TI Designs – Precision: Verified Design - Comparator with Hysteresis ...
Upload
independentCategory
view
1download
0
The effect of biomass particle characteristics on the sorption hysteresis of 17α-ethinylestradiol
Taewoo Yi and Willie F. Harper, Jr.
ABSTRACT The effects of particle characteristics on sorption and hysteresis of 17α-ethinylestradiol (EE2) were investigated in membrane bioreactor (MBR) and sequencing batch reactor (SBR). These results showed that the magnitude of the sorption partitioning coefficient depended on the particle specific surface area. This study also found that the sorption hysteresis index was greater for biomass suspensions with larger particle sizes. SRT did not prove to be an effective means of directly manipulating the biomass particle size, and the effects of SRT on the partitioning coefficient and the HI index, although present, were not dramatic. Nitrogen limitation did increase the hysteresis index values of the bioreactors when the SRT was 5 days; this result implies that it is possible to cause increased accumulation of EE2 in activated sludge floc during nitrogen limiting conditions. KEYWORDS 17α-ethinylestradiol, membrane bioreactor, sorption, sorption hysteresis, exocellular polymeric substances, particle size INTRODUCTION 17α-ethinylestradiol (EE2) is among numerous emerging micropollutants attracting great interest in the water treatment community, because it may interfere with the development of living organisms (Parkkonen et. al. 2000). EE2 has been detected in numerous surface waters in North America and Europe (Kolpin et. al. 2001, Boyd et. al. 2003, Belfroid et. al. 1999), and is likely widespread because it is commonly used as a key ingredient in birth control pills. Removing EE2 during biological wastewater treatment is probably important for preventing the proliferation of these chemicals in our environment. In general, sorption is one of the important EE2 removal mechanisms. The term “sorption” is commonly used (Sarmah et. al. (2005), Gomes et. al., (2003), Servos et. al. (2004), and Urase and Kikuta (2005)) to avoid assuming that the compound is on the surface (adsorption) or partitioned into another phase (absorption). EE2 is relatively hydrophobic (log Kow = 3.9), and has been shown to partition to activated sludges as a function of biomass hydrophobicity (Yi and Harper, 2005). There is also a sorption/desorption cycle that must be considered, because in many cases, the desorption process fails to restore the full capacity of the sorbent (in this case, the activated sludge biomass). This phenomena is known as sorption hysteresis, and this has been reported for many organic compounds where either soil or sludge acts as the sorbent (Kim et. al. (2005), Conrad et. al. (2005), and Huang et. al. (2003)). EE2 sorption hysteresis is a basic and relevant process that has not received great attention, and the understanding that is needed is currently missing. The cause of sorption hysteresis is likely related to particle characteristics (e.g. size).
1494
WEFTEC®.06
Copyright 2006 Water Environment Foundation. All Rights Reserved©
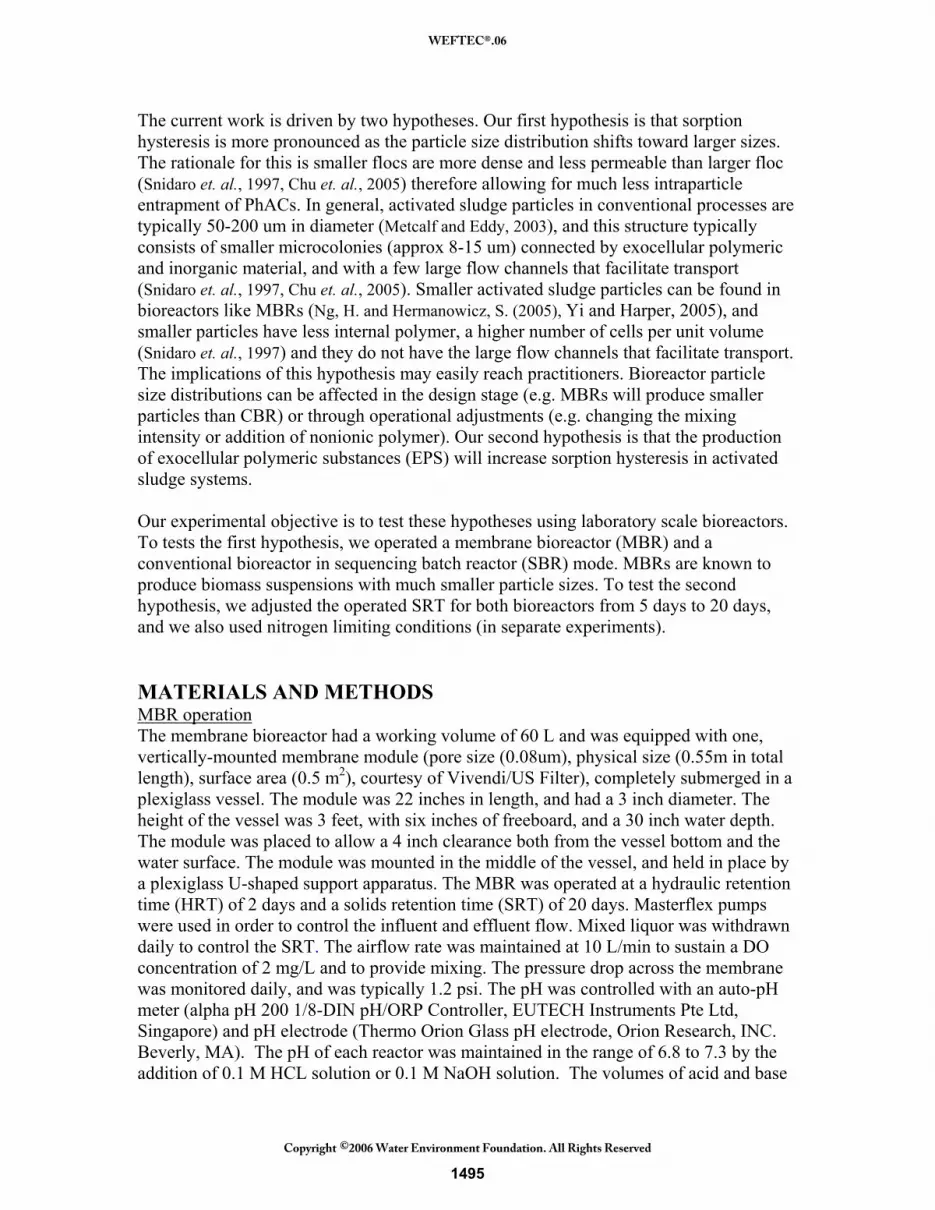
The current work is driven by two hypotheses. Our first hypothesis is that sorption hysteresis is more pronounced as the particle size distribution shifts toward larger sizes. The rationale for this is smaller flocs are more dense and less permeable than larger floc (Snidaro et. al., 1997, Chu et. al., 2005) therefore allowing for much less intraparticle entrapment of PhACs. In general, activated sludge particles in conventional processes are typically 50-200 um in diameter (Metcalf and Eddy, 2003), and this structure typically consists of smaller microcolonies (approx 8-15 um) connected by exocellular polymeric and inorganic material, and with a few large flow channels that facilitate transport (Snidaro et. al., 1997, Chu et. al., 2005). Smaller activated sludge particles can be found in bioreactors like MBRs (Ng, H. and Hermanowicz, S. (2005), Yi and Harper, 2005), and smaller particles have less internal polymer, a higher number of cells per unit volume (Snidaro et. al., 1997) and they do not have the large flow channels that facilitate transport. The implications of this hypothesis may easily reach practitioners. Bioreactor particle size distributions can be affected in the design stage (e.g. MBRs will produce smaller particles than CBR) or through operational adjustments (e.g. changing the mixing intensity or addition of nonionic polymer). Our second hypothesis is that the production of exocellular polymeric substances (EPS) will increase sorption hysteresis in activated sludge systems. Our experimental objective is to test these hypotheses using laboratory scale bioreactors. To tests the first hypothesis, we operated a membrane bioreactor (MBR) and a conventional bioreactor in sequencing batch reactor (SBR) mode. MBRs are known to produce biomass suspensions with much smaller particle sizes. To test the second hypothesis, we adjusted the operated SRT for both bioreactors from 5 days to 20 days, and we also used nitrogen limiting conditions (in separate experiments). MATERIALS AND METHODS MBR operation The membrane bioreactor had a working volume of 60 L and was equipped with one, vertically-mounted membrane module (pore size (0.08um), physical size (0.55m in total length), surface area (0.5 m2), courtesy of Vivendi/US Filter), completely submerged in a plexiglass vessel. The module was 22 inches in length, and had a 3 inch diameter. The height of the vessel was 3 feet, with six inches of freeboard, and a 30 inch water depth. The module was placed to allow a 4 inch clearance both from the vessel bottom and the water surface. The module was mounted in the middle of the vessel, and held in place by a plexiglass U-shaped support apparatus. The MBR was operated at a hydraulic retention time (HRT) of 2 days and a solids retention time (SRT) of 20 days. Masterflex pumps were used in order to control the influent and effluent flow. Mixed liquor was withdrawn daily to control the SRT. The airflow rate was maintained at 10 L/min to sustain a DO concentration of 2 mg/L and to provide mixing. The pressure drop across the membrane was monitored daily, and was typically 1.2 psi. The pH was controlled with an auto-pH meter (alpha pH 200 1/8-DIN pH/ORP Controller, EUTECH Instruments Pte Ltd, Singapore) and pH electrode (Thermo Orion Glass pH electrode, Orion Research, INC. Beverly, MA). The pH of each reactor was maintained in the range of 6.8 to 7.3 by the addition of 0.1 M HCL solution or 0.1 M NaOH solution. The volumes of acid and base
1495
WEFTEC®.06
Copyright 2006 Water Environment Foundation. All Rights Reserved©

were monitored daily and the addition of new solution to the storage vials was recorded. The temperature was ambient (approx. 24ºC). SBR operation The SBR had a working volume of 4 liters, and operated on a continuous 6-hour cycle with a hydraulic retention time (HRT) of 12 hours. For aerobic SBR, the 6-hour cycle consisted of the following phases: effluent withdrawal (12 min), nutrient feed and deionized water addition (3 min), aerobic phase (280 min), and settling (30 min). The timing of the operation for the influent and effluent pumps, air flow, mixing and pH electrode activity, was controlled by a programmable logic controller (Model XT, Chrontrol Corporation, San Diego, CA). The mean cell retention time (MCRT), was maintained by manually wasting a portion of the mixed reactor contents once per day. The wasting was performed during the same cycle each day after reactor TSS samples had been taken and before the start of the settling phase. Aerobic conditions were maintained by bubbling ambient air through a porous diffuser. Aerobic conditions were verified by measuring dissolved oxygen (YSI Model 57 Oxygen Meter with YSI Model 5793 Standard Membranes, YSI Incorporated, Yellow Spings, Ohio) and redox potential (Eutech Instruments, Model 200, Singapore). The pH was controlled with an auto-pH meter (WDP Series Dual Input pH/ORP Controller, Walchem Corporation, Holliston, MA) and pH electrode (WEL-PHF-NN electrode, Walchem Corporation, Holliston, MA) with a protective housing (Model 102606, Walchem Corporation, Holliston, MA). The pH of each reactor was maintained in the range of 6.8 to 7.3 by the addition of 0.1 M HCL solution or 0.1 M NaOH solution. The volumes of acid and base were monitored daily and the addition of new solution to the storage vials was recorded. There was no pH control during the settling or effluent withdrawal phases. The temperature was ambient (approx. 24ºC). MBR and SBR synthetic wastewater The synthetic wastewater used for the MBR and the SBR was the same. The organic substrate (acetic acid) and inorganic nutrients were added in separate feed streams. The composition of the synthetic feed was (on mg COD /L basis: acetate (360), casamino acids (20), yeast extract (< 1)). The inorganic salts content was (as mg/L total influent concentration): KCl (210), MgCl2-6H20 (394), MgSO4-7H20 (26), CaCl2 (80), H3BO3 (0.11, ZnSO4-7H20 (0.0.50), KI (0.027), CuSO4-5H20 (0.11), Co(NO3)2-6H20 (0.135), NaMoO4-2H20 (0.056), MnSO4-H20 (0.62), and FeSO4-7H20 (0.55). The influent P concentration was supplied as NaH2PO4-2H2O and was always 8.0 mg P/L. The influent N was supplied as NH4Cl and was always 40.3 mg N/L. The synthetic wastewater used for nitrogen limiting condition was the same, except that the nitrogen concentration was reduced to 8mg N/L. Particle size distribution Particle size and surface area distribution were determined on 15 ml samples from the MBR and SBR sludges utilizing a Horiba LA-920 laser scattering particle size distribution analyzer (Delta Analytical Instruments, North Huntington, PA).
1496
WEFTEC®.06
Copyright 2006 Water Environment Foundation. All Rights Reserved©

Sorption isotherm tests The sorption experiments of EE2 were conducted using biomass from the SBR and MBR. A 250mL glass bottle with a working volume of 200mL was used for this test. Sorption of EE2 onto the biomass was determined by adding EE2 into glass bottles at different concentration ranging between 10 μg/L and 1000 μg/L. Samples were taken at equilibrium , which was typically obtained in 120 min. All tests were conducted in an orbital shaker at 200rpm at 23oC. All sorption and desorption experiment were run in duplicate or triplicate. Biomass inhibition was achieved using sodium azide (0.2 % w/w). Desorption tests After the sorption experiment, the glass bottles were agitated in the dark at 250 rpm, 25 °C for 5 h then centrifuged for 20 min at 3,000g. Next, 100 mL of the supernatant were removed. The removed supernatant was replaced with fresh background solution and the tubes were further agitated under the same conditions. Four sequential desorption steps were performed. Supernatants collected after the sorption and each of the desorption steps were filtered through a 0.2-μm Teflon filter. This desorption procedure was repeated four times. All sorption and desorption experiments were run in duplicate. Extraction and chemical analyses of exocellular polymeric substances EPS was chemically extracted. Biomass taken from MBR and SBR was washed by high speed centrifugation (5000 xg) two times. Formaldehyde was added (4 oC for 1hr) and then NaOH was added (4oC for 3hr). Cell debris were removed using centrifugation (5000x g for 20min at 4oC), followed by membrane separation (a 0.22 µm membrane). Low molecular-weight metabolites were removed through a dialysis membrane of 3500 Da (Pierce, USA) at 4oC for 24hr. The extracted EPS was analyzed for total carbohydrates by anthrone method (Gaudy, 1962), and protein by modified Lowry method (Frølund et al, 1995) using bovine serum albumin as standard. RESULTS AND DISCUSSION The partitioning coefficient (Kd) was determined using the linear sorption equation, q= Kd *C, where q is the equilibrium constant on biomass (µg/g), and C is the equilibrium concentration of EE2 in aqueous solution (µg/L). As the mean particle size increased, the Kd decreased as expected (Figure 1), but the overall correlation between the biomass mean particle size and Kd was poor (R2=0.45). This is likely because activated sludge floc shapes are not spheres, and in the current study irregular morphological characteristics were observed. The correlation between the measured biomass surface area and Kd was much better (R2 = 0.84, Figure 2), but this correlation also had a relatively low correlation factor.
1497
WEFTEC®.06
Copyright 2006 Water Environment Foundation. All Rights Reserved©

y = -0.001x + 0.4707R2 = 0.447
0
0.1
0.2
0.3
0.4
0.5
0.6
0.7
0 50 100 150 200 250
Mean particle size(um)
Kd(
L/g)
Figure 1. The effect of mean particle size on the partitioning coefficient
y = 0.0665x0.2115
R2 = 0.8415
0
0.1
0.2
0.3
0.4
0.5
0.6
0 2000 4000 6000 8000 10000 12000 14000 16000 18000
Specific surface area (cm2/cm3)
Kd (
L/g)
Figure 2. The effect of specific surface area on the partitioning coefficient
1498
WEFTEC®.06
Copyright 2006 Water Environment Foundation. All Rights Reserved©

Sorption hysteresis was calculated using the hysteresis index (HI) (Huang et al, 1998):
s
sd
qqq
HI−
= T,Cr
The subscript T (23oC) and Cr (Cr level is 0.5) are specific conditions of constant temperature and residual solution phase concentration ratio, respectively. The partitioning coefficient determined from the sorption experiments is qs, and the partitioning coefficient determined from the desorption experiments is qd. Figure 3 shows a typical result for two different biomass floc suspensions. Particle size influences the extent of the observed hysteresis for EE2 sorption, and the sorption hysteresis increases for larger floc as the soluble EE2 concentration increases. This makes sense, because as EE2 concentration increases, more intrafloc mass transfer (and entrapment) is expected. Figure 3. Sorption and desorption experiments with small (10 um mean size) and larger (120 um mean size) activated sludge particles. The filled and open data markers are for sorption and desorption respectively. The difference between the sorption and desorption isotherms is greater for larger particles. The HI increased as the mean particle size increased (Figure 4). An exponential curve fit function was used to demonstrate the nonlinear behavior of the observed hysteresis. Suspensions with mean particle sizes typical of conventional activated sludge (150-300 um, Metcalf and Eddy, 2003) are expected to exhibit significant degrees of sorption hysteresis. Much less hysteresis is expected from sludges with mean particle sizes at or below 50 um (e.g. MBR sludges). These results imply that particle size can significantly impact sorption hysteresis (and therefore ultimate fate) of EE2. Because bioreactor particle size distributions can be affected in the design stage (e.g. MBRs will produce smaller particles than CBR) or through operational adjustments (e.g. changing the mixing intensity or addition of nonionic polymer), engineering measures can directly address sorption hysteresis. These results also suggest that particle size must be carefully accounted for when predicting the fate of EE2 in computational experiments.
0
20
40
60
80
100
120
140
0 50 100 150 200 250 300
Aqueous EE2 (ug/L)
Sorb
ed E
E2 (m
g/g)
10 um - sorp 10 um - des 120 um - sorp 120 um - des
Arrows show extend of hysteresis
1499
WEFTEC®.06
Copyright 2006 Water Environment Foundation. All Rights Reserved©
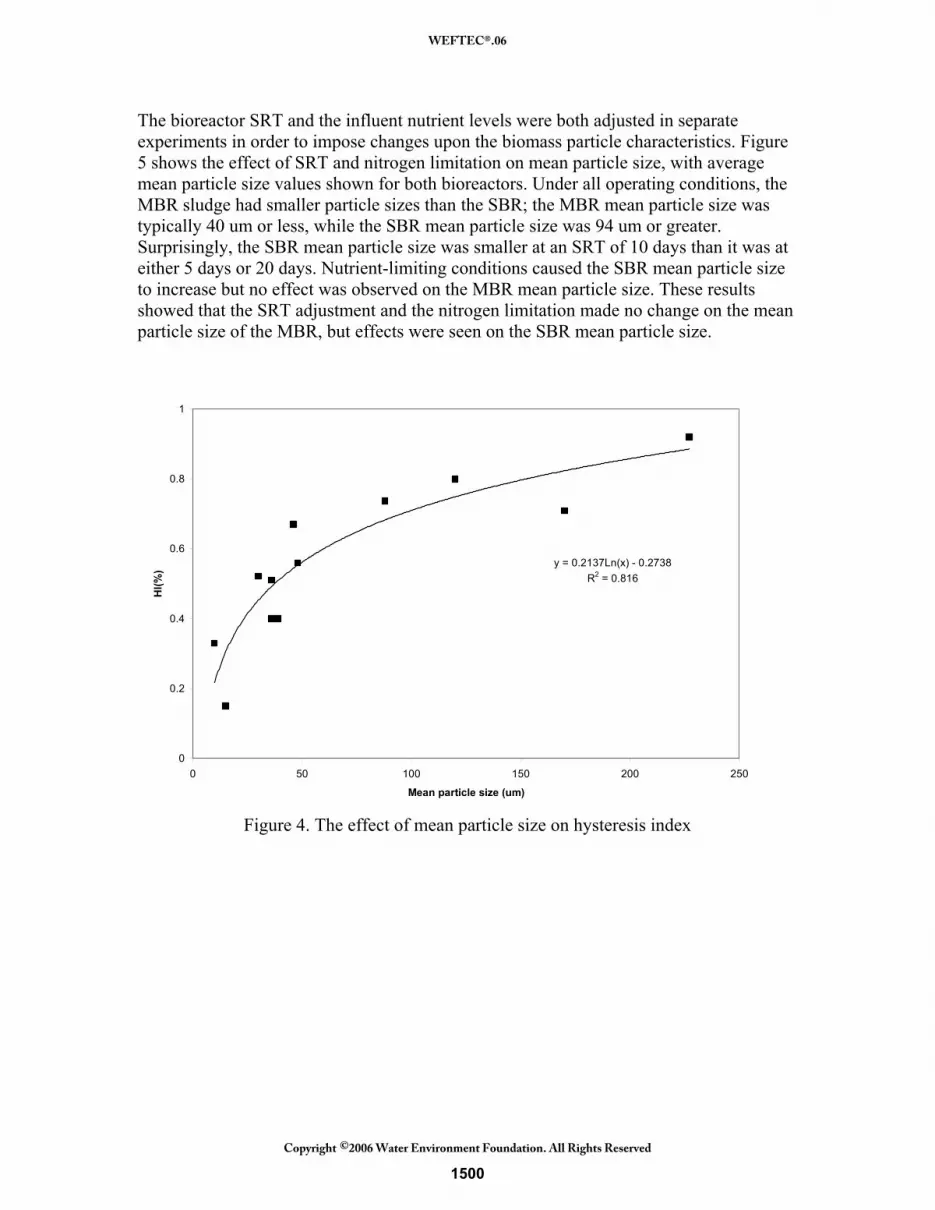
The bioreactor SRT and the influent nutrient levels were both adjusted in separate experiments in order to impose changes upon the biomass particle characteristics. Figure 5 shows the effect of SRT and nitrogen limitation on mean particle size, with average mean particle size values shown for both bioreactors. Under all operating conditions, the MBR sludge had smaller particle sizes than the SBR; the MBR mean particle size was typically 40 um or less, while the SBR mean particle size was 94 um or greater. Surprisingly, the SBR mean particle size was smaller at an SRT of 10 days than it was at either 5 days or 20 days. Nutrient-limiting conditions caused the SBR mean particle size to increase but no effect was observed on the MBR mean particle size. These results showed that the SRT adjustment and the nitrogen limitation made no change on the mean particle size of the MBR, but effects were seen on the SBR mean particle size.
y = 0.2137Ln(x) - 0.2738R2 = 0.816
0
0.2
0.4
0.6
0.8
1
0 50 100 150 200 250
Mean particle size (um)
HI(%
)
Figure 4. The effect of mean particle size on hysteresis index
1500
WEFTEC®.06
Copyright 2006 Water Environment Foundation. All Rights Reserved©

0
40
80
120
160
200
0 5 10 15 20 25
SRT (day)
Mea
n pa
rtic
le s
ize
(um
)
MBR-Normal condition MBR-Nitrogen limiting condition
SBR-Normal condition SBR-Nitrogen limiting condition
Figure 5. The effect of SRT and nitrogen-limitation on mean particle size
Figure 6 shows the effect of SRT and nitrogen limitation on the measured partitioning coefficient (Kd). Under normal (non nitrogen limiting) conditions the average MBR Kd generally decreased with the increase of SRT. Under nitrogen limiting conditions, the average MBR Kd values were relatively stable, 0.45 L/g at a 5 day SRT, 0.45 L/g at a 10 day SRT, and 0.35 L/g at a 20 day SRT. Under normal conditions the average SBR Kd values were 0.47 L/g at a 5 day SRT, 0.64 L/g at a 10 day SRT, and 0.25 L/g at a 20 day SRT. The average SBR Kd value measured at a 10 day SRT was surprising, given that previous results have shown that MBR Kd values are higher than those of comparably operated SBRs (Yi and Harper, 2005). The SBR Kd values measured during nitrogen-limiting conditions were lower at a 5 day SRT, but no significant difference was noted at the other SRTs. These results showed that a gradual adjustment of the SRT can gradually lower the partitioning coefficient for EE2 in both bioreactors. The imposition of the nitrogen limitation sometimes affected the Kd values, but the magnitude of the effect depended on the operating SRT. Figure 7 shows the effect of SRT and nitrogen limitation on the hysteresis index. At a 5 day SRT, the average HI values were lower for the MBR, and the nitrogen limiting conditions increased the HI for both bioreactors. At a 10 day SRT, the average HI for the bioreactors were more similar, except that the SBR had a lower than expected HI under non nitrogen-limiting conditions. At a 20 day SRT, the MBR again maintained a lower HI than the SBR, and the nitrogen limitation caused a statistically significant change in the HI for the SBR but not the MBR. Overall, the HI appeared to increase slightly with SRT for both bioreactors.
1501
WEFTEC®.06
Copyright 2006 Water Environment Foundation. All Rights Reserved©

0
0.2
0.4
0.6
0.8
0 5 10 15 20 25SRT(day)
Kd (
L/g)
MBR-Normal condition MBR-Nitrogen limiting conditionSBR-Normal condition SBR-Nitrogen limiting condition
Figure 6. The effect of SRT and nitrogen-limitation on the Kd
0
0.2
0.4
0.6
0.8
1
1.2
SRT 5 day SRT 10day SRT 20day
HI(%
)
MBR-Normal condition MBR-Nitrogen limiting conditionSBR-Normal condition SBR-Nitrogen limiting condition
Figure 7. The effect of SRT and nitrogen limitation on hysteresis index
1502
WEFTEC®.06
Copyright 2006 Water Environment Foundation. All Rights Reserved©

The present study provides further evidence for the sorption and entrapment of EE2 in activated sludge floc. Sorption is a basic phenomena responsible for removal of EE2 from wastewater, and sorption hysteresis is important for understanding the ultimate fate of EE2 in engineered bioreactors. These results showed that the magnitude of the partitioning coefficient depended on the particle size characteristics (i.e. specific surface area), and that these particle sizes can be controlled by operated with a conventional system such as a SBR or a MBR. The MBR always contained smaller particles than SBR. Because of the smaller particles in the MBR, the amount of exposed surface area available for sorption was bigger that that of SBR, so MBR has bigger Kd values. This study also found that the hysteresis index was greater for biomass suspensions with larger particle sizes. This means that the selection of a MBR may potentially result in a less entrapment of EE2 with activated sludge biomass. SRT proved to be a less effective means of directly manipulating the biomass characteristics. The mean particle size of the MBR was unaffected by SRT, and the SBR mean particle size was not affected in a systematic way. Therefore, the effects of SRT on the partitioning coefficient and the HI index, although present, were not as dramatic. Nitrogen limitation did increase the HI values at a 5 day SRT; this result implies that it is possible to cause increased accumulation of EE2 in activated sludge floc during nitrogen limiting conditions. This further underscores the importance of maintaining nitrogen sufficient conditions in biological systems. Exocellular polymer is a well known biomass characteristic, and it could impact sorption and fate of EE2. EPS protein and carbohydrate concentration were measured to determine the possible effects on the measured Kd and HI values (Figures 8 and 9). There were no correlations between protein and carbohydrate concentrations and the measured Kd and HI values (correlation lines have been omitted for clarity). This phenomenon was also observed in the study of Holbrook et al (2004), who reported that low correlations between sorption with colloidal protein and polysaccharide concentrations, suggesting that colloidal organic carbon derived from biological wastewater treatment plant affect the degree of sorption to a great extent. Stringfellow and Alvarez-Cohen (1998) also showed that the correlations between biosorption and EPS protein and carbohydrate were not clear.
1503
WEFTEC®.06
Copyright 2006 Water Environment Foundation. All Rights Reserved©

0
0.2
0.4
0.6
0.8
1
0 5 10 15 20 25
Protein Conc. (mg/g)
Kd
(L/g
)
0
0.2
0.4
0.6
0.8
HI(%
)
Kd vs Protein (Normal) Kd vs Protein (Nitrogen limiting)HI vs Protein (Nitrogen limiting) HI vs Protein (Normal)
Figure 8. The effect of EPS protein concentration on Kd and HI
0
0.2
0.4
0.6
0.8
1
0 10 20 30 40 50 60
Carbohydrate conc. (mg/g)
Kd
(L/g
)
0
0.2
0.4
0.6
0.8
HI (
%)
Kd vs Carbohydrate (Normal) Kd vs Carbohydrate (Nitrogen limiting)
HI vs Carbohydrate (Nitrogen limiting) HI vs Carbohydrate(Normal)
Figure 9. The effect of EPS carbohydrate concentration on Kd and HI
1504
WEFTEC®.06
Copyright 2006 Water Environment Foundation. All Rights Reserved©

Acknowledgements Credits. The authors thank Jinling Zhuang for experimental assistance, and the National Science Foundation (BES-0504393) for financial support. Authors. Taewoo Yi is a PhD student in the Auburn University Department of Civil Engineering. Willie F. Harper, Jr. is an Assistant Professor in the Department of Civil Engineering at Auburn University. Correspondence should be sent to Willie F. Harper, Jr., Auburn University, 204 Harbert Engineering Center, Auburn, AL 36849-5337 (email: [email protected]). REFERENCES Andersen, H., Hansen, M., Kjolholt, J., Stuer-Lauridsen, F., Ternes, T., and Halling-Sorensen, B. (2005). Assessment of the importance of sorption for steroid estrogens removal during activated sludge treatment. Chemosphere, 61(1), 139-46. APHA (1992). Standard Methods for the Examination of Water and Wastewater. Eighteenth Edition, American Public Health Association, American Water Works Association, Water Pollution Control Federation, Washington, D.C. Belfroid, C., Van der Horst, A., Vethaak, A., Schäfer, A., Rijs, G., Wegener, J., and Cofino, W. (1999). Analysis and occurrence of estrogenic hormones and their glucuronides in surface water and waste water in The Netherlands. The Science of the Total Environment, 225(1-2), 101-108. Boyd, G., Reemtsma, H., Grimm, D., and Mitra, S. (2003). Pharmaceuticals and personal care products (PPCPs) in surface and treated waters of Louisiana, USA and Ontario, Canada. The Science of the Total Environment, 311(1-3), 135-149. Conrad, A., Cadoret, A., Corteel, P., Leroy, P., and Block, J.C. (2006). Adsorption/desorption of linear alkylbenzenesulfonate (LAS) and azoproteins by/from activated sludge flocs. Chemosphere, 62, 53-60. Chu, C., Lee, D. and Tay, J. (2005). Floc model and intrafloc flow. Chemical Engineering Science, 60(2):565-575. Frølund, B., Griebe, T., Nielsen, P. H., (1995). Enzymatic activity in the activated sludge floc matrix. Appl. Microbiol. Biotechnol. 43, 755-761. Gaudy, A. F. (1962). Colorimetric determination of protein and carbohydrate. Ind. Water Wastes 7, 17-22. Gomes, R., Scrimshaw, M., and Lester, J. (2003). Determination of endocrine disrupters in sewage treatment and receiving waters. TrAC Trends in Analytical Chemistry, 22(10):697-707.
1505
WEFTEC®.06
Copyright 2006 Water Environment Foundation. All Rights Reserved©

Hoa, P. T., Nair, L., and Visvanathan, C. (2003). The effect of nutrients on extracellular polymeric substance production and its influence on sludge properties. Water SA, 29(4), 437-442. Holbrook, D. R., Love, N. G., and Novak, J. T. (2004). Sorption of 17β-Estradiol and 17α-Ethinylestradiol by colloidal organic carbon derived from biological wastewater treatment systems. Environmental Science and Technology, 38, 3322-3329. Huang, W., Peng, P., Yu, Z., and Fu, J. (2003). Effects of organic matter heterogeneity on sorption and desorption of organic contaminants by soils and sediments. Applied Geochemistry, 18(7):955-972. Huang, W., Weber, Jr. W. J. (1998). A distributed reactivity model for sorption by soils and sediments. 11: slow concentration-dependent sorption rates. Environmental Science and Technology, 32, 3549-3555. Jacobsen, B. N., and Nyholm, N., Pedersen, B. M., Poulsen, O., and Østfeldt, P. (1993). Removal of organic micropollutants in laboratory activated sludge reactors under various operating conditions: sorption. Water Research, 27(10), 1505-1510. Jang, A., Kim, S. M., Kim, S. Y., Lee, S. G., and Kim, I. S. (2001). Effect of heavy metals (Cu, Pb, and Ni) on the compositions of EPS in biofilms. Water Science and Technology. 43(6), 41-48. Kim, S., Eichhorn, P., Jensen, J., Weber, S. and Aga, D. Removal of Antibiotics in Wastewater: Effect of Hydraulic and Solids Retention Times on the Fate of Tetracycline in the Activated Sludge Process. Environmental Science and Technology, In Press. Kolpin, D., Furlong, E., Meyer, M., Thurman, E., Zaugg, S., Barber, L., and Buxton, H. (2001). Pharmaceuticals, hormones, and other organic wastewater contaminants in U.S. streams, 1999-2000: A national reconnaissance. Environmental Science and Technology, 36, 1202-1211. Liao, B. Q., Allen, D. G., Droppo, I. G., Leppard, G. G., and Liss, S. N. (2000). Surface properties of sludge and their role in bioflocculation and settleability. Water Research, 35(2), 339-350. Liu, H. and Fang, H.H.P (2002). Extraction of extracellular polymeric substances (EPS) of sludges. Journal of Biotechnology, 95, 249-256. Metcalf and Eddy (2003). Wastewater engineering: treatment and reuse. McGraw-Hill Publishers, New York, NY.1819 pp. Mian, F. A., Jarman, T. R., and Righelato, R. C. (1978). Biosynthesis of exopolysaccharide by Pseudomonas aeruginosa. Journal of Bacteriology, 134(2), 418-422.
1506
WEFTEC®.06
Copyright 2006 Water Environment Foundation. All Rights Reserved©

Ng, H. and Hermanowicz, S. (2005). Membrane bioreactor operation and short solids retention times: performance and biomass characteristics. Water Research 39(6):981-992. Parkkonen, J., Larsson, D., Adolfsson-Erici, M., Pettersson, M., Berg, A., Olsson, P., and Förlin, L. (2000). “Contraceptive pill residues in sewage effluent are estrogenic to fish.” Mar. Environ. Res., 50(1-5), 198. Sarmah, A., Northcott, G., Leusch, F., and Tremblay, L. (2005). A survey of endocrine disrupting chemicals (EDCs) in municipal sewage and animal waste effluents in the Waikato region of New Zealand. Science of The Total Environment, In Press. Servos, M., Bennie, D., Burnison, B., Jurkovic, A., McInnis, R., Neheli, T., Schnell, A., Seto, P., Smyth, S. and Ternes, T. (2004). Distribution of estrogens, 17-estradiol and estrone, in Canadian municipal wastewater treatment plants. Science of The Total Environment, 336(1-3):155-170. Snidaro, D., Zartarian, F., Jorand, F., Bottero, J., Block, J. and Manem, J. (1997). Characterization of activated sludge flocs structure. Water Science and Technology, 36(4):313-320. Stringfellow, W. T. and Alvarez-Cohen, L. (1998). Evaluating the relationship between the sorption of PAHs to bacterial biomass and biodegradation. Waster research. 33(11), 2535-2544. Suzuki, Y., and Maruyama, T. (2006). Fate of natural estrogens in batch mixing experiments using municipal sewage and activated sludge. Water research, 40, 1061-1069. Urase, T. and Kikuta, T. (2005). Separate estimation of adsorption and degradation of pharmaceutical substances and estrogens in the activated sludge process. Water Research, 39(7):1289-1300. Wilen, B., Jin b., and Lant, P. (2003). The influence of key chemical constituents in activated sludge on surface and flocculating properties. Water Research, 37, 2127-2139. Wolfaardt, G. M., Lawrence, J. R., Robarts, R. D., and Caldwell, D. E. (1995). Bioaccumulation of the herbicide diclofop in extracellular polymers and its utilization by a biofilm community during starvation. Applied and Environmental Microbiology, 61(1), 152-158. Wolfaardt, G. M., Lawrence, J. R., Headley, J. V., Robarts, R. D., and Caldwell, D. E. (1995). Microbial exopolymers provide a mechanism for bioaccumulation of contaminants. Microbial Ecology, 27(3), 279-291.
1507
WEFTEC®.06
Copyright 2006 Water Environment Foundation. All Rights Reserved©

Yi, T. and Harper, Jr. W. F. (2005). Mechanisms for removal of 17a-Ethinylestradiol in bioreactors. Proceedings of the 78th Annual Water Environment Federation Technical Exposition and Conference, Washington, D.C., October 2005. Yi, T., Harper, Jr., W.F., Holbrook, R.D., and Love, N.G., The role of particle characteristics and nitrification in removal of 17α-ethinylestradiol in bioreactors. ASCE J. Env. Eng. (In press).
1508
WEFTEC®.06
Copyright 2006 Water Environment Foundation. All Rights Reserved©
Copyright © 2022 FDOKUMEN