Hysteresis: Phenomenon and modeling in soil-water relationship
18
Iran Agricultural Research, Vol. 27, No. 1-2, 2008 and Vol. 28 No. 1, 2009 Printed in the Islamic Republic of Iran Shiraz University "Review Article" Hysteresis: Phenomenon and Modeling in Soil- Water Relationship A. IZADY 1* , B. GHAHRAMAN 1** AND K. DAVARI 1* 1 Department of Water Engineering, College of Agriculture, Ferdowsi University of Mashhad, Mashhad, I.R. Iran ABSTRACT-Hysteresis has been widely recognized in the soil water relationship. In this paper, a detailed review of hysteresis was performed in relation to its models. So far, different models have been suggested to describe hysteresis in the water retention curve (WRC) that could be categorized into two main groups: conceptual and empirical models. The models in the first group are based on the domain theory of capillary hysteresis and those in the second group rely on the analysis of observed WRC shape and properties. Conceptual models include the independent and dependent domain theories and the Parlange's model, while empirical models consist of the interpolation, linear, Slope and Scaling – down models. Different results of studies carried out by several researchers showed that the Parlange model, that uses the concept of rational extrapolation, was the best model to predict hysteresis of the WRC. Keywords: Conceptual Model, Empirical Model, Hysteresis, Parlange Model INTRODUCTION The description and prediction of water flow through unsaturated soils imply an understanding of unsaturated soil properties. The main unsaturated soil properties used in engineering calculations are the relationships between suction (or water pressure), , (cm of water or kPa) and volumetric water content, , (cm 3 /cm 3 ) as well as that between suction and hydraulic conductivity, K. These two relationships comprise the water retention curve (WRC) and permeability function, respectively. Due to the complex nature of the liquid-phase configuration in an unsaturated porous medium, the relationship between water pressure and water content is not unique and presents hysteresis effects (e.g. 14, 43, 52 and 5). As shown in Figure 1, a soil typically shows a volumetric water content that is less for a wetting process (such as infiltration) than for a drying process (such as evaporation or drainage) at a given water pressure. * PhD Student, Professor , Associate Professor and Assistant Professor, respectively ** Corresponding Author
Transcript of Hysteresis: Phenomenon and modeling in soil-water relationship
Iran Agricultural Research, Vol. 27, No. 1-2, 2008 and Vol. 28 No. 1, 2009 Printed in the Islamic Republic of Iran Shiraz University
"Review Article"
Hysteresis: Phenomenon and Modeling in Soil- Water Relationship
A. IZADY1*, B. GHAHRAMAN1** AND K. DAVARI 1*
1Department of Water Engineering, College of Agriculture, Ferdowsi University of Mashhad, Mashhad, I.R. Iran
ABSTRACT-Hysteresis has been widely recognized in the soil water relationship. In this paper, a detailed review of hysteresis was performed in relation to its models. So far, different models have been suggested to describe hysteresis in the water retention curve (WRC) that could be categorized into two main groups: conceptual and empirical models. The models in the first group are based on the domain theory of capillary hysteresis and those in the second group rely on the analysis of observed WRC shape and properties. Conceptual models include the independent and dependent domain theories and the Parlange's model, while empirical models consist of the interpolation, linear, Slope and Scaling – down models. Different results of studies carried out by several researchers showed that the Parlange model, that uses the concept of rational extrapolation, was the best model to predict hysteresis of the WRC.
Keywords: Conceptual Model, Empirical Model, Hysteresis, Parlange Model
INTRODUCTION
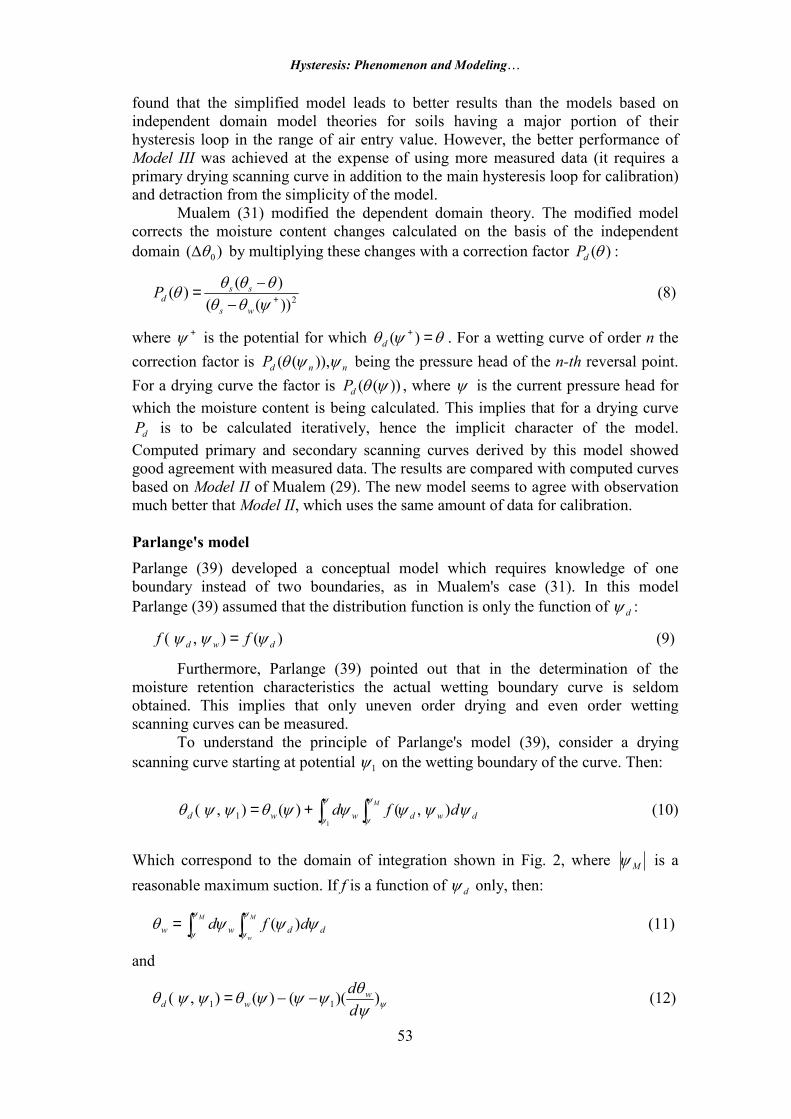
The description and prediction of water flow through unsaturated soils imply an understanding of unsaturated soil properties. The main unsaturated soil properties used in engineering calculations are the relationships between suction (or water pressure),ψ , (cm of water or kPa) and volumetric water content,θ , (cm3/cm3) as well as that between suction and hydraulic conductivity, K. These two relationships comprise the water retention curve (WRC) and permeability function, respectively. Due to the complex nature of the liquid-phase configuration in an unsaturated porous medium, the relationship between water pressure and water content is not unique and presents hysteresis effects (e.g. 14, 43, 52 and 5). As shown in Figure 1, a soil typically shows a volumetric water content that is less for a wetting process (such as infiltration) than for a drying process (such as evaporation or drainage) at a given water pressure.
* PhD Student, Professor , Associate Professor and Assistant Professor, respectively ** Corresponding Author

Izady et al.
48
The hysteresis effect can be attributed to 4 main causes (e.g. 18 and 37): a) geometric nonuniformity of individual pores, resulting from the so called “Ink Bottle” effect, b) different spatial connectivity of pores during drying or wetting processes, c) variation in the liquid-solid contact angle, where the contact angle and the radius of curvature are greater in the case of an advancing meniscus than the case of a receding one. A given water content will, therefore, tend to exhibit greater suction in desorption than sorption, and d) air entrapment, which further reduces the water content of newly wetted soil. Failure to attain true equilibrium (though not, strictly speaking, true hysteresis) can accentuate the hysteresis effect.
The two complete characteristic curves, from saturation to dryness and vice versa, are the main branches of the hysteretic soil moisture characteristics. When a partially wetted soil commences to drain, or when a partially desorbed soil is rewetted, the relation of suction to moisture content follows a number of intermediate curves as it moves from one main branch to the other. Such intermediate spurs are called scanning curves.
In the past, hysteresis was generally disregarded in the practice of soil physics. This may be justifiable in the treatment of processes involving monotonic wetting (e.g., infiltration) or monotonic drying (e.g., evaporation). Nevertheless, hysteresis may be important in cases of composite processes where wetting and drying occur simultaneously or sequentially in various parts of the soil profile (e.g., redistribution). Two soil layers of identical texture and structure may be at equilibrium with each other (i.e., at identical energy states) and yet may differ in wetness if their sorbing-desorbing histories have been different. Furthermore, hysteresis can affect dynamic, as well as static properties of the soil (i.e., hydraulic conductivity and flow phenomena).
Fig. 1. Schematic representation of water retention curves with hysteresis effects
Because of the important effects of hysteresis on most soils, especially coarse-textured soils (18), different models have been developed to describe different hysteresis curves (main, primary and secondary curves) of the WRC over the last 40

Hysteresis: Phenomenon and Modeling…
49
years. This paper presents a brief explanation of the models developed so far. A comparison of these models is then presented for assessment.
HYSTERESIS MODELS
The different approaches that have been used to describe hysteresis in WRC can be categorized into two main groups: conceptual and empirical models. The first group is based on the domain theory of capillary hysteresis. This theory assigns soil water to domains according to a distribution function ),( wdf ψψ , where the subscripts stand for drying and wetting, respectively. Knowledge of this distribution function allows for the determination of the moisture content by integrating the filled domains after any series of wetting or drying. Empirical models rely on the analysis of observed WRC shape and properties.
Another possible classification of the model is based on the model's parameter identification requirements. Most of these models present the relationship between different WRC curves. A model that describes an arbitrary curve as a function of nother curves, can be referred to as an "n-branch" model.
CONCEPTUAL MODELS
Independent Domain Theory The use of the independent domain theory for water content-pressure head hysteresis as formulated by Everett et al. (10 and 11) is dependent on two assumptions: first, that the pore space is made up of pores or domains, each defined by two pressure head values, one where the pore drains and one where it fills precipitously. The draining and filling of each pore takes place at its defining pressure head values independent of the remaining pores in the system. Second, the water volume difference between the drained and filled states of each pore is independent of the pressure head. It should be noted that the term domain is used here to refer to a group of molecules, or some elements of the system, which can exist in either of the two states (11). If the main branch curve and a set of primary scanning curves (e.g., redrying) are used to define the pore configuration in terms of the domain model, then the other set of primary curves (rewetting) or any other wetting and drying curve patterns can be predicted from the theory.
Poulovassilis (43) was the first to apply the theory to predict redry from rewet scanning curves. Using a disc of sintered glass beads Poulovassilis got encouraging agreement between these predictions and his experimentally–measured data.
Using a dynamic technique, Topp and Miller (52) determined the hysteresis behavior of two artificial porous bodies prepared from glass beads, and compared their experimental data with the prediction of the independent domain hypothesis. One of their porous bodies consisted of uniform glass beads (monodispersed porous body) and the other, was comprised of aggregates made of glass beads. In both bodies the particles were loose and presented a rather narrow range of pore sizes, especially in the case of the monodispersed system. The results showed that predictions were in very poor agreement with the experimental data.
Izady et al.
50
The discrepancy between these results and those of Poulovassilis (43) could perhaps be due merely to differences in the employed media. In this study, the theory fits the aggregated sample somewhat better than it does for the monodispersed sample. This may indicate that the theory may be at worst performance for media with narrow pore size distributions. Therefore, it can be concluded that the theory proved to be quite inapplicable to these data and that the air-entry effect on the main branch drainage curves was strongly connected to the failure of the independent domain theory, although it was not the sole origin of the discrepancies.
Topp (50) has used a uniformly packed column of sandy loam soil to a controlled series of wetting and drying changes. From the poor agreement between the predictions and the experimental data it is evident that the independent domain model is not adequate for this sandy loam soil for pressure heads ranging from 0 to -280 cm of water. The nature of the discrepancy between the experiment and the prediction is quite similar to that shown by Topp and Miller (52) for the monodispersed glass-bead sample.
Poulovassilis (44) has used granular porous bodies to assess hysteresis behavior and to compare them with the predictions of the independent domain concept. The results showed that the predictions were in very good agreement with the experimental data.
To modify the inadequacies of the independent domain theory of hysteresis Topp (51) introduced an extra extension to the theory by including two types of pore interactions. In the independent domain theory only the shapes of the pores determine the draining and filling characteristics of each pore, but in the introduced extension the draining and filling of each pore was assumed to depend on the state of neighboring pores as well as the pore geometry. The ratios of changes in water content of the soil during drying and rewetting over a given pressure head range has been used to determine the importance of pore interactions and to separate the two types of pore blockage. Primary scanning curve data for porous materials ranging from glass beads to clay loam soil has shown that pore blockage against air-entry during the drying of a soil near saturation and pore blockage against water-entry during rewetting of a relatively dry soil were the two major types of pore interactions. The predictions based on the introduced extension are considerable improvements over predictions by the independent domain theory. Although, this extension to the domain theory has improved the model, it has complications when applied in practice.
By considering a different integration domain for the distribution function ),( wdf ψψ , Mualem (29) derives Model II. Using the theory developed by Mualem
(29), the following expressions for the moisture content can be derived:
(1) For an uneven order drying scanning curve of order n:
]))((
))()())(()(([
])(
)()())[()(()()(
21
1 2
221212∑−=
=
+−
−−−+
−−−+=
ni
i iws
iwidiwiw
ws
wdwnwwnd
ψθθψθψθψθψθ
ψθθψθψθψθψθψθψθ
(1)
(2) For an even order wetting scanning curve of order n:
Hysteresis: Phenomenon and Modeling…
51
]))((
))()())(()(([
])(
)()())[()(()()(
2
2
1232
1
∑=
=
−−
−
−−−+
−−
−+=
ni
i nws
nwndiwiw
nws
nwndwnwwnw
ψθθψθψθψθψθ
ψθθψθψθψθψθψθψθ
(2)
(3) For an uneven order wetting scanning curve of order n:
])((
))()(())((
))()(())[()((
])(
)()())[(()()(
12
121221
1 12
12122
1
11
−
−−−=
= +
++
−−
−−
−−+
−−
−+=
∑iws
iwidni
i iws
iwidwiw
ws
wdwswnw
ψθθψθψθ
ψθθψθψθψθψθ
ψθθψθψθψθθψθψθ
(3)
(4) For an even order drying scanning curve of order n:
]))((
))()(())[()((])(
)()([
)).()((])(
)()())[(()()(
2
2 12
1212222
1
12
∑=
= −
−−− −
−−+
−−
−+−−
−+=
ni
i iws
iwidiwiw
ws
wd
wnwws
swdwswnd
ψθθψθψθψθψθ
ψθθψθψθ
ψθψθψθθψθψθψθθψθψθ
(4)
where )(ψθw , is volumetric moisture content on the main wetting curve for a pressure head ψ ; )(ψθd , is volumetric moisture content on the main drying curve for a pressure head ψ ; )(ψθnw , is volumetric moisture content on the wetting curve of order n for a pressure head ψ ; )(ψθnd , is volumetric moisture content on the drying curve of order n for a pressure head ψ ; sθ , is saturated moisture content and
iψ is the water potential at which the i-th reversal from wetting to drying (or drying to wetting) occurred.
The scanning curves predicted by the introduced model were in satisfactory agreement with the measured ones. Great improvement was achieved for the case in which the prediction based on usual Everett model (11) was poor. Since the introduced model was based on a modified independent domain theory, there are some limitations that are not circumvented, such as the large deviation of the predicted curves from the measured ones for cases in which appreciable hysteresis exists for ψ greater than the air-entry value.
Mualem's Model II was a 2-branch model. If the two main curves are given ),( dw θθ , all the other curves could be calculated. In the universal variant of this model (30) the two distribution functions were assumed equal:
)()(),( wdwd mmf ψψψψ = (5)
In this case the required information for the determination of the distribution function ),( wdf ψψ was reduced to one branch. The model is "universal" because it presents a "universal" relationship between the two main curves.
s
wws θ
ψθψθθψθ )()].(2[)( −= (6)
Izady et al.
52
Mualem (31) proved that when the water content is normalized between the minimum measured value )( minθ and the resaturation value )( sθ , the theoretical primary curves duplicate the main hysteresis curve. Based on this property of the universal model, a procedure was developed to predict the complete hysteresis domain when only the primary hysteresis curve is available. However, the universal model was not recommended for unrestricted use as a predictive tool of scanning curves. Good agreement between theory and observations was found for sand, which displays a zero air entry value. In other cases, the prediction errors at high saturations were quite large. A comprehensive examination of the universal model using data of 10 soils (31) indicated that the upper limit of the effective saturation )( eS under which the model generally yields acceptable results varies significantly for different soils but with a characteristic trend. This limiting value of eS diminishes as the granular fraction of the soil increases. That gave grounds for hypothesizing that poor performance of the universal model results from neglecting the effect of pore water blockage against air entry.
Dependent Domain Theory
The basis of the dependent domain theory is the following equation (9):
dwdwdwdwd ddfP ψψψψψθψψψθψψθ ),(),,,).(,,,(∫∫= (7)
where ),( dwf ψψ is the distribution function corresponding to the independent domain behavior of the porous medium, dP is a weight function )1( ≤dP which represents the ratio between the volume of actually drained pores and the volume which would have been drained if the pores were independent. Similarly, wP is the weight function for a wetting process. Function dP accounts for pore blockage against air entry, and wP for pore blockage against water. If wd PP = , Eq. (7) becomes identical with the independent domain relationship.
A different attempt for defining a dependent domain model of hysteresis has been made by Poulovassilis and Childs (45). They defined two kinds of pore elements: α elements, have independent wψ values but the values of dψ depend on the capillary head wrψ , at which the process switches from wetting to drying, and βelements, with independent dψ but with wψ depending on drψ at which transition from drying to wetting takes place. All the parameters are located off the line. The pore distribution function becomes in a way a function of four variables, F( wψ , dψ ,
wrψ , drψ ). Although the authors suggest some simplifications which make possible the derivation of F from measured scanning curves, the amount of experimental data required in order to determine F is so large (sets of primary and secondary wetting and drying scanning curves) as to prohibit use of the method. However, the results showed that the predictions were in satisfactory agreement with the experimental data.
Mualem and Dagan (33) presented a simplified dependent domain model of hysteresis (Model III) which incorporates two fundamental ideas of Everett (9) and Topp (51) together and was simple enough to be applied to unsaturated flows. It was
Hysteresis: Phenomenon and Modeling…
53
found that the simplified model leads to better results than the models based on independent domain model theories for soils having a major portion of their hysteresis loop in the range of air entry value. However, the better performance of Model III was achieved at the expense of using more measured data (it requires a primary drying scanning curve in addition to the main hysteresis loop for calibration) and detraction from the simplicity of the model.
Mualem (31) modified the dependent domain theory. The modified model corrects the moisture content changes calculated on the basis of the independent domain )( 0θ∆ by multiplying these changes with a correction factor )(θdP :
2))(()()( +−
−=ψθθθθθθ
ws
ssdP (8)
where +ψ is the potential for which θψθ =+ )(d . For a wetting curve of order n the correction factor is nndP ψψθ )),(( being the pressure head of the n-th reversal point. For a drying curve the factor is ))(( ψθdP , where ψ is the current pressure head for which the moisture content is being calculated. This implies that for a drying curve
dP is to be calculated iteratively, hence the implicit character of the model. Computed primary and secondary scanning curves derived by this model showed good agreement with measured data. The results are compared with computed curves based on Model II of Mualem (29). The new model seems to agree with observation much better that Model II, which uses the same amount of data for calibration. Parlange's model Parlange (39) developed a conceptual model which requires knowledge of one boundary instead of two boundaries, as in Mualem's case (31). In this model Parlange (39) assumed that the distribution function is only the function of dψ :
)(),( dwd ff ψψψ = (9)
Furthermore, Parlange (39) pointed out that in the determination of the moisture retention characteristics the actual wetting boundary curve is seldom obtained. This implies that only uneven order drying and even order wetting scanning curves can be measured.
To understand the principle of Parlange's model (39), consider a drying scanning curve starting at potential 1ψ on the wetting boundary of the curve. Then:
dwdwwd dfd M ψψψψψθψψθψ
ψ
ψ
ψ),()(),(
11 ∫∫+= (10)
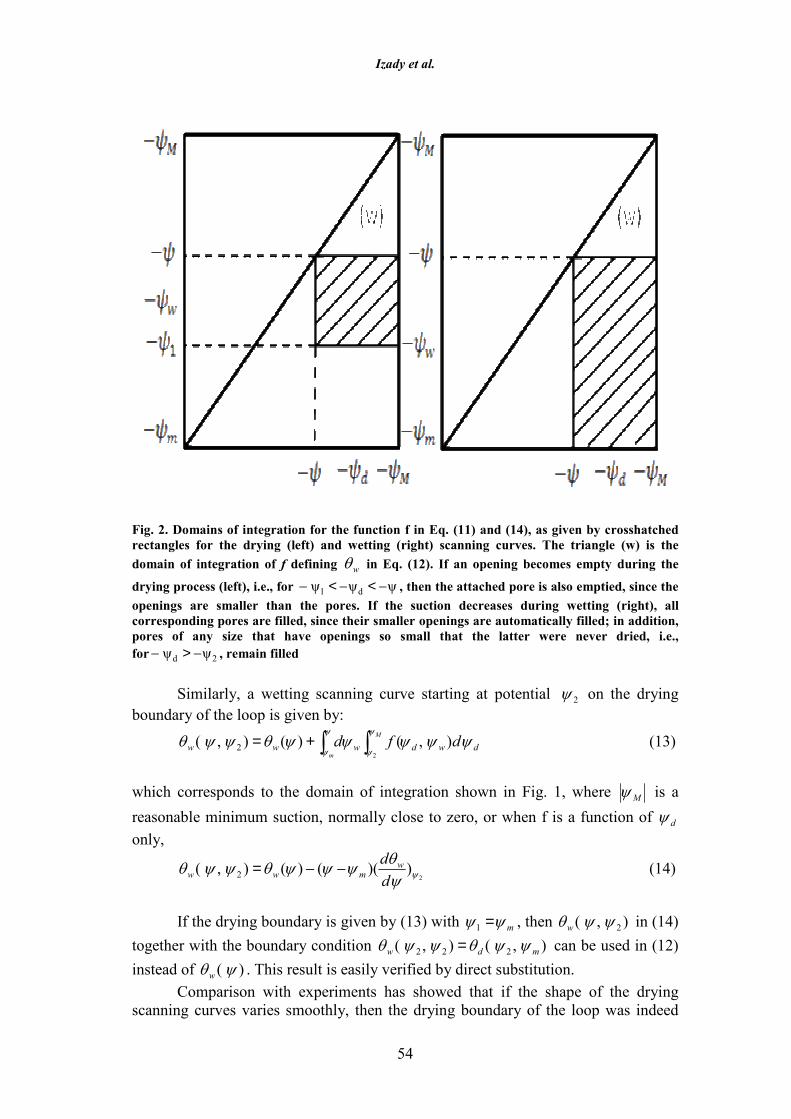
Which correspond to the domain of integration shown in Fig. 2, where Mψ is a reasonable maximum suction. If f is a function of dψ only, then:
ddwwM
w
M dfd ψψψθψ
ψ
ψ
ψ ∫∫= )( (11)
and
ψψθψψψθψψθ ))(()(),( 11 d
d wwd −−= (12)
Izady et al.
54
Fig. 2. Domains of integration for the function f in Eq. (11) and (14), as given by crosshatched rectangles for the drying (left) and wetting (right) scanning curves. The triangle (w) is the domain of integration of f defining wθ in Eq. (12). If an opening becomes empty during the
drying process (left), i.e., for ψψψ d1 −<−<− , then the attached pore is also emptied, since the openings are smaller than the pores. If the suction decreases during wetting (right), all corresponding pores are filled, since their smaller openings are automatically filled; in addition, pores of any size that have openings so small that the latter were never dried, i.e., for 2d ψψ −>− , remain filled
Similarly, a wetting scanning curve starting at potential 2ψ on the drying boundary of the loop is given by:
dwdwww dfd M
m
ψψψψψθψψθψ
ψ
ψ
ψ),()(),(
22 ∫∫+= (13)
which corresponds to the domain of integration shown in Fig. 1, where Mψ is a reasonable minimum suction, normally close to zero, or when f is a function of dψonly,
2))(()(),( 2 ψψ
θψψψθψψθdd w
mww −−= (14)
If the drying boundary is given by (13) with mψψ =1 , then ),( 2ψψθw in (14)
together with the boundary condition ),(),( 222 mdw ψψθψψθ = can be used in (12) instead of )(ψθw . This result is easily verified by direct substitution.
Comparison with experiments has showed that if the shape of the drying scanning curves varies smoothly, then the drying boundary of the loop was indeed
Hysteresis: Phenomenon and Modeling…
55
sufficient to predict all scanning curves. However, if the shape of the drying scanning curves changed abruptly, the model was applicable. However, the drying boundary yields only the wetting scanning curves, and the wetting boundary yields only the drying scanning curves.
Nonetheless, application of the theory is mathematically not trivial (34). Using a modified Brooks and Corey equation (4), Hogarth et al. (20) express the main wetting curve as:
aeweae
aew
aeae
aew
for
for
ψψψψψλλθψθ
ψψψψθψθ λ
≤−+=
=
p
f
)1()(
)()((15)
and wesw for ψψθψθ p=)( (16)
where aeψ is air entry potential; weψ is water entry potential; λ is a dimensionless shape factor; sθ is the saturated moisture content; and aeθ is the moisture content on the main wetting curve at the air entry potential, which is calculated as:
)(1ae
we
sae
ψψλλ
θθ−+
= (17)
The main drying curve can be calculated according to the expression:
aesd
aeweae
aed
for
for
ψψθψθ
ψψψψλλ
ψψθψθ λ
≤=
−+=
)(
)1()()( f(18)
The Parlange hysteresis model (39), which was initially formulated using the
Brooks and Corey equation (4), was modified to use the well known van Genuchten (53) equation to describe the WRC (3). This model uses a simplified expression of van Genuchten equation by taking 0=rθ (even if the residual volumetric water content can have an important role as a curve fitting parameter). In the following, θstands for )( rθθ − , then 0)( →ψθ as 0→ψ . The van Genuchten (53) model becomes:
mnsvG ]
)(11[αψ
θθ+
= (19)
where vGθ is volumetric moisture content estimated by the van Genuchten equation (53) and nm, and α correspond to fitted parameters of the equation. The authors defined a parameter )(ψC as the specific capacity:
11 ])(1
1[)()( +−
+= m
nn
smnCαψ
αψαθψ (20)
Using the van Genuchten equation (53) to fit data of the main wetting curve,
the main drying curve can be expressed as:

Izady et al.
56
)()()( ψψψψθθ CdvGd −+= (21) where dθ is the calculated (predicted) volumetric water content on the main drying curve and dψ is the water pressure at the inversion point from wetting to drying. Braddock et al. (3) have also presented other equations that allow predicting primary and secondary hysteresis curves.
EMPIRICAL MODELS
Empirical models are based on an analysis of WRC shape and properties. These models use close-formed empirical expressions to represent hysteresis curves. They are often developed for a specific soil and they do not claim general validity because their derivation is not based on a physical representation of hysteresis. Among these models, one can identify: a) the interpolation model developed by Pickens and Gilham (42), Hoa et al. (19) and Dane and Wierenga (5); b) the linear model developed by Hanks et al. (15); c) the slope model developed by Jaynes (21) derived from Dane and Wierenga’s (5) work and d) the scaling-down model developed by Scott et al. (48).
Interpolation model
The interpolation model calculates the value of θ of the new soil – water pressure from the θ -values of the main wetting and drying curves, wθ and dθ .
)()( 11 nnnn PPC −−= ++ θθ (22)
where C is the differential or specific water capacity, θ is the volumetric water content and the subscripts identify the values at the new time (n+1) and the old time (n) used in the numerical scheme. For wetting process:
)()1()( 11
11
1 +++ −+= nw
nd
n PcPc θθθ (23)
where
11
11
1 ][ wPP
ctr
n αα
+−= + (24)
)]()([)]()([1 trwtrdtrwtr PPPPw θθθθ −−= (25)
For drying, 1+nθ is found from:
)()1()( 12
12
1 +++ −+= nd
nw
n PcPc θθθ (26)

Hysteresis: Phenomenon and Modeling…
57
where
22
12
2 ][ wPP
c ntr α
α+−
= + (27)
)]()([)]()([2 trwtrdtrtrd PPPPw θθθθ −−= (28)
where trP is the transition pressure, the pressure at which the soil changes from wetting to drying or drying to wetting, 1w and 2w are weighting factors which are dependent on the water contents at the transition pressure and are required for secondary or higher scanning curves, 1α and 2α determine the rate of the scanning curve for a wetting and drying process, respectively. It should be noted that the values of 1.8 and 1.2 have been suggested for 1α and 2α , respectively by Hanks et al. (15). However, the α -values can be calculated from information contained in the main wetting and drying curves. Therefore:
trs
cetr
PPPPP
−=−+=
2
1 )](4[expαα
(29)
where eP is the air-entry soil-water pressure head, cP is the pressure where the hysteresis curves merge, and sP is the pressure at which the main curves separate. Linear model The linear model approximates the scanning curves by a straight line spanning the main wetting and drying curves. In this model, the slope of the line is arbitrary with the only constraint that it be less than the slope of the main curves at intersection. For this 2-branch model the equations are:
])()([)()( 131
311211 ψψ
ααααψθψθψθψθ −
−−−= dw
wd (30)
for a primary drying scanning curve and
])()([)()( 132
32211 ψψ
ααψθααψθψθψθ −
−+−= dw
dw (31)
for a primary wetting scanning curve. where 3α is the maximum pressure difference between the main wetting and drying curves at the same water content. Slope model The slope model is a modification of the interpolation method (5). In this model, C is calculated from the slopes of the main wetting and drying curves rather than from the water contents as in the interpolation method. For wetting curves:
)(3 dPdwC wθ= (32)

Izady et al.
58
with
)]()([)]()([ 11113
++++ −−= nw
nd
nnd PPPPw θθθθ (33)
For drying, C is calculated in a similar way.
)(4 dPdwC dθ= (34)
with
)]()([)]()([ 11114
++++ −−= nw
nd
nw
n PPPPw θθθθ (35)
where P is the soil water pressure head. An additional condition was placed on C for drying curves where ePP 5.1≥ ( eP is the air – entry soil – water pressure head). For these conditions, C was taken to be the maximum of either the value calculated in Equation 34 or the value calculated from a weighted average of the main curve slopes:
dPd
dPdC wd θαθ
4+= (36)
where
sn
s P θθθα 1.0)]([ 14
+−= (37)
and the maximum value allowed for 4α was 1. Equation 36 was used to give C anon-zero value for scanning curves where e
n PP f1+ rather than zero, as would be calculated by Equation (34) alone. Scaling – down model In this model the drainage scanning curves are predicted by rescaling the main drying curve to pass through the residual moisture content )( rθ and the last reversal point from wetting to drying )( ∆∆ψθ by replacing the saturated moisture content, sθ , by:
))(())(()(*
rd
dsrrsS θψθ
ψθθθθθθθ−−−−=
∆
∆∆ (38)
Wetting scanning curves are predicted by replacing rθ by:
))(())(()(*
∆
∆∆
−−−−=
ψθθθψθθθθθθ
ws
rwsrsr (39)
All notations have been specified before. By doing this, the curve is forced
through the last drying to wetting reversal point and sθ .It should be mentioned that other models were recently developed using
different concepts. For example, the mathematical model developed by Preisach (46)

Hysteresis: Phenomenon and Modeling…
59
was applied to describe the hysteresis effects in the water retention curve by O’Kane et al. (37), using the concept of a continuous analog of a finite parallel connection of relays. The Haverkamp et al. (17) model, based on geometric scaling, was recently modified and simplified (12). Another hysteresis empirical model was developed for sandy soils using the basic concept of shape similarity between the WRC and the cumulative particle-size distribution function (16). In this case, the hysteresis is predicted from the basic properties of the soil, not from a WRC.
Summary and Comparison of models Two main group of hysteresis models were reviewed in connection to their theories. These models were categorized into conceptual and empirical models. The first group is based on the domain theory of capillary hysteresis and the second group relies on the analysis of observed WRC shape and properties. Conceptual models included the independent and dependent domain theories and Parlange's model, while empirical models consisted of the interpolation; linear; Slope and Scaling – down models. Several authors have compared these different models. Viaene et al. (54), following a statistical analysis of hysteresis models, concluded that the best 2 branch models were conceptual models (Mualem II and IV), while the Parlange model was selected as the best choice for hysteresis prediction using a single branch. The same conclusion was reached by Si and Kachanoski (49) about one branch models. However, Jaynes' comparison (21 and 22) led to the conclusion that none of the methods were consistently better than the others, even for the more complex models with more than two branches. Jaynes also concluded that the linear model (empirical type of model) appears to be the best approach to predict hysteresis. Maqsoud et al. (27) indicated that the Universal Mualem model did not predict the WRC adequately. However, the two versions of the Parlange model (22 and 3) allow for good predictions of the main drying curves. More recently, different studies (3 and 17) suggested that the Parlange model, that uses the concept of rational extrapolation, was the best model to predict hysteresis of the WRC. Bradock et al. (3) proposed a new formulation of the Parlange model using the Van Genuchten (53) equation instead of Brooks and Corey’s (4). However, this version of the Parlange model should be examined in most texture soils.
REFERENCES
1. Basile, A., G. Ciollaro, and A. Coppola. 2003. Hysteresis in soil water characteristics as a key to interpreting comparisons of laboratory and field measured hydraulic properties. Water Resour. Res. 39:1301-1312.
2. Beese, F. and R. R. Van Der Ploeg. 1976. Influence of hysteresis on moisture flow in an undisturbed soil monolith. Soil Science Society of America Journal. 40:480-483.
3. Braddock, R. D., J. Y. Parlange, and J. Lee. 2001. Application of a soil water hysteresis model to simple water retention curves. Transport in Porous Media 44:407-420.
4. Brooks, R. H. and A. T. Corey. 1964. Hydraulic properties of porous media. Hydrology Paper No. 3. Colorado State University, Fort Collins.

Izady et al.
60
5. Dane, J. H. and P. J. Wierenga. 1975. Effect of hysteresis on the prediction of infiltration, redistribution and drainage of water in a layered soil. J. Hydrology. 25:229-242.
6. Enderby J. A. 1955. The domain of hysteresis. Part I: independent domains. Transaction Faraday Society. 51:835-848.
7. Everett, D. H. 1954. A general approach to hysteresis – Part 3: A formal treatment of the independent domain model of hysteresis. Transaction Faraday Society. 50:1077-1096.
8. Everett, D. H. 1955. A general approach to hysteresis – Part 4: An alternative formulation of the domain model. Transaction Faraday Society. 50:1551-1557.
9. Everett, D. H. 1967. Adsorption hysteresis, in Solid Gas Interface. Vol. 2, edited by E. A. Flood, Chap. 36, Marcel Dekker, New York.
10. Everett, D. H. and F. H. Smith. 1953. A general approach to hysteresis – Part 2: Development of the domain theory. Transaction Faraday Society. 50:187-197.
11. Everett, D. H. and W. I. Whitton. 1952. A general approach to hysteresis. Transaction Faraday Society. 48: 749-757.
12. Gandola, F., S. Debionne, N. Varado, R. Haverkamp, P. J. Ross, G. Sander, and J. Y. Parlange. 2004. Simple soil water hysteresis prediction model based on theory and geometric scaling. Proc. of EGU conference, Vol. 6.
13. Gillham, R. W., A. Klute and D. F. Hermann. 1979. Measurement and numerical solution of hysteretic flow in a heterogeneous porous medium. Soil Sci. Soc. Am. J. 43:1061-1067.
14. Haines, W. 1930. Studies in the physical properties of soil: The hysteresis effect in capillary properties, and the modes of moisture distribution associated therewith. J. Agric. Sci. 20:97–116.
15. Hanks, R. J., A. Klute, and E. Bresler. 1969. A numerical method for estimating infiltration, redistribution, drainage and evaporation of water from of water from soil. Water Resour. Res. 5:1064-1069.
16. Haverkamp, R. and J. Y. Parlange. 1986. Predicting the water-retention curve from particle size distribution: 1. Sandy soils without organic matter. Soil Sci. 142:325-339.
17. Haverkamp, R., P. Reggiani, P. J. Ross, and J. Y. Parlange. 2002. Soil water hysteresis prediction model based on theory and geometric scaling. Environmental Mechanics; Water, Mass and Energy Transfer in the Biosphere, Geophysical Monograph Series, Vol. 129.
18. Hillel, D. 1980. Fundamentals of Soil Physics. Academic Press, New York. pp. 155-161; 457-464.
19. Hoa, N.T., R. Gaudu, and C. Thirriot. 1977. Influence of the hysteresis effect on transient flows in saturated–unsaturated porous media. Water Resour. Res. 13(6): 992–996.
20. Hogarth, W., J. Hopmans, and J. Y. Parlange. 1988. Application of a simple soil water hysteresis model. J. hydrol. 98:21-29.

Hysteresis: Phenomenon and Modeling…
61
21. Jaynes, D. 1984. Comparison of soil-water hysteresis models, J. Hydrology. 75:287-299.
22. Jaynes, D. 1990. Soil water hysteresis: models and implications. Process studies in hillslope hydrology. 93-126.
23. Kool, J. B. and J. C. Parker. 1987. Development and evaluation of closed-form expressions for hysteretic soil hydraulic properties. Water Resour. Res. 23(1):105–114.
24. Lehmann, P., F. Stauffer, C. Hinz, O. Dury, and H. Fluhler. 1998. Effect of hysteresis on water flow in a sand column with a fluctuating capillary fringe. Journal of Contaminant Hydrology. 33:81–100.
25. Lenhard, R. J. and J. C. Parker. 1987. A model for hysteretic constitutive relation governing multiphase flow. 2. Permeability saturation relation. Water Resour. Res. 23:2197-2206.
26. Lenhard, R. J., J. C. Parker, and J. J. Kaluarachchi. 1989. A model for hysteretic constitutive relation governing multiphase flow. 3. Refinements and numerical simulations. Water Resour. Res., 25:1727-1736.
27. Maqsoud, A., B. Bussière, M. Mbonimpa, and M. Aubertin. 2004. Hysteresis effects on the water retention curve: A comparison between Laboratory results and predictive models. 57th Canadian Geotechnical Conference and 5th Joint CGS/IAH-CNC Conference.
28. Mualem, Y. 1973. Modified approach to capillary hysteresis based on a similarity hypothesis. Water Resour. Res. 9(5):1324–1331.
29. Mualem, Y. 1974. A conceptual model of hysteresis. Water Resour. Res. 10(3):514–520.
30. Mualem, Y. 1977. Extension of the similarity hypothesis used for modeling the soil water characteristics. Water Resour. Res. 13(4):773–780.
31. Mualem, Y. 1984. A modified dependent-domain theory of hysteresis. Soil Sci. 137(5):283–291.
32. Mualem, Y. and E. E. Miller. 1979. A hysteresis model based on an explicit domain-dependence function. Soil Sci. Soc. Am. J. 43:1067–1073.
33. Mualem, Y. and G. Dagan. 1975. A dependent domain model of capillary hysteresis. Water Resour. Res. 11(3):452–460.
34. Mualem, Y. and H. J. Morel-Seytoux. 1978. Analysis of a capillary hysteresis model based on a one variable distribution function. Water Resour. Res. 14:605-610.
35. Nimmo, J. R. and E. E. Miller. 1986. The temperature dependence of isothermal moisture versus potential characteristics of soils. Soil Sci. Soc. Am. J. 50:1105-1113.
36. O’Kane, J. P. 2005. The FEST model – a test bed for hysteresis in hydrology and soil physics. Institute of Physics Publishing, Journal of Physics: Conference Series 22: 148–163.
Izady et al.
62
37. O’Kane, J.P., A. Pokrovskii, and D. Flynn. 2004. The fest model for testing the importance of hysteresis in hydrology. Proc. of EGU conference, Vol. 6, 07303.
38. Parker, J. C. and R. J. Lenhard. 1987. A model for hysteretic constitutive relation governing multiphase flow. 1. Saturation-pressure relations. Water Resour. Res. 23:2187-2196.
39. Parlange, J. Y. 1976. Capillary hysteresis and relationship between drying and wetting curves, Water Resour. Res. 12:224-228.
40. Philip, J. R. 1964. Similarity hypothesis for capillary hysteresis in porous materials. J. Geophys. Res. 69(8):1553–1562.
41. Philip, J. R. 1991. Horizental redistribution with capillary hysteresis. Water Resour. Res., 27:1459-1469.
42. Pickens, J. F. and R. W. Gillham. 1980. Finite element analysis of solute transport under hysteretic unsaturated flow conditions, Water Resour. Res. 16:1071-1078.
43. Poulovassilis, A. 1961. Hysteresis of pore water: an application of the concept of independent domains. Soil Sci. 93:405-412.
44. Poulovassilis, A. 1969. Hysteresis of pore water in granular porous bodies. Soil Sci. 109:5-12.
45. Poulovassilis, A. and E .C. Childs. 1970. The hysteresis of pore water: The non-independence of domains. Soil Sci. 112:301–312.
46. Preisach P. 1938. Über die magnetische Nachwirkung. Zeitschrift für Physik. 94:277-302.
47. Russo, D., W.A. Jury, and G. L. Butters. 1989. Numerical analysis of solute transport during transient irrigation: 1. The effect of hysteresis and profile heterogeneity. Water Resour. Res. 25(10):2109–2118.
48. Scott, P. S., G. J. Farquhar, and N. Kouwen. 1983. Hysteretic effects on net infiltration, Adv. in Infiltration, ASAE, St Joseph, MI, pp. 163-170.
49. Si, B. C. and R. C. Kachanoski. 2000. Unified solution for infiltration and drainage with hysteresis : Theory and field test, Soil Sci. Soc. Am. J. 64:30-36.
50. Topp, G. C. 1969. Soil Water Hysteresis Measured in a Sandy Loam and Compared with the Hysteresis Domain Model. Soil Sci. Soc. Am. Proc. 33:645–651.
51. Topp, G. C. 1971. Soil–water hysteresis: the domain theory extended to pore interaction conditions. Soil Sci. Soc. Am. Proc. 35: 219–225.
52. Topp, G. C. and E. E. Miller. 1966. Hysteresis moisture characteristics and hydraulic conductivities for glass bead media. Soil Sci. Am. Proc. 30:156-162.
53. Van Genuchten, M. T. 1980. A closed-form equation for predicting the hydraulic conductivity of unsaturated soils. Soil Sci. Am. J. 44:892-898.

Hysteresis: Phenomenon and Modeling…
63
54. Viane, P., H. Vereecken, J. Diels, and J. Feyen. 1994. A statistical analysis of six hysteresis models for the moisture characteristics. Soil Sci. 157:345-355.
55. Witkowska-Walczak, B. 2006. Hysteresis between wetting and drying processes as affected by soil aggregate size. Int. Agrophysics. 20:359-365.

Izady et al.
64
و مدل و خاكسازيهيسترسيس؛ پديده در روابط آب
ايزديلهعزيزا*١كامران داوريو**١، بيژن قهرمان*١
١ بخش مهندسي آب، دانشكده كشاورزي، دانشگاه فردوسي مشهد، مشهد، جمهوري اسالمي ايران
و خاك يك پديده كامالً شناخت- چكيده در ايـن مقالـه،. باشدميه شده هيسترسيس در روابط مربوط به آب
هاي مختلفـيتاكنون، مدل. هاي مربوط به آن مورد مطالعه قرار گرفته است پديده هيسترسيس از ديدگاه مدل
وبراي توصيف هيسترسيس در منحني رطوبتي ارائه شده است كه شامل دو گروه اصـلي مـدل هـاي مفهـومي
ت. باشدتجربي مي هايمدل و گروه دوم بر مبناي تحليل شـكلئوري هيسترسيس موئينه گروه اول بر مبناي اي
ميو خصوصيات منحني رطوبتي اندازه هاي مفهومي شامل تئوري حوزه مستقل، تئـوريمدل. باشدگيري شده
و مدل و مدل پارالنژ وهاي درونهاي تجربي شامل مدلحوزه وابسته †كوچك نمودن مقياسيابي، خطي، شيب
يابي منطقي اسـتفادهدهد كه مدل پارالنژ كه از مفهوم برونمطالعات محققين مختلف نشان مي نتايج. باشد مي
ركند بهترين مدل براي پيشمي .باشدميطوبتيبيني هيسترسيس در منحني
هيسترسيس، مدل پارالنژ، تجربيمدل مفهومي، مدل: واژه هاي كليدي
† Scaling–down *و دانشيار�� ترتيب دانشجوي دكتري، استاد
مكاتبه كننده **