Chemical Resistance of Cement Concrete Partially Replaced ...
Rheol Acta (2009) 48:343–358DOI 10.1007/s00397-008-0333-9
ORIGINAL CONTRIBUTION
Study of morphological hysteresisin partially immiscible polymers
Carmela Tufano · Gerrit W. M. Peters ·Peter Van Puyvelde · Han E. H. Meijer
Received: 1 April 2008 / Accepted: 5 November 2008 / Published online: 10 December 2008© The Author(s) 2008. This article is published with open access at Springerlink.com
Abstract The morphology evolution of two systems ofpartially immiscible polymers, differing in miscibility, isinvestigated by means of rheological experiments andoptical microscopy. For each system, two concentra-tions, 10% and 20%, are used. For immiscible systems,a hysteresis zone, defined by coalescence and breakup,exists where the average drop radius is not a uniquefunction of the shear rate. We investigate whether thefindings also apply to partially immiscible polymers. Theaverage radii at different shear rates, measured withrheology, are compared to model predictions. The hys-teresis zone, if present, is indeed affected by the poly-meric system, the concentration and the flow historyapplied. Coalescence evolution is measured for threedifferent step-downs in shear rate. For both 10% sys-tems, the resulting average radii show a rather highscattering and do not match the theoretical predictions.For the 20% concentrations, the average experimentaldrop sizes seem independent of the magnitude of thestep-down, at least during a certain period of time.Thereafter, it experiences a sudden, in the time scaleof the experiments unbounded, increase in size that ismore pronounced for the higher step-downs. Devia-tions of the experimental data from theoretical predic-tions are attributed to the partially immiscible characterof the systems, yielding enhanced coalescence which, inturn, can induce confinement effects.
C. Tufano · G. W. M. Peters (B) · H. E. H. MeijerEindhoven University of Technology,Eindhoven, The Netherlandse-mail: [email protected]
P. Van PuyveldeKatholieke Universiteit Leuven, Leuven, Belgium
Keywords Morphological hysteresis ·Partially immiscible polymers ·Morphology evolution · Blend · Confined flow
Introduction
The steady-state morphology of blends obtained bymixing immiscible polymers has been found to be aunique function of the flow history applied, while pre-paring and processing the blend, and it is consid-ered as the result of a dynamic equilibrium betweentwo competing phenomena: breakup and coalescence(Takahashi et al. 1994; Vinckier et al. 1996). Bothprocesses are determined by two dimensionless num-bers: the capillary number Ca = ηmγ̇ R/σ , with ηm theviscosity of the matrix phase, γ̇ the shear rate, R thedrop radius, and σ the interfacial tension of the polymerpairs, and the viscosity ratio p = ηd/ηm, where ηd is theviscosity of the dispersed phase. Grace (1982) devotedhis life to determine how the critical capillary number,defined as the capillary number at which breakup ofa single drop occurs, depends on the viscosity ratio,defining in shear and extensional flows the limitingcondition for breakup to occur. Concerning the flow-driven coalescence limit for two droplets, Chesters(1991) proposed a probability of coalescence basedon the interaction time during the collision of dropsand the time needed to drain the matrix film trappedbetween them. Based on the mobility of the interface(fully mobile, partially mobile, and immobile), threedifferent expressions to, for a given shear rate, calculatethe maximum radius, above which coalescence does notoccur anymore, were proposed. An overview of thephysics behind breakup and coalescence is reported by
344 Rheol Acta (2009) 48:343–358
Grmela et al. (2001). Also, some experimental stud-ies on the effects of simple shear flow on the mor-phology evolution in immiscible polymer blends havebeen carried out. Elmendorp (1986) showed that theequilibrium between breakup and coalescence can bereached only for shear rates higher than the critical one,which is defined as the shear rate at which the theoret-ical limiting curves for breakup and coalescence cross.Grizzuti and Bifulco (1997), Vinckier et al. (1998), andMinale et al. (1997, 1998) showed, by means of rhe-ological experiments and optical microscopy (OM),that the steady-state morphology is reached only aftera certain critical shearing time. However, Janssen andMeijer (1995) reported that flow conditions might existin which more that one morphology is possible. Forshear rates lower than the critical one, the dynamicequilibrium between breakup and coalescence cannotbe obtained, or, at least, it cannot be reached in a rea-sonable shearing time. In that case, there exists a pseu-doequilibrium zone, in which the morphology dependson the initial conditions and neither breakup nor coa-lescence occurs. Minale et al. (1997) demonstrated theexistence of this hysteresis zone with a model blend atfixed concentration, and they showed that, when theaverage drop radius in the blend is larger than theone predicted by coalescence limits and lower thanthe breakup model prediction at the same experimen-tal shear rate, multiple steady-state morphologies, orpseudo steady-state morphologies, are reached. Thefinal morphology was shown not only to depend onthe characteristics of the blend components and historyof flow but also on the initial conditions. The effectsof viscosity ratio and concentration of the blend havebeen studied by Minale et al. (1998) for the samemodel system. They showed that the hysteresis regionshifts to smaller shear rates and narrows with increas-ing the concentration of the dispersed phase. Apartfrom the aforementioned studies, several others can befound in the literature, all concerning the coalescence inimmiscible polymer blends (Elmendorp and van derVegt 1986; Fortelny and Kovar 1988; Rusu and Peuvrel-Disdier 1999; Verdier and Brizard 2002).
In this study, we investigate the occurrence of a hys-teresis zone and the flow-driven coalescence behaviorfor two partially immiscible polymer systems, havingdifferent diffusivity. The effect of the flow history ap-plied, initial conditions, and concentration of the blendsare investigated by means of rheological measurementsand OM. The measured morphology evolution is com-pared to theories available in literature for breakup andcoalescence. The use of dynamic measurements as anexperimental morphology probing method is criticallyreexamined.
Materials and methods
Materials
The blends investigated are prepared using as dispersephase polybutene (PB, Indopol H-25, BP Chemicals,UK) and polybutadiene (PBD, Ricon 134, Sartomer)respectively, while polydimethylsiloxane (PDMS, UCT)is chosen as continuous phase. These three materialsare liquid and transparent at room temperature, andthey exhibit almost matched refractive indices, leadingto a limited turbidity of the blends, which allows rheo-optical experiments. The densities (ρ) of the materialsare measured at 23◦C by means of a digital densitymeter (DMA 5000, Anton Paar) and, due to the smalldifferences in the density values of the dispersed andcontinuous phases, buoyancy effects can be neglectedgiven the time scale of the experiments. Zero shearviscosities (η) are measured at 23◦C using a rotationalrheometer (Rheometrics, ARES) equipped with a par-allel plate geometry and applying steady shear rates.The viscosity of the pure components is independentof shear rate in the whole range of shear rates applied.In addition, the first normal stress difference is toosmall to be measured with our equipment. The steadyinterfacial tensions (σ ) are measured at room temper-ature by means of a pendent drop apparatus (PAT-1,Profile Analysis Tensiometer, Sinterface, Germany).The average molecular weight (Mn), densities and vis-cosities of the phases and the interfacial tensions ofthe two polymer pairs at room temperature are shownin Table 1. Two different concentrations (10% and20% mass fraction of PB and PBD, respectively) areinvestigated and mixing is performed following the pro-tocol proposed by Takahashi et al. (1994) and Vinckieret al. (1996).
Experimental methods
To erase influence of preparation and loading, all sys-tems are preconditioned at the beginning of eachexperiment by shearing them for a time sufficientlylong to obtain a steady state morphology. The totalminimum strain required is determined in advance,using transient stress relaxation tests that are suitablefor this purpose given their sensibility to the initial
Table 1 Selected model components
Sample Mn ρ η σ
drop/matrix kg/m3 Pa · s mN/m
PB/PDMS 635/62,700 874/972 3.7/10.9 2.2 ∗ 10−3
PBD/PDMS 8,000/62,700 891/972 13.6/10.9 4.2 ∗ 10−3

Rheol Acta (2009) 48:343–358 345
morphology (Takahashi et al. 1994). For our systems,the strain required is found to be between 2,500 and3,000. In all experiments, we used a stress-controlledrheometer (Rheometrics DSR) equipped with a coneand plate geometry (cone diameter 40 mm and coneangle 0.04 rad) and a Peltier element to control thetemperature, set to 23◦C, with an accuracy of ±0.1◦C.After preshearing, the flow is stopped and oscillatorytests are performed to obtain the elastic modulus atfrequencies varying from 0.1 to 100 rad/s. Subsequently,a new steady shear, at a different shear rate, is applied.Experiments are carried out with both increasing anddecreasing shear rates. In the case where shear rates aredecreased, drops coalesce and, therefore, the averageradii measured in this way are expected to follow thepredictions from coalescence theory. In the oppositecase, breakup dominates and results are compared tothe breakup predictions. When investigating the effecton coalescence of different step-downs in shear rate,the sample is first preconditioned at an initial shear rateof 8s−1 for 1,250 s (≈10,000 strain units). Next, the de-sired step-down in the shear rate is applied, whereafterthe flow is stopped at different time intervals from thestep-down to perform the dynamic tests that ultimatelyyield the average drop radii. Indeed, a small strain oscil-latory flow does not affect the morphology (Graeblinget al. 1993, 1994; Gramespacher and Meissner 1992;Vinckier et al. 1996). OM is performed in order tointerpret some of the results and to check the actualdrop size.
Morphology probing using dynamic measurements
For the pure components, the value of storage modulusG′ is zero. The blends show a typical linear viscoelastic
behavior, with a non-zero G′, even at the smallestconcentrations investigated. Figure 1, left, shows theelastic moduli of the blend measured upon cessation ofthe flow, after preshearing at a shear rate of 2 and 0.1s−1
for 3,000 strain units, respectively, showing a shoul-der at low frequencies, that accounts for a relaxationprocess that is due to a perturbation of the shape ofthe dispersed droplets during the oscillatory flow. Dif-ferent preshear rates result in different morphologiesyielding different elastic moduli. Lowering the preshearrate makes the shoulder move to lower frequencies,indicating that larger droplets form at these lowershear rates.
To find the average drop diameter in the blend fromdynamic measurements, the continuous relaxation spec-trum is calculated from the dynamic moduli using anonlinear regression program (Honerkamp and Weese1993); see Fig. 1, right. The initial part of the spectrais identical and it reflects the contribution of the purecomponents. We are interested in the relaxation time τ
corresponding to the peak, which is characteristic fordrop relaxation. The average droplet size R can becalculated from this relaxation τ using an approximateequation derived from the emulsion model of Palierne(1990):
τ = ηm R4σ
(19p + 16)(2p + 3 − 2φ(p + 1))
10(p + 1) − 2φ(5p + 2), (1)
where p is the viscosity ratio (p = ηd/ηm, with ηd as theviscosity of the dispersed phase and ηm as the viscosityof the continuous phase), φ is the volume fraction, andσ is the interfacial tension. Although the value of τ
can be directly obtained from the relaxation spectrum,
Fig. 1 Storage moduli (left), relaxation spectra and weighted relaxation spectra (inset plot) (right) upon cessation of flow after shearingat γ̇ = 2s−1 and γ̇ = 0.1s−1 for 3,000 strain units for a 10-wt.% PB in PDMS blend

346 Rheol Acta (2009) 48:343–358
as the time at which H(τ ) reaches the maximum, adifferent approach was proposed by Gramespacher andMeissner (1992). They suggested to plot the weightedtime relaxation spectrum, τ ∗ H(τ ) vs τ and to usethe time at which this curve reaches the maximumas the relaxation time of the drops. The use of thefirst moment of the relaxation spectrum amplifies thecontribution of slower processes, thus enhancing effectsof the interfacial relaxation process. The inset plot inFig. 1, right, shows the weighted relaxation spectra atthe two shear rates considered. In both procedures, alonger relaxation time and a lower maximum is foundfor the lower shear rate. While the relaxation time islinked to the average size of the inclusions, the mag-nitude of the maximum in the relaxation spectrum, aswell as in the weighted relaxation spectrum, containsinformation on the amount of interfacial area. De-creasing the shear rate, coalescence is promoted and,due to the constant fraction of dispersed phase, themorphology evolution will lead to less and larger drops,which require longer times to relax; see Eq. 1. Fewerlarge drops imply, on the other hand, less interfacialarea, which reduces the magnitude of the maximum; seeFig. 1, right. Figure 2 shows the average droplet radiifor the 10% PB/PDMS blend calculated using Eq. 1with the relaxation time retrieved from the time re-laxation spectra and from the weighted time relaxationspectra, respectively. Experiments are performed whiledecreasing the preshear rate. Clearly, both proceduresgive similar results (within experimental error), indicat-ing that the average radii obtained are a good indicationof the blend morphology. However, we experiencedthat, for the weighted relaxation spectra, the ampli-
Fig. 2 Calculated average radii (Eq. 1), 10 wt.% PB in PDMSblend, for decreasing shear rate. Radii from relaxation timespectra (circles) and weighted relaxation time spectra (triangles)
fication of the slow relaxation phenomena was oftenmore clearly present, which makes the analysis moreprecise. Therefore, this procedure is used. Vinckieret al. (1996) proposed a further improved approach,based on the assumption that the contribution of thedifferent relaxation processes involved are additive.The time relaxation spectra of the pure components,weighted by their volume fraction, were subtractedfrom the blend time relaxation spectrum, influencingthe position of the maximum in H(τ ) and, therefore,the predicted average radius. However, since, in ourcases, the relaxation of the pure components is muchfaster than that of the interface, these corrections willnot have to be used here.
Hysteresis zone
Theories to probe morphological hysteresis
The morphology resulting from dynamic experimentsis compared to breakup and coalescence theories. At afixed shear rate, the flow is able to breakup drops withsizes above a critical value, whereas drops with smallerradii will collide and eventually coalesce. Grace (1982)experimentally found the critical size of a droplet, fora fixed shear rate, above which breakup occurs andbelow which coalescence dominates. Based on Grace’sexperimental results, Bruijn (1989) suggested a fittedcurve:
log(
ηmγ̇ Rσ
)= −0.506 − 0.0994log(p) + 0.124log2(p)
− 0.115
log(p) − log(pcr), (2)
where pcr = 4.08 is the viscosity ratio above whichbreakup is not possible anymore, at least in a start-upshear flow, γ̇ is the shear rate, and R is the average dropradius in the blend. Theories and numerical modelssupport the experimental data (Jackson and Tucker2003; Taylor 1932; Yu et al. 2002, 2005). Also, thecoalescence process has been modeled and differentmobilities of the sharp interfaces (from mobile to par-tially mobile and fully immobile) are distinct, greatlyinfluencing the drainage rate. Also, the more physicaldiffuse interfaces have obtained a lot of attention (viadiffuse interface modeling), and while, for breakup,excellent results are obtained, the spatial resolutionof the mesh makes coalescence events occur too fast(Anderson et al. 1998; Cahn and Hilliard 1958, 1965).The drainage model for sharp interfaces is chosen here.The maximum radius below which coalescence occurs

Rheol Acta (2009) 48:343–358 347
is estimated for the case of a immobile interface (IM)and partially mobile interface (PM) (Chesters 1991):
IM R =(
32
9
)1/4
·(
h1/2cr p
ηm · γ̇
)−1/2
(3)
PM R =(
4√3
hcr
p
)2/5
·(
σ
ηm · γ̇
)3/5
, (4)
where hcr is the critical film thickness. The maximumdrop radius above which coalescence does not occur isa function of the coalescence conditions, the viscosityratio p, and the interfacial tension. In the original paperof Mackay and Mason (1963), the drainage time refersto a droplet coalescing on a flat surface while, in ourexperiments, coalescence occurs between two droplets.To account for that, Eq. 3 is corrected by a factor 4.The main difficulty is to find an adequate value for thecritical film thickness of the matrix trapped betweentwo coalescing drops, hcr. A possibility is to calculatedthis parameter, e.g., using the formulation suggested byChesters (1991):
hcr ≈(
AR8πσ
)1/3
(5)
where A is the Hamaker constant. Since theories arederived for isolated pairs of droplets, while we aredealing with concentrated blends, some authors chooseto use the hcr as an adjustable parameter. It then con-tains all the uncertainties and approximations of themodel and, to a certain extent, it is a function of theconcentration (Minale et al. 1997, 1998). We will use a
Table 2 Critical film thickness hcr calculated with Eq. 5 for thePB/PDMS and PBD/PDMS systems, for three different averagedrop radii R
R [m] hPBcr [m] hPBD
cr [m]
5 ∗ 10−6 1 ∗ 10−8 0.8 ∗ 10−8
50 ∗ 10−6 2 ∗ 10−8 1.7 ∗ 10−8
150 ∗ 10−6 3 ∗ 10−8 2.5 ∗ 10−8
fixed value for each system based on Eq. 5 and use onlythe predictions of the PM model.
Hysteresis results
To draw the coalescence line to theoretically boundthe hysteresis zone, a value for the critical film thick-ness, hcr, which changes with the radius (see Eq. 5), isrequired. To choose, sensitivity analysis is performed.The average radii observed in our hysteresis experi-ments mostly range between 5 ∗ 10−6 and 150 ∗ 10−6 mfor both blends, which, according to Eq. 5, lead tothe hcr values shown in Table 2. The variations of theaverage drop radius, predicted by the PM model (Eq. 4)using these hcr values, are small only, see Fig. 3, whichbasically allow us to use a constant, concentration-independent value of hcr for each of the two systems.We choose to use the values corresponding to theaverage radius of 50 ∗ 10−6 m to investigate the exis-tence and size of the hysteresis zone.
PB in PDMS
The average radii measured for the 10-wt.% PB inPDMS system, at increasing and decreasing shear rates,
Fig. 3 Influence of different radii and the corresponding hcr values (Eq. 5) on the average radii calculated with the PM model (Eq. 4)for the PB/PDMS system (left) and PBD/PDMS system (right)
348 Rheol Acta (2009) 48:343–358
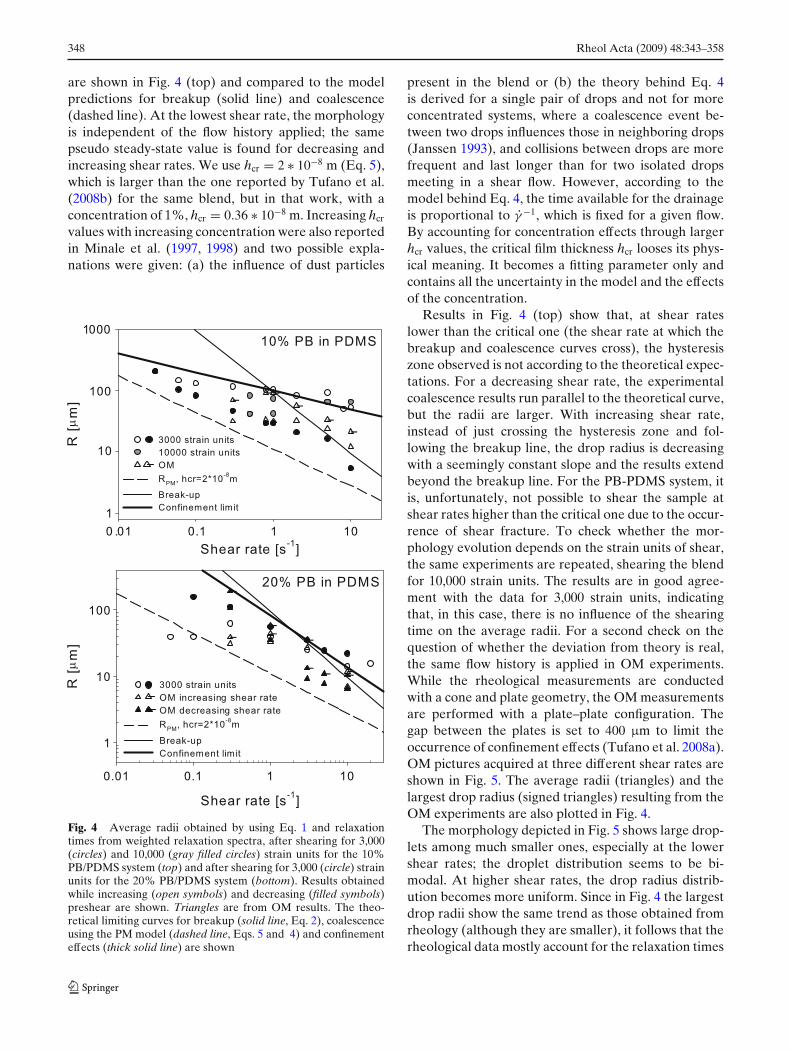
are shown in Fig. 4 (top) and compared to the modelpredictions for breakup (solid line) and coalescence(dashed line). At the lowest shear rate, the morphologyis independent of the flow history applied; the samepseudo steady-state value is found for decreasing andincreasing shear rates. We use hcr = 2 ∗ 10−8 m (Eq. 5),which is larger than the one reported by Tufano et al.(2008b) for the same blend, but in that work, with aconcentration of 1%, hcr = 0.36 ∗ 10−8 m. Increasing hcr
values with increasing concentration were also reportedin Minale et al. (1997, 1998) and two possible expla-nations were given: (a) the influence of dust particles
Fig. 4 Average radii obtained by using Eq. 1 and relaxationtimes from weighted relaxation spectra, after shearing for 3,000(circles) and 10,000 (gray filled circles) strain units for the 10%PB/PDMS system (top) and after shearing for 3,000 (circle) strainunits for the 20% PB/PDMS system (bottom). Results obtainedwhile increasing (open symbols) and decreasing (filled symbols)preshear are shown. Triangles are from OM results. The theo-retical limiting curves for breakup (solid line, Eq. 2), coalescenceusing the PM model (dashed line, Eqs. 5 and 4) and confinementeffects (thick solid line) are shown
present in the blend or (b) the theory behind Eq. 4is derived for a single pair of drops and not for moreconcentrated systems, where a coalescence event be-tween two drops influences those in neighboring drops(Janssen 1993), and collisions between drops are morefrequent and last longer than for two isolated dropsmeeting in a shear flow. However, according to themodel behind Eq. 4, the time available for the drainageis proportional to γ̇ −1, which is fixed for a given flow.By accounting for concentration effects through largerhcr values, the critical film thickness hcr looses its phys-ical meaning. It becomes a fitting parameter only andcontains all the uncertainty in the model and the effectsof the concentration.
Results in Fig. 4 (top) show that, at shear rateslower than the critical one (the shear rate at which thebreakup and coalescence curves cross), the hysteresiszone observed is not according to the theoretical expec-tations. For a decreasing shear rate, the experimentalcoalescence results run parallel to the theoretical curve,but the radii are larger. With increasing shear rate,instead of just crossing the hysteresis zone and fol-lowing the breakup line, the drop radius is decreasingwith a seemingly constant slope and the results extendbeyond the breakup line. For the PB-PDMS system, itis, unfortunately, not possible to shear the sample atshear rates higher than the critical one due to the occur-rence of shear fracture. To check whether the mor-phology evolution depends on the strain units of shear,the same experiments are repeated, shearing the blendfor 10,000 strain units. The results are in good agree-ment with the data for 3,000 strain units, indicatingthat, in this case, there is no influence of the shearingtime on the average radii. For a second check on thequestion of whether the deviation from theory is real,the same flow history is applied in OM experiments.While the rheological measurements are conductedwith a cone and plate geometry, the OM measurementsare performed with a plate–plate configuration. Thegap between the plates is set to 400 μm to limit theoccurrence of confinement effects (Tufano et al. 2008a).OM pictures acquired at three different shear rates areshown in Fig. 5. The average radii (triangles) and thelargest drop radius (signed triangles) resulting from theOM experiments are also plotted in Fig. 4.
The morphology depicted in Fig. 5 shows large drop-lets among much smaller ones, especially at the lowershear rates; the droplet distribution seems to be bi-modal. At higher shear rates, the drop radius distrib-ution becomes more uniform. Since in Fig. 4 the largestdrop radii show the same trend as those obtained fromrheology (although they are smaller), it follows that therheological data mostly account for the relaxation times

Rheol Acta (2009) 48:343–358 349
50 mµ 50 mµ50 mµ
Fig. 5 Morphology for the 10-wt.% PB in PDMS blend at shear rates 0.3, 0.8, and 5 s−1, increasing the shear rate
of the largest droplets, giving an estimated averageradius in the blend larger than the effective one.
The data for the 20% PB/PDMS blend are ratherscattered [see Fig. 4 (bottom)] and the results becomeeven more complicated for this higher concentration.A narrowing of the hysteresis zone is observed, inaccordance with Minale et al. (1998). The data forincreasing and decreasing shear rates almost coincide(within experimental error), i.e., the morphology seemsto become independent of the flow history. However,similar phenomena as for the 10% PB/PDMS blendare observed; drop radii are found that are above thebreakup line and large droplets, which will excessivelycontribute to the rheology (yielding an overestimationof the average radius), are also found with OM (Fig. 6).In contrast to a number of published results, we do notfind a good agreement between theory and average ra-dius from dynamic measurements. Although our resultsare somewhat scattered, trends are clear. In an attemptto interpret them, two effects are considered that mighthelp their explanation: (1) for partially immiscibleblends, coalescence is drastically increased (Zdravkovet al. 2006), which leads to large drops after a step-downin shear rate, (2) on the other hand, confinement of
flows can cause phenomena like droplet ordering, stringformation, etc. (Migler 2001; Pathak et al. 2002; Pathakand Migler 2003; Tufano et al. 2008a; Vananroyeet al. 2006). Large drops, as observed with OM, easierfeel the presence of walls. This influences, in a yetunpredictable manner, the rheological results. For acone-plate geometry, where the gap varies from zero tomaximum at the edge, part of the flow can be confined,e.g., in the area of flow where drops have the samecharacteristic size as the gap. The size of this confinedregion depends on both the blend system and the flowconditions. For a given shear rate, for the four blendsstudied, the degree of confinement Cd = 2R/H, with R,the drop radius, and H, the gap spacing between theparallel plates, at which wall effects are present, wasmeasured by Tufano et al. (2008a) for different shearrates applied. A power law relation follows:
Cd = Cd0γ̇−a (6)
Figure 7 shows the measured values of Cd for allfour blend systems combined with the correspondingfits, using Eq. 6, and the fit parameters Cd0 and a inTable 3. The values of the prefactor Cd0 are rather
Fig. 6 Morphology for the20-wt.% PB in PDMS blendat shear rates 1 and 0.3 s−1,decreasing the shear rate
100µm 200µm

350 Rheol Acta (2009) 48:343–358
Fig. 7 Critical degree of confinements vs shear rate. Experimen-tal results from Tufano et al. (2008a) (symbols) and fits usingEq. 6 (lines). The values for Cd0 and a are given in Table 3
close while the values of the exponent increase withviscosity ratio p and with concentration. It is temptingto (try to) create a master curve, but this is outside thescope of this work and more data are needed. For agiven drop size, we can deduce the sample volume thatis prone to confined flow. For a drop size of 100 μm,as found for the 10% PB/PDMS blend, confinementis expected up to half way the maximum cone radius(i.e., 25% of the sample area is confined or 10% of thetorque is affected). Using the half-way gap height andthe parameter sets of Table 3 and Eq. 6, we can drawconfinement lines R(γ̇ ) in Fig. 4 (and Fig. 8 in the nextsection for the PBD/PDMS blends). From these con-siderations, it seems reasonable to expect confinementeffects during the dynamic measurements on partiallyimmiscible polymers. Despite that, it is yet impossibleto predict what effects will occur since confinement leadsto complex, transient phenomena. While the build-uptime for confined dominated morphologies typicallytakes a period in the order of minutes, the stationarystate of morphology is often obtained only after a fewhours (Migler 2001; Pathak et al. 2002; Pathak andMigler 2003; Tufano et al. 2008a; Vananroye et al.2006). Therefore, the transient coalescence process gets
Table 3 Cd0 and a values from Eq. 6 for the four blendsinvestigated
Blend Cd0 a
10% PB/PDMS 0.5 0.320% PB/PDMS 0.41 0.7810% PBD/PDMS 0.5 0.3820% PBD/PDMS 0.45 1.1
Fig. 8 As Fig. 4, now for 10% (top) and 20% (bottom) PBD inPDMS systems
coupled with effects of transient confinement. Whenconfinement occurs, typically a mixture of standard andextended drops, or the opposite small drops, is formed,which causes an increased relaxation time (apparentlylarger drops) for the first case and a decreased relaxa-tion time (apparently smaller drops) for the secondcase. During dynamic measurements, part of the struc-tures extend to threads that subsequently breakup,leading to a bimodal distribution of drop size; the stan-dard drops and the new drops from thread breakup.However, the thread-like structures can also survive forlong periods of time, depending on the local degreeof confinement (Son et al. 2003). As an example, forthe 10% PB/PDMS blend, it is known that partialmiscibility is present between the phases that enhancesthe coalescence process dramatically (Zdravkov et al.2006); larger droplets are formed quicker, strengthen-ing the confinement. For the 20% PB/PDMS blend
Rheol Acta (2009) 48:343–358 351
200µm 200µm 200µm
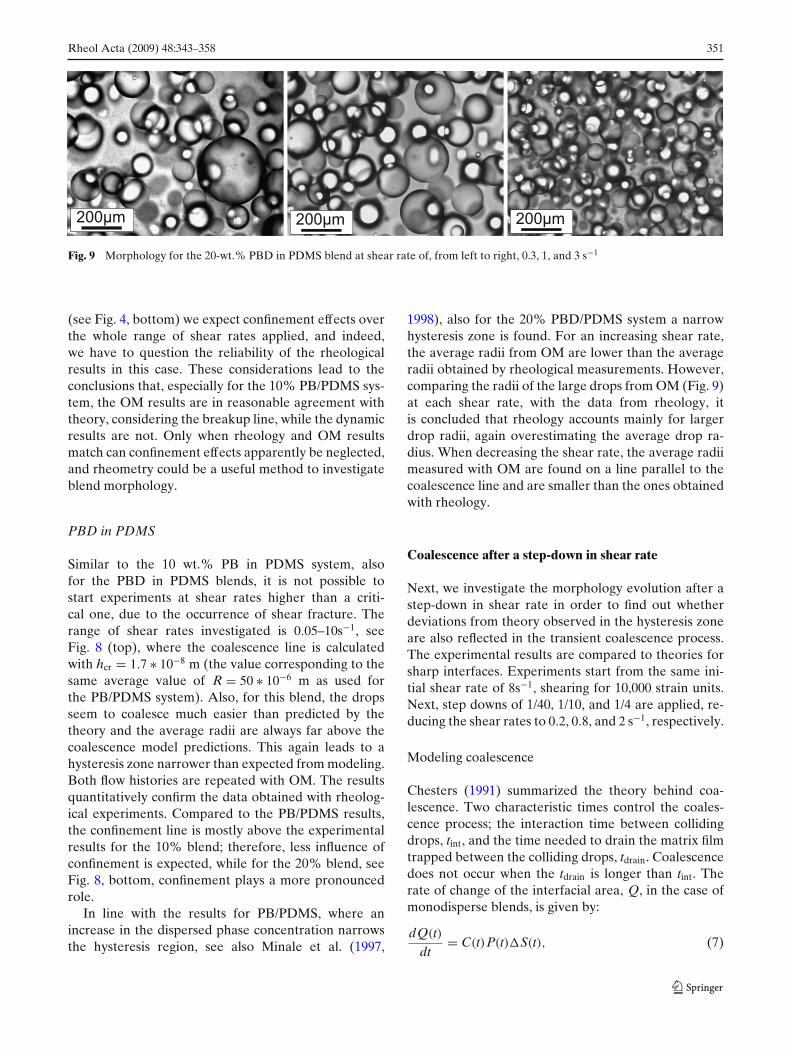
Fig. 9 Morphology for the 20-wt.% PBD in PDMS blend at shear rate of, from left to right, 0.3, 1, and 3 s−1
(see Fig. 4, bottom) we expect confinement effects overthe whole range of shear rates applied, and indeed,we have to question the reliability of the rheologicalresults in this case. These considerations lead to theconclusions that, especially for the 10% PB/PDMS sys-tem, the OM results are in reasonable agreement withtheory, considering the breakup line, while the dynamicresults are not. Only when rheology and OM resultsmatch can confinement effects apparently be neglected,and rheometry could be a useful method to investigateblend morphology.
PBD in PDMS
Similar to the 10 wt.% PB in PDMS system, alsofor the PBD in PDMS blends, it is not possible tostart experiments at shear rates higher than a criti-cal one, due to the occurrence of shear fracture. Therange of shear rates investigated is 0.05–10s−1, seeFig. 8 (top), where the coalescence line is calculatedwith hcr = 1.7 ∗ 10−8 m (the value corresponding to thesame average value of R = 50 ∗ 10−6 m as used forthe PB/PDMS system). Also, for this blend, the dropsseem to coalesce much easier than predicted by thetheory and the average radii are always far above thecoalescence model predictions. This again leads to ahysteresis zone narrower than expected from modeling.Both flow histories are repeated with OM. The resultsquantitatively confirm the data obtained with rheolog-ical experiments. Compared to the PB/PDMS results,the confinement line is mostly above the experimentalresults for the 10% blend; therefore, less influence ofconfinement is expected, while for the 20% blend, seeFig. 8, bottom, confinement plays a more pronouncedrole.
In line with the results for PB/PDMS, where anincrease in the dispersed phase concentration narrowsthe hysteresis region, see also Minale et al. (1997,
1998), also for the 20% PBD/PDMS system a narrowhysteresis zone is found. For an increasing shear rate,the average radii from OM are lower than the averageradii obtained by rheological measurements. However,comparing the radii of the large drops from OM (Fig. 9)at each shear rate, with the data from rheology, itis concluded that rheology accounts mainly for largerdrop radii, again overestimating the average drop ra-dius. When decreasing the shear rate, the average radiimeasured with OM are found on a line parallel to thecoalescence line and are smaller than the ones obtainedwith rheology.
Coalescence after a step-down in shear rate
Next, we investigate the morphology evolution after astep-down in shear rate in order to find out whetherdeviations from theory observed in the hysteresis zoneare also reflected in the transient coalescence process.The experimental results are compared to theories forsharp interfaces. Experiments start from the same ini-tial shear rate of 8s−1, shearing for 10,000 strain units.Next, step downs of 1/40, 1/10, and 1/4 are applied, re-ducing the shear rates to 0.2, 0.8, and 2 s−1, respectively.
Modeling coalescence
Chesters (1991) summarized the theory behind coa-lescence. Two characteristic times control the coales-cence process; the interaction time between collidingdrops, tint, and the time needed to drain the matrix filmtrapped between the colliding drops, tdrain. Coalescencedoes not occur when the tdrain is longer than tint. Therate of change of the interfacial area, Q, in the case ofmonodisperse blends, is given by:
dQ(t)dt
= C(t)P(t)S(t), (7)

352 Rheol Acta (2009) 48:343–358
where C(t) is the collision frequency per unit volume,P(t) is the fraction of collisions that leads to coales-cence, i.e., the coalescence probability, and S(t) is thevariation in the interfacial area associate to a singlecoalescence event. To find expressions for these terms,we follow Chesters (1991). First, it is assumed thatdroplets move affine with the macroscopic flow, yield-ing a collision frequency per unit volume expressed as(Von Smoluchowski 1917):
C(t) = 2
3γ̇ D(t)3n(t)2, (8)
where γ̇ is the shear rate, D(t) is the drop diameter,and n(t) is the number of drops per unit volume. In
Eq. 8, hydrodynamic interactions have been neglected;hence, it applies only to relatively dilute blends. Thecoalescence probability is given by:
P(t) = exp(
− tdrain
tint
), (9)
where tint is assumed proportional to γ̇ −1. Using anapproximation for tdrain in the case of a partially mobileinterface leads to [for more details on deriving thisexpression, see Janssen (1993)]:
P(t) � exp
[−0.0765
phcr
(ηmγ̇
σ
)3/2
D(t)5/2
](10)
Fig. 10 Influence of different radii, and the corresponding hcrvalues (Eq. 5) on the transient average radii calculated withthe PM model (Eq. 4) after step-down in shear rate of 1/40(solid line), 1/10 (dashed line), and 1/4 (dash-dotted line) for the
PB/PDMS system (top) and PBD/PDMS system (bottom) forconcentrations of 10 wt.% (left) and 20 wt.% (right). Symbols in-dicate the radius used to calculate hcr (Eq. 5), the correspondingvalues are reported in Table 2

Rheol Acta (2009) 48:343–358 353
Fig. 11 Storage modulus G′ (top figures) and weighted relaxa-tion spectra (bottom figures) after a step down of 1/40 at differentstrains. For convenience, the data have been split in two plots
(strain 2 to 200 on the left, 500 to 40,000 on the right), and inboth cases, the curves are shifted upwards with increasing strainunits
354 Rheol Acta (2009) 48:343–358
Substituting Eqs. 8 and 10 in Eq. 7 and expressingQ(t), S(t), and n(t) as functions of the volume frac-tion φ of the dispersed phase results in a differentialequation for the time evolution of the average dropletdiameter:
dD(t)dt
= 0.525φγ̇ D(t)exp[− (mD(t))5/2 γ̇ 3/2
], (11)
where m is defined as:
m = 0.358
(p
hcr
)2/5 (ηm
σ
)3/5(12)
To obtain the change in drop diameter as function ofthe shearing time, Eq. 11 is integrated:
∫ mγ̇ 3/5dt
mγ̇ 3/5d0
du(t)
0.525u(t)exp[−u(t)5/2
] = φγ̇ t, (13)
where
u(t) = mγ̇ 3/5 D(t) (14)
Equation 13 is used to predict the time evolution ofthe radii, the only unknown is hcr.
Coalescence results
The hcr values used to calculate the predictions of thePM model are chosen based on a sensitivity analysis;see Fig. 10. In the range of the average experimentalradii values (see next sections), the theoretical radiuspredicted with the PM model is not very sensitive tochanges in the value of hcr, except for the largest step-down in shear rate, see Fig. 10. However, we will useagain the hcr values corresponding to R = 50 ∗ 10−6 mas a first approximation.
PB in PDMS
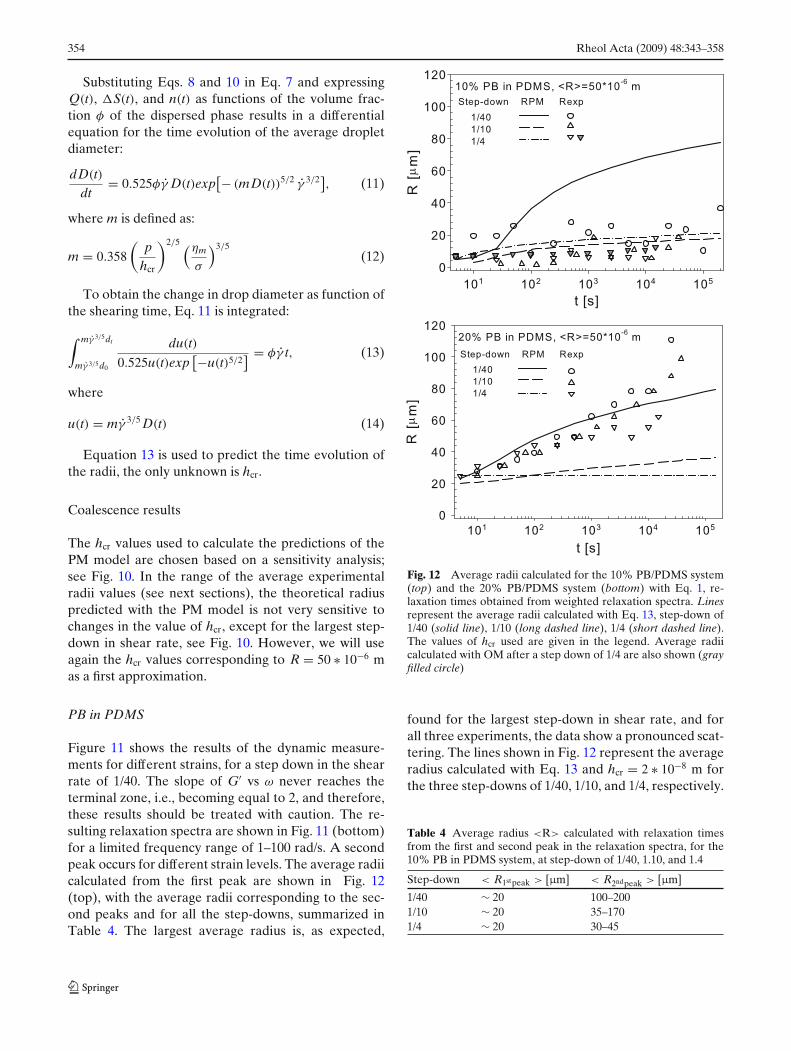
Figure 11 shows the results of the dynamic measure-ments for different strains, for a step down in the shearrate of 1/40. The slope of G′ vs ω never reaches theterminal zone, i.e., becoming equal to 2, and therefore,these results should be treated with caution. The re-sulting relaxation spectra are shown in Fig. 11 (bottom)for a limited frequency range of 1–100 rad/s. A secondpeak occurs for different strain levels. The average radiicalculated from the first peak are shown in Fig. 12(top), with the average radii corresponding to the sec-ond peaks and for all the step-downs, summarized inTable 4. The largest average radius is, as expected,
Fig. 12 Average radii calculated for the 10% PB/PDMS system(top) and the 20% PB/PDMS system (bottom) with Eq. 1, re-laxation times obtained from weighted relaxation spectra. Linesrepresent the average radii calculated with Eq. 13, step-down of1/40 (solid line), 1/10 (long dashed line), 1/4 (short dashed line).The values of hcr used are given in the legend. Average radiicalculated with OM after a step down of 1/4 are also shown (grayfilled circle)
found for the largest step-down in shear rate, and forall three experiments, the data show a pronounced scat-tering. The lines shown in Fig. 12 represent the averageradius calculated with Eq. 13 and hcr = 2 ∗ 10−8 m forthe three step-downs of 1/40, 1/10, and 1/4, respectively.
Table 4 Average radius <R> calculated with relaxation timesfrom the first and second peak in the relaxation spectra, for the10% PB in PDMS system, at step-down of 1/40, 1.10, and 1.4
Step-down < R1stpeak > [μm] < R2ndpeak > [μm]
1/40 ∼ 20 100–2001/10 ∼ 20 35–1701/4 ∼ 20 30–45

Rheol Acta (2009) 48:343–358 355
The values of < R > corresponding to the second peakcompare reasonably well with the size of the largerdroplets obtained from OM measurements for the sameblend; see Fig. 4. These coalescence results also indicatethe existence of a bimodal drop radius distribution.OM is carried out for the step down 1/4, showing asmoother trend of the average radii in time comparedto the rheological results, see Fig. 12 (top), and at strainunits above 5,000, few larger drops with radii in theorder of <R2ndpeak> are found in the majority of smallerdroplets.
Figure 13 shows the elastic modulus vs the frequency(left) and the weighted relaxation spectra (right) forthe 20% PB/PDMS system. For this blend, the terminalzone is reached, even at the lowest strain units.
In Fig. 12 (bottom), the average radii for the threedifferent step downs are compared with PM modelpredictions. In the first 1,000 s, the average radii seemto grow almost independently of the step down size. Atlonger times, the radii obtained with the larger step-down in shear rate (1/40 and 1/10) increase sharply,while for the step-down of 1/4, the growth of the av-erage radius slows down with increasing shearing time.The steep increase in drop radius is consistent with thehysteresis results, i.e., the large average drop sizes com-
pared to theoretical curves. The average radius seemsto approach a constant value that is in good agreementwith the average radius predicted at γ̇ = 2 s−1 by thecoalescence models.
PBD in PDMS
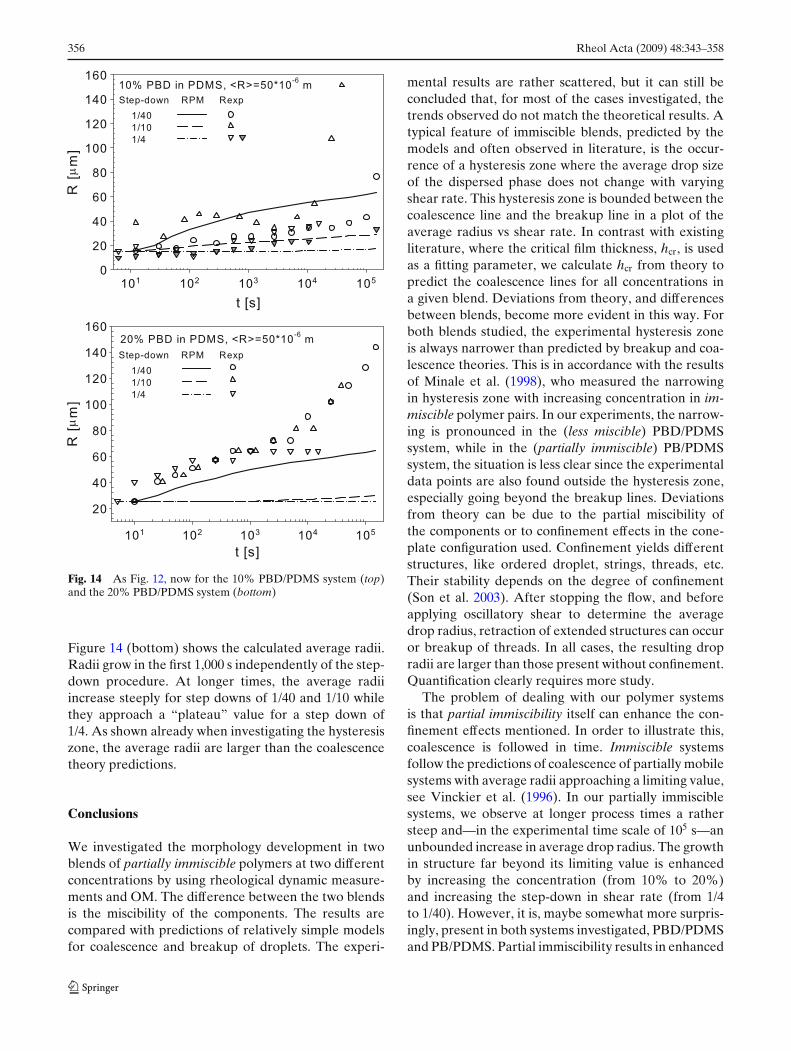
Also for the storage moduli measured after step downsof 1/40, 1/10, and 1/4 for the 10 wt.% PBD in PDMSblend, the terminal zone is never reached and a sec-ond peak occurs for all the strains (data not shownhere). Different from the 10% PB/PDMS system, thesecond peak occurs at relatively long periods of time,corresponding to large radii, which are unrealistic whencompared to the gap height of the cone-plate geometry.The average radii calculated from the first peak inrelaxation spectrum are shown in Fig. 14 (top). Forthe step-down of 1/10, the average radii at large strainsincrease quickly. The average radii obtained from OMwhen applying a step-down of 1/4 are also shown inFig. 14 (top) (filled triangle) and are in reasonableagreement with the rheological results.
For the 20-wt.% PBD in PDMS, the elastic modulusreaches the terminal zone for all three steps down.The relaxation spectra always show one peak only.
Fig. 13 G′ vs frequency (left) and weighted relaxation spectra (right) after a step down of 1/40 to a shear rate of 0.2 s−1
356 Rheol Acta (2009) 48:343–358
Fig. 14 As Fig. 12, now for the 10% PBD/PDMS system (top)and the 20% PBD/PDMS system (bottom)
Figure 14 (bottom) shows the calculated average radii.Radii grow in the first 1,000 s independently of the step-down procedure. At longer times, the average radiiincrease steeply for step downs of 1/40 and 1/10 whilethey approach a “plateau” value for a step down of1/4. As shown already when investigating the hysteresiszone, the average radii are larger than the coalescencetheory predictions.
Conclusions
We investigated the morphology development in twoblends of partially immiscible polymers at two differentconcentrations by using rheological dynamic measure-ments and OM. The difference between the two blendsis the miscibility of the components. The results arecompared with predictions of relatively simple modelsfor coalescence and breakup of droplets. The experi-
mental results are rather scattered, but it can still beconcluded that, for most of the cases investigated, thetrends observed do not match the theoretical results. Atypical feature of immiscible blends, predicted by themodels and often observed in literature, is the occur-rence of a hysteresis zone where the average drop sizeof the dispersed phase does not change with varyingshear rate. This hysteresis zone is bounded between thecoalescence line and the breakup line in a plot of theaverage radius vs shear rate. In contrast with existingliterature, where the critical film thickness, hcr, is usedas a fitting parameter, we calculate hcr from theory topredict the coalescence lines for all concentrations ina given blend. Deviations from theory, and differencesbetween blends, become more evident in this way. Forboth blends studied, the experimental hysteresis zoneis always narrower than predicted by breakup and coa-lescence theories. This is in accordance with the resultsof Minale et al. (1998), who measured the narrowingin hysteresis zone with increasing concentration in im-miscible polymer pairs. In our experiments, the narrow-ing is pronounced in the (less miscible) PBD/PDMSsystem, while in the (partially immiscible) PB/PDMSsystem, the situation is less clear since the experimentaldata points are also found outside the hysteresis zone,especially going beyond the breakup lines. Deviationsfrom theory can be due to the partial miscibility ofthe components or to confinement effects in the cone-plate configuration used. Confinement yields differentstructures, like ordered droplet, strings, threads, etc.Their stability depends on the degree of confinement(Son et al. 2003). After stopping the flow, and beforeapplying oscillatory shear to determine the averagedrop radius, retraction of extended structures can occuror breakup of threads. In all cases, the resulting dropradii are larger than those present without confinement.Quantification clearly requires more study.
The problem of dealing with our polymer systemsis that partial immiscibility itself can enhance the con-finement effects mentioned. In order to illustrate this,coalescence is followed in time. Immiscible systemsfollow the predictions of coalescence of partially mobilesystems with average radii approaching a limiting value,see Vinckier et al. (1996). In our partially immisciblesystems, we observe at longer process times a rathersteep and—in the experimental time scale of 105 s—anunbounded increase in average drop radius. The growthin structure far beyond its limiting value is enhancedby increasing the concentration (from 10% to 20%)and increasing the step-down in shear rate (from 1/4to 1/40). However, it is, maybe somewhat more surpris-ingly, present in both systems investigated, PBD/PDMSand PB/PDMS. Partial immiscibility results in enhanced
Rheol Acta (2009) 48:343–358 357
dynamic coalescence, yielding larger drops that feelconfinement earlier in time. Confinement effects couldexplain the quasi-unlimited growth in drop size mea-sured after stopping the flow. Confinement effects, andthe critical shear rate at which they occur, strongly de-pend on the viscosity of the components and the viscos-ity ratio. This could explain the unexpected differencesfound between the less miscible (PBD/PDMS) andthe partially immiscible (PB/PDMS) systems. Clearly,to interpret data on morphology development in par-tially immiscible polymers from dynamic rheologicalmeasurements, applying a cone-plate geometry, shouldbe used with caution. More quantitative studies, e.g.using combined rheological and optical experimentsor applying, e.g., advanced diffuse interface modeling,that can deal with concentrated two-phase flows, shouldconclude whether the rheological experimental tech-nique used could be a reliable one to approach thisproblem or whether it should be abandoned.
Open Access This article is distributed under the terms of theCreative Commons Attribution Noncommercial License whichpermits any noncommercial use, distribution, and reproductionin any medium, provided the original author(s) and source arecredited.
References
Anderson D, McFadden G, Wheeler A (1998) Diffuse-interfacemethods in fluid mechanics. Annu Rev Fluid Mech 30:139–165
Bruijn RD (1989) Deformation and break-up of drops in simpleshear flows. Technical University of Eindhoven, Eindhoven
Cahn J, Hilliard J (1958) Free energy of a nonuniform system. I.Interfacial free energy. J Chem Phys 28(2):258–267
Cahn J, Hilliard J (1965) Phase separation by spinodal decompo-sition in isotropic systems. J Chem Phys 42:93–99
Chesters A (1991) The modelling of coalescence processes influid-liquid dispersions. Trans IChemE 69A:259–281
Elmendorp J (1986) A study on polymer blending microrheology.Technical University of Delft, Delft
Elmendorp J, van der Vegt A (1986) A study on polymer blend-ing micro-rheology: part IV. The influence of coalescence onblend morphology origination. Polym Eng Sci 26:1332–1338
Fortelny I, Kovar J (1988) Theory of coalescence in immisciblepolymer blends. Polym Compos 9:119–124
Grace H (1982) Dispersion phenomena in high viscosity immis-cible fluid systems and application of static mixers as dis-persion devices in such systems. Chem Eng Commun 14:225–277
Graebling D, Gallot ABY, Muller R (1994) Dynamic viscoelas-tic behaviour of polymer blends in the melt: experimen-tal results for PDMS/POE-DO, PS/PMMA and PS/PEMAblends. Eur Pol J 30(3):301–308
Graebling D, Muller R, Palierne J (1993) Linear viscoelasticbehaviour of some incompatible polymer blends in melt.Interpretation of data with a model of emulsion of viscoelas-tic liquids. Macromolecules 26:320–329
Gramespacher H, Meissner J (1992) Interfacial tension betweenpolymer melts measured by shear oscillations of their blends.Rheol Acta 36:1127–1141
Grizzuti N, Bifulco O (1997) Effects of coalescence and breakupon the steady-state morphology of an immiscible polymerblend in shear flow. Rheol Acta 36:406–415
Grmela M, Bousmina M, Palierne J (2001) On the rheology ofimmiscible blends. Rheol Acta 40(6):560–569
Honerkamp J, Weese J (1993) A nonlinear regularization methodfor the calculation of relaxation spectra. Rheol Acta 32:65–73
Jackson N, Tucker C (2003) A model for large deformation ofan ellipsoidal droplet with interfacial tension. J Rheol 47:659–682
Janssen J (1993) Dynamics of liquid-liquid mixing. TechnicalUniversity of Eindhoven, Eindhoven
Janssen J, Meijer H (1995) Dynamics of liquid-liquid mixing: atwo zone model. Polym Eng Sci 35:1766–1780
Mackay G, Mason S (1963) The gravity approach and coales-cence of fluid drops at liquid interfaces. J Chem Eng 41:203–212
Migler K (2001) String formation in sheared polymer blends:coalescence, breakup, and finite size effect. Phys Rev Lett86:1023–1026
Minale M, Mewis J, Moldenaers P (1998) Study of the morpho-logical hysteresis in immiscible polymer blends. AIChE J44:943–950
Minale M, Moldenaers P, Mewis J (1997) Effect of shear his-tory on the morphology of immiscible polymer blends.Macromolecules 30:5470–5475
Palierne J (1990) Linear rheology of viscoelastic emulsions withinterfacial tension. Rheol Acta 29:204–214
Pathak J, Migler K (2003) Droplet-string deformation and stabil-ity during microconfined shear flow. Langmuir 19:8667–8674
Pathak J, Davis M, Hudson S, Migler K (2002) Layered dropletmicrostructures in sheared emulsions: finite-size effects.J Colloid Interface Sci 255:391–402
Rusu D, Peuvrel-Disdier E (1999) In-situ characterization bysmall angle light scattering of the shear-induced coalescencemechanisms in immiscible polymer blends. J Rheol 43:1391–1409
Son Y, Martys N, Hagedorn J, Migler K (2003) Suppression ofcapillary instability of a polymeric thread via parallel plateconfinement. Macromolecules 36:5825–5833
Takahashi Y, Kurashima N, Noda I (1994) Experimental tests ofthe scaling relation for textured materials in mixtures of twoimmiscible fluids. J Rheol 38:699–712
Taylor G (1932) The viscosity of a fluid containing small drop ofanother fluid. Proc R Soc Lond A 138:41–48
Tufano C, Peters G, Meijer H (2008a) Confined flow of polymerblends. Langmuir 24(9):4494–4505
Tufano C, Peters G, Anderson P, Meijer H (2008b) Transientinterfacial tension of partially miscible polymers. J ColloidInterface Sci 325(1):130–140
Vananroye A, Puyvelde PV, Moldenaers P (2006) Structure de-velopment in confined polymer blends: steady-state shearflow and relaxation. Langmuir 22:2273–2280
Verdier C, Brizard M (2002) Understanding droplet coales-cence and its use to estimate interfacial tension. Rheol Acta43:514–523
Vinckier I, Moldenaers P, Mewis J (1996) Relationship betweenrheology and morphology of model blends in steady shearflow. J Rheol 40:613–631
Vinckier I, Moldenaers P, Terracciano A, Grizzuti N (1998)Droplet size evolution during coalescence in semiconcen-trated model blends. AIChE J 44:951–958

358 Rheol Acta (2009) 48:343–358
Von Smoluchowski M (1917) Versuch einer mathematischentheorie der koagulationskinetik kolloider Lösungen. PhysChem 92:129–168
Yu W, Zhou C, Bousmina M (2005) Theory of morphology evo-lution in mixtures of viscoelastic immiscible components.J Rheol 49:215–236
Yu W, Bousmina M, Grmela M, Palierne J, Zhou C (2002) Quan-titative relationship between rheology and morphology inemulsions. J Rheol 46:1381–1399
Zdravkov A, Peters G, Meijer H (2006) Film drainage and inter-facial instabilities in polymeric systems with diffuse inter-faces. J Colloid Interface Sci 296:86–94
Copyright © 2022 FDOKUMEN