Influence of Rock and Fluid Properties on Immiscible Fluid ...
11
PETROLEUM BRANCH, AIME Fidelity Union Bu11ding Dallas, Texas PAPER NUMBER 510-6 THIS IS A PREPRINT --- SUBJECT TO CORRECTION Influence of Rock and Fluid Properties On Immiscible Fluid-Flow Behavior In Porous Media By 1h. Merliss, Junior Member AIME, il.!..1h. Doane and 1h. Member AIME, Cities Service Research and Development Co., Tulsa, Okla. Publication Rights Reserved This paper is to be presented at the 30th Annual Fall Meeting of the Petroleum Branch of the American Institute of Mining and Metallurgical Engineers in New Orleans, October 2-5, 1955, and is considered the property of the Petroleum Branch. Permission to publish is hereby restricted to an abstract of not more than 300 words, with no illustrations, unless the paper is specifically released to the press by the Branch Publications Committee Chairman or the Executive Secretary on his behalf. Such abstract should contain appropriate, conspicuous acknowledgments. Publication elsewhere after publication in Journal of Petroleum Technology is granted on request, providing proper credit is given that publication and the original pres- entation of the paper. Discussion of this paper is invited. Branch it will be presented at the Journal of Petroleum Technology. Three copies of any discussion should be sent to the Petroleum above meeting with the paper and considered for publication in ABSTRACT An investigation of immiscible flow behavior in porous material as affected by fluid properties and the solid mater1al characteristics has been made on consolidated and unconsolidated sands. Production mechanisms analyzed were external gas and water drives and solution gas ctrives. Flow- ing pressures up to 1,500 psi were used. The work indicates that variations exist in the flow behavior of such systems; and that relative permeabilities and relative permeability ratios are functions not only of fluid saturations, saturation histories, and the porous material geometry, but also fluid proper- ties and solid material characteristics. An approximate method of determination of rela tive permeabl1ities from external drive experimental data has been derived to correlate the variations encountered in flow behavior. It is based on ViSCOUf flow theory and allows the mathematical determinatior of a pressure profile [for don stant pressure differ- ential or constant flow rate experiments] for extern al gas and water drive systems. Any desired static pressure may be used in the exper1.ment. Porosities and permeabilities were studied by choosing models with a wide range of characteristics. The consolidated sands had porosities from 13 to 21 References and illustrations at end of paper per cent, while for the unconsolidated sand the porosity was from 34 to 39 per cent. Permeability ranges varied from 1.5 to 300 md for consolidated material, and 7 to 20 darcies for the unconsolidated material. The models used varied in length from 16 cm to 77 1/2 cm, with diameters from 2.54 om to 5.08 cm. The unconsolidated sand was treated with a silicone material to make it oil-wet for the water drive experiments. In the gas drive experiments on these treated sands, the silicone material effective- ly increased the oil-solid adhesion tension. Capillary phenomena were investigated to deter- mine their effect on flow behavior in various wetta- bili ty systems. INTRODUCTION The amount of oil that can be recovered eco- nomically from a reservoir is dependent upon the fluid-flow relationships which exist for that partic- ular reservoir. Laboratory experiments are performed to arrive at relative permeability relationships which are used to make predictions of recoveries fr)m reservoirs. Effective use of relative permeability characteristics requires knowledge of what they are and what affects them. If the properties of the fluids affect the production characteristics of laboratory models, then these same properties would affect the producing reservoir, and should be taken Downloaded from http://onepetro.org/SPEATCE/proceedings-pdf/55FM/All-55FM/SPE-510-G/2085821/spe-510-g.pdf by guest on 27 March 2022
-
Upload
khangminh22 -
Category
Documents
-
view
0 -
download
0
Transcript of Influence of Rock and Fluid Properties on Immiscible Fluid ...

PETROLEUM BRANCH, AIME Fidelity Union Bu11ding Dallas, Texas
PAPER NUMBER 510-6
THIS IS A PREPRINT --- SUBJECT TO CORRECTION
Influence of Rock and Fluid Properties On Immiscible Fluid-Flow Behavior
In Porous Media By
~ 1h. Merliss, Junior Member AIME, il.!..1h. Doane and 1h. il.!..~, Member AIME, Cities Service Research and Development Co., Tulsa, Okla.
Publication Rights Reserved
This paper is to be presented at the 30th Annual Fall Meeting of the Petroleum Branch of the American Institute of Mining and Metallurgical Engineers in New Orleans, October 2-5, 1955, and is considered the property of the Petroleum Branch. Permission to publish is hereby restricted to an abstract of not more than 300 words, with no illustrations, unless the paper is specifically released to the press by the Branch Publications Committee Chairman or the Executive Secretary on his behalf. Such abstract should contain appropriate, conspicuous acknowledgments. Publication elsewhere after publication in Journal of Petroleum Technology is granted on request, providing proper credit is given that publication and the original presentation of the paper.
Discussion of this paper is invited. Branch office~ it will be presented at the Journal of Petroleum Technology.
Three copies of any discussion should be sent to the Petroleum above meeting with the paper and considered for publication in
ABSTRACT
An investigation of immiscible flow behavior in porous material as affected by fluid properties and the solid mater1al characteristics has been made on consolidated and unconsolidated sands.
Production mechanisms analyzed were external gas and water drives and solution gas ctrives. Flowing pressures up to 1,500 psi were used. The work indicates that variations exist in the flow behavior of such systems; and that relative permeabilities and relative permeability ratios are functions not only of fluid saturations, saturation histories, and the porous material geometry, but also fluid properties and solid material characteristics.
An approximate method of determination of rela tive permeabl1ities from external drive experimental data has been derived to correlate the variations encountered in flow behavior. It is based on ViSCOUf flow theory and allows the mathematical determinatior of a pressure profile [for don stant pressure differential or constant flow rate experiments] for extern al gas and water drive systems. Any desired static pressure may be used in the exper1.ment.
Porosities and permeabilities were studied by choosing models with a wide range of characteristics. The consolidated sands had porosities from 13 to 21
References and illustrations at end of paper
per cent, while for the unconsolidated sand the porosity was from 34 to 39 per cent. Permeability ranges varied from 1.5 to 300 md for consolidated material, and 7 to 20 darcies for the unconsolidated material. The models used varied in length from 16 cm to 77 1/2 cm, with diameters from 2.54 om to 5.08 cm.
The unconsolidated sand was treated with a silicone material to make it oil-wet for the water drive experiments. In the gas drive experiments on these treated sands, the silicone material effectively increased the oil-solid adhesion tension.
Capillary phenomena were investigated to determine their effect on flow behavior in various wettabili ty systems.
INTRODUCTION
The amount of oil that can be recovered economically from a reservoir is dependent upon the fluid-flow relationships which exist for that particular reservoir. Laboratory experiments are performed to arrive at relative permeability relationships which are used to make predictions of recoveries fr)m reservoirs. Effective use of relative permeability characteristics requires knowledge of what they are and what affects them. If the properties of the fluids affect the production characteristics of laboratory models, then these same properties would affect the producing reservoir, and should be taken
Dow
nloaded from http://onepetro.org/SPEATC
E/proceedings-pdf/55FM/All-55FM
/SPE-510-G/2085821/spe-510-g.pdf by guest on 27 M
arch 2022

2 INFLUENCE OF ROCK AND FLUID PROPERTIES ON IMMISCIBLE FLUID-FLOW BEHAVIOR IN POROUS MEDIA 510-G
into account .in any predictions relative to the ultimate recovery of oil from a reservoir.
The experimental work described in this paper was undertaken to find the relationship between porous material geometry, fluid properties, and relative permeability. This information would be useful in any sphere of activity requiring knowledge of fluid-flow characteristics, such as ultimate recoveries, timing and type of secondary recovery operations. etc.
and Leverett does not depend upon the unique function of fD vs SD' but only on a systematic change of fD with SD that is experimentally reproducible for a given set of conditions. This implies that neither fD nor SD are functions of a time variable.
Further, the work of Leverett and Lewis7 in three-phase flow shows a wide variation in gas permeability with saturation. The variation is as much as 15 per cent saturation-wise for a given kg/k, or as much as a factor of 10 in kglk at a constant gas saturation. This is true through the entire range of gas saturations studied and not in the early history only. Since this is for a steady flow condition, and gas is never. considered to be a wetting phase, it should, according to all relative permeability theory, be a unique relationship. This is indicative that the rock geometry is not ·the only important role in relative permeability relationships, and that relative permeability is not a unique function of fluid saturation.
It is the purpose of this paper to illustrate some of the variations that exist in flow behavior in fluid-flow experiments using fluids of widely varying physical properties. .In no case are fluids used: which interact with the porous material to the extent of changing the flow geometry of the system.
Experimental work on production problems can best be done in the laboratory with ideal systems. The ultimate goal is knowledge of actual flow mechanisms and properties of the system which would take into account changes in flow characteristics due to geometry differences between the laboratory model and the producing reservoir.
Research work described in this paper is limited to fundamental studies of the flow relationships of laboratory fluids and homogeneous rocks rather than reservoir fluids and reservoir rocks which are quite different in nature.
An independence of flow relationships on fluid properties would yield identical results to relative permeabilities and relative permeability ratios. Therefore, in a study of fluid-flow characteristics through porous media, one of the first points which is examined is the effect of fluid properties on relative permeabilities and relative permeability ratios.
On the basis of theories of relative permeability, fluid properties have no effect on the flow characteristics after the stabilized prOduction from the laboratory model is completed, while previous to the passing of this production p~riod the production characteristics a·re a functIon of the how -rate, interfacial tension between the fluids, and the porous material characteristics such as relative permeability and the capillary pressure gradient. At all stages of depletion of the laboratory model, sufficiently high pressure gradients must be maintained to eliminate the variations in flow characteristics that are caused by capillary forces. l ,2,3,4,5
In the work of Buckley and Leverett6 it is stated that fD for a given s~nd and fluids varies only slightly with factors othe~ than SD in the absence of capillary and gravitational effects. If the factor fD is not a unique function of SD' the predicted saturation profile will be different for each set of fD values. The small differences in fD at a constant SD must be caused by some property of the system.
The frontal advance formula derived by Buckley
When different experimental conditions are applied to a system, the frontal advance equation can be used to determine a saturation profile for each set of conditions that is imposed on the system. A comparison can be made between the experiments at a given saturation to either phase in a two-phase system.
The experimental work done here was to study the variables in the system which would be affected by pressure. Differe~t gases and oils were used to cover a considerable range of properties. Each of the gases was selected for a property which it would exhibit in the system. For purposes of this work thE ultimate economic recovery is based on a relative permeability ratio of one.
STATEMENT OF THEORY
Since so many variations were observed in the relative permeability ratios with changi~g conditions an approximate method of calculation of relative permeabilities, ke!k, from external drive experimental data was derived. It is used to correlate the results from one experiment to another to find the variations that exist for either flowing phase in the experiments. This method is based on the theory of viscous· flow, and its derivation is as follows:
In a perfectly homogeneous porous material, I all of the pore sizes are the same and the fluid
carrying capacity of each pore is the same. The absolute fluid velocity at a point in the system is a function of the saturation and the pressure gradient at that point. For any given conditions the relative permeability ratio will be a function of saturation, and a plot of injected fluid volumes vs saturation will be unique. In other words, saturation at a point will be a function of the volume of fluid which has been injected. The basis for this is the integrated form of the ~everett and Buckley equation as presented by Welge. The integrated expression relates the producing saturation to the average saturation during an external drive experiment.
Dow
nloaded from http://onepetro.org/SPEATC
E/proceedings-pdf/55FM/All-55FM
/SPE-510-G/2085821/spe-510-g.pdf by guest on 27 M
arch 2022

510-G F. E. MERLISS J. D. DOANE AND M. J. RZASA ,
Using the plot of injected fluid volumes as a If a constant 'length AL is used in Equation 8 it function of saturation and the frontal advance form- reduces to ula, a saturation profile can be determined for the system. From the production data the instantaneous flow rate and pressure differential across the system will be determined, Using this flow rate and the fractional flow formula, the flow rate profile for either phase can be determined as a function of the saturation profile.
If the system is operated under constant differential pressure conditions, a plot of cumulative produced fluid vs time can be used to obtain the instantaneous flow rate as
d [cumulative fluidj _ Flow Rate = q d [time] t
., .. ,. [1]
Since the fractional flow formula yields a value of fD vs saturation, the flOW rate of either component can be calculated at a point by
• , • [2]
Then the absolute velocity of this component is
qD t
v • -S A'" ["'] D ~ , • . J
When fluids flow in a tube of circular crosssection and the conditions are such that the flow is viscous, it has been shown experimentally and theoretically that this flow takes place according to the Hagen Poiseuille equation. This is:
or
32 L v f.L AP = gD2 • • • [4]
• , • [5]
In viscous flow for a homogeneous system, the absolute velocity divided by the pressure, gradient is a constant, or for the point velocities in the porous material
v, [-dP"",,,/r"'-dL-=]-3 - ..... = [dP/dL]n
• • • [6]
From the saturation profile a length, AL, is chosen such that the saturation gradient along this length is constant. This means that the saturation profile approaches a straight line over this length. The saturation which is representative can be shown to be the average saturation over the length AL. Then for this condition
AP AL =
dP dL • • • [7]
and substituting in Equation 6 for ~ we arrive at dL
[AP/AL]3 = ..... = [AP/AL]
• • • [8]
n
vI v2 v3 [AP]l = [AP] 2 = [APl 3
:
or vn AP - APl [vl) n - ••• [10]
Since i = n
£. [AP] = AP = P - Pd n u • • • [ll]
i = n
then ,by substituting the equivalent of [AP]n from Equation 10 we obtain
i = n i = n
1- [APh ::n = APl t-. v l i = 0 ••• I12] i = 0
For a system which is operated at a constant pressure differential, the inlet and outlet pressures can be measured directly and the cumUlative production must be plotted as a function of time to determine the instantaneous flow rate. When the system is operated at constant flow rate, the inlet and outlet pressures must be measured as a function of time to determine the correct pressure differential to be used in Equation 12. When the proper pressure differential is equated to Equation 12 for the same time at ,which qt was evaluated, Equation 12 becomes a Single equation with only one unknown, AP1, which can be solved •. Using APl and the absolute velocity ratios over each AL, the AP for that segment can be evaluated. Using the AP of each segment of length and the non-wetting phase flow rate for that segment of length as predicted by the flow ,rate profile, Darcy's law will yield the value of relative permeability of the non-wetting phase if the specific permeability is known.
For the wetting phase relative permeability, it is necessary to use a capillary pressure curve to determine a pressure profile from the n6n-wetting phase pressure profile. The pressure profile for a non-wetting phase is obtained using the following equation:
Pn = Pd + API'" AP2 T AP3+...... APn _l ••• [13]
and the pressure profile for a wetting phase is determined using
Pn = Pn [non-wetting] - Pc [Sn] ••• [14]
Then AP'S for the wetting phase can be determined over the same lengths that were used for ~he nonwetting phase and thus the relative permeability of the wetting phase can be determ,ined by Darcy's law.
This method of calculation has been used to find the magnitude of the changes in the relative permeabilities as pr~sented in this paper.
In an actual system the pore sizes are not the same and the fluid carrying capacity of the pores varies as the square of the diameter of the pores. The method used above can be extended to cover a
Dow
nloaded from http://onepetro.org/SPEATC
E/proceedings-pdf/55FM/All-55FM
/SPE-510-G/2085821/spe-510-g.pdf by guest on 27 M
arch 2022

4 INFLUENCE OF ROCK AND FLUID PROPERTIES ON IMMISCIBLE FLUID~FLOW BEHAVIOR IN POROUS MEDIA 510-G
real system, but the procedure is too complex for presentation here.
EXPERIMENTAL PROCEDURE AND MATERIALS
PROCEDURE
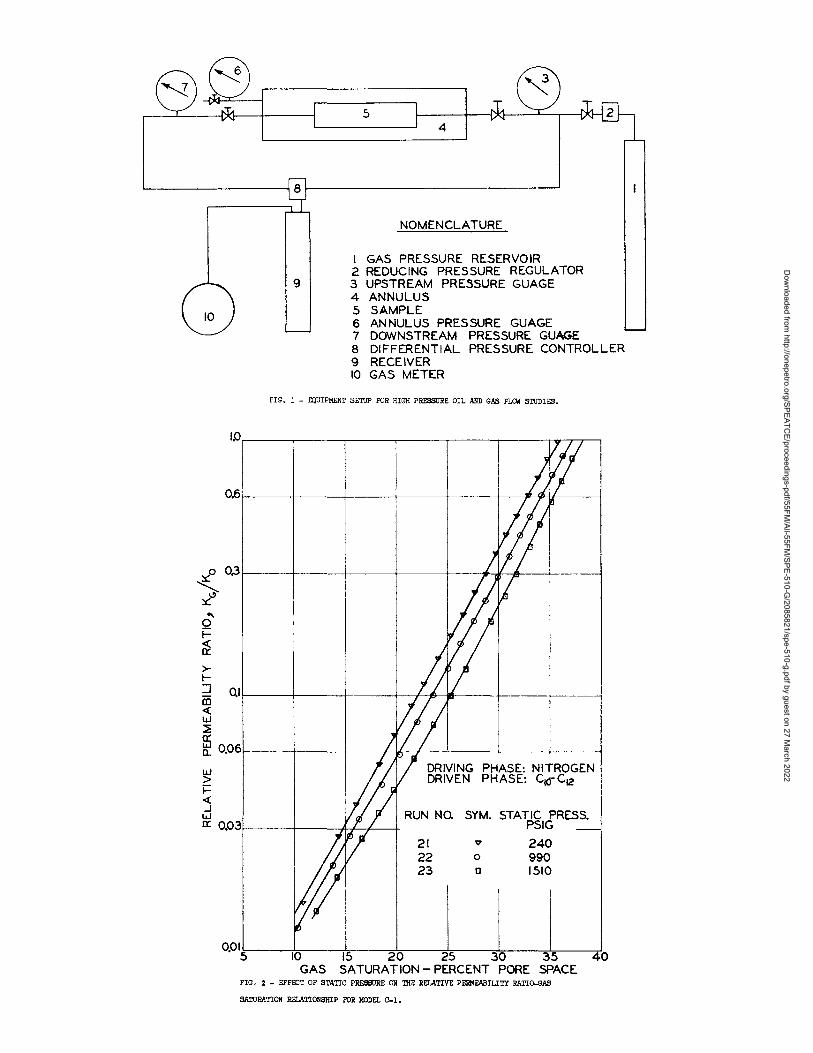
A schematic diagram of the equipment setup which is used for flow experiments is shown in Fig. 1.
The operating procedure is as follows:
A mounted model is placed in a high pressure cell and pressure is applied to the outer extremities of the Lucite mounting inside the steel shell. This allows flow studies to be made at higher pressure than could be maintained within the Lucite mounting itself. The model is evacuated and weighed Oil is then flowed through the model at a high pressure until the model is saturated. A new weight is taken to determine the amount of fluid within the model. This is done on a high capacity, high sensitivity balance. The core is now ready for flow tests.
For external drive experiments an upstream gas pressure is set and controlled from a gas bottle using a reducing pressure regulator. The gas is admitted directly to the system for external gas drives, and for water drives it is applied to_a high pressure reservoir to drive the water at a given pre~sure. A differential pressure across the system is set using a differential pressure controller. The outlet of the system is connected to a receiving system which consists of a wet test meter and liquid reservoir for gas drives, or a reservoir which can be accurately read for water drives while it is maintained at a constant pressure. The gas and oil, or water and oil production and time are measured simultaneously. These data are plotted and instantaneous producing" ratios are calculated by measuring the slopes of the cumulative production curve. From the instantaneous gas-oil or water-oil ratios, producing characteristics ~f the system can be calculated.
Systems operated at constant pressure and constant pressure differential require only a periodic check of the pressure system. Those operated at constant rate require a pressure reading at the same time that the production data are read.
For solution gas drives, the upstream volume of the system is nUlled using an incompressible fluid to actuate the differential pressure controller. The data are taken and plotted in the same manner as for external drives and the calculations of the producing characteristics are made using the production data.
MATERIALS
The porous materials used in the tests were from outcrops, ordinary surface rocks, and unconsolidated sands. The rocks were Torpedo, Big Heart, and Nellie Bly. The sand used was Ottawa Silica sand. The sand mesh was 50-70 and 80-120.
The unconsolidated sand was treated with silicone materials to increase the solid-oil adhesion tension. The degree-of change of this value was dependent upon the amount of silicone that was contacted by the sand.
Table"l is a resume of the characteristics of the models used which cover a wide range of porosities, permeabilities, and sample dimensions.
After the raw material for a model was selected, several preliminary tests were made. These consisted of a "capillary pressure experiment to deter~ mille the homogeneity of the model and a gas porosity measurement. Both liquid and gas permeabilities were determined. Upon completion of the preliminary experiments the moqels were mounted in Lucite.
The fluids used in this investigation were rela ti vely pure straight-chain hydrocarbon cuts [on"e consisting mainly of the CIO-C12 fraction], methane, carbon dioXide, nitrogen, helium, and air.
Although these gases are not always found in reservoirs, they were selected for laboratory experiments to cover the range of gas properties that may be encountered and which would have to be considered in any complete study of fluid-flow relation ships.
EXPERIMENTAL RESULTS AND DISCUSSION
Flow studies were made on consolidated sandstones cut from out~rops. The characteristics of the models and the number of experiments performed on each is given in Table 1. Results of external gas drives performed on model C-l at 240 psig, 990 pSig, and 1,510 psig with a 20 psi differential pressure across the system are shown in Fig. 2. These results are reproducible to within 1/2 of 1 per cent on the saturation scale.
A stepwise change is noted on the plots as the flowing pressure in the system is increased. Other runs made at intermediate pressures fall in line with the results shown.
The significance of these changes becomes more apparent when the results are plotted as shown in Fig. 3, which shows the amount of gas which must be injected to recover a given amount of oil f.rom the system under full pressure maintenance conditions. "An example of the use of Fig. 3 is as follows: to recover 50,000,000 bbl of oil from a formation originally containing 125,000,000 bbl of oil would require the injection of 2,244,000,000 cu ft of gas at the original reservoir pressure of 240 psig;" 1,753,000,000 cu ft of gas at the original reservoir pressure 990 psig; or only 1,332,000,000 cu ft of gas at the original reservoir pressure of 1,510 psig. This is for full pressure maintenance with the final saturation being the same in all cases.
The assumptions made to get these results were: [1] the viscosity and shrinkage of "the oil is the same in all cases~ and [2] the reservoir rock is the same in all cases.
Dow
nloaded from http://onepetro.org/SPEATC
E/proceedings-pdf/55FM/All-55FM
/SPE-510-G/2085821/spe-510-g.pdf by guest on 27 M
arch 2022

510-0 F. E. MERLISS, J. D. DOANE, AND M. J. RZASA 5 The variation in relative permeability at any
fixed saturation or the variation of saturation at any fixed relative permeability is a significant amount. The early history is discounted somewhat to take into account the passage of the stabilized done. The calculations of the stabilized zone indicate it can be contained in the model and that all results obtained after a depletion of the oil in the system to approximately 20 per cent producing gas saturation are valid.
Since the accepted theories were in disagreement with the results obtained in this study, the data were analyzed carefully for possible reasons for this disa~reement. The accepted theories are said to hold only for a homogeneous system. Even though capillary pressure experiments were performed on this model to test it for homogeneity, it was felt that the deviations in these results might be caused by some unknown character of the rock. There fore, other models were made and the same tests were performed on them. The results of these tests show the same deviations as the results for the first model.
All of the additional models tested gave different relative permeability characteristics under the same applied conditions which indicated that the structure of each model was different. Experiments on these models yielded results shown in Fig. 4 for a mean flowing pressure of 250 psig. There is no directional correlation of the results with any of the properties of the rock. All models have the same deviations due tO,the mean flowing pressure in the system. The mean flowing pressure is defined as the arithmetic average of the inlet and outlet pressures of the system.
Models which have extremely high permeability cannot be readily studied at high pressure due to the high gas flow rates which are involved at reaso~ able pressure drops. Therefore, the highest permeability system studied in high pressure gas drives is a 286 md core. The length of the system helps to overcome the high flow rate problem, and most of the data included in this paper are for the models which are from 24 to 30 in. in length.
The flow tests were performed on both horizontal and vertical systems to eliminate the gravity segregation which might be thought to cause the deviations. In either system, the deviations with pressure are apparent and significant. The results of the experiments on a single system for both vertical and horizontal runs at 290 psig and 1,000 psig are shown in Fig. 5. The results are in agreement within the experimental error.
The deviations due to pressure are so consistent that they are believed to be independent of rock structure and appear to be due to some property of the fluids or combination between the rock and fluid properties. Fluid properties which were chosen for investigation were viscosity, solubility, fluid compressibility, and interfacial tension. Each of these was investigated.
An increase in oil viscosity accompanies a pressure increase. At atmospheric pressure the vis-
cosity of the oil used in the experiments is 1.31 cp and the viscosity of the bubble pOint oil at 1,500 psig is 1.36 cpo This was an indication that viscosity was not the cause of the deviation of the results.
To further study the effects of viscosity, a hydrocarbon oil having a viscosity of 3.61 cp was used to make flow studies at low and high pressures. The same general type of results was found to persist. Although the data show a very small difference between the 1.31 cp oil and the 3.61 cp oil, the results indicated that viscosity is not causing this shift in kg/ko curves. A comparison of the results of the runs with two oils of different viscOsity is shown in Fig. 6.
The determination of producing characteristics involves the viscosity term. In order to have the results correlated by a single curve, the viscosity of the light oil at 1,500 psig would have to be not 1.36 cp but 0.71 cpo For these particular oils and with nitrogen or helium as the gaseous phase there is an increase in viscosity of the bubble point oil as the bubble point pre'ssure increases.
To bring the curves together due to gas solubility would require the solubility of gas in the oil to be greater at low pressure than at high pressure. Again this is inverse to the condition that exists and the nature of the fluids.
Fluid compressibility in the liquid state is negligible over this change in pressure and was therefore eliminated. The gas compressibility was accounted for in the calculations of the performance characteristics.
The last property to be analyzed was interfacial tension which, according to generally accepted theory, does not influence production characteristics. Literature9 indicates that the interfacial tension between nitrogen and water decreases as the pressure increases. The same is 'true for methane and water. The inverse of this is true for helium and water, although the increases noted in this system are not as great as are the decreases in the nitrogen or methane systems. From this knowledge it was decided to make runs using helium as the inert gas for experiments.
Helium has the same type of effect on the oil viscosity that the nitrogen has, but because of its lower solubility the effect is more exaggerated.
Fig. 7 shows the results of experiments on model c-6 when helium and nitrogen are used as the driving phase. In the nitrogen-oil runs the results indicate a change in one direction with an increase in pressure, while the helium-oil runs indicate a . change in the opposite direction. The results of this system show a deviation in the relative permeability ratio at any given saturation by as much as a factor of three, or along the saturation scale by as much as 7 per cent at a constant relative permeability ratio. The reproducibility of these results is within 1/2 of 1 per cent on the saturation scale.
Dow
nloaded from http://onepetro.org/SPEATC
E/proceedings-pdf/55FM/All-55FM
/SPE-510-G/2085821/spe-510-g.pdf by guest on 27 M
arch 2022

6 INFLUENCE OF ROCK AND FLUID PROPERTIES ON IMMISCIBLE FLUID-FLOW BEHAVIOR IN POROUS MEDIA 510-G
This gave a possible indication that the property which seemed to be the cause of the deviations was the interfacial tension or the rate of change of interfacial tension with pressure, or some combination of the two charact&ristics. To test this variable further, an oil would be required having a higher surface tension than the C10-C12 fraction and the more viscous oil previously used. Pine oil and dipentene have a surface tension of 32 dynes/cm, while the former oils have a surface tension of 24-25 dynes/cm. The viscosity of pine oil was too high and that of d~pentene too low. A mixture of phese two yielded an oil which had a 3.61 cp viscosity and a surface tension of 32 dynes/cm, which were the desired characteristics. Unfortunately, this fluid mixture attacked the Lucite mounting and the resultant tests were inconclusive. Other mounting materials such as rubber and thermo-setting plastics used with this oil were not satisfactory.
Single phase gas or oil pressure profiles deviate from each other in a porous system. The deviation of the gas pressure profile from the liquid profile is caused by gas expansion. The exact gas pressure profile will depend on the static pressure as well as the pressure differential. The'liquid pressure profile is independent of static pressure and depends on the-pressure differential only. The pressure differential will control the flow rate in either a single phase or two-phase system.
Due to gas expansibility, it was necessary to check the effects of flow rate on the producing characteristics. Fig. 8 shows the results at two pressures at varying rates. The small differences in these characteri~tics are within the experimental error involved in the test and are not directional with change in rate. Therefore, it is concluded that rate effects are negligible as long as the rate is sufficiently high to eliminate the effect of capillarity in the system. Runs made at other pressures than those shown also ~ndicate no rate effects
When a pressure differential exists between the outside and inside of a piece of porous material, the porous material is compressed. Under compression the pore sizes become smaller and the permeability of the material is reduced. To ascertain the effect of the rock compressibility on the results, a constant differential pressure between the annulus and the rock was maintained while making several runs at different flowing pressures. Experimental results under th~se conditions we're compared to resu~ts obtained with a constant annulus pressure for several runs at different flowing pressures. The only noticeable deviations in the results were those due to the changes in flowing pressure and none due to the compressibility of the rock.
Several solution gas drive experiments were perfbrmed. To make the calculations of relative permeability ratios from this type of experiment it is necessary to assume that no saturation gradient exists in the model. When this assumption is made some of the resulting curves, such as the one shown in Fig. 9 for run Il-SD, show a significant reduction in relative permeability ratio in the gas
saturation range above 35 per cent. These tests were performed using methane-Soltrol 140 bubble point oil at 1,000 psig bubble point and higher. The pressure at which this reduction occurs is high enough [about 500 psig] relative to the pressure differential across the system [20 psi] that the result is not due to gas expansion. This type of result had been noted previously with low pressure [200 psig] solution gas drives but was attributed to gas expansion. A gas balance was run at each production point to determine any supersaturation that might exist in the system, but no significant amount was apparent.
The results of these experiments indicate that a uniform depletion along the length of the system does not occur and that part of· the system may be affected by imbibition in the late history.
The unconsolidated sand models were treated with a silicone polymer to change the surface forces between the sand and the oil. As the adhesion tension between the sand and the oil increased, the gas became less effective in driving the oil. As the sandf were cleaned for various experiments the silicone polymer became less effective and ultimately the untreated sand and treated sand on similar models gave the same results. The original treated sand had a permeability which was about 15 per cent less than that exhibited b~ the untreated sand, but after several cleanings, columns which were similar except for treatment reacted the same.
Water drives were performed on the treated unconsolidated sand models using a 110 cp viscosity oil. The water-oil interfacial tension was approximately the same as the atmospheric gas-oil interfacial tension on this oil. Using this oil the results of both water and gas drive experiments run at essentially atmospheric pressure were in excellent agreement as shown in Fig. 10.
The permeability of the unconsolidated systems is too high to study the performance characteristics at high pressures.
Water drives on oil-wet systems made at lower interfacial tensions were more efficient. When the oil-water interfacial tension was reduced to 1 or 2 dynes/cm using an oil soluble additive, the recovery at breakthrough was of the order of 60 per cent compared to gas-oil breakthrough recoveries with the same viscosity ratio on the order of 15 per cent. The stabilized zone calculations indicated no such range of effective saturations. At the very low interfacial tensions emulsification was encountered which made it difficult to obtain good data after breakthrough.
Some capillary pressure experiments were performed on the unconsolidated sand models. The values of capillary pressure reported by Leverett5 are confirmed by this work on the untreated systems. The sands which were treated have a capillary pressure which is about 30 per cent higher than the untreated systems.
Dow
nloaded from http://onepetro.org/SPEATC
E/proceedings-pdf/55FM/All-55FM
/SPE-510-G/2085821/spe-510-g.pdf by guest on 27 M
arch 2022
510-G F. E. MERLISS, J. D. DOANE, AND M. J. RZASA 7
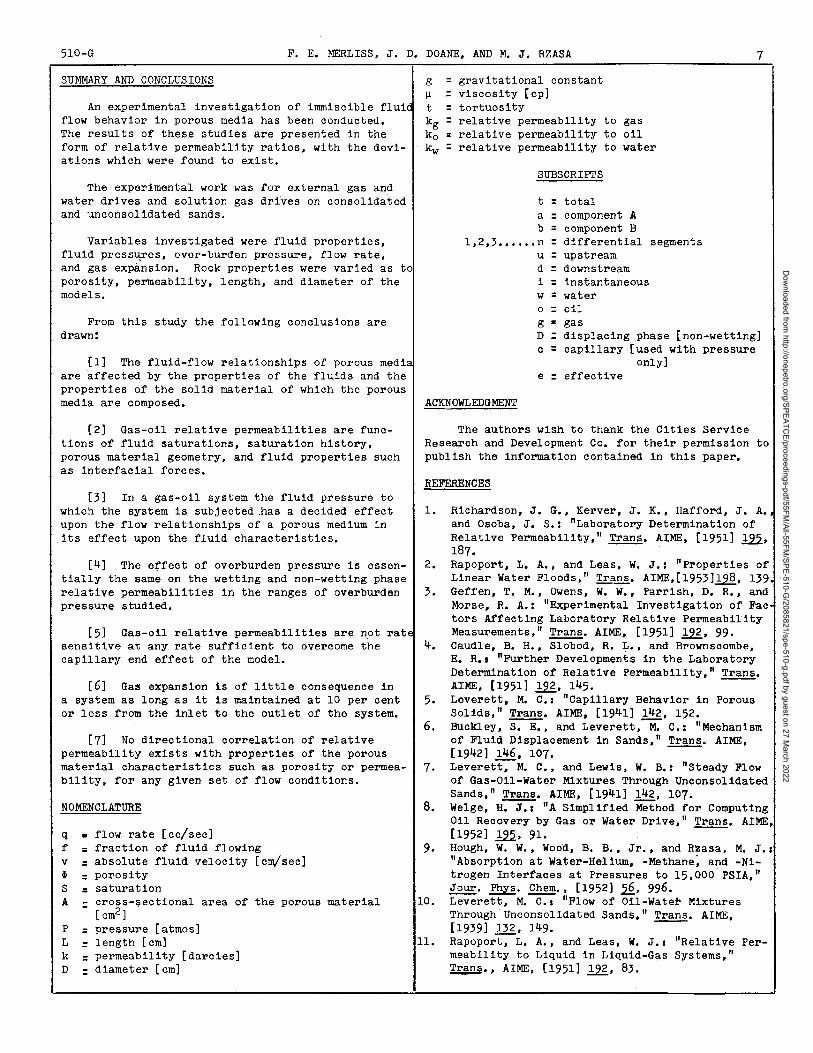
SUMMARY AND CONCLUSIONS
An experimental investigation of immiscible fluid flow behavior in porous media has been conducted. The results of these studies are presented in the form of relative permeability ratios, with the deviations which were found to exist.
The experimental work was for external gas and water drives and solution gas drives on consolidated and unconsolidated sands.
Variables investigated were fluid properties, fluid pressUJ'es, over-burden pressure, flow rate, and gas expansion. Rock properties were varied as to porosity, permeability, length, and diameter of the models.
From this study the following conclusions are drawn:
[1] The fluid-flow relationships of porous media are affected by the properties of the fluids and the properties of the solid material of which the porous
g = ~ : t = kg = ko = kw =
gravitational constant viscosity [cp] tortuosity relative permeab ili ty to gas relative permeability to oil relative permeability to water
SUBSCRIPTS
t = total a = component A b =
1,2,3 •• , ... n = component B differential segments upstream u =
d = downstream i = in stantaneous w = water o = oil g • gas D = displacing phase [non-wetting] c = capillary [used with pressure
only] e = effective
media are composed. ACKNOWLEDGMENT
[2] Gas-oil relative permeabilities are functions of fluid saturations, saturation history, porous material geometry, and fluid properties such as interfacial forces.
The authors wish to thank the Cities Service Research and Development Co. for their permission to publish the information contained in this paper.
REFERENCES [3] In a gas-oil system the fluid pressure to
which the system is subjected .has a decided effect 1. upon the flow relationships of a porous medium in its effect upon the fluid characteristics.
[4] The effect of overburden pressure is essen- 2. tially the same on the wetting and non-wetting phase relative permeabilities in the ranges of overburden 3. pressure studied.
[5] Gas-oil relative permeabilities are not rate sensitive at any rate sufficient to overcome the 4. capillary end effect of the model.
[6] Gas expansion is of little consequence in a system as long as it is maintained at 10 per cent 5. or less from the inlet to the outlet of the system.
6. [7] No directional correlation of relative
permeability exists with properties of the porous material characteristics such as porosity or permea- 7. bility, for any given set of flow conditions.
NOMENCLATURE 8.
q • flow rate [cc/sec] f = fraction of fluid flowing 9. v = absolute fluid velocity [cm/sec] ~ = porosity S = saturation A = cross-sectional area of the porous material 10.
[cm2] . P = pressure [atmos] L = length [em] 11. k = permeability [darcies] D = diameter [cm]
Richardson, J. G., Kerver, J. K., Hafford, J. A. and Osoba, J. S.: IILaboratory Determination of Relative Permeability,lI Trans. AIME. [1951] ill, 187. Rapoport, L. A., and Leas, W. J.: IIProperties of Linear Water Floods," Trans. AIME,[1953]1.2§., 139. Geffen, T. M., OWens, W. W., Parrish, D. R., and Morse, R. A.: "Experimental Investigation of Fac tors Affecting Laboratory Relative Permeability Measurements, II ~. AIME. [1951] ill, 99. Caudle, B. H., Slobod, R. L., and Brownscombe, E. R.I "Further Developments in the Laboratory Determination of Relative Permeability," Trans. AIME, [1951] 192, 145. -Leverett, M. C. t IICapillary Behavior in Porous Solids," Trans. AIME, [1941] 142, 152. Buckley, S. E •• and Leverett,M. C.: "Mechanism of Fluid Displacement in Sands," Trans. AIME, [1942] 146, 107. --Leveret~M. C., and Lewis, W. B.: "Steady Flow of Gas-Oil-Water Mixtures Through Unconsolidated Sands," Trans. AIME, [1941] 142, 107. . Welge, H~ "A 3-impl1fied Method for Computing Oil Recovery by Gas or Water Drive," Trans. AIME, [1952] .!..22, 91. --Hough, W. W., Wood, B. B., Jr., and Rzasa, M. J.t IIAbsorption at Water-Helium, -Methane~ and -Nitrogen Interfaces at Pressures to 15,OOO'PSIA," ~. Phys. ~., [1952] 22., 996. Leverett, M. C., "Flow of 01l-Watef' Mixtures Through Unconsolidated Sands,lI Trans. AIME, [1939] 132, 149. --Rapoport, L. A., and Leas, W. J.t IIRelative Permeability to Liquid in Liquid-Gas Systems," ~., AIME, [1951] ill, 83.
Dow
nloaded from http://onepetro.org/SPEATC
E/proceedings-pdf/55FM/All-55FM
/SPE-510-G/2085821/spe-510-g.pdf by guest on 27 M
arch 2022

TABLE 1
Number of Core Length Diameter Permeability Porosity Silicone Sand Experiments
No o om em md 1- Treated Mesh Performed
Consolidated Models
C-1 25 0 4 5.08 100 18.36 No 56 C-2 25.4 5.08 60 18.84 No 5 C~3 25.4 5.08 l.5 13.27 No 4 C-4 16.0 4.05 17.4 20.01 No 2 C-5 15 0 2 4.05 200 20.92 No 2 C-6 77 05 4.30 286 21.70 No 24
Unconsolidated Models
U~l 60.9 2.54 8262 34.64 Yes 80-120 8 U-2 62.9 2.54 9725 33.65 No 80-120 4 U-3 26.7 3.77 7267 37.49 Yes 80-120 5 U=4 26.7 3.77 14379 38.48 No 50-70 3 U-5 63 0 8 3 0 81 19629 35.39 No 50-70 3
Dow
nloaded from http://onepetro.org/SPEATC
E/proceedings-pdf/55FM/All-55FM
/SPE-510-G/2085821/spe-510-g.pdf by guest on 27 M
arch 2022
5 4
NOMENCLATURE
I GAS PRESSURE RESERVOIR 2 REDUCING PRESSURE REGULATOR
9 3 UPSTREAM PRESSURE GUAGE 4 ANNULUS 5 SAMPLE 6 ANNULUS PRESSURE GUAGE 7 DOWNSTREAM PRESSURE GUAGE 8 DIFFERENTIAL PRESSURE CONTROLLER 9 RECEIVER 10 GAS METER
FIG. 1 - fXlUIPMENT SE'ruP FOR HIGH PRESSURE OIL AND GAS FLCI<I SIDDIES.
Q6r-----r-----+-----+_----~----_r--~~----~
~o O~r-----+-----_r-----+----~----~~&_--+_----~
~ ~
'" Q I-
~ >I-:J QI ffi r-----+------r-----+-.~~~----~--_+----_4
<:( w ~
~ 0.061------I1-----I----+--lir--;----'---------'------+------i
21 22 23
PHASE: NITROGEN PHASE: CKf"C12
SYM. STATIC PRESS. PSIG
v 240 o 990 o 1510
QOI5~---.1~0----·1~5----2AO~--~2~5----3~0~---3~5.---~40 GAS SATURATION - PERCENT PORE SPACE
FIG. 2 - EFFJ£T OF STATIC PRESSURE ON 1RE RELATIVE PERMEABILITY RATIO-GAS
SATURATION RELATIONSIUP FOR MODEL C-l.
Dow
nloaded from http://onepetro.org/SPEATC
E/proceedings-pdf/55FM/All-55FM
/SPE-510-G/2085821/spe-510-g.pdf by guest on 27 M
arch 2022

w u ~ til
W a: 0 11.
I-z w u a: w 11. I
...J (5
...J « ::l 0 Vi w a:
o
Z ~
o i= « a:
100
95 --------
DRIVING PHASE: NITROGEN DRIVEN PHASE: CIO-Clc
90 RUN NO. SYM. STATIC PRESS.
21 • 240 PSIG 22 • 990 PSIG 23 • 1510 PSIG
BREAKTHR UGH
80
75
70 -------1 ---
65
60 -- -- ----~~-""""--==-_=_t""-__....----+--__I
551---__ _
50~---+_--o I 234 PORE VOLUMES OF GAS INJECTED AT MEAN STATIC PRES~
PIG. 3 - RESIDUAL OIL IN PER CENT OF PORE SPACE VERSUS PORE VOLUMES OF GAB
INJECTED AT 'IRE MEAN STATIC PR&SSURE FOR MODEL C-l.
I~,-_~ __ ,,--,---,---,~~~----
0.6
0.3
DRIVING PHASE: NITROGEN DRIVEN PHASE: C;o-C12
RUN NO.
68 69
106 107
SYM. FLOW
.. HOR. o HOR .. VERT.
• VERT.
STATIC PRESS. PSIG 1006 280 290 1000
>I~ QI~ __ ~ __ ~-~~~-~---~----~--~
~ w ~
~ Q06~--+----+-}L-~~--+---~---+-----I w > i= « ...J
~ 0.03~--+----J1L-1f-----+-----+---+---t---I
0.01 5 15 20 25 30 GAS SATURATION- PERCENT PORE SPACE
FIG. 5 _ (.'(H>ARIfK)N OF 'lHE RElATIVE PERHEABILIT!' RATlO-GAS SA'1'URA.TIClf
RElATlOHSHIP (li WRIZCBTAL AND V&R'l'ICAL GAB DRIV&9 FOR MJDEL C-6.
1.0,--__ ,---__ ,-----._-,_
I I
O'6f----+--+-----+-__ J __ _ ! I
I I I 0.31----_+_--1----+----1 ---- --HP--+tI+t--
'.1:.0 I '? d' i= 1
~
t~,:~~~~:~----If-cl__l___I__fl__--_+---.j-
>I-:J
~ ~ a:
MODEL STAT. SYM. NO. PRESS.
PSIG 72 • C-5 259 21 • C-I 240 69 0 C-6 280 10 0 C-2 250 2 • C-3 240
70 v C-4 260
0.0~!-------,1i=0-----+-----+-----+-----~----~-----}40
GAS
FIG 0 4 - RELATIVE P~ILI'lT RATIO-GAB SATURA.TION RELATIONSHIP FOR SIX
SANnSroNE MODELS AT (.'(H>ARABLE EXP~TAL CONDITIONS.
1.0',-------r--,-----,---,----r---,,-,,.---_
0.6
RUN NO. 112 116 108 109
STATIC OIL SYMBOL PRESS. VISCOSITY
o 250 PSIG 3.61 • 250 PSIG 1.31 v 700 PSIG 1.31 o 700 PSIG
O.I~-_+-~+--_'J__::f-\---j---+--_____j
~ 0~6~--~--+_-¥~~--_r_---I---+-----~ ~ I ~ I
~ O'03,1----+--__I_-h~--1 .. ---+---~- --+----
0.01!-------,l10~--+.1 ~--..2b.:-------..;2~5--~-~k-----;;r'0 GAS SA TURA nON - PERCENT PORE SPACE
FIG. 6 _ EFFECT OF OIL VI8X8ITY OM '1'IIE REIATIVE PEliMEABILITY RArIO-GAS
SA'l'URATION RElATIONSHIP FOR ",DEL C-&.
Dow
nloaded from http://onepetro.org/SPEATC
E/proceedings-pdf/55FM/All-55FM
/SPE-510-G/2085821/spe-510-g.pdf by guest on 27 M
arch 2022

o o.3f----t----+--~
)-0'"
~ a:: >I-
:J OJ f---+----l---FcP--A---d---.l+---+---+---j ~ w ~ a:: ~ Q06f----t---7~-~~~~~-+_--_+---~--~ w > ~ ...J W
a:: 0.031------J1+----f'---v--c1-
DRIVEN PHASE: C,crCIZ
RUN I STATic NO. SYM. GAS PRESS. 117 • 118 ... 119 c 120 v 121 0
NZ 315 NZ 1015 Nz 1515 HE 1015 HE 315
QOI5~--.1~0--'1~5--~2~0--~--~--~--4~0 GAS SATURATION-
FIG. 7 _ EFFECT OF STATIC PRm'3URE ON RELATIVE PERMEABILITY CHARACTERISTICS
IN THE Nlomo:;EN-ClO-C12 AND HELIUM-ClO-CU S'iS'l'IMS. RUNS PERFOIiMED ON
MODEL C-6 AT FIXED PRESSURE DIFFERENTIAL.
1.0
0.6
0,3
,:£0
'-.. :t " O. I
0 i= 0.06 « / a:: >-I- 0.03 :J iil « w ~
15 0.0 I a.. RUN NO. SYMBOL llP [PSI]
) I I'" ~ 0.006 i= « ~ 0.003 a::
0.001
0.0006
0.0003 q
3SD 0 20 _ 1.,/0 IISD C 15
r------i/I----iY---r---cmIGINAL BUBBLE POINT 1250 PSIG
10 I C~'l==-~ ___ ~ __ ~ ----I ----1---- c--
f---'--+----+--I-----~- -+----+----1
i 0'000~~-~15~---2~5--~35~--74T5--~5~5--~6T5--~75 AVERAGE GAS SATURATION - PERCENT PORE SPACE
FIG. 9 _ RElATIVE PEla1EABILITY RATIO-GJIS Sl'l'UU'lI0If RELA'l'IORSHIP
CALCULATED FROM OOLUTION GAS DRIVE EIPEIlIMEIr.IB.
-2 0.3f--~_+_~_F__+_+__?"---f__~_+_~~t_~--1 ')-
~ :J iii « w ~ a: ~ Q06f---+--
w > f: :3 w a: 0.031----t---+7"---..t-/ STATIC
PRESS PSIG 1000 1000 1000 250 250 250
40 41 42
SYM. t.P[PSI)
o v
C
• ... •
17 13 8 18 15 5 JJi
0.0\"0--"'12---'1;'-;;4-·- 16 -'1';o;-8--"'2"'0---';2"'2~--.i24 GAS SATURATION - PERCENT PORE SPACE
FIG. 8 _ EFFECT OF VARYING PRESSURE DIFF£REWrIAL ON GAS-OIL REJ..ATIVE
PERMEABILITY RATlCB FOR MODEL C-l.
0" i= « a:
>-
'1.0
0.6
0.3
S Q I iii « w ~ ffi 0.06 a.. w ~
~ ...J
ll! 0.03
0.0 I
y
/ ;-
/
/ VI
I
If
I MODEL NO. U-3 -V
I I RUN NO. SYM. DRIVING PHASE 94 • AIR
V 104 0 HZO ~
V 15 20 25 30 5 40 45
NON-WETTING PHASE SATURATION-PERCENT PORE SPACE FIG. 10 _ WATER-OIL AND GAS-()IL RELATIVE PERMFABILITY RATIO VERSJS NON-W"E'l"l'ING
PHASE SA'lVRATION AT WATER-OIL AND (3AS-OIL INTERfACIAL 'nliSIONB OF 35 DYKES/C](.
Dow
nloaded from http://onepetro.org/SPEATC
E/proceedings-pdf/55FM/All-55FM
/SPE-510-G/2085821/spe-510-g.pdf by guest on 27 M
arch 2022