UMB-SI-Hernawati-Culinary as Social Phenomenon
18
CULINARY AS SOCIAL PHENOMENON, CASE STUDIES IN JABABEKA AND LIPPO CIKARANG, BEKASI, INDONESIA 1,2 Hernawati W. Retno Wiratih, MSc 3 [email protected] President University Jababeka, Indonesia Without bread, all is misery (William Cobbett (1763—1835) ABSTRACT Humans find its existence for thought. Humans are unique creatures. According to Descartes (1596- 1650) humans are creatures who think (cogito); doubts about its existence the cogito ergo sum are answered which is building a relationship with their environment to develop themselves as human beings. In the whole course of life, man’s development from the primitive and simple to the most complex ways of living, wherever men have lived together there has been some group interest in food, traveling, and pleasure. This interest as group grows becomes more complex, and places in charged with the chance and challenge of feeding and offering is created. Human capital is not only a factor in economic growth, but also an effect of it or of developments generated by economic growth. The process of economic growth can explain much of the observed variation in the structure distribution among culinary foods as a social phenomenon. The global spread culinary industries produced benefit development of well-being in many areas. The contribution of culinary to economic well-being depends on the quality and revenues of the culinary that offer. The trend of world community todays there is an interest increase of most of people, with their own reasons, they like to spend their time to the food court even a while. Due to the result of research shows that with 180 respondents from any reasons we try to study (ages of group of respondents, gender, education, occupation, the living area, their related Activities Culinary for. Lunch and or dining out is growing form of half of informal form and leisure where meals are consumed not out of necessity but also important sustainable positioning in ever more complex for pleasure and to build a relationships, the occasion are part of the leisure experiences as much as the food itself as social-belonging, esteem, and self-actualization (Hierarchy of Needs, Maslow, 1954), and event cultural object. In Sen’s capabilities approach which holds a person’s capability to have various functioning vectors and to enjoy the corresponding “well-being achievements” to the best indicator of welfare (Sen, 1985) means that culinary as social phenomenon growth amplifies the positive impacts of rotation economic and market production at the same time welfare too. Key Words: Culinary, Leisure and Esteem, Self-Actualization, Growth Economic. 1. Research Paper Present in Business, Management and Environment: A Comprehensive Study in Asian Economy, International Seminar, Bali, Indonesia Page 1 2. This study was carried out with support of PT Jababeka Tbk, Jababeka, Bekasi, Indonesia, and President University, Jababeka, Bekasi, Indonesia 3. Lecturer at President University, Jababeka, Bekasi, Indonesia
Transcript of UMB-SI-Hernawati-Culinary as Social Phenomenon

CULINARY AS SOCIAL PHENOMENON, CASE STUDIESIN JABABEKA AND LIPPO CIKARANG, BEKASI,
INDONESIA1,2
Hernawati W. Retno Wiratih, MSc3
President University
Jababeka, Indonesia
Without bread, all is misery (William Cobbett (1763—1835)
ABSTRACTHumans find its existence for thought. Humans are unique creatures. According to Descartes (1596-1650) humans are creatures who think (cogito); doubts about its existence the cogito ergo sum areanswered which is building a relationship with their environment to develop themselves as humanbeings. In the whole course of life, man’s development from the primitive and simple to the mostcomplex ways of living, wherever men have lived together there has been some group interest infood, traveling, and pleasure. This interest as group grows becomes more complex, and places incharged with the chance and challenge of feeding and offering is created. Human capital is not onlya factor in economic growth, but also an effect of it or of developments generated by economicgrowth. The process of economic growth can explain much of the observed variation in the structuredistribution among culinary foods as a social phenomenon. The global spread culinary industriesproduced benefit development of well-being in many areas. The contribution of culinary to economicwell-being depends on the quality and revenues of the culinary that offer. The trend of worldcommunity todays there is an interest increase of most of people, with their own reasons, they like tospend their time to the food court even a while. Due to the result of research shows that with 180respondents from any reasons we try to study (ages of group of respondents, gender, education,occupation, the living area, their related Activities Culinary for. Lunch and or dining out is growingform of half of informal form and leisure where meals are consumed not out of necessity but alsoimportant sustainable positioning in ever more complex for pleasure and to build a relationships,the occasion are part of the leisure experiences as much as the food itself as social-belonging,esteem, and self-actualization (Hierarchy of Needs, Maslow, 1954), and event cultural object. In Sen’scapabilities approach which holds a person’s capability to have various functioning vectors and toenjoy the corresponding “well-being achievements” to the best indicator of welfare (Sen, 1985)means that culinary as social phenomenon growth amplifies the positive impacts of rotationeconomic and market production at the same time welfare too. Key Words: Culinary, Leisure and Esteem, Self-Actualization, GrowthEconomic.
1. Research Paper Present in Business, Management and Environment: A Comprehensive Study in Asian Economy, International Seminar, Bali, Indonesia Page 1
2. This study was carried out with support of PT Jababeka Tbk, Jababeka, Bekasi, Indonesia, and President University, Jababeka, Bekasi, Indonesia 3. Lecturer at President University, Jababeka, Bekasi, Indonesia
A. Research Background
As human beings we are born with a human nature and human dignitythat each and every member in the very capacity of being human holdsan inherent dignity and worth. Human being is an ideal and a norm;need to be cultivated to develop his or her human nature. Humanbeing has capacities that allow them to respond appropriately toenvironmental requirements, but also allow them to care for theappropriateness of their own responses. The human being is arational actor and such creates culture and history, free in manyrespects and expectations. We may have across the word of‘environment,’ even ‘feeding environmental.’ Humans not only learnfrom the environment (natural, social system, and the economicsystem), he also learned from the earlier human, processes anddevelopments will shape his pattern of learned behavior and beliefs.Man is reflections human beings who think about the experiences andbeliefs that grow out of him.
Development, even as the basic needs of human welfare, e.g. income,education, health, and also the vector of possible opportunitiesavailable to individuals in a particular state. Underpinning inSen’s capabilities approach which holds a person’s capability tohave various functioning vectors and to enjoy the corresponding“well-being achievements” to the best indicator of welfare (Sen,1985[11]). For that reasons, we do not want culinary to travelthrough. We want them to stop, spend and stay longer, on the thingsthat make them unique and which reinforces their identities thatdifferent of them. Consider contribution provider of sustainabilityto local economy and food ways like consideration of food and goodsthat contribute to saving heirloom foods it help reduce emissionsand environmental change, it help increase rather than reduce thevariety of what they eat and taste.
B. Objectives of Research
1. Research Paper Present in Business, Management and Environment: A Comprehensive Study in Asian Economy, International Seminar, Bali, Indonesia Page 2
2. This study was carried out with support of PT Jababeka Tbk, Jababeka, Bekasi, Indonesia, and President University, Jababeka, Bekasi, Indonesia 3. Lecturer at President University, Jababeka, Bekasi, Indonesia

The main purpose of this research is to identify profitability ofJababeka city as an Industry city as a travel destination forpicturesque culinary experiences.
C. Research Design
D. Research Schedule
The research was conducted since December 2012 until April 2013 at
Jababeka and Lippo Cikarang, Bekasi regency, West Java.
E. Research Data Collection
1. This research using percent among perspective of consumer’sculinary behavior. 2. This research with 180 respondents (with 67 percent
Indonesian and 33 percent foreigners) as sample withspecification of socio-demographic indicators of respondentwhich devided by Hierarchy of Needs of Maslow ,1954[9], into: AgeGroup; Gender; Education Level; Living Area;
3. Related Activities Culinary and or food tourism for:Lunch; Dining; Purchasing; Unique
Experience. 4. Spent Amount for Culinary and or food tourism in Rupiah:200.000-400.000; 500-600;1. Research Paper Present in Business, Management and Environment: A Comprehensive Study in Asian Economy,
International Seminar, Bali, Indonesia Page 32. This study was carried out with support of PT Jababeka Tbk, Jababeka, Bekasi, Indonesia, and President University, Jababeka, Bekasi, Indonesia 3. Lecturer at President University, Jababeka, Bekasi, Indonesia
AgeGenderEducationLiving Area
Original Country:IndonesiaForeigners
Reason’s take into:Related Activities
Spent Amount of Money
Culinary Behavior’s Tourism
Influencing of:Self-imageSelf-relationshipAppraisal-imageCultural-imageCultural-boundCultural-replication
consistency

700.000-800.000; 800-1.000.000; 1.000.000> 5. The questionnaire consisted of respondent’s statementwith choosing favorite food for their occasion. By this statement, tried to identify: kind
of places food choices for purchace (Indonesian food, Westfood, Japan food, Korean food, Chinese food, Thailand food).In the
questionnaire regarding how much the consumers’culinary willing to pay for.
F. Result of Research
1. Respondents Devided by Ages To represent population of people who interest on food culinarythis research with 180 respondents that divided into group of agewhich showed that 19 percent for 20 – 24 years old; 19 percent for25 – 34 years old; 26 percent for 35 – 44 years old; 26 percent for45 – 54 years old; and 10 percent for 55 years old and more (seefigure 4). Which19 percent of respondents who represent of 20 to24 years old with the percentage of 9 percent they chose Thailandfood; 14 percent each for Chinese food and Indonesian food; 17percent Korean food; and each of 23 percent for West food, andJapanese food (see figure 5); 19 percent of respondents thatrepresent of 25 to 34 years old (see figure 6) that show the middleage of their carrier, 6 percent of them choose for Thailand foodmeans lower than respondents which 20 to 24 years old who chooseThailand food; 14 percent choose for Indonesian food; 11 percentchoose for West food, and 23 percent each groups they choose forJapanese food Korean food and event Chinese food.
35 to 44 years old of respondents (see figure 7) that also representtheir social maturity which represent 26 percent showed that 4percent they choose for Thailand food; 15 percent respectively of
1. Research Paper Present in Business, Management and Environment: A Comprehensive Study in Asian Economy, International Seminar, Bali, Indonesia Page 4
2. This study was carried out with support of PT Jababeka Tbk, Jababeka, Bekasi, Indonesia, and President University, Jababeka, Bekasi, Indonesia 3. Lecturer at President University, Jababeka, Bekasi, Indonesia
two groups of respondents they choose for Indonesian and Westfoods; and for three groups of respondents respectively which each22 percent they choose for Japanese, Korean, and Chinese foods. 26percent of respondents which represent of 45 to 54 years old (seefigure 8) that represent for well-established of their carrier, 4percent of them choose Thailand food it show like in respondentsages of 35-44 years old; 15 percent choose Indonesian food and itshow still same like in respondents ages of 35-44 years old; 11percent choose West food it mean four percent lower than in ages of35-44 years old of the respondents; 22 percent choose Korean food;and 24 percent of two groups of respondents they choose Japaneseand Chinese food. Ten percent of 55 years old or more ofrespondents (see figure 9) of this research that we have asrepresentative of well-considered and mature respondents, 0 percentthey choose Thailand food; 11 percent they choose Indonesian food;23 percent they like to choose West food; and three groups ofrespondents respectively with 22 percent they like to chooseChinese, Korean and Japanese food.
2. Respondent Devided By Gender With sample 180 of respondents which divided by 61 percent are maleand 39 percent are female (see figure 10). From segregation of genderresearcher try to find out who and what they like most to foodsculinary for. For Male which 61 percent of respondents (see figure11); 4 percent of respondents they like to choose Thailand food; 11percent of respondent’s they choose Indonesian food; 18 percent ofrespondents choose for West food; 23 percent of respondent’s Koreanfood; and respectively 22 percent respondent’s of two groups ofrespondents they like to choose Japanese and Chinese food. Incontrary, for female (see figure 12) which 39 percent of respondents, 7percent of respondents they choose Thailand food means 3 percenthigher than male; 22 percent respondents choose to Indonesian foodmeans two times larger than male respondent’s who choose Indonesianfoods; 7 percent of them choose Chinese food that means 15 percent
1. Research Paper Present in Business, Management and Environment: A Comprehensive Study in Asian Economy, International Seminar, Bali, Indonesia Page 5
2. This study was carried out with support of PT Jababeka Tbk, Jababeka, Bekasi, Indonesia, and President University, Jababeka, Bekasi, Indonesia 3. Lecturer at President University, Jababeka, Bekasi, Indonesia
lower than male; 19 percent respondents who choose West foods thatshow almost same percent of respondent respectively of male andfemale who like to west foods; 21 percent of respondents chooseKorean foods; and 24 percent of respondents choose Japanese food.
3. Respondents Divided by Education Level
For respondents who divided by their education level (see figure 13)which divided by 33 percent of respondents to represent whograduate from high school and 67 percent of respondents torepresent graduate from higher education (university). From thisstep researcher divided them into favorite food of their culinary.And it was showed that 33 percent respondents which is represent ofhigh school education background (see figure 14), 0 percent ofrespondents choose Thailand foods; 8 percent of respondents chooseChinese food; 20 percent of respondents choose Korean foods astheir favorite; they choose for Indonesian food and West foods with22 percent of respondents respectively; and 28 percent ofrespondents choose to the Japanese food. And from 67 percentrespondents which is group of higher education/university educationbackground (see figure 15), 4 percent of respondents choose Thailandfoods which mean 4 percent higher than high school educationbackground; 10 percent of the respondents choose Chinese foods itshows 2 percent higher than group of respondents before; 12 percentof respondents choosing Indonesian foods here shows that 10 percentlower than respondents group of high school; 19 percent ofrespondents choosing West food it show 3 percent lower thanrespondent’s group before; 27 percent of respondents choosingJapanese foods mean shows that evenly to the respondents groupbefore; than 28 percent of respondents choosing Korean foods.
4. Respondents Divided by their Living Area
Respondents which divided into their living of area (see figure 16)that they divided into 33 percent of respondents who live in Lippo-
1. Research Paper Present in Business, Management and Environment: A Comprehensive Study in Asian Economy, International Seminar, Bali, Indonesia Page 6
2. This study was carried out with support of PT Jababeka Tbk, Jababeka, Bekasi, Indonesia, and President University, Jababeka, Bekasi, Indonesia 3. Lecturer at President University, Jababeka, Bekasi, Indonesia

Cikarang; and 67 percent of respondents who live in Jababeka-Cikarang. 67 percent respondents which is live in Jababeka-Cikarang (see figure 17) shows that 5 percent of them choose forThailand food it reveal evenly like respondents before for theThailand food; 18 percent of respondents choosing Chinese food itshow higher than respondent before; 15 percent of respondentschoosing Indonesian food; 18 percent of respondents are choosingWest food; 21 percent of respondents choosing Japanese food; and 23percent of respondents choosing Korean foods. With 33 percent ofrespondents which live in Lippo-Cikarang (see figure 18), it shows that7 percent of respondents choose Thailand food it mean shows that 2percent higher than respondents who live in Jababeka-Cikarang; 18percent of respondents choosing Chinese food here evenly likerespondents who live in Jababeka-Cikarang; 17 percent ofrespondents choosing Indonesian food it show that 2 percent higherthan respondents who live in Jababeka-Cikarang; 13 percent ofrespondents choosing West food that show 5 percent lower thanrespondents who live in Jababeka-Cikarang; 20 percent choosingJapanese food that show a little dispute to the respondents wholive in Jababeka-Cikarang; and 25 percent of respondents choosingKorean food it show 2 percent higher than respondents who live inJababeka-Cikarang.
5. Respondents Divided by their Related Activities
For respondents which divided by their Related Activities (see figure19) that they divided into 17 percent of respondents with lunch astheir related activities for culinary; 30 percent of respondents bydining as their related activities of food culinary; and 19 percentof respondents by purchasing as their related activities for foodculinary; and 34 percent of respondents as their related activitiesfor their food culinary. For respondents which divided into 17percent of respondents as their related activities for lunch (seefigure 20) for their foods culinary attest that 10 percent of them
1. Research Paper Present in Business, Management and Environment: A Comprehensive Study in Asian Economy, International Seminar, Bali, Indonesia Page 7
2. This study was carried out with support of PT Jababeka Tbk, Jababeka, Bekasi, Indonesia, and President University, Jababeka, Bekasi, Indonesia 3. Lecturer at President University, Jababeka, Bekasi, Indonesia

choosing Thailand food; 20 percent they choose Indonesian food; 13percent they choose West food; 23 percent choosing Japanese food;and each two groups of 17 percent choosing Chinese and Korean food.Respondents which divided into 30 percent of respondents as theirrelated activities for their dining (see figure 21) of their foodsculinary show a little of varieties to related activities whichis 6 percent of respondents choosing Thailand food it mean 4percent lower from lunch as related activities of food culinary;respondents choosing for Indonesian food as many as 23 percent fortheir dining as their related culinary activities same like Koreanfood with 23 percent as their related culinary activities; 15percent choosing West food for related dining activities; and 9percent for Chinese food. Respondents which divided into 19 percent of respondents withpurchasing (see figure 22) in the interest of their related activitiesfor their foods culinary show a varieties of related activitieswhich is 3 percent of respondents choosing Thailand food which mean3 percent lower than dining as related activities of respondents;17 percent of respondents each groups respectively choosing ofIndonesian food and West food of their related activities fortheir food culinary which mean 2 percent higher from West food ofdining and 6 percent lower than Indonesian food of dining ofrelated food culinary; for Chinese food they are 14 percent andimply to 5 percent higher of dining as related activities; forJapanese food in purchasing as related activities have 23 percentand only 1 percent lower than dining related activities; and 26percent for Korean food in purchasing culinary imply 3 percenthigher than dining one. Respondents which divided into 34 percentof respondents with their unique experience (see figure 23) in theinterest of their related activities for their foods culinaryattest a varieties of related activities which is 3 percent ofrespondents choosing Thailand food which imply like in respondentsof purchasing related activity; 12 percent of respondents choosingChinese food that show 2 percent lower than respondents of
1. Research Paper Present in Business, Management and Environment: A Comprehensive Study in Asian Economy, International Seminar, Bali, Indonesia Page 8
2. This study was carried out with support of PT Jababeka Tbk, Jababeka, Bekasi, Indonesia, and President University, Jababeka, Bekasi, Indonesia 3. Lecturer at President University, Jababeka, Bekasi, Indonesia
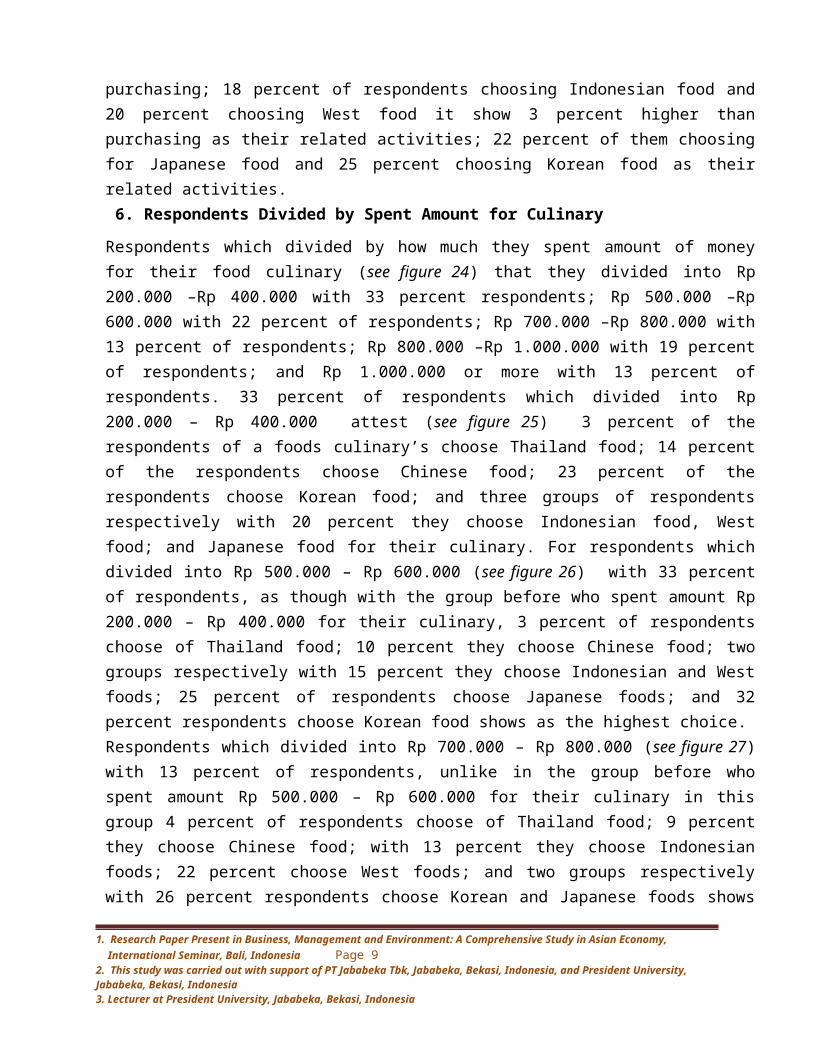
purchasing; 18 percent of respondents choosing Indonesian food and20 percent choosing West food it show 3 percent higher thanpurchasing as their related activities; 22 percent of them choosingfor Japanese food and 25 percent choosing Korean food as theirrelated activities. 6. Respondents Divided by Spent Amount for Culinary
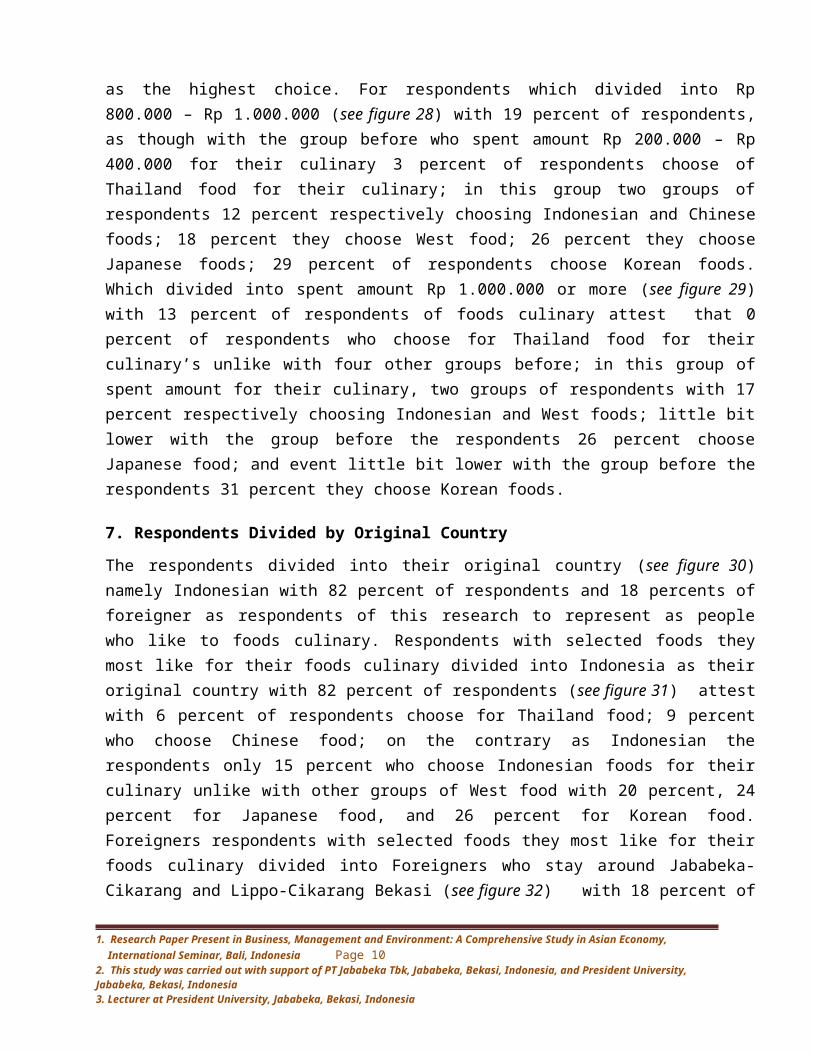
Respondents which divided by how much they spent amount of moneyfor their food culinary (see figure 24) that they divided into Rp200.000 –Rp 400.000 with 33 percent respondents; Rp 500.000 –Rp600.000 with 22 percent of respondents; Rp 700.000 –Rp 800.000 with13 percent of respondents; Rp 800.000 –Rp 1.000.000 with 19 percentof respondents; and Rp 1.000.000 or more with 13 percent ofrespondents. 33 percent of respondents which divided into Rp200.000 – Rp 400.000 attest (see figure 25) 3 percent of therespondents of a foods culinary’s choose Thailand food; 14 percentof the respondents choose Chinese food; 23 percent of therespondents choose Korean food; and three groups of respondentsrespectively with 20 percent they choose Indonesian food, Westfood; and Japanese food for their culinary. For respondents whichdivided into Rp 500.000 – Rp 600.000 (see figure 26) with 33 percentof respondents, as though with the group before who spent amount Rp200.000 – Rp 400.000 for their culinary, 3 percent of respondentschoose of Thailand food; 10 percent they choose Chinese food; twogroups respectively with 15 percent they choose Indonesian and Westfoods; 25 percent of respondents choose Japanese foods; and 32percent respondents choose Korean food shows as the highest choice.Respondents which divided into Rp 700.000 – Rp 800.000 (see figure 27)with 13 percent of respondents, unlike in the group before whospent amount Rp 500.000 – Rp 600.000 for their culinary in thisgroup 4 percent of respondents choose of Thailand food; 9 percentthey choose Chinese food; with 13 percent they choose Indonesianfoods; 22 percent choose West foods; and two groups respectivelywith 26 percent respondents choose Korean and Japanese foods shows
1. Research Paper Present in Business, Management and Environment: A Comprehensive Study in Asian Economy, International Seminar, Bali, Indonesia Page 9
2. This study was carried out with support of PT Jababeka Tbk, Jababeka, Bekasi, Indonesia, and President University, Jababeka, Bekasi, Indonesia 3. Lecturer at President University, Jababeka, Bekasi, Indonesia
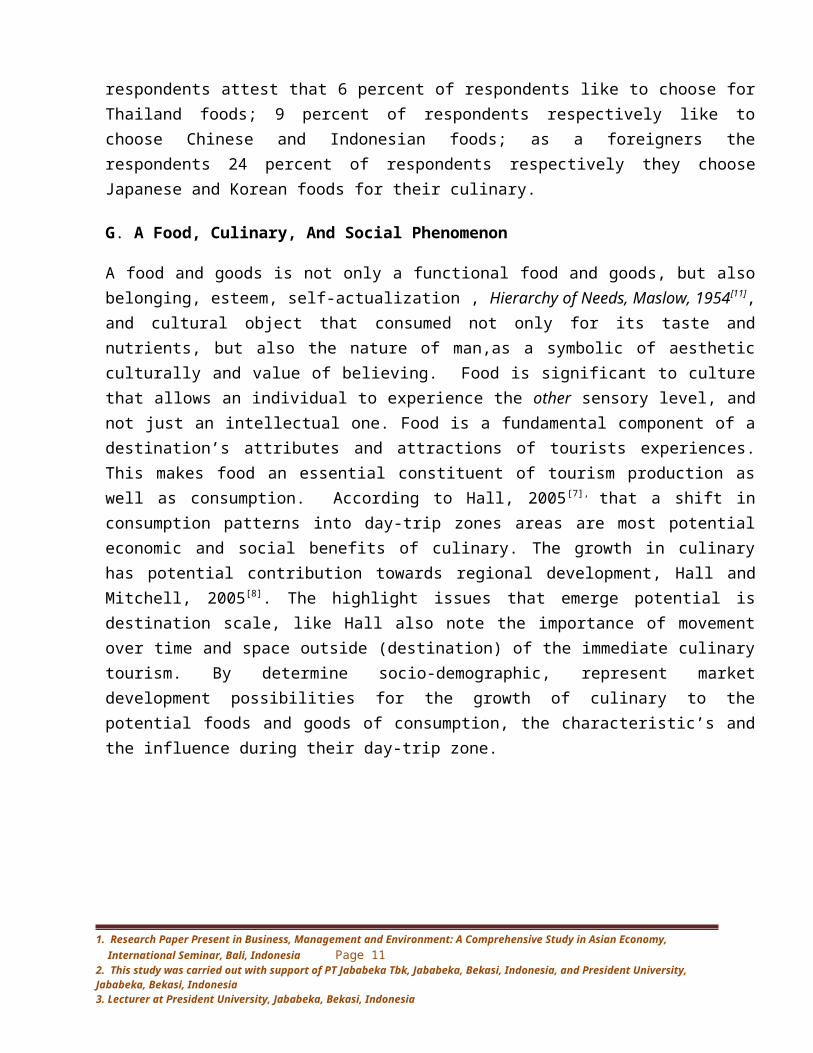
as the highest choice. For respondents which divided into Rp800.000 – Rp 1.000.000 (see figure 28) with 19 percent of respondents,as though with the group before who spent amount Rp 200.000 – Rp400.000 for their culinary 3 percent of respondents choose ofThailand food for their culinary; in this group two groups ofrespondents 12 percent respectively choosing Indonesian and Chinesefoods; 18 percent they choose West food; 26 percent they chooseJapanese foods; 29 percent of respondents choose Korean foods.Which divided into spent amount Rp 1.000.000 or more (see figure 29)with 13 percent of respondents of foods culinary attest that 0percent of respondents who choose for Thailand food for theirculinary’s unlike with four other groups before; in this group ofspent amount for their culinary, two groups of respondents with 17percent respectively choosing Indonesian and West foods; little bitlower with the group before the respondents 26 percent chooseJapanese food; and event little bit lower with the group before therespondents 31 percent they choose Korean foods.
7. Respondents Divided by Original Country
The respondents divided into their original country (see figure 30)namely Indonesian with 82 percent of respondents and 18 percents offoreigner as respondents of this research to represent as peoplewho like to foods culinary. Respondents with selected foods theymost like for their foods culinary divided into Indonesia as theiroriginal country with 82 percent of respondents (see figure 31) attestwith 6 percent of respondents choose for Thailand food; 9 percentwho choose Chinese food; on the contrary as Indonesian therespondents only 15 percent who choose Indonesian foods for theirculinary unlike with other groups of West food with 20 percent, 24percent for Japanese food, and 26 percent for Korean food.Foreigners respondents with selected foods they most like for theirfoods culinary divided into Foreigners who stay around Jababeka-Cikarang and Lippo-Cikarang Bekasi (see figure 32) with 18 percent of
1. Research Paper Present in Business, Management and Environment: A Comprehensive Study in Asian Economy, International Seminar, Bali, Indonesia Page 10
2. This study was carried out with support of PT Jababeka Tbk, Jababeka, Bekasi, Indonesia, and President University, Jababeka, Bekasi, Indonesia 3. Lecturer at President University, Jababeka, Bekasi, Indonesia
respondents attest that 6 percent of respondents like to choose forThailand foods; 9 percent of respondents respectively like tochoose Chinese and Indonesian foods; as a foreigners therespondents 24 percent of respondents respectively they chooseJapanese and Korean foods for their culinary.
G. A Food, Culinary, And Social Phenomenon
A food and goods is not only a functional food and goods, but alsobelonging, esteem, self-actualization , Hierarchy of Needs, Maslow, 1954[11],and cultural object that consumed not only for its taste andnutrients, but also the nature of man,as a symbolic of aestheticculturally and value of believing. Food is significant to culturethat allows an individual to experience the other sensory level, andnot just an intellectual one. Food is a fundamental component of adestination’s attributes and attractions of tourists experiences.This makes food an essential constituent of tourism production aswell as consumption. According to Hall, 2005[7], that a shift inconsumption patterns into day-trip zones areas are most potentialeconomic and social benefits of culinary. The growth in culinaryhas potential contribution towards regional development, Hall andMitchell, 2005[8]. The highlight issues that emerge potential isdestination scale, like Hall also note the importance of movementover time and space outside (destination) of the immediate culinarytourism. By determine socio-demographic, represent marketdevelopment possibilities for the growth of culinary to thepotential foods and goods of consumption, the characteristic’s andthe influence during their day-trip zone.
1. Research Paper Present in Business, Management and Environment: A Comprehensive Study in Asian Economy, International Seminar, Bali, Indonesia Page 11
2. This study was carried out with support of PT Jababeka Tbk, Jababeka, Bekasi, Indonesia, and President University, Jababeka, Bekasi, Indonesia 3. Lecturer at President University, Jababeka, Bekasi, Indonesia

In this global era, the business volume of culinary tourism equalsor even surpasses that of oil exports, food products orautomobiles. Culinary tourism has become one of the major playersin international commerce, and represents at the same time one ofthe main income sources for many developing countries. This growthgoes hand in hand with a increasing diversification and competitionamong destinations. Over decades, culinary and tourism hasexperienced continued growth and deepening diversification tobecome one of the fastest growing economic sectors in the world.Modern culinary tourism is closely linked to development andencompasses growing number of new destinations. These dynamics haveturned culinary tourism into a key driver for socio-economicprogress. Lunch and or dining out is growing form of half ofinformal form and leisure where meals are consumed not out ofnecessity but also important sustainable positioning in ever morecomplex for pleasure and to build a relationships. The occasionsare part of the leisure experiences as much as the food itself.Consumption is integral experience aspect with the consuming notonly the sights and sounds but also the food and the pleasure astheir leisure experiences that they are looking for. Economic developments professionals are searching for the correctrecipe of strategies in induce the greatest gain of chances andchallenges of economic growth benefits. One measure of theirsuccess is defined as an increase or decrease of tourism relative
1. Research Paper Present in Business, Management and Environment: A Comprehensive Study in Asian Economy, International Seminar, Bali, Indonesia Page 12
2. This study was carried out with support of PT Jababeka Tbk, Jababeka, Bekasi, Indonesia, and President University, Jababeka, Bekasi, Indonesia 3. Lecturer at President University, Jababeka, Bekasi, Indonesia

to county. Blair, 1995[2], from the perspective of the economicdevelopment, the community should optimize the combination ofdevelopment strategies into package that will be beneficial tobusinesses, without imposing too high cost on the community. Inother words, the goal of community economic development is todiversify the local economy by engaging in development that resultsin tourism opportunities, Blakeley, 1994[3]. Generally, the processof making a decision about purchase has five phases: a consumerpasses focusing to a problem; search for information; seekingalternatives; decision about the purchase and post-purchasereactions. Grbac and Meler, 2007[6], mention, consumer might skipsome of the decision process steps depending on the level ofcomplication the process. Identified some factors which affect theconsumer during the decision process and pointed out personal,physical and social factors (Zhang T. and D., 2007[15]). Ilak P, andA. Tezak (2009: 296-305[13]) found that a purchase process model inwhich the socio-demographic features affect the consumerssensitivity to quality and price, and finally the motivations andpurchase decision. Although nonmetro areas have enjoyed theeconomic prosperity, but not all nonmetro areas have shared equallyin the economic boom (Gibbs, 2001). Specifically, the most remotenonmetro areas have achieved the same magnitude of economicprosperity as those closer to metro areas (Gibbs, 2001[5]). Also, adivergence still remains between metro and nonmetro areas withrespect to growth by design of differences in population densityand economic base (Gibbs, 2001[5]). Starting thinking fromtraditional economical views, consumers’ behavior during purchaseor looking for unique experience is based on maximizing usage andminimizing costs for a person. Consider to food as a basic need ofeach person is necessity highly ranked comparing to other needs,therefore, it is satisfied first. Masloyljev theory explains thedifference between what we can call a physical/ inherited need andthe learned need which a person gain through social interaction.Taking in mind that these fact, a consumers who buy food want to
1. Research Paper Present in Business, Management and Environment: A Comprehensive Study in Asian Economy, International Seminar, Bali, Indonesia Page 13
2. This study was carried out with support of PT Jababeka Tbk, Jababeka, Bekasi, Indonesia, and President University, Jababeka, Bekasi, Indonesia 3. Lecturer at President University, Jababeka, Bekasi, Indonesia

maximize the use and minimize the the cost (Myung et.al, 2008).Most people, consuming food is a central point of their touristexperiences and an experience in itself (Beer, 2008). To consumeinteresting food in a nice environment is one of the aims of thetourist to stay (Antonoioli-Corigliano, 2000). In thisexperiencing, food is a big role in the destination presentationthat connects to regional activities and finally it increases theincome of the destination facilities such as hotels. As a point ofculinary interest, food is an attactive factor and part of heritageand also an inventive part of the future.
Wisdom Quote
“Dreams Are Renewable. No Matter What Our Age or Condition, There Are Still Untapped Possibilities within Us and New Beauty Waiting To Be Born” (Dale E. Turner)
To take up of the cultural wisdom in any sense we are obliged, we have to consider what has become of it. Entry for wisdom is slightly scanty, has to cometo vanish entirely with the greater density and reticence.
REFERENCES [1] Antonioli-Corigliano M. (2000): Food for tourists – determinants of an image. International Journal of Tourism Research, 2 (4): 281–293. [2] Blair, J.P. (1995). Local Economic Development: Analysis and Practice. Thousand Oaks: Sage. [3] Blakely, E.J. (1994) Planning Local Economic Development: Theory and Practice. Thousand Oaks: Sage. [4] Foxall G.R., Goldsmith R.E., Brown S. (2007): Consumer psychology for marketing. Naklada Slap, Jastrebarsko [5] Gibbs, R. (2001). Nonmetro Labor Markets in the Era of Welfare Reform. Rural America, 16(3) 11-21. [6] Grbac B., Meler M. (2007): Knowledge about consumers: creating determinants of competitive advantage. Ministarstvo gospodarstva,
radai poduzetništva, Zagreb. [7] Hall, C.M. (2005).Tourism: Rethinking the social science of mobility, Harlow: Prentice-Hall. [8] Hall, C.M., & Mitchell, R. (2005). Wine tourism in the Mediterranean: A tool for restructuring and development. [9] MULLINS, P., NATALIE, K., SMITH, P. and SMEATON, B. (1999) Cities and consumption spaces, Urban Affairs Review, 35, pp. 44–71. [10] Myung E., McCool A.C., Feinstein A.H. (2008): Understandingattributes affecting meal choice decisions in a bundling context. International Journal of Hospitality Management, 27 (1):119–125.
1. Research Paper Present in Business, Management and Environment: A Comprehensive Study in Asian Economy, International Seminar, Bali, Indonesia Page 14
2. This study was carried out with support of PT Jababeka Tbk, Jababeka, Bekasi, Indonesia, and President University, Jababeka, Bekasi, Indonesia 3. Lecturer at President University, Jababeka, Bekasi, Indonesia

[11] Sen, Amartya, (1985) . Well-being, Agency and Freedom: The Deway Lectures 1984, The Journal of Philosophy. Vol. 82, No. 4, 169-221. [12] Težak A., Bošković D., Luk N. (2009): Organic food distribution possibilities: case of Istrian tourism market). In: Segetlija Z.,Karić M.
(eds.): VIII. Međunarodni znanstveni skup “Poslovna logistika u suvremenom menadžmentu”, pp. 297–312. Ekonomski fakultet u Osijeku.
[13] WRIGLEY, N. and LOWE, M. (2002) Reading Retail: A Geographical Perspective on Retailing and Consumption Spaces. New York: Oxford
University Press [14] Zhang T., Zhang D. (2007): Agent based simulation of consumer purchase decision making and the decay effect. Journal of Business
Research, 60: 912–922
Fig.4. Research respondents by ages. Fig. 5. 20-24 years old of respondents. Fig. 6. 25-34 years old of respondents.
Fig. 8. 45-54 years old of respondents.
Fig. 9. 55+ years old of respondents Fig. 7. 35-44 years old of respondents
Fig. 10. Respondents which divided by gender. Fig. 11. Male respondents. Fig. 12. Female respondents.
1. Research Paper Present in Business, Management and Environment: A Comprehensive Study in Asian Economy, International Seminar, Bali, Indonesia Page 15
2. This study was carried out with support of PT Jababeka Tbk, Jababeka, Bekasi, Indonesia, and President University, Jababeka, Bekasi, Indonesia 3. Lecturer at President University, Jababeka, Bekasi, Indonesia

Fig. 13. Respondents which divided by education level. Fig. 14. Respondents withhigh school of education. Fig. 15. Respondents with higher of education/university.
Fig. 16. Respondents which divided by Living Area. Fig. 17. Respondents who live in Jababeka. Fig. 18. Respondents who live in Lippo-Cikarang.
Fig. 19. Respondents with Related Activities. Fig. 20. Related Activities Culinary: Lunch Fig. 21. Related ActivitiesCulinary: Dining
1. Research Paper Present in Business, Management and Environment: A Comprehensive Study in Asian Economy, International Seminar, Bali, Indonesia Page 16
2. This study was carried out with support of PT Jababeka Tbk, Jababeka, Bekasi, Indonesia, and President University, Jababeka, Bekasi, Indonesia 3. Lecturer at President University, Jababeka, Bekasi, Indonesia
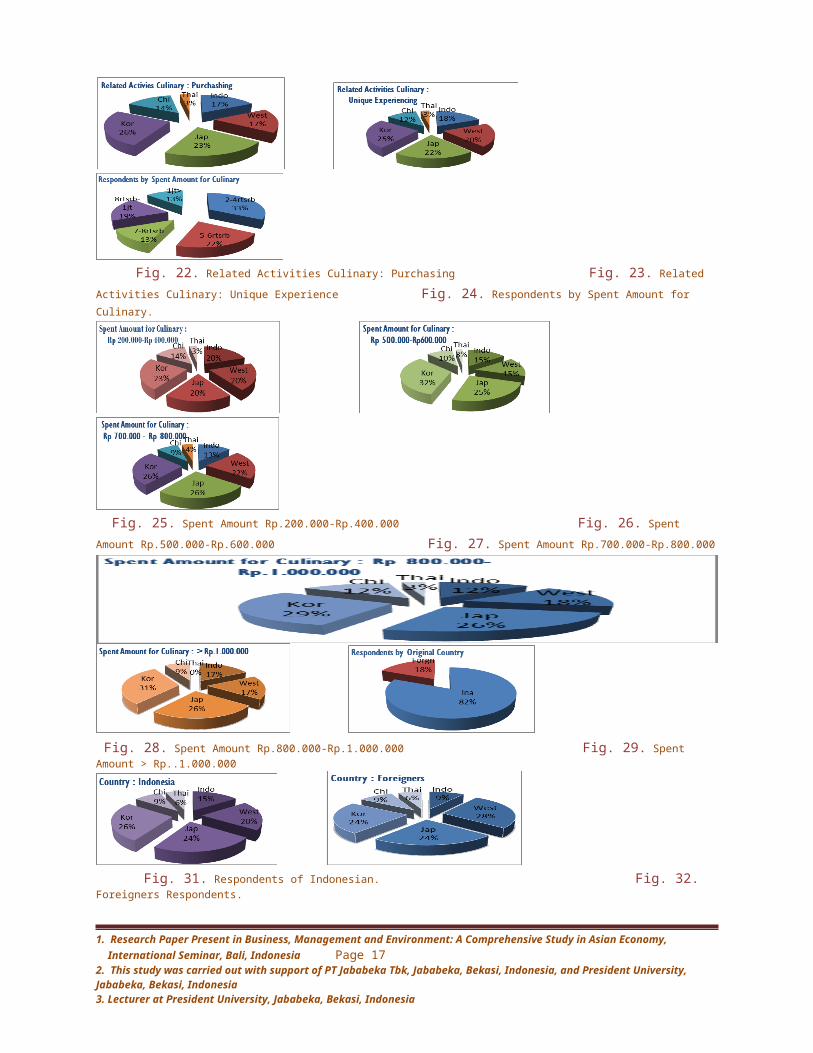
Fig. 22. Related Activities Culinary: Purchasing Fig. 23. Related Activities Culinary: Unique Experience Fig. 24. Respondents by Spent Amount for Culinary.
Fig. 25. Spent Amount Rp.200.000-Rp.400.000 Fig. 26. Spent Amount Rp.500.000-Rp.600.000 Fig. 27. Spent Amount Rp.700.000-Rp.800.000
Fig. 28. Spent Amount Rp.800.000-Rp.1.000.000 Fig. 29. Spent Amount > Rp..1.000.000
Fig. 31. Respondents of Indonesian. Fig. 32. Foreigners Respondents.
1. Research Paper Present in Business, Management and Environment: A Comprehensive Study in Asian Economy, International Seminar, Bali, Indonesia Page 17
2. This study was carried out with support of PT Jababeka Tbk, Jababeka, Bekasi, Indonesia, and President University, Jababeka, Bekasi, Indonesia 3. Lecturer at President University, Jababeka, Bekasi, Indonesia

1. Research Paper Present in Business, Management and Environment: A Comprehensive Study in Asian Economy, International Seminar, Bali, Indonesia Page 18
2. This study was carried out with support of PT Jababeka Tbk, Jababeka, Bekasi, Indonesia, and President University, Jababeka, Bekasi, Indonesia 3. Lecturer at President University, Jababeka, Bekasi, Indonesia