ACTIVE AND REACTIVE POWER CONTROL OF GRID CONNECTED PHOTOVOLTAIC SYSTEM
Upload
independentCategory
view
2download
0
THE ECONOMICS OF GRID-CONNECTED ELECTRICITY PRODUCTION FROM SOLAR PHOTOVOLTAIC SYSTEMS
by
Jean-Baptiste LESOURD and Soo-Uk PARK1
ABSTRACT
This paper analyses the economics of grid-connected photovoltaic systems. With the 2003 costs of photovoltaic systems, under prevailing capital market conditions, with a system lifetime of 30 years, and under the best climatic conditions, it appears that the cost of production of grid-connected electricity could be of 0.28 US $/kWh. Similar values hold for other regions (US locations under medium climatic conditions, European locations, Switzerland and Japan with, in these countries, low costs of capital). If the lifetime of the system goes up, due to future technological improvements, to a very large value such as 50 years, these costs can be lowered by a significant amount, leading to estimates of of 0.24 US $/kWh. Competitiveness of grid-connected photovoltaic electricity, while it still cannot be taken for granted, is a possibility, especially if major technological advances further lowers the costs of photocells and increases their lifetimes. JEL Classification: O3, Q01, Q42. Keywords : Technological change - research and development; sustainable development; alternative energy sources; photovoltaic energy; photovoltaic electricity; solar energy; renewable energy; renewable resource. INTRODUCTION In a previous paper (Lesourd, 2001) we discussed the economics, and future developments of electricity production through photovoltaic technologies, which are, basically, emerging technologies based on silicium or other semiconductors, with major innovations still expected, leading to a long-term decrease in costs. This work aims at examining the possible evolution of long-term forecasts concerning the costs of photocells, in order to assess whether cost decreases due to technical progress and scale effects and the integration of external effects will ultimately lead to competitiveness of these technologies. This paper is organised as follows. Firstly, we discuss the economics of photovoltaic systems. Secondly, we analyse the costs of grid-connected electricity produced from these systems. The results, and major trends are discussed. THE ECONOMICS OF PHOTOVOLTAIC SYSTEMS Industrial applications of electricity production by photovoltaic systems developed only slowly, not earlier than the beginning of the 1970's. This is because throughout the 1970's, photovoltaic electrical energy was still very expensive, with an estimated cost of more than US $ 30/kWh, to be compared to a typical estimated price of US $ 0.10 for residential applications (1975, deflated 2003 US $). These costs have been decreasing a considerably since these early days, as shown by Lesourd (2001) due to technical progress and advances in the physics of semi-conductors such as silicium, and to scale and learning effects in the industrial production of photovoltaic devices. However, these advances seem to level off in the recent years, and the 1 Groupe de Recherche en Economie Quantitative d’Aix-Marseille (GREQAM), Université de la Méditerranée, Marseille, France, and Korea Institute of Energy Research(KIER), Taejon, Korea.
1

question whether it can at all become competitive (at least in the absence of any great technological advance) with respect to conventional fuel power plants has to be raised. At the moment (2004) only off-grid uses of photovoltaic electricity are already economically competitive, especially on remote locations where grid connection would be very costly. Remote village power, refrigeration, water pumping (especially for irrigation), lighting for security and on ships, may be mentioned as examples of such competitive uses, as compared to conventional Diesel engine generators used in such remote locations. Photovoltaic power may also be grid-connected, and thus used as a complement to grid-supplied conventional power. Thus, photovoltaic power production systems may either be isolated, or grid-connected. They may be used in developing countries where conventional utility grid-connected power production is either not available, or deficient, but also in countries where extensive grid-connected power is available. As shown in the previous paper of Lesourd (2001), the economics of photovoltaic systems, and, consequently, the cost of electrical energy produced thereby, depends on several key variables : (1) Capital costs, (I) which are mainly the costs of photocells, usually expressed in US $/Watt-peak ($/Wp); a Watt-peak is defined the power of a cell with an electrical power of 1 Watt submitted to standard sunlight of 1000 W/m2. (2) The equivalent annual time of exposure to sunlight (Ei), sometimes called the irradiance of the system, or the actual quantity of energy received in kWh/KWp (Chabot, 1993). Although the detailed calculations of annual in terms of energy received by m2 of cell surface can be performed and gives rise to complex calculations, it has become customary, in photovoltaic cell economic calculations, to use the annual duration of sunshine (Pulfrey, 1978; Chabot, 1993). This is equal to the total number of hours in a year (8760), multiplied by a load factor, also called the dc capacity factor2. According to Maycock and Stirewalt (1981), for typical US sunbelt conditions, one may expect a (somewhat optimistic) load factor of about 0.27, while the work of Kurosawa et al. (1997) concerning desert areas such as the Great Sandy desert in Australia, implies a load factor of 0.25. According to US DOE estimates (US DOE, 1998), the load factor would be 0.26 for US sunbelt conditions, and 0.20 for average US conditions. For average German conditions, Wiese (1993) assumes a load factor of 0.20. For Japan, Hamakawa (1991) only retain a figure corresponding, however, to a load factor of about 0.15. If L is the load factor as defined above, the equivalent annual duration of sunshine Ei may therefore be expressed as :
Ei = 8760 L (1) (3) The operating costs of the cell, mainly maintenance costs, because the cell uses no marketed fuel whatsoever as a primary energy source. (4) The economic lifetime (T) of the system, which should be equal to its technical lifetime. In many economic assessments of photovoltaic systems, the lifetime which is assumed is 20 years, but, in calculations concerning grid-connected and utility applications, a 30-year lifetime is often assumed, which corresponds to a time horizon also often assumed in conventional
2 An ac capacity factor may also be defined, with respect to the ac electricity production of the system, which typically is smaller than the dc production, in particular because of losses in the dc-ac conversion.
2
electricity generation calculations. Other photovoltaic calculations are performed on the basis of a 25-year lifetime. It is not yet fully proved that the technical duration of photovoltaic systems may reach 30 years or more; although some accelerated duration tests have been carried out, no actual large-scale photovoltaic plant has as yet reached an age of 30 years. Many previous authors assume a 20-year lifetime, but a 30-year lifetime can be thought of as reasonable. An efficiency factor ρ has to be applied to the electricity output calculated; this factor expresses the ratio of effectively available electrical power to the electrical power initially produced. It takes into account various losses occurring with respect to the theoretical dc electricity output, including the efficiency of the dc → ac conversion. This factor is typically 0.85 (Chabot,1993). Let A be the depreciation annuity of capital I, which is a constant if one allows for constant nominal annuities. It is well known that, if i is the suitable discount rate, one has :
A = i i
i
T
T( )
( )1
1 1+
+ − (2)
Let, otherwise, M be the ratio of operating costs to capital costs, assumed to be a constant. Then, the expression for the cost of electrical energy produced is (Chabot, 1993) :
c = IEiρ
(A + M) (3)
It is clear that c is linearly increasing with I, but decreasing with Ei. The value of M, a ratio describing the maintenance expenses with respect to capital costs, may be regarded as approximately constant, and is typically rather small (Chabot, 1993); this reflects of course the factor that photocell devices require little or no maintenance. According to (2), A itself depends on the lifetime of the cell T, and on the rate of discount i. When T → ∞, however, the asymptotic limit of A is the discount rate i itself, so that of course the smaller rate of interest, the smaller the cost c. This asymptotic value is only a rough approximation with usual cell lifetimes, which are 20 years or more. In our base case calculation, we have assumed a lifetime of the investment of 20 years, in agreement with a number of previous authors (although the actual duration of the cells might be higher). However, (3) gives a nominal rather than deflated value, so that it is overestimating c over the whole lifetime of the equipment. There are several ways to avoid that overestimation. One way is to estimate a deflated cost over the lifetime of the equipment, assuming deflated annuities, which amounts to assuming that they are increasing at the rate of inflation in nominal terms. This means that one takes into account for the calculation of the deflated annuities A a real rate of discount r, instead of the nominal rate of discount i, such that :
1 + r = 11
++
in
(4)
where n is the expected rate of inflation.
3
Therefore, one has :
A =r r
r
T
T( )
( )1
1 1+
+ − (5)
The cost equation (3) thus becomes in real terms :
c = IEiρ
( A + M) (6)
Furthermore, if the lifetime T of the system becomes infinite, the limits of, respectively, A and A become exactly equal to the interest or discount rate used in the calculation, which are, respectively, i and r, so that (3) and (6) become, respectively:
c = IEiρ
(i + M) (7)
c = IEiρ
(r + M) (8)
However, with the prevailing long-term costs of capital, and with system lifetimes of 20 to 30 years, these equations would lead to grossly underestimated costs. However, they can be thought of as describing lower limits of costs that would be observed if technological advances result in increasing these lifetimes to at least 50 years. Clearly, one of the features of photovoltaic electricity production is apparently that, unlike fuel-fired conventional plants (whether gas, fuel-oil or coal-fired) there are no fuel costs (at least direct fuel costs); maintenance costs are usually comparatively small, so that the bulk of the costs consists in capital costs. However, this is open to discussion because solar energy is an intermittent source of energy, and variable in intensity, so that the electricity has to be stocked during the day to be available overnight, which is very costly and more than doubles the costs of systems. Another solution to this problem would be to couple a photocell system to a conventional power plant, which is already practiced in the case of solar heat power plants using mirror systems. Electricity storage, if necessary, can be very costly, because of the batteries that have to be used for this purpose. This storage would lead to a system-to-module ratio that can be much higher than the usual ratio without storage (which would roughly be something between 1.5 and 2), reaching values of 3 to 5. In this paper, however, we consider grid-connected systems for which the excess energy produced may be absorbed by the grid, typically at peak hours. In this case, the values given here appear reasonable. Let us now discuss these points in detail. The paper by Lesourd (2001) mentions many sources for historical data for photovoltaic systems, which are only roughly in agreement with each other; so that earlier data are somewhat approximate, because for a long time, the photovoltaic industry had not reached mass production until at least the mid-1980s (Derrick, Barlow, McNelis and Gregory, 1993). Thus, earlier price data concern experimental devices produced in small series. Furthermore, there are
4
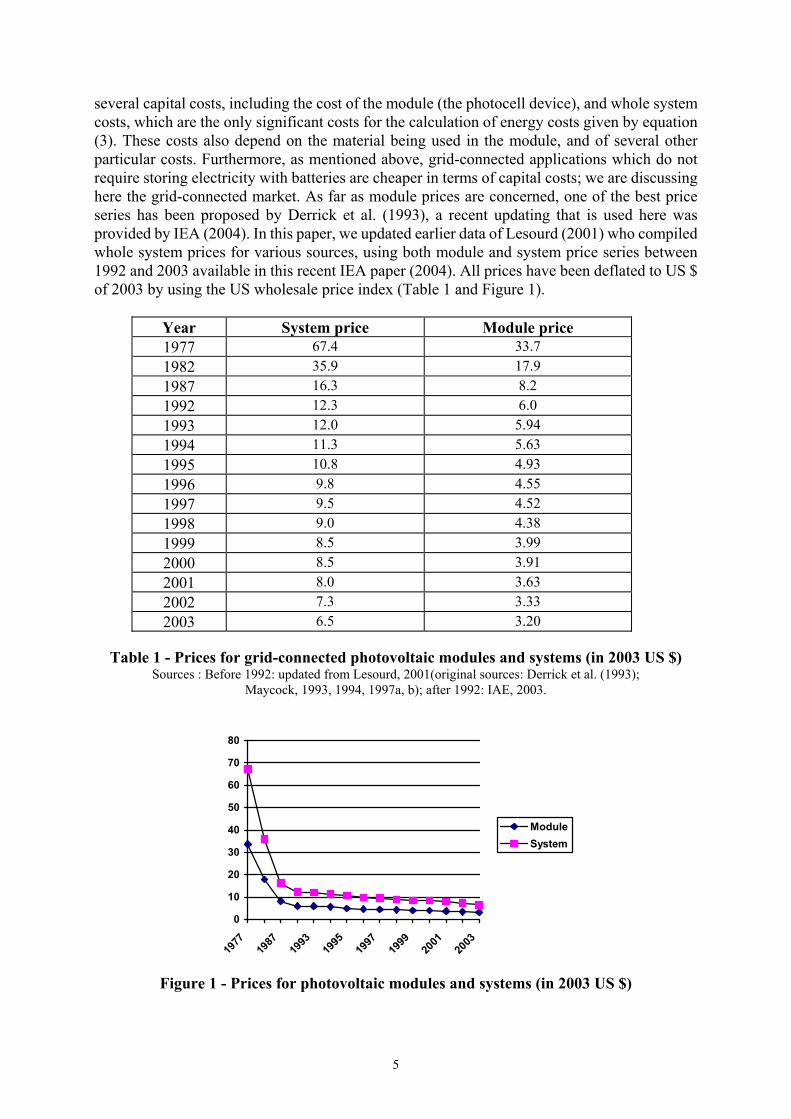
several capital costs, including the cost of the module (the photocell device), and whole system costs, which are the only significant costs for the calculation of energy costs given by equation (3). These costs also depend on the material being used in the module, and of several other particular costs. Furthermore, as mentioned above, grid-connected applications which do not require storing electricity with batteries are cheaper in terms of capital costs; we are discussing here the grid-connected market. As far as module prices are concerned, one of the best price series has been proposed by Derrick et al. (1993), a recent updating that is used here was provided by IEA (2004). In this paper, we updated earlier data of Lesourd (2001) who compiled whole system prices for various sources, using both module and system price series between 1992 and 2003 available in this recent IEA paper (2004). All prices have been deflated to US $ of 2003 by using the US wholesale price index (Table 1 and Figure 1).
Year System price Module price 1977 67.4 33.7 1982 35.9 17.9 1987 16.3 8.2 1992 12.3 6.0 1993 12.0 5.94 1994 11.3 5.63 1995 10.8 4.93 1996 9.8 4.55 1997 9.5 4.52 1998 9.0 4.38 1999 8.5 3.99 2000 8.5 3.91 2001 8.0 3.63 2002 7.3 3.33 2003 6.5 3.20
Table 1 - Prices for grid-connected photovoltaic modules and systems (in 2003 US $)
Sources : Before 1992: updated from Lesourd, 2001(original sources: Derrick et al. (1993); Maycock, 1993, 1994, 1997a, b); after 1992: IAE, 2003.
0
10
20
30
40
50
60
70
80
1977
1987
1993
1995
1997
1999
2001
2003
ModuleSystem
Figure 1 - Prices for photovoltaic modules and systems (in 2003 US $)
5

As already mentioned, there usually is a factor of the order of the order of magnitude of 1.5 to 2 between module price and system price. A factor of 2 was assumed here, following the IEA estimates of 2004, rather than the perhaps too optimistic factor of 1.5 chosen in the previous paper of Lesourd (2001). These figures, updated from the paper by Lesourd (2001) lead to base case estimates of solar electricity costs calculated by applying (3) and (6). In our calculation, we assume a system lifetime of 20 years, a conservative estimate of the technical lifetime of the photocells, as well as a lifetime of 30 years, a more optimistic guess, and an infinite lifetime, which, in practice, can be approximated by a 50-year calculation, still an optimistic and remote possibility; we also assume a nominal 30-year risk-free discount rate of 4.86%, with a risk premium of about 1.5% above the present 30-year US riskless rate, and a deflated discount rate with an expected inflation of 2%, under the present conditions (2004) of American capital markets. Clearly, calculations concerning earlier data using today’s capital market conditions can be thought of as biased, because capital market conditions in the past have been quite different from today’s conditions, at least in nominal terms. Our estimations provide, however, an evolution of electricity costs for comparable capital market conditions, so that the decrease in costs reflects only the decrease in the costs of modules and systems. With a load factor of 0.25, following Kurosawa (1997), Ei = 2,200 hours/year, which corresponds to some of the best climatic conditions (deserts or semi-arid Mediterranean climates, such as Southern Spain, Southern Italy, Crete, sunbelt locations in the USA, Arizona, New Mexico or Mojave desert…, many Australian locations) and ρ = 0.85, following Chabot (1993). We also assume a maintenance cost factor M of about 0.005, also according to Chabot (1993), a conservative estimate, less optimistic than the one given by the US National Association of Regulatory Utility Commissioners (1991).
Nominal cost [c, Equation (2)] Deflated cost [c, Equation (5)] Year T = 20 years T = 30 years T = ∞ T = 20 years T = 30 years T = ∞ 1977 3.41 2.89 2.47 2.91 2.35 1.77 1982 1.82 1.54 1.32 1.55 1.25 0.94 1987 0.82 0.70 0.60 0.70 0.57 0.43 1992 0.62 0.53 0.45 0.53 0.43 0.32 1993 0.61 0.52 0.44 0.52 0.42 0.31 1994 0.57 0.48 0.41 0.49 0.39 0.29 1995 0.54 0.46 0.39 0.46 0.38 0.28 1996 0.49 0.42 0.36 0.42 0.34 0.26 1997 0.48 0.41 0.35 0.41 0.33 0.25 1998 0.46 0.39 0.33 0.39 0.31 0.24 1999 0.43 0.37 0.31 0.37 0.30 0.22 2000 0.43 0.37 0.31 0.37 0.30 0.22 2001 0.40 0.34 0.29 0.35 0.28 0.21 2002 0.37 0.31 0.27 0.31 0.25 0.19 2003 0.33 0.28 0.24 0.28 0.23 0.17
Table 2 - Base-case costs for grid-connected photovoltaic electricity (2003 US $)
(Our calculation with the above sets of parameters, corresponding to American capital market conditions (30-year nominal risk-free interest rate of 4.84%, risk premium of 1.5%, expected inflation of 2%, with a load factor of
about 0.25, meaning an equivalent annual sunshine period of 2,200 hours/year)
6
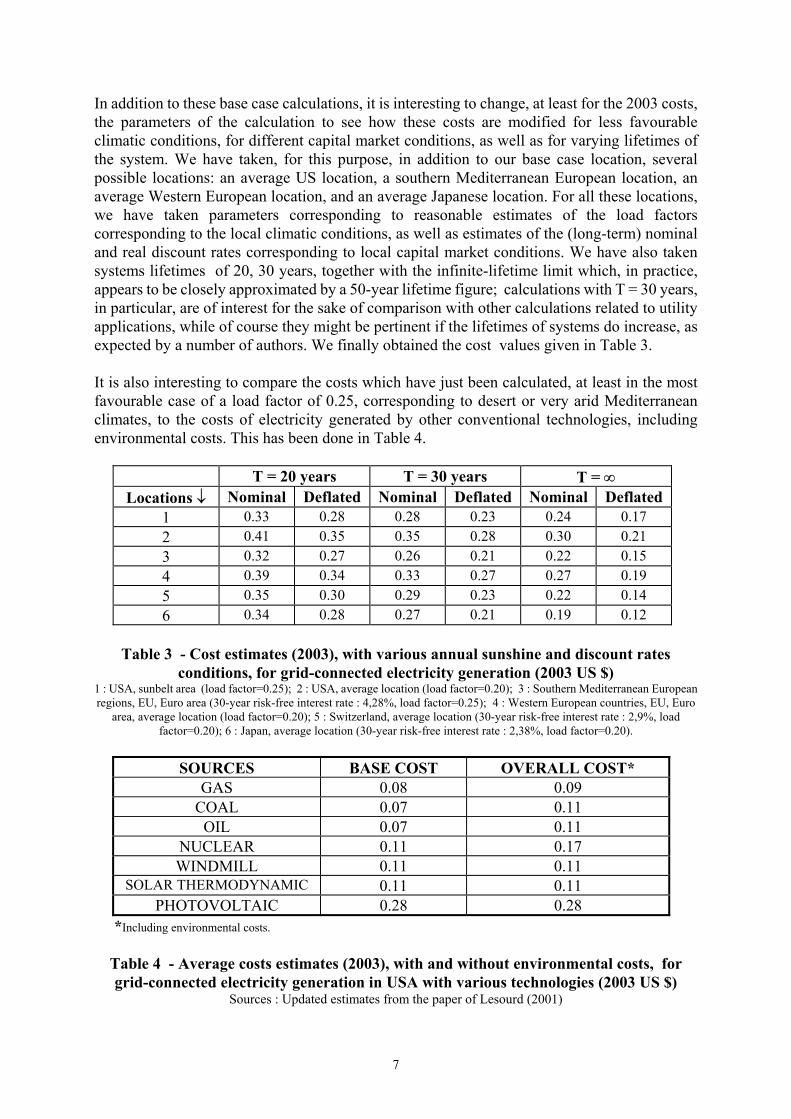
In addition to these base case calculations, it is interesting to change, at least for the 2003 costs, the parameters of the calculation to see how these costs are modified for less favourable climatic conditions, for different capital market conditions, as well as for varying lifetimes of the system. We have taken, for this purpose, in addition to our base case location, several possible locations: an average US location, a southern Mediterranean European location, an average Western European location, and an average Japanese location. For all these locations, we have taken parameters corresponding to reasonable estimates of the load factors corresponding to the local climatic conditions, as well as estimates of the (long-term) nominal and real discount rates corresponding to local capital market conditions. We have also taken systems lifetimes of 20, 30 years, together with the infinite-lifetime limit which, in practice, appears to be closely approximated by a 50-year lifetime figure; calculations with T = 30 years, in particular, are of interest for the sake of comparison with other calculations related to utility applications, while of course they might be pertinent if the lifetimes of systems do increase, as expected by a number of authors. We finally obtained the cost values given in Table 3. It is also interesting to compare the costs which have just been calculated, at least in the most favourable case of a load factor of 0.25, corresponding to desert or very arid Mediterranean climates, to the costs of electricity generated by other conventional technologies, including environmental costs. This has been done in Table 4.
T = 20 years T = 30 years T = ∞ Locations ↓ Nominal Deflated Nominal Deflated Nominal Deflated
1 0.33 0.28 0.28 0.23 0.24 0.17 2 0.41 0.35 0.35 0.28 0.30 0.21 3 0.32 0.27 0.26 0.21 0.22 0.15 4 0.39 0.34 0.33 0.27 0.27 0.19 5 0.35 0.30 0.29 0.23 0.22 0.14 6 0.34 0.28 0.27 0.21 0.19 0.12
Table 3 - Cost estimates (2003), with various annual sunshine and discount rates
conditions, for grid-connected electricity generation (2003 US $) 1 : USA, sunbelt area (load factor=0.25); 2 : USA, average location (load factor=0.20); 3 : Southern Mediterranean European regions, EU, Euro area (30-year risk-free interest rate : 4,28%, load factor=0.25); 4 : Western European countries, EU, Euro
area, average location (load factor=0.20); 5 : Switzerland, average location (30-year risk-free interest rate : 2,9%, load factor=0.20); 6 : Japan, average location (30-year risk-free interest rate : 2,38%, load factor=0.20).
SOURCES BASE COST OVERALL COST*
GAS 0.08 0.09 COAL 0.07 0.11
OIL 0.07 0.11 NUCLEAR 0.11 0.17 WINDMILL 0.11 0.11
SOLAR THERMODYNAMIC 0.11 0.11 PHOTOVOLTAIC 0.28 0.28
*Including environmental costs.
Table 4 - Average costs estimates (2003), with and without environmental costs, for grid-connected electricity generation in USA with various technologies (2003 US $)
Sources : Updated estimates from the paper of Lesourd (2001)
7
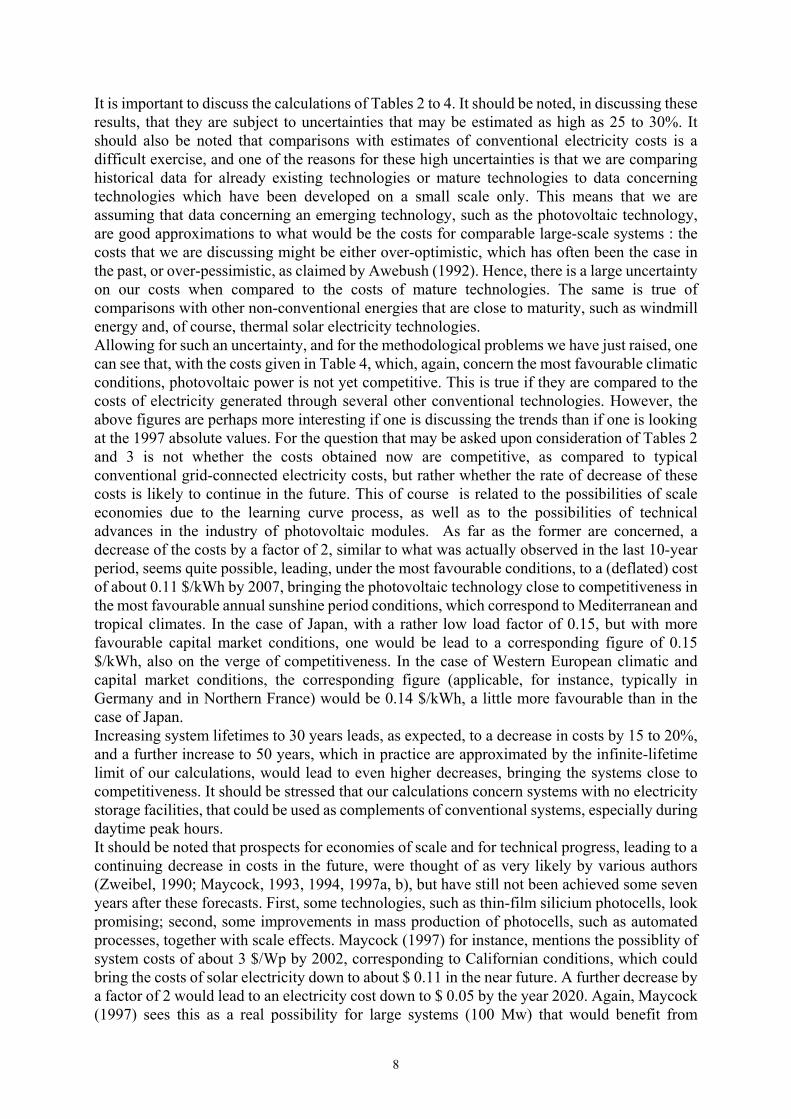
It is important to discuss the calculations of Tables 2 to 4. It should be noted, in discussing these results, that they are subject to uncertainties that may be estimated as high as 25 to 30%. It should also be noted that comparisons with estimates of conventional electricity costs is a difficult exercise, and one of the reasons for these high uncertainties is that we are comparing historical data for already existing technologies or mature technologies to data concerning technologies which have been developed on a small scale only. This means that we are assuming that data concerning an emerging technology, such as the photovoltaic technology, are good approximations to what would be the costs for comparable large-scale systems : the costs that we are discussing might be either over-optimistic, which has often been the case in the past, or over-pessimistic, as claimed by Awebush (1992). Hence, there is a large uncertainty on our costs when compared to the costs of mature technologies. The same is true of comparisons with other non-conventional energies that are close to maturity, such as windmill energy and, of course, thermal solar electricity technologies. Allowing for such an uncertainty, and for the methodological problems we have just raised, one can see that, with the costs given in Table 4, which, again, concern the most favourable climatic conditions, photovoltaic power is not yet competitive. This is true if they are compared to the costs of electricity generated through several other conventional technologies. However, the above figures are perhaps more interesting if one is discussing the trends than if one is looking at the 1997 absolute values. For the question that may be asked upon consideration of Tables 2 and 3 is not whether the costs obtained now are competitive, as compared to typical conventional grid-connected electricity costs, but rather whether the rate of decrease of these costs is likely to continue in the future. This of course is related to the possibilities of scale economies due to the learning curve process, as well as to the possibilities of technical advances in the industry of photovoltaic modules. As far as the former are concerned, a decrease of the costs by a factor of 2, similar to what was actually observed in the last 10-year period, seems quite possible, leading, under the most favourable conditions, to a (deflated) cost of about 0.11 $/kWh by 2007, bringing the photovoltaic technology close to competitiveness in the most favourable annual sunshine period conditions, which correspond to Mediterranean and tropical climates. In the case of Japan, with a rather low load factor of 0.15, but with more favourable capital market conditions, one would be lead to a corresponding figure of 0.15 $/kWh, also on the verge of competitiveness. In the case of Western European climatic and capital market conditions, the corresponding figure (applicable, for instance, typically in Germany and in Northern France) would be 0.14 $/kWh, a little more favourable than in the case of Japan. Increasing system lifetimes to 30 years leads, as expected, to a decrease in costs by 15 to 20%, and a further increase to 50 years, which in practice are approximated by the infinite-lifetime limit of our calculations, would lead to even higher decreases, bringing the systems close to competitiveness. It should be stressed that our calculations concern systems with no electricity storage facilities, that could be used as complements of conventional systems, especially during daytime peak hours. It should be noted that prospects for economies of scale and for technical progress, leading to a continuing decrease in costs in the future, were thought of as very likely by various authors (Zweibel, 1990; Maycock, 1993, 1994, 1997a, b), but have still not been achieved some seven years after these forecasts. First, some technologies, such as thin-film silicium photocells, look promising; second, some improvements in mass production of photocells, such as automated processes, together with scale effects. Maycock (1997) for instance, mentions the possiblity of system costs of about 3 $/Wp by 2002, corresponding to Californian conditions, which could bring the costs of solar electricity down to about $ 0.11 in the near future. A further decrease by a factor of 2 would lead to an electricity cost down to $ 0.05 by the year 2020. Again, Maycock (1997) sees this as a real possibility for large systems (100 Mw) that would benefit from
8
economies of scale. Under Japanese conditions, Hamakawa (1991) is led to favourable forecasts, more optimistic, but in agreement with what we have been calculating under Japanese capital market conditions. Here, the low interest rates that prevail in Japan are favourable to the calculation for that country. Thus, if these technological advances and industrial scale cost reduction are to be confirmed, grid-connected photovoltaic power could reach competitiveness in 20 years or even less. It is indispensable to view this future evolution of the costs and of the technologies of photovoltaic generation as related to the development of the photovoltaic industry, because of learning effects and of scale effects in this industry. Therefore, the main characteristics of this industry and its possible future will be described in the next paragraph. A further decrease of photovoltaic modules and systems costs by another factor of 3-4, leading the system costs to about 1.5-2 $/Wp, although uncertain, would enhance the competitiveness of photovoltaic electricity generation, with electricity costs of 0.06 to 0.10 $/kWh. This would give a clear edge of competitiveness to photovoltaic electricity generation over some conventional thermal electricity generation technologies. This competitiveness would, furthermore, concern not only the regions of the world with suitable climatic conditions, such as the mediterranean and tropical regions, with an annual sunshine of about 2,200 hours/year, but also some temperate regions with a smaller annual sunshine of about 1,500 hours/year. However, there might be problems of electricity storage if photovoltaic systems are to be used at a large scale, and in the past, some of the forecasts that have been made have proved really over-optimistic. However, this cost decrease stands as a possibility by year 2020. We also note that, according to previous work (Bloss and Pfisterer, 1993), “considerable cost reductions, down to values < 1 $/Wp, seem to be only possible by a real technological breakthrough…”. This statement still seems to be true. Furthermore, the economic feasibility of large-scale production of photovoltaic modules is not yet fully proved, because the photovoltaic industry now uses cheap silicium and other materials’ scraps, which might not be feasible at a larger scale of production (see also Bloss and Pfisterer, 1993). CONCLUSION In this paper, we updated previous results of Lesourd (2001), providing an equation for the calculation of photovoltaic electricity costs which is a real-term or deflated version of the equation proposed by Chabot (1973), and previous authors. We applied this equation to a base-case concerning the United States under the best climatic conditions US sunbelt states and deserts), which leads to an estimate of 0.28 $/kWh, still far from competitiveness with a 30-year lifetime. Under several other hypotheses concerning the climatic conditions, that range from the best sun exposition conditions observed in desert or Mediterranean sunbelt areas of the United States, southern Europe and Australia to less favourable conditions typically observed in the rest of Western Europe, Northern American states such as New England States, and Japan. We also carried out several simulations under various capital market conditions, which is important inasmuch as the photovoltaic electricity industry would be a capital-intensive industry, in which costs would essentially be capital and maintenance costs. Our conclusion concerning the costs of photovoltaic electricity production for grid-connected systems is that they now range, in deflated terms, between 0.21 $/kWh (sunbelt areas of Europe and the USA, countries with less favourable climates but with better capital market conditions such as Japan), and 0.28 $/kWh (less favourable climatic conditions in the USA). A division by a factor of 3-4 of the cost of photovoltaic modules and systems, bringing these costs to about 2 $/Wp, would divide by half these figures, thus bringing photovoltaic electricity production close to competitiveness with a cost of less than 0.10 $/kWh in the best locations (sunbelt
9
Mediterranean, desert or tropical areas), could bring photovoltaic grid-connected electricity production on the verge of competitiveness. These reductions, that would trigger an acceleration of the growth of the market, are possible, but still uncertain in the foreseeable future. However, a clear edge of competitiveness could be achieved only through further reduction of costs of photovoltaic modules, bringing the costs of systems down to about 1 $/Wp. Here, there is still some uncertainty as to the possibility of such cost reductions, knowing that in the past many of the forecasts have proved over-optimistic. BIBLIOGRAPHY
S. Awerbush, Determining a Bid Price for PV-Generated Electricity under an IPP Agreement, Report, Sandia Laboratory, March 1992. J.R. Bates, D.K. Munro and H. Barnes, Photovoltaic Power Systems in Selected IEA Members Countries, Proceedings of the 14th European Photovoltaic Solar Energy Conference Held in Barcelona, Spain, 30 June- 4 July 1997, H.S. Stevens Associates, Bedford, UK, 1997, pp. 865-868. W.H. Bloss and F. Pfisterer, Photovoltaic Systems, in M. Palfy (Ed.), Proceedings of the ISES World Congress, Budapest, 1993, Volume 3. Photovoltaic Systems, pp. 35-49, especially p. 46. B. Chabot, Analyse économique des filières d’énergie solaire, Sommet Solaire Mondial, UNESCO, Paris, July 1993. A. Derrick, R.W. Barlow, B. McNelis, and J.A. Gregory, Photovoltaics : A Market Overview, James-James, London, 1993. Ch. Flavin and N. Lenssen, Power Surge : Guide to the Coming Energy Revolution, Norton and Co., New-York, 1994. Y. Hamakawa, Sunshine Project and Recent Progress in Photovaoltaic Technology in Japan, Proceedings of the Tenth EC Photovoltaic Solar Conference held at Lisbon, Portugal, 8-12 April 1991. Kluwer, Dordrecht, 1991, pp. 1375-1380. International Energy Agency, Added Values of Photovoltaic Power Systems, Report IEA PVPS T1-09, IEA, Paris, 2001. IEA, Trends in Photovoltaic Applications: Survey Report of Selected IEA Countries between 1992 and 2003. Report IEA PVPS T-13, IEA, Paris, 2004. K. Kurosawa, T. Takashima, T. Hirasawa, T. Kichimi, T. Imura, T. Nishioka, H. Iitsuka, and N. Tashiro, Case Studies of Large-Scale PV systems in Desert Areas of the World, Solar Energy Materials and Solar Cells, 47, 1997, pp. 189-196. J.B. Lesourd, Quelles politiques économiques pour le développement du solaire ? Le cas de l’électricité. Stratégies Energétiques, Biosphère et Sociéte, 1995, pp. 53-59. J.B. Lesourd, Solar Photovoltaic Systems : the economics of a renewable energy resource. Environmental Modelling and Software, 16 (2), 2001, pp. 147-156. P. Maycock and E. N. Stirewalt, Photovoltaics : Sunlight to Electricity in One Step, Brick House, New-York, 1981. Maycock, P., 1993, PV Efficiencies to Rise Sharply. Costs to Crumble by 2010. The Solar Letter, 23 July 1993. Maycock, P., 1994. 1993 Module Shipments, Photovoltaic News, February 1994. P. Maycock, The Impact of Cost Reduction in PV Manufacturing and New Thin Film Plants on Grid-Connected and Building-Integrated Markets, Proceedings of the 14th European Photovoltaic Solar Energy Conference Held in Barcelona, Spain, 30 June- 4 July 1997, H.S. Stevens Associates, Bedford, UK, 1997, Vol. 1, pp. 869-872; P. Maycock, Cost Reduction in
10
PV Manufacturing. Impact on grid-connected and building-integrated markets, Solar Energy Materials and Solar Cells, 47, 1997, pp. 37-45. R.A. Meyers (Editor), Handbook of Energy Technology and Economics, Wiley, New-York, 1983. National Association of Regulatory Utility Commissioners, (NARUC), Electric Power Technology. Options for Utility Generation and Storage, Staff Paper, Technology Subcommitte, Finance and Technology Committee, February 1991. M. Palfy (Ed.), Proceedings of the ISES World Congress, Budapest, 1993, Volume 3. Photovoltaic Systems. D.L. Pulfrey, Photovoltaic Power Generation, Van Nostrand, New-York, 1978. A. Ricaud, Les modules photovoltaiques. Evaluation et prospective, Acts, Journée du CUEPE 1997, University of Geneva, Geneva, Switzerland, 30 October 1997, pp. 75-90. UNSEGED (United Nations Solar Energy Group on Environment and Development), Solar Energy : A Strategy in Support of Environment and Development. A Comprehensive Analytical Study on Renewable Sources of Energy, Report, UNSEGED, October, 1991. US DOE (US Department of Energy), Utility Flat-Plate Thin Film Photovoltaics, Working Paper, 1998. A. Wiese, Photovoltaic Electricity Generation in Germany. Potential, Costs, Implementation Strategies, in M. Palfy (Ed.), Proceedings of the ISES World Congress, Budapest, 1993, Volume 3. Photovoltaic Systems, pp.89-95. K. Zweibel, Harnessing Solar Power : The Photovoltaics Challenge, Plenum Publishing, New-York, 1990.
11
Copyright © 2022 FDOKUMEN