Listening, connected, committed to… - AnnualReports.com
140
Listening, connected, committed to… Annual Report 2007
-
Upload
khangminh22 -
Category
Documents
-
view
1 -
download
0
Transcript of Listening, connected, committed to… - AnnualReports.com

Xerox Annual Report 2007 2
Listening, connected, committed to…
Annual Report 2007

Accelerating the adoption of color. Driving The New Business of Printing.® Expanding participation in small and medium businesses.Leading with services.
These are the priorities we focus on every day.
And as important as they are, they are no more than a means to our ultimate priority: you.
In business today, especially our business, making it personal makes a difference in the value we bring to you. For us that means creating a great experience for you, our customer… delivering greater returns for you, our shareholder… and acting responsibly as a corporate citizen for you, our stakeholders and employees who expect nothing less.
We listen. We’re connected. We’re committed.To you.
Xerox Annual Report 2007 1
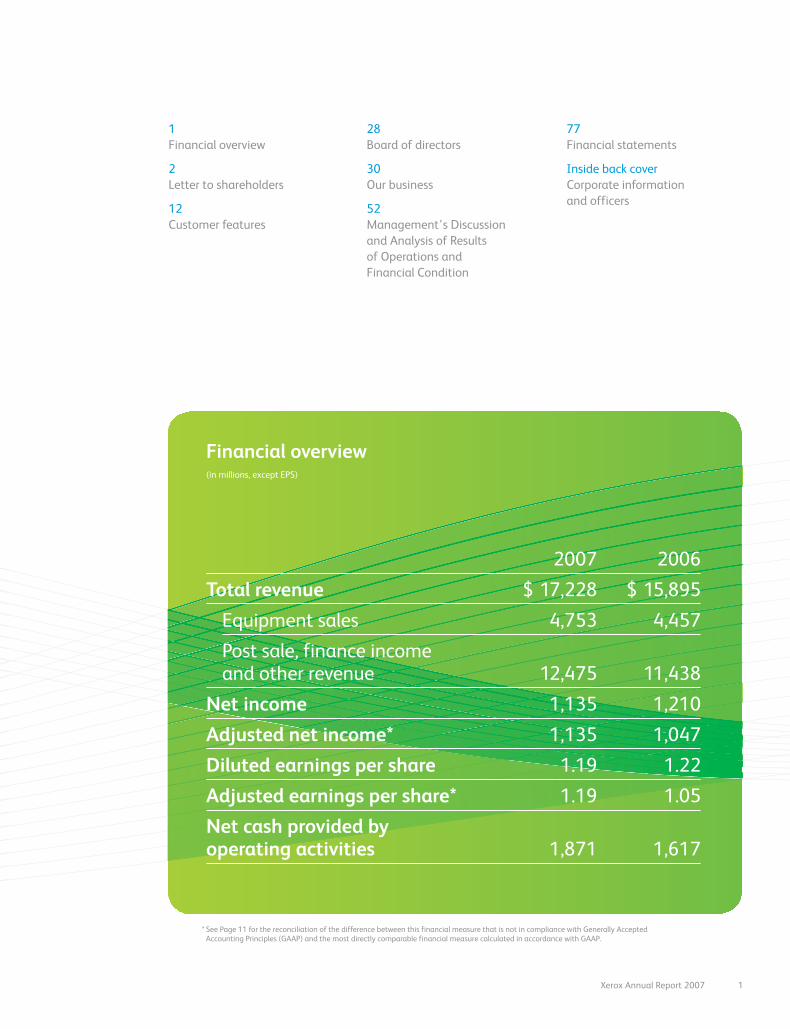
Financial overview(in millions, except EPS)
2007 2006
Total revenue $ 17,228 $ 15,895
Equipment sales 4,753 4,457
Post sale, finance income and other revenue 12,475 11,438
Net income 1,135 1,210
Adjusted net income* 1,135 1,047
Diluted earnings per share 1.19 1.22
Adjusted earnings per share* 1.19 1.05
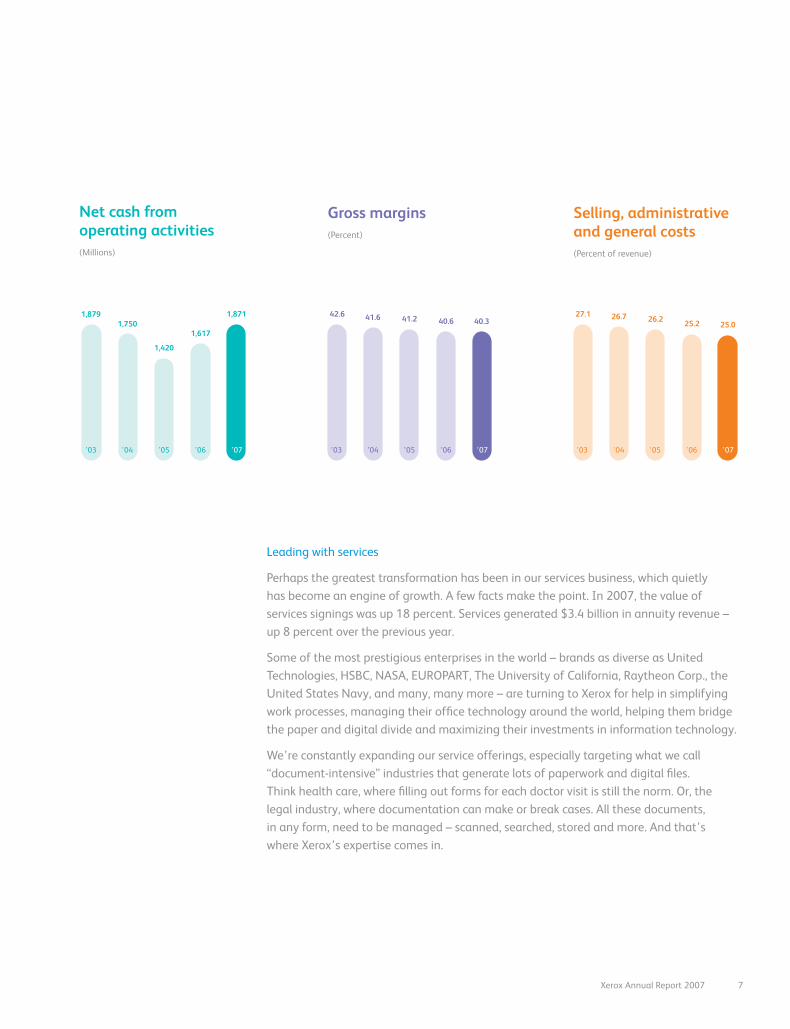
Net cash provided by operating activities 1,871 1,617
* See Page 11 for the reconciliation of the difference between this financial measure that is not in compliance with Generally Accepted Accounting Principles (GAAP) and the most directly comparable financial measure calculated in accordance with GAAP.
77
Financial statements
Inside back cover
Corporate information
and officers
28
Board of directors
30
Our business
52
Management’s Discussion
and Analysis of Results
of Operations and
Financial Condition
1
Financial overview
2
Letter to shareholders
12
Customer features
2
Fellow shareholders:
Our results included:
Net income of $1.1 billion.
Earnings per share of $1.19, which compares to 2006 earnings per share of
$1.22. On an adjusted basis, our earnings per share grew 13 percent in 2007*.
Operating cash flow of $1.9 billion.
Total revenue of $17.2 billion, an increase of $1.3 billion or 8 percent. Excluding
the benefit of our acquisition of Global Imaging Systems, which we purchased in
May last year, revenue was up 4 percent in 2007*.
Investments in strategic acquisitions totaling $1.6 billion.
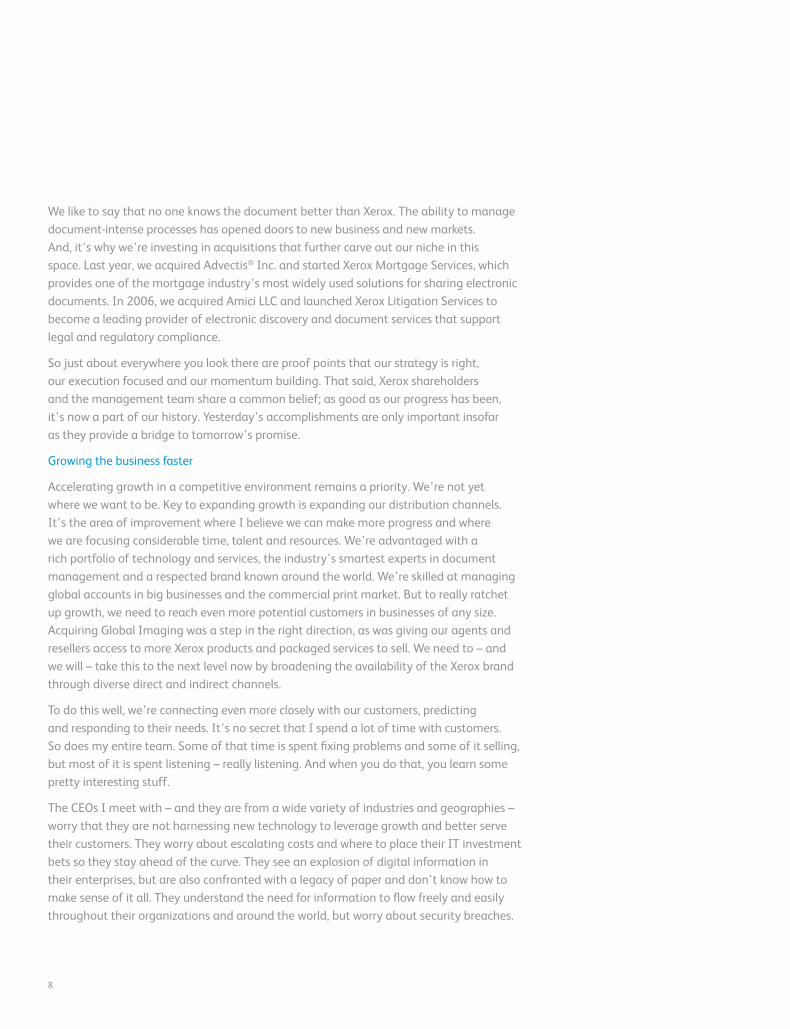
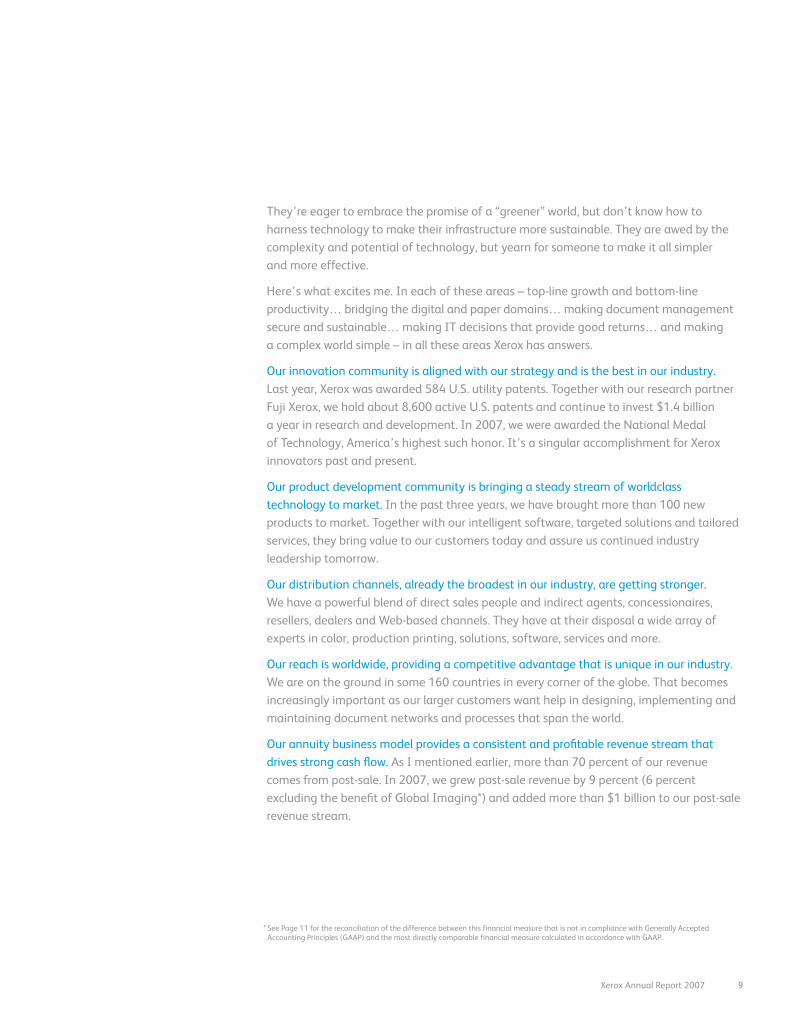
And disciplined cost management that kept our gross margins and selling,
administrative and general costs right in line with our business model.
At the same time, we continued to take steps to build shareholder value. All the
credit rating agencies rank us as investment grade. We reinstated a dividend. We
repurchased $631 million in Xerox stock, bringing the total repurchased since 2005
to $2.1 billion. And, as we entered 2008, our Board of Directors authorized the
repurchase of an additional $1 billion of Xerox stock.
We feel good about the state of our business. And, we know that consistently delivering
double-digit earnings per share growth and strong operating cash flow make for the
best long-term investment. It’s a value proposition we’re strengthening every day.
* See Page 11 for the reconciliation of the difference between this financial measure that is not in compliance with Generally Accepted Accounting Principles (GAAP) and the most directly comparable financial measure calculated in accordance with GAAP.
I am pleased to report that 2007 was
another year of steady and solid progress –
a year in which we continued to strengthen
the company financially, invest in growth,
and win in the marketplace.

Xerox Annual Report 2007 3
The numbers, as they say, speak for themselves but they don’t tell the entire story.
Turnarounds are easy to track and to talk about; transformations evolve more slowly
and are harder to define. Over the past several years – step by step and brick by
brick – we have built a new Xerox.
I believe we are at an inflection point. We have evolved into a services-led technology
company that is known for innovation and customer focus. We help manage the
massive flow of information and communication in businesses today. We’re a content
management provider and a trusted partner that can help our customers make the
most of their IT infrastructure and bridge the paper and digital worlds.
The Xerox once known for copiers, printers and paper has greatly expanded its footprint.
New technology and services offerings are generating billions of dollars in recurring
revenue for us.
We’ve made some critical strategic bets in the past few years that are now differentiating
Xerox in the marketplace and fueling our growth. We invested heavily in color, determined
to be the market leader. We coined the term “The New Business of Printing” and vowed
to bring digital technology to what was largely the province of offset or lithographic
printing. We also invested in technology and distribution to aggressively attack the office
market and expand the business we do with small and mid-size companies. And we vowed
to become a services-led partner in large enterprises.
I’m not given to exaggeration or hyperbole, but I feel strongly that we have achieved
considerable success on all four fronts.
4
Accelerating the adoption of color
We’ve led the transition to color from top to bottom across the markets we serve – color
that’s both the highest quality and highly affordable. Last year, more than 40 billion
pages were printed on Xerox color systems. That’s an increase of 31 percent over 2006
and way ahead of our competitors. In fact, according to estimates by InfoTrends, a
leading independent research firm, Xerox accounts for half of the total worldwide color
pages printed by high-speed digital systems.
And, for us, the power really is in the pages. We operate an annuity-based business
with more than 70 percent of our total revenue coming from recurring revenue streams,
what we call our “post sale.” This includes interest income from financing our customers’
purchases; service, such as technical support as well as consulting and outsourcing
services; and supplies, like ink, paper and toner. The latter is why pages are so important
to our business. Post-sale revenue from color pages was up 18 percent year-over-year,
so we know the model is working. As that continues to grow, so will Xerox.
Color now accounts for about 39 percent of our total revenue, but only 12 percent of our
total pages (excluding the benefit of Global Imaging Systems) – indicating a tremendous
growth opportunity that we’re well positioned to mine. Last year, we shook up the
marketplace by launching an office printer that makes the cost of printing a color page
as affordable as black and white. It’s the Phaser® 8860 and it uses our proprietary solid
ink, cartridge-free technology, minimizing the impact on the environment. We announced
18 color products in 2007, strengthening what is already the industry’s broadest portfolio
of digital color printing systems. Look for more worldclass color technology this year –
technology that promises to widen our significant competitive advantage and generates
the pages that boost our annuity.
We’ve made some critical strategic
bets in the past few years that are now
differentiating Xerox in the marketplace
and fueling our growth.
Xerox Annual Report 2007 5
Driving The New Business of Printing®
Our leadership in digital high-volume printing complements traditional offset printing.
This market transition is The New Business of Printing. The opportunity for digital
production printing is about $25 billion, and Xerox’s advantages are the ability to print
on demand, produce short runs of books, and customize each and every document that
comes off a digital press. In The New Business of Printing, the Xerox iGen3® Digital
Production Press continues to be the star performer, but it has a great supporting cast.
We’ve now installed more than 2,000 iGen3s around the world. Many customers – 126
to be precise – are printing more than a million pages a month on these market-making
marvels. Perhaps the best testimony to their success is that 275 of our customers, many
of whom run commercial print shops, have purchased at least two iGen3s and have seen
their business soar by offering more digital printing capabilities.
At the same time, we’re seeing accelerated demand for the high end of our DocuColor®
series and the recently launched Xerox Nuvera® systems. We’re going after the continuous
feed market with new technology that redefines the industry standards of speed and
quality and gives us a competitive advantage. And we’re partnering with photo imaging
companies to use Xerox technology for printing photo applications. In fact, if you order
a photo calendar from a retailer that works with Fujifilm, the calendar will be printed
on a Xerox press using Xerox paper. As Xerox leads advancements in quality for digital
printing, the lines are blurring between the traditional photo imaging business and
document processing. InfoTrends predicts the specialty photo printing market – that’s
calendars, greeting cards and photo books – will grow at a rate of 24.5 percent per
year through 2010, reaching $800 million. Xerox is well on its way to capturing a good
share of this growth.
Last year, more than 40 billion pages
were printed on Xerox color systems,
an increase of 31 percent and way
ahead of competitors.
6
Expanding participation in small/medium businesses
We also see great opportunity in the office market where we’re investing heavily to
win. In 2007, we launched 29 office products that garnered 190 industry awards and
broadened and deepened our offerings in this highly competitive market.
At the same time, we acquired Global Imaging Systems, which immediately put some
1,400 new sales people on the street and brought more than 200,000 new customers
into the Xerox fold. The acquisition has exceeded our expectations and then some.
One year ago, this billion-dollar enterprise sold NO Xerox products. By year’s end,
50 percent of the document technology Global Imaging was selling carried the Xerox
brand and it is getting better every month.
In addition, much of Xerox’s 11 percent growth in developing markets has been fueled
by small and mid-size businesses (SMB). We’ve been increasingly building a competitive
portfolio of products and services that cater directly to the fast-growing SMB market.
We’re making inroads with today’s small businesses that may be tomorrow’s large
enterprises. Xerox wants to be with them every step of the way.
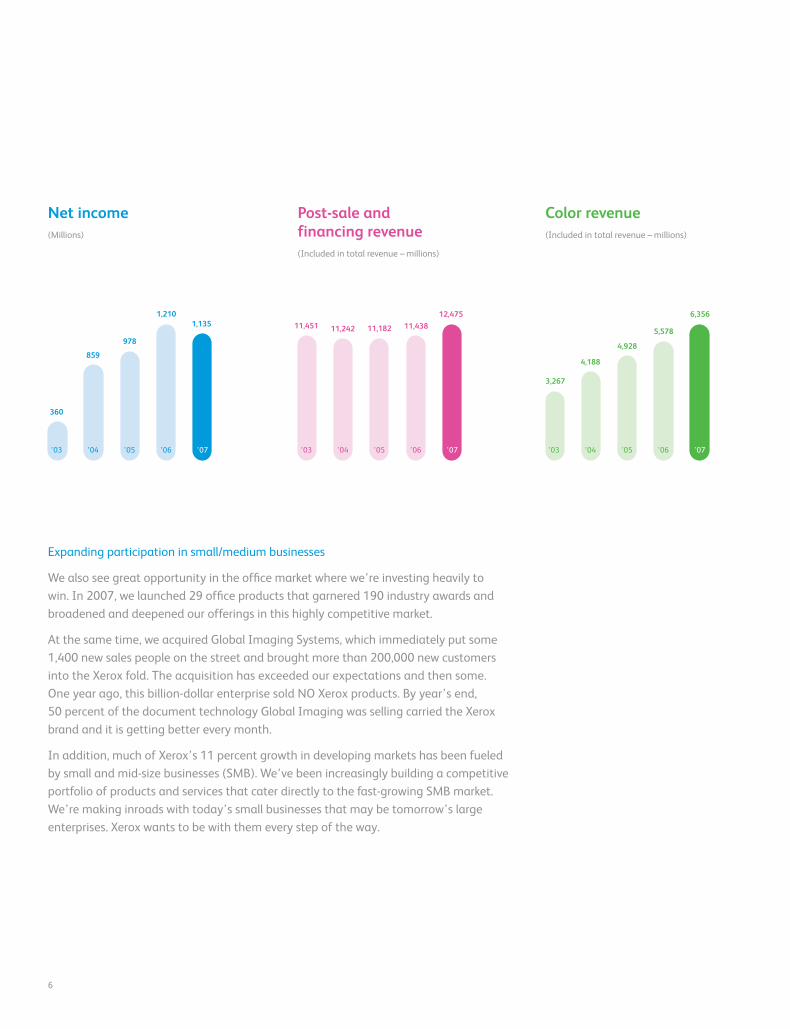
11,451 11,242 11,182 11,43812,475
’03 ’04 ’05 ’06 ’07
Post-sale and financing revenue(Included in total revenue – millions)
’03 ’04 ’05 ’06 ’07
3,267
4,188
4,928
5,578
6,356
Color revenue(Included in total revenue – millions)
360
859
978
1,2101,135
’03 ’04 ’05 ’06 ’07
Net income(Millions)
Xerox Annual Report 2007 7
Leading with services
Perhaps the greatest transformation has been in our services business, which quietly
has become an engine of growth. A few facts make the point. In 2007, the value of
services signings was up 18 percent. Services generated $3.4 billion in annuity revenue –
up 8 percent over the previous year.
Some of the most prestigious enterprises in the world – brands as diverse as United
Technologies, HSBC, NASA, EUROPART, The University of California, Raytheon Corp., the
United States Navy, and many, many more – are turning to Xerox for help in simplifying
work processes, managing their office technology around the world, helping them bridge
the paper and digital divide and maximizing their investments in information technology.
We’re constantly expanding our service offerings, especially targeting what we call
“document-intensive” industries that generate lots of paperwork and digital files.
Think health care, where filling out forms for each doctor visit is still the norm. Or, the
legal industry, where documentation can make or break cases. All these documents,
in any form, need to be managed – scanned, searched, stored and more. And that’s
where Xerox’s expertise comes in.
Selling, administrative and general costs(Percent of revenue)
27.1 26.7 26.2 25.2 25.0
’03 ’04 ’05 ’06 ’07
Net cash from operating activities(Millions)
1,8791,750
1,420
1,617
1,871
’03 ’04 ’05 ’06 ’07
Gross margins(Percent)
’03 ’04 ’05 ’06 ’07
42.6 41.6 41.2 40.6 40.3
8
We like to say that no one knows the document better than Xerox. The ability to manage
document-intense processes has opened doors to new business and new markets.
And, it’s why we’re investing in acquisitions that further carve out our niche in this
space. Last year, we acquired Advectis® Inc. and started Xerox Mortgage Services, which
provides one of the mortgage industry’s most widely used solutions for sharing electronic
documents. In 2006, we acquired Amici LLC and launched Xerox Litigation Services to
become a leading provider of electronic discovery and document services that support
legal and regulatory compliance.
So just about everywhere you look there are proof points that our strategy is right,
our execution focused and our momentum building. That said, Xerox shareholders
and the management team share a common belief; as good as our progress has been,
it’s now a part of our history. Yesterday’s accomplishments are only important insofar
as they provide a bridge to tomorrow’s promise.
Growing the business faster
Accelerating growth in a competitive environment remains a priority. We’re not yet
where we want to be. Key to expanding growth is expanding our distribution channels.
It’s the area of improvement where I believe we can make more progress and where
we are focusing considerable time, talent and resources. We’re advantaged with a
rich portfolio of technology and services, the industry’s smartest experts in document
management and a respected brand known around the world. We’re skilled at managing
global accounts in big businesses and the commercial print market. But to really ratchet
up growth, we need to reach even more potential customers in businesses of any size.
Acquiring Global Imaging was a step in the right direction, as was giving our agents and
resellers access to more Xerox products and packaged services to sell. We need to – and
we will – take this to the next level now by broadening the availability of the Xerox brand
through diverse direct and indirect channels.
To do this well, we’re connecting even more closely with our customers, predicting
and responding to their needs. It’s no secret that I spend a lot of time with customers.
So does my entire team. Some of that time is spent fixing problems and some of it selling,
but most of it is spent listening – really listening. And when you do that, you learn some
pretty interesting stuff.
The CEOs I meet with – and they are from a wide variety of industries and geographies –
worry that they are not harnessing new technology to leverage growth and better serve
their customers. They worry about escalating costs and where to place their IT investment
bets so they stay ahead of the curve. They see an explosion of digital information in
their enterprises, but are also confronted with a legacy of paper and don’t know how to
make sense of it all. They understand the need for information to flow freely and easily
throughout their organizations and around the world, but worry about security breaches.
Xerox Annual Report 2007 9
They’re eager to embrace the promise of a “greener” world, but don’t know how to
harness technology to make their infrastructure more sustainable. They are awed by the
complexity and potential of technology, but yearn for someone to make it all simpler
and more effective.
Here’s what excites me. In each of these areas – top-line growth and bottom-line
productivity… bridging the digital and paper domains… making document management
secure and sustainable… making IT decisions that provide good returns… and making
a complex world simple – in all these areas Xerox has answers.
Our innovation community is aligned with our strategy and is the best in our industry.
Last year, Xerox was awarded 584 U.S. utility patents. Together with our research partner
Fuji Xerox, we hold about 8,600 active U.S. patents and continue to invest $1.4 billion
a year in research and development. In 2007, we were awarded the National Medal
of Technology, America’s highest such honor. It’s a singular accomplishment for Xerox
innovators past and present.
Our product development community is bringing a steady stream of worldclass
technology to market. In the past three years, we have brought more than 100 new
products to market. Together with our intelligent software, targeted solutions and tailored
services, they bring value to our customers today and assure us continued industry
leadership tomorrow.
Our distribution channels, already the broadest in our industry, are getting stronger.
We have a powerful blend of direct sales people and indirect agents, concessionaires,
resellers, dealers and Web-based channels. They have at their disposal a wide array of
experts in color, production printing, solutions, software, services and more.
Our reach is worldwide, providing a competitive advantage that is unique in our industry.
We are on the ground in some 160 countries in every corner of the globe. That becomes
increasingly important as our larger customers want help in designing, implementing and
maintaining document networks and processes that span the world.
Our annuity business model provides a consistent and profitable revenue stream that
drives strong cash flow. As I mentioned earlier, more than 70 percent of our revenue
comes from post-sale. In 2007, we grew post-sale revenue by 9 percent (6 percent
excluding the benefit of Global Imaging*) and added more than $1 billion to our post-sale
revenue stream.
* See Page 11 for the reconciliation of the difference between this financial measure that is not in compliance with Generally Accepted Accounting Principles (GAAP) and the most directly comparable financial measure calculated in accordance with GAAP.
10
And our leadership team is my personal pride and joy. It’s a terrific blend of seasoned
Xerox veterans, some great additions from outside the company and some new leaders
who have emerged from our own ranks. It’s a team that leads 57,400 Xerox people who
consistently deliver on their commitments, have grown earnings in the 10 to 15 percent
range, and are determined to do whatever it takes to be successful. It is a team that
I am exceptionally proud to lead.
Rest assured that we are hardly satisfied with what we have accomplished. We love
change and hate the status quo. We embrace challenges and obstacles. We’ve developed
a culture that I like to call “problem-curious.” We want to grow faster and win more, not by
a little but by a lot. We pride ourselves on listening intently to our customers, connecting
with them on a one-to-one basis and committing to finding them the right answer for
their unique needs – not some of the time but all of the time. You’ll read more about
just that in this report – how we listen, connect and are committed to you.
Playing offense with high expectations and great opportunities
Our performance in 2008 will be driven by growing our profitable annuity stream – fueled
by color and services – and continued discipline in managing costs while generating
significant operating cash flow. And, with our strong balance sheet, we’ll focus on share
repurchase while being opportunistic in making acquisitions.
We do business in a $125 billion market that has attracted a set of competitors we
regard with great respect. We know that our customers have choices. We realize that
the better we get, the higher our customers’ expectations will get.
We are also proud but not content with our record on corporate responsibility. I invite you
to read our second Report on Global Citizenship. It’s online at www.xerox.com/citizenship.
You will see that we continue to invest in the communities in which we work and live,
that our people are active and constructive participants in making our world better, that
we have one of the most diverse workforces in the world and that we are a leader but
hardly a newcomer in the fight for a sustainable world and a greener planet.
This Annual Report to Shareholders is the first to carry our new brand identity, which we
launched the first week of 2008. Companies often use new identities in an aspirational
way – to signal what they want to become. Our launch is both a statement that we have
already arrived at a new place and a promise that our journey continues.
I truly believe that our best days are ahead of us. We are playing to our strengths,
ushering in a period of great growth for our shareholders, our customers and our people.
So, to sum it all up, here’s why I’m confident Xerox will increase value for you:
Xerox Annual Report 2007 11
We operate a global business with about half of our revenue generated from customers
outside of the U.S. From small and medium businesses and the public sector to large
enterprises and commercial printers, we serve a wide range of markets – giving us
diversification globally and in market scope.
We’re an annuity-based business that continues to boost profitable recurring revenues.
We’re an investment-grade firm that generates strong cash flow. We’re investing in our
business and in our stock.
All of us at Xerox are eager to play offense and to give you a good return on your trust.
We’re listening, we’re connecting and we’re committed. We know that you, like our
customers, have choices. You chose Xerox and we take that very seriously. You can be
sure we will do whatever it takes to continue to earn your trust.
That’s a promise.
Anne M. Mulcahy
Chairman and Chief Executive Officer
Full-year ’07 Full-year ’06 Net Income Diluted EPS Net Income Diluted EPSAs Reported $ 1,135 $ 1.19 $ 1,210 $ 1.22AdjustmentsRestructuring and Asset Impairment 254 0.25
Tax Audit Benefits (494) (0.50)
Litigation Matters 68 0.07
Credit Facility Fee 9 0.01
Adjusted $ 1,135 $ 1.19 $ 1,047 $ 1.05
Adjusted Earnings Per Share:(in millions, except per-share data)
Year Ended December 31 2007 2006 %ChangeEquipment Sales Revenue: As Reported $ 4,753 $ 4,457 7%
As Adjusted $ 4,753 $ 4,821 (1%)
Post Sale, Financing and Other Revenue:As Reported $ 12,475 $ 11,438 9%
As Adjusted $ 12,475 $ 11,812 6%
Total Revenue:As Reported $ 17,228 $ 15,895 8%
As Adjusted $ 17,228 $ 16,633 4%
Global Imaging Systems Revenue Benefit:(in millions)
Revenue “As Adjusted” adds Global Imaging’s results for the period from May 9, 2006, through December 31, 2006, to our 2006 “As Reported”
revenue. This calculation excludes the revenue benefit from this acquisition reflected in the 2007 “As Reported” revenue growth.
*Non-GAAP Reconciliation

12
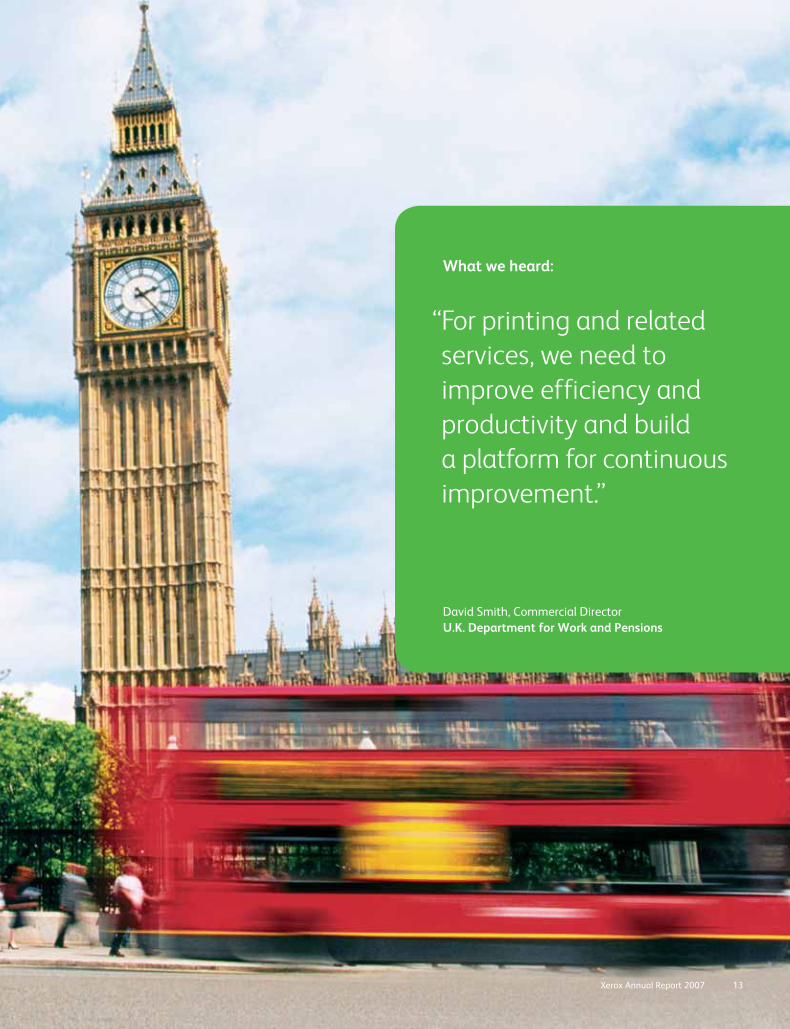
“ For printing and related
services, we need to
improve efficiency and
productivity and build
a platform for continuous
improvement.”
What we heard:
David Smith, Commercial Director
U.K. Department for Work and Pensions
13Xerox Annual Report 2007
14
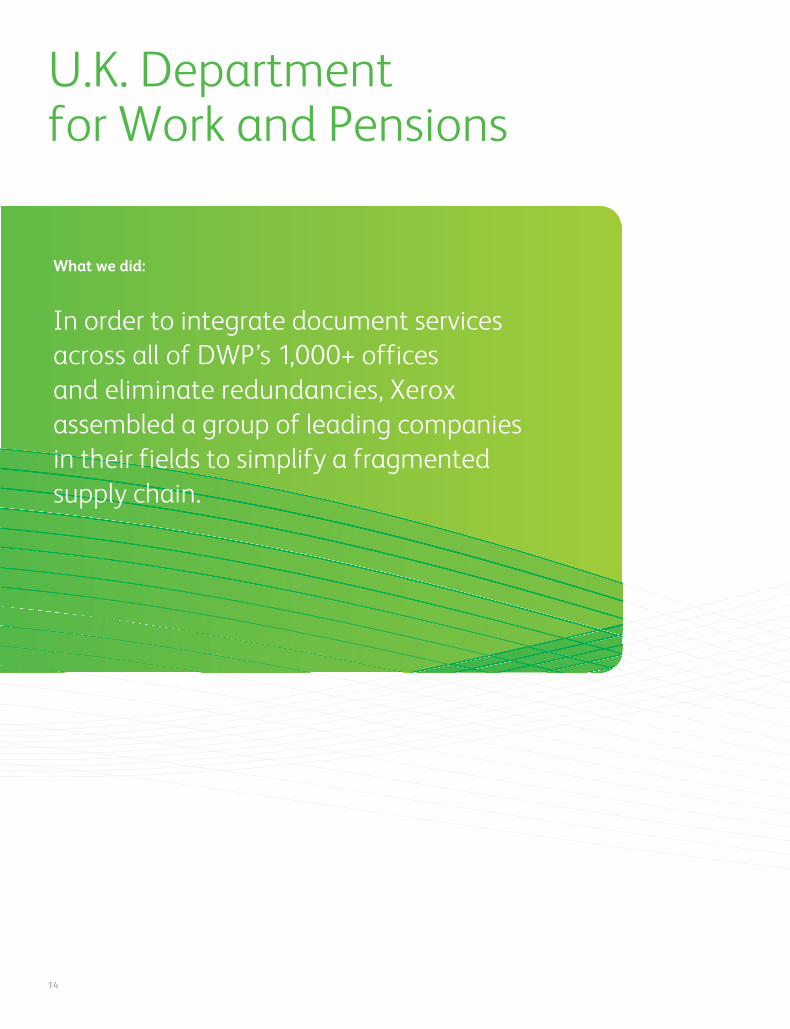
In order to integrate document services
across all of DWP’s 1,000+ offices
and eliminate redundancies, Xerox
assembled a group of leading companies
in their fields to simplify a fragmented
supply chain.
What we did:
U.K. Department for Work and Pensions
Xerox Annual Report 2007 15
Committed
Besides drawing from its
standard portfolio of document
management services, Xerox
put in place a dedicated contact
center and an 80,000-square-
foot warehouse so that all
document-driven components
could be ordered and shipped
from one source.
Says David Smith, DWP’s
Commercial Director, “The
approach Xerox and its partners
have developed is designed to
ensure that we get real value
from our partnership and that
our critical requirements for
print and associated services are
met as and when we need them.”
With one-third of a nation
depending on them every day,
DWP was not about to settle
for anything less.
Connected
To improve overall service
delivery, DWP set out to review
and revamp its entire document
supply chain. It had two principal
goals: 1) Make information
clearer and more easily available
and accessible to its constituents;
and 2) Improve efficiency in
keeping with increasingly vigilant
government reviews.
Implicit in its goals was the
need to integrate document
services across all of its
1,000+ offices and eliminate
the redundancies of work
performed with multiple suppliers
in individual departments.
Since it was a tall order for
any single organization, Xerox
assembled iON, a partnership
of leading companies in their
fields, to integrate transforma-
tion across a fragmented supply
chain – starting with ordering,
through procurement and
production, all the way to final
delivery to the recipient.
Listening
As the United Kingdom’s largest
central and civil government
department, the Department
for Work and Pensions (DWP)
delivers services directly to over
20 million citizens and pays
out more than $500 million in
benefits every year. From “child
support” to “welfare to work”
to “pensions management,” it is
fact that DWP will touch every
citizen in the U.K. at some time
during their lifetime.
That amounts to a staggering
number of records and
transactions to manage.
And with the very well-being
of people in the balance,
it requires accuracy that
approaches perfection and
security that can’t be breached.
How streamlined document services are streamlining the delivery of human services.

16

“ If you want to
communicate something
important, put it on
a monthly statement.”
What we heard:
Håkan Larsson, Technical Director
Strålfors
17Xerox Annual Report 2007
18
Strålfors and Xerox worked together
to make individualized customer
messages come to life in vibrant
color and on paper that can be light
enough to keep down mailing costs.
What we did:
Strålfors
Xerox Annual Report 2007 19
Committed
Xerox worked closely with
Strålfors’ IT, marketing and
sales people to target its most
likely customers and devise
specific strategies for each.
Now throughout Europe,
millions of people receive
need-to-know and nice-to-know
information suited specifically
for them. Not in predictable,
institutional black and white,
but in “cut through the clutter”
color. The result is much higher
readership and response.
For Strålfors, what began
many years ago as a great
idea in customer care has
become an indispensable
way of doing business.
Connected
With non-personalized statement
inserts being ignored and tossed
out routinely, why not embed the
customized marketing messages
on the statements themselves,
with vibrant, high-impact color?
Great idea, but no one seemed
to be doing it without breaking
the bank, so to speak. That’s
when Strålfors and Xerox
joined forces in applying their
collaborative imagination to
the opportunity at hand.
Enter the Xerox Color Continuous
Feed Printing System, with the
power to make individualized
messages come to life with
high-quality color and on paper
that can be light enough to
keep down mailing costs.
Listening
High-speed, continuous-feed
color printing. It might not
sound like a warm and fuzzy
solution to greater customer
care. But for the high-volume
customers of Strålfors, one of
Europe’s preeminent printers
and managers of information
logistics, it is the key to touching
many millions of customers,
one colorful message at a time.
For years, banks, insurance
companies, public utilities and
telecommunications companies
have recognized that monthly
statements and other necessary
documents are an excellent
opportunity to market to their
customers as individuals.
As we heard from Håkan
Larsson, Strålfors’ Technical
Director, “If you want to
communicate something
important, put it on a monthly
statement because then it
will get read.”
Technology catches up with a great approach to customer care.

20
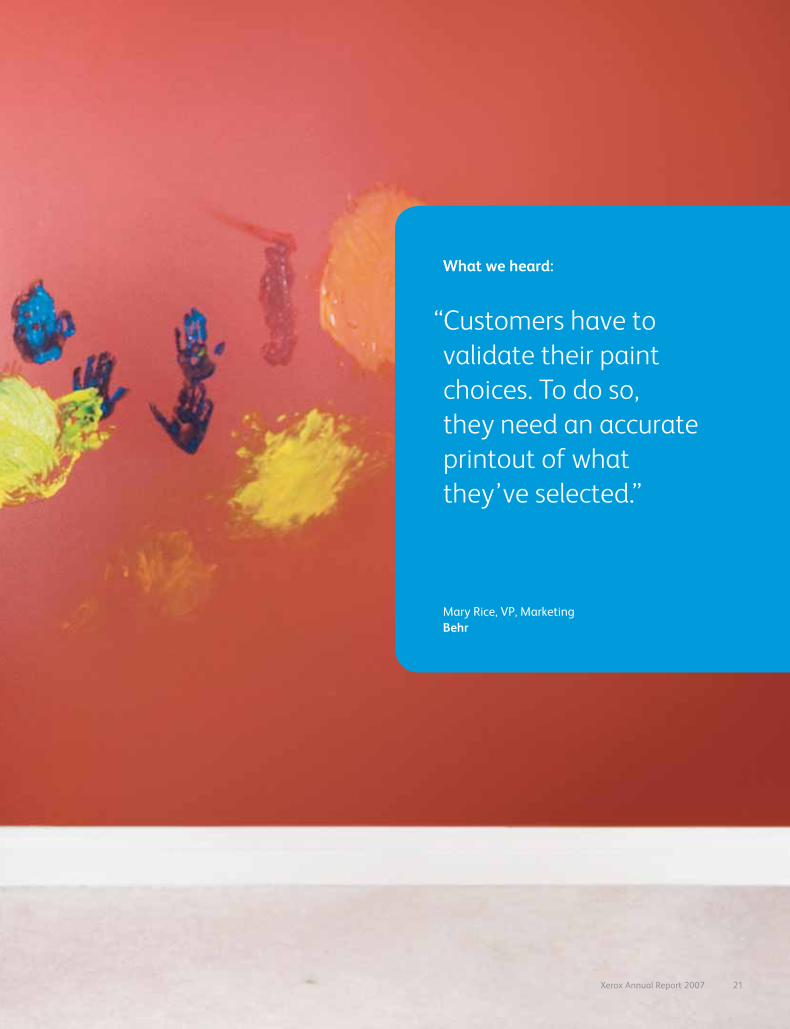
“ Customers have to
validate their paint
choices. To do so,
they need an accurate
printout of what
they’ve selected.”
What we heard:
Mary Rice, VP, Marketing
Behr
21Xerox Annual Report 2007
22
Xerox Phaser®
color printers are
critical links in the process – making
sure that what customers choose in
the store accurately matches what
they want for their home. That step
requires true, high-quality printouts
of the colors selected.
What we did:
Behr
Xerox Annual Report 2007 23
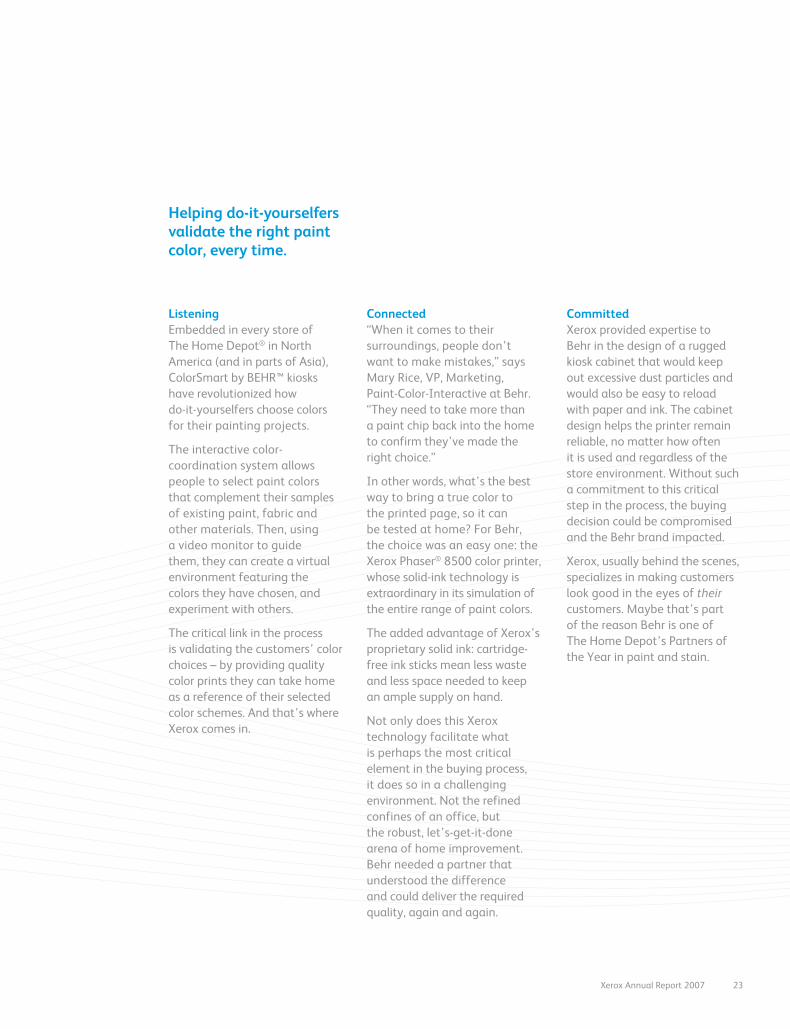
Committed
Xerox provided expertise to
Behr in the design of a rugged
kiosk cabinet that would keep
out excessive dust particles and
would also be easy to reload
with paper and ink. The cabinet
design helps the printer remain
reliable, no matter how often
it is used and regardless of the
store environment. Without such
a commitment to this critical
step in the process, the buying
decision could be compromised
and the Behr brand impacted.
Xerox, usually behind the scenes,
specializes in making customers
look good in the eyes of their customers. Maybe that’s part
of the reason Behr is one of
The Home Depot’s Partners of
the Year in paint and stain.
Connected
“When it comes to their
surroundings, people don’t
want to make mistakes,” says
Mary Rice, VP, Marketing,
Paint-Color-Interactive at Behr.
“They need to take more than
a paint chip back into the home
to confirm they’ve made the
right choice.”
In other words, what’s the best
way to bring a true color to
the printed page, so it can
be tested at home? For Behr,
the choice was an easy one: the
Xerox Phaser® 8500 color printer,
whose solid-ink technology is
extraordinary in its simulation of
the entire range of paint colors.
The added advantage of Xerox’s
proprietary solid ink: cartridge-
free ink sticks mean less waste
and less space needed to keep
an ample supply on hand.
Not only does this Xerox
technology facilitate what
is perhaps the most critical
element in the buying process,
it does so in a challenging
environment. Not the refined
confines of an office, but
the robust, let’s-get-it-done
arena of home improvement.
Behr needed a partner that
under stood the difference
and could deliver the required
quality, again and again.
Listening
Embedded in every store of
The Home Depot® in North
America (and in parts of Asia),
ColorSmart by BEHR™ kiosks
have revolutionized how
do-it-yourselfers choose colors
for their painting projects.
The interactive color-
coordination system allows
people to select paint colors
that complement their samples
of existing paint, fabric and
other materials. Then, using
a video monitor to guide
them, they can create a virtual
environment featuring the
colors they have chosen, and
experiment with others.
The critical link in the process
is validating the customers’ color
choices – by providing quality
color prints they can take home
as a reference of their selected
color schemes. And that’s where
Xerox comes in.
Helping do-it-yourselfers validate the right paint color, every time.

24

“ Packaging is as much
our product as what our
customers put in their
gardens or in their
living rooms. It’s got
to be top-flight.”
What we heard:
Stefan Yauchzee, General Manager
Potting Shed Creations, Ltd.TM
25Xerox Annual Report 2007

26
Developed affordable, easy-to-use
color technology that delivers
the quality, reliability and speed
small businesses need to showcase
their company.
What we did:
Potting Shed Creations, Ltd.™
Xerox Annual Report 2007 27
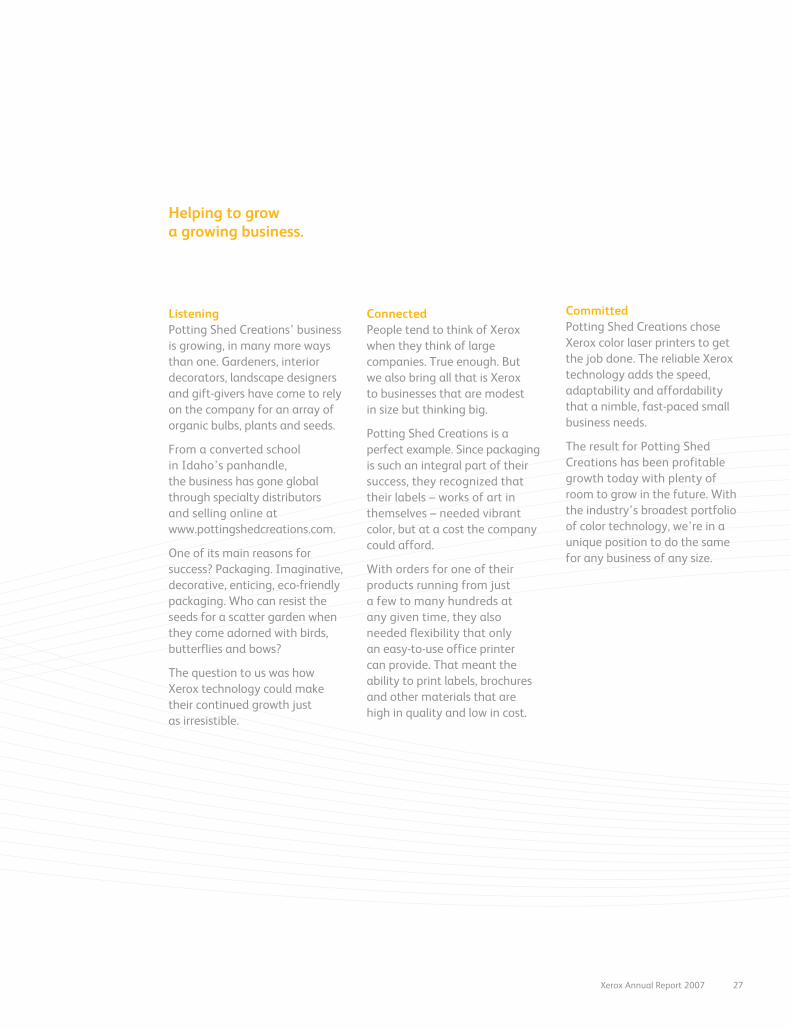
Committed
Potting Shed Creations chose
Xerox color laser printers to get
the job done. The reliable Xerox
technology adds the speed,
adaptability and affordability
that a nimble, fast-paced small
business needs.
The result for Potting Shed
Creations has been profitable
growth today with plenty of
room to grow in the future. With
the industry’s broadest portfolio
of color technology, we’re in a
unique position to do the same
for any business of any size.
Connected
People tend to think of Xerox
when they think of large
companies. True enough. But
we also bring all that is Xerox
to businesses that are modest
in size but thinking big.
Potting Shed Creations is a
perfect example. Since pack ag ing
is such an integral part of their
success, they recognized that
their labels – works of art in
themselves – needed vibrant
color, but at a cost the company
could afford.
With orders for one of their
products running from just
a few to many hundreds at
any given time, they also
needed flexibility that only
an easy-to-use office printer
can provide. That meant the
ability to print labels, brochures
and other materials that are
high in quality and low in cost.
Listening
Potting Shed Creations’ business
is growing, in many more ways
than one. Gardeners, interior
decorators, landscape designers
and gift-givers have come to rely
on the company for an array of
organic bulbs, plants and seeds.
From a converted school
in Idaho’s panhandle,
the business has gone global
through specialty distributors
and selling online at
www.pottingshedcreations.com.
One of its main reasons for
success? Packaging. Imaginative,
decorative, enticing, eco-friendly
packaging. Who can resist the
seeds for a scatter garden when
they come adorned with birds,
butterflies and bows?
The question to us was how
Xerox technology could make
their continued growth just
as irresistible.
Helping to grow a growing business.
28
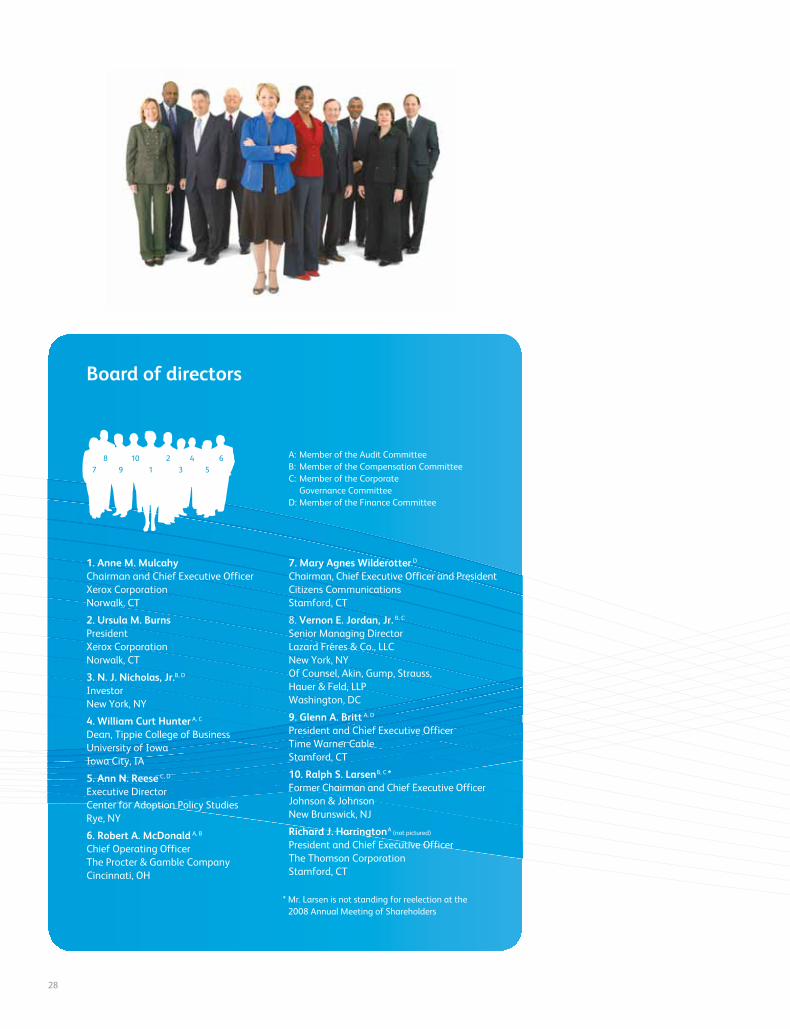
Board of directors
A: Member of the Audit Committee
B: Member of the Compensation Committee
C: Member of the Corporate
Governance Committee
D: Member of the Finance Committee
* Mr. Larsen is not standing for reelection at the
2008 Annual Meeting of Shareholders
7. Mary Agnes Wilderotter D
Chairman, Chief Executive Officer and President
Citizens Communications
Stamford, CT
8. Vernon E. Jordan, Jr. B, C
Senior Managing Director
Lazard Frères & Co., LLC
New York, NY
Of Counsel, Akin, Gump, Strauss,
Hauer & Feld, LLP
Washington, DC
9. Glenn A. Britt A, D
President and Chief Executive Officer
Time Warner Cable
Stamford, CT
10. Ralph S. LarsenB, C*Former Chairman and Chief Executive Officer
Johnson & Johnson
New Brunswick, NJ
Richard J. HarringtonA (not pictured)
President and Chief Executive Officer
The Thomson Corporation
Stamford, CT
1. Anne M. Mulcahy Chairman and Chief Executive Officer
Xerox Corporation
Norwalk, CT
2. Ursula M. BurnsPresident
Xerox Corporation
Norwalk, CT
3. N. J. Nicholas, Jr.B, D
Investor
New York, NY
4. William Curt Hunter A, C
Dean, Tippie College of Business
University of Iowa
Iowa City, IA
5. Ann N. Reese C, D
Executive Director
Center for Adoption Policy Studies
Rye, NY
6. Robert A. McDonald A, B
Chief Operating Officer
The Procter & Gamble Company
Cincinnati, OH
7
8
9
10
1
2
3
4
5
6
Xerox Annual Report 2007 29
30
Our business
52
Management’s Discussion and
Analysis of Results of Operations
and Financial Condition
77
Consolidated Statements of Income
78
Consolidated Balance Sheets
79
Consolidated Statements of Cash Flows
80
Consolidated Statements of
Common Shareholder’s Equity
81
Notes to the Consolidated
Financial Statements
132
Reports of Management
133
Report of Independent Registered
Public Accounting Firm
134
Quarterly Results of Operations
(Unaudited)
135
Five Years in Review
136
Corporate information
30
Overview References in this section to “we,” “us,” “our,” the “Company” and “Xerox” refer to Xerox
Corporation and its subsidiaries unless the context specifi cally states or implies otherwise.
The document industry is transitioning to digital systems, to color, and to an increased
reliance on electronic documents. More and more, businesses are creating and storing
documents digitally and using the Internet to exchange electronic documents. We believe
these trends play to the strengths of our product and service offerings and represent
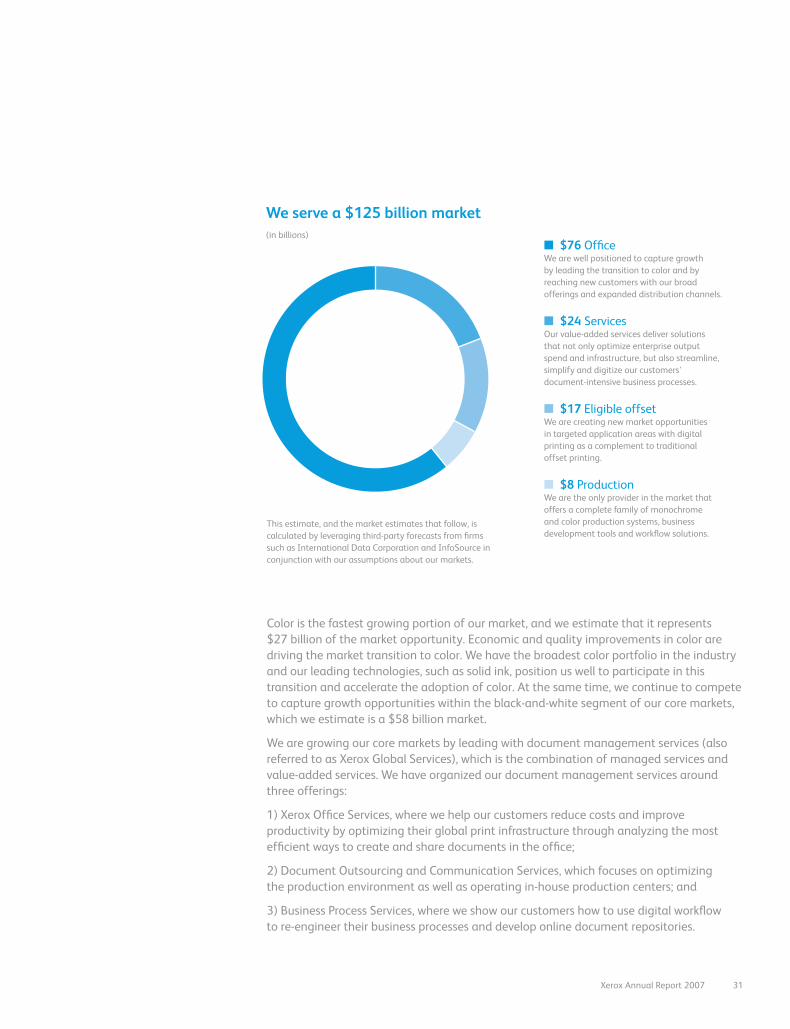
opportunities for future growth in the $125 billion market we serve.
In our core markets of Production and Offi ce, we are well-positioned to lead in this large
and growing market through our four growth planks:
• Accelerate the adoption of color
• Lead with services in large enterprises
• Drive the New Business of Printing®
• Expand participation in small/mid-size business market
We are a $17.2 billion technology and services enterprise and a leader in the global document market. We develop, manufacture, market, service and
fi nance a complete range of document equipment,
software, solutions and services.
Our business
Xerox Annual Report 2007 31
Color is the fastest growing portion of our market, and we estimate that it represents
$27 billion of the market opportunity. Economic and quality improvements in color are
driving the market transition to color. We have the broadest color portfolio in the industry
and our leading technologies, such as solid ink, position us well to participate in this
transition and accelerate the adoption of color. At the same time, we continue to compete
to capture growth opportunities within the black-and-white segment of our core markets,
which we estimate is a $58 billion market.
We are growing our core markets by leading with document management services (also
referred to as Xerox Global Services), which is the combination of managed services and
value-added services. We have organized our document management services around
three offerings:
1) Xerox Offi ce Services, where we help our customers reduce costs and improve
productivity by optimizing their global print infrastructure through analyzing the most
effi cient ways to create and share documents in the offi ce;
2) Document Outsourcing and Communication Services, which focuses on optimizing
the production environment as well as operating in-house production centers; and
3) Business Process Services, where we show our customers how to use digital workfl ow
to re-engineer their business processes and develop online document repositories.
This estimate, and the market estimates that follow, is
calculated by leveraging third-party forecasts from fi rms
such as International Data Corporation and InfoSource in
conjunction with our assumptions about our markets.
We serve a $125 billion market(in billions)
■ $76 Offi ceWe are well positioned to capture growth
by leading the transition to color and by
reaching new customers with our broad
offerings and expanded distribution channels.
■ $24 ServicesOur value-added services deliver solutions
that not only optimize enterprise output
spend and infrastructure, but also streamline,
simplify and digitize our customers’
document-intensive business processes.
■ $17 Eligible offsetWe are creating new market opportunities
in targeted application areas with digital
printing as a complement to traditional
offset printing.
■ $8 Production We are the only provider in the market that
offers a complete family of monochrome
and color production systems, business
development tools and workfl ow solutions.
32
We are creating new market opportunities with digital printing as a complement to
traditional offset printing through a market transition we call “The New Business of
Printing”. We are driving the New Business of Printing opportunity by identifying
applications which are suitable for digital production and represent what we refer to
as the “eligible offset” market. With our leading business development tools, workfl ow
and digital technology, led by our market-making Xerox iGen3® technology, we are
uniquely positioned to meet the increasing demand for short-run, customized and
quick-turnaround offset quality printing.
Over the past year we have scaled up our presence in the small and mid-size business
(SMB) market, most notably through our acquisition of Global Imaging Systems, Inc.
(GIS). This increased distribution capacity, along with a strong product portfolio in this
segment, is expanding our participation in SMB and opening up new growth
opportunities.
Our products include high-end printing and publishing systems; digital multifunctional
devices (MFDs) which can print, copy, scan and fax; digital copiers; laser and solid ink
printers; fax machines; document-management software; and supplies such as toner,
paper and ink. We provide software and workfl ow solutions with which businesses can
easily and affordably print books, create personalized documents for their customers,
and scan and route digital information.
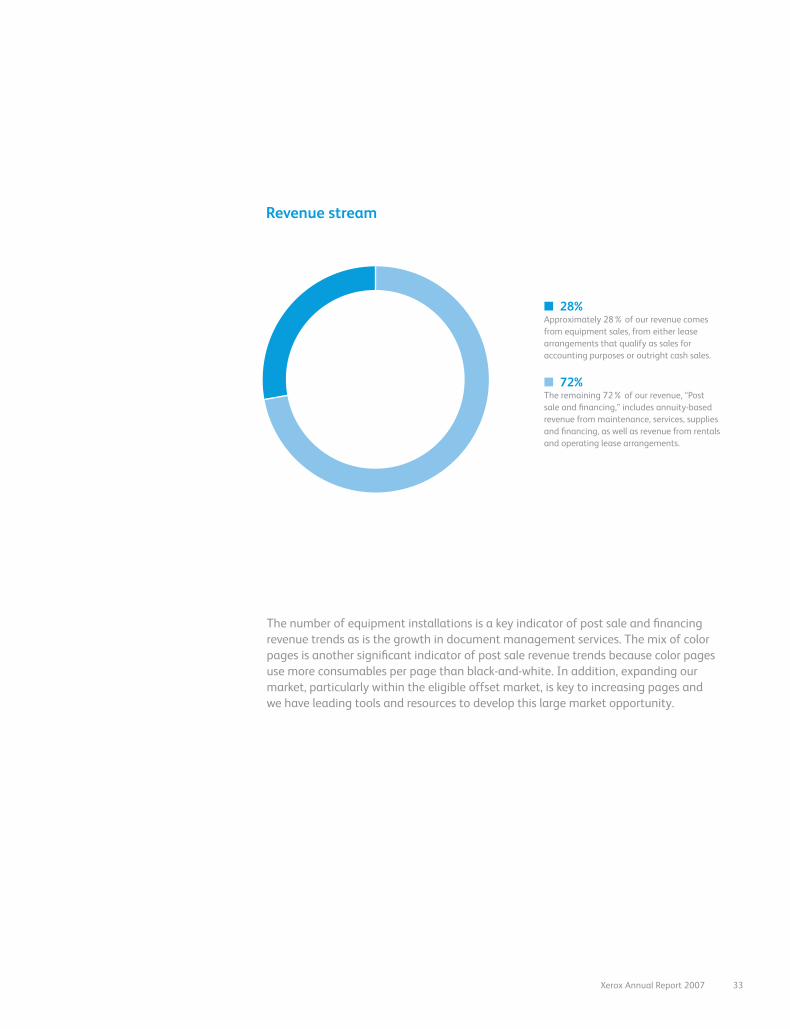
Our business model is an annuity model where post sale and fi nancing revenue growth
is driven by increasing equipment installations which increases the number of page
producing machines in the fi eld (MIF) and expanding the document management
services we offer our customers. 72% of our 2007 total revenue was post sale and
fi nancing revenue that includes equipment maintenance and consumable supplies,
among other elements. We sell the majority of our equipment through sales-type
leases that we record as equipment sale revenue. Equipment sales represented 28%
of our 2007 total revenue.
Our business
Xerox Annual Report 2007 33
Revenue stream
■ 28%Approximately 28% of our revenue comes
from equipment sales, from either lease
arrangements that qualify as sales for
accounting purposes or outright cash sales.
■ 72%The remaining 72% of our revenue, “Post
sale and fi nancing,” includes annuity-based
revenue from maintenance, services, supplies
and fi nancing, as well as revenue from rentals
and operating lease arrangements.
The number of equipment installations is a key indicator of post sale and fi nancing
revenue trends as is the growth in document management services. The mix of color
pages is another signifi cant indicator of post sale revenue trends because color pages
use more consumables per page than black-and-white. In addition, expanding our
market, particularly within the eligible offset market, is key to increasing pages and
we have leading tools and resources to develop this large market opportunity.
34
AcquisitionsTo further our business goals, in 2007 we completed the acquisitions of GIS, a provider of
offi ce technology for small and mid-size businesses in the United States, and Advectis®, Inc.
(Advectis), a provider of a web-based solution that electronically manages the process to
underwrite, audit, collaborate, deliver and archive mortgage loan documents. GIS focuses
on the SMB market through 22 regional core companies in the U.S. that sell and service
document management systems. With the GIS acquisition, we increased our distribution
capacity in the SMB market in the U.S. by approximately 50%, where the total opportunity
for document-related offerings is estimated at $16 billion. GIS currently serves about
200,000 customers with about 1,400 sales representatives and 1,700 service technicians.
Since acquiring GIS, they acquired four additional companies in 2007, further expanding
our distribution. In addition, as of the fourth quarter of 2007, roughly half of GIS
equipment available for sale was Xerox equipment compared to none a year ago.
Advectis’ web-based BlitzDocs Collaboration Suite helps users reduce costs associated with
the lending process, deliver better services, decrease credit risk and build a competitive
advantage in capturing new loan applications. Advectis, now branded Xerox Mortgage
Services, similar to our acquisition last year of Amici, expands our business process services
capabilities into yet another vertical document intensive area.
Our business
We made two acquisitions in 2007: A provider of
offi ce technology for small and mid-size businesses
in the U.S. and a provider of a web-based solution to
electronically manage mortgage loan documents.
Xerox Annual Report 2007 35
Segment information Our reportable segments are Production, Offi ce, Developing Markets Operations (DMO),
and Other. We present operating segment fi nancial information in Note 2-Segment
Reporting in the Consolidated Financial Statements, which we incorporate by reference
here. We have a very broad and diverse base of customers, both geographically and
demographically, ranging from SMB to graphic communications companies, governmental
entities, educational institutions and large (Fortune 1,000) corporate accounts. None
of our business segments depends upon a single customer, or a few customers, the loss
of which would have a material adverse effect on our business.
Beginning in 2008, we will not report DMO results in a separate segment, but will
include their results within our Offi ce, Production and Other segments. More details on
this change are included on page 68 within the Segment Reporting Change section
of the Management Discussion and Analysis in our 2007 Annual Report.
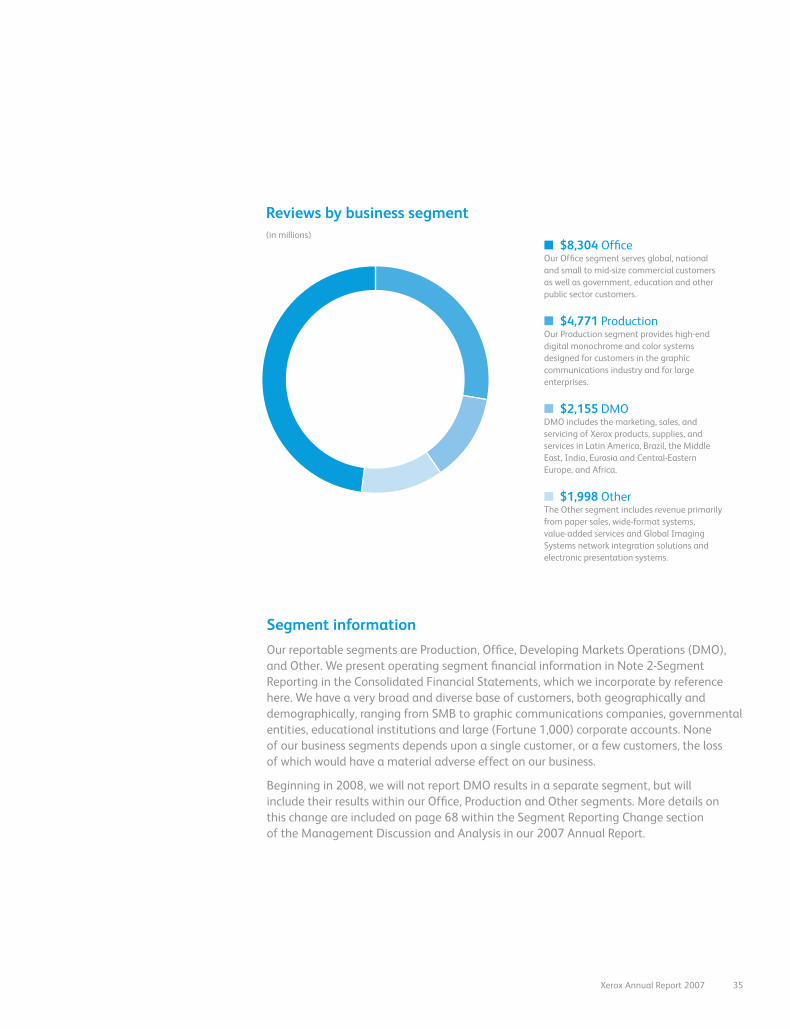
Reviews by business segment(in millions)
■ $8,304 Offi ceOur Offi ce segment serves global, national
and small to mid-size commercial customers
as well as government, education and other
public sector customers.
■ $4,771 ProductionOur Production segment provides high-end
digital monochrome and color systems
designed for customers in the graphic
communications industry and for large
enterprises.
■ $2,155 DMODMO includes the marketing, sales, and
servicing of Xerox products, supplies, and
services in Latin America, Brazil, the Middle
East, India, Eurasia and Central-Eastern
Europe, and Africa.
■ $1,998 OtherThe Other segment includes revenue primarily
from paper sales, wide-format systems,
value-added services and Global Imaging
Systems network integration solutions and
electronic presentation systems.
36
Production We provide high-end digital monochrome and color systems designed for customers in the
graphic communications industry and for large enterprises. These high-end devices enable
digital on-demand printing, digital full-color printing, and enterprise printing. We are the
only manufacturer in the market that offers a complete family of cut sheet monochrome
production systems from 65 to 288 pages per minute (ppm), color production systems
from 40 to 110 ppm, and a complete line of continuous feed printers from 250 to 1,064
ppm. In addition, we offer a variety of pre-press and post-press options and the industry’s
broadest set of workfl ow software.
With our Freefl ow™ digital workfl ow collection, our customers can improve all aspects of
their processes, from content creation and management to production and fulfi llment.
Our digital technology, combined with total document solutions and services that enable
personalization and printing on demand, delivers value that improves our customers’
business results.
Our 2007 Production goals
Our 2007 goals for our Production segment were to continue strengthening our leadership
position in monochrome and color and to build on the power of digital printing in the
eligible offset market. Our “New Business of Printing” strategy complements the traditional
offset market and continues to transform our industry. We are enabling print providers
in graphic communications and large enterprises to profi t and grow by meeting their
customers’ specifi c business needs with just-in-time, one-to-one and e-based services –
rather than simply manufacturing a printed piece. Having the right business model, the
right workfl ow, and the right technology are fundamental to this transformation.
In 2007 we launched an application-focused program to assist our customers implement
solutions in four major categories. The “Can Do” program provides our customers live
end-to-end applications for: Collaterals by Request, Books, Transactional/Promotional
and Direct Mail.
We continued to increase installations of our fl agship Digital Color Production Presses.
In April 2007, according to estimates by InfoTrends, a leading independent research
fi rm, Xerox’s installed base of DocuColor and iGen3 presses accounted for approximately
50 percent of the total worldwide page volume printed by high speed production
color printers. We are the industry leader in the number of pages produced on digital
production color presses, with our fl agship Xerox iGen3 Digital Production Press and
DocuColor® Digital Presses.
In 2007, we continued to build on our unmatched product breadth, world class market
and business development tools and integrated end-to-end applications. Below are some
of the key accomplishments that enabled us to reach our goals:
Our business
Xerox Annual Report 2007 37
Our 2007 Production accomplishments
Right business model
• Profi tAccelerator™ – this robust set of tools and programs designed to maximize our
customer’s investment in digital printing equipment expanded in 2007 to now include
more than 75 tools. It brings together Xerox’s unparalleled experience and expertise,
world-class resources and industry-leading support. Some of the newest additions
include an audio sales training course, a kit to assist customers pursuing the digital
book opportunity, and a new fi nancial modeling tool that will increase productivity
and achieve cost and effi ciency savings.
• New Business of Printing Services – Business Development Services were built in
response to customer requirements and will provide both training and professional
services to help print providers increase page volume and revenue. The three initial
services offerings are developing a digital marketing plan, selling one-to-one marketing
campaigns and web-to-print jobs, and training and managing a digital sales force. The
offerings are executed by a dedicated team of Xerox business development consultants
and industry experts.
Right workfl ow
With our Freefl ow™ digital workfl ow collection our customers can improve effi ciency
for everything from content creation and management to production and fulfi llment.
In 2007 the FreeFlow suite of workfl ow software was enhanced to uniquely enable our
customers to connect with print users 24 hours a day, 7 days a week, reduce costs, and
enable new applications and revenue streams. A few highlights include:
• Xerox FreeFlow Process Manager 6.0 – software that provides automated, “touchless”
fi le preparation and decision making to automate prepress and eliminate manual
production steps.
• Xerox FreeFlow Variable Information Suite 6.0 – software that delivers the maximum
productivity for personalized and customized documents. The software also now
supports award winning specialty effects that help print providers minimize document
security concerns while enabling new applications. These effects include MicroText
marks, Correlation Marks, Glossmark®, FlorescentMark, and InfraRed text.
• FreeFlow Print Server – a newly launched, powerful print server that delivers superior
performance, advanced workfl ow interoperability, state-of-the-art color management,
and a common workfl ow for Xerox production printers.
38
Right technology
• Xerox DocuColor 8000AP and Xerox DocuColor 7000AP – In May and September we
launched 80 ppm and 70 ppm full-color production systems, respectively, which provide
excellent print resolution, color reproduction and reliability for a wide range of
application and weights, all at rated speed.
• Xerox DocuColor 260 – We expanded our full color offerings with the launch of the
DocuColor 260 in September, a 60 ppm light production printer. The combination of
quality, reliability and price point makes it easy to get started in digital full color printing.
• Xerox 490/980 Color Continuous Feed Printing System – We announced the world’s
fastest toner based full color roll fed printer that produces up to 986 full color duplex
images per minute. This system is ideal for the Transactional/Promotional and Direct
Mail market segments that require high speed, high volume variable data printing.
• Xerox 495 Continuous Feed Duplex Printer – We expanded our offerings within the
Continuous Feed market with the February launch of a 500 ppm continuous feed duplex
printer with two imaging systems built into one device, fl ash fusing and a small footprint
ideal for high quality, high volume duplex applications.
• Xerox Nuvera® 288 Digital Perfecting System – Launched in April, this is the fastest
cut sheet monochrome duplex printer in the market. This system, with its benchmark
image quality, fl exibility of substrates and reliability, enables applications such as
book publishing.
• Xerox Nuvera 100/120/144 EA Digital Production Systems – A new family of
Xerox Nuvera digital production systems was launched in April, utilizing Emulsion
Aggregate (EA) toner for greater reliability and image quality. This modular, scalable
print engine also expands digital printing applications due to its high quality and
fl exibility of substrates.
• Xerox DocuTech® Highlight Color 128 and 155 Publishing System – In April, we
expanded our highlight color publishing system family for print on demand. These
systems print both black and white, as well as highlight color at rated speeds of 128
and 155 ppm, respectively.
• Xerox 4595 CP and 4110 CP with DocuSP – In April, we continued to expand our
presence in the light production segment with the launch of the Xerox 4595 CP and
4110 CP with DocuSP. These digital light production systems at 95 ppm and 110 ppm
feature high quality, easy to use systems that offer production workfl ow software that
can make them part of an Enterprise distributed print solution.
• Xerox 4112/4127 – In September, we introduced our latest light production
monochrome printers. The 4112 and 4127 include upgrades in speed, up to 125 ppm,
enhanced application capabilities and substrate handling. Both products were launched
with FreeFlow PrintServer.
• Custom Blended Color Program for DocuTech Highlight Color Systems – In 2007, we
expanded the range of colors to over 80 custom colors, enabling our customers to match
company logos for brand identity applications.
Our business
Xerox Annual Report 2007 39
Offi ce Our Offi ce segment serves global, national, and small to mid-size commercial customers
as well as government, education and other public sector customers. Offi ce systems and
services, which include monochrome devices at speeds up to 95 ppm and color devices up
to 60 ppm, include our family of CopyCentre®, WorkCentre® and WorkCentre® Pro digital
multifunction systems, Phaser™ desktop printers and MFD’s as well as DocuColor printer/
copiers for the specifi c needs of graphic intensive organizations and facsimile products.
We offer a complete range of solutions in partnership with independent software vendors
that allow our customers to analyze, streamline, automate, secure and track their digital
workfl ows, which we then use to identify the most effi cient, productive mix of offi ce equipment
and software for that business, helping to reduce the customer’s document-related costs.
Our 2007 Offi ce goals
Our 2007 Offi ce goals were to drive the transition to color in the offi ce, to extend our
market reach, particularly in the SMB market, and to continue to expand our Offi ce Services
business. We aimed to broaden our product line and complement our industry-leading
product offerings with expanded distribution to increase our machines-in-fi eld (MIF) and
capture more pages, building the foundation for future post sale revenue growth.
We continued to drive color in our Offi ce segment by signifi cantly enhancing our already
strong color product portfolio, making color more affordable, easier to use, faster and
more reliable. The breadth of our color product portfolio is unmatched. Our color-capable
laser devices provide an attractive color entry point, our patented solid ink technology
offers unmatched ease of use, vibrant color image quality and economic color run costs,
and our top of the line color laser products provide superior image quality coupled with
industry-leading productivity and reliability. Below are some of the key accomplishments
that enabled us to achieve our goals:
Our 2007 Offi ce accomplishments
• Phaser 8560 – With the February introduction of the 8560, we continued to leverage
our patented solid ink technology to provide offi ces with affordable, easy to use color.
The 8560 can print at speeds up to 30 ppm in color and black-and-white and is offered
in both standalone printer and multifunction confi gurations.
• Phaser 6180 – In February, we strengthened our color laser offerings with the
introduction of the Phaser 6180. The 6180 prints at speeds up to 20 color ppm and
26 ppm in black-and-white and utilizes Xerox’s environmentally friendly EA toner.
The 6180 is offered in both standalone printer and multifunction confi gurations.
• Phaser 6360 – In February, we introduced the Phaser 6360. With speeds up to 42 ppm
in color and black-and-white, the 6360 is the world’s fastest letter-size color laser printer.
• WorkCentre 7328/7335/7345 – In April, we introduced the WorkCentre 7300 product
family. These devices print and copy at speeds ranging from 26 to 35 ppm color and
28 to 45 ppm black-and-white. The systems also scan and fax, and include new tools to
integrate and improve workfl ows and manage color costs.
40
• DocuColor 260 – Introduced in April, the DocuColor 260 Digital Color Printer/Copier is
the fastest color system in the Xerox offi ce line, printing and copying at up to 60 ppm
in color and 75 ppm in black-and-white. It features the EFI® Fiery® embedded controller,
which enables customers to easily program, monitor and manage workfl ow. As a result,
the DocuColor 260 brings outstanding image quality and productivity to offi ces and
departments that want to create their own high-end materials without having to invest
in a full production press.
• WorkCentre 7232/7242 – In September, we continued to bring affordable color to
the offi ce with the WorkCentre 7232 and 7242 color-capable multi-function products.
The 7232 is capable of printing 10 ppm color and 32 ppm black-and-white, while the
7242 increases the black-and-white productivity to 40 ppm.
• WorkCentre 7675 – In September, we introduced the WorkCentre 7675, offering color
pages at 50 ppm and black-and-white pages at 75 ppm. The 7675 provides superior
image quality, excellent productivity, extensive media handling and professional in-line
fi nishing capabilities.
• Phaser 8860 – Launched in September, this is the fi rst printer to feature the next
generation of Xerox’s solid ink technology, enabling us to bring affordable color to
offi ces of any size. The new solid ink dramatically lowers the cost of color prints enabling
Xerox to offer innovative pricing, giving our customers ‘color for the price of black-and-
white’. The 8860 operates at print speeds as fast as 30 ppm in color and black-and-white
and is offered in both standalone printer and multifunction confi gurations.
We completely refreshed the core of our black-and-white multifunction series, further
strengthening our position.
• WorkCentre 5632/5638/5645/5655/5665/5675 – Introduced in August, the 5600
product family refreshed the entire black-and-white multifunction product line in the
Segments 3–5 market.
• Xerox 4595 Digital Copier/Printer – Introduced in April, the 4595 is a high-volume,
black-and-white copier/printer to meet the continuing need for high volume monochrome
offi ce printing. With scanning speeds up to 100 ppm and print and copy speeds up to
95 ppm, this system is a true workhorse for high-volume environments such as offi ce
workgroups, and educational and fi nancial institutions. The Xerox 4595 is also available
with the light-production fi nisher for a full range of output choices.
• Extensible Interface Platform – Announced in October 2006, Xerox’s Extensible Interface
Platform (EIP) is a software platform developers can use to create server-based
applications for multifunction devices and that can be confi gured for the MFD’s touch-
screen user interface. Using this interface, workers can enter a password or use a secure
smart card at the MFD and access a set of features and options designed specifi cally for
their business needs. A wide range of document management and workfl ow software
has already been developed by Xerox and its Alliance Partners to help organizations
manage costs, boost productivity and improve effi ciency. In 2007, Xerox expanded
the worldwide implementation of this platform including it on all major workgroup
and departmental MFD introductions.
Our business
Xerox Annual Report 2007 41
DMO DMO includes the marketing, sales and servicing of Xerox products, supplies, and
services in Latin America, Brazil, the Middle East, India, Eurasia and Central-Eastern
Europe and Africa.
In countries with developing economies, DMO manages the Xerox business through
operating companies, subsidiaries, joint ventures, product distributors, affi liates,
concessionaires, value-added resellers and dealers. Our two-tiered distribution model
has proven very successful in the high-growth geographies of Russia and Central-
Eastern Europe. Our 2007 DMO goals included revenue growth, a continued focus
on improving the entire cost base and providing a foundation for profi table growth.
Other The Other segment primarily includes revenue from paper sales, value-added
services, wide-format systems and GIS network integration solutions and electronic
presentation systems.
We sell cut-sheet paper to our customers for use in their document processing products.
The market for cut-sheet paper is highly competitive and revenues are signifi cantly
affected by pricing. Our strategy is to charge a premium over mill wholesale prices, which
is adequate to cover our costs and the value we add as a distributor, as well as to provide
unique products that enhance the “New Business of Printing” and color output.
An increasingly important part of our offering is value-added services, which uses our
document industry knowledge and experience. Our value-added services deliver solutions
that optimize our customers’ document output and infrastructure costs while streamlining,
simplifying, and digitizing their document-intensive business processes. In October 2007,
we acquired Advectis, a provider of a web-based solution that electronically manages the
process to underwrite, audit, collaborate, deliver and archive mortgage loan documents.
In July 2006 we acquired Amici, a provider of web-based electronic discovery (E-discovery)
services, primarily supporting litigation and regulatory compliance. Often our value-added
services solutions lead to larger managed services contracts which include our equipment,
supplies, service, and labor. We report the revenue from managed services contracts in
the Production, Offi ce, or DMO segments. In 2007, the combined value-added services
and managed services revenue, including equipment, totaled $3.8 billion.
In our wide-format systems business, we offer document processing products and
devices designed to reproduce large engineering and architectural drawings up to three
feet by four feet in size.
42
RevenueWe sell the majority of our products and services under bundled lease arrangements, in
which our customers pay a monthly amount for the equipment, maintenance, services,
supplies and fi nancing over the course of the lease agreement. These arrangements are
benefi cial to our customers and us since, in addition to customers receiving a bundled
offering, these arrangements allow us to maintain the customer relationship for future
sales of equipment and services.
We analyze these arrangements to determine whether the equipment component meets
certain accounting requirements such that the equipment fair value should be recorded as
a sale at lease inception, that is, a sales-type lease. We allocate the remaining portion of
the monthly minimum payments to the various elements of the lease based on fair value
– service, maintenance, supplies and fi nancing – that we generally recognize over the term
of the lease agreement, and that we report as “post sale and other revenue” and “fi nance
income” revenue. In those arrangements that do not qualify as sales-type leases, which
have increased as a result of our services-led strategy, we recognize the entire monthly
payment over the term of the lease agreement, whether rental or operating lease, and
report it in “post sale and other revenue.” Our accounting policies for revenue recognition
for leases and bundled arrangements are included in Note 1-Summary of Signifi cant
Accounting Policies in the Consolidated Financial Statements in our 2007 Annual Report.
Our business
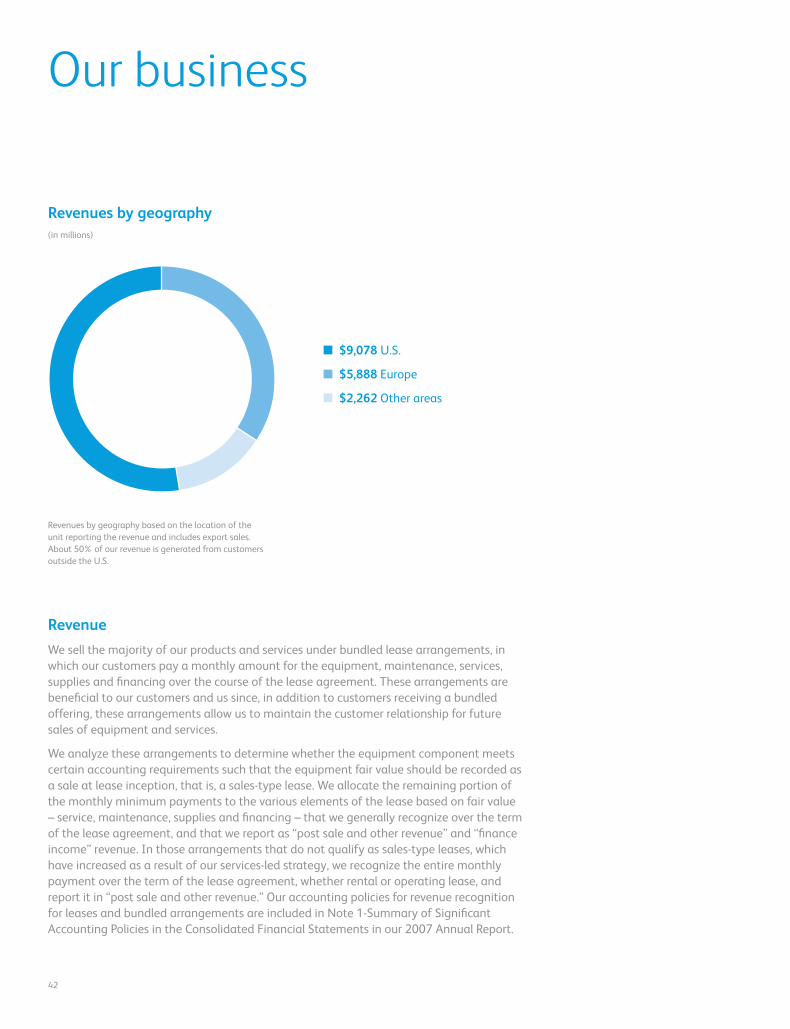
■ $9,078 U.S.
■ $5,888 Europe
■ $2,262 Other areas
Revenues by geography(in millions)
Revenues by geography based on the location of the
unit reporting the revenue and includes export sales.
About 50% of our revenue is generated from customers
outside the U.S.
Xerox Annual Report 2007 43
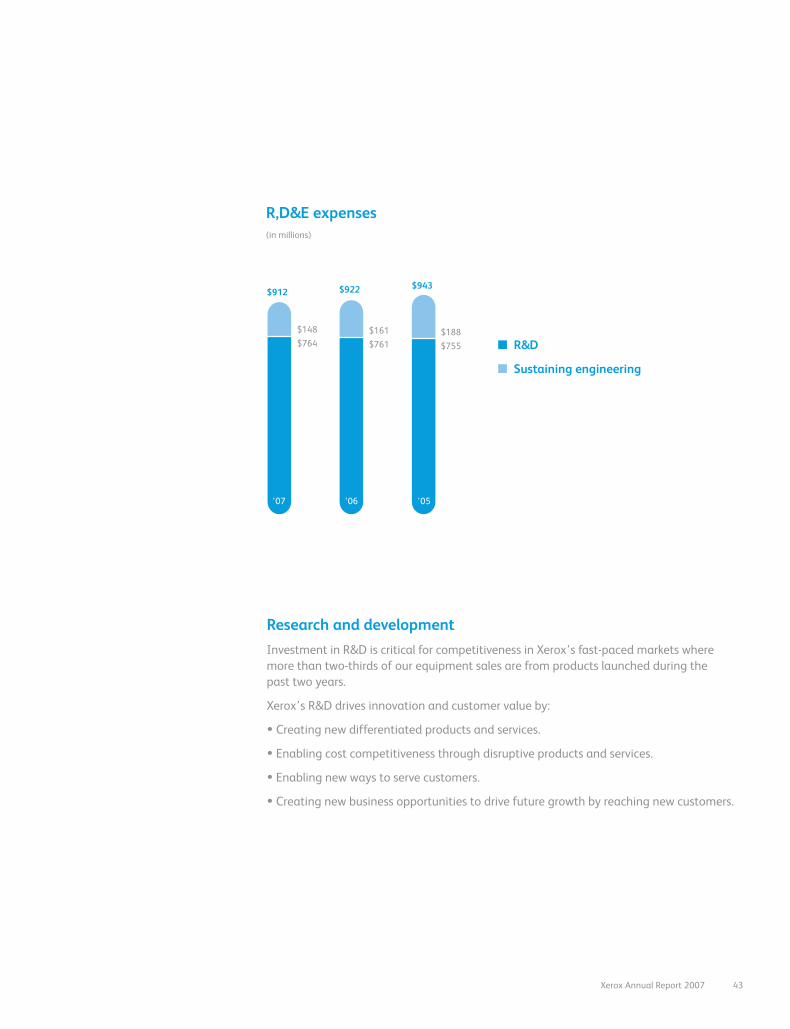
Research and development Investment in R&D is critical for competitiveness in Xerox’s fast-paced markets where
more than two-thirds of our equipment sales are from products launched during the
past two years.
Xerox’s R&D drives innovation and customer value by:
• Creating new differentiated products and services.
• Enabling cost competitiveness through disruptive products and services.
• Enabling new ways to serve customers.
• Creating new business opportunities to drive future growth by reaching new customers.
R,D&E expenses(in millions)
■ R&D
■ Sustaining engineering
$764
$148
$912
$761
$161
$922
$755
$188
$943
’07 ’06 ’05
44
To ensure our success, we have aligned our R&D investment portfolio with our strategic
planks: accelerating the color transition, driving the “New Business of Printing®”,
enhancing customer value by leading with services and expanding our participation
in the SMB market. 2007 R&D spending focused primarily on the development of high-
end business applications to drive the “New Business of Printing®”, extending our color
capabilities, expanding our services offerings and delivering lower-cost platforms and
customer productivity enablers. The Xerox iGen3, an advanced next-generation digital
printing press that produces photographic-quality prints indistinguishable from offset,
the Xerox Nuvera 288 Digital Perfecting System that boasts the fastest (288 duplex
impressions per minute) digital duplex monochrome cut-sheet printer in the industry
and Xerox’s proprietary Solid Ink technology for the offi ce are examples of the type of
breakthrough technology we developed and that we expect will drive future growth.
Sustaining engineering expenses, which are the hardware engineering and software
development costs we incur after we launch a product are included in our R,D&E expenses.
We are incorporating by reference the amounts spent for research, development and
engineering for 2007, 2006 and 2005 that are included in Note 1-Summary of Signifi cant
Accounting Policies in the Consolidated Financial Statements in our 2007 Annual Report.
Our business
Our R&D is strategically coordinated with that of Fuji Xerox, which invested $672 million in R&D in 2007,
$660 million in 2006 and $720 million in 2005.
Xerox Annual Report 2007 45
Patents, trademarks and licenses We are a technology company. Including our Xerox Palo Alto Research Center (PARC)
subsidiary, we were awarded 584 U.S. utility patents in 2007. We were ranked 33rd on
the list of companies that were awarded the most U.S. patents during the year and would
have been ranked 27th with the inclusion of PARC patents. Including our research partner,
Fuji Xerox Co., Limited, we were awarded over 900 U.S. utility patents in 2007. Our patent
portfolio evolves as new patents are awarded to us and as older patents expire. As of
December 31, 2007, we held approximately 8,600 design and utility U.S. patents. These
patents expire at various dates up to 20 years or more from their original fi ling dates.
While we believe that our portfolio of patents and applications has value, in general no
single patent is essential to our business or any individual segment. In addition, any of our
proprietary rights could be challenged, invalidated, or circumvented or may not provide
signifi cant competitive advantages.
In the U.S., we are party to numerous patent-licensing agreements and, in a majority
of them, we license or assign our patents to others, in return for revenue and/or access
to their patents. Most of the patent licenses expire concurrently with the expiration of
the last patent identifi ed in the license. In 2007, including our PARC subsidiary, we added
9 agreements to our portfolio of patent licensing agreements, and either we or our PARC
subsidiary was a licensor in 7 of the agreements. We also have a number of cross-licensing
agreements with companies with substantial patent portfolios, including Canon, Microsoft,
IBM, Hewlett Packard, Océ and Sharp. Those agreements vary in subject matter, scope,
compensation, signifi cance and time.
In the U.S., we own approximately 550 trademarks, either registered or applied for. These
trademarks have a perpetual life, subject to renewal every ten years. We vigorously enforce
and protect our trademarks.
Competition Although we encounter aggressive competition in all areas of our business, we are the
leader or among the leaders in each of our principal business segments. Our competitors
range from large international companies to relatively small fi rms. We compete primarily
on the basis of technology, performance, price, quality, reliability, brand, distribution,
and customer service and support. To remain competitive we invest in and develop new
products and services and continually improve our existing offerings. Our key competitors
include Canon, Ricoh, IKON, Hewlett-Packard, and, in certain areas of the business, Pitney
Bowes, Kodak, Océ, Konica-Minolta and Lexmark. We believe that our brand recognition,
reputation for document knowledge and expertise, innovative technology, breadth of
product offerings, global distribution channels, customer relationships and large customer
base are important competitive advantages. We and our competitors continue to develop
and market new and innovative products at competitive prices, and, at any given time,
we may set new market standards for quality, speed and function.
46
Our business
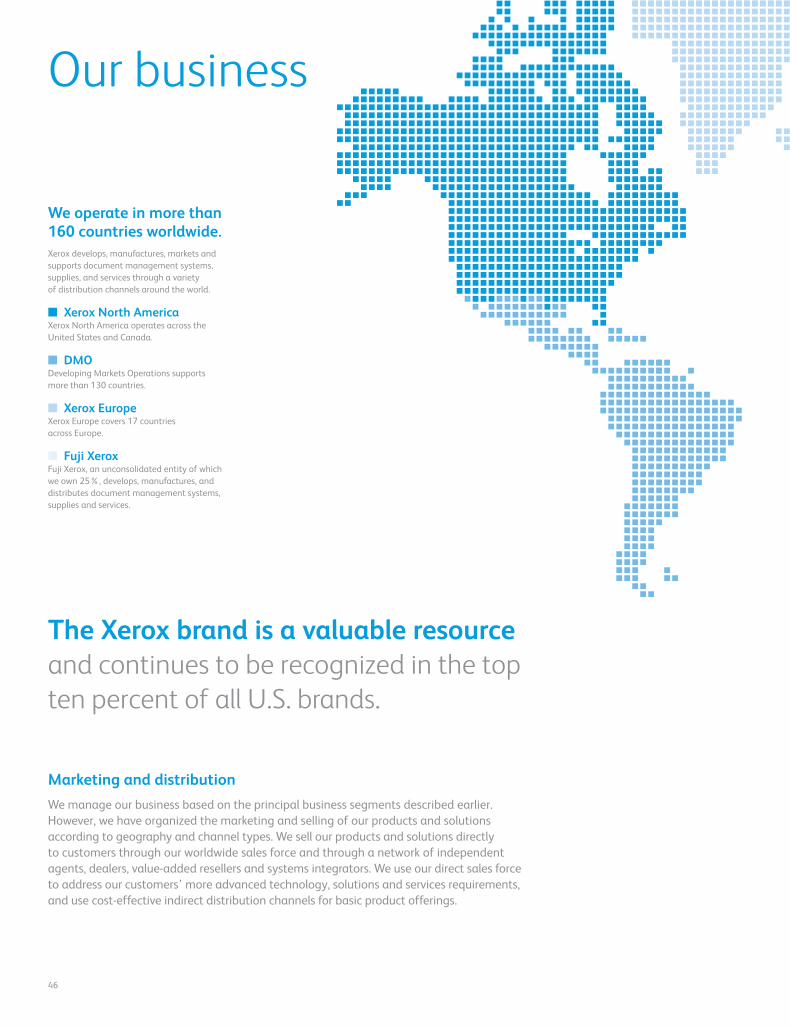
We operate in more than 160 countries worldwide.Xerox develops, manufactures, markets and
supports document management systems,
supplies, and services through a variety
of distribution channels around the world.
■ Xerox North AmericaXerox North America operates across the
United States and Canada.
■ DMODeveloping Markets Operations supports
more than 130 countries.
■ Xerox EuropeXerox Europe covers 17 countries
across Europe.
■ Fuji XeroxFuji Xerox, an unconsolidated entity of which
we own 25%, develops, manufactures, and
distributes document management systems,
supplies and services.
The Xerox brand is a valuable resource
and continues to be recognized in the top
ten percent of all U.S. brands.
Marketing and distribution We manage our business based on the principal business segments described earlier.
However, we have organized the marketing and selling of our products and solutions
according to geography and channel types. We sell our products and solutions directly
to customers through our worldwide sales force and through a network of independent
agents, dealers, value-added resellers and systems integrators. We use our direct sales force
to address our customers’ more advanced technology, solutions and services requirements,
and use cost-effective indirect distribution channels for basic product offerings.
Xerox Annual Report 2007 47
In large enterprises, we follow a services led approach that allows us to address two
basic challenges facing large enterprises:
1) How to optimize their infrastructure to be both cost effective and globally consistent.
2) How to improve their value proposition and communication with their customers.
In response to these needs, we bring a go-to-market approach that leads with the largest
direct sales and service delivery force in the industry available on a globally consistent
manner. This can range from hardware, software or services in whatever combination is
necessary to meet the needs of that customer.
In 2007 we substantially increased our distribution capabilities to the SMB market in
the U.S. through our acquisition of GIS. GIS has a proven track record of delivering value
to customers in the SMB market through a decentralized management structure that
emphasizes local customer connections and empowerments. We have maintained that
operating structure and approach. GIS, which had previously not distributed Xerox
products, now brings Xerox product options to a segment of the market where we were
previously underrepresented. GIS was built up over the years through acquisitions and
now operates in 32 states in the U.S. In 2007 GIS acquired six additional companies,
four after our acquisition of GIS, and going forward we will continue to support GIS in
expanding its footprint.
48
We market our Phaser line of color and monochrome laser-class and solid ink printers
primarily through offi ce information technology industry resellers, who typically access
our products through distributors. In 2007, we expanded our distribution partnerships
in North America by recruiting an expanded set of information technology resellers and
enhancing our network of independent agents. We also continued to increase the product
offerings available through a two-tiered distribution model in Europe and DMO.
We are increasing our use of partners to expand our market coverage. Through reseller
alliances with Fujifi lm Graphics Systems and Fujifi lm Imaging Systems, we distribute our
production products to graphic communications customers and the photo market industries.
In 2007 we signed a contract with Fujifi lm Graphics Systems in Europe to compliment the
contracts in the U.S. and Canada. We have launched in six western European countries and
will continue to expand throughout 2008. We also signed a reseller contract with Fujifi lm
Imaging Systems in both the U.S. and Canada to enable a channel for production products
that support the digital photo specialty application market. We also have an alliance with
Electronic Data Systems (EDS) which is designed to integrate EDS’ information technology
(IT) services with our document management systems and services to provide customers
with full IT infrastructure support. Overall, through The Xerox Connection partner program,
we have over 125 partners who work with us to provide solutions.
In Europe, Africa, the Middle East, India, and parts of Asia, we distribute our products
through Xerox Limited, a company established under the laws of England, and related
non-U.S. companies all of which we refer to as Xerox Limited. Xerox Limited enters into
distribution agreements with unaffi liated third parties covering distribution of our
products in some of the countries located in these regions, and previously entered into
agreements with unaffi liated third parties covering distribution of our products in Iran,
Sudan, and Syria. Iran, Sudan, and Syria, among others, have been designated as state
sponsors of terrorism by the U.S. Department of State and are subject to U.S. economic
sanctions. We maintain an export and sanctions compliance program and believe that
we have been and are in compliance with U.S. laws and government regulations for these
countries. In addition, we had no assets, liabilities, or operations in these countries other
than liabilities under the distribution agreements. After observing required prior notice
periods, Xerox Limited terminated its distribution agreements related to Sudan and Syria
in August 2006 and terminated its distribution agreement related to Iran in December
2006, and now has only legacy obligations such as providing spare parts and supplies
to these third parties. In 2007, we had total revenues of $17.2 billion, of which approxi-
mately $7.7 million was attributable to Iran and less than $0.25 million in total was
attributable to Sudan and Syria. As a result of the termination of these agreements,
we anticipate that our revenues attributable to these countries will decline.
In January 2006, Xerox Limited entered into a fi ve-year distribution agreement with
an unaffi liated third party covering distribution of our products in Libya. Libya is also
designated as a state sponsor of terrorism by the U.S. Department of State. The decision
to enter into this distribution agreement was made in light of recent U.S. federal govern-
ment actions that have lifted the countrywide embargo previously imposed on Libya.
Our sales in Libya through this distribution agreement will be subject to our export and
sanctions compliance program and will be according to the U.S. laws and government
regulations that relate to Libya.
Our business
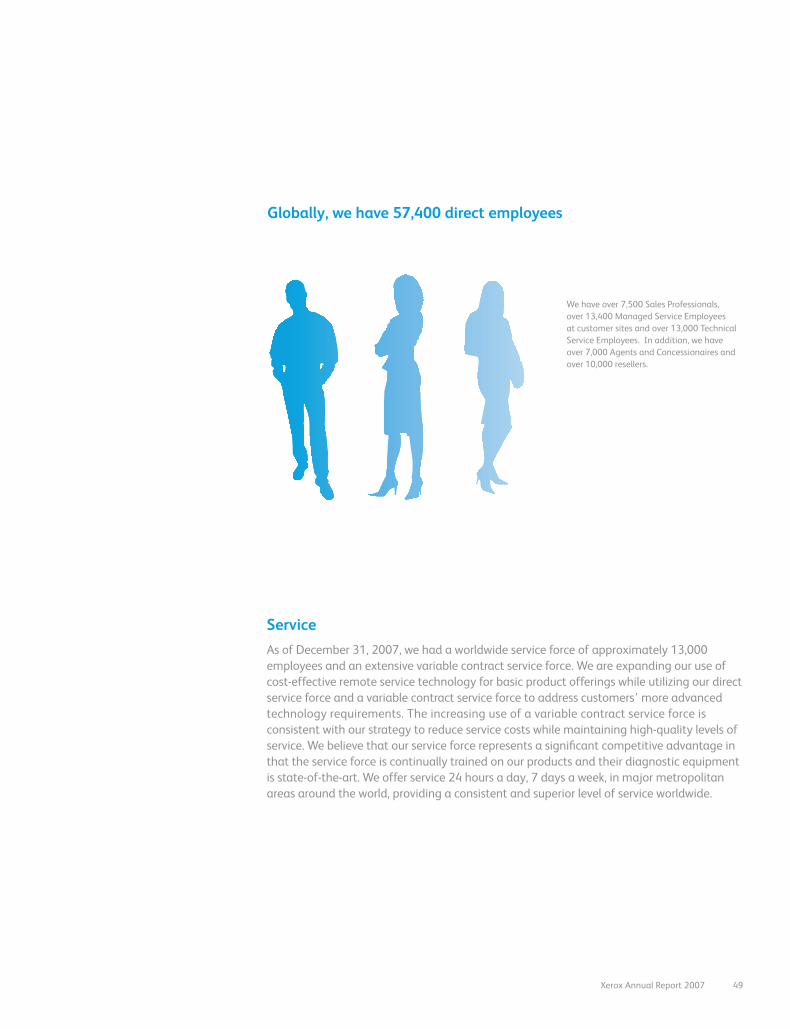
Xerox Annual Report 2007 49
ServiceAs of December 31, 2007, we had a worldwide service force of approximately 13,000
employees and an extensive variable contract service force. We are expanding our use of
cost-effective remote service technology for basic product offerings while utilizing our direct
service force and a variable contract service force to address customers’ more advanced
technology requirements. The increasing use of a variable contract service force is
consistent with our strategy to reduce service costs while maintaining high-quality levels of
service. We believe that our service force represents a signifi cant competitive advantage in
that the service force is continually trained on our products and their diagnostic equipment
is state-of-the-art. We offer service 24 hours a day, 7 days a week, in major metropolitan
areas around the world, providing a consistent and superior level of service worldwide.
Globally, we have 57,400 direct employees
We have over 7,500 Sales Professionals,
over 13,400 Managed Service Employees
at customer sites and over 13,000 Technical
Service Employees. In addition, we have
over 7,000 Agents and Concessionaires and
over 10,000 resellers.
50
Manufacturing and supply We are currently in the fi rst year of a 2007 master supply agreement with Flextronics,
a global electronics manufacturing services company, to outsource portions of
manufacturing for our Offi ce segment. The agreement is for three years with two
additional one-year extension periods at our option. Our inventory purchases from
Flextronics currently represent approximately 20% of our overall worldwide inventory
procurement. We have agreed to purchase from Flextronics some products and
consumables within specifi ed product families. Flextronics must acquire inventory in
anticipation of meeting our forecasted requirements and must maintain suffi cient
manufacturing capacity to satisfy these requirements. Under certain circumstances,
we may be obligated to purchase inventory that remains unused for more than
180 days or becomes obsolete, or on the termination of the supply agreement.
We acquire other offi ce products from various third parties, to increase the breadth of
our product portfolio, and to meet channel requirements. We also have arrangements
with Fuji Xerox under which we purchase some products from and sell other products
to Fuji Xerox. Some of these purchases and sales are the result of mutual research and
development arrangements. Our remaining manufacturing operations are primarily
located in Rochester, New York and Dundalk, Ireland for our high-end production products
and consumables, and in Wilsonville, Oregon for solid ink products, consumable supplies,
and components for our Offi ce segment products.
In 2007 Xerox opened a $60 million emulsion aggregation (EA) toner plant in Webster,
New York. EA toner was developed by Xerox and is protected by more than 300 patents.
EA toner is chemically grown enabling the size, shape and structure of the particles to
be precisely controlled which leads to improved print quality, less toner usage, less toner
waste and less energy required for manufacturing and for printing. Xerox also opened
in 2007 a $24 million state-of-the art automated ink manufacturing plant in Wilsonville,
Oregon to serve growing demand for its proprietary solid ink color printers.
Fuji XeroxFuji Xerox Co., Limited is an unconsolidated entity in which we currently own 25% and
FUJIFILM Holdings Corporation (FujiFilm) owns 75%. Fuji Xerox develops, manufactures
and distributes document processing products in Japan, China, Hong Kong and other
areas of the Pacifi c Rim, Australia and New Zealand. We retain signifi cant rights as a
minority shareholder. Our technology licensing agreements with Fuji Xerox ensure that
the two companies retain uninterrupted access to each other’s portfolio of patents,
technology and products.
Our business
Xerox Annual Report 2007 51
International operationsWe are incorporating by reference the fi nancial measures by geographical area for
2007, 2006 and 2005 that are included in Note 2-Segment Reporting in the Consolidated
Financial Statements in our 2007 Annual Report. See also the risk factors entitled “Our
business results of operations and fi nancial condition may be negatively impacted by
economic conditions abroad, including fl uctuating foreign currencies and shifting regulatory
schemes.” in Part 1, Item 1A of our 2007 Form 10K.
Backlog We believe that backlog, or the value of unfi lled orders, is not a meaningful indicator of
future business prospects because of the signifi cant proportion of our revenue that follows
equipment installation, the large volume of products we deliver from shelf inventories,
and the shortening of product life cycles.
Seasonality Our revenues are affected by such factors as the introduction of new products, the length
of the sales cycles, and the seasonality of technology purchases. As a result, our operating
results are diffi cult to predict. These factors have historically resulted in lower revenue in
the fi rst quarter than in the immediately preceding fourth quarter.
Other information Xerox is a New York corporation, organized in 1906, and our principal executive offi ces are
located at 45 Glover Avenue, P.O. Box 4505, Norwalk, Connecticut 06856-4505.
Our telephone number is (203) 968-3000.
On the Investor Information section of our Internet website, you will fi nd our annual
reports on Form 10-K, quarterly reports on Form 10-Q, current reports on Form 8-K, and any
amendments to these reports. We make these documents available as soon as we can after
we have fi led them with, or furnished them to, the Securities and Exchange Commission.
Our Internet address is http://www.xerox.com.
MANAGEMENT’S DISCUSSION AND ANALYSIS OF RESULTSOF OPERATIONS AND FINANCIAL CONDITION
The following Management’s Discussion and Analysis(“MD&A”) is intended to help the reader understand theresults of operations and financial condition of XeroxCorporation. MD&A is provided as a supplement to, andshould be read in conjunction with, our consolidatedfinancial statements and the accompanying notes.
Throughout this document, references to “we,” “our,”the “Company” and “Xerox” refer to Xerox Corporationand its subsidiaries. References to “Xerox Corporation”refer to the stand-alone parent company and do notinclude its subsidiaries.
Executive Overview
We are a technology and services enterprise and aleader in the global document market, developing,manufacturing, marketing, servicing and financing theindustry’s broadest portfolio of document equipment,solutions and services. The document industry istransitioning to digital systems, color, and to an increasedreliance on electronic documents. Increasingly, businessesare digitally creating and storing documents and using theInternet to exchange electronic documents. Morecustomers are seeking to gain efficiencies in theirdocument management processes and are looking to usfor document related services to achieve thoseefficiencies. We believe these trends play to the strengthsof our product and service offerings and representopportunities for future growth in the $125 billion marketwe serve. These transformations also representopportunities for future growth since our research anddevelopment investments have been focused on digital,color and services offerings and our acquisitions havefocused on expanding our services, software anddistribution capabilities.
We operate in a global business environment, servinga wide range of customers with about 50 percent of ourrevenue generated from customers outside the U.S. Ourmarkets are competitive and our customers demand
improved solutions, such as the ability to print offsetquality color documents on-demand; improved productfunctionality, such as the ability to print, copy, fax andscan from a single device; and lower prices for the samefunctionality. Customers are demanding documentservices such as assessment consulting, managed services,imaging and hosting and document intensive businessprocess improvements.
We deliver advanced technology through investmentsin research and development and offset lower prices byfocusing on streamlining our cost base. The majority ofour revenue is recurring revenue (supplies, service, paper,outsourcing and rentals), which we collectively refer to aspost sale revenue. Post sale revenue is driven by theamount of equipment installed at customer locations andthe utilization of those devices. As such, our critical successfactors include equipment installations, which stabilizeand grow our installed base of equipment at customerlocations, page volume growth and higher revenue perpage. Key drivers to increase equipment usage areconnected multifunction devices, new services andsolutions. The transition to color is the primary driver toimprove revenue per page, as color documents typicallyrequire significantly more toner coverage per page thantraditional black-and-white printing.
Financial Overview
In 2007, we grew revenue, expanded earnings andgenerated strong operating cash flow. Our investments inthe growing areas of digital production and officesystems, particularly with respect to color products,contributed to the majority of our equipment sales beinggenerated from products launched in the last two years.During 2007 we completed the acquisitions of GlobalImaging Systems, Inc. (“GIS”) and Advectis, Inc. Theacquisition of GIS greatly expanded our reach in the smallto mid-size business (“SMB”) market and together with
favorable currency was a key driver of our increase inrevenue. Total revenue increased 8% over the prior yearreflecting 9% growth in post sale, financing and otherrevenue and 7% equipment sales growth. Total colorrevenue was up 14% over the prior year reflecting ourinvestments in this market and document managementservices (also referred to as “Xerox Global Services”) postsale, financing and other revenue of $3.4 billion increased8% over 2006.
52
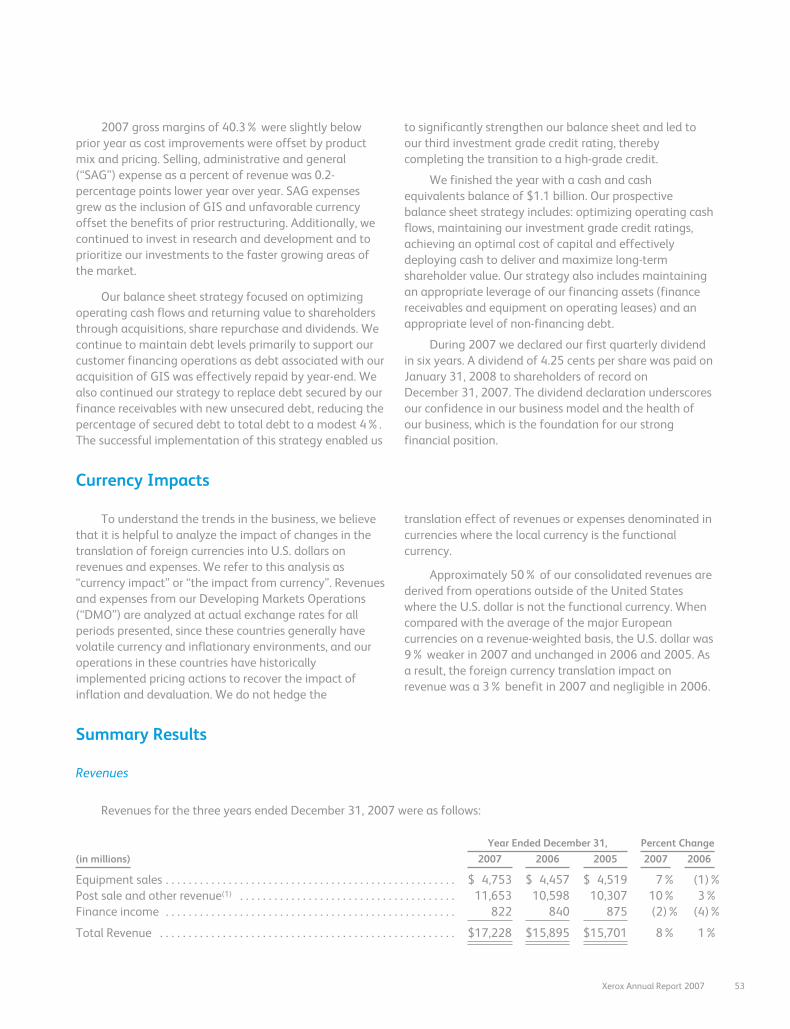
2007 gross margins of 40.3% were slightly belowprior year as cost improvements were offset by productmix and pricing. Selling, administrative and general(“SAG”) expense as a percent of revenue was 0.2-percentage points lower year over year. SAG expensesgrew as the inclusion of GIS and unfavorable currencyoffset the benefits of prior restructuring. Additionally, wecontinued to invest in research and development and toprioritize our investments to the faster growing areas ofthe market.
Our balance sheet strategy focused on optimizingoperating cash flows and returning value to shareholdersthrough acquisitions, share repurchase and dividends. Wecontinue to maintain debt levels primarily to support ourcustomer financing operations as debt associated with ouracquisition of GIS was effectively repaid by year-end. Wealso continued our strategy to replace debt secured by ourfinance receivables with new unsecured debt, reducing thepercentage of secured debt to total debt to a modest 4%.The successful implementation of this strategy enabled us
to significantly strengthen our balance sheet and led toour third investment grade credit rating, therebycompleting the transition to a high-grade credit.
We finished the year with a cash and cashequivalents balance of $1.1 billion. Our prospectivebalance sheet strategy includes: optimizing operating cashflows, maintaining our investment grade credit ratings,achieving an optimal cost of capital and effectivelydeploying cash to deliver and maximize long-termshareholder value. Our strategy also includes maintainingan appropriate leverage of our financing assets (financereceivables and equipment on operating leases) and anappropriate level of non-financing debt.
During 2007 we declared our first quarterly dividendin six years. A dividend of 4.25 cents per share was paid onJanuary 31, 2008 to shareholders of record onDecember 31, 2007. The dividend declaration underscoresour confidence in our business model and the health ofour business, which is the foundation for our strongfinancial position.
Currency Impacts
To understand the trends in the business, we believethat it is helpful to analyze the impact of changes in thetranslation of foreign currencies into U.S. dollars onrevenues and expenses. We refer to this analysis as“currency impact” or “the impact from currency”. Revenuesand expenses from our Developing Markets Operations(“DMO”) are analyzed at actual exchange rates for allperiods presented, since these countries generally havevolatile currency and inflationary environments, and ouroperations in these countries have historicallyimplemented pricing actions to recover the impact ofinflation and devaluation. We do not hedge the
translation effect of revenues or expenses denominated incurrencies where the local currency is the functionalcurrency.
Approximately 50% of our consolidated revenues arederived from operations outside of the United Stateswhere the U.S. dollar is not the functional currency. Whencompared with the average of the major Europeancurrencies on a revenue-weighted basis, the U.S. dollar was9% weaker in 2007 and unchanged in 2006 and 2005. Asa result, the foreign currency translation impact onrevenue was a 3% benefit in 2007 and negligible in 2006.
Summary Results
Revenues
Revenues for the three years ended December 31, 2007 were as follows:
(in millions)
Year Ended December 31, Percent Change
2007 2006 2005 2007 2006
Equipment sales . . . . . . . . . . . . . . . . . . . . . . . . . . . . . . . . . . . . . . . . . . . . . . . . . . . $ 4,753 $ 4,457 $ 4,519 7% (1)%Post sale and other revenue(1) . . . . . . . . . . . . . . . . . . . . . . . . . . . . . . . . . . . . . . 11,653 10,598 10,307 10% 3%Finance income . . . . . . . . . . . . . . . . . . . . . . . . . . . . . . . . . . . . . . . . . . . . . . . . . . . 822 840 875 (2)% (4)%
Total Revenue . . . . . . . . . . . . . . . . . . . . . . . . . . . . . . . . . . . . . . . . . . . . . . . . . . . . $17,228 $15,895 $15,701 8% 1%
Xerox Annual Report 2007 53
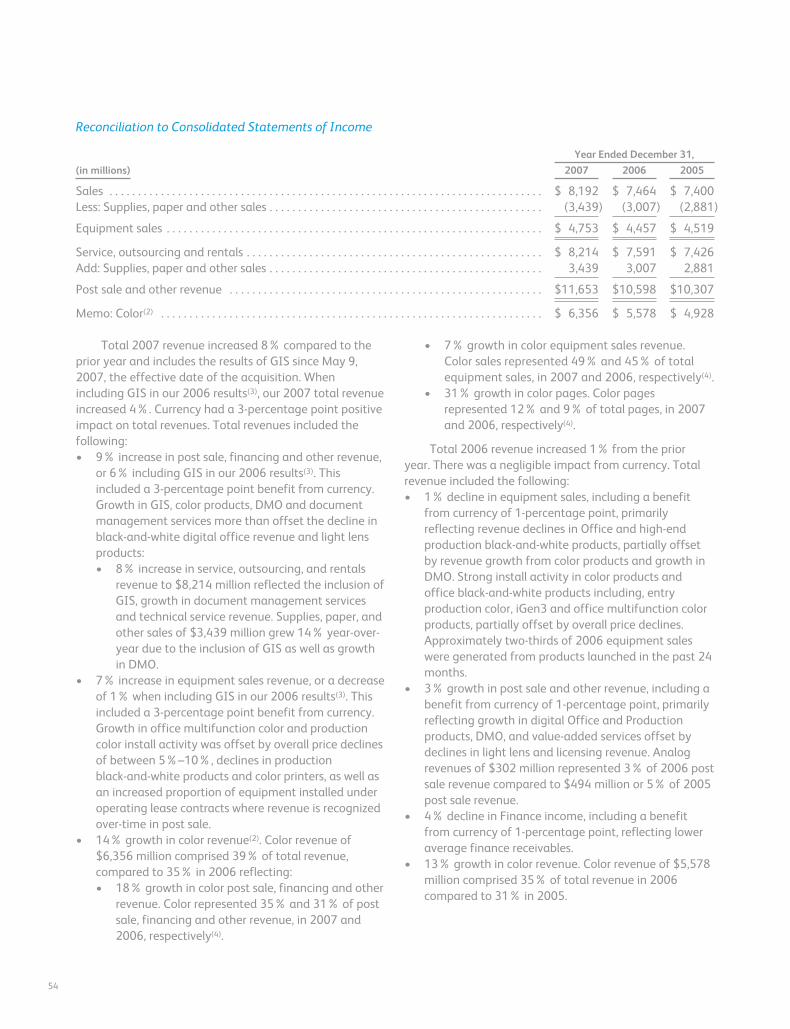
Reconciliation to Consolidated Statements of Income
(in millions)
Year Ended December 31,
2007 2006 2005
Sales . . . . . . . . . . . . . . . . . . . . . . . . . . . . . . . . . . . . . . . . . . . . . . . . . . . . . . . . . . . . . . . . . . . . . . . . . . . . $ 8,192 $ 7,464 $ 7,400Less: Supplies, paper and other sales . . . . . . . . . . . . . . . . . . . . . . . . . . . . . . . . . . . . . . . . . . . . . . . . (3,439) (3,007) (2,881)
Equipment sales . . . . . . . . . . . . . . . . . . . . . . . . . . . . . . . . . . . . . . . . . . . . . . . . . . . . . . . . . . . . . . . . . . $ 4,753 $ 4,457 $ 4,519
Service, outsourcing and rentals . . . . . . . . . . . . . . . . . . . . . . . . . . . . . . . . . . . . . . . . . . . . . . . . . . . . $ 8,214 $ 7,591 $ 7,426Add: Supplies, paper and other sales . . . . . . . . . . . . . . . . . . . . . . . . . . . . . . . . . . . . . . . . . . . . . . . . 3,439 3,007 2,881
Post sale and other revenue . . . . . . . . . . . . . . . . . . . . . . . . . . . . . . . . . . . . . . . . . . . . . . . . . . . . . . . $11,653 $10,598 $10,307
Memo: Color(2) . . . . . . . . . . . . . . . . . . . . . . . . . . . . . . . . . . . . . . . . . . . . . . . . . . . . . . . . . . . . . . . . . . . $ 6,356 $ 5,578 $ 4,928
Total 2007 revenue increased 8% compared to theprior year and includes the results of GIS since May 9,2007, the effective date of the acquisition. Whenincluding GIS in our 2006 results(3), our 2007 total revenueincreased 4%. Currency had a 3-percentage point positiveimpact on total revenues. Total revenues included thefollowing:• 9% increase in post sale, financing and other revenue,
or 6% including GIS in our 2006 results(3). Thisincluded a 3-percentage point benefit from currency.Growth in GIS, color products, DMO and documentmanagement services more than offset the decline inblack-and-white digital office revenue and light lensproducts:• 8% increase in service, outsourcing, and rentals
revenue to $8,214 million reflected the inclusion ofGIS, growth in document management servicesand technical service revenue. Supplies, paper, andother sales of $3,439 million grew 14% year-over-year due to the inclusion of GIS as well as growthin DMO.
• 7% increase in equipment sales revenue, or a decreaseof 1% when including GIS in our 2006 results(3). Thisincluded a 3-percentage point benefit from currency.Growth in office multifunction color and productioncolor install activity was offset by overall price declinesof between 5%–10%, declines in productionblack-and-white products and color printers, as well asan increased proportion of equipment installed underoperating lease contracts where revenue is recognizedover-time in post sale.
• 14% growth in color revenue(2). Color revenue of$6,356 million comprised 39% of total revenue,compared to 35% in 2006 reflecting:• 18% growth in color post sale, financing and other
revenue. Color represented 35% and 31% of postsale, financing and other revenue, in 2007 and2006, respectively(4).
• 7% growth in color equipment sales revenue.Color sales represented 49% and 45% of totalequipment sales, in 2007 and 2006, respectively(4).
• 31% growth in color pages. Color pagesrepresented 12% and 9% of total pages, in 2007and 2006, respectively(4).
Total 2006 revenue increased 1% from the prioryear. There was a negligible impact from currency. Totalrevenue included the following:• 1% decline in equipment sales, including a benefit
from currency of 1-percentage point, primarilyreflecting revenue declines in Office and high-endproduction black-and-white products, partially offsetby revenue growth from color products and growth inDMO. Strong install activity in color products andoffice black-and-white products including, entryproduction color, iGen3 and office multifunction colorproducts, partially offset by overall price declines.Approximately two-thirds of 2006 equipment saleswere generated from products launched in the past 24months.
• 3% growth in post sale and other revenue, including abenefit from currency of 1-percentage point, primarilyreflecting growth in digital Office and Productionproducts, DMO, and value-added services offset bydeclines in light lens and licensing revenue. Analogrevenues of $302 million represented 3% of 2006 postsale revenue compared to $494 million or 5% of 2005post sale revenue.
• 4% decline in Finance income, including a benefitfrom currency of 1-percentage point, reflecting loweraverage finance receivables.
• 13% growth in color revenue. Color revenue of $5,578million comprised 35% of total revenue in 2006compared to 31% in 2005.
54
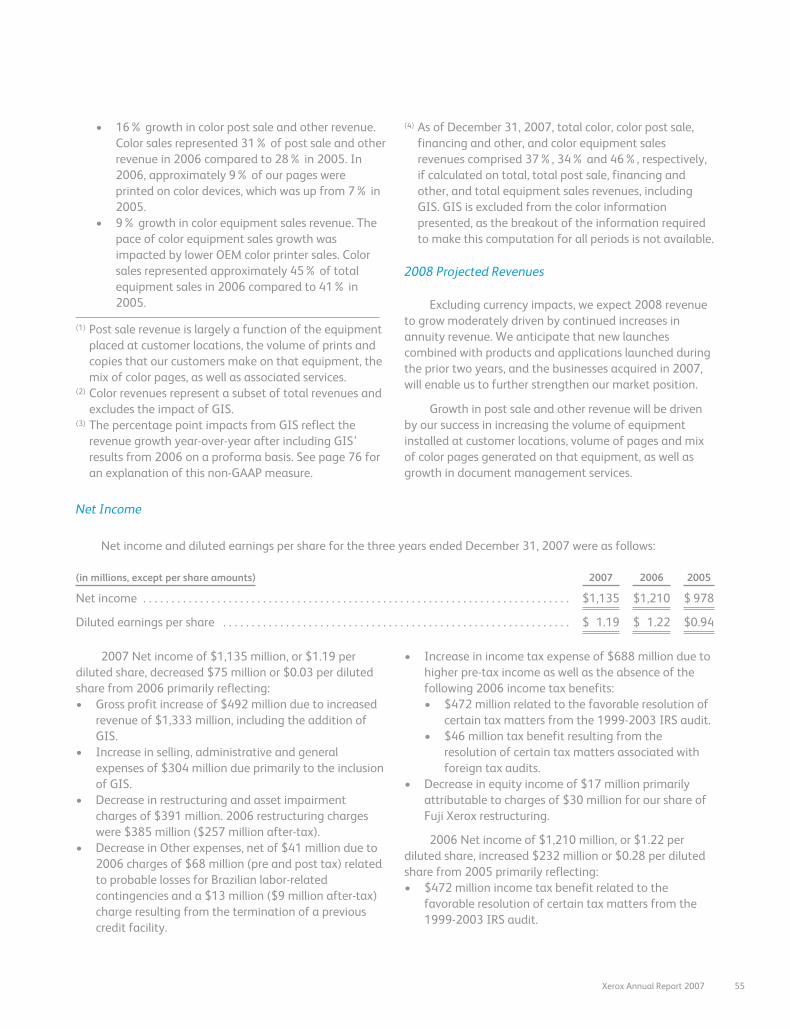
• 16% growth in color post sale and other revenue.Color sales represented 31% of post sale and otherrevenue in 2006 compared to 28% in 2005. In2006, approximately 9% of our pages wereprinted on color devices, which was up from 7% in2005.
• 9% growth in color equipment sales revenue. Thepace of color equipment sales growth wasimpacted by lower OEM color printer sales. Colorsales represented approximately 45% of totalequipment sales in 2006 compared to 41% in2005.
(1) Post sale revenue is largely a function of the equipmentplaced at customer locations, the volume of prints andcopies that our customers make on that equipment, themix of color pages, as well as associated services.
(2) Color revenues represent a subset of total revenues andexcludes the impact of GIS.
(3) The percentage point impacts from GIS reflect therevenue growth year-over-year after including GIS’results from 2006 on a proforma basis. See page 76 foran explanation of this non-GAAP measure.
(4) As of December 31, 2007, total color, color post sale,financing and other, and color equipment salesrevenues comprised 37%, 34% and 46%, respectively,if calculated on total, total post sale, financing andother, and total equipment sales revenues, includingGIS. GIS is excluded from the color informationpresented, as the breakout of the information requiredto make this computation for all periods is not available.
2008 Projected Revenues
Excluding currency impacts, we expect 2008 revenueto grow moderately driven by continued increases inannuity revenue. We anticipate that new launchescombined with products and applications launched duringthe prior two years, and the businesses acquired in 2007,will enable us to further strengthen our market position.
Growth in post sale and other revenue will be drivenby our success in increasing the volume of equipmentinstalled at customer locations, volume of pages and mixof color pages generated on that equipment, as well asgrowth in document management services.
Net Income
Net income and diluted earnings per share for the three years ended December 31, 2007 were as follows:
(in millions, except per share amounts) 2007 2006 2005
Net income . . . . . . . . . . . . . . . . . . . . . . . . . . . . . . . . . . . . . . . . . . . . . . . . . . . . . . . . . . . . . . . . . . . . . . . . . . . $1,135 $1,210 $ 978
Diluted earnings per share . . . . . . . . . . . . . . . . . . . . . . . . . . . . . . . . . . . . . . . . . . . . . . . . . . . . . . . . . . . . . $ 1.19 $ 1.22 $0.94
2007 Net income of $1,135 million, or $1.19 perdiluted share, decreased $75 million or $0.03 per dilutedshare from 2006 primarily reflecting:• Gross profit increase of $492 million due to increased
revenue of $1,333 million, including the addition ofGIS.
• Increase in selling, administrative and generalexpenses of $304 million due primarily to the inclusionof GIS.
• Decrease in restructuring and asset impairmentcharges of $391 million. 2006 restructuring chargeswere $385 million ($257 million after-tax).
• Decrease in Other expenses, net of $41 million due to2006 charges of $68 million (pre and post tax) relatedto probable losses for Brazilian labor-relatedcontingencies and a $13 million ($9 million after-tax)charge resulting from the termination of a previouscredit facility.
• Increase in income tax expense of $688 million due tohigher pre-tax income as well as the absence of thefollowing 2006 income tax benefits:• $472 million related to the favorable resolution of
certain tax matters from the 1999-2003 IRS audit.• $46 million tax benefit resulting from the
resolution of certain tax matters associated withforeign tax audits.
• Decrease in equity income of $17 million primarilyattributable to charges of $30 million for our share ofFuji Xerox restructuring.
2006 Net income of $1,210 million, or $1.22 perdiluted share, increased $232 million or $0.28 per dilutedshare from 2005 primarily reflecting:• $472 million income tax benefit related to the
favorable resolution of certain tax matters from the1999-2003 IRS audit.
Xerox Annual Report 2007 55
• $68 million (pre-tax and after-tax) for litigationmatters related to probable losses on Brazilian labor-related contingencies.
• $46 million tax benefit resulting from the resolution ofcertain tax matters associated with foreign tax audits.
• $13 million ($9 million after-tax) charge from thewrite-off of the unamortized deferred debt issuancecosts as a result of the termination of a previous creditfacility.
• $385 million ($257 million after-tax) restructuring andasset impairment charges.
2005 Net income of $978 million, or $0.94 perdiluted share, included the following:• $343 million after-tax benefit related to the
finalization of the 1996-1998 IRS audit.• $115 million ($84 million after-tax) charge for
litigation matters relating to the MPI arbitration paneldecision and probable losses for other legal matters.
• $93 million ($58 million after-tax) gain related to thesale of our total equity interest in Integic Corporation(“Integic”).
• $366 million ($247 million after-tax) restructuring andasset impairment charges.
Application of Critical Accounting Policies
In preparing our Consolidated Financial Statementsand accounting for the underlying transactions andbalances, we apply various accounting policies. Seniormanagement has discussed the development andselection of the critical accounting policies, estimates andrelated disclosures, included herein, with the AuditCommittee of the Board of Directors. We consider thepolicies discussed below as critical to understanding ourConsolidated Financial Statements, as their applicationplaces the most significant demands on management’sjudgment, since financial reporting results rely onestimates of the effects of matters that are inherentlyuncertain. In instances where different estimates couldhave reasonably been used, we disclosed the impact ofthese different estimates on our operations. In certaininstances like revenue recognition for leases, theaccounting rules are prescriptive; therefore, it would nothave been possible to reasonably use different estimates.Changes in assumptions and estimates are reflected in theperiod in which they occur. The impact of such changescould be material to our results of operations and financialcondition in any quarterly or annual period.
Specific risks associated with these critical accountingpolicies are discussed throughout the MD&A, where suchpolicies affect our reported and expected financial results.For a detailed discussion of the application of these andother accounting policies, refer to Note 1-Summary ofSignificant Accounting Policies, in the ConsolidatedFinancial Statements.
Revenue Recognition for Leases: Our accounting forleases involves specific determinations under applicablelease accounting standards, which often involve complexand prescriptive provisions. These provisions affect thetiming of revenue recognition for our equipment. If a
lease qualifies as a sales-type capital lease, equipmentrevenue is recognized upon delivery or installation of theequipment as sale revenue as opposed to ratably over thelease term. The critical elements that we consider withrespect to our lease accounting are the determination ofthe economic life and the fair value of equipment,including the residual value. For purposes of determiningthe economic life, we consider the most objective measureto be the original contract term, since most equipment isreturned by lessees at or near the end of the contractedterm. The economic life of most of our products is fiveyears since this represents the most frequent contractuallease term for our principal products and only a smallpercentage of our leases are for original terms longer thanfive years. There is no significant after-market for our usedequipment. We believe five years is representative of theperiod during which the equipment is expected to beeconomically usable, with normal service, for the purposefor which it is intended.
Revenue Recognition Under Bundled Arrangements:We sell the majority of our products and services underbundled lease arrangements, which typically includeequipment, service, supplies and financing components forwhich the customer pays a single negotiated monthlyfixed price for all elements over the contractual lease term.Typically these arrangements include an incremental,variable component for page volumes in excess ofcontractual page volume minimums, which are oftenexpressed in terms of price per page. Revenues underthese arrangements are allocated, considering the relativefair values of the lease and non-lease deliverables includedin the bundled arrangement, based upon the estimatedrelative fair values of each element. Lease deliverablesinclude maintenance and executory costs, equipment andfinancing, while non-lease deliverables generally consist of
56
supplies and non-maintenance services. Our revenueallocation for lease deliverables begins by allocatingrevenues to the maintenance and executory costs plusprofit thereon. The remaining amounts are allocated tothe equipment and financing elements. We performextensive analyses of available verifiable objectiveevidence of equipment fair value based on cash sellingprices during the applicable period. The cash selling pricesare compared to the range of values included in our leaseaccounting systems. The range of cash selling prices mustbe reasonably consistent with the lease selling prices,taking into account residual values that accrue to ourbenefit, in order for us to determine that such lease pricesare indicative of fair value. Our pricing interest rates,which are used in determining customer payments, aredeveloped based upon a variety of factors including localprevailing rates in the marketplace and the customer’scredit history, industry and credit class. We reassess ourpricing interest rates quarterly based on changes in thelocal prevailing rates in the marketplace. These interestrates are adjusted if the rates vary by twenty-five basispoints or more, cumulatively, from the last rate in effect.The pricing interest rates generally equal the implicit rateswithin the leases, as corroborated by our comparisons ofcash to lease selling prices.
Residual Values for Equipment under Lease: Residualvalues represent the recorded estimated fair value ofequipment as of the end of the lease. Residual valuesassociated with equipment under sales-type leases areincluded as a component of our net finance receivablesbalance and amounted to $69 million and $90 million atDecember 31, 2007 and 2006. Residual values associatedwith equipment under operating leases represent therecorded estimated salvage value at the end of the leaseterm and are included as a component of equipment onoperating leases, net and amounted to $36 million and$41 million at December 31, 2007 and 2006. Equipmentunder operating leases and similar arrangements aredepreciated to estimated salvage value over theirestimated useful lives.
We review residual values regularly and, whenappropriate, adjust them based on estimates of expectedmarket conditions at the end of the lease, including theimpacts of future product launches, changes inremanufacturing strategies and the expected lesseebehavior at the end of the lease term. Impairments toresidual values occur when available information indicatesthat the decline in recorded value is other than temporaryand we would therefore not be able to fully recover therecorded values. Impairments on residual values are
recognized as losses in the period in which the estimate ischanged or as a revision in depreciation estimates forsales-type leases and operating leases, respectively. Werecorded $1 million and $4 million in residual valueimpairment charges for the years ended December 31,2007 and 2005. We did not record any residual valueimpairment charges for the year ended December 31,2006.
Allowance for Doubtful Accounts and Credit Losses:We perform ongoing credit evaluations of our customersand adjust credit limits based upon customer paymenthistory and current creditworthiness. We continuouslymonitor collections and payments from our customers andmaintain a provision for estimated credit losses basedupon our historical experience and any specific customercollection issues that have been identified. While suchcredit losses have historically been within our expectationsand the provisions established, we cannot guarantee thatwe will continue to experience credit loss rates similar tothose we have experienced in the past. Measurement ofsuch losses requires consideration of historical lossexperience, including the need to adjust for currentconditions, and judgments about the probable effects ofrelevant observable data, including present economicconditions such as delinquency rates and financial healthof specific customers. We recorded bad debt provisions of$134 million, $87 million, and $72 million in SAG expensesin our Consolidated Statements of Income for the yearsended December 31, 2007, 2006 and 2005, respectively.
As discussed above, in preparing our ConsolidatedFinancial Statements for the three year period endedDecember 31, 2007, we estimated our provision fordoubtful accounts based on historical experience andcustomer-specific collection issues. This methodology hasbeen consistently applied for all periods presented. Duringthe five year period ended December 31, 2007, ourallowance for doubtful accounts ranged from 3.0% to4.6% of gross receivables. Holding all other assumptionsconstant, a 1-percentage point increase or decrease in theallowance from the December 31, 2007 rate of 3.1%would change the 2007 provision by approximately $110million.
Historically, about half of the provision for doubtfulaccounts relates to our finance receivables portfolio. Thisprovision is inherently more difficult to estimate than theprovision for trade accounts receivable because theunderlying lease portfolio has an average maturity, at anytime, of approximately two to three years and containspast due billed amounts, as well as unbilled amounts. Theestimated credit quality of any given customer and class
Xerox Annual Report 2007 57
of customer or geographic location can significantlychange during the life of the portfolio. We consider allavailable information in our quarterly assessments of theadequacy of the provision for doubtful accounts.
Pension and Post-retirement Benefit PlanAssumptions: We sponsor pension plans in various forms inseveral countries covering substantially all employees whomeet eligibility requirements. Post-retirement benefitplans cover primarily U.S. employees for retirementmedical costs. Several statistical and other factors thatattempt to anticipate future events are used in calculatingthe expense, liability and asset values related to ourpension and post-retirement benefit plans. These factorsinclude assumptions we make about the discount rate,expected return on plan assets, rate of increase inhealthcare costs, the rate of future compensationincreases and mortality. For purposes of determining theexpected return on plan assets, we utilize a calculatedvalue approach in determining the value of the pensionplan assets, as opposed to a fair market value approach.The primary difference between the two methods relatesto a systematic recognition of changes in fair value overtime (generally two years) versus immediate recognitionof changes in fair value. Our expected rate of return onplan assets is then applied to the calculated asset value todetermine the amount of the expected return on planassets to be used in the determination of the net periodicpension cost. The calculated value approach reduces thevolatility in net periodic pension cost that can result fromusing the fair market value approach. The differencebetween the actual return on plan assets and the expectedreturn on plan assets is added to, or subtracted from, anycumulative differences that arose in prior years. Thisamount is a component of the net actuarial gain or lossand is subject to amortization to net periodic pension costover the average remaining service lives of the employeesparticipating in the pension plan.
Total actuarial losses for our pension plans as ofDecember 31, 2007 were $1 billion, as compared to $1.6billion at December 31, 2006. The change fromDecember 31, 2006 relates primarily to an increase in thediscount rate. The total actuarial loss will be amortized inthe future, subject to offsetting gains or losses that willchange the future amortization amount. We have utilizeda weighted average expected rate of return on plan assetsof 7.6% for 2007, 7.8% for 2006 and 8.0% for 2005, on aworldwide basis. In estimating this rate, we considered thehistorical returns earned by the plan assets, the rates ofreturn expected in the future and our investment strategyand asset mix with respect to the plans’ funds. The
weighted average expected rate of return on plan assetswe will utilize for 2008 will be 7.6%.
Another significant assumption affecting our pensionand post-retirement benefit obligations and the netperiodic pension and other post-retirement benefit cost isthe rate that we use to discount our future anticipatedbenefit obligations. The discount rate reflects the currentrate at which the pension liabilities could be effectivelysettled considering the timing of expected payments forplan participants. In estimating this rate, we consider ratesof return on high quality fixed-income investmentsincluded in various published bond indexes, adjusted toeliminate the effects of call provisions and differences inthe timing and amounts of cash outflows related to thebonds. In the U.S. and the U.K., which compriseapproximately 80% of our projected benefit obligations,we consider the Moody’s Aa Corporate Bond Index andthe International Index Company’s iBoxx SterlingCorporate AA Cash Bond Index, respectively in thedetermination of the appropriate discount rateassumptions. The weighted average rate we utilized tomeasure our pension obligation as of December 31, 2007and calculate our 2008 expense was 5.9%, which is anincrease from 5.3% used in determining 2007 expense.Assuming settlement losses in 2008 are consistent with2007, our 2008 net periodic pension cost is expected to beapproximately $40 million lower than 2007, primarily as aresult of the increase in the discount rate.
On a consolidated basis, we recognized net periodicpension cost of $315 million, $425 million, and $414million for the years ended December 31, 2007, 2006 and2005, respectively. The costs associated with our definedcontribution plans, which are included in net periodicpension cost, were $80 million, $70 million and $71 millionfor the years ended December 31, 2007, 2006 and 2005,respectively. Pension cost is included in several incomestatement components based on the related underlyingemployee costs. Pension and post-retirement benefit planassumptions are included in Note 14-Employee BenefitPlans in the Consolidated Financial Statements. Holdingall other assumptions constant, a 0.25% increase ordecrease in the discount rate would change the 2008projected net periodic pension cost by $26 million.Likewise, a 0.25% increase or decrease in the expectedreturn on plan assets would change the 2008 projectednet periodic pension cost by $19 million.
Refer to Note 1 – “New Accounting Standards andAccounting Changes” in the Consolidated FinancialStatements for additional information regarding our 2006adoption of SFAS No. 158, “Employers’ Accounting for
58
Defined Benefit Pension and Other Postretirement Plans,an amendment of FASB Statements No. 87, 88, 106 and132(R).”
Income Taxes and Tax Valuation Allowances: Werecord the estimated future tax effects of temporarydifferences between the tax bases of assets and liabilitiesand amounts reported in our Consolidated BalanceSheets, as well as operating loss and tax creditcarryforwards. We follow very specific and detailedguidelines in each tax jurisdiction regarding therecoverability of any tax assets recorded in ourConsolidated Balance Sheets and provide necessaryvaluation allowances as required. We regularly review ourdeferred tax assets for recoverability considering historicalprofitability, projected future taxable income, theexpected timing of the reversals of existing temporarydifferences and tax planning strategies. If we continue tooperate at a loss in certain jurisdictions or are unable togenerate sufficient future taxable income, or if there is amaterial change in the actual effective tax rates or timeperiod within which the underlying temporary differencesbecome taxable or deductible, we could be required toincrease the valuation allowance against all or asignificant portion of our deferred tax assets resulting in asubstantial increase in our effective tax rate and amaterial adverse impact on our operating results.Conversely, if and when our operations in somejurisdictions were to become sufficiently profitable torecover previously reserved deferred tax assets, we wouldreduce all or a portion of the applicable valuationallowance in the period when such determination is made.This would result in an increase to reported earnings insuch period. Adjustments to our valuation allowance,through charges/(credits) to income tax expense, were$14 million, $12 million, and $(38) million for the yearsended December 31, 2007, 2006 and 2005, respectively.There were other increases/(decreases) to our valuationallowance, including the effects of currency, of $86million, $45 million, and $61 million for the years endedDecember 31, 2007, 2006 and 2005, respectively, that didnot affect income tax expense in total as there was acorresponding adjustment to deferred tax assets or othercomprehensive income. Gross deferred tax assets of $3.6billion and $3.9 billion had valuation allowances of $747million and $647 million at December 31, 2007 and 2006,respectively.
We adopted FASB Interpretation No. 48, “Accountingfor Uncertainty in Income Taxes – an Interpretation ofFASB Statement No. 109,” on January 1, 2007. Theadoption of this interpretation changed the way we
evaluated recognition and measurement of uncertain taxpositions. Refer to Note 1 – “New Accounting Standardsand Accounting Changes” and Note 15 – “Income andOther Taxes” in the Consolidated Financial Statements forfurther information regarding the adoption andapplication of this interpretation.
We are subject to ongoing tax examinations andassessments in various jurisdictions. Accordingly, we mayincur additional tax expense based upon our assessmentof the more-likely-than-not outcomes of such matters. Inaddition, when applicable, we adjust the previouslyrecorded tax expense to reflect examination results. Ourongoing assessments of the more-likely-than-notoutcomes of the examinations and related tax positionsrequire judgment and can materially increase or decreaseour effective tax rate as well as impact our operatingresults.
We file income tax returns in the U.S. Federaljurisdiction and various foreign jurisdictions. In the U.S. weare no longer subject to U.S. Federal income taxexaminations by tax authorities for years before 2006.With respect to our major foreign jurisdictions, we are nolonger subject to tax examinations by tax authoritiesbefore 2000.
Legal Contingencies: We are involved in a variety ofclaims, lawsuits, investigations and proceedingsconcerning securities law, intellectual property law,environmental law, employment law and ERISA, asdiscussed in Note 16 – Contingencies in the ConsolidatedFinancial Statements. We determine whether anestimated loss from a contingency should be accrued byassessing whether a loss is deemed probable and can bereasonably estimated. We assess our potential liability byanalyzing our litigation and regulatory matters usingavailable information. We develop our views on estimatedlosses in consultation with outside counsel handling ourdefense in these matters, which involves an analysis ofpotential results, assuming a combination of litigation andsettlement strategies. Should developments in any ofthese matters cause a change in our determination as toan unfavorable outcome and result in the need torecognize a material accrual, or should any of thesematters result in a final adverse judgment or be settled forsignificant amounts, they could have a material adverseeffect on our results of operations, cash flows andfinancial position in the period or periods in which suchchange in determination, judgment or settlement occurs.
Business Combinations and Goodwill: The applicationof the purchase method of accounting for businesscombinations requires the use of significant estimates and
Xerox Annual Report 2007 59
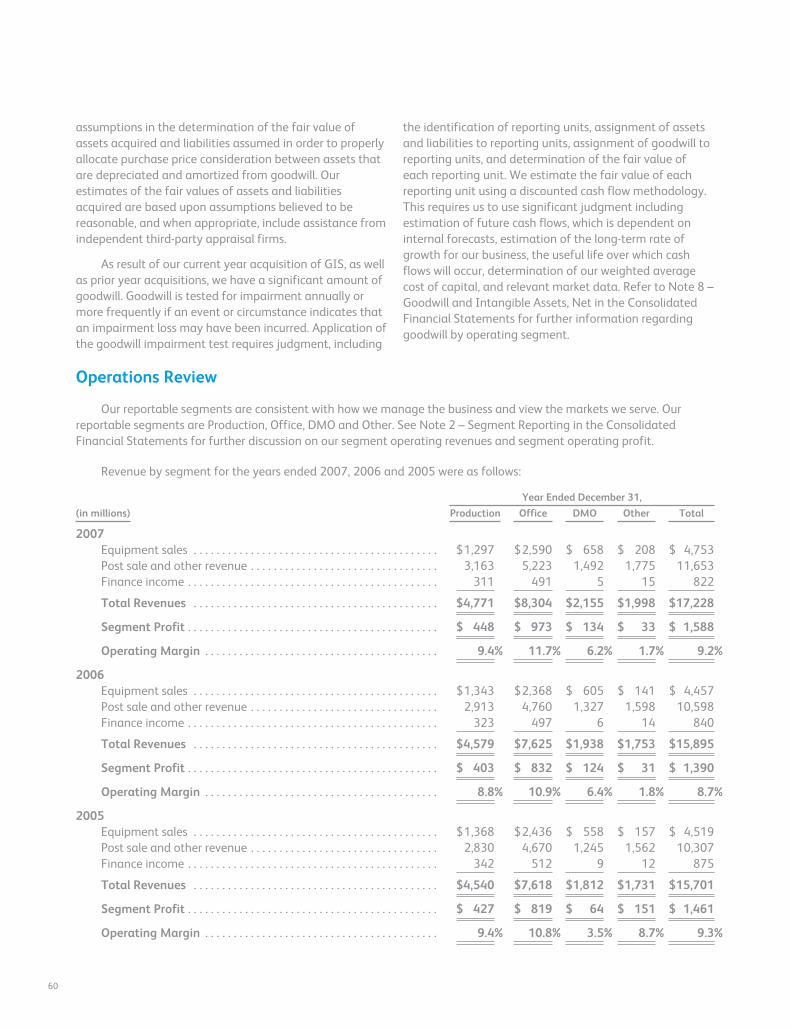
assumptions in the determination of the fair value ofassets acquired and liabilities assumed in order to properlyallocate purchase price consideration between assets thatare depreciated and amortized from goodwill. Ourestimates of the fair values of assets and liabilitiesacquired are based upon assumptions believed to bereasonable, and when appropriate, include assistance fromindependent third-party appraisal firms.
As result of our current year acquisition of GIS, as wellas prior year acquisitions, we have a significant amount ofgoodwill. Goodwill is tested for impairment annually ormore frequently if an event or circumstance indicates thatan impairment loss may have been incurred. Application ofthe goodwill impairment test requires judgment, including
the identification of reporting units, assignment of assetsand liabilities to reporting units, assignment of goodwill toreporting units, and determination of the fair value ofeach reporting unit. We estimate the fair value of eachreporting unit using a discounted cash flow methodology.This requires us to use significant judgment includingestimation of future cash flows, which is dependent oninternal forecasts, estimation of the long-term rate ofgrowth for our business, the useful life over which cashflows will occur, determination of our weighted averagecost of capital, and relevant market data. Refer to Note 8 –Goodwill and Intangible Assets, Net in the ConsolidatedFinancial Statements for further information regardinggoodwill by operating segment.
Operations Review
Our reportable segments are consistent with how we manage the business and view the markets we serve. Ourreportable segments are Production, Office, DMO and Other. See Note 2 – Segment Reporting in the ConsolidatedFinancial Statements for further discussion on our segment operating revenues and segment operating profit.
Revenue by segment for the years ended 2007, 2006 and 2005 were as follows:
Year Ended December 31,
(in millions) Production Office DMO Other Total
2007Equipment sales . . . . . . . . . . . . . . . . . . . . . . . . . . . . . . . . . . . . . . . . . . . $1,297 $2,590 $ 658 $ 208 $ 4,753Post sale and other revenue . . . . . . . . . . . . . . . . . . . . . . . . . . . . . . . . . 3,163 5,223 1,492 1,775 11,653Finance income . . . . . . . . . . . . . . . . . . . . . . . . . . . . . . . . . . . . . . . . . . . . 311 491 5 15 822
Total Revenues . . . . . . . . . . . . . . . . . . . . . . . . . . . . . . . . . . . . . . . . . . . $4,771 $8,304 $2,155 $1,998 $17,228
Segment Profit . . . . . . . . . . . . . . . . . . . . . . . . . . . . . . . . . . . . . . . . . . . . $ 448 $ 973 $ 134 $ 33 $ 1,588
Operating Margin . . . . . . . . . . . . . . . . . . . . . . . . . . . . . . . . . . . . . . . . . 9.4% 11.7% 6.2% 1.7% 9.2%
2006Equipment sales . . . . . . . . . . . . . . . . . . . . . . . . . . . . . . . . . . . . . . . . . . . $1,343 $2,368 $ 605 $ 141 $ 4,457Post sale and other revenue . . . . . . . . . . . . . . . . . . . . . . . . . . . . . . . . . 2,913 4,760 1,327 1,598 10,598Finance income . . . . . . . . . . . . . . . . . . . . . . . . . . . . . . . . . . . . . . . . . . . . 323 497 6 14 840
Total Revenues . . . . . . . . . . . . . . . . . . . . . . . . . . . . . . . . . . . . . . . . . . . $4,579 $7,625 $1,938 $1,753 $15,895
Segment Profit . . . . . . . . . . . . . . . . . . . . . . . . . . . . . . . . . . . . . . . . . . . . $ 403 $ 832 $ 124 $ 31 $ 1,390
Operating Margin . . . . . . . . . . . . . . . . . . . . . . . . . . . . . . . . . . . . . . . . . 8.8% 10.9% 6.4% 1.8% 8.7%
2005Equipment sales . . . . . . . . . . . . . . . . . . . . . . . . . . . . . . . . . . . . . . . . . . . $1,368 $2,436 $ 558 $ 157 $ 4,519Post sale and other revenue . . . . . . . . . . . . . . . . . . . . . . . . . . . . . . . . . 2,830 4,670 1,245 1,562 10,307Finance income . . . . . . . . . . . . . . . . . . . . . . . . . . . . . . . . . . . . . . . . . . . . 342 512 9 12 875
Total Revenues . . . . . . . . . . . . . . . . . . . . . . . . . . . . . . . . . . . . . . . . . . . $4,540 $7,618 $1,812 $1,731 $15,701
Segment Profit . . . . . . . . . . . . . . . . . . . . . . . . . . . . . . . . . . . . . . . . . . . . $ 427 $ 819 $ 64 $ 151 $ 1,461
Operating Margin . . . . . . . . . . . . . . . . . . . . . . . . . . . . . . . . . . . . . . . . . 9.4% 10.8% 3.5% 8.7% 9.3%
60
Production
Revenue2007 Production revenue of $4,771 million increased
4%, including a 4-percentage point benefit from currency,reflecting:• 9% increase in post sale and other revenue, including
a 5-percentage point benefit from currency, as growthfrom digital products more than offset declines inrevenue from older light lens technology.
• 3% decrease in equipment sales revenue, including a5-percentage point benefit from currency, reflectinggrowth in production color systems offset by declinesin black-and-white production printing systems andlight production and an increased proportion ofequipment installed under operating lease contractswhere revenue is recognized over-time in post sale.
• 6% growth in installs of production color productsdriven by DocuColor 242/252/260 family, Docucolor5000 and iGen3 activity.
• 8% decline in installs of production black-and-whitesystems reflecting a decline in installs of high-volumeand light production systems.
2006 Production revenue of $4,579 million increased1%, including a 1-percentage point benefit from currency,reflecting:• 3% increase in post sale and other revenue reflecting
growth in color products which was partially offset bydeclines in revenue from high-end black-and-whitedigital products and older light lens technology.
• 2% decrease in equipment sales revenue, including a1-percentage point benefit from currency, as pricedeclines of less than 5% was partially offset by strongcolor install activity.
• 74% growth in installs of production color productslargely driven by strong activity in the DocuColor240/250, DocuColor 5000 and DocuColor 7000/8000,as well as an increase in iGen3 installs.
• Installs of production black-and-white systems wereflat year-over-year. This included 16% growth ininstalls of black-and-white light production systems,reflecting continued success of the 4110 lightproduction system, which was more than offset by21% declines in installs of high-end black-and-whitesystems.
Operating Profit2007 Operating profit of $448 million increased $45
million from 2006. The increase is primarily the result ofhigher gross profit and lower R,D&E, partially offset by anincrease in bad debt expense.
2006 Operating profit of $403 million declined $24million from 2005. This decrease is a result of reducedgross margins impacted by product mix, price declines andan increase in bad debt expense, partially offset by adecrease in R,D&E spending and selling expenses.
Office
Revenue2007 Office revenue of $8,304 million increased 9%,
including a 3-percentage point benefit from currency,reflecting:• 10% increase in post sale and other revenue,
reflecting the inclusion of GIS as well as growth fromcolor multifunction devices and color printers.
• 9% increase in equipment sales revenue, reflecting theinclusion of GIS as well as color multifunction productsinstall growth.
• 65% color multifunction device install growth led bystrong demand for Xerox WorkCentre products.
• 5% increase in installs of black-and-white copiers andmultifunction devices, including 4% growth in
Segment 1&2 products (11-30 ppm) and 7% growthin Segment 3-5 products (31-90 ppm) that includesthe 95 ppm device with an embedded controller.
• 10% decline in color printer installs due to lower OEMsales.
2006 Office revenue of $7,625 million was relativelyflat year over year, including a negligible currency effect.• 2% increase in post sale and other revenue, including
a benefit from currency of 1-percentage point. Growthin revenue from color multifunction products,black-and-white and color printers, were partiallyoffset by declines in black-and-white multifunctionand older light lens technology.
Xerox Annual Report 2007 61
• 3% decrease in equipment sales revenue, including abenefit from currency of 1-percentage point. Pricedeclines of less than 10% more than offset the growthin office color multifunction and black-and-whiteproducts. In addition, an increased proportion of officeequipment installed under operating lease contractswere recognized in post sale revenue.
• 35% increase in installs of office color multifunctionsystems.
• 8% increase in installs of black-and-white digitalcopiers and multifunction devices. Install growth wasdriven by 15% growth in Segments 3-5 devices (31-90ppm) and 7% growth in Segments 1&2 devices (11-30ppm).
• 5% decline in color printers as compared to 111%growth in the comparable 2005 periods. The declinereflects lower 2006 OEM sales.
Operating Profit2007 Operating profit of $973 million increased $141
million from 2006. The increase was primarily due to theinclusion of GIS and higher gross profits partially offset byhigher SAG expenses.
2006 Operating profit of $832 million increased $13million from 2005, reflecting the reduction in SAGexpenses partially offset by lower gross profit.
DMO
Revenue2007 DMO revenue of $2,155 million increased 11%
from 2006, reflecting:• Strong performance in Eurasia, Central and Eastern
Europe and the Middle East.• 12% increase in post sale and other revenue, driven
primarily by increased supplies, documentmanagement services and paper revenue.
• 9% increase in equipment sales revenue, reflectinginstall growth in office multifunction devices, lightproduction black-and-white and production colorsystems. DMO equipment sales consist of Office andProduction products, including a large proportion ofsales in Segment 1&2 office products.
2006 DMO revenue of $1,938 million increased 7%from 2005, reflecting:• 7% increase in post sale and other revenue, driven
primarily by growth in revenue from supplies, colorproducts and services.
• 8% increase in equipment sales revenue, reflectingstrong sales of Segments 1&2 devices, as well as installgrowth in light production black-and-white andproduction color systems.
Operating Profit2007 Operating profit of $134 million increased $10
million from 2006 reflecting higher gross profit primarilyfrom increased revenue, partially offset by an increase inSAG expenses.
2006 Operating profit of $124 million increased $60million from 2005, reflecting higher gross profit andreduction in SAG expenses.
Other
Revenue2007 Other revenue of $1,998 million increased 14%,
including a 3-percentage point benefit from currency,primarily reflecting the inclusion of GIS as well asincreased paper and value-added services revenues. Papercomprised approximately 40% of Other segment revenue.
2006 Other revenue of $1,753 million increased 1%from 2005 reflecting:• 11% decrease in equipment revenue driven by lower
equipment component sales included in value-addedservices.
• 3% increase in post sale and other revenue from 2005,including a benefit from currency of 1-percentagepoint, due primarily to increased paper sales andvalue-added services. Paper comprised approximatelytwo-thirds of the 2006 Other segment post sale andother revenue.
Operating Profit2007 Operating profit of $33 million increased $2
million from 2006 reflecting higher revenue as well aslower currency exchange losses and litigation charges,
62
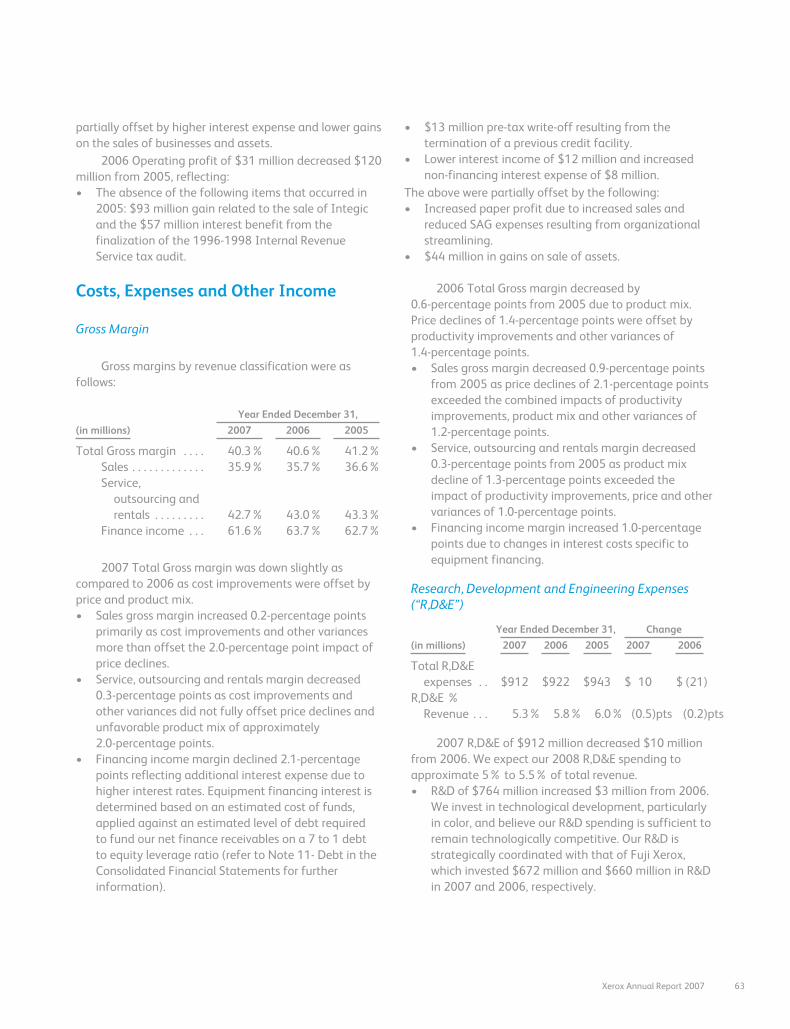
partially offset by higher interest expense and lower gainson the sales of businesses and assets.
2006 Operating profit of $31 million decreased $120million from 2005, reflecting:• The absence of the following items that occurred in
2005: $93 million gain related to the sale of Integicand the $57 million interest benefit from thefinalization of the 1996-1998 Internal RevenueService tax audit.
• $13 million pre-tax write-off resulting from thetermination of a previous credit facility.
• Lower interest income of $12 million and increasednon-financing interest expense of $8 million.
The above were partially offset by the following:• Increased paper profit due to increased sales and
reduced SAG expenses resulting from organizationalstreamlining.
• $44 million in gains on sale of assets.
Costs, Expenses and Other Income
Gross Margin
Gross margins by revenue classification were asfollows:
Year Ended December 31,
(in millions) 2007 2006 2005
Total Gross margin . . . . 40.3% 40.6% 41.2%Sales . . . . . . . . . . . . . 35.9% 35.7% 36.6%Service,
outsourcing andrentals . . . . . . . . . 42.7% 43.0% 43.3%
Finance income . . . 61.6% 63.7% 62.7%
2007 Total Gross margin was down slightly ascompared to 2006 as cost improvements were offset byprice and product mix.• Sales gross margin increased 0.2-percentage points
primarily as cost improvements and other variancesmore than offset the 2.0-percentage point impact ofprice declines.
• Service, outsourcing and rentals margin decreased0.3-percentage points as cost improvements andother variances did not fully offset price declines andunfavorable product mix of approximately2.0-percentage points.
• Financing income margin declined 2.1-percentagepoints reflecting additional interest expense due tohigher interest rates. Equipment financing interest isdetermined based on an estimated cost of funds,applied against an estimated level of debt requiredto fund our net finance receivables on a 7 to 1 debtto equity leverage ratio (refer to Note 11- Debt in theConsolidated Financial Statements for furtherinformation).
2006 Total Gross margin decreased by0.6-percentage points from 2005 due to product mix.Price declines of 1.4-percentage points were offset byproductivity improvements and other variances of1.4-percentage points.• Sales gross margin decreased 0.9-percentage points
from 2005 as price declines of 2.1-percentage pointsexceeded the combined impacts of productivityimprovements, product mix and other variances of1.2-percentage points.
• Service, outsourcing and rentals margin decreased0.3-percentage points from 2005 as product mixdecline of 1.3-percentage points exceeded theimpact of productivity improvements, price and othervariances of 1.0-percentage points.
• Financing income margin increased 1.0-percentagepoints due to changes in interest costs specific toequipment financing.
Research, Development and Engineering Expenses(“R,D&E”)
(in millions)
Year Ended December 31, Change
2007 2006 2005 2007 2006
Total R,D&Eexpenses . . $912 $922 $943 $ 10 $ (21)
R,D&E %Revenue . . . 5.3% 5.8% 6.0% (0.5)pts (0.2)pts
2007 R,D&E of $912 million decreased $10 millionfrom 2006. We expect our 2008 R,D&E spending toapproximate 5% to 5.5% of total revenue.• R&D of $764 million increased $3 million from 2006.
We invest in technological development, particularlyin color, and believe our R&D spending is sufficient toremain technologically competitive. Our R&D isstrategically coordinated with that of Fuji Xerox,which invested $672 million and $660 million in R&Din 2007 and 2006, respectively.
Xerox Annual Report 2007 63
• Sustaining engineering costs of $148 million were $13lower than 2006 due primarily to lower spendingrelated to environmental compliance activities andmaturing product platforms in the Productionsegment.
• R,D&E as a percentage of revenue declined0.5-percentage points as we leveraged our currentR,D&E investments to support GIS operations.
2006 R,D&E of $922 million decreased $21 millionfrom 2005 reflecting lower environmental compliancespending.• R&D of $761 million increased $6 million from 2005
reflecting higher expenditures in the Production andOffice segments primarily related to expected 2007product launches.
• Sustaining engineering costs of $161 milliondecreased $27 million from 2005, reflecting lowerspending related to environmental complianceactivities and maturing product platforms.
Selling, Administrative and General Expenses (“SAG”)
Year EndedDecember 31,
AmountChange
2007 2006 2005 2007 2006
Total SAGexpenses . . . $4,312 $4,008 $4,110 $304 $(102)
SAG as a % ofrevenue . . . . 25.0% 25.2% 26.2% (0.2)pts (1.0)pts
2007 SAG expenses of $4,312 million were higherthan 2006, including a $141 million negative impact fromcurrency. The SAG expense increase was the result of thefollowing:• $93 million increase in selling expenses primarily
reflecting the negative impact from currency and theinclusion of GIS. This increase was partially offset bylower costs reflecting the benefits from the 2006restructuring programs intended to realign our salesinfrastructure.
• $164 million increase in general and administrative(“G&A”) expenses primarily from the inclusion of GIS,unfavorable currency and information technologyinvestments.
• $47 million increase in bad debt expense primarily as aresult of an increase in reserves for several customersin Europe as well as a 2006 reduction in expense dueto adjustments to the reserves to reflect improvementin write-offs and aging.
2006 SAG expenses of $4,008 million decreased from2005 as a result of the following:• $58 million reduction in selling expenses, including
lower marketing spending and headcount reductions.• $59 million reduction in G&A expenses as a result of
continued expense management initiatives, includingbenefits from restructuring.
• The above reductions were partially offset by a $15million increase in bad debt expense.
Bad debt expense included in SAG was $134 million,$87 million and $72 million in 2007, 2006 and 2005,respectively. Both 2005 and, to a lesser extent, 2006reflect the benefits associated with recoveries andadjustments to the reserves as the result of improvementsin write-offs and aging. This favorable trend in write-offs,receivables aging and collections continues to be reflectedin our current year bad debt expense. Bad debt expense asa percent of total revenue was 0.8%, 0.5% and 0.5% for2007, 2006 and 2005, respectively. At December 31,2007, bad debt reserves, as a percentage of receivables,were comparable to year end 2006.
Restructuring and Asset Impairment Charges
For the three years ended December 31, 2007, 2006and 2005 we recorded restructuring and asset impairment(credits)/charges of $(6) million, $385 million and $366million, respectively. Restructuring activity was minimal in2007 and the related credit of $6 million primarily reflectschanges in estimates for prior years’ severance costs.2006 net charges of $318 million related to headcountreductions of approximately 3,400 employees in NorthAmerica and Europe. Lease termination and assetimpairment net charges of $67 million primarily reflectedthe relocation of certain manufacturing operations andthe exit from certain leased and owned facilities. 2005 netcharges of $350 million related to the elimination of3,900 employees worldwide and the remaining $16million of net charges related to asset impairments andlease cancellations. The remaining restructuring reservebalance as of December 31, 2007, for all programs was$109 million. Refer to Note 9-Restructuring and AssetImpairment Charges in the Consolidated FinancialStatements for further information regarding ourrestructuring programs.
64
Worldwide Employment
Worldwide employment of 57,400 as ofDecember 31, 2007 increased approximately 3,700 fromDecember 31, 2006, primarily reflecting the addition ofGIS personnel and the hiring of former contract
employees in certain Latin American subsidiaries, partiallyoffset by reductions from the 2006 restructuringprograms. Worldwide employment was approximately53,700 and 55,200 at December 31, 2006 and 2005,respectively.
Other Expenses, Net
Other expenses, net for the three years ended December 31, 2007 consisted of the following:
Year Ended December 31,
(in millions) 2007 2006 2005
Non-financing interest expense . . . . . . . . . . . . . . . . . . . . . . . . . . . . . . . . . . . . . . . . . . . . . . . $263 $239 $ 231Interest income . . . . . . . . . . . . . . . . . . . . . . . . . . . . . . . . . . . . . . . . . . . . . . . . . . . . . . . . . . . . . . (55) (69) (138)Gain on sales of businesses and assets . . . . . . . . . . . . . . . . . . . . . . . . . . . . . . . . . . . . . . . . . (7) (44) (97)Currency losses, net . . . . . . . . . . . . . . . . . . . . . . . . . . . . . . . . . . . . . . . . . . . . . . . . . . . . . . . . . . 8 39 5Amortization of intangible assets . . . . . . . . . . . . . . . . . . . . . . . . . . . . . . . . . . . . . . . . . . . . . . 42 41 38Legal matters . . . . . . . . . . . . . . . . . . . . . . . . . . . . . . . . . . . . . . . . . . . . . . . . . . . . . . . . . . . . . . . . (6) 89 115Minorities’ interests in earnings of subsidiaries . . . . . . . . . . . . . . . . . . . . . . . . . . . . . . . . . . 30 22 15Loss on extinguishment of debt . . . . . . . . . . . . . . . . . . . . . . . . . . . . . . . . . . . . . . . . . . . . . . . – 15 –All other expenses, net . . . . . . . . . . . . . . . . . . . . . . . . . . . . . . . . . . . . . . . . . . . . . . . . . . . . . . . . 20 4 55
Total Other expenses, net . . . . . . . . . . . . . . . . . . . . . . . . . . . . . . . . . . . . . . . . . . . . . . . . . . . . . $295 $336 $ 224
Non-financing interest expense: In 2007non-financing interest expense increased primarily due tohigher average debt balances as well as higher rates. In2006 non-financing interest expense increased due tohigher interest rates partially offset by lower average debtbalances.
Interest income: Interest income is derived primarilyfrom our invested cash and cash equivalent balances. Thedecline in interest income in 2007 was primarily due tolower average cash balances partially offset by higherrates. The decline in 2006 was primarily because 2005included $57 million of interest income associated withthe 2005 settlement of the 1996-1998 IRS audit as well aslower average cash balances partially offset by higherrates of return.
Gain on sales of businesses and assets: 2006 gain onsales of businesses and assets primarily consisted of thefollowing:• $15 million on the sale of our Corporate headquarters.• $11 million on the sale of a manufacturing facility.• $10 million receipt from escrow of additional proceeds
related to our 2005 sale of Integic.
In 2005, gain on sales of businesses and assetsprimarily consist of the $93 million gain on the sale ofIntegic.
Currency (gains) losses net: Currency gains and lossesprimarily result from the re-measurement of foreigncurrency-denominated assets and liabilities, the cost ofhedging foreign currency-denominated assets andliabilities, the mark-to-market of any foreign exchangecontracts utilized to hedge those foreign currency-denominated assets and liabilities and the mark-to-marketimpact of hedges of anticipated transactions, primarilyfuture inventory purchases, for those we do not apply cashflow hedge accounting treatment.
In 2007, 2006 and 2005 currency losses totaled $8million, $39 million and $5 million, respectively. The 2006increase in currency losses primarily reflected themark-to-market of derivative contracts which areeconomically hedging anticipated foreign currencydenominated payments. The mark-to-market losses wereprimarily due to the strengthening of the Euro againstother currencies, in particular the Canadian Dollar,U.S. Dollar and Japanese Yen, as compared to theweakening Euro in 2005.
Amortization of intangible assets: 2007 amortizationof intangible assets expense of $42 million reflectsamortization expense of $16 million associated withintangible assets acquired as part of our acquisition ofGIS, partially offset by reduced amortization from prior
Xerox Annual Report 2007 65
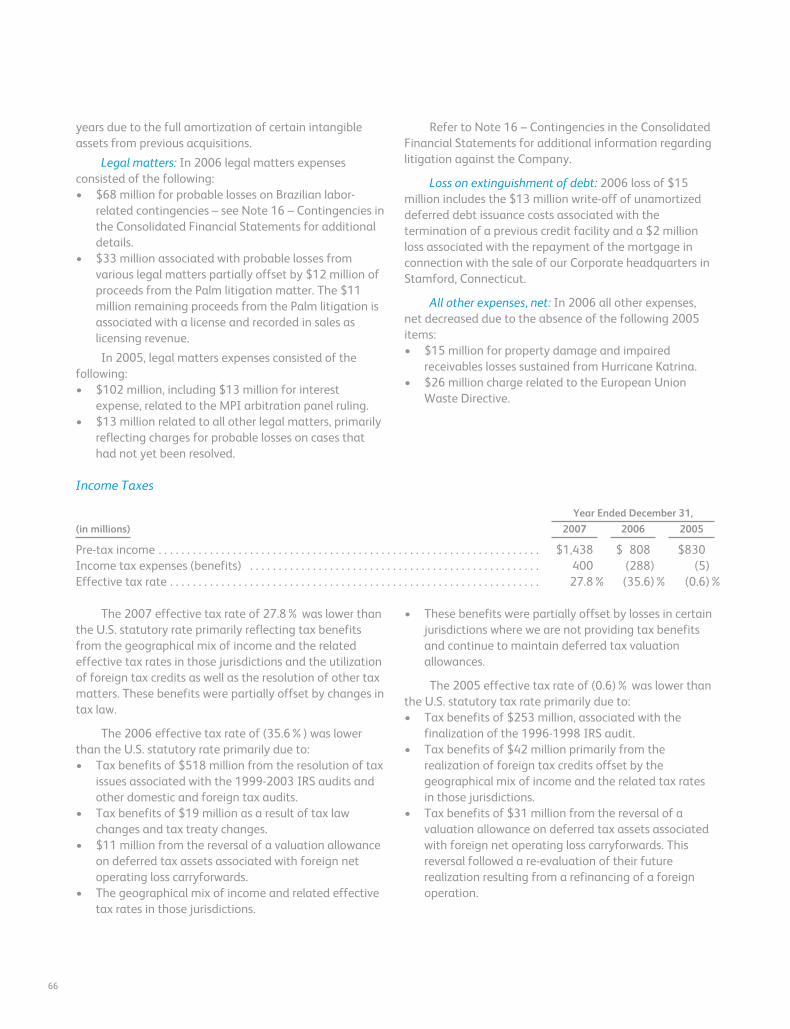
years due to the full amortization of certain intangibleassets from previous acquisitions.
Legal matters: In 2006 legal matters expensesconsisted of the following:• $68 million for probable losses on Brazilian labor-
related contingencies – see Note 16 – Contingencies inthe Consolidated Financial Statements for additionaldetails.
• $33 million associated with probable losses fromvarious legal matters partially offset by $12 million ofproceeds from the Palm litigation matter. The $11million remaining proceeds from the Palm litigation isassociated with a license and recorded in sales aslicensing revenue.
In 2005, legal matters expenses consisted of thefollowing:• $102 million, including $13 million for interest
expense, related to the MPI arbitration panel ruling.• $13 million related to all other legal matters, primarily
reflecting charges for probable losses on cases thathad not yet been resolved.
Refer to Note 16 – Contingencies in the ConsolidatedFinancial Statements for additional information regardinglitigation against the Company.
Loss on extinguishment of debt: 2006 loss of $15million includes the $13 million write-off of unamortizeddeferred debt issuance costs associated with thetermination of a previous credit facility and a $2 millionloss associated with the repayment of the mortgage inconnection with the sale of our Corporate headquarters inStamford, Connecticut.
All other expenses, net: In 2006 all other expenses,net decreased due to the absence of the following 2005items:• $15 million for property damage and impaired
receivables losses sustained from Hurricane Katrina.• $26 million charge related to the European Union
Waste Directive.
Income Taxes
Year Ended December 31,
(in millions) 2007 2006 2005
Pre-tax income . . . . . . . . . . . . . . . . . . . . . . . . . . . . . . . . . . . . . . . . . . . . . . . . . . . . . . . . . . . . . . . . . . . $1,438 $ 808 $830Income tax expenses (benefits) . . . . . . . . . . . . . . . . . . . . . . . . . . . . . . . . . . . . . . . . . . . . . . . . . . . 400 (288) (5)Effective tax rate . . . . . . . . . . . . . . . . . . . . . . . . . . . . . . . . . . . . . . . . . . . . . . . . . . . . . . . . . . . . . . . . . 27.8% (35.6)% (0.6)%
The 2007 effective tax rate of 27.8% was lower thanthe U.S. statutory rate primarily reflecting tax benefitsfrom the geographical mix of income and the relatedeffective tax rates in those jurisdictions and the utilizationof foreign tax credits as well as the resolution of other taxmatters. These benefits were partially offset by changes intax law.
The 2006 effective tax rate of (35.6%) was lowerthan the U.S. statutory rate primarily due to:• Tax benefits of $518 million from the resolution of tax
issues associated with the 1999-2003 IRS audits andother domestic and foreign tax audits.
• Tax benefits of $19 million as a result of tax lawchanges and tax treaty changes.
• $11 million from the reversal of a valuation allowanceon deferred tax assets associated with foreign netoperating loss carryforwards.
• The geographical mix of income and related effectivetax rates in those jurisdictions.
• These benefits were partially offset by losses in certainjurisdictions where we are not providing tax benefitsand continue to maintain deferred tax valuationallowances.
The 2005 effective tax rate of (0.6)% was lower thanthe U.S. statutory tax rate primarily due to:• Tax benefits of $253 million, associated with the
finalization of the 1996-1998 IRS audit.• Tax benefits of $42 million primarily from the
realization of foreign tax credits offset by thegeographical mix of income and the related tax ratesin those jurisdictions.
• Tax benefits of $31 million from the reversal of avaluation allowance on deferred tax assets associatedwith foreign net operating loss carryforwards. Thisreversal followed a re-evaluation of their futurerealization resulting from a refinancing of a foreignoperation.
66
• These impacts were partially offset by losses in certainjurisdictions where we are not providing tax benefitsand continue to maintain deferred tax valuationallowances.
Our effective tax rate will change based onnonrecurring events as well as recurring factors includingthe geographical mix of income before taxes and therelated tax rates in those jurisdictions and availableforeign tax credits. In addition, our effective tax rate willchange based on discrete or other nonrecurring events(such as audit settlements) that may not be predictable.We anticipate that our effective tax rate for 2008 willapproximate 30%, excluding the effect of any discreteitems.
Equity in Net Income of Unconsolidated Affiliates
2007 equity in net income of unconsolidatedaffiliates of $97 million is principally related to our 25%share of Fuji Xerox (“FX”) income. The $17 millionreduction from 2006 is primarily due to $30 million in ourafter-tax share of FX restructuring charges.
Income from Discontinued Operations
As disclosed in Note 15 – Income and Other Taxes inthe Consolidated Financial Statements, in June 2005 the1996-1998 Internal Revenue Service (“IRS”) audit wasfinalized. Of the total tax benefits realized, $53 millionwas attributed to our discontinued operations.
Recent Accounting Pronouncements
Refer to Note 1 – Summary of Significant AccountingPolicies in the Consolidated Financial Statements for adescription of recent accounting pronouncementsincluding the respective dates of adoption and the effectson results of operations and financial condition.
Xerox Annual Report 2007 67
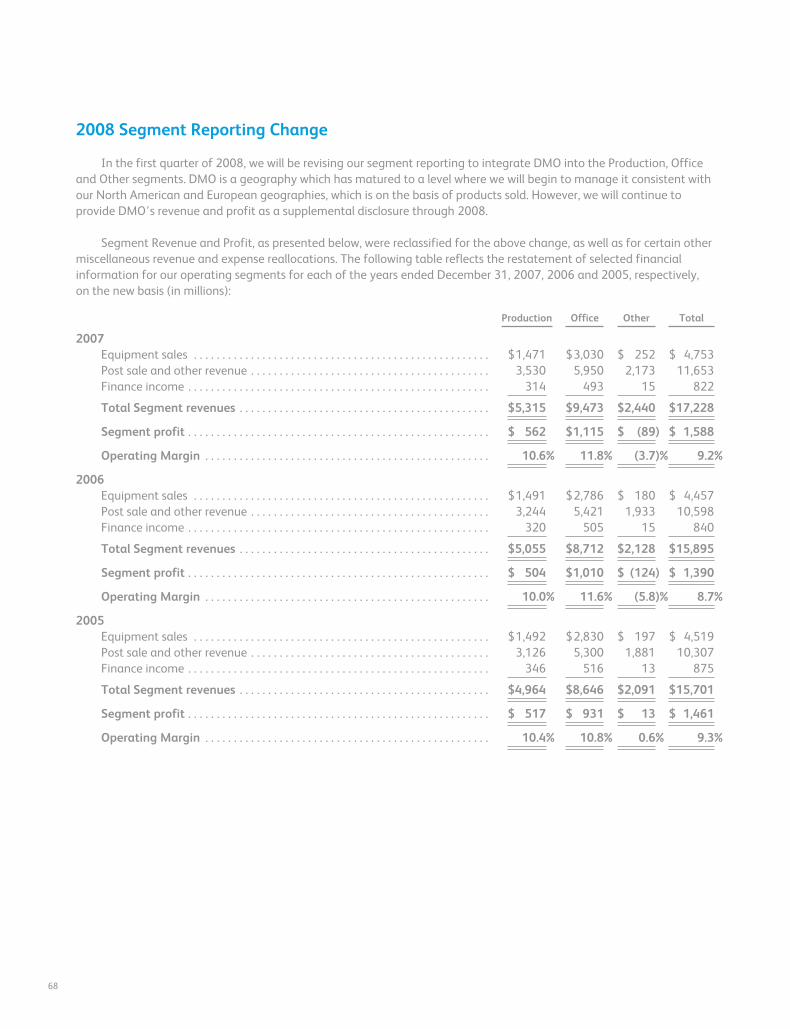
2008 Segment Reporting Change
In the first quarter of 2008, we will be revising our segment reporting to integrate DMO into the Production, Officeand Other segments. DMO is a geography which has matured to a level where we will begin to manage it consistent withour North American and European geographies, which is on the basis of products sold. However, we will continue toprovide DMO’s revenue and profit as a supplemental disclosure through 2008.
Segment Revenue and Profit, as presented below, were reclassified for the above change, as well as for certain othermiscellaneous revenue and expense reallocations. The following table reflects the restatement of selected financialinformation for our operating segments for each of the years ended December 31, 2007, 2006 and 2005, respectively,on the new basis (in millions):
Production Office Other Total
2007Equipment sales . . . . . . . . . . . . . . . . . . . . . . . . . . . . . . . . . . . . . . . . . . . . . . . . . . . . $1,471 $3,030 $ 252 $ 4,753Post sale and other revenue . . . . . . . . . . . . . . . . . . . . . . . . . . . . . . . . . . . . . . . . . . 3,530 5,950 2,173 11,653Finance income . . . . . . . . . . . . . . . . . . . . . . . . . . . . . . . . . . . . . . . . . . . . . . . . . . . . . 314 493 15 822
Total Segment revenues . . . . . . . . . . . . . . . . . . . . . . . . . . . . . . . . . . . . . . . . . . . . $5,315 $9,473 $2,440 $17,228
Segment profit . . . . . . . . . . . . . . . . . . . . . . . . . . . . . . . . . . . . . . . . . . . . . . . . . . . . . $ 562 $1,115 $ (89) $ 1,588
Operating Margin . . . . . . . . . . . . . . . . . . . . . . . . . . . . . . . . . . . . . . . . . . . . . . . . . . 10.6% 11.8% (3.7)% 9.2%
2006Equipment sales . . . . . . . . . . . . . . . . . . . . . . . . . . . . . . . . . . . . . . . . . . . . . . . . . . . . $1,491 $2,786 $ 180 $ 4,457Post sale and other revenue . . . . . . . . . . . . . . . . . . . . . . . . . . . . . . . . . . . . . . . . . . 3,244 5,421 1,933 10,598Finance income . . . . . . . . . . . . . . . . . . . . . . . . . . . . . . . . . . . . . . . . . . . . . . . . . . . . . 320 505 15 840
Total Segment revenues . . . . . . . . . . . . . . . . . . . . . . . . . . . . . . . . . . . . . . . . . . . . $5,055 $8,712 $2,128 $15,895
Segment profit . . . . . . . . . . . . . . . . . . . . . . . . . . . . . . . . . . . . . . . . . . . . . . . . . . . . . $ 504 $1,010 $ (124) $ 1,390
Operating Margin . . . . . . . . . . . . . . . . . . . . . . . . . . . . . . . . . . . . . . . . . . . . . . . . . . 10.0% 11.6% (5.8)% 8.7%
2005Equipment sales . . . . . . . . . . . . . . . . . . . . . . . . . . . . . . . . . . . . . . . . . . . . . . . . . . . . $1,492 $2,830 $ 197 $ 4,519Post sale and other revenue . . . . . . . . . . . . . . . . . . . . . . . . . . . . . . . . . . . . . . . . . . 3,126 5,300 1,881 10,307Finance income . . . . . . . . . . . . . . . . . . . . . . . . . . . . . . . . . . . . . . . . . . . . . . . . . . . . . 346 516 13 875
Total Segment revenues . . . . . . . . . . . . . . . . . . . . . . . . . . . . . . . . . . . . . . . . . . . . $4,964 $8,646 $2,091 $15,701
Segment profit . . . . . . . . . . . . . . . . . . . . . . . . . . . . . . . . . . . . . . . . . . . . . . . . . . . . . $ 517 $ 931 $ 13 $ 1,461
Operating Margin . . . . . . . . . . . . . . . . . . . . . . . . . . . . . . . . . . . . . . . . . . . . . . . . . . 10.4% 10.8% 0.6% 9.3%
68
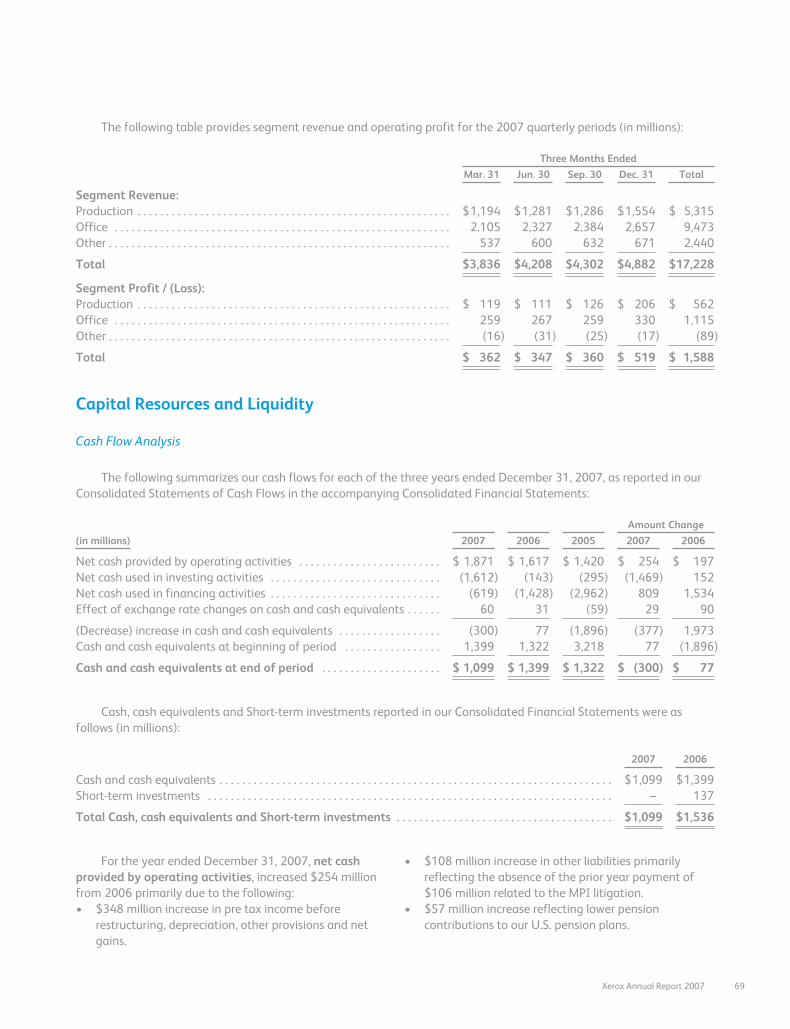
The following table provides segment revenue and operating profit for the 2007 quarterly periods (in millions):
Three Months Ended
Mar. 31 Jun. 30 Sep. 30 Dec. 31 Total
Segment Revenue:Production . . . . . . . . . . . . . . . . . . . . . . . . . . . . . . . . . . . . . . . . . . . . . . . . . . . . . . . $1,194 $1,281 $1,286 $1,554 $ 5,315Office . . . . . . . . . . . . . . . . . . . . . . . . . . . . . . . . . . . . . . . . . . . . . . . . . . . . . . . . . . . 2,105 2,327 2,384 2,657 9,473Other . . . . . . . . . . . . . . . . . . . . . . . . . . . . . . . . . . . . . . . . . . . . . . . . . . . . . . . . . . . . 537 600 632 671 2,440
Total $3,836 $4,208 $4,302 $4,882 $17,228
Segment Profit / (Loss):Production . . . . . . . . . . . . . . . . . . . . . . . . . . . . . . . . . . . . . . . . . . . . . . . . . . . . . . . $ 119 $ 111 $ 126 $ 206 $ 562Office . . . . . . . . . . . . . . . . . . . . . . . . . . . . . . . . . . . . . . . . . . . . . . . . . . . . . . . . . . . 259 267 259 330 1,115Other . . . . . . . . . . . . . . . . . . . . . . . . . . . . . . . . . . . . . . . . . . . . . . . . . . . . . . . . . . . . (16) (31) (25) (17) (89)
Total $ 362 $ 347 $ 360 $ 519 $ 1,588
Capital Resources and Liquidity
Cash Flow Analysis
The following summarizes our cash flows for each of the three years ended December 31, 2007, as reported in ourConsolidated Statements of Cash Flows in the accompanying Consolidated Financial Statements:
Amount Change
(in millions) 2007 2006 2005 2007 2006
Net cash provided by operating activities . . . . . . . . . . . . . . . . . . . . . . . . . $ 1,871 $ 1,617 $ 1,420 $ 254 $ 197Net cash used in investing activities . . . . . . . . . . . . . . . . . . . . . . . . . . . . . . (1,612) (143) (295) (1,469) 152Net cash used in financing activities . . . . . . . . . . . . . . . . . . . . . . . . . . . . . . (619) (1,428) (2,962) 809 1,534Effect of exchange rate changes on cash and cash equivalents . . . . . . 60 31 (59) 29 90
(Decrease) increase in cash and cash equivalents . . . . . . . . . . . . . . . . . . (300) 77 (1,896) (377) 1,973Cash and cash equivalents at beginning of period . . . . . . . . . . . . . . . . . 1,399 1,322 3,218 77 (1,896)
Cash and cash equivalents at end of period . . . . . . . . . . . . . . . . . . . . . $ 1,099 $ 1,399 $ 1,322 $ (300) $ 77
Cash, cash equivalents and Short-term investments reported in our Consolidated Financial Statements were asfollows (in millions):
2007 2006
Cash and cash equivalents . . . . . . . . . . . . . . . . . . . . . . . . . . . . . . . . . . . . . . . . . . . . . . . . . . . . . . . . . . . . . . . . . . . . . $1,099 $1,399Short-term investments . . . . . . . . . . . . . . . . . . . . . . . . . . . . . . . . . . . . . . . . . . . . . . . . . . . . . . . . . . . . . . . . . . . . . . . – 137
Total Cash, cash equivalents and Short-term investments . . . . . . . . . . . . . . . . . . . . . . . . . . . . . . . . . . . . . . $1,099 $1,536
For the year ended December 31, 2007, net cashprovided by operating activities, increased $254 millionfrom 2006 primarily due to the following:• $348 million increase in pre tax income before
restructuring, depreciation, other provisions and netgains.
• $108 million increase in other liabilities primarilyreflecting the absence of the prior year payment of$106 million related to the MPI litigation.
• $57 million increase reflecting lower pensioncontributions to our U.S. pension plans.
Xerox Annual Report 2007 69
• $30 million increase as a result of lower restructuringpayments due to minimal activity in 2007.
• $114 million decrease due to year-over-year inventorygrowth of $54 million primarily related to increasedproduct launches in 2007, as well as a $60 millionincrease in equipment on operating leases reflectinghigher operating lease install activity.
• $73 million decrease due to a lower net run-off offinance receivables.
• $49 million decrease primarily due to higher accountsreceivable reflecting increased revenue, partially offsetby $110 million year-over-year benefit from increasedreceivables sales.
• $45 million decrease due to lower benefit accruals,partially offset by higher accounts payable due to thetiming of payments to vendors and suppliers.
For the year ended December 31, 2006, net cashprovided by operating activities, increased $197 millionfrom 2005 primarily as a result of the increased netincome of $232 million, as well as the following additionalitems:• $173 million increase due to lower inventories.• $87 million increase due to lower net tax payments
including a $34 million refund associated with thesettlement of the 1999 to 2003 IRS tax audit.
• $62 million decrease due to a lower net run-off offinance receivables.
• $51 million decrease due to higher restructuringpayments related to previously reported actions.
• $96 million decrease due to a lower year-over-yearreduction in other current and long-term assets.
• $77 million decrease due to a reduction in othercurrent and long-term liabilities, primarily reflecting a$106 million payment relating to the previouslydisclosed MPI legal matter.
For the year ended December 31, 2007, net cashused in investing activities, increased $1,469 million from2006 primarily due to the following:• $1,386 million increase due to $1,615 million in 2007
acquisitions primarily comprised of $1,568 for GIS andits additional acquisitions and $30 million for Advectis,Inc., as compared to $229 million in acquisitions in2006 comprised of Amici, LLC and XMPie, Inc.
• $153 million increase reflecting the absence of the2006 $122 million distribution related to the sale ofinvestments held by Ridge Re* and the $21 milliondistribution from the liquidation of our investment inXerox Capital LLC.
• $57 million increase due to higher 2006 proceeds fromsales of land, buildings and equipment, which includedthe sale of our corporate headquarters and a parcel ofvacant land.
• $65 million increase due to higher capital and internaluse software investments in 2007.
• $162 million decrease due to a reduction in escrowand other restricted investments in 2007, as wecontinue to run-off our secured borrowing programs.
For the year ended December 31, 2006, net cashfrom investing activities increased $152 million from2005 primarily as a result of the following:• $354 million increase due to proceeds from the net
sale of short-term investments in 2006 of $107 million,as compared to the net purchases of $247 million in2005, as 2005 represented the initial year wepurchased short-term investments to supplement ourinvestment income.
• $77 million increase due to proceeds from the sale ofour Corporate headquarters and other excess land andbuildings.
• $48 million increase due to proceeds from divestituresand investments, reflecting:• $122 million related to the sale of investments
held by Ridge Re* in 2006.• $21 million distribution from the liquidation of our
investment in a subsidiary trust in 2006.• $96 million of proceeds from the sale of Integic in
2005.
• Partially offsetting these items were the following:• $229 million due to payments related to the
acquisition of Amici, LLC and XMPie, Inc.• $57 million increase in capital expenditures and
internal use software.• Lower cash generation of $42 million due to a
lower net reduction of escrow and other restrictedinvestments.
* In March 2006 Ridge Re, a wholly ownedsubsidiary included in discontinued operations,executed an agreement to complete its exitfrom the insurance business. As a result of thisagreement and pursuant to a liquidation plan,excess cash held by Ridge Re was distributedback to the Company (Refer to Note19-Divestitures and Other Sales in theConsolidated Financial Statements for furtherinformation).
70
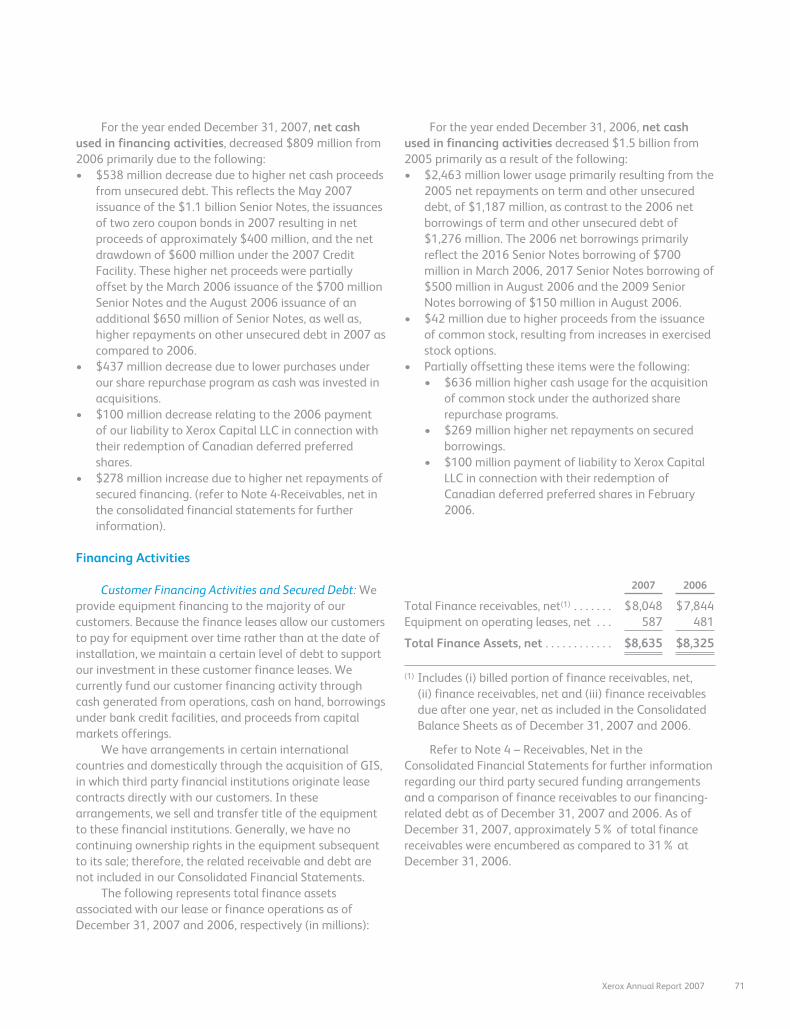
For the year ended December 31, 2007, net cashused in financing activities, decreased $809 million from2006 primarily due to the following:• $538 million decrease due to higher net cash proceeds
from unsecured debt. This reflects the May 2007issuance of the $1.1 billion Senior Notes, the issuancesof two zero coupon bonds in 2007 resulting in netproceeds of approximately $400 million, and the netdrawdown of $600 million under the 2007 CreditFacility. These higher net proceeds were partiallyoffset by the March 2006 issuance of the $700 millionSenior Notes and the August 2006 issuance of anadditional $650 million of Senior Notes, as well as,higher repayments on other unsecured debt in 2007 ascompared to 2006.
• $437 million decrease due to lower purchases underour share repurchase program as cash was invested inacquisitions.
• $100 million decrease relating to the 2006 paymentof our liability to Xerox Capital LLC in connection withtheir redemption of Canadian deferred preferredshares.
• $278 million increase due to higher net repayments ofsecured financing. (refer to Note 4-Receivables, net inthe consolidated financial statements for furtherinformation).
For the year ended December 31, 2006, net cashused in financing activities decreased $1.5 billion from2005 primarily as a result of the following:• $2,463 million lower usage primarily resulting from the
2005 net repayments on term and other unsecureddebt, of $1,187 million, as contrast to the 2006 netborrowings of term and other unsecured debt of$1,276 million. The 2006 net borrowings primarilyreflect the 2016 Senior Notes borrowing of $700million in March 2006, 2017 Senior Notes borrowing of$500 million in August 2006 and the 2009 SeniorNotes borrowing of $150 million in August 2006.
• $42 million due to higher proceeds from the issuanceof common stock, resulting from increases in exercisedstock options.
• Partially offsetting these items were the following:• $636 million higher cash usage for the acquisition
of common stock under the authorized sharerepurchase programs.
• $269 million higher net repayments on securedborrowings.
• $100 million payment of liability to Xerox CapitalLLC in connection with their redemption ofCanadian deferred preferred shares in February2006.
Financing Activities
Customer Financing Activities and Secured Debt: Weprovide equipment financing to the majority of ourcustomers. Because the finance leases allow our customersto pay for equipment over time rather than at the date ofinstallation, we maintain a certain level of debt to supportour investment in these customer finance leases. Wecurrently fund our customer financing activity throughcash generated from operations, cash on hand, borrowingsunder bank credit facilities, and proceeds from capitalmarkets offerings.
We have arrangements in certain internationalcountries and domestically through the acquisition of GIS,in which third party financial institutions originate leasecontracts directly with our customers. In thesearrangements, we sell and transfer title of the equipmentto these financial institutions. Generally, we have nocontinuing ownership rights in the equipment subsequentto its sale; therefore, the related receivable and debt arenot included in our Consolidated Financial Statements.
The following represents total finance assetsassociated with our lease or finance operations as ofDecember 31, 2007 and 2006, respectively (in millions):
2007 2006
Total Finance receivables, net(1) . . . . . . . $8,048 $7,844Equipment on operating leases, net . . . 587 481
Total Finance Assets, net . . . . . . . . . . . . $8,635 $8,325
(1) Includes (i) billed portion of finance receivables, net,(ii) finance receivables, net and (iii) finance receivablesdue after one year, net as included in the ConsolidatedBalance Sheets as of December 31, 2007 and 2006.
Refer to Note 4 – Receivables, Net in theConsolidated Financial Statements for further informationregarding our third party secured funding arrangementsand a comparison of finance receivables to our financing-related debt as of December 31, 2007 and 2006. As ofDecember 31, 2007, approximately 5% of total financereceivables were encumbered as compared to 31% atDecember 31, 2006.
Xerox Annual Report 2007 71
The following table summarizes our debt as ofDecember 31,
(in millions) 2007 2006
Debt secured by finance receivables . . $ 275 $2,059Capital leases . . . . . . . . . . . . . . . . . . . . . . . 19 28
Total Secured Debt . . . . . . . . . . . . . . . . . . 294 2,087
Senior Notes . . . . . . . . . . . . . . . . . . . . . . . . 5,781 4,224Subordinated debt . . . . . . . . . . . . . . . . . . 19 192007 Credit Facility . . . . . . . . . . . . . . . . . 600 –Other Debt . . . . . . . . . . . . . . . . . . . . . . . . . 770 815
Total Unsecured Debt . . . . . . . . . . . . . . . 7,170 5,058
Total Debt . . . . . . . . . . . . . . . . . . . . . . . . . $7,464 $7,145
At December 31, 2007, approximately 4% of totaldebt was secured by finance receivables and other assetscompared to 29% at December 31, 2006.
Credit Facility: In April 2007, we amended andrestated our $1.25 billion unsecured revolving creditfacility that was originally entered into in April 2006. Theamended and restated 2007 Credit Facility (“2007 CreditFacility”) increased the maximum amount available forborrowing to $2 billion and includes a $300 million letterof credit subfacility. As of December 31, 2007, we hadborrowings of $600 million and no outstanding letters ofcredit under the 2007 Credit Facility.
Refer to Note 11 – Debt in the Consolidated FinancialStatements for further information regarding our 2007Credit Facility.
Liquidity, Financial Flexibility and Other FinancingActivity
Liquidity: We manage our worldwide liquidity usinginternal cash management practices, which are subject to(1) the statutes, regulations and practices of each of thelocal jurisdictions in which we operate, (2) the legalrequirements of the agreements to which we are a partyand (3) the policies and cooperation of the financialinstitutions we utilize to maintain and provide cashmanagement services.
As of December 31, 2007, we had $1.1 billion of cashand cash equivalents and borrowing capacity under our2007 Credit Facility of $1.4 billion. Our ability to maintainpositive liquidity going forward depends on our ability tocontinue to generate cash from operations and access thefinancial markets, both of which are subject to generaleconomic, financial, competitive, legislative, regulatoryand other market factors that are beyond our control.
Share Repurchase Programs: The Board of Directorshas authorized programs for the repurchase of theCompany’s common stock totaling $2.5 billion as ofDecember 31, 2007. Since launching this program inOctober 2005, we have repurchased 137 million shares,totaling approximately $2.1 billion of the $2.5 billionauthorized through December 31, 2007. In January 2008,the Board of Directors authorized an additional $1 billionfor share repurchase.
Refer to Note 17 – Shareholders’ Equity – “TreasuryStock” in the Consolidated Financial Statements forfurther information regarding our share repurchaseprograms.
Dividends: In the fourth quarter of 2007, the Boardof Directors declared a 4.25 cent per share dividend oncommon stock payable January 31, 2008 to shareholdersof record on December 31, 2007.
Loan Covenants and Compliance: At December 31,2007, we were in full compliance with the covenants andother provisions of the 2007 Credit Facility, the seniornotes and the Loan Agreement. Failure to be incompliance with any material provision or covenant ofthese agreements could have a material adverse effect onour liquidity and operations and our ability to continue tofund our customers’ purchase of Xerox equipment. Wehave the right to prepay any outstanding loans or toterminate the 2007 Credit Facility without penalty.
Refer to Note 11 – Debt and Note 4 – Receivables,Net in the Consolidated Financial Statements foradditional information regarding the senior notes andLoan agreement, respectively.
Financial Instruments: Refer to Note 13 –FinancialInstruments in the Consolidated Financial Statements foradditional information regarding our derivative financialinstruments.
Capital Markets Offerings and Other: In 2007, weraised net proceeds of $1.5 billion through the issuance ofSenior Notes due in 2012 and zero coupon bondtransactions. Refer to Note 11-Debt in the ConsolidatedFinancial Statements for additional information regardingthese transactions.
72
Credit Ratings: Our credit ratings, which are periodically reviewed by major rating agencies, have substantiallyimproved and we are currently rated investment grade by all major rating agencies. As of January 31, 2008 the ratingswere as follows:
Senior UnsecuredDebt Outlook Comments
Moody’s(1) . . . . . . . . . . . . . . . . . . . Baa2 Positive The Moody’s rating was upgraded from Baa3 in November2007, with a positive outlook.
Standard & Poors (“S&P”)(2) . . . . BBB- Stable The S&P rating was upgraded from BB+ to investment grade,BBB-, in May 2007. Outlook is stable.
Fitch(3) . . . . . . . . . . . . . . . . . . . . . . . BBB Stable The Fitch rating was upgraded from BBB- and a stableoutlook was affirmed in December 2007.
(1) On November 15, 2007, Moody’s raised its long term rating of Xerox to Baa2 from Baa3, with a positive outlook. Thefollowing ratings were impacted: Senior Unsecured Debt to Baa2 from Baa3; Trust Preferred Securities to Baa3 fromBa1; Xerox Credit Corp Senior Unsecured Debt to Baa2 from Baa3.
(2) In May 2007, S&P upgraded the Senior Unsecured and Corporate Credit ratings from BB+ to BBB-, investment grade,with a stable outlook. At the same time, S&P upgraded the ratings on Subordinated Debt from BB- to BB+ andPreferred Stock from B+ to BB. The ratings upgrade followed our announcement that we completed our tender offerfor GIS.
(3) On December 10, 2007, Fitch upgraded Xerox’s Issuer Default Rating to BBB from BBB-, with a stable outlook. Thefollowing ratings were also impacted: Senior Unsecured Debt to BBB from BBB-; Senior Unsecured Credit Facility toBBB from BBB- and Trust Preferred Securities to BBB- from BB.
Contractual Cash Obligations and Other Commercial Commitments and Contingencies:
At December 31, 2007, we had the following contractual cash obligations and other commercial commitments andcontingencies (in millions):
2008 2009 2010 2011 2012 Thereafter
Long-term debt, including capital lease obligations(1) . . . . . . . $ 525 $1,552 $ 707 $ 808 $1,721 $2,151Minimum operating lease commitments(2) . . . . . . . . . . . . . . . . 266 212 169 129 90 158Liability to subsidiary trust issuing preferred securities(3) . . . . – – – – – 632Retiree Health Payments . . . . . . . . . . . . . . . . . . . . . . . . . . . . . . . . 105 114 119 123 127 635Purchase Commitments
Flextronics(4) . . . . . . . . . . . . . . . . . . . . . . . . . . . . . . . . . . . . . . . 716 – – – – –EDS Contracts(5) . . . . . . . . . . . . . . . . . . . . . . . . . . . . . . . . . . . . 290 150 17 16 16 15Other(6) . . . . . . . . . . . . . . . . . . . . . . . . . . . . . . . . . . . . . . . . . . . . 4 3 1 – – –
Total contractual cash obligations . . . . . . . . . . . . . . . . . . . . . . $1,906 $2,031 $1,013 $1,076 $1,954 $3,591
(1) Refer to Note 11 – Debt in our Consolidated Financial Statements for additional information and interest paymentsrelated to long-term debt (amounts above include principal portion only).
(2) Refer to Note 6 – Land, Buildings and Equipment, Net in our Consolidated Financial Statements for additionalinformation related to minimum operating lease commitments.
(3) Refer to Note 12 – Liability to Subsidiary Trust Issuing Preferred Securities in our Consolidated Financial Statementsfor additional information and interest payments (amounts above include principal portion only).
(4) Flextronics: We outsource certain manufacturing activities to Flextronics and are currently in the first year of the 2007master supply agreement. This agreement is for three years with two additional one year extension periods at ouroption.
Xerox Annual Report 2007 73
(5) EDS Contract: We have an information management contract with Electronic Data Systems Corp. (“EDS”) to provideservices to us for global mainframe system processing, application maintenance and support, desktop services andhelpdesk support, voice and data network management and server management. On July 1, 2004, we extended thecontract through June 30, 2009. There are no minimum payments required under the contract. We can terminate thecurrent contract for convenience with six months notice, as defined in the contract, with no termination fee and withpayment to EDS for costs incurred as of the termination date. Should we terminate the contract for convenience, wehave an option to purchase the assets placed in service under the EDS contract. On January 1, 2008, the portion of thecontract for global mainframe processing was extended to December 31, 2013.
(6) Other Purchase Commitments: We enter into other purchase commitments with vendors in the ordinary course ofbusiness. Our policy with respect to all purchase commitments is to record losses, if any, when they are probable andreasonably estimable. We currently do not have, nor do we anticipate, material loss contracts.
Pension and Other Post-retirement Benefit Plans: Wesponsor pension and other post-retirement benefit plansthat may require periodic cash contributions. Our 2007cash fundings for these plans were $298 million forpensions and $102 million for other post-retirement plans.Our anticipated cash fundings for 2008 are approximately$130 million for pensions and approximately $100 millionfor other post-retirement plans. Cash contributionrequirements for our domestic tax qualified pension plansare governed by the Employment Retirement IncomeSecurity Act (“ERISA”) and the Internal Revenue Code.Cash contribution requirements for our international plansare subject to the applicable regulations in each country.The expected 2008 pension contributions do not includecontributions to the domestic tax-qualified plans becausethese plans currently exceed the ERISA minimum fundingrequirements for the plans’ 2007 plan year. However, oncethe January 1, 2008 actuarial valuations and projectedresults as of the end of the 2008 measurement year areavailable, the desirability of additional contributions willbe assessed. Based on these results, we may voluntarilydecide to contribute to these plans, even though nocontribution is required. In prior years, after making thisassessment, we decided to contribute $158 million and$228 million in 2007 and 2006, respectively, to ourdomestic tax qualified plans in order to make them 100%funded on a current liability basis under the ERISA fundingrules.
Our other post-retirement benefit plans arenon-funded and are almost entirely related to domesticoperations. Cash contributions are made each year tocover medical claims costs incurred in that year. Theamounts reported in the above table as retiree healthpayments represent our estimated future benefitpayments.
Fuji Xerox: We purchased products from Fuji Xeroxtotaling $1.9 billion, $1.7 billion, and $1.5 billion in 2007,2006 and 2005, respectively. Our purchase commitmentswith Fuji Xerox are in the normal course of business andtypically have a lead time of three months. We anticipate
that we will purchase approximately $2.2 billion ofproducts from Fuji Xerox in 2008. Related partytransactions with Fuji Xerox are discussed in Note 7 –Investments in Affiliates, at Equity in the ConsolidatedFinancial Statements.
Brazil Tax and Labor Contingencies: At December 31,2007, our Brazilian operations were involved in variouslitigation matters and have been the subject of numerousgovernmental assessments related to indirect and othertaxes as well as disputes associated with formeremployees and contract labor. The tax matters, whichcomprise a significant portion of the total contingencies,principally relate to claims for taxes on the internaltransfer of inventory, municipal service taxes on rentalsand gross revenue taxes. We are disputing these taxmatters and intend to vigorously defend our position.Based on the opinion of legal counsel and current reservesfor those matters deemed probable of loss, we do notbelieve that the ultimate resolution of these matters willmaterially impact our results of operations, financialposition or cash flows. The labor matters principally relateto claims made by former employees and contract laborfor the equivalent payment of all social security and otherrelated labor benefits, as well as consequential tax claims,as if they were regular employees. As of December 31,2007, the total amounts related to the unreserved portionof the tax and labor contingencies, inclusive of any relatedinterest, amounted to approximately $1.1 billion, with theincrease from the December 31, 2006 balance of $960million primarily related to indexation, interest andcurrency. In connection with the above proceedings,customary local regulations may require us to makeescrow cash deposits or post other security of up to half ofthe total amount in dispute. As of December 31, 2007 wehad $200 million of escrow cash deposits for matters weare disputing and there are liens on certain Brazilian assetswith a net book value of $64 million and additional lettersof credit of approximately $84 million. Generally, anyescrowed amounts would be refundable and any lienswould be removed to the extent the matters are resolved
74
in our favor. We routinely assess all these matters as toprobability of ultimately incurring a liability against ourBrazilian operations and record our best estimate of theultimate loss in situations where we assess the likelihoodof an ultimate loss as probable.
Other Contingencies and Commitments: As morefully discussed in Note 16 – Contingencies in theConsolidated Financial Statements, we are involved in avariety of claims, lawsuits, investigations andproceedings concerning securities law, intellectualproperty law, environmental law, employment law andthe Employee Retirement Income Security Act (“ERISA”).In addition, guarantees, indemnifications and claimsmay arise during the ordinary course of business fromrelationships with suppliers, customers andnonconsolidated affiliates. Nonperformance under acontract including a guarantee, indemnification or claimcould trigger an obligation of the Company. Wedetermine whether an estimated loss from a contingencyshould be accrued by assessing whether a loss is deemedprobable and can be reasonably estimated. Shoulddevelopments in any of these areas cause a change inour determination as to an unfavorable outcome and
result in the need to recognize a material accrual, orshould any of these matters result in a final adversejudgment or be settled for significant amounts, theycould have a material adverse effect on our results ofoperations, cash flows and financial position in theperiod or periods in which such change in determination,judgment or settlement occurs.
Unrecognized Tax Benefits: As of December 31,2007, we had $303 million of unrecognized tax benefits.This represents the tax benefits associated with varioustax positions taken, or expected to be taken, on domesticand international tax returns that have not beenrecognized in our financial statements due to uncertaintyregarding their resolution. The resolution or settlement ofthese tax positions with the taxing authorities is atvarious stages and therefore we are unable to make areliable estimate of the eventual cash flows by periodthat may be required to settle these matters. In addition,certain of these matters may not require cash settlementdue to the existence of credit and net operating losscarryforwards as well as other offsets, including theindirect benefit from other taxing jurisdictions that maybe available.
Off-Balance Sheet Arrangements
Although we generally do not utilize off-balancesheet arrangements in our operations, we enter intooperating leases in the normal course of business. Thenature of these lease arrangements is discussed in Note6-Land, Buildings and Equipment, Net in theConsolidated Financial Statements. Additionally, we haveutilized special purpose entities (“SPEs”) in conjunctionwith certain financing transactions. The SPEs utilized inconjunction with these transactions are consolidated inour financial statements in accordance with applicableaccounting standards. These transactions, which are
discussed further in Note 4 – Receivables, Net in theConsolidated Financial Statements, have been accountedfor as secured borrowings with the debt and relatedassets remaining on our balance sheets. Although theobligations related to these transactions are included inour balance sheet, recourse is generally limited to thesecured assets and no other assets of the Company.
Refer to Note 16 – Contingencies in theConsolidated Financial Statements for furtherinformation regarding our guarantees, indemnificationsand warranty liabilities.
Financial Risk Management
We are exposed to market risk from foreign currencyexchange rates and interest rates, which could affectoperating results, financial position and cash flows. Wemanage our exposure to these market risks through ourregular operating and financing activities and, whenappropriate, through the use of derivative financialinstruments. These derivative financial instruments areutilized to hedge economic exposures as well as reduceearnings and cash flow volatility resulting from shifts inmarket rates. Refer to Note 13 – Financial Instruments inthe Consolidated Financial Statements for furtherdiscussion on our financial risk management.
Assuming a 10% appreciation or depreciation inforeign currency exchange rates from the quoted foreigncurrency exchange rates at December 31, 2007, thepotential change in the fair value of foreign currency-denominated assets and liabilities in each entity wouldnot be significant because all material currency asset andliability exposures were economically hedged as ofDecember 31, 2007. A 10% appreciation or depreciationof the U.S. dollar against all currencies from the quotedforeign currency exchange rates at December 31, 2007would have a $709 million impact on our cumulativetranslation adjustment portion of equity. The amount
Xerox Annual Report 2007 75
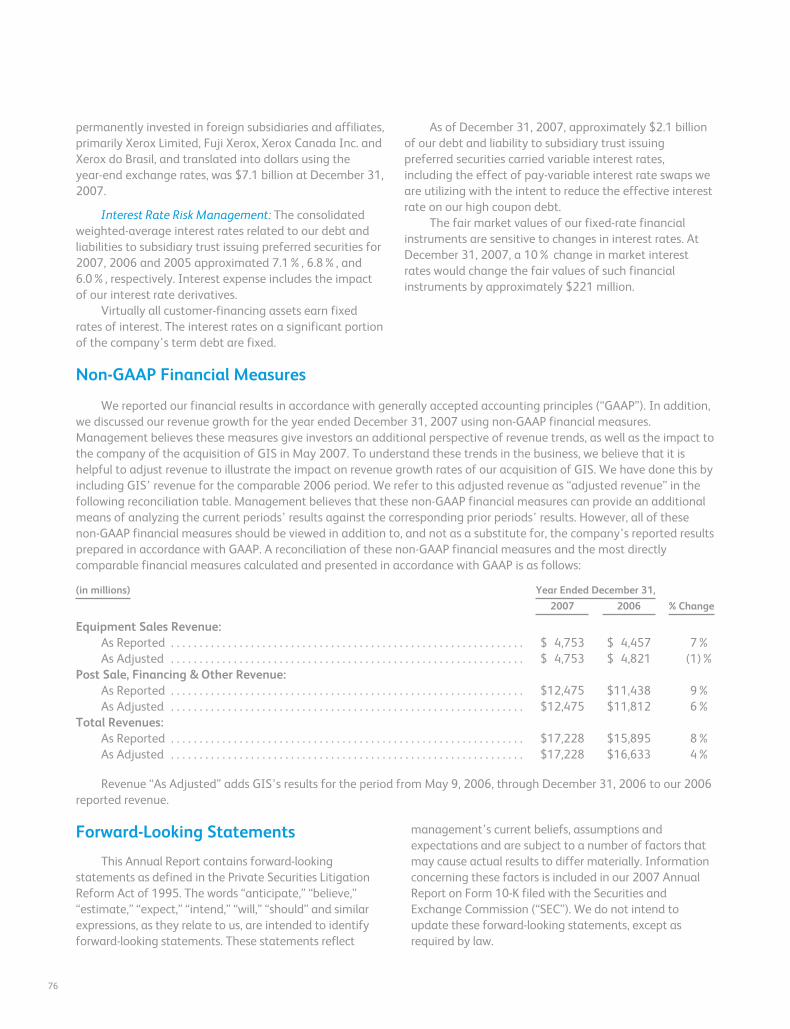
permanently invested in foreign subsidiaries and affiliates,primarily Xerox Limited, Fuji Xerox, Xerox Canada Inc. andXerox do Brasil, and translated into dollars using theyear-end exchange rates, was $7.1 billion at December 31,2007.
Interest Rate Risk Management: The consolidatedweighted-average interest rates related to our debt andliabilities to subsidiary trust issuing preferred securities for2007, 2006 and 2005 approximated 7.1%, 6.8%, and6.0%, respectively. Interest expense includes the impactof our interest rate derivatives.
Virtually all customer-financing assets earn fixedrates of interest. The interest rates on a significant portionof the company’s term debt are fixed.
As of December 31, 2007, approximately $2.1 billionof our debt and liability to subsidiary trust issuingpreferred securities carried variable interest rates,including the effect of pay-variable interest rate swaps weare utilizing with the intent to reduce the effective interestrate on our high coupon debt.
The fair market values of our fixed-rate financialinstruments are sensitive to changes in interest rates. AtDecember 31, 2007, a 10% change in market interestrates would change the fair values of such financialinstruments by approximately $221 million.
Non-GAAP Financial Measures
We reported our financial results in accordance with generally accepted accounting principles (“GAAP”). In addition,we discussed our revenue growth for the year ended December 31, 2007 using non-GAAP financial measures.Management believes these measures give investors an additional perspective of revenue trends, as well as the impact tothe company of the acquisition of GIS in May 2007. To understand these trends in the business, we believe that it ishelpful to adjust revenue to illustrate the impact on revenue growth rates of our acquisition of GIS. We have done this byincluding GIS’ revenue for the comparable 2006 period. We refer to this adjusted revenue as “adjusted revenue” in thefollowing reconciliation table. Management believes that these non-GAAP financial measures can provide an additionalmeans of analyzing the current periods’ results against the corresponding prior periods’ results. However, all of thesenon-GAAP financial measures should be viewed in addition to, and not as a substitute for, the company’s reported resultsprepared in accordance with GAAP. A reconciliation of these non-GAAP financial measures and the most directlycomparable financial measures calculated and presented in accordance with GAAP is as follows:
(in millions) Year Ended December 31,
% Change2007 2006
Equipment Sales Revenue:As Reported . . . . . . . . . . . . . . . . . . . . . . . . . . . . . . . . . . . . . . . . . . . . . . . . . . . . . . . . . . . . . . $ 4,753 $ 4,457 7%As Adjusted . . . . . . . . . . . . . . . . . . . . . . . . . . . . . . . . . . . . . . . . . . . . . . . . . . . . . . . . . . . . . . $ 4,753 $ 4,821 (1)%
Post Sale, Financing & Other Revenue:As Reported . . . . . . . . . . . . . . . . . . . . . . . . . . . . . . . . . . . . . . . . . . . . . . . . . . . . . . . . . . . . . . $12,475 $11,438 9%As Adjusted . . . . . . . . . . . . . . . . . . . . . . . . . . . . . . . . . . . . . . . . . . . . . . . . . . . . . . . . . . . . . . $12,475 $11,812 6%
Total Revenues:As Reported . . . . . . . . . . . . . . . . . . . . . . . . . . . . . . . . . . . . . . . . . . . . . . . . . . . . . . . . . . . . . . $17,228 $15,895 8%As Adjusted . . . . . . . . . . . . . . . . . . . . . . . . . . . . . . . . . . . . . . . . . . . . . . . . . . . . . . . . . . . . . . $17,228 $16,633 4%
Revenue “As Adjusted” adds GIS’s results for the period from May 9, 2006, through December 31, 2006 to our 2006reported revenue.
Forward-Looking Statements
This Annual Report contains forward-lookingstatements as defined in the Private Securities LitigationReform Act of 1995. The words “anticipate,” “believe,”“estimate,” “expect,” “intend,” “will,” “should” and similarexpressions, as they relate to us, are intended to identifyforward-looking statements. These statements reflect
management’s current beliefs, assumptions andexpectations and are subject to a number of factors thatmay cause actual results to differ materially. Informationconcerning these factors is included in our 2007 AnnualReport on Form 10-K filed with the Securities andExchange Commission (“SEC”). We do not intend toupdate these forward-looking statements, except asrequired by law.
76
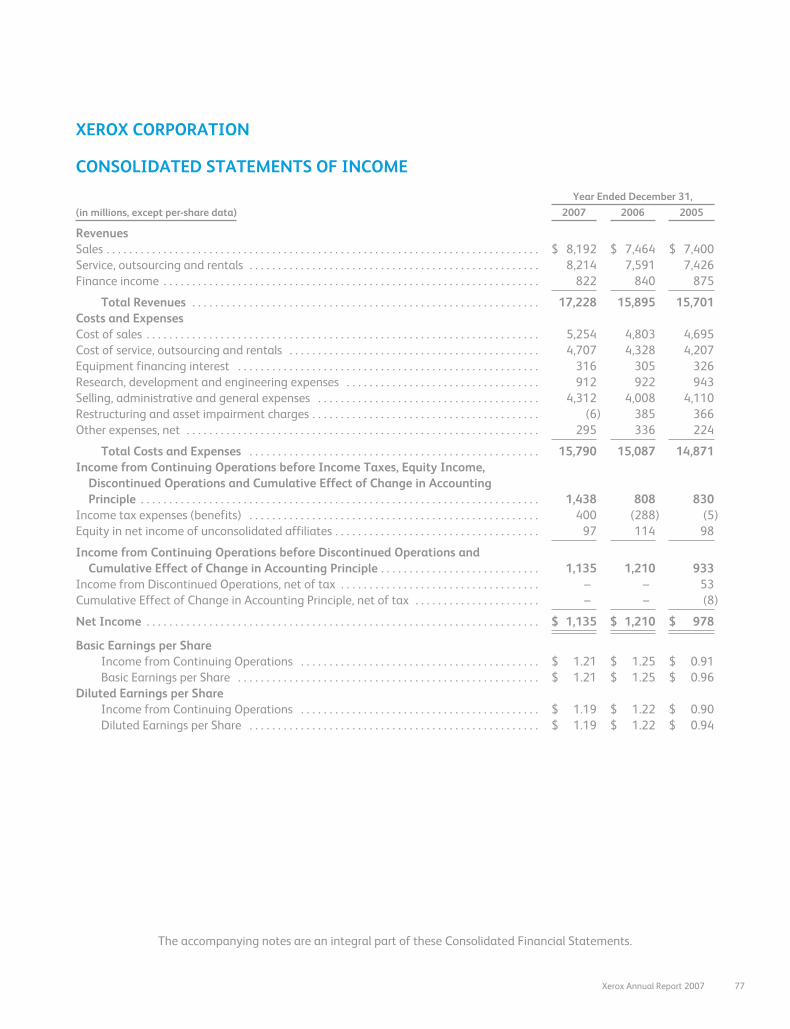
XEROX CORPORATION
CONSOLIDATED STATEMENTS OF INCOME
Year Ended December 31,
(in millions, except per-share data) 2007 2006 2005
RevenuesSales . . . . . . . . . . . . . . . . . . . . . . . . . . . . . . . . . . . . . . . . . . . . . . . . . . . . . . . . . . . . . . . . . . . . . . . . . . . . $ 8,192 $ 7,464 $ 7,400Service, outsourcing and rentals . . . . . . . . . . . . . . . . . . . . . . . . . . . . . . . . . . . . . . . . . . . . . . . . . . . 8,214 7,591 7,426Finance income . . . . . . . . . . . . . . . . . . . . . . . . . . . . . . . . . . . . . . . . . . . . . . . . . . . . . . . . . . . . . . . . . . 822 840 875
Total Revenues . . . . . . . . . . . . . . . . . . . . . . . . . . . . . . . . . . . . . . . . . . . . . . . . . . . . . . . . . . . . . 17,228 15,895 15,701Costs and ExpensesCost of sales . . . . . . . . . . . . . . . . . . . . . . . . . . . . . . . . . . . . . . . . . . . . . . . . . . . . . . . . . . . . . . . . . . . . . 5,254 4,803 4,695Cost of service, outsourcing and rentals . . . . . . . . . . . . . . . . . . . . . . . . . . . . . . . . . . . . . . . . . . . . 4,707 4,328 4,207Equipment financing interest . . . . . . . . . . . . . . . . . . . . . . . . . . . . . . . . . . . . . . . . . . . . . . . . . . . . . 316 305 326Research, development and engineering expenses . . . . . . . . . . . . . . . . . . . . . . . . . . . . . . . . . . 912 922 943Selling, administrative and general expenses . . . . . . . . . . . . . . . . . . . . . . . . . . . . . . . . . . . . . . . 4,312 4,008 4,110Restructuring and asset impairment charges . . . . . . . . . . . . . . . . . . . . . . . . . . . . . . . . . . . . . . . . (6) 385 366Other expenses, net . . . . . . . . . . . . . . . . . . . . . . . . . . . . . . . . . . . . . . . . . . . . . . . . . . . . . . . . . . . . . . 295 336 224
Total Costs and Expenses . . . . . . . . . . . . . . . . . . . . . . . . . . . . . . . . . . . . . . . . . . . . . . . . . . . 15,790 15,087 14,871Income from Continuing Operations before Income Taxes, Equity Income,
Discontinued Operations and Cumulative Effect of Change in AccountingPrinciple . . . . . . . . . . . . . . . . . . . . . . . . . . . . . . . . . . . . . . . . . . . . . . . . . . . . . . . . . . . . . . . . . . . . . . 1,438 808 830
Income tax expenses (benefits) . . . . . . . . . . . . . . . . . . . . . . . . . . . . . . . . . . . . . . . . . . . . . . . . . . . 400 (288) (5)Equity in net income of unconsolidated affiliates . . . . . . . . . . . . . . . . . . . . . . . . . . . . . . . . . . . . 97 114 98
Income from Continuing Operations before Discontinued Operations andCumulative Effect of Change in Accounting Principle . . . . . . . . . . . . . . . . . . . . . . . . . . . . 1,135 1,210 933
Income from Discontinued Operations, net of tax . . . . . . . . . . . . . . . . . . . . . . . . . . . . . . . . . . . – – 53Cumulative Effect of Change in Accounting Principle, net of tax . . . . . . . . . . . . . . . . . . . . . . – – (8)
Net Income . . . . . . . . . . . . . . . . . . . . . . . . . . . . . . . . . . . . . . . . . . . . . . . . . . . . . . . . . . . . . . . . . . . . . $ 1,135 $ 1,210 $ 978
Basic Earnings per ShareIncome from Continuing Operations . . . . . . . . . . . . . . . . . . . . . . . . . . . . . . . . . . . . . . . . . . $ 1.21 $ 1.25 $ 0.91Basic Earnings per Share . . . . . . . . . . . . . . . . . . . . . . . . . . . . . . . . . . . . . . . . . . . . . . . . . . . . . $ 1.21 $ 1.25 $ 0.96
Diluted Earnings per ShareIncome from Continuing Operations . . . . . . . . . . . . . . . . . . . . . . . . . . . . . . . . . . . . . . . . . . $ 1.19 $ 1.22 $ 0.90Diluted Earnings per Share . . . . . . . . . . . . . . . . . . . . . . . . . . . . . . . . . . . . . . . . . . . . . . . . . . . $ 1.19 $ 1.22 $ 0.94
The accompanying notes are an integral part of these Consolidated Financial Statements.
Xerox Annual Report 2007 77
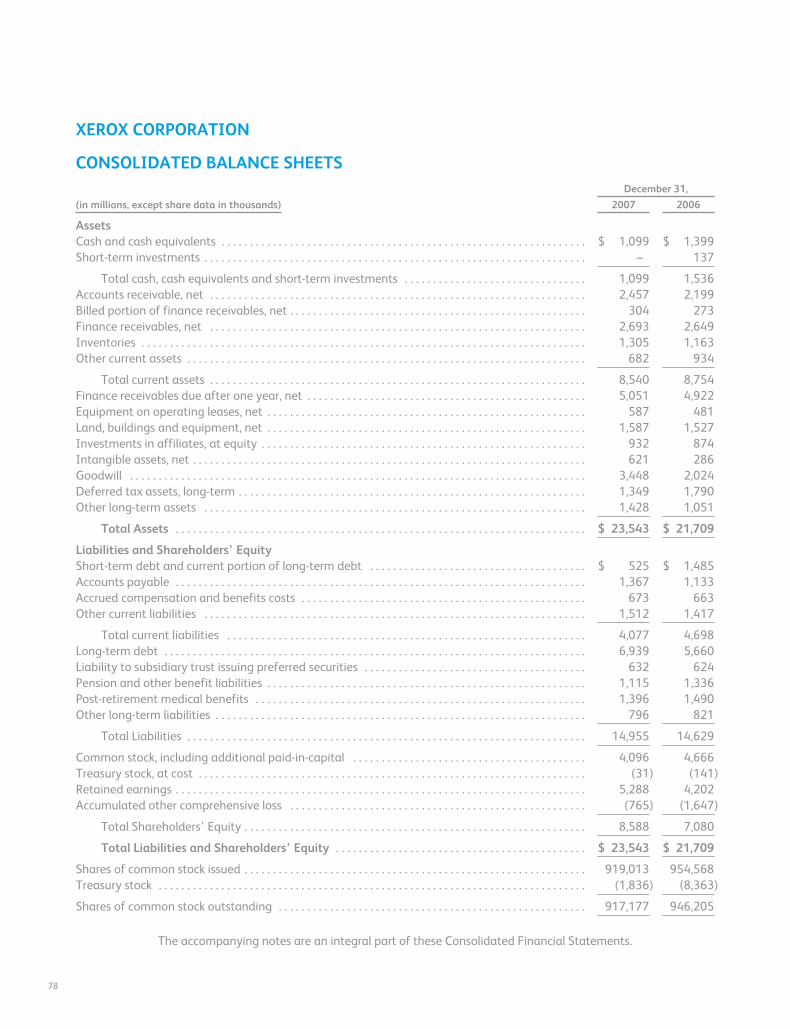
XEROX CORPORATION
CONSOLIDATED BALANCE SHEETSDecember 31,
(in millions, except share data in thousands) 2007 2006
AssetsCash and cash equivalents . . . . . . . . . . . . . . . . . . . . . . . . . . . . . . . . . . . . . . . . . . . . . . . . . . . . . . . . . . . . . . . . $ 1,099 $ 1,399Short-term investments . . . . . . . . . . . . . . . . . . . . . . . . . . . . . . . . . . . . . . . . . . . . . . . . . . . . . . . . . . . . . . . . . . . – 137
Total cash, cash equivalents and short-term investments . . . . . . . . . . . . . . . . . . . . . . . . . . . . . . . . 1,099 1,536Accounts receivable, net . . . . . . . . . . . . . . . . . . . . . . . . . . . . . . . . . . . . . . . . . . . . . . . . . . . . . . . . . . . . . . . . . . 2,457 2,199Billed portion of finance receivables, net . . . . . . . . . . . . . . . . . . . . . . . . . . . . . . . . . . . . . . . . . . . . . . . . . . . . 304 273Finance receivables, net . . . . . . . . . . . . . . . . . . . . . . . . . . . . . . . . . . . . . . . . . . . . . . . . . . . . . . . . . . . . . . . . . . 2,693 2,649Inventories . . . . . . . . . . . . . . . . . . . . . . . . . . . . . . . . . . . . . . . . . . . . . . . . . . . . . . . . . . . . . . . . . . . . . . . . . . . . . . 1,305 1,163Other current assets . . . . . . . . . . . . . . . . . . . . . . . . . . . . . . . . . . . . . . . . . . . . . . . . . . . . . . . . . . . . . . . . . . . . . . 682 934
Total current assets . . . . . . . . . . . . . . . . . . . . . . . . . . . . . . . . . . . . . . . . . . . . . . . . . . . . . . . . . . . . . . . . . . 8,540 8,754Finance receivables due after one year, net . . . . . . . . . . . . . . . . . . . . . . . . . . . . . . . . . . . . . . . . . . . . . . . . . 5,051 4,922Equipment on operating leases, net . . . . . . . . . . . . . . . . . . . . . . . . . . . . . . . . . . . . . . . . . . . . . . . . . . . . . . . . 587 481Land, buildings and equipment, net . . . . . . . . . . . . . . . . . . . . . . . . . . . . . . . . . . . . . . . . . . . . . . . . . . . . . . . . 1,587 1,527Investments in affiliates, at equity . . . . . . . . . . . . . . . . . . . . . . . . . . . . . . . . . . . . . . . . . . . . . . . . . . . . . . . . . 932 874Intangible assets, net . . . . . . . . . . . . . . . . . . . . . . . . . . . . . . . . . . . . . . . . . . . . . . . . . . . . . . . . . . . . . . . . . . . . . 621 286Goodwill . . . . . . . . . . . . . . . . . . . . . . . . . . . . . . . . . . . . . . . . . . . . . . . . . . . . . . . . . . . . . . . . . . . . . . . . . . . . . . . . 3,448 2,024Deferred tax assets, long-term . . . . . . . . . . . . . . . . . . . . . . . . . . . . . . . . . . . . . . . . . . . . . . . . . . . . . . . . . . . . . 1,349 1,790Other long-term assets . . . . . . . . . . . . . . . . . . . . . . . . . . . . . . . . . . . . . . . . . . . . . . . . . . . . . . . . . . . . . . . . . . . 1,428 1,051
Total Assets . . . . . . . . . . . . . . . . . . . . . . . . . . . . . . . . . . . . . . . . . . . . . . . . . . . . . . . . . . . . . . . . . . . . . . . . $ 23,543 $ 21,709
Liabilities and Shareholders’ EquityShort-term debt and current portion of long-term debt . . . . . . . . . . . . . . . . . . . . . . . . . . . . . . . . . . . . . . $ 525 $ 1,485Accounts payable . . . . . . . . . . . . . . . . . . . . . . . . . . . . . . . . . . . . . . . . . . . . . . . . . . . . . . . . . . . . . . . . . . . . . . . . 1,367 1,133Accrued compensation and benefits costs . . . . . . . . . . . . . . . . . . . . . . . . . . . . . . . . . . . . . . . . . . . . . . . . . . 673 663Other current liabilities . . . . . . . . . . . . . . . . . . . . . . . . . . . . . . . . . . . . . . . . . . . . . . . . . . . . . . . . . . . . . . . . . . . 1,512 1,417
Total current liabilities . . . . . . . . . . . . . . . . . . . . . . . . . . . . . . . . . . . . . . . . . . . . . . . . . . . . . . . . . . . . . . . 4,077 4,698Long-term debt . . . . . . . . . . . . . . . . . . . . . . . . . . . . . . . . . . . . . . . . . . . . . . . . . . . . . . . . . . . . . . . . . . . . . . . . . . 6,939 5,660Liability to subsidiary trust issuing preferred securities . . . . . . . . . . . . . . . . . . . . . . . . . . . . . . . . . . . . . . . 632 624Pension and other benefit liabilities . . . . . . . . . . . . . . . . . . . . . . . . . . . . . . . . . . . . . . . . . . . . . . . . . . . . . . . . 1,115 1,336Post-retirement medical benefits . . . . . . . . . . . . . . . . . . . . . . . . . . . . . . . . . . . . . . . . . . . . . . . . . . . . . . . . . . 1,396 1,490Other long-term liabilities . . . . . . . . . . . . . . . . . . . . . . . . . . . . . . . . . . . . . . . . . . . . . . . . . . . . . . . . . . . . . . . . . 796 821
Total Liabilities . . . . . . . . . . . . . . . . . . . . . . . . . . . . . . . . . . . . . . . . . . . . . . . . . . . . . . . . . . . . . . . . . . . . . . 14,955 14,629
Common stock, including additional paid-in-capital . . . . . . . . . . . . . . . . . . . . . . . . . . . . . . . . . . . . . . . . . 4,096 4,666Treasury stock, at cost . . . . . . . . . . . . . . . . . . . . . . . . . . . . . . . . . . . . . . . . . . . . . . . . . . . . . . . . . . . . . . . . . . . . (31) (141)Retained earnings . . . . . . . . . . . . . . . . . . . . . . . . . . . . . . . . . . . . . . . . . . . . . . . . . . . . . . . . . . . . . . . . . . . . . . . . 5,288 4,202Accumulated other comprehensive loss . . . . . . . . . . . . . . . . . . . . . . . . . . . . . . . . . . . . . . . . . . . . . . . . . . . . (765) (1,647)
Total Shareholders’ Equity . . . . . . . . . . . . . . . . . . . . . . . . . . . . . . . . . . . . . . . . . . . . . . . . . . . . . . . . . . . . 8,588 7,080
Total Liabilities and Shareholders’ Equity . . . . . . . . . . . . . . . . . . . . . . . . . . . . . . . . . . . . . . . . . . . . $ 23,543 $ 21,709
Shares of common stock issued . . . . . . . . . . . . . . . . . . . . . . . . . . . . . . . . . . . . . . . . . . . . . . . . . . . . . . . . . . . . 919,013 954,568Treasury stock . . . . . . . . . . . . . . . . . . . . . . . . . . . . . . . . . . . . . . . . . . . . . . . . . . . . . . . . . . . . . . . . . . . . . . . . . . . (1,836) (8,363)
Shares of common stock outstanding . . . . . . . . . . . . . . . . . . . . . . . . . . . . . . . . . . . . . . . . . . . . . . . . . . . . . . 917,177 946,205
The accompanying notes are an integral part of these Consolidated Financial Statements.
78
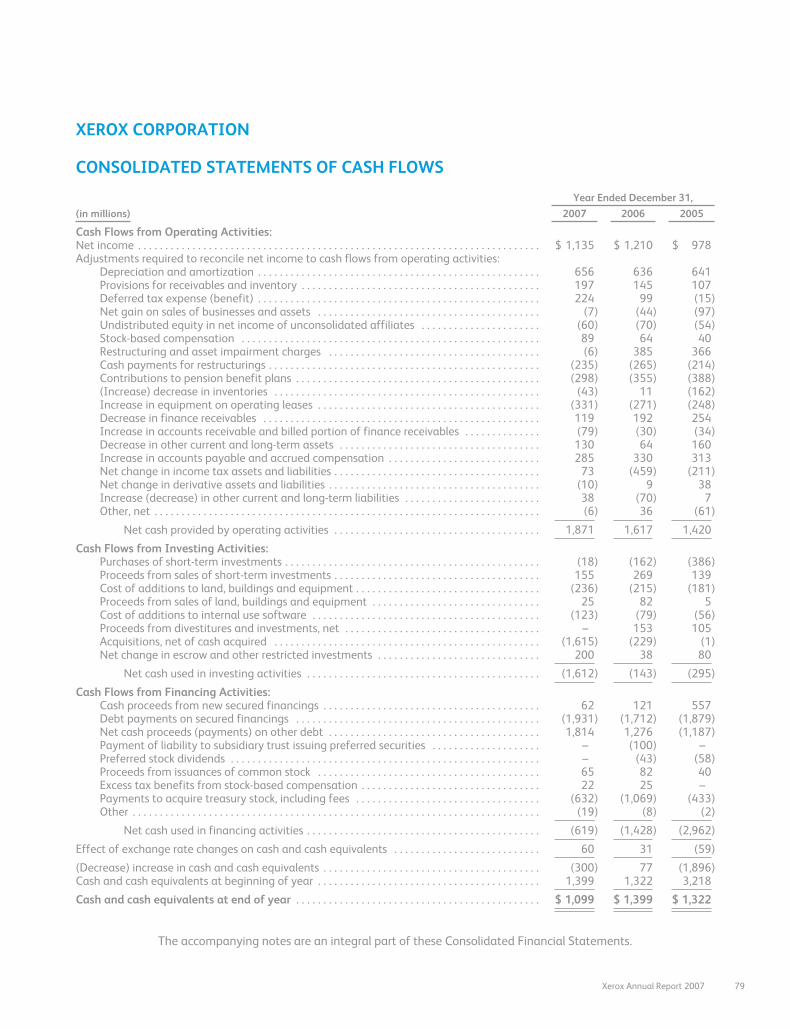
XEROX CORPORATION
CONSOLIDATED STATEMENTS OF CASH FLOWS
Year Ended December 31,
(in millions) 2007 2006 2005
Cash Flows from Operating Activities:Net income . . . . . . . . . . . . . . . . . . . . . . . . . . . . . . . . . . . . . . . . . . . . . . . . . . . . . . . . . . . . . . . . . . . . . . . . . . $ 1,135 $ 1,210 $ 978Adjustments required to reconcile net income to cash flows from operating activities:
Depreciation and amortization . . . . . . . . . . . . . . . . . . . . . . . . . . . . . . . . . . . . . . . . . . . . . . . . . . . . 656 636 641Provisions for receivables and inventory . . . . . . . . . . . . . . . . . . . . . . . . . . . . . . . . . . . . . . . . . . . . 197 145 107Deferred tax expense (benefit) . . . . . . . . . . . . . . . . . . . . . . . . . . . . . . . . . . . . . . . . . . . . . . . . . . . . 224 99 (15)Net gain on sales of businesses and assets . . . . . . . . . . . . . . . . . . . . . . . . . . . . . . . . . . . . . . . . . (7) (44) (97)Undistributed equity in net income of unconsolidated affiliates . . . . . . . . . . . . . . . . . . . . . . (60) (70) (54)Stock-based compensation . . . . . . . . . . . . . . . . . . . . . . . . . . . . . . . . . . . . . . . . . . . . . . . . . . . . . . . 89 64 40Restructuring and asset impairment charges . . . . . . . . . . . . . . . . . . . . . . . . . . . . . . . . . . . . . . . (6) 385 366Cash payments for restructurings . . . . . . . . . . . . . . . . . . . . . . . . . . . . . . . . . . . . . . . . . . . . . . . . . . (235) (265) (214)Contributions to pension benefit plans . . . . . . . . . . . . . . . . . . . . . . . . . . . . . . . . . . . . . . . . . . . . . (298) (355) (388)(Increase) decrease in inventories . . . . . . . . . . . . . . . . . . . . . . . . . . . . . . . . . . . . . . . . . . . . . . . . . (43) 11 (162)Increase in equipment on operating leases . . . . . . . . . . . . . . . . . . . . . . . . . . . . . . . . . . . . . . . . . (331) (271) (248)Decrease in finance receivables . . . . . . . . . . . . . . . . . . . . . . . . . . . . . . . . . . . . . . . . . . . . . . . . . . . 119 192 254Increase in accounts receivable and billed portion of finance receivables . . . . . . . . . . . . . . (79) (30) (34)Decrease in other current and long-term assets . . . . . . . . . . . . . . . . . . . . . . . . . . . . . . . . . . . . . 130 64 160Increase in accounts payable and accrued compensation . . . . . . . . . . . . . . . . . . . . . . . . . . . . 285 330 313Net change in income tax assets and liabilities . . . . . . . . . . . . . . . . . . . . . . . . . . . . . . . . . . . . . . 73 (459) (211)Net change in derivative assets and liabilities . . . . . . . . . . . . . . . . . . . . . . . . . . . . . . . . . . . . . . . (10) 9 38Increase (decrease) in other current and long-term liabilities . . . . . . . . . . . . . . . . . . . . . . . . . 38 (70) 7Other, net . . . . . . . . . . . . . . . . . . . . . . . . . . . . . . . . . . . . . . . . . . . . . . . . . . . . . . . . . . . . . . . . . . . . . . . (6) 36 (61)
Net cash provided by operating activities . . . . . . . . . . . . . . . . . . . . . . . . . . . . . . . . . . . . . . 1,871 1,617 1,420
Cash Flows from Investing Activities:Purchases of short-term investments . . . . . . . . . . . . . . . . . . . . . . . . . . . . . . . . . . . . . . . . . . . . . . . (18) (162) (386)Proceeds from sales of short-term investments . . . . . . . . . . . . . . . . . . . . . . . . . . . . . . . . . . . . . . 155 269 139Cost of additions to land, buildings and equipment . . . . . . . . . . . . . . . . . . . . . . . . . . . . . . . . . . (236) (215) (181)Proceeds from sales of land, buildings and equipment . . . . . . . . . . . . . . . . . . . . . . . . . . . . . . . 25 82 5Cost of additions to internal use software . . . . . . . . . . . . . . . . . . . . . . . . . . . . . . . . . . . . . . . . . . (123) (79) (56)Proceeds from divestitures and investments, net . . . . . . . . . . . . . . . . . . . . . . . . . . . . . . . . . . . . – 153 105Acquisitions, net of cash acquired . . . . . . . . . . . . . . . . . . . . . . . . . . . . . . . . . . . . . . . . . . . . . . . . . (1,615) (229) (1)Net change in escrow and other restricted investments . . . . . . . . . . . . . . . . . . . . . . . . . . . . . . 200 38 80
Net cash used in investing activities . . . . . . . . . . . . . . . . . . . . . . . . . . . . . . . . . . . . . . . . . . . (1,612) (143) (295)
Cash Flows from Financing Activities:Cash proceeds from new secured financings . . . . . . . . . . . . . . . . . . . . . . . . . . . . . . . . . . . . . . . . 62 121 557Debt payments on secured financings . . . . . . . . . . . . . . . . . . . . . . . . . . . . . . . . . . . . . . . . . . . . . (1,931) (1,712) (1,879)Net cash proceeds (payments) on other debt . . . . . . . . . . . . . . . . . . . . . . . . . . . . . . . . . . . . . . . 1,814 1,276 (1,187)Payment of liability to subsidiary trust issuing preferred securities . . . . . . . . . . . . . . . . . . . . – (100) –Preferred stock dividends . . . . . . . . . . . . . . . . . . . . . . . . . . . . . . . . . . . . . . . . . . . . . . . . . . . . . . . . . – (43) (58)Proceeds from issuances of common stock . . . . . . . . . . . . . . . . . . . . . . . . . . . . . . . . . . . . . . . . . 65 82 40Excess tax benefits from stock-based compensation . . . . . . . . . . . . . . . . . . . . . . . . . . . . . . . . . 22 25 –Payments to acquire treasury stock, including fees . . . . . . . . . . . . . . . . . . . . . . . . . . . . . . . . . . (632) (1,069) (433)Other . . . . . . . . . . . . . . . . . . . . . . . . . . . . . . . . . . . . . . . . . . . . . . . . . . . . . . . . . . . . . . . . . . . . . . . . . . . (19) (8) (2)
Net cash used in financing activities . . . . . . . . . . . . . . . . . . . . . . . . . . . . . . . . . . . . . . . . . . . (619) (1,428) (2,962)
Effect of exchange rate changes on cash and cash equivalents . . . . . . . . . . . . . . . . . . . . . . . . . . . 60 31 (59)
(Decrease) increase in cash and cash equivalents . . . . . . . . . . . . . . . . . . . . . . . . . . . . . . . . . . . . . . . . (300) 77 (1,896)Cash and cash equivalents at beginning of year . . . . . . . . . . . . . . . . . . . . . . . . . . . . . . . . . . . . . . . . . 1,399 1,322 3,218
Cash and cash equivalents at end of year . . . . . . . . . . . . . . . . . . . . . . . . . . . . . . . . . . . . . . . . . . . . . $ 1,099 $ 1,399 $ 1,322
The accompanying notes are an integral part of these Consolidated Financial Statements.
Xerox Annual Report 2007 79
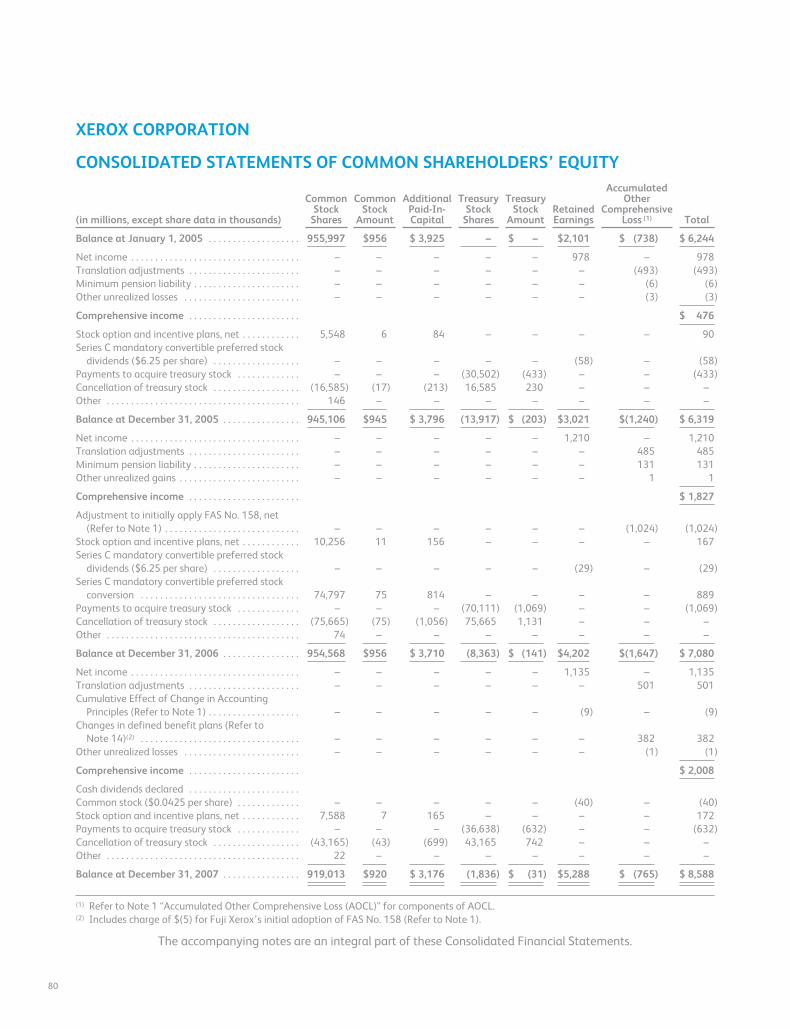
XEROX CORPORATION
CONSOLIDATED STATEMENTS OF COMMON SHAREHOLDERS’ EQUITY
(in millions, except share data in thousands)
CommonStock
Shares
CommonStock
Amount
AdditionalPaid-In-Capital
TreasuryStock
Shares
TreasuryStock
AmountRetainedEarnings
AccumulatedOther
ComprehensiveLoss (1) Total
Balance at January 1, 2005 . . . . . . . . . . . . . . . . . . . 955,997 $956 $ 3,925 – $ – $2,101 $ (738) $ 6,244
Net income . . . . . . . . . . . . . . . . . . . . . . . . . . . . . . . . . . . – – – – – 978 – 978Translation adjustments . . . . . . . . . . . . . . . . . . . . . . . – – – – – – (493) (493)Minimum pension liability . . . . . . . . . . . . . . . . . . . . . . – – – – – – (6) (6)Other unrealized losses . . . . . . . . . . . . . . . . . . . . . . . . – – – – – – (3) (3)
Comprehensive income . . . . . . . . . . . . . . . . . . . . . . . $ 476
Stock option and incentive plans, net . . . . . . . . . . . . 5,548 6 84 – – – – 90Series C mandatory convertible preferred stock
dividends ($6.25 per share) . . . . . . . . . . . . . . . . . . – – – – – (58) – (58)Payments to acquire treasury stock . . . . . . . . . . . . . – – – (30,502) (433) – – (433)Cancellation of treasury stock . . . . . . . . . . . . . . . . . . (16,585) (17) (213) 16,585 230 – – –Other . . . . . . . . . . . . . . . . . . . . . . . . . . . . . . . . . . . . . . . . 146 – – – – – – –
Balance at December 31, 2005 . . . . . . . . . . . . . . . . 945,106 $945 $ 3,796 (13,917) $ (203) $3,021 $(1,240) $ 6,319
Net income . . . . . . . . . . . . . . . . . . . . . . . . . . . . . . . . . . . – – – – – 1,210 – 1,210Translation adjustments . . . . . . . . . . . . . . . . . . . . . . . – – – – – – 485 485Minimum pension liability . . . . . . . . . . . . . . . . . . . . . . – – – – – – 131 131Other unrealized gains . . . . . . . . . . . . . . . . . . . . . . . . . – – – – – – 1 1
Comprehensive income . . . . . . . . . . . . . . . . . . . . . . . $ 1,827
Adjustment to initially apply FAS No. 158, net(Refer to Note 1) . . . . . . . . . . . . . . . . . . . . . . . . . . . . – – – – – – (1,024) (1,024)
Stock option and incentive plans, net . . . . . . . . . . . . 10,256 11 156 – – – – 167Series C mandatory convertible preferred stock
dividends ($6.25 per share) . . . . . . . . . . . . . . . . . . – – – – – (29) – (29)Series C mandatory convertible preferred stock
conversion . . . . . . . . . . . . . . . . . . . . . . . . . . . . . . . . . 74,797 75 814 – – – – 889Payments to acquire treasury stock . . . . . . . . . . . . . – – – (70,111) (1,069) – – (1,069)Cancellation of treasury stock . . . . . . . . . . . . . . . . . . (75,665) (75) (1,056) 75,665 1,131 – – –Other . . . . . . . . . . . . . . . . . . . . . . . . . . . . . . . . . . . . . . . . 74 – – – – – – –
Balance at December 31, 2006 . . . . . . . . . . . . . . . . 954,568 $956 $ 3,710 (8,363) $ (141) $4,202 $(1,647) $ 7,080
Net income . . . . . . . . . . . . . . . . . . . . . . . . . . . . . . . . . . . – – – – – 1,135 – 1,135Translation adjustments . . . . . . . . . . . . . . . . . . . . . . . – – – – – – 501 501Cumulative Effect of Change in Accounting
Principles (Refer to Note 1) . . . . . . . . . . . . . . . . . . . – – – – – (9) – (9)Changes in defined benefit plans (Refer to
Note 14)(2) . . . . . . . . . . . . . . . . . . . . . . . . . . . . . . . . . – – – – – – 382 382Other unrealized losses . . . . . . . . . . . . . . . . . . . . . . . . – – – – – – (1) (1)
Comprehensive income . . . . . . . . . . . . . . . . . . . . . . . $ 2,008
Cash dividends declared . . . . . . . . . . . . . . . . . . . . . . .Common stock ($0.0425 per share) . . . . . . . . . . . . . – – – – – (40) – (40)Stock option and incentive plans, net . . . . . . . . . . . . 7,588 7 165 – – – – 172Payments to acquire treasury stock . . . . . . . . . . . . . – – – (36,638) (632) – – (632)Cancellation of treasury stock . . . . . . . . . . . . . . . . . . (43,165) (43) (699) 43,165 742 – – –Other . . . . . . . . . . . . . . . . . . . . . . . . . . . . . . . . . . . . . . . . 22 – – – – – – –
Balance at December 31, 2007 . . . . . . . . . . . . . . . . 919,013 $920 $ 3,176 (1,836) $ (31) $5,288 $ (765) $ 8,588
(1) Refer to Note 1 “Accumulated Other Comprehensive Loss (AOCL)” for components of AOCL.(2) Includes charge of $(5) for Fuji Xerox’s initial adoption of FAS No. 158 (Refer to Note 1).
The accompanying notes are an integral part of these Consolidated Financial Statements.
80
NOTES TO THE CONSOLIDATED FINANCIAL STATEMENTS
(Dollars in millions, except per-share data and unless otherwise indicated)
Note 1 – Summary of Significant Accounting Policies
References herein to “we,” “us,” “our,” the “Company,”and Xerox refer to Xerox Corporation and its consolidatedsubsidiaries unless the context specifically requiresotherwise.
Description of Business and Basis of Presentation:We are a technology and services enterprise and a leaderin the global document market. We develop, manufacture,market, service and finance a complete range ofdocument equipment, solutions and services.
Basis of Consolidation: The Consolidated FinancialStatements include the accounts of Xerox Corporation andall of our controlled subsidiary companies. All significantintercompany accounts and transactions have beeneliminated. Investments in business entities in which wedo not have control, but we have the ability to exercisesignificant influence over operating and financial policies(generally 20% to 50% ownership), are accounted forusing the equity method of accounting. Upon the sale ofstock of a subsidiary, we recognize a gain or loss in ourConsolidated Statements of Income equal to ourproportionate share of the corresponding increase ordecrease in that subsidiary’s equity. Operating results ofacquired businesses are included in the ConsolidatedStatements of Income from the date of acquisition.
We consolidate variable interest entities if we aredeemed to be the primary beneficiary of the entity.Operating results for variable interest entities in which weare determined to be the primary beneficiary are includedin the Consolidated Statements of Income from the datesuch determination is made.
For convenience and ease of reference, we refer tothe financial statement caption “Income from Continuing
Operations before Income Taxes, Equity Income,Discontinued Operations and Cumulative Effect of Changein Accounting Principle” as “pre-tax income,” throughoutthe notes to the Consolidated Financial Statements.
Use of Estimates: The preparation of ourConsolidated Financial Statements, in accordance withaccounting principles generally accepted in the UnitedStates of America, requires that we make estimates andassumptions that affect the reported amounts of assetsand liabilities, as well as the disclosure of contingentassets and liabilities at the date of the financialstatements, and the reported amounts of revenues andexpenses during the reporting period. Significantestimates and assumptions are used for, but not limitedto: (i) allocation of revenues and fair values in leases andother multiple element arrangements; (ii) accounting forresidual values; (iii) economic lives of leased assets;(iv) allowance for doubtful accounts; (v) inventoryvaluation; (vi) restructuring and related charges; (vii) assetimpairments; (viii) depreciable lives of assets; (ix) usefullives of intangible assets; (x) pension and post-retirementbenefit plans; (xi) income tax reserves and valuationallowances and (xii) contingency and litigation reserves.Future events and their effects cannot be predicted withcertainty; accordingly, our accounting estimates requirethe exercise of judgment. The accounting estimates usedin the preparation of our Consolidated FinancialStatements will change as new events occur, as moreexperience is acquired, as additional information isobtained and as our operating environment changes.Actual results could differ from those estimates.
Xerox Annual Report 2007 81
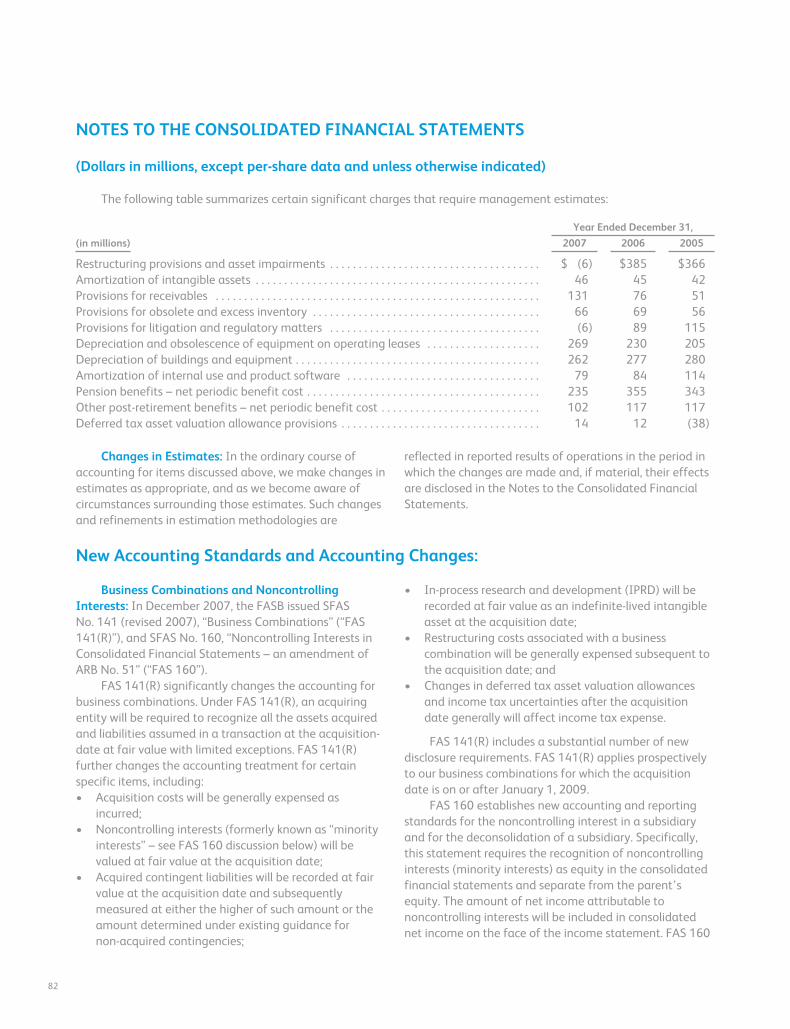
NOTES TO THE CONSOLIDATED FINANCIAL STATEMENTS
(Dollars in millions, except per-share data and unless otherwise indicated)
The following table summarizes certain significant charges that require management estimates:
Year Ended December 31,
(in millions) 2007 2006 2005
Restructuring provisions and asset impairments . . . . . . . . . . . . . . . . . . . . . . . . . . . . . . . . . . . . . $ (6) $385 $366Amortization of intangible assets . . . . . . . . . . . . . . . . . . . . . . . . . . . . . . . . . . . . . . . . . . . . . . . . . . 46 45 42Provisions for receivables . . . . . . . . . . . . . . . . . . . . . . . . . . . . . . . . . . . . . . . . . . . . . . . . . . . . . . . . . 131 76 51Provisions for obsolete and excess inventory . . . . . . . . . . . . . . . . . . . . . . . . . . . . . . . . . . . . . . . . 66 69 56Provisions for litigation and regulatory matters . . . . . . . . . . . . . . . . . . . . . . . . . . . . . . . . . . . . . (6) 89 115Depreciation and obsolescence of equipment on operating leases . . . . . . . . . . . . . . . . . . . . 269 230 205Depreciation of buildings and equipment . . . . . . . . . . . . . . . . . . . . . . . . . . . . . . . . . . . . . . . . . . . 262 277 280Amortization of internal use and product software . . . . . . . . . . . . . . . . . . . . . . . . . . . . . . . . . . 79 84 114Pension benefits – net periodic benefit cost . . . . . . . . . . . . . . . . . . . . . . . . . . . . . . . . . . . . . . . . . 235 355 343Other post-retirement benefits – net periodic benefit cost . . . . . . . . . . . . . . . . . . . . . . . . . . . . 102 117 117Deferred tax asset valuation allowance provisions . . . . . . . . . . . . . . . . . . . . . . . . . . . . . . . . . . . 14 12 (38)
Changes in Estimates: In the ordinary course ofaccounting for items discussed above, we make changes inestimates as appropriate, and as we become aware ofcircumstances surrounding those estimates. Such changesand refinements in estimation methodologies are
reflected in reported results of operations in the period inwhich the changes are made and, if material, their effectsare disclosed in the Notes to the Consolidated FinancialStatements.
New Accounting Standards and Accounting Changes:
Business Combinations and NoncontrollingInterests: In December 2007, the FASB issued SFASNo. 141 (revised 2007), “Business Combinations” (“FAS141(R)”), and SFAS No. 160, “Noncontrolling Interests inConsolidated Financial Statements – an amendment ofARB No. 51” (“FAS 160”).
FAS 141(R) significantly changes the accounting forbusiness combinations. Under FAS 141(R), an acquiringentity will be required to recognize all the assets acquiredand liabilities assumed in a transaction at the acquisition-date at fair value with limited exceptions. FAS 141(R)further changes the accounting treatment for certainspecific items, including:• Acquisition costs will be generally expensed as
incurred;• Noncontrolling interests (formerly known as “minority
interests” – see FAS 160 discussion below) will bevalued at fair value at the acquisition date;
• Acquired contingent liabilities will be recorded at fairvalue at the acquisition date and subsequentlymeasured at either the higher of such amount or theamount determined under existing guidance fornon-acquired contingencies;
• In-process research and development (IPRD) will berecorded at fair value as an indefinite-lived intangibleasset at the acquisition date;
• Restructuring costs associated with a businesscombination will be generally expensed subsequent tothe acquisition date; and
• Changes in deferred tax asset valuation allowancesand income tax uncertainties after the acquisitiondate generally will affect income tax expense.
FAS 141(R) includes a substantial number of newdisclosure requirements. FAS 141(R) applies prospectivelyto our business combinations for which the acquisitiondate is on or after January 1, 2009.
FAS 160 establishes new accounting and reportingstandards for the noncontrolling interest in a subsidiaryand for the deconsolidation of a subsidiary. Specifically,this statement requires the recognition of noncontrollinginterests (minority interests) as equity in the consolidatedfinancial statements and separate from the parent’sequity. The amount of net income attributable tononcontrolling interests will be included in consolidatednet income on the face of the income statement. FAS 160
82
NOTES TO THE CONSOLIDATED FINANCIAL STATEMENTS
(Dollars in millions, except per-share data and unless otherwise indicated)
clarifies that changes in a parent’s ownership interest in asubsidiary that does not result in deconsolidation aretreated as equity transactions if the parent retains itscontrolling financial interest. In addition, this statementrequires that a parent recognize a gain or loss in netincome when a subsidiary is deconsolidated. Such gain orloss will be measured using the fair value of thenoncontrolling equity investment on the deconsolidationdate. FAS 160 also includes expanded disclosurerequirements regarding the interests of the parent and itsnoncontrolling interest.
FAS 160 is effective for our fiscal year, and interimperiods within such year, beginning January 1, 2009. Earlyadoption of both FAS 141(R) and FAS 160 is prohibited.The adoption of FAS 160 will result in the reclassificationof minority interests from long term liabilities toshareholders’ equity. The balance at December 31, 2007was $103. We are currently evaluating further impacts, ifany, of these standards on our financial statements.
Income Tax Accounting: In 2006, the FASB issuedInterpretation No. 48, “Accounting for Uncertainty inIncome Taxes – an Interpretation of FASB StatementNo. 109” (“FIN 48”) which we adopted on January 1,2007. FIN 48 clarifies the accounting for uncertainty inincome taxes by prescribing a minimum recognitionthreshold for a tax position taken or expected to be takenin a tax return that is required to be met before beingrecognized in the financial statements. FIN 48 alsoprovides guidance on derecognition, measurement,classification, interest and penalties, accounting in interimperiods, disclosure and transition. The cumulative effect ofadopting FIN 48 of $2 was recorded as a reduction toRetained earnings. The total amount of unrecognized taxbenefits as of the date of adoption was $287. Refer toNote 15-Income and Other Taxes for additionalinformation regarding unrecognized tax benefits.
Benefit Plans Accounting: In 2006, the FASB issuedSFAS No. 158, “Employers’ Accounting for Defined BenefitPension and Other Postretirement Plans, an amendmentof FASB Statements No. 87, 88, 106 and 132(R)” (“FAS158”) which requires the recognition of an asset or liabilityfor the funded status of defined pension and otherpostretirement benefit plans in the statement of financialposition of the sponsoring entity. The funded status of abenefit plan is measured as the difference between planassets at fair value and the benefit obligation. The initial
incremental recognition of the funded status under FAS158 of our defined pension and other post retirementbenefit plans, as well as subsequent changes in our fundedstatus that are not included in net periodic benefit cost willbe reflected in shareholders’ equity and othercomprehensive loss, respectively. As of December 31,2006, the net unfunded status of our benefit plans was$2,842 and recognition of this status upon the adoptionof FAS 158 resulted in an after-tax charge to equity of$1,024. Prior to the adoption of FAS 158, we recorded anafter-tax credit to our minimum pension liability of $131,for a total equity charge in 2006 related to the fundedstatus of our benefit plans of $893. Amounts recognized inaccumulated other comprehensive loss are adjusted asthey are subsequently recognized as a component of netperiodic benefit cost. The method of calculating netperiodic benefit cost will not change from existingguidance. Refer to Note 14-Employee Benefit Plans foradditional information.
The funded status recognition and certain disclosureprovisions of FAS 158 were effective as of our fiscal yearending December 31, 2006. FAS 158 also requires theconsistent measurement of plan assets and benefitobligations as of the date of our fiscal year-end statementof financial position effective for the year endingDecember 31, 2008, with early adoption permitted. Sinceseveral of our international plans currently have aSeptember 30th measurement date, this standard willrequire us to change, in 2008, that measurement date toDecember 31st. The adoption of this requirement by ourinternational plans will not have a material effect on ourfinancial condition or results of operations. The effect ofadoption by our international plans resulted in aJanuary 1, 2008 opening retained earnings charge of $16,deferred tax asset increase of $4, pension asset reductionof $9, a pension liability increase of $6 and a credit toaccumulated other comprehensive loss of $5.
FAS 158 was not effective for our equity investmentin Fuji Xerox (“FX”) until their annual year-end ofMarch 31, 2007. Upon FX’s adoption of FAS 158, werecorded a $5 charge to equity representing our share oftheir after-tax charge to equity for the unfunded status oftheir benefit plans. We also recorded a $44 after-taxcharge to equity for our portion of a minimum pensionliability adjustment recorded by FX prior to their adoptionof FAS 158 for a total equity charge in 2007 related to thefunded status of FX’s benefit plans of $49.
Xerox Annual Report 2007 83
NOTES TO THE CONSOLIDATED FINANCIAL STATEMENTS
(Dollars in millions, except per-share data and unless otherwise indicated)
Fair Value Accounting: In 2006, the FASB issuedSFAS No. 157, “Fair Value Measurements” (“FAS 157”).FAS 157 defines fair value, establishes a market-basedframework or hierarchy for measuring fair value, andexpands disclosures about fair value measurements. FAS157 is applicable whenever another accountingpronouncement requires or permits assets and liabilities tobe measured at fair value. FAS 157 does not expand orrequire any new fair value measures, however theapplication of this statement may change current practice.The requirements of FAS 157 are first effective for ourfiscal year beginning January 1, 2008. However, inFebruary 2008 the FASB decided that an entity need notapply this standard to nonfinancial assets and liabilitiesthat are recognized or disclosed at fair value in thefinancial statements on a nonrecurring basis until thesubsequent year. Accordingly, our adoption of thisstandard on January 1, 2008 is limited to financial assetsand liabilities, which primarily affects the valuation of ourderivative contracts. We do not believe the initial adoptionof FAS 157 will have a material effect on our financialcondition or results of operations. However, we are still inthe process of evaluating this standard with respect to itseffect on nonfinancial assets and liabilities and thereforehave not yet determined the impact that it will have onour financial statements upon full adoption.
In February 2007, the FASB issued SFAS No. 159,“The Fair Value Option for Financial Assets and FinancialLiabilities – Including an Amendment of FASB StatementNo. 115” (“FAS 159”). FAS 159 permits entities to chooseto measure many financial instruments and certain otheritems at fair value. Entities that elect the fair value optionwill report unrealized gains and losses in earnings at eachsubsequent reporting date. The fair value option may beelected on an instrument-by-instrument basis, with fewexceptions. FAS 159 also establishes presentation anddisclosure requirements to facilitate comparisons betweencompanies that choose different measurement attributesfor similar assets and liabilities. The requirements of FAS159 are effective for our fiscal year beginning January 1,2008. We do not believe that the adoption of thisstatement will have a material effect on our financialcondition or results of operations as election of this optionfor our financial instruments is expected to be limited.
Stock-Based Compensation: In 2004, the FASBissued SFAS No. 123(R), “Share-Based Payment” (“FAS123(R)”), which requires companies to recognize
compensation expense using a fair value based methodfor costs related to all share-based payments, includingstock options. On January 1, 2006, we adopted FAS 123(R)using the modified prospective transition method andtherefore we did not restate the results of prior periods.Prior to the adoption of FAS 123(R), under previousaccounting guidance, we did not expense stock options, asthere was no intrinsic value associated with the optionsgranted because the exercise price was set equal to themarket price at the date of grant. The adoption of FAS123(R) was immaterial to our results of operationsprimarily as a result of changes made in our stock-basedcompensation programs in 2005, including theaccelerated vesting of substantially all outstandingunvested stock options prior to the adoption of FAS123(R).
In 2005, we implemented changes in our stock-basedcompensation programs that included expanded use ofrestricted stock grants with time and performance-basedrestrictions in lieu of stock options. Prior to this change, ourstock-based compensation programs primarily consistedof stock option grants. These new restricted stock awardsare reflected as compensation expense in our results ofoperations for all years presented and the adoption of FAS123(R) did not materially affect the expense recognizedfor these awards.
In 2005, we accelerated the vesting of approximately3.6 million stock options granted in 2004 that would havebeen scheduled to vest on January 1, 2007, toDecember 31, 2005. The accelerated vesting resulted insubstantially all outstanding stock options being vested atthe date of the adoption of FAS 123(R). The primarypurpose of this accelerated vesting was to reduce our pre-tax compensation expense in 2006 by approximately $31or $0.02 per diluted share.
Stock-based compensation expense for the threeyears ended December 31, 2007 was as follows (inmillions):
2007 2006 2005
Stock-based compensation expense,pre-tax . . . . . . . . . . . . . . . . . . . . . . . . . $89 $64 $40
Stock-based compensation expense,net of tax . . . . . . . . . . . . . . . . . . . . . . . 55 39 25
Prior to 2006, in accordance with previous accountingguidance we did not recognize compensation expenserelating to employee stock options because the exercise
84
NOTES TO THE CONSOLIDATED FINANCIAL STATEMENTS
(Dollars in millions, except per-share data and unless otherwise indicated)
price was equal to the market price at the date of grant. Ifwe had elected to recognize compensation expense usinga FAS 123(R) methodology our 2005 net income andearnings per share would have been reduced by $88 and$0.09 per diluted share, respectively.
Refer to Note 17 – Shareholders’ Equity – “Stock-Based Compensation” for additional disclosures regardingour stock compensation programs.
Other Accounting Changes: In March 2005, theFASB issued Interpretation No. 47, “Accounting forConditional Asset Retirement Obligations – aninterpretation of FASB Statement No. 143” (“FIN 47”). FIN47 requires an entity to recognize a liability for the fairvalue of a conditional asset retirement obligation if thefair value can be reasonably estimated. A conditionalasset retirement obligation is a legal obligation to performan asset retirement activity in which the timing or methodof settlement are conditional upon a future event thatmay or may not be within control of the entity. The
adoption of FIN 47 in 2005 resulted in an after-tax chargeof $8 ($12 pre-tax) and was recorded as a cumulativeeffect of change in accounting principle. This chargerepresented conditional asset retirement obligationsassociated with leased facilities where we are required toremove certain leasehold improvements and restore thefacility to its original condition at lease termination.
In June 2006, the FASB ratified the consensusreached on EITF Issue No. 06-2, “Accounting forSabbatical Leave and Other Similar Benefits Pursuant toFASB Statement No. 43” (“EITF 06-2”). EITF 06-2 clarifiesrecognition guidance on the accrual of employees’ rightsto compensated absences under a sabbatical or othersimilar benefit arrangement. We recorded a $7 after-taxcharge to Retained earnings in 2007 reflecting our shareof the cumulative effect recorded by Fuji Xerox uponadoption of EITF 06-2. With the exception of this charge,the adoption of EITF 06-2 did not impact the Company aswe do not have a similar benefit arrangement.
Summary of Accounting Policies:
Revenue Recognition: We generate revenue throughthe sale and rental of equipment, service and supplies andincome associated with the financing of our equipmentsales. Revenue is recognized when earned. Morespecifically, revenue related to sales of our products andservices is recognized as follows:
Equipment: Revenues from the sale of equipment,including those from sales-type leases, are recognized atthe time of sale or at the inception of the lease, asappropriate. For equipment sales that require us to installthe product at the customer location, revenue isrecognized when the equipment has been delivered to andinstalled at the customer location. Sales of customerinstallable products are recognized upon shipment orreceipt by the customer according to the customer’sshipping terms. Revenues from equipment under otherleases and similar arrangements are accounted for by theoperating lease method and are recognized as earnedover the lease term, which is generally on a straight-linebasis.
Service: Service revenues are derived primarily frommaintenance contracts on our equipment sold tocustomers and are recognized over the term of the
contracts. A substantial portion of our products are soldwith full service maintenance agreements for which thecustomer typically pays a base service fee plus a variableamount based on usage. As a consequence, other than theproduct warranty obligations associated with certain ofour low end products in the Office segment, we do nothave any significant product warranty obligations,including any obligations under customer satisfactionprograms.
Revenues associated with outsourcing services as wellas professional and value-added services are generallyrecognized as such services are performed. In those servicearrangements where final acceptance of a system orsolution by the customer is required, revenue is deferreduntil all acceptance criteria have been met. Costsassociated with service arrangements are generallyrecognized as incurred. Initial direct costs of anarrangement are capitalized and amortized over thecontractual service period. Long-lived assets used in thefulfillment of the arrangements are capitalized anddepreciated over the shorter of their useful life or the termof the contract. Losses on service arrangements arerecognized in the period that the contractual loss becomesprobable and estimable.
Xerox Annual Report 2007 85
NOTES TO THE CONSOLIDATED FINANCIAL STATEMENTS
(Dollars in millions, except per-share data and unless otherwise indicated)
Sales to distributors and resellers: We utilizedistributors and resellers to sell certain of our products toend-users. We refer to our distributor and reseller networkas our two-tier distribution model. Sales to distributors andresellers are recognized as revenue when products are soldto such distributors and resellers, as long as allrequirements for revenue recognition have been met.Distributors and resellers participate in various cooperativemarketing and other programs, and we record provisionsfor these programs as a reduction to revenue when thesales occur. We also similarly account for our estimates ofsales returns and other allowances when the sales occurbased on our historical experience.
Supplies: Supplies revenue generally is recognizedupon shipment or utilization by customers in accordancewith the sales terms.
Software: Software included within our equipmentand services is generally considered incidental and istherefore accounted for as part of the equipment sales orservices revenues. Software accessories sold in connectionwith our equipment sales as well as free-standing softwarerevenues are accounted for in accordance with AICPAStatement of Position No. 97-2, “Software RevenueRecognition” (“SOP 97-2”). In most cases, these softwareproducts are sold as part of multiple elementarrangements and include software maintenanceagreements for the delivery of technical service as well asunspecified upgrades or enhancements on awhen-and-if-available basis. In those software accessoryand free-standing software arrangements that includemore than one element, we allocate the revenue amongthe elements based on vendor-specific objective evidence(“VSOE”) of fair value. VSOE of fair value is based on theprice charged when the deliverable is sold separately by uson a regular basis and not as part of the multiple-elementarrangement. Revenue allocated to software is normallyrecognized upon delivery while revenue allocated to thesoftware maintenance element is recognized ratably overthe term of the arrangement.
Revenue Recognition for Leases: Our accounting forleases involves specific determinations under SFAS No. 13,which often involve complex provisions and significantjudgments. The two primary criteria of SFAS No. 13 whichwe use to classify transactions as sales-type or operatingleases are 1) a review of the lease term to determine if it isequal to or greater than 75% of the economic life of the
equipment and 2) a review of the present value of theminimum lease payments to determine if they are equalto or greater than 90% of the fair market value of theequipment at the inception of the lease. Our leases in ourLatin America operations have historically been recordedas operating leases given the cancellability of the contractor because the recoverability of the lease investment isdeemed not to be predictable at lease inception.
The critical elements that we consider with respect toour lease accounting are the determination of theeconomic life and the fair value of equipment, includingthe residual value. For purposes of determining theeconomic life, we consider the most objective measure tobe the original contract term, since most equipment isreturned by lessees at or near the end of the contractedterm. The economic life of most of our products is fiveyears since this represents the most frequent contractuallease term for our principal products and only a smallpercentage of our leases have original terms longer thanfive years. We continually evaluate the economic life ofboth existing and newly introduced products for purposesof this determination. Residual values, if any, areestablished at lease inception using estimates of fair valueat the end of the lease term.
The vast majority of our leases that qualify as sales-type are non-cancelable and include cancellation penaltiesapproximately equal to the full value of the leasereceivables. A portion of our business involves sales togovernmental units. Governmental units are those entitiesthat have statutorily defined funding or annual budgetsthat are determined by their legislative bodies. Certain ofour governmental contracts may have cancellationprovisions or renewal clauses that are required by law,such as 1) those dependant on fiscal funding outside of agovernmental unit’s control, 2) those that can becancelled if deemed in the best interest of thegovernmental unit’s taxpayers or 3) those that must berenewed each fiscal year, given limitations that may existon entering into multi-year contracts that are imposed bystatute. In these circumstances, we carefully evaluatethese contracts to assess whether cancellation is remote.The evaluation of a lease agreement with a renewaloption includes an assessment as to whether the renewalis reasonably assured based on the apparent intent andour experience of such governmental unit. We furtherensure that the contract provisions described above areoffered only in instances where required by law. Where
86
NOTES TO THE CONSOLIDATED FINANCIAL STATEMENTS
(Dollars in millions, except per-share data and unless otherwise indicated)
such contract terms are not legally required, we considerthe arrangement to be cancelable and account for thelease as an operating lease.
After the initial lease of equipment to our customers,we may enter subsequent transactions with the samecustomer whereby we extend the term. Revenue fromsuch lease extensions is typically recognized over theextension period.
Revenue Recognition Under Bundled Arrangements:We sell the majority of our products and services underbundled lease arrangements, which typically includeequipment, service, supplies and financing componentsfor which the customer pays a single negotiated fixedminimum monthly payment for all elements over thecontractual lease term. These arrangements typically alsoinclude an incremental, variable component for pagevolumes in excess of contractual page volume minimums,which are often expressed in terms of price per page. Thefixed minimum monthly payments are multiplied by thenumber of months in the contract term to arrive at thetotal fixed minimum payments that the customer isobligated to make (“fixed payments”) over the lease term.The payments associated with page volumes in excess ofthe minimums are contingent on whether or not suchminimums are exceeded (“contingent payments”). Theminimum contractual committed page volumes aretypically negotiated to equal the customer’s estimatedpage volume at lease inception. In applying our leaseaccounting methodology, we only consider the fixedpayments for purposes of allocating to the relative fairvalue elements of the contract. Contingent payments, ifany, are inherently uncertain and therefore are recognizedas revenue in the period when the customer exceeds theminimum copy volumes specified in the contract.Revenues under bundled arrangements are allocatedconsidering the relative fair values of the lease andnon-lease deliverables included in the bundledarrangement based upon the estimated relative fairvalues of each element. Lease deliverables includemaintenance and executory costs, equipment andfinancing, while non-lease deliverables generally consist ofthe supplies and non-maintenance services. Our revenueallocation for the lease deliverables begins by allocatingrevenues to the maintenance and executory costs plusprofit thereon. The remaining amounts are allocated tothe equipment and financing elements.
Cash and Cash Equivalents: Cash and cashequivalents consist of cash on hand, including money-market funds, and investments with original maturities ofthree months or less.
Restricted Cash and Investments: Several of oursecured financing arrangements and other contracts,require us to post cash collateral or maintain minimumcash balances in escrow. In addition, as more fullydiscussed in Note 16 Contingencies, various litigationmatters in Brazil require us to make cash deposits as acondition of continuing the litigation. These cash amountsare reported in our Consolidated Balance Sheets,depending on when the cash will be contractuallyreleased. At December 31, 2007 and 2006, such restrictedcash amounts were as follows (in millions):
December 31,
2007 2006
Escrow and cash collections related tosecured borrowing arrangements . . . . . . $ 41 $ 214
Tax and other litigation deposits inBrazil . . . . . . . . . . . . . . . . . . . . . . . . . . . . . . . 200 154
Other restricted cash . . . . . . . . . . . . . . . . . . . 23 58
Total . . . . . . . . . . . . . . . . . . . . . . . . . . . $264 $426
Of these amounts, $45 and $236 were included inOther current assets and $219 and $190 were included inOther long-term assets, as of December 31, 2007 and2006, respectively.
Provisions for Losses on Uncollectible Receivables:The provisions for losses on uncollectible trade andfinance receivables are determined principally on thebasis of past collection experience applied to ongoingevaluations of our receivables and evaluations of thedefault risks of repayment. Allowances for doubtfulaccounts receivable were $128 and $116, as ofDecember 31, 2007 and 2006, respectively. Allowancesfor doubtful accounts on finance receivables were $203and $198 at December 31, 2007 and 2006, respectively.
Inventories: Inventories are carried at the lower ofaverage cost or market. Inventories also includeequipment that is returned at the end of the lease term.Returned equipment is recorded at the lower of remainingnet book value or salvage value. Salvage value consists ofthe estimated market value (generally determined based
Xerox Annual Report 2007 87
NOTES TO THE CONSOLIDATED FINANCIAL STATEMENTS
(Dollars in millions, except per-share data and unless otherwise indicated)
on replacement cost) of the salvageable component parts,which are expected to be used in the remanufacturingprocess. We regularly review inventory quantities andrecord a provision for excess and/or obsolete inventorybased primarily on our estimated forecast of productdemand, production requirements and servicingcommitments. Several factors may influence therealizability of our inventories, including our decision toexit a product line, technological changes and newproduct development. The provision for excess and/orobsolete raw materials and equipment inventories isbased primarily on near term forecasts of product demandand include consideration of new product introductions aswell as changes in remanufacturing strategies. Theprovision for excess and/or obsolete service parts inventoryis based primarily on projected servicing requirements overthe life of the related equipment populations.
Land, Buildings and Equipment and Equipment onOperating Leases: Land, buildings and equipment arerecorded at cost. Buildings and equipment are depreciatedover their estimated useful lives. Leasehold improvementsare depreciated over the shorter of the lease term or theestimated useful life. Equipment on operating leases isdepreciated to estimated residual value over the leaseterm. Depreciation is computed using the straight-linemethod. Significant improvements are capitalized andmaintenance and repairs are expensed. Refer to Note5-Inventories and Equipment on Operating Leases, Netand Note 6-Land, Buildings and Equipment, Net for furtherdiscussion.
Internal Use Software: We capitalize direct costsassociated with developing, purchasing or otherwiseacquiring software for internal use and amortize thesecosts on a straight-line basis over the expected useful lifeof the software, beginning when the software isimplemented. Useful lives of the software generally varyfrom 3 to 5 years. Amortization expense, includingapplicable impairment charges, was $76, $73, and $92 forthe years ended December 31, 2007, 2006 and 2005,respectively. Capitalized costs were $270 and $217 as ofDecember 31, 2007 and 2006, respectively.
Goodwill and Other Intangible Assets: Goodwill istested for impairment annually or more frequently if anevent or circumstance indicates that an impairment lossmay have been incurred. Application of the goodwill
impairment test requires judgment, including theidentification of reporting units, assignment of assets andliabilities to reporting units, assignment ofgoodwill to reporting units, and determination of the fairvalue of each reporting unit. We estimate the fair value ofeach reporting unit using a discounted cash flowmethodology. This requires us to use significant judgmentincluding estimation of future cash flows, which isdependent on internal forecasts, estimation of the long-term rate of growth for our business, the useful life overwhich cash flows will occur, determination of our weightedaverage cost of capital, and relevant market data.
Other intangible assets primarily consist of assetsobtained in connection with business acquisitions,including installed customer base and distribution networkrelationships, patents on existing technology andtrademarks. We apply an impairment evaluation wheneverevents or changes in business circumstances indicate thatthe carry value of our intangible assets may not berecoverable. Other intangible assets are amortized on astraight-line basis over their estimated economic lives. Webelieve that the straight-line method of amortizationreflects an appropriate allocation of the cost of theintangible assets to earnings in proportion to the amountof economic benefits obtained annually by the Company.
Impairment of Long-Lived Assets: We review therecoverability of our long-lived assets, including buildings,equipment, internal-use software and other intangibleassets, when events or changes in circumstances occurthat indicate that the carrying value of the asset may notbe recoverable. The assessment of possible impairment isbased on our ability to recover the carrying value of theasset from the expected future pre-tax cash flows(undiscounted and without interest charges) of the relatedoperations. If these cash flows are less than the carryingvalue of such asset, an impairment loss is recognized forthe difference between estimated fair value and carryingvalue. Our primary measure of fair value is based ondiscounted cash flows.
Treasury Stock: We account for repurchasedcommon stock under the cost method and include suchtreasury stock as a component of our Commonshareholders’ equity. Retirement of Treasury stock isrecorded as a reduction of Common stock and Additionalpaid-in-capital at the time such retirement is approved byour Board of Directors.
88
NOTES TO THE CONSOLIDATED FINANCIAL STATEMENTS
(Dollars in millions, except per-share data and unless otherwise indicated)
Research, Development and Engineering (“R,D&E”):Research, development and engineering costs areexpensed as incurred. R,D&E was $912, $922 and $943,for the three years ended December 31, 2007,respectively. Research and development (“R&D”) costswere $764 in 2007, $761 in 2006 and $755 in 2005.Sustaining engineering costs are incurred with respect toon-going product improvements or environmentalcompliance after initial product launch. Our sustainingengineering costs were $148, $161, and $188, for thethree years ended December 31, 2007, respectively.
Restructuring Charges: Costs associated with exit ordisposal activities, including lease termination costs andcertain employee severance costs associated withrestructuring, plant closing or other activity, are recognizedwhen they are incurred. In those geographies where wehave either a formal severance plan or a history ofconsistently providing severance benefits representing asubstantive plan, we recognize severance costs when theyare both probable and reasonably estimable.
Pension and Post-Retirement Benefit Obligations:We sponsor pension plans in various forms in severalcountries covering substantially all employees who meeteligibility requirements. Post-retirement benefit planscover primarily U.S. employees for retirement medicalcosts. As permitted by existing accounting rules, weemploy a delayed recognition feature in measuring thecosts of pension and post-retirement benefit plans. Thisrequires changes in the benefit obligations and changes inthe value of assets set aside to meet those obligations tobe recognized not as they occur, but systematically andgradually over subsequent periods. All changes areultimately recognized as components of net periodicbenefit cost, except to the extent they may be offset bysubsequent changes. At any point, changes that havebeen identified and quantified but not recognized ascomponents of net periodic benefit cost, are recognized inaccumulated other comprehensive loss, net of tax.
Several statistical and other factors that attempt toanticipate future events are used in calculating theexpense, liability and asset values related to our pensionand post-retirement benefit plans. These factors includeassumptions we make about the discount rate, expectedreturn on plan assets, rate of increase in healthcare costs,the rate of future compensation increases, and mortality,
among others. Actual returns on plan assets are notimmediately recognized in our income statement, due tothe delayed recognition requirement. In calculating theexpected return on the plan asset component of our netperiodic pension cost, we apply our estimate of the long-term rate of return to the plan assets that support ourpension obligations, after deducting assets that arespecifically allocated to Transitional Retirement Accounts(which are accounted for based on specific plan terms).
For purposes of determining the expected return onplan assets, we utilize a calculated value approach indetermining the value of the pension plan assets, asopposed to a fair market value approach. The primarydifference between the two methods relates to systematicrecognition of changes in fair value over time (generallytwo years) versus immediate recognition of changes in fairvalue. Our expected rate of return on plan assets is thenapplied to the calculated asset value to determine theamount of the expected return on plan assets to be usedin the determination of the net periodic pension cost. Thecalculated value approach reduces the volatility in netperiodic pension cost that results from using the fairmarket value approach.
Each year, the difference between the actual returnon plan assets and the expected return on plan assets isadded to, or subtracted from, any cumulative actuarialgain or loss that arose in prior years. Subsequent to theadoption of FAS 158, this amount is a component of thenet actuarial gain or loss recognized in accumulated othercomprehensive loss and is subject to subsequentamortization to net periodic pension cost in future periodsover the remaining service lives of the employeesparticipating in the pension plan.
The discount rate is used to present value our futureanticipated benefit obligations. In estimating our discountrate, we consider rates of return on high quality fixed-income investments included in various published bondindexes, adjusted to eliminate the effects of call provisionsand differences in the timing and amounts of cashoutflows related to the bonds, as well as, the expectedtiming of pension and other benefit payments. In the U.S.and the U.K., which comprise approximately 80% of ourprojected benefit obligation, we consider the Moody’s AaCorporate Bond Index and the International IndexCompany’s iBoxx Sterling Corporate AA Cash Bond Index,respectively in the determination of the appropriate
Xerox Annual Report 2007 89
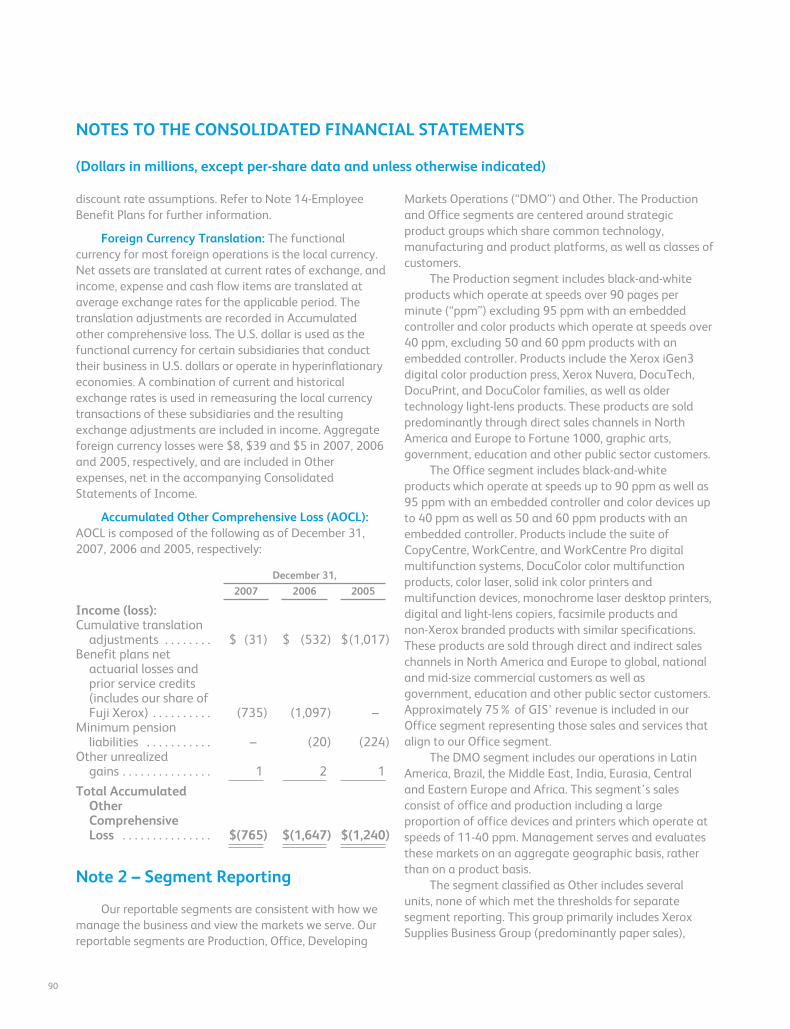
NOTES TO THE CONSOLIDATED FINANCIAL STATEMENTS
(Dollars in millions, except per-share data and unless otherwise indicated)
discount rate assumptions. Refer to Note 14-EmployeeBenefit Plans for further information.
Foreign Currency Translation: The functionalcurrency for most foreign operations is the local currency.Net assets are translated at current rates of exchange, andincome, expense and cash flow items are translated ataverage exchange rates for the applicable period. Thetranslation adjustments are recorded in Accumulatedother comprehensive loss. The U.S. dollar is used as thefunctional currency for certain subsidiaries that conducttheir business in U.S. dollars or operate in hyperinflationaryeconomies. A combination of current and historicalexchange rates is used in remeasuring the local currencytransactions of these subsidiaries and the resultingexchange adjustments are included in income. Aggregateforeign currency losses were $8, $39 and $5 in 2007, 2006and 2005, respectively, and are included in Otherexpenses, net in the accompanying ConsolidatedStatements of Income.
Accumulated Other Comprehensive Loss (AOCL):AOCL is composed of the following as of December 31,2007, 2006 and 2005, respectively:
December 31,
2007 2006 2005
Income (loss):Cumulative translation
adjustments . . . . . . . . $ (31) $ (532) $(1,017)Benefit plans net
actuarial losses andprior service credits(includes our share ofFuji Xerox) . . . . . . . . . . (735) (1,097) –
Minimum pensionliabilities . . . . . . . . . . . – (20) (224)
Other unrealizedgains . . . . . . . . . . . . . . . 1 2 1
Total AccumulatedOtherComprehensiveLoss . . . . . . . . . . . . . . . $(765) $(1,647) $(1,240)
Note 2 – Segment Reporting
Our reportable segments are consistent with how wemanage the business and view the markets we serve. Ourreportable segments are Production, Office, Developing
Markets Operations (“DMO”) and Other. The Productionand Office segments are centered around strategicproduct groups which share common technology,manufacturing and product platforms, as well as classes ofcustomers.
The Production segment includes black-and-whiteproducts which operate at speeds over 90 pages perminute (“ppm”) excluding 95 ppm with an embeddedcontroller and color products which operate at speeds over40 ppm, excluding 50 and 60 ppm products with anembedded controller. Products include the Xerox iGen3digital color production press, Xerox Nuvera, DocuTech,DocuPrint, and DocuColor families, as well as oldertechnology light-lens products. These products are soldpredominantly through direct sales channels in NorthAmerica and Europe to Fortune 1000, graphic arts,government, education and other public sector customers.
The Office segment includes black-and-whiteproducts which operate at speeds up to 90 ppm as well as95 ppm with an embedded controller and color devices upto 40 ppm as well as 50 and 60 ppm products with anembedded controller. Products include the suite ofCopyCentre, WorkCentre, and WorkCentre Pro digitalmultifunction systems, DocuColor color multifunctionproducts, color laser, solid ink color printers andmultifunction devices, monochrome laser desktop printers,digital and light-lens copiers, facsimile products andnon-Xerox branded products with similar specifications.These products are sold through direct and indirect saleschannels in North America and Europe to global, nationaland mid-size commercial customers as well asgovernment, education and other public sector customers.Approximately 75% of GIS’ revenue is included in ourOffice segment representing those sales and services thatalign to our Office segment.
The DMO segment includes our operations in LatinAmerica, Brazil, the Middle East, India, Eurasia, Centraland Eastern Europe and Africa. This segment’s salesconsist of office and production including a largeproportion of office devices and printers which operate atspeeds of 11-40 ppm. Management serves and evaluatesthese markets on an aggregate geographic basis, ratherthan on a product basis.
The segment classified as Other includes severalunits, none of which met the thresholds for separatesegment reporting. This group primarily includes XeroxSupplies Business Group (predominantly paper sales),
90
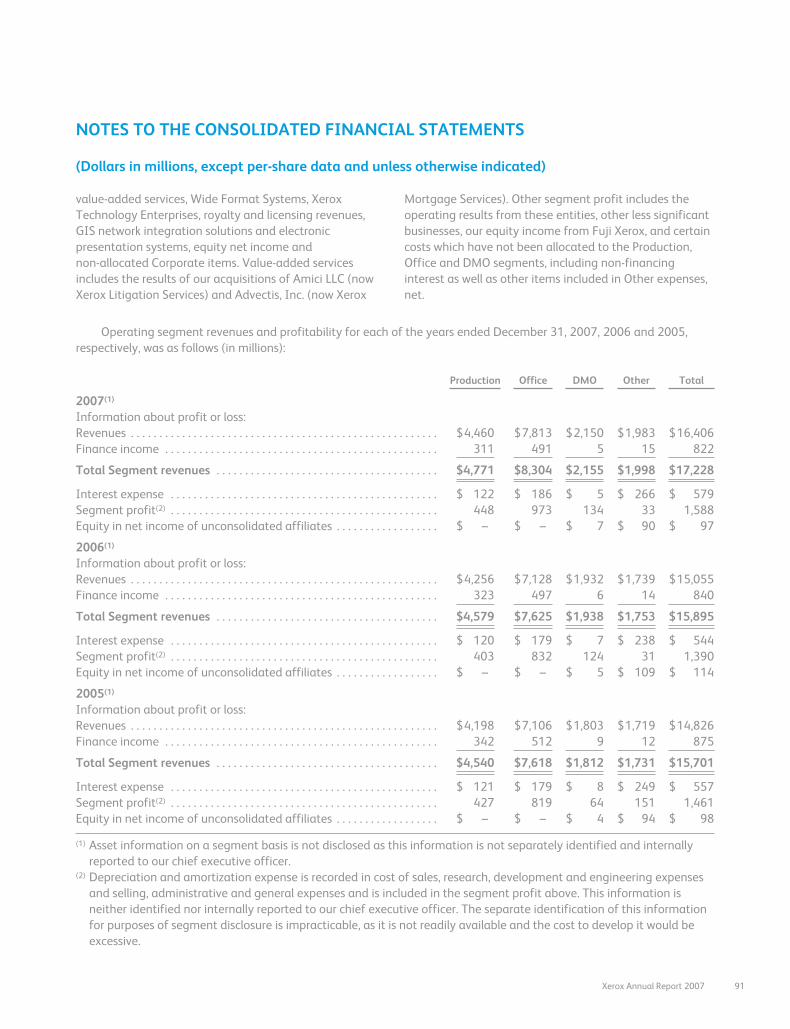
NOTES TO THE CONSOLIDATED FINANCIAL STATEMENTS
(Dollars in millions, except per-share data and unless otherwise indicated)
value-added services, Wide Format Systems, XeroxTechnology Enterprises, royalty and licensing revenues,GIS network integration solutions and electronicpresentation systems, equity net income andnon-allocated Corporate items. Value-added servicesincludes the results of our acquisitions of Amici LLC (nowXerox Litigation Services) and Advectis, Inc. (now Xerox
Mortgage Services). Other segment profit includes theoperating results from these entities, other less significantbusinesses, our equity income from Fuji Xerox, and certaincosts which have not been allocated to the Production,Office and DMO segments, including non-financinginterest as well as other items included in Other expenses,net.
Operating segment revenues and profitability for each of the years ended December 31, 2007, 2006 and 2005,respectively, was as follows (in millions):
Production Office DMO Other Total
2007(1)
Information about profit or loss:Revenues . . . . . . . . . . . . . . . . . . . . . . . . . . . . . . . . . . . . . . . . . . . . . . . . . . . . . . $4,460 $7,813 $2,150 $1,983 $16,406Finance income . . . . . . . . . . . . . . . . . . . . . . . . . . . . . . . . . . . . . . . . . . . . . . . . 311 491 5 15 822
Total Segment revenues . . . . . . . . . . . . . . . . . . . . . . . . . . . . . . . . . . . . . . . $4,771 $8,304 $2,155 $1,998 $17,228
Interest expense . . . . . . . . . . . . . . . . . . . . . . . . . . . . . . . . . . . . . . . . . . . . . . . $ 122 $ 186 $ 5 $ 266 $ 579Segment profit(2) . . . . . . . . . . . . . . . . . . . . . . . . . . . . . . . . . . . . . . . . . . . . . . . 448 973 134 33 1,588Equity in net income of unconsolidated affiliates . . . . . . . . . . . . . . . . . . $ – $ – $ 7 $ 90 $ 97
2006(1)
Information about profit or loss:Revenues . . . . . . . . . . . . . . . . . . . . . . . . . . . . . . . . . . . . . . . . . . . . . . . . . . . . . . $4,256 $7,128 $1,932 $1,739 $15,055Finance income . . . . . . . . . . . . . . . . . . . . . . . . . . . . . . . . . . . . . . . . . . . . . . . . 323 497 6 14 840
Total Segment revenues . . . . . . . . . . . . . . . . . . . . . . . . . . . . . . . . . . . . . . . $4,579 $7,625 $1,938 $1,753 $15,895
Interest expense . . . . . . . . . . . . . . . . . . . . . . . . . . . . . . . . . . . . . . . . . . . . . . . $ 120 $ 179 $ 7 $ 238 $ 544Segment profit(2) . . . . . . . . . . . . . . . . . . . . . . . . . . . . . . . . . . . . . . . . . . . . . . . 403 832 124 31 1,390Equity in net income of unconsolidated affiliates . . . . . . . . . . . . . . . . . . $ – $ – $ 5 $ 109 $ 114
2005(1)
Information about profit or loss:Revenues . . . . . . . . . . . . . . . . . . . . . . . . . . . . . . . . . . . . . . . . . . . . . . . . . . . . . . $4,198 $7,106 $1,803 $1,719 $14,826Finance income . . . . . . . . . . . . . . . . . . . . . . . . . . . . . . . . . . . . . . . . . . . . . . . . 342 512 9 12 875
Total Segment revenues . . . . . . . . . . . . . . . . . . . . . . . . . . . . . . . . . . . . . . . $4,540 $7,618 $1,812 $1,731 $15,701
Interest expense . . . . . . . . . . . . . . . . . . . . . . . . . . . . . . . . . . . . . . . . . . . . . . . $ 121 $ 179 $ 8 $ 249 $ 557Segment profit(2) . . . . . . . . . . . . . . . . . . . . . . . . . . . . . . . . . . . . . . . . . . . . . . . 427 819 64 151 1,461Equity in net income of unconsolidated affiliates . . . . . . . . . . . . . . . . . . $ – $ – $ 4 $ 94 $ 98
(1) Asset information on a segment basis is not disclosed as this information is not separately identified and internallyreported to our chief executive officer.
(2) Depreciation and amortization expense is recorded in cost of sales, research, development and engineering expensesand selling, administrative and general expenses and is included in the segment profit above. This information isneither identified nor internally reported to our chief executive officer. The separate identification of this informationfor purposes of segment disclosure is impracticable, as it is not readily available and the cost to develop it would beexcessive.
Xerox Annual Report 2007 91
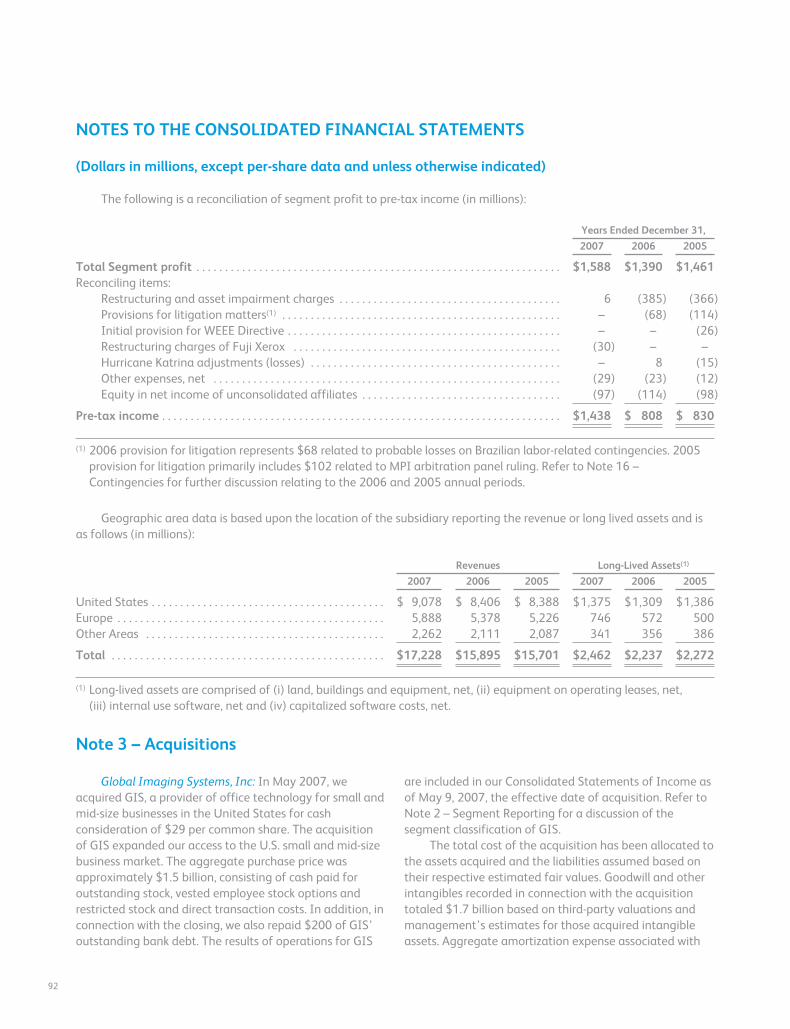
NOTES TO THE CONSOLIDATED FINANCIAL STATEMENTS
(Dollars in millions, except per-share data and unless otherwise indicated)
The following is a reconciliation of segment profit to pre-tax income (in millions):
Years Ended December 31,
2007 2006 2005
Total Segment profit . . . . . . . . . . . . . . . . . . . . . . . . . . . . . . . . . . . . . . . . . . . . . . . . . . . . . . . . . . . . . . . . $1,588 $1,390 $1,461Reconciling items:
Restructuring and asset impairment charges . . . . . . . . . . . . . . . . . . . . . . . . . . . . . . . . . . . . . . . 6 (385) (366)Provisions for litigation matters(1) . . . . . . . . . . . . . . . . . . . . . . . . . . . . . . . . . . . . . . . . . . . . . . . . . – (68) (114)Initial provision for WEEE Directive . . . . . . . . . . . . . . . . . . . . . . . . . . . . . . . . . . . . . . . . . . . . . . . . – – (26)Restructuring charges of Fuji Xerox . . . . . . . . . . . . . . . . . . . . . . . . . . . . . . . . . . . . . . . . . . . . . . . (30) – –Hurricane Katrina adjustments (losses) . . . . . . . . . . . . . . . . . . . . . . . . . . . . . . . . . . . . . . . . . . . . – 8 (15)Other expenses, net . . . . . . . . . . . . . . . . . . . . . . . . . . . . . . . . . . . . . . . . . . . . . . . . . . . . . . . . . . . . . (29) (23) (12)Equity in net income of unconsolidated affiliates . . . . . . . . . . . . . . . . . . . . . . . . . . . . . . . . . . . (97) (114) (98)
Pre-tax income . . . . . . . . . . . . . . . . . . . . . . . . . . . . . . . . . . . . . . . . . . . . . . . . . . . . . . . . . . . . . . . . . . . . . . $1,438 $ 808 $ 830
(1) 2006 provision for litigation represents $68 related to probable losses on Brazilian labor-related contingencies. 2005provision for litigation primarily includes $102 related to MPI arbitration panel ruling. Refer to Note 16 –Contingencies for further discussion relating to the 2006 and 2005 annual periods.
Geographic area data is based upon the location of the subsidiary reporting the revenue or long lived assets and isas follows (in millions):
Revenues Long-Lived Assets(1)
2007 2006 2005 2007 2006 2005
United States . . . . . . . . . . . . . . . . . . . . . . . . . . . . . . . . . . . . . . . . . $ 9,078 $ 8,406 $ 8,388 $1,375 $1,309 $1,386Europe . . . . . . . . . . . . . . . . . . . . . . . . . . . . . . . . . . . . . . . . . . . . . . . 5,888 5,378 5,226 746 572 500Other Areas . . . . . . . . . . . . . . . . . . . . . . . . . . . . . . . . . . . . . . . . . . 2,262 2,111 2,087 341 356 386
Total . . . . . . . . . . . . . . . . . . . . . . . . . . . . . . . . . . . . . . . . . . . . . . . . $17,228 $15,895 $15,701 $2,462 $2,237 $2,272
(1) Long-lived assets are comprised of (i) land, buildings and equipment, net, (ii) equipment on operating leases, net,(iii) internal use software, net and (iv) capitalized software costs, net.
Note 3 – Acquisitions
Global Imaging Systems, Inc: In May 2007, weacquired GIS, a provider of office technology for small andmid-size businesses in the United States for cashconsideration of $29 per common share. The acquisitionof GIS expanded our access to the U.S. small and mid-sizebusiness market. The aggregate purchase price wasapproximately $1.5 billion, consisting of cash paid foroutstanding stock, vested employee stock options andrestricted stock and direct transaction costs. In addition, inconnection with the closing, we also repaid $200 of GIS’outstanding bank debt. The results of operations for GIS
are included in our Consolidated Statements of Income asof May 9, 2007, the effective date of acquisition. Refer toNote 2 – Segment Reporting for a discussion of thesegment classification of GIS.
The total cost of the acquisition has been allocated tothe assets acquired and the liabilities assumed based ontheir respective estimated fair values. Goodwill and otherintangibles recorded in connection with the acquisitiontotaled $1.7 billion based on third-party valuations andmanagement’s estimates for those acquired intangibleassets. Aggregate amortization expense associated with
92
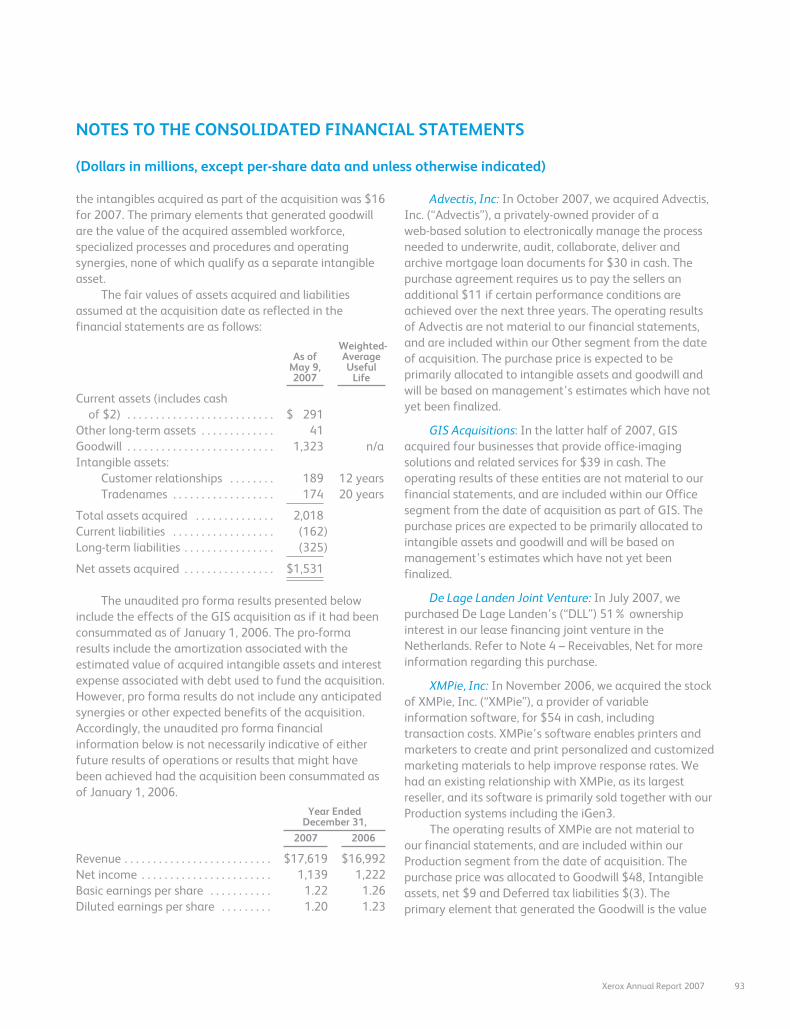
NOTES TO THE CONSOLIDATED FINANCIAL STATEMENTS
(Dollars in millions, except per-share data and unless otherwise indicated)
the intangibles acquired as part of the acquisition was $16for 2007. The primary elements that generated goodwillare the value of the acquired assembled workforce,specialized processes and procedures and operatingsynergies, none of which qualify as a separate intangibleasset.
The fair values of assets acquired and liabilitiesassumed at the acquisition date as reflected in thefinancial statements are as follows:
As ofMay 9,2007
Weighted-AverageUseful
Life
Current assets (includes cashof $2) . . . . . . . . . . . . . . . . . . . . . . . . . . $ 291
Other long-term assets . . . . . . . . . . . . . 41Goodwill . . . . . . . . . . . . . . . . . . . . . . . . . . 1,323 n/aIntangible assets:
Customer relationships . . . . . . . . 189 12 yearsTradenames . . . . . . . . . . . . . . . . . . 174 20 years
Total assets acquired . . . . . . . . . . . . . . 2,018Current liabilities . . . . . . . . . . . . . . . . . . (162)Long-term liabilities . . . . . . . . . . . . . . . . (325)
Net assets acquired . . . . . . . . . . . . . . . . $1,531
The unaudited pro forma results presented belowinclude the effects of the GIS acquisition as if it had beenconsummated as of January 1, 2006. The pro-formaresults include the amortization associated with theestimated value of acquired intangible assets and interestexpense associated with debt used to fund the acquisition.However, pro forma results do not include any anticipatedsynergies or other expected benefits of the acquisition.Accordingly, the unaudited pro forma financialinformation below is not necessarily indicative of eitherfuture results of operations or results that might havebeen achieved had the acquisition been consummated asof January 1, 2006.
Year EndedDecember 31,
2007 2006
Revenue . . . . . . . . . . . . . . . . . . . . . . . . . . $17,619 $16,992Net income . . . . . . . . . . . . . . . . . . . . . . . 1,139 1,222Basic earnings per share . . . . . . . . . . . 1.22 1.26Diluted earnings per share . . . . . . . . . 1.20 1.23
Advectis, Inc: In October 2007, we acquired Advectis,Inc. (“Advectis”), a privately-owned provider of aweb-based solution to electronically manage the processneeded to underwrite, audit, collaborate, deliver andarchive mortgage loan documents for $30 in cash. Thepurchase agreement requires us to pay the sellers anadditional $11 if certain performance conditions areachieved over the next three years. The operating resultsof Advectis are not material to our financial statements,and are included within our Other segment from the dateof acquisition. The purchase price is expected to beprimarily allocated to intangible assets and goodwill andwill be based on management’s estimates which have notyet been finalized.
GIS Acquisitions: In the latter half of 2007, GISacquired four businesses that provide office-imagingsolutions and related services for $39 in cash. Theoperating results of these entities are not material to ourfinancial statements, and are included within our Officesegment from the date of acquisition as part of GIS. Thepurchase prices are expected to be primarily allocated tointangible assets and goodwill and will be based onmanagement’s estimates which have not yet beenfinalized.
De Lage Landen Joint Venture: In July 2007, wepurchased De Lage Landen’s (“DLL”) 51% ownershipinterest in our lease financing joint venture in theNetherlands. Refer to Note 4 – Receivables, Net for moreinformation regarding this purchase.
XMPie, Inc: In November 2006, we acquired the stockof XMPie, Inc. (“XMPie”), a provider of variableinformation software, for $54 in cash, includingtransaction costs. XMPie’s software enables printers andmarketers to create and print personalized and customizedmarketing materials to help improve response rates. Wehad an existing relationship with XMPie, as its largestreseller, and its software is primarily sold together with ourProduction systems including the iGen3.
The operating results of XMPie are not material toour financial statements, and are included within ourProduction segment from the date of acquisition. Thepurchase price was allocated to Goodwill $48, Intangibleassets, net $9 and Deferred tax liabilities $(3). Theprimary element that generated the Goodwill is the value
Xerox Annual Report 2007 93
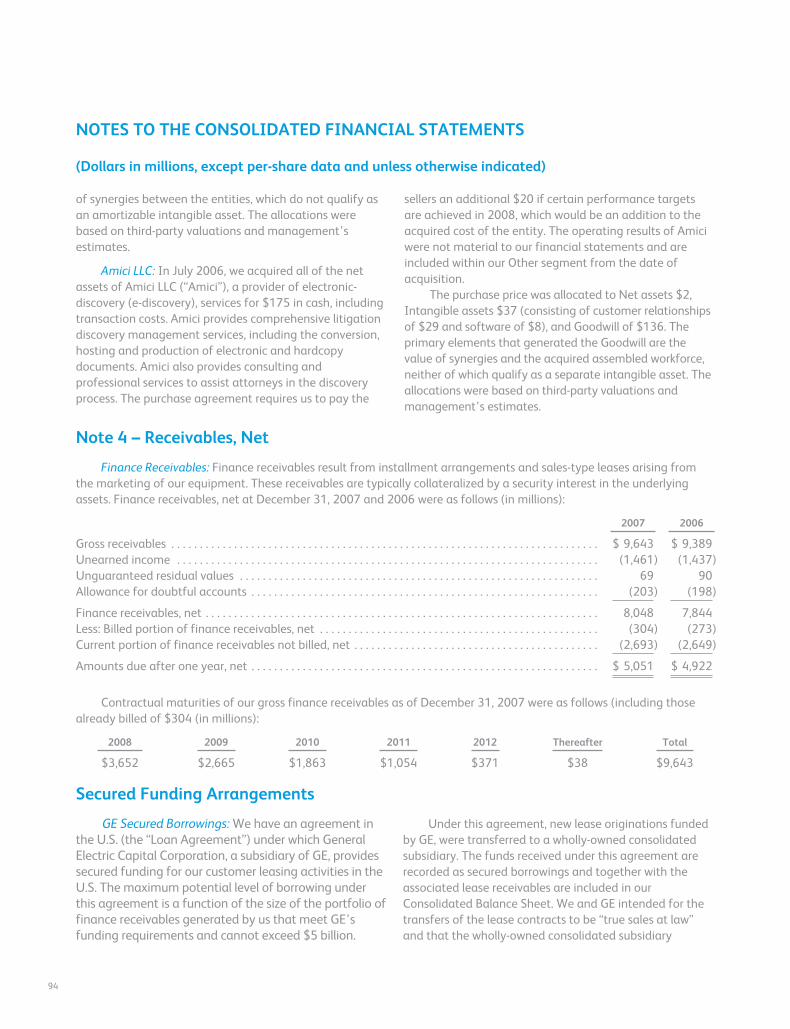
NOTES TO THE CONSOLIDATED FINANCIAL STATEMENTS
(Dollars in millions, except per-share data and unless otherwise indicated)
of synergies between the entities, which do not qualify asan amortizable intangible asset. The allocations werebased on third-party valuations and management’sestimates.
Amici LLC: In July 2006, we acquired all of the netassets of Amici LLC (“Amici”), a provider of electronic-discovery (e-discovery), services for $175 in cash, includingtransaction costs. Amici provides comprehensive litigationdiscovery management services, including the conversion,hosting and production of electronic and hardcopydocuments. Amici also provides consulting andprofessional services to assist attorneys in the discoveryprocess. The purchase agreement requires us to pay the
sellers an additional $20 if certain performance targetsare achieved in 2008, which would be an addition to theacquired cost of the entity. The operating results of Amiciwere not material to our financial statements and areincluded within our Other segment from the date ofacquisition.
The purchase price was allocated to Net assets $2,Intangible assets $37 (consisting of customer relationshipsof $29 and software of $8), and Goodwill of $136. Theprimary elements that generated the Goodwill are thevalue of synergies and the acquired assembled workforce,neither of which qualify as a separate intangible asset. Theallocations were based on third-party valuations andmanagement’s estimates.
Note 4 – Receivables, Net
Finance Receivables: Finance receivables result from installment arrangements and sales-type leases arising fromthe marketing of our equipment. These receivables are typically collateralized by a security interest in the underlyingassets. Finance receivables, net at December 31, 2007 and 2006 were as follows (in millions):
2007 2006
Gross receivables . . . . . . . . . . . . . . . . . . . . . . . . . . . . . . . . . . . . . . . . . . . . . . . . . . . . . . . . . . . . . . . . . . . . . . . . . . . $ 9,643 $ 9,389Unearned income . . . . . . . . . . . . . . . . . . . . . . . . . . . . . . . . . . . . . . . . . . . . . . . . . . . . . . . . . . . . . . . . . . . . . . . . . . (1,461) (1,437)Unguaranteed residual values . . . . . . . . . . . . . . . . . . . . . . . . . . . . . . . . . . . . . . . . . . . . . . . . . . . . . . . . . . . . . . . 69 90Allowance for doubtful accounts . . . . . . . . . . . . . . . . . . . . . . . . . . . . . . . . . . . . . . . . . . . . . . . . . . . . . . . . . . . . . (203) (198)
Finance receivables, net . . . . . . . . . . . . . . . . . . . . . . . . . . . . . . . . . . . . . . . . . . . . . . . . . . . . . . . . . . . . . . . . . . . . . 8,048 7,844Less: Billed portion of finance receivables, net . . . . . . . . . . . . . . . . . . . . . . . . . . . . . . . . . . . . . . . . . . . . . . . . . (304) (273)Current portion of finance receivables not billed, net . . . . . . . . . . . . . . . . . . . . . . . . . . . . . . . . . . . . . . . . . . . (2,693) (2,649)
Amounts due after one year, net . . . . . . . . . . . . . . . . . . . . . . . . . . . . . . . . . . . . . . . . . . . . . . . . . . . . . . . . . . . . . $ 5,051 $ 4,922
Contractual maturities of our gross finance receivables as of December 31, 2007 were as follows (including thosealready billed of $304 (in millions):
2008 2009 2010 2011 2012 Thereafter Total
$3,652 $2,665 $1,863 $1,054 $371 $38 $9,643
Secured Funding Arrangements
GE Secured Borrowings: We have an agreement inthe U.S. (the “Loan Agreement”) under which GeneralElectric Capital Corporation, a subsidiary of GE, providessecured funding for our customer leasing activities in theU.S. The maximum potential level of borrowing underthis agreement is a function of the size of the portfolio offinance receivables generated by us that meet GE’sfunding requirements and cannot exceed $5 billion.
Under this agreement, new lease originations fundedby GE, were transferred to a wholly-owned consolidatedsubsidiary. The funds received under this agreement arerecorded as secured borrowings and together with theassociated lease receivables are included in ourConsolidated Balance Sheet. We and GE intended for thetransfers of the lease contracts to be “true sales at law”and that the wholly-owned consolidated subsidiary
94
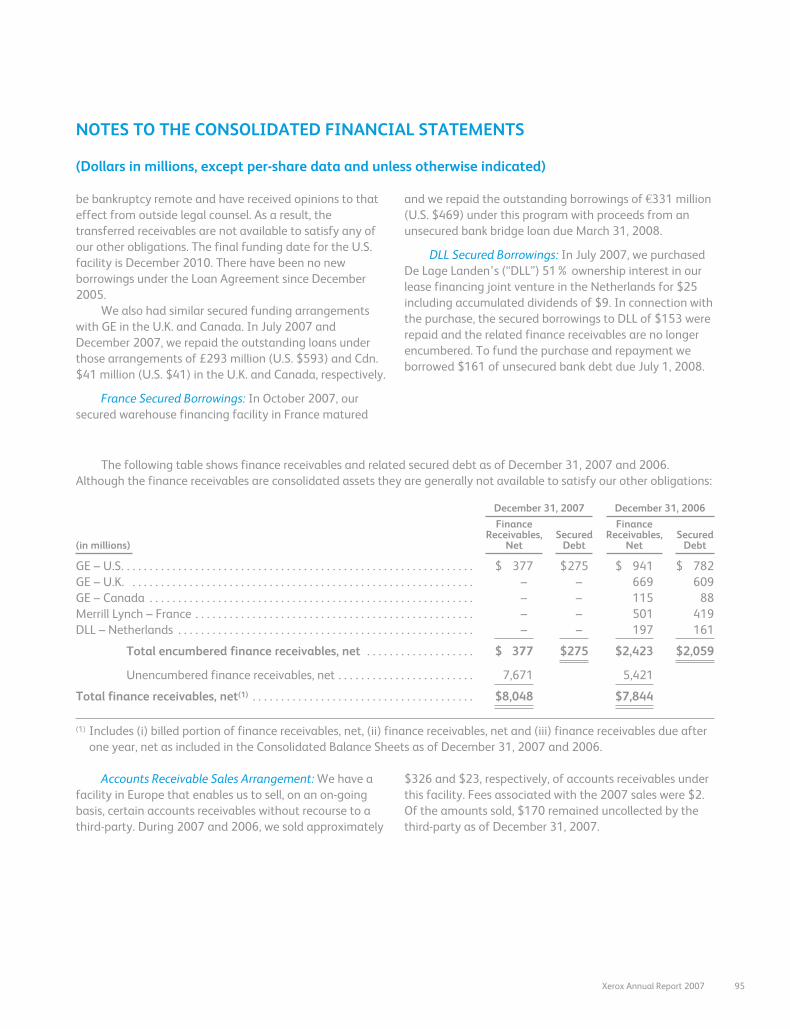
NOTES TO THE CONSOLIDATED FINANCIAL STATEMENTS
(Dollars in millions, except per-share data and unless otherwise indicated)
be bankruptcy remote and have received opinions to thateffect from outside legal counsel. As a result, thetransferred receivables are not available to satisfy any ofour other obligations. The final funding date for the U.S.facility is December 2010. There have been no newborrowings under the Loan Agreement since December2005.
We also had similar secured funding arrangementswith GE in the U.K. and Canada. In July 2007 andDecember 2007, we repaid the outstanding loans underthose arrangements of £293 million (U.S. $593) and Cdn.$41 million (U.S. $41) in the U.K. and Canada, respectively.
France Secured Borrowings: In October 2007, oursecured warehouse financing facility in France matured
and we repaid the outstanding borrowings of €331 million(U.S. $469) under this program with proceeds from anunsecured bank bridge loan due March 31, 2008.
DLL Secured Borrowings: In July 2007, we purchasedDe Lage Landen’s (“DLL”) 51% ownership interest in ourlease financing joint venture in the Netherlands for $25including accumulated dividends of $9. In connection withthe purchase, the secured borrowings to DLL of $153 wererepaid and the related finance receivables are no longerencumbered. To fund the purchase and repayment weborrowed $161 of unsecured bank debt due July 1, 2008.
The following table shows finance receivables and related secured debt as of December 31, 2007 and 2006.Although the finance receivables are consolidated assets they are generally not available to satisfy our other obligations:
December 31, 2007 December 31, 2006
(in millions)
FinanceReceivables,
NetSecured
Debt
FinanceReceivables,
NetSecured
Debt
GE – U.S. . . . . . . . . . . . . . . . . . . . . . . . . . . . . . . . . . . . . . . . . . . . . . . . . . . . . . . . . . . . . . $ 377 $275 $ 941 $ 782GE – U.K. . . . . . . . . . . . . . . . . . . . . . . . . . . . . . . . . . . . . . . . . . . . . . . . . . . . . . . . . . . . . – – 669 609GE – Canada . . . . . . . . . . . . . . . . . . . . . . . . . . . . . . . . . . . . . . . . . . . . . . . . . . . . . . . . . – – 115 88Merrill Lynch – France . . . . . . . . . . . . . . . . . . . . . . . . . . . . . . . . . . . . . . . . . . . . . . . . . – – 501 419DLL – Netherlands . . . . . . . . . . . . . . . . . . . . . . . . . . . . . . . . . . . . . . . . . . . . . . . . . . . . – – 197 161
Total encumbered finance receivables, net . . . . . . . . . . . . . . . . . . . $ 377 $275 $2,423 $2,059
Unencumbered finance receivables, net . . . . . . . . . . . . . . . . . . . . . . . . 7,671 5,421
Total finance receivables, net(1) . . . . . . . . . . . . . . . . . . . . . . . . . . . . . . . . . . . . . . . $8,048 $7,844
(1) Includes (i) billed portion of finance receivables, net, (ii) finance receivables, net and (iii) finance receivables due afterone year, net as included in the Consolidated Balance Sheets as of December 31, 2007 and 2006.
Accounts Receivable Sales Arrangement: We have afacility in Europe that enables us to sell, on an on-goingbasis, certain accounts receivables without recourse to athird-party. During 2007 and 2006, we sold approximately
$326 and $23, respectively, of accounts receivables underthis facility. Fees associated with the 2007 sales were $2.Of the amounts sold, $170 remained uncollected by thethird-party as of December 31, 2007.
Xerox Annual Report 2007 95
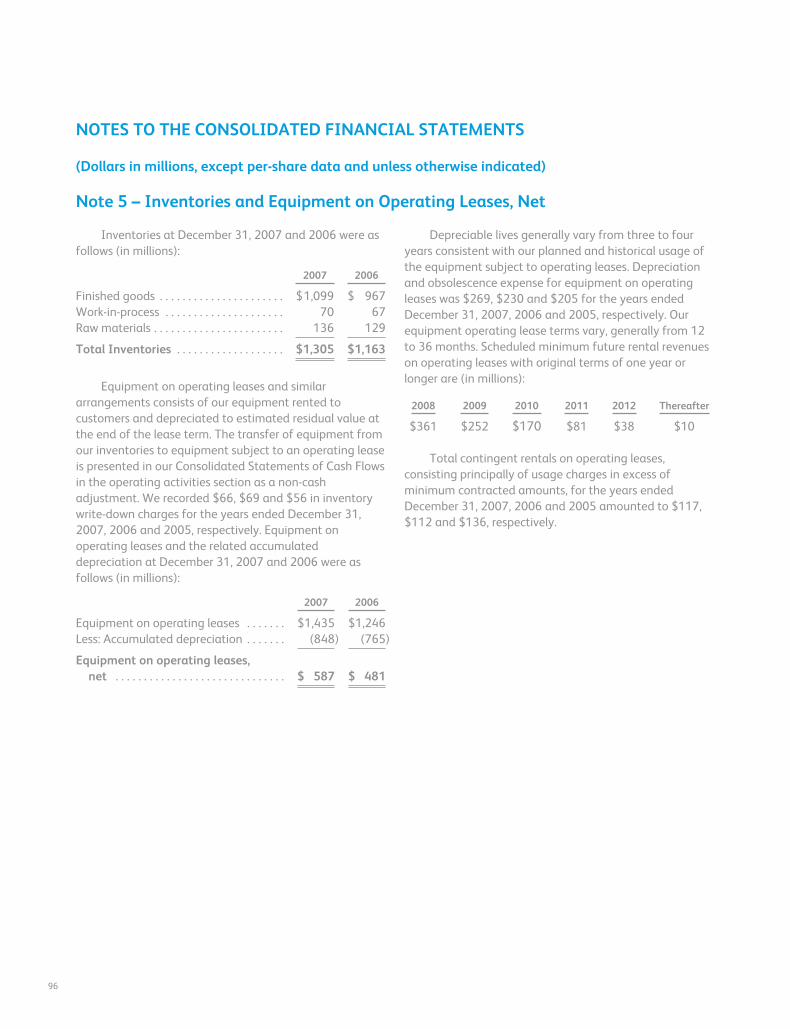
NOTES TO THE CONSOLIDATED FINANCIAL STATEMENTS
(Dollars in millions, except per-share data and unless otherwise indicated)
Note 5 – Inventories and Equipment on Operating Leases, Net
Inventories at December 31, 2007 and 2006 were asfollows (in millions):
2007 2006
Finished goods . . . . . . . . . . . . . . . . . . . . . . $1,099 $ 967Work-in-process . . . . . . . . . . . . . . . . . . . . . 70 67Raw materials . . . . . . . . . . . . . . . . . . . . . . . 136 129
Total Inventories . . . . . . . . . . . . . . . . . . . $1,305 $1,163
Equipment on operating leases and similararrangements consists of our equipment rented tocustomers and depreciated to estimated residual value atthe end of the lease term. The transfer of equipment fromour inventories to equipment subject to an operating leaseis presented in our Consolidated Statements of Cash Flowsin the operating activities section as a non-cashadjustment. We recorded $66, $69 and $56 in inventorywrite-down charges for the years ended December 31,2007, 2006 and 2005, respectively. Equipment onoperating leases and the related accumulateddepreciation at December 31, 2007 and 2006 were asfollows (in millions):
2007 2006
Equipment on operating leases . . . . . . . $1,435 $1,246Less: Accumulated depreciation . . . . . . . (848) (765)
Equipment on operating leases,net . . . . . . . . . . . . . . . . . . . . . . . . . . . . . . $ 587 $ 481
Depreciable lives generally vary from three to fouryears consistent with our planned and historical usage ofthe equipment subject to operating leases. Depreciationand obsolescence expense for equipment on operatingleases was $269, $230 and $205 for the years endedDecember 31, 2007, 2006 and 2005, respectively. Ourequipment operating lease terms vary, generally from 12to 36 months. Scheduled minimum future rental revenueson operating leases with original terms of one year orlonger are (in millions):
2008 2009 2010 2011 2012 Thereafter
$361 $252 $170 $81 $38 $10
Total contingent rentals on operating leases,consisting principally of usage charges in excess ofminimum contracted amounts, for the years endedDecember 31, 2007, 2006 and 2005 amounted to $117,$112 and $136, respectively.
96
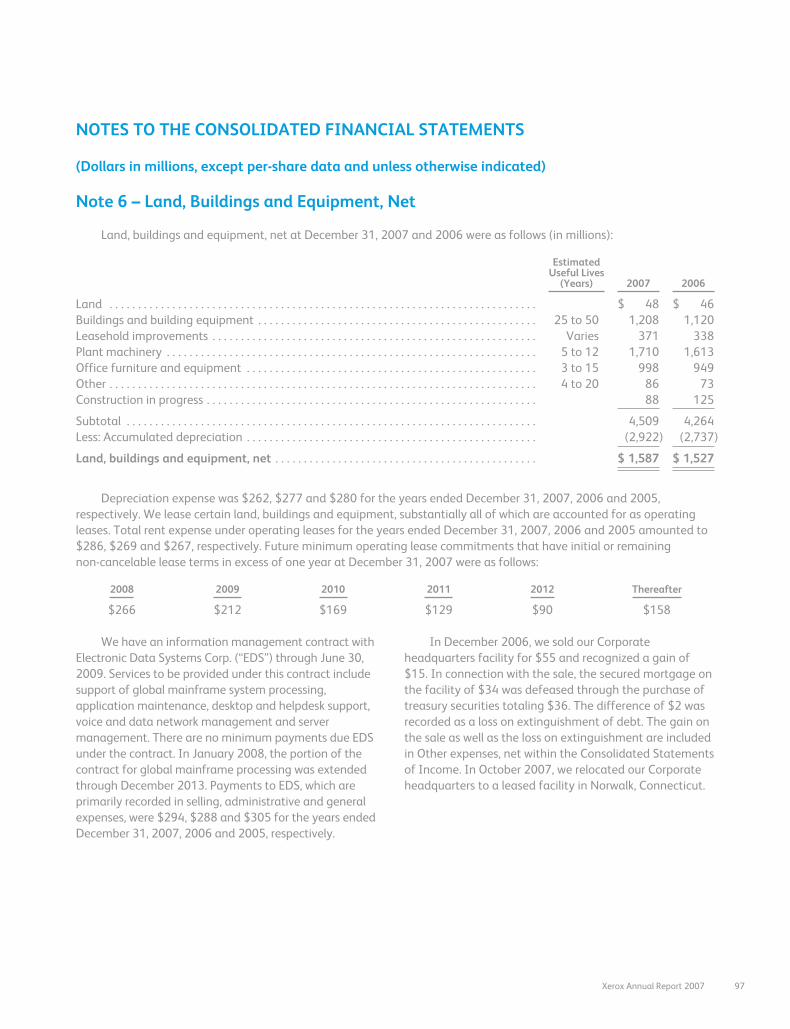
NOTES TO THE CONSOLIDATED FINANCIAL STATEMENTS
(Dollars in millions, except per-share data and unless otherwise indicated)
Note 6 – Land, Buildings and Equipment, Net
Land, buildings and equipment, net at December 31, 2007 and 2006 were as follows (in millions):
EstimatedUseful Lives
(Years) 2007 2006
Land . . . . . . . . . . . . . . . . . . . . . . . . . . . . . . . . . . . . . . . . . . . . . . . . . . . . . . . . . . . . . . . . . . . . . . . . . . . $ 48 $ 46Buildings and building equipment . . . . . . . . . . . . . . . . . . . . . . . . . . . . . . . . . . . . . . . . . . . . . . . . . 25 to 50 1,208 1,120Leasehold improvements . . . . . . . . . . . . . . . . . . . . . . . . . . . . . . . . . . . . . . . . . . . . . . . . . . . . . . . . . Varies 371 338Plant machinery . . . . . . . . . . . . . . . . . . . . . . . . . . . . . . . . . . . . . . . . . . . . . . . . . . . . . . . . . . . . . . . . . 5 to 12 1,710 1,613Office furniture and equipment . . . . . . . . . . . . . . . . . . . . . . . . . . . . . . . . . . . . . . . . . . . . . . . . . . . 3 to 15 998 949Other . . . . . . . . . . . . . . . . . . . . . . . . . . . . . . . . . . . . . . . . . . . . . . . . . . . . . . . . . . . . . . . . . . . . . . . . . . . 4 to 20 86 73Construction in progress . . . . . . . . . . . . . . . . . . . . . . . . . . . . . . . . . . . . . . . . . . . . . . . . . . . . . . . . . . 88 125
Subtotal . . . . . . . . . . . . . . . . . . . . . . . . . . . . . . . . . . . . . . . . . . . . . . . . . . . . . . . . . . . . . . . . . . . . . . . . 4,509 4,264Less: Accumulated depreciation . . . . . . . . . . . . . . . . . . . . . . . . . . . . . . . . . . . . . . . . . . . . . . . . . . . (2,922) (2,737)
Land, buildings and equipment, net . . . . . . . . . . . . . . . . . . . . . . . . . . . . . . . . . . . . . . . . . . . . . . $ 1,587 $ 1,527
Depreciation expense was $262, $277 and $280 for the years ended December 31, 2007, 2006 and 2005,respectively. We lease certain land, buildings and equipment, substantially all of which are accounted for as operatingleases. Total rent expense under operating leases for the years ended December 31, 2007, 2006 and 2005 amounted to$286, $269 and $267, respectively. Future minimum operating lease commitments that have initial or remainingnon-cancelable lease terms in excess of one year at December 31, 2007 were as follows:
2008 2009 2010 2011 2012 Thereafter
$266 $212 $169 $129 $90 $158
We have an information management contract withElectronic Data Systems Corp. (“EDS”) through June 30,2009. Services to be provided under this contract includesupport of global mainframe system processing,application maintenance, desktop and helpdesk support,voice and data network management and servermanagement. There are no minimum payments due EDSunder the contract. In January 2008, the portion of thecontract for global mainframe processing was extendedthrough December 2013. Payments to EDS, which areprimarily recorded in selling, administrative and generalexpenses, were $294, $288 and $305 for the years endedDecember 31, 2007, 2006 and 2005, respectively.
In December 2006, we sold our Corporateheadquarters facility for $55 and recognized a gain of$15. In connection with the sale, the secured mortgage onthe facility of $34 was defeased through the purchase oftreasury securities totaling $36. The difference of $2 wasrecorded as a loss on extinguishment of debt. The gain onthe sale as well as the loss on extinguishment are includedin Other expenses, net within the Consolidated Statementsof Income. In October 2007, we relocated our Corporateheadquarters to a leased facility in Norwalk, Connecticut.
Xerox Annual Report 2007 97
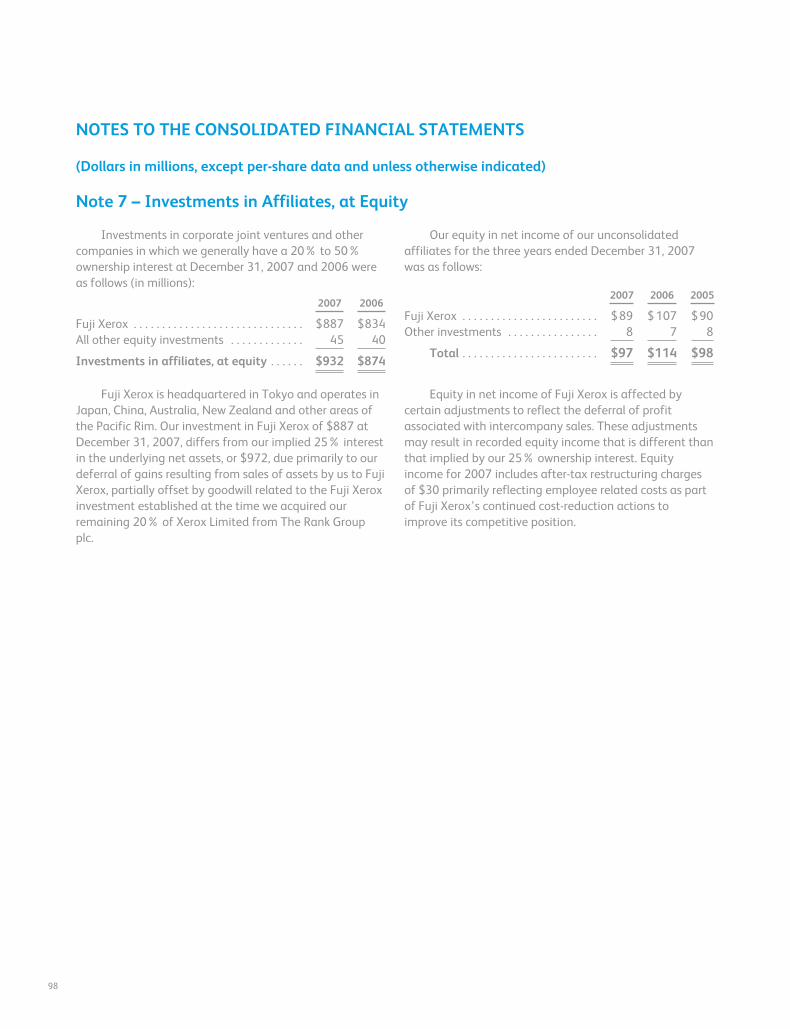
NOTES TO THE CONSOLIDATED FINANCIAL STATEMENTS
(Dollars in millions, except per-share data and unless otherwise indicated)
Note 7 – Investments in Affiliates, at Equity
Investments in corporate joint ventures and othercompanies in which we generally have a 20% to 50%ownership interest at December 31, 2007 and 2006 wereas follows (in millions):
2007 2006
Fuji Xerox . . . . . . . . . . . . . . . . . . . . . . . . . . . . . . $887 $834All other equity investments . . . . . . . . . . . . . 45 40
Investments in affiliates, at equity . . . . . . $932 $874
Fuji Xerox is headquartered in Tokyo and operates inJapan, China, Australia, New Zealand and other areas ofthe Pacific Rim. Our investment in Fuji Xerox of $887 atDecember 31, 2007, differs from our implied 25% interestin the underlying net assets, or $972, due primarily to ourdeferral of gains resulting from sales of assets by us to FujiXerox, partially offset by goodwill related to the Fuji Xeroxinvestment established at the time we acquired ourremaining 20% of Xerox Limited from The Rank Groupplc.
Our equity in net income of our unconsolidatedaffiliates for the three years ended December 31, 2007was as follows:
2007 2006 2005
Fuji Xerox . . . . . . . . . . . . . . . . . . . . . . . . $89 $ 107 $90Other investments . . . . . . . . . . . . . . . . 8 7 8
Total . . . . . . . . . . . . . . . . . . . . . . . . $97 $114 $98
Equity in net income of Fuji Xerox is affected bycertain adjustments to reflect the deferral of profitassociated with intercompany sales. These adjustmentsmay result in recorded equity income that is different thanthat implied by our 25% ownership interest. Equityincome for 2007 includes after-tax restructuring chargesof $30 primarily reflecting employee related costs as partof Fuji Xerox’s continued cost-reduction actions toimprove its competitive position.
98
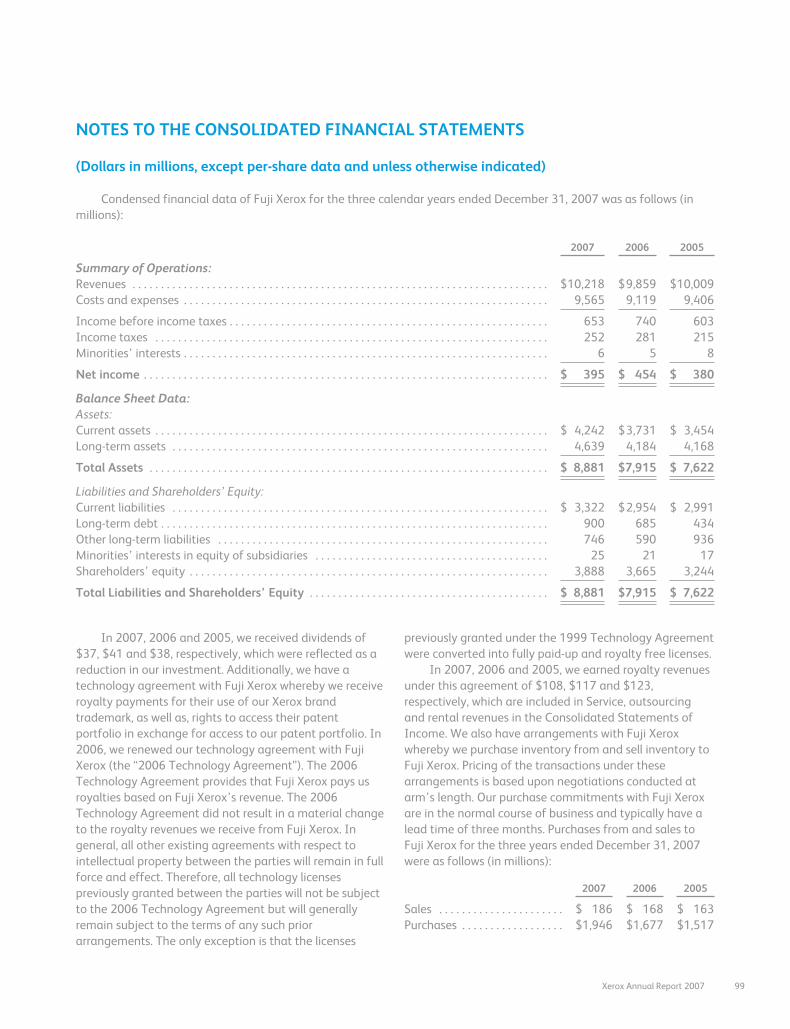
NOTES TO THE CONSOLIDATED FINANCIAL STATEMENTS
(Dollars in millions, except per-share data and unless otherwise indicated)
Condensed financial data of Fuji Xerox for the three calendar years ended December 31, 2007 was as follows (inmillions):
2007 2006 2005
Summary of Operations:Revenues . . . . . . . . . . . . . . . . . . . . . . . . . . . . . . . . . . . . . . . . . . . . . . . . . . . . . . . . . . . . . . . . . . . . . . . . . $10,218 $9,859 $10,009Costs and expenses . . . . . . . . . . . . . . . . . . . . . . . . . . . . . . . . . . . . . . . . . . . . . . . . . . . . . . . . . . . . . . . . 9,565 9,119 9,406
Income before income taxes . . . . . . . . . . . . . . . . . . . . . . . . . . . . . . . . . . . . . . . . . . . . . . . . . . . . . . . . 653 740 603Income taxes . . . . . . . . . . . . . . . . . . . . . . . . . . . . . . . . . . . . . . . . . . . . . . . . . . . . . . . . . . . . . . . . . . . . . 252 281 215Minorities’ interests . . . . . . . . . . . . . . . . . . . . . . . . . . . . . . . . . . . . . . . . . . . . . . . . . . . . . . . . . . . . . . . . 6 5 8
Net income . . . . . . . . . . . . . . . . . . . . . . . . . . . . . . . . . . . . . . . . . . . . . . . . . . . . . . . . . . . . . . . . . . . . . . . $ 395 $ 454 $ 380
Balance Sheet Data:Assets:Current assets . . . . . . . . . . . . . . . . . . . . . . . . . . . . . . . . . . . . . . . . . . . . . . . . . . . . . . . . . . . . . . . . . . . . . $ 4,242 $3,731 $ 3,454Long-term assets . . . . . . . . . . . . . . . . . . . . . . . . . . . . . . . . . . . . . . . . . . . . . . . . . . . . . . . . . . . . . . . . . . 4,639 4,184 4,168
Total Assets . . . . . . . . . . . . . . . . . . . . . . . . . . . . . . . . . . . . . . . . . . . . . . . . . . . . . . . . . . . . . . . . . . . . . . $ 8,881 $7,915 $ 7,622
Liabilities and Shareholders’ Equity:Current liabilities . . . . . . . . . . . . . . . . . . . . . . . . . . . . . . . . . . . . . . . . . . . . . . . . . . . . . . . . . . . . . . . . . . $ 3,322 $2,954 $ 2,991Long-term debt . . . . . . . . . . . . . . . . . . . . . . . . . . . . . . . . . . . . . . . . . . . . . . . . . . . . . . . . . . . . . . . . . . . . 900 685 434Other long-term liabilities . . . . . . . . . . . . . . . . . . . . . . . . . . . . . . . . . . . . . . . . . . . . . . . . . . . . . . . . . . 746 590 936Minorities’ interests in equity of subsidiaries . . . . . . . . . . . . . . . . . . . . . . . . . . . . . . . . . . . . . . . . . 25 21 17Shareholders’ equity . . . . . . . . . . . . . . . . . . . . . . . . . . . . . . . . . . . . . . . . . . . . . . . . . . . . . . . . . . . . . . . 3,888 3,665 3,244
Total Liabilities and Shareholders’ Equity . . . . . . . . . . . . . . . . . . . . . . . . . . . . . . . . . . . . . . . . . . $ 8,881 $7,915 $ 7,622
In 2007, 2006 and 2005, we received dividends of$37, $41 and $38, respectively, which were reflected as areduction in our investment. Additionally, we have atechnology agreement with Fuji Xerox whereby we receiveroyalty payments for their use of our Xerox brandtrademark, as well as, rights to access their patentportfolio in exchange for access to our patent portfolio. In2006, we renewed our technology agreement with FujiXerox (the “2006 Technology Agreement”). The 2006Technology Agreement provides that Fuji Xerox pays usroyalties based on Fuji Xerox’s revenue. The 2006Technology Agreement did not result in a material changeto the royalty revenues we receive from Fuji Xerox. Ingeneral, all other existing agreements with respect tointellectual property between the parties will remain in fullforce and effect. Therefore, all technology licensespreviously granted between the parties will not be subjectto the 2006 Technology Agreement but will generallyremain subject to the terms of any such priorarrangements. The only exception is that the licenses
previously granted under the 1999 Technology Agreementwere converted into fully paid-up and royalty free licenses.
In 2007, 2006 and 2005, we earned royalty revenuesunder this agreement of $108, $117 and $123,respectively, which are included in Service, outsourcingand rental revenues in the Consolidated Statements ofIncome. We also have arrangements with Fuji Xeroxwhereby we purchase inventory from and sell inventory toFuji Xerox. Pricing of the transactions under thesearrangements is based upon negotiations conducted atarm’s length. Our purchase commitments with Fuji Xeroxare in the normal course of business and typically have alead time of three months. Purchases from and sales toFuji Xerox for the three years ended December 31, 2007were as follows (in millions):
2007 2006 2005
Sales . . . . . . . . . . . . . . . . . . . . . . $ 186 $ 168 $ 163Purchases . . . . . . . . . . . . . . . . . . $1,946 $1,677 $1,517
Xerox Annual Report 2007 99
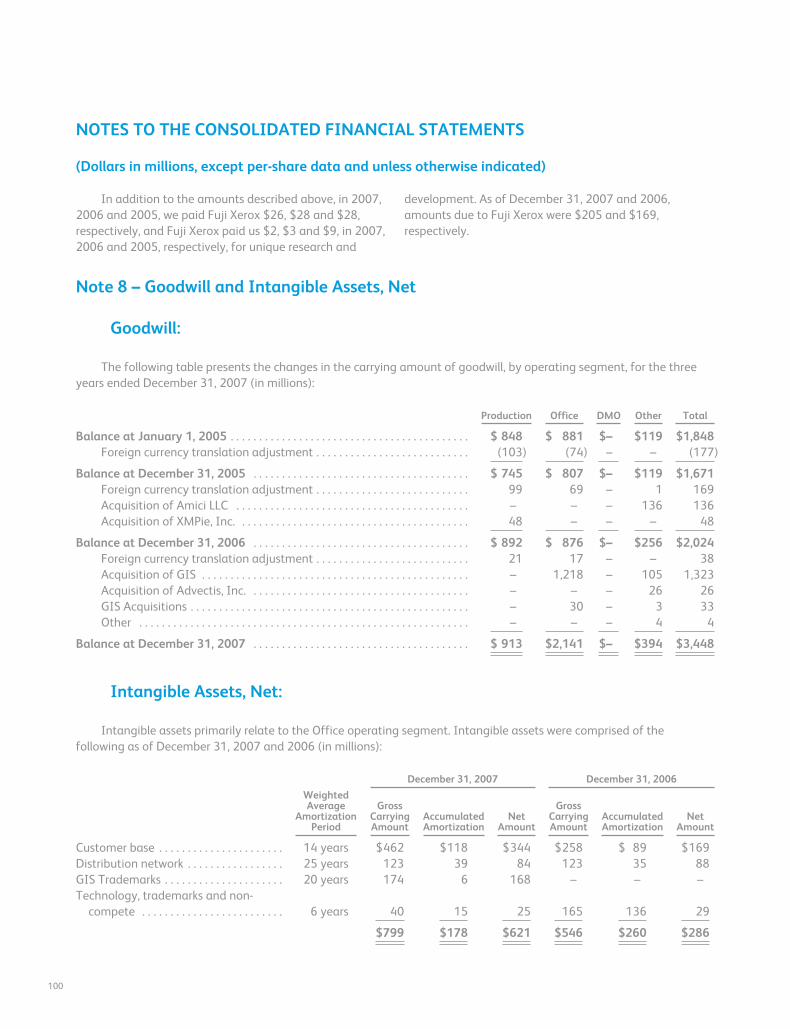
NOTES TO THE CONSOLIDATED FINANCIAL STATEMENTS
(Dollars in millions, except per-share data and unless otherwise indicated)
In addition to the amounts described above, in 2007,2006 and 2005, we paid Fuji Xerox $26, $28 and $28,respectively, and Fuji Xerox paid us $2, $3 and $9, in 2007,2006 and 2005, respectively, for unique research and
development. As of December 31, 2007 and 2006,amounts due to Fuji Xerox were $205 and $169,respectively.
Note 8 – Goodwill and Intangible Assets, Net
Goodwill:
The following table presents the changes in the carrying amount of goodwill, by operating segment, for the threeyears ended December 31, 2007 (in millions):
Production Office DMO Other Total
Balance at January 1, 2005 . . . . . . . . . . . . . . . . . . . . . . . . . . . . . . . . . . . . . . . . . . $ 848 $ 881 $– $119 $1,848Foreign currency translation adjustment . . . . . . . . . . . . . . . . . . . . . . . . . . . (103) (74) – – (177)
Balance at December 31, 2005 . . . . . . . . . . . . . . . . . . . . . . . . . . . . . . . . . . . . . . $ 745 $ 807 $– $119 $1,671Foreign currency translation adjustment . . . . . . . . . . . . . . . . . . . . . . . . . . . 99 69 – 1 169Acquisition of Amici LLC . . . . . . . . . . . . . . . . . . . . . . . . . . . . . . . . . . . . . . . . . – – – 136 136Acquisition of XMPie, Inc. . . . . . . . . . . . . . . . . . . . . . . . . . . . . . . . . . . . . . . . . 48 – – – 48
Balance at December 31, 2006 . . . . . . . . . . . . . . . . . . . . . . . . . . . . . . . . . . . . . . $ 892 $ 876 $– $256 $2,024Foreign currency translation adjustment . . . . . . . . . . . . . . . . . . . . . . . . . . . 21 17 – – 38Acquisition of GIS . . . . . . . . . . . . . . . . . . . . . . . . . . . . . . . . . . . . . . . . . . . . . . . – 1,218 – 105 1,323Acquisition of Advectis, Inc. . . . . . . . . . . . . . . . . . . . . . . . . . . . . . . . . . . . . . . – – – 26 26GIS Acquisitions . . . . . . . . . . . . . . . . . . . . . . . . . . . . . . . . . . . . . . . . . . . . . . . . . – 30 – 3 33Other . . . . . . . . . . . . . . . . . . . . . . . . . . . . . . . . . . . . . . . . . . . . . . . . . . . . . . . . . . – – – 4 4
Balance at December 31, 2007 . . . . . . . . . . . . . . . . . . . . . . . . . . . . . . . . . . . . . . $ 913 $2,141 $– $394 $3,448
Intangible Assets, Net:
Intangible assets primarily relate to the Office operating segment. Intangible assets were comprised of thefollowing as of December 31, 2007 and 2006 (in millions):
December 31, 2007 December 31, 2006
WeightedAverage
AmortizationPeriod
GrossCarryingAmount
AccumulatedAmortization
NetAmount
GrossCarryingAmount
AccumulatedAmortization
NetAmount
Customer base . . . . . . . . . . . . . . . . . . . . . . 14 years $462 $118 $344 $258 $ 89 $169Distribution network . . . . . . . . . . . . . . . . . 25 years 123 39 84 123 35 88GIS Trademarks . . . . . . . . . . . . . . . . . . . . . 20 years 174 6 168 – – –Technology, trademarks and non-
compete . . . . . . . . . . . . . . . . . . . . . . . . . 6 years 40 15 25 165 136 29
$799 $178 $621 $546 $260 $286
100
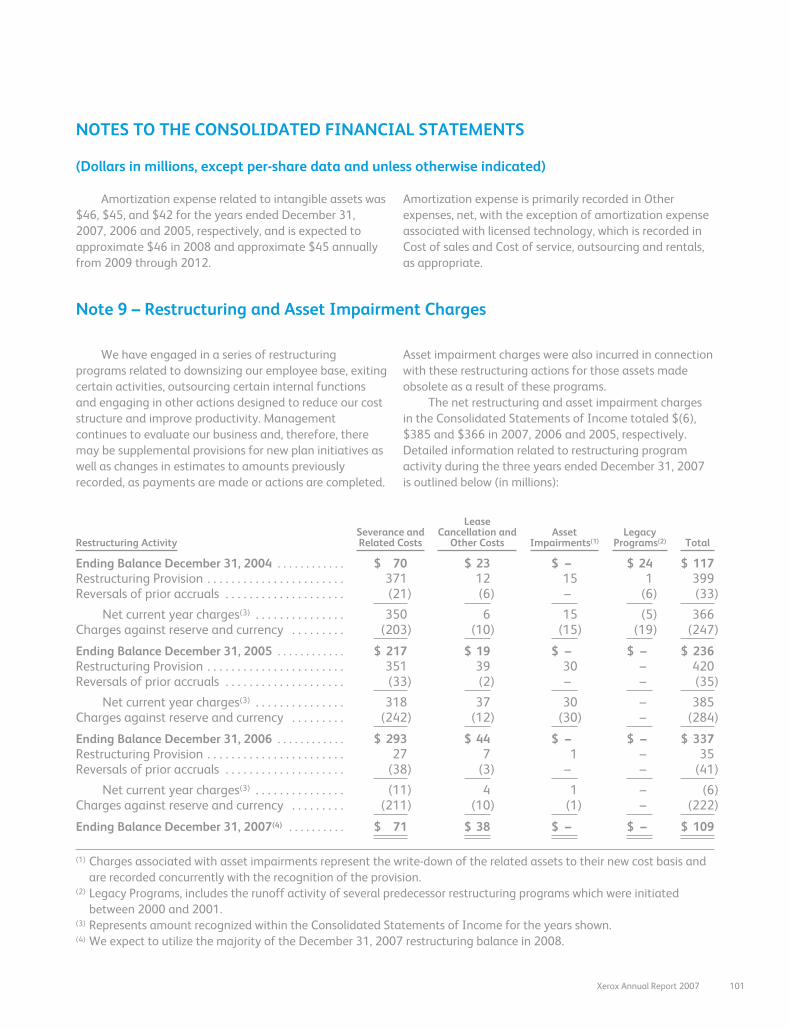
NOTES TO THE CONSOLIDATED FINANCIAL STATEMENTS
(Dollars in millions, except per-share data and unless otherwise indicated)
Amortization expense related to intangible assets was$46, $45, and $42 for the years ended December 31,2007, 2006 and 2005, respectively, and is expected toapproximate $46 in 2008 and approximate $45 annuallyfrom 2009 through 2012.
Amortization expense is primarily recorded in Otherexpenses, net, with the exception of amortization expenseassociated with licensed technology, which is recorded inCost of sales and Cost of service, outsourcing and rentals,as appropriate.
Note 9 – Restructuring and Asset Impairment Charges
We have engaged in a series of restructuringprograms related to downsizing our employee base, exitingcertain activities, outsourcing certain internal functionsand engaging in other actions designed to reduce our coststructure and improve productivity. Managementcontinues to evaluate our business and, therefore, theremay be supplemental provisions for new plan initiatives aswell as changes in estimates to amounts previouslyrecorded, as payments are made or actions are completed.
Asset impairment charges were also incurred in connectionwith these restructuring actions for those assets madeobsolete as a result of these programs.
The net restructuring and asset impairment chargesin the Consolidated Statements of Income totaled $(6),$385 and $366 in 2007, 2006 and 2005, respectively.Detailed information related to restructuring programactivity during the three years ended December 31, 2007is outlined below (in millions):
Restructuring ActivitySeverance andRelated Costs
LeaseCancellation and
Other CostsAsset
Impairments(1)Legacy
Programs(2) Total
Ending Balance December 31, 2004 . . . . . . . . . . . . $ 70 $ 23 $ – $ 24 $ 117Restructuring Provision . . . . . . . . . . . . . . . . . . . . . . . 371 12 15 1 399Reversals of prior accruals . . . . . . . . . . . . . . . . . . . . (21) (6) – (6) (33)
Net current year charges(3) . . . . . . . . . . . . . . . 350 6 15 (5) 366Charges against reserve and currency . . . . . . . . . (203) (10) (15) (19) (247)
Ending Balance December 31, 2005 . . . . . . . . . . . . $ 217 $ 19 $ – $ – $ 236Restructuring Provision . . . . . . . . . . . . . . . . . . . . . . . 351 39 30 – 420Reversals of prior accruals . . . . . . . . . . . . . . . . . . . . (33) (2) – – (35)
Net current year charges(3) . . . . . . . . . . . . . . . 318 37 30 – 385Charges against reserve and currency . . . . . . . . . (242) (12) (30) – (284)
Ending Balance December 31, 2006 . . . . . . . . . . . . $ 293 $ 44 $ – $ – $ 337Restructuring Provision . . . . . . . . . . . . . . . . . . . . . . . 27 7 1 – 35Reversals of prior accruals . . . . . . . . . . . . . . . . . . . . (38) (3) – – (41)
Net current year charges(3) . . . . . . . . . . . . . . . (11) 4 1 – (6)Charges against reserve and currency . . . . . . . . . (211) (10) (1) – (222)
Ending Balance December 31, 2007(4) . . . . . . . . . . $ 71 $ 38 $ – $ – $ 109
(1) Charges associated with asset impairments represent the write-down of the related assets to their new cost basis andare recorded concurrently with the recognition of the provision.
(2) Legacy Programs, includes the runoff activity of several predecessor restructuring programs which were initiatedbetween 2000 and 2001.
(3) Represents amount recognized within the Consolidated Statements of Income for the years shown.(4) We expect to utilize the majority of the December 31, 2007 restructuring balance in 2008.
Xerox Annual Report 2007 101
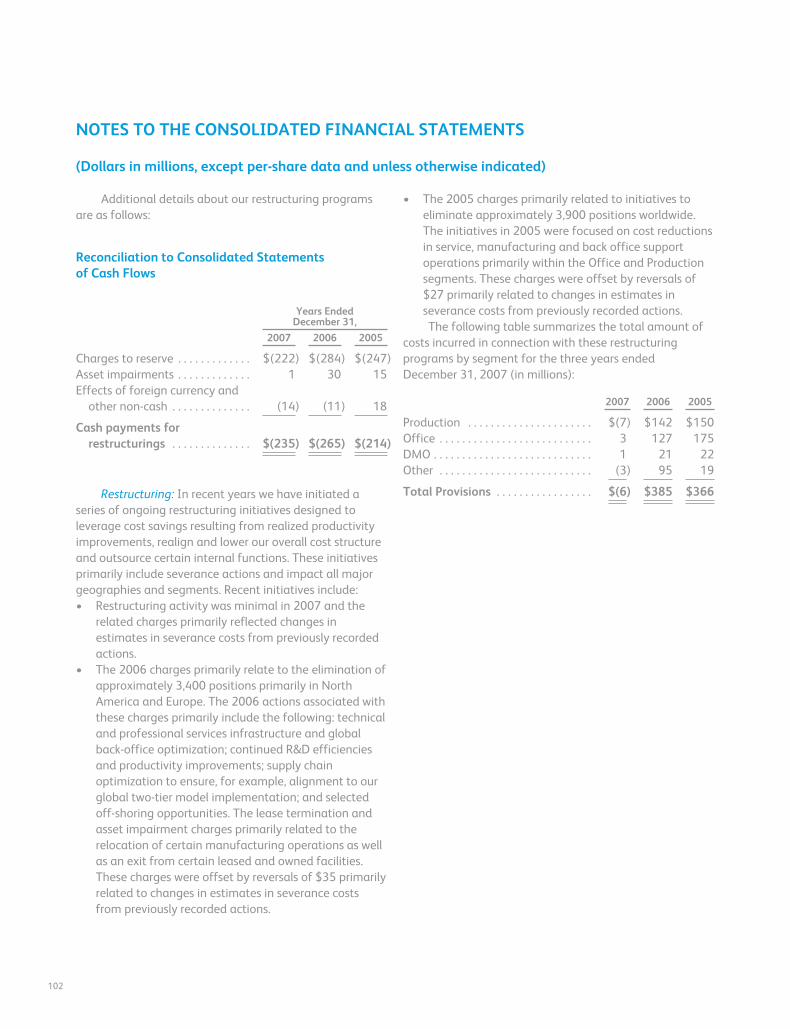
NOTES TO THE CONSOLIDATED FINANCIAL STATEMENTS
(Dollars in millions, except per-share data and unless otherwise indicated)
Additional details about our restructuring programsare as follows:
Reconciliation to Consolidated Statementsof Cash Flows
Years EndedDecember 31,
2007 2006 2005
Charges to reserve . . . . . . . . . . . . . $(222) $(284) $(247)Asset impairments . . . . . . . . . . . . . 1 30 15Effects of foreign currency and
other non-cash . . . . . . . . . . . . . . (14) (11) 18
Cash payments forrestructurings . . . . . . . . . . . . . . $(235) $(265) $(214)
Restructuring: In recent years we have initiated aseries of ongoing restructuring initiatives designed toleverage cost savings resulting from realized productivityimprovements, realign and lower our overall cost structureand outsource certain internal functions. These initiativesprimarily include severance actions and impact all majorgeographies and segments. Recent initiatives include:• Restructuring activity was minimal in 2007 and the
related charges primarily reflected changes inestimates in severance costs from previously recordedactions.
• The 2006 charges primarily relate to the elimination ofapproximately 3,400 positions primarily in NorthAmerica and Europe. The 2006 actions associated withthese charges primarily include the following: technicaland professional services infrastructure and globalback-office optimization; continued R&D efficienciesand productivity improvements; supply chainoptimization to ensure, for example, alignment to ourglobal two-tier model implementation; and selectedoff-shoring opportunities. The lease termination andasset impairment charges primarily related to therelocation of certain manufacturing operations as wellas an exit from certain leased and owned facilities.These charges were offset by reversals of $35 primarilyrelated to changes in estimates in severance costsfrom previously recorded actions.
• The 2005 charges primarily related to initiatives toeliminate approximately 3,900 positions worldwide.The initiatives in 2005 were focused on cost reductionsin service, manufacturing and back office supportoperations primarily within the Office and Productionsegments. These charges were offset by reversals of$27 primarily related to changes in estimates inseverance costs from previously recorded actions.The following table summarizes the total amount of
costs incurred in connection with these restructuringprograms by segment for the three years endedDecember 31, 2007 (in millions):
2007 2006 2005
Production . . . . . . . . . . . . . . . . . . . . . . $(7) $142 $150Office . . . . . . . . . . . . . . . . . . . . . . . . . . . 3 127 175DMO . . . . . . . . . . . . . . . . . . . . . . . . . . . . 1 21 22Other . . . . . . . . . . . . . . . . . . . . . . . . . . . (3) 95 19
Total Provisions . . . . . . . . . . . . . . . . . $(6) $385 $366
102
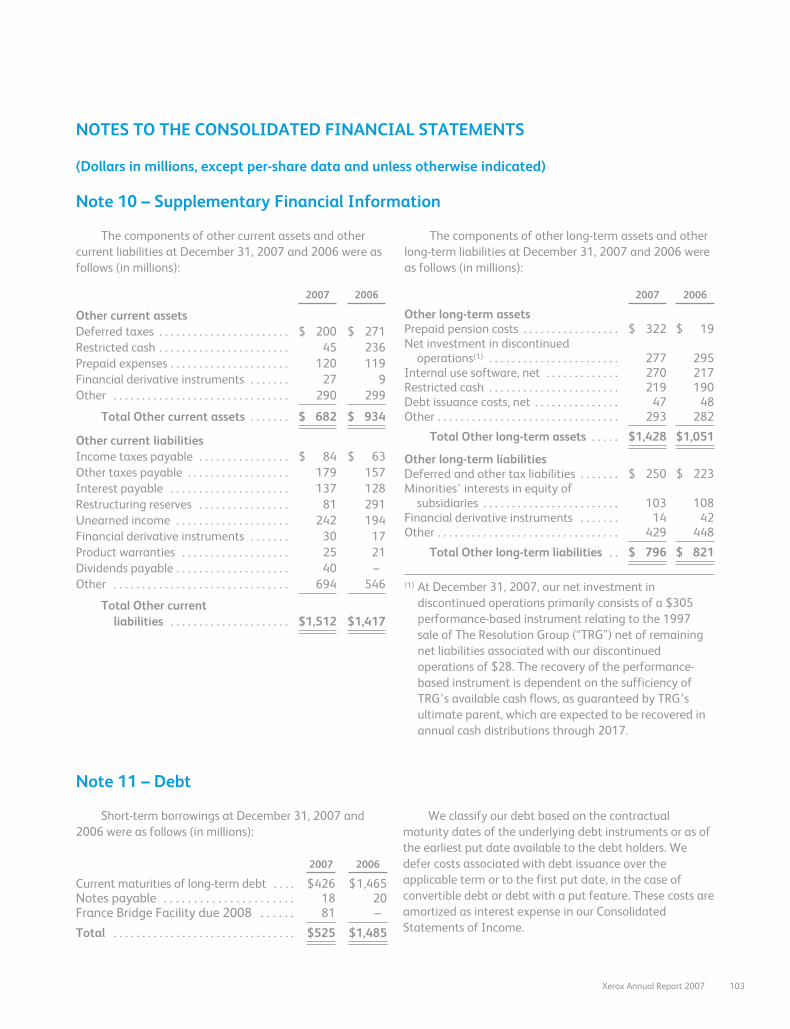
NOTES TO THE CONSOLIDATED FINANCIAL STATEMENTS
(Dollars in millions, except per-share data and unless otherwise indicated)
Note 10 – Supplementary Financial Information
The components of other current assets and othercurrent liabilities at December 31, 2007 and 2006 were asfollows (in millions):
2007 2006
Other current assetsDeferred taxes . . . . . . . . . . . . . . . . . . . . . . . $ 200 $ 271Restricted cash . . . . . . . . . . . . . . . . . . . . . . . 45 236Prepaid expenses . . . . . . . . . . . . . . . . . . . . . 120 119Financial derivative instruments . . . . . . . 27 9Other . . . . . . . . . . . . . . . . . . . . . . . . . . . . . . . 290 299
Total Other current assets . . . . . . . $ 682 $ 934
Other current liabilitiesIncome taxes payable . . . . . . . . . . . . . . . . $ 84 $ 63Other taxes payable . . . . . . . . . . . . . . . . . . 179 157Interest payable . . . . . . . . . . . . . . . . . . . . . 137 128Restructuring reserves . . . . . . . . . . . . . . . . 81 291Unearned income . . . . . . . . . . . . . . . . . . . . 242 194Financial derivative instruments . . . . . . . 30 17Product warranties . . . . . . . . . . . . . . . . . . . 25 21Dividends payable . . . . . . . . . . . . . . . . . . . . 40 –Other . . . . . . . . . . . . . . . . . . . . . . . . . . . . . . . 694 546
Total Other currentliabilities . . . . . . . . . . . . . . . . . . . . . $1,512 $1,417
The components of other long-term assets and otherlong-term liabilities at December 31, 2007 and 2006 wereas follows (in millions):
2007 2006
Other long-term assetsPrepaid pension costs . . . . . . . . . . . . . . . . . $ 322 $ 19Net investment in discontinued
operations(1) . . . . . . . . . . . . . . . . . . . . . . . 277 295Internal use software, net . . . . . . . . . . . . . 270 217Restricted cash . . . . . . . . . . . . . . . . . . . . . . . 219 190Debt issuance costs, net . . . . . . . . . . . . . . . 47 48Other . . . . . . . . . . . . . . . . . . . . . . . . . . . . . . . . 293 282
Total Other long-term assets . . . . . $1,428 $1,051
Other long-term liabilitiesDeferred and other tax liabilities . . . . . . . $ 250 $ 223Minorities’ interests in equity of
subsidiaries . . . . . . . . . . . . . . . . . . . . . . . . 103 108Financial derivative instruments . . . . . . . 14 42Other . . . . . . . . . . . . . . . . . . . . . . . . . . . . . . . . 429 448
Total Other long-term liabilities . . $ 796 $ 821
(1) At December 31, 2007, our net investment indiscontinued operations primarily consists of a $305performance-based instrument relating to the 1997sale of The Resolution Group (“TRG”) net of remainingnet liabilities associated with our discontinuedoperations of $28. The recovery of the performance-based instrument is dependent on the sufficiency ofTRG’s available cash flows, as guaranteed by TRG’sultimate parent, which are expected to be recovered inannual cash distributions through 2017.
Note 11 – Debt
Short-term borrowings at December 31, 2007 and2006 were as follows (in millions):
2007 2006
Current maturities of long-term debt . . . . $426 $1,465Notes payable . . . . . . . . . . . . . . . . . . . . . . 18 20France Bridge Facility due 2008 . . . . . . 81 –
Total . . . . . . . . . . . . . . . . . . . . . . . . . . . . . . . . $525 $1,485
We classify our debt based on the contractualmaturity dates of the underlying debt instruments or as ofthe earliest put date available to the debt holders. Wedefer costs associated with debt issuance over theapplicable term or to the first put date, in the case ofconvertible debt or debt with a put feature. These costs areamortized as interest expense in our ConsolidatedStatements of Income.
Xerox Annual Report 2007 103
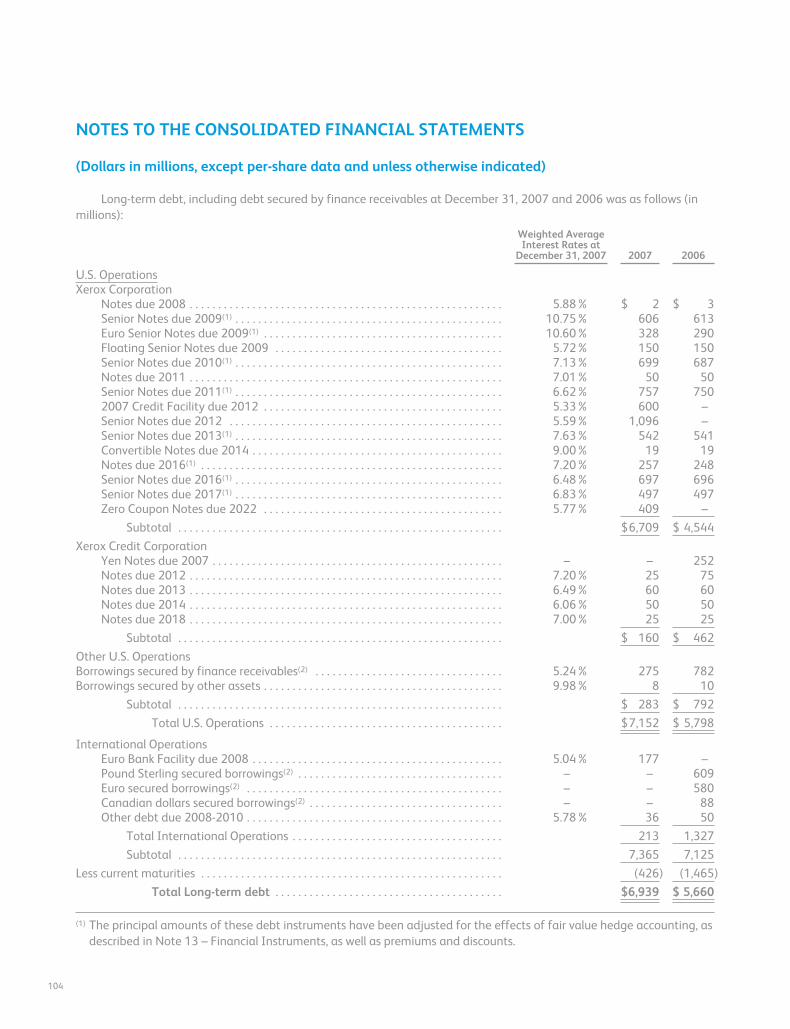
NOTES TO THE CONSOLIDATED FINANCIAL STATEMENTS
(Dollars in millions, except per-share data and unless otherwise indicated)
Long-term debt, including debt secured by finance receivables at December 31, 2007 and 2006 was as follows (inmillions):
Weighted AverageInterest Rates at
December 31, 2007 2007 2006
U.S. OperationsXerox Corporation
Notes due 2008 . . . . . . . . . . . . . . . . . . . . . . . . . . . . . . . . . . . . . . . . . . . . . . . . . . . . . . . 5.88% $ 2 $ 3Senior Notes due 2009(1) . . . . . . . . . . . . . . . . . . . . . . . . . . . . . . . . . . . . . . . . . . . . . . . 10.75% 606 613Euro Senior Notes due 2009(1) . . . . . . . . . . . . . . . . . . . . . . . . . . . . . . . . . . . . . . . . . . 10.60% 328 290Floating Senior Notes due 2009 . . . . . . . . . . . . . . . . . . . . . . . . . . . . . . . . . . . . . . . . 5.72% 150 150Senior Notes due 2010(1) . . . . . . . . . . . . . . . . . . . . . . . . . . . . . . . . . . . . . . . . . . . . . . . 7.13% 699 687Notes due 2011 . . . . . . . . . . . . . . . . . . . . . . . . . . . . . . . . . . . . . . . . . . . . . . . . . . . . . . . 7.01% 50 50Senior Notes due 2011(1) . . . . . . . . . . . . . . . . . . . . . . . . . . . . . . . . . . . . . . . . . . . . . . . 6.62% 757 7502007 Credit Facility due 2012 . . . . . . . . . . . . . . . . . . . . . . . . . . . . . . . . . . . . . . . . . . 5.33% 600 –Senior Notes due 2012 . . . . . . . . . . . . . . . . . . . . . . . . . . . . . . . . . . . . . . . . . . . . . . . . 5.59% 1,096 –Senior Notes due 2013(1) . . . . . . . . . . . . . . . . . . . . . . . . . . . . . . . . . . . . . . . . . . . . . . . 7.63% 542 541Convertible Notes due 2014 . . . . . . . . . . . . . . . . . . . . . . . . . . . . . . . . . . . . . . . . . . . . 9.00% 19 19Notes due 2016(1) . . . . . . . . . . . . . . . . . . . . . . . . . . . . . . . . . . . . . . . . . . . . . . . . . . . . . 7.20% 257 248Senior Notes due 2016(1) . . . . . . . . . . . . . . . . . . . . . . . . . . . . . . . . . . . . . . . . . . . . . . . 6.48% 697 696Senior Notes due 2017(1) . . . . . . . . . . . . . . . . . . . . . . . . . . . . . . . . . . . . . . . . . . . . . . . 6.83% 497 497Zero Coupon Notes due 2022 . . . . . . . . . . . . . . . . . . . . . . . . . . . . . . . . . . . . . . . . . . 5.77% 409 –
Subtotal . . . . . . . . . . . . . . . . . . . . . . . . . . . . . . . . . . . . . . . . . . . . . . . . . . . . . . . . . $6,709 $ 4,544
Xerox Credit CorporationYen Notes due 2007 . . . . . . . . . . . . . . . . . . . . . . . . . . . . . . . . . . . . . . . . . . . . . . . . . . . – – 252Notes due 2012 . . . . . . . . . . . . . . . . . . . . . . . . . . . . . . . . . . . . . . . . . . . . . . . . . . . . . . . 7.20% 25 75Notes due 2013 . . . . . . . . . . . . . . . . . . . . . . . . . . . . . . . . . . . . . . . . . . . . . . . . . . . . . . . 6.49% 60 60Notes due 2014 . . . . . . . . . . . . . . . . . . . . . . . . . . . . . . . . . . . . . . . . . . . . . . . . . . . . . . . 6.06% 50 50Notes due 2018 . . . . . . . . . . . . . . . . . . . . . . . . . . . . . . . . . . . . . . . . . . . . . . . . . . . . . . . 7.00% 25 25
Subtotal . . . . . . . . . . . . . . . . . . . . . . . . . . . . . . . . . . . . . . . . . . . . . . . . . . . . . . . . . $ 160 $ 462
Other U.S. OperationsBorrowings secured by finance receivables(2) . . . . . . . . . . . . . . . . . . . . . . . . . . . . . . . . . 5.24% 275 782Borrowings secured by other assets . . . . . . . . . . . . . . . . . . . . . . . . . . . . . . . . . . . . . . . . . . 9.98% 8 10
Subtotal . . . . . . . . . . . . . . . . . . . . . . . . . . . . . . . . . . . . . . . . . . . . . . . . . . . . . . . . . $ 283 $ 792
Total U.S. Operations . . . . . . . . . . . . . . . . . . . . . . . . . . . . . . . . . . . . . . . . . $7,152 $ 5,798
International OperationsEuro Bank Facility due 2008 . . . . . . . . . . . . . . . . . . . . . . . . . . . . . . . . . . . . . . . . . . . . 5.04% 177 –Pound Sterling secured borrowings(2) . . . . . . . . . . . . . . . . . . . . . . . . . . . . . . . . . . . . – – 609Euro secured borrowings(2) . . . . . . . . . . . . . . . . . . . . . . . . . . . . . . . . . . . . . . . . . . . . . – – 580Canadian dollars secured borrowings(2) . . . . . . . . . . . . . . . . . . . . . . . . . . . . . . . . . . – – 88Other debt due 2008-2010 . . . . . . . . . . . . . . . . . . . . . . . . . . . . . . . . . . . . . . . . . . . . . 5.78% 36 50
Total International Operations . . . . . . . . . . . . . . . . . . . . . . . . . . . . . . . . . . . . . 213 1,327
Subtotal . . . . . . . . . . . . . . . . . . . . . . . . . . . . . . . . . . . . . . . . . . . . . . . . . . . . . . . . . 7,365 7,125
Less current maturities . . . . . . . . . . . . . . . . . . . . . . . . . . . . . . . . . . . . . . . . . . . . . . . . . . . . . (426) (1,465)
Total Long-term debt . . . . . . . . . . . . . . . . . . . . . . . . . . . . . . . . . . . . . . . . $6,939 $ 5,660
(1) The principal amounts of these debt instruments have been adjusted for the effects of fair value hedge accounting, asdescribed in Note 13 – Financial Instruments, as well as premiums and discounts.
104
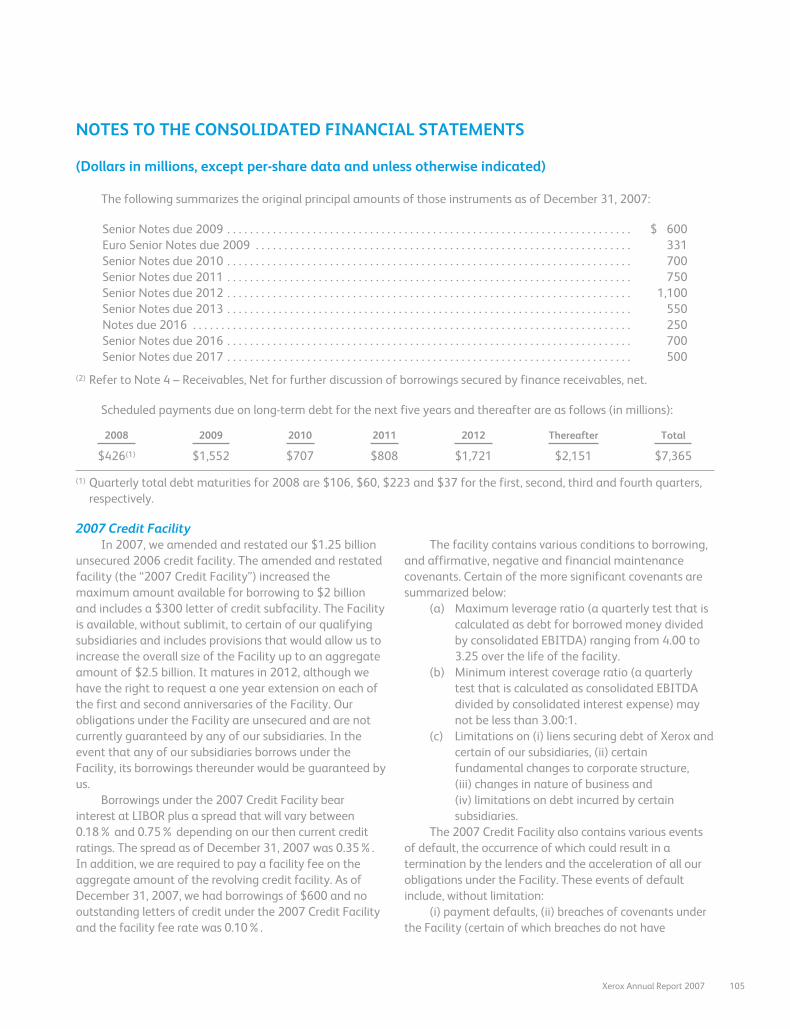
NOTES TO THE CONSOLIDATED FINANCIAL STATEMENTS
(Dollars in millions, except per-share data and unless otherwise indicated)
The following summarizes the original principal amounts of those instruments as of December 31, 2007:
Senior Notes due 2009 . . . . . . . . . . . . . . . . . . . . . . . . . . . . . . . . . . . . . . . . . . . . . . . . . . . . . . . . . . . . . . . . . . . . . . . $ 600Euro Senior Notes due 2009 . . . . . . . . . . . . . . . . . . . . . . . . . . . . . . . . . . . . . . . . . . . . . . . . . . . . . . . . . . . . . . . . . . 331Senior Notes due 2010 . . . . . . . . . . . . . . . . . . . . . . . . . . . . . . . . . . . . . . . . . . . . . . . . . . . . . . . . . . . . . . . . . . . . . . . 700Senior Notes due 2011 . . . . . . . . . . . . . . . . . . . . . . . . . . . . . . . . . . . . . . . . . . . . . . . . . . . . . . . . . . . . . . . . . . . . . . . 750Senior Notes due 2012 . . . . . . . . . . . . . . . . . . . . . . . . . . . . . . . . . . . . . . . . . . . . . . . . . . . . . . . . . . . . . . . . . . . . . . . 1,100Senior Notes due 2013 . . . . . . . . . . . . . . . . . . . . . . . . . . . . . . . . . . . . . . . . . . . . . . . . . . . . . . . . . . . . . . . . . . . . . . . 550Notes due 2016 . . . . . . . . . . . . . . . . . . . . . . . . . . . . . . . . . . . . . . . . . . . . . . . . . . . . . . . . . . . . . . . . . . . . . . . . . . . . . 250Senior Notes due 2016 . . . . . . . . . . . . . . . . . . . . . . . . . . . . . . . . . . . . . . . . . . . . . . . . . . . . . . . . . . . . . . . . . . . . . . . 700Senior Notes due 2017 . . . . . . . . . . . . . . . . . . . . . . . . . . . . . . . . . . . . . . . . . . . . . . . . . . . . . . . . . . . . . . . . . . . . . . . 500
(2) Refer to Note 4 – Receivables, Net for further discussion of borrowings secured by finance receivables, net.
Scheduled payments due on long-term debt for the next five years and thereafter are as follows (in millions):
2008 2009 2010 2011 2012 Thereafter Total
$426(1) $1,552 $707 $808 $1,721 $2,151 $7,365
(1) Quarterly total debt maturities for 2008 are $106, $60, $223 and $37 for the first, second, third and fourth quarters,respectively.
2007 Credit FacilityIn 2007, we amended and restated our $1.25 billion
unsecured 2006 credit facility. The amended and restatedfacility (the “2007 Credit Facility”) increased themaximum amount available for borrowing to $2 billionand includes a $300 letter of credit subfacility. The Facilityis available, without sublimit, to certain of our qualifyingsubsidiaries and includes provisions that would allow us toincrease the overall size of the Facility up to an aggregateamount of $2.5 billion. It matures in 2012, although wehave the right to request a one year extension on each ofthe first and second anniversaries of the Facility. Ourobligations under the Facility are unsecured and are notcurrently guaranteed by any of our subsidiaries. In theevent that any of our subsidiaries borrows under theFacility, its borrowings thereunder would be guaranteed byus.
Borrowings under the 2007 Credit Facility bearinterest at LIBOR plus a spread that will vary between0.18% and 0.75% depending on our then current creditratings. The spread as of December 31, 2007 was 0.35%.In addition, we are required to pay a facility fee on theaggregate amount of the revolving credit facility. As ofDecember 31, 2007, we had borrowings of $600 and nooutstanding letters of credit under the 2007 Credit Facilityand the facility fee rate was 0.10%.
The facility contains various conditions to borrowing,and affirmative, negative and financial maintenancecovenants. Certain of the more significant covenants aresummarized below:
(a) Maximum leverage ratio (a quarterly test that iscalculated as debt for borrowed money dividedby consolidated EBITDA) ranging from 4.00 to3.25 over the life of the facility.
(b) Minimum interest coverage ratio (a quarterlytest that is calculated as consolidated EBITDAdivided by consolidated interest expense) maynot be less than 3.00:1.
(c) Limitations on (i) liens securing debt of Xerox andcertain of our subsidiaries, (ii) certainfundamental changes to corporate structure,(iii) changes in nature of business and(iv) limitations on debt incurred by certainsubsidiaries.
The 2007 Credit Facility also contains various eventsof default, the occurrence of which could result in atermination by the lenders and the acceleration of all ourobligations under the Facility. These events of defaultinclude, without limitation:
(i) payment defaults, (ii) breaches of covenants underthe Facility (certain of which breaches do not have
Xerox Annual Report 2007 105
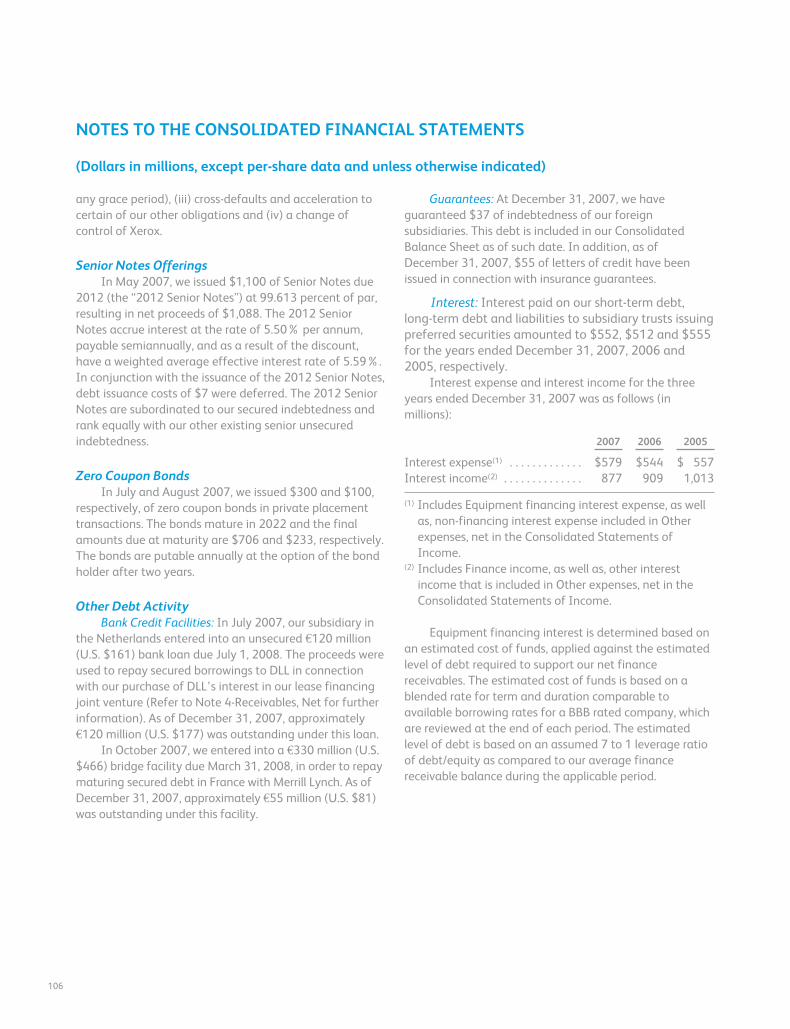
NOTES TO THE CONSOLIDATED FINANCIAL STATEMENTS
(Dollars in millions, except per-share data and unless otherwise indicated)
any grace period), (iii) cross-defaults and acceleration tocertain of our other obligations and (iv) a change ofcontrol of Xerox.
Senior Notes OfferingsIn May 2007, we issued $1,100 of Senior Notes due
2012 (the “2012 Senior Notes”) at 99.613 percent of par,resulting in net proceeds of $1,088. The 2012 SeniorNotes accrue interest at the rate of 5.50% per annum,payable semiannually, and as a result of the discount,have a weighted average effective interest rate of 5.59%.In conjunction with the issuance of the 2012 Senior Notes,debt issuance costs of $7 were deferred. The 2012 SeniorNotes are subordinated to our secured indebtedness andrank equally with our other existing senior unsecuredindebtedness.
Zero Coupon BondsIn July and August 2007, we issued $300 and $100,
respectively, of zero coupon bonds in private placementtransactions. The bonds mature in 2022 and the finalamounts due at maturity are $706 and $233, respectively.The bonds are putable annually at the option of the bondholder after two years.
Other Debt ActivityBank Credit Facilities: In July 2007, our subsidiary in
the Netherlands entered into an unsecured €120 million(U.S. $161) bank loan due July 1, 2008. The proceeds wereused to repay secured borrowings to DLL in connectionwith our purchase of DLL’s interest in our lease financingjoint venture (Refer to Note 4-Receivables, Net for furtherinformation). As of December 31, 2007, approximately€120 million (U.S. $177) was outstanding under this loan.
In October 2007, we entered into a €330 million (U.S.$466) bridge facility due March 31, 2008, in order to repaymaturing secured debt in France with Merrill Lynch. As ofDecember 31, 2007, approximately €55 million (U.S. $81)was outstanding under this facility.
Guarantees: At December 31, 2007, we haveguaranteed $37 of indebtedness of our foreignsubsidiaries. This debt is included in our ConsolidatedBalance Sheet as of such date. In addition, as ofDecember 31, 2007, $55 of letters of credit have beenissued in connection with insurance guarantees.
Interest: Interest paid on our short-term debt,long-term debt and liabilities to subsidiary trusts issuingpreferred securities amounted to $552, $512 and $555for the years ended December 31, 2007, 2006 and2005, respectively.
Interest expense and interest income for the threeyears ended December 31, 2007 was as follows (inmillions):
2007 2006 2005
Interest expense(1) . . . . . . . . . . . . . $579 $544 $ 557Interest income(2) . . . . . . . . . . . . . . 877 909 1,013
(1) Includes Equipment financing interest expense, as wellas, non-financing interest expense included in Otherexpenses, net in the Consolidated Statements ofIncome.
(2) Includes Finance income, as well as, other interestincome that is included in Other expenses, net in theConsolidated Statements of Income.
Equipment financing interest is determined based onan estimated cost of funds, applied against the estimatedlevel of debt required to support our net financereceivables. The estimated cost of funds is based on ablended rate for term and duration comparable toavailable borrowing rates for a BBB rated company, whichare reviewed at the end of each period. The estimatedlevel of debt is based on an assumed 7 to 1 leverage ratioof debt/equity as compared to our average financereceivable balance during the applicable period.
106
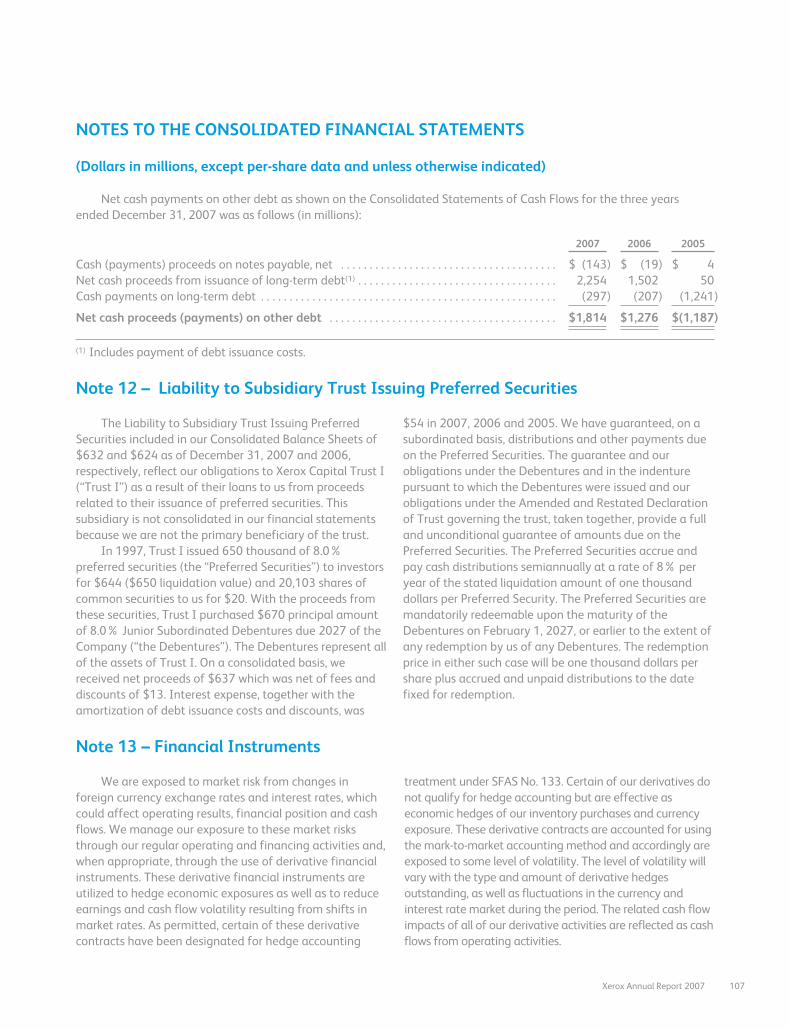
NOTES TO THE CONSOLIDATED FINANCIAL STATEMENTS
(Dollars in millions, except per-share data and unless otherwise indicated)
Net cash payments on other debt as shown on the Consolidated Statements of Cash Flows for the three yearsended December 31, 2007 was as follows (in millions):
2007 2006 2005
Cash (payments) proceeds on notes payable, net . . . . . . . . . . . . . . . . . . . . . . . . . . . . . . . . . . . . . . $ (143) $ (19) $ 4Net cash proceeds from issuance of long-term debt(1) . . . . . . . . . . . . . . . . . . . . . . . . . . . . . . . . . . . 2,254 1,502 50Cash payments on long-term debt . . . . . . . . . . . . . . . . . . . . . . . . . . . . . . . . . . . . . . . . . . . . . . . . . . . . (297) (207) (1,241)
Net cash proceeds (payments) on other debt . . . . . . . . . . . . . . . . . . . . . . . . . . . . . . . . . . . . . . . . $1,814 $1,276 $(1,187)
(1) Includes payment of debt issuance costs.
Note 12 – Liability to Subsidiary Trust Issuing Preferred Securities
The Liability to Subsidiary Trust Issuing PreferredSecurities included in our Consolidated Balance Sheets of$632 and $624 as of December 31, 2007 and 2006,respectively, reflect our obligations to Xerox Capital Trust I(“Trust I”) as a result of their loans to us from proceedsrelated to their issuance of preferred securities. Thissubsidiary is not consolidated in our financial statementsbecause we are not the primary beneficiary of the trust.
In 1997, Trust I issued 650 thousand of 8.0%preferred securities (the “Preferred Securities”) to investorsfor $644 ($650 liquidation value) and 20,103 shares ofcommon securities to us for $20. With the proceeds fromthese securities, Trust I purchased $670 principal amountof 8.0% Junior Subordinated Debentures due 2027 of theCompany (“the Debentures”). The Debentures represent allof the assets of Trust I. On a consolidated basis, wereceived net proceeds of $637 which was net of fees anddiscounts of $13. Interest expense, together with theamortization of debt issuance costs and discounts, was
$54 in 2007, 2006 and 2005. We have guaranteed, on asubordinated basis, distributions and other payments dueon the Preferred Securities. The guarantee and ourobligations under the Debentures and in the indenturepursuant to which the Debentures were issued and ourobligations under the Amended and Restated Declarationof Trust governing the trust, taken together, provide a fulland unconditional guarantee of amounts due on thePreferred Securities. The Preferred Securities accrue andpay cash distributions semiannually at a rate of 8% peryear of the stated liquidation amount of one thousanddollars per Preferred Security. The Preferred Securities aremandatorily redeemable upon the maturity of theDebentures on February 1, 2027, or earlier to the extent ofany redemption by us of any Debentures. The redemptionprice in either such case will be one thousand dollars pershare plus accrued and unpaid distributions to the datefixed for redemption.
Note 13 – Financial Instruments
We are exposed to market risk from changes inforeign currency exchange rates and interest rates, whichcould affect operating results, financial position and cashflows. We manage our exposure to these market risksthrough our regular operating and financing activities and,when appropriate, through the use of derivative financialinstruments. These derivative financial instruments areutilized to hedge economic exposures as well as to reduceearnings and cash flow volatility resulting from shifts inmarket rates. As permitted, certain of these derivativecontracts have been designated for hedge accounting
treatment under SFAS No. 133. Certain of our derivatives donot qualify for hedge accounting but are effective aseconomic hedges of our inventory purchases and currencyexposure. These derivative contracts are accounted for usingthe mark-to-market accounting method and accordingly areexposed to some level of volatility. The level of volatility willvary with the type and amount of derivative hedgesoutstanding, as well as fluctuations in the currency andinterest rate market during the period. The related cash flowimpacts of all of our derivative activities are reflected as cashflows from operating activities.
Xerox Annual Report 2007 107
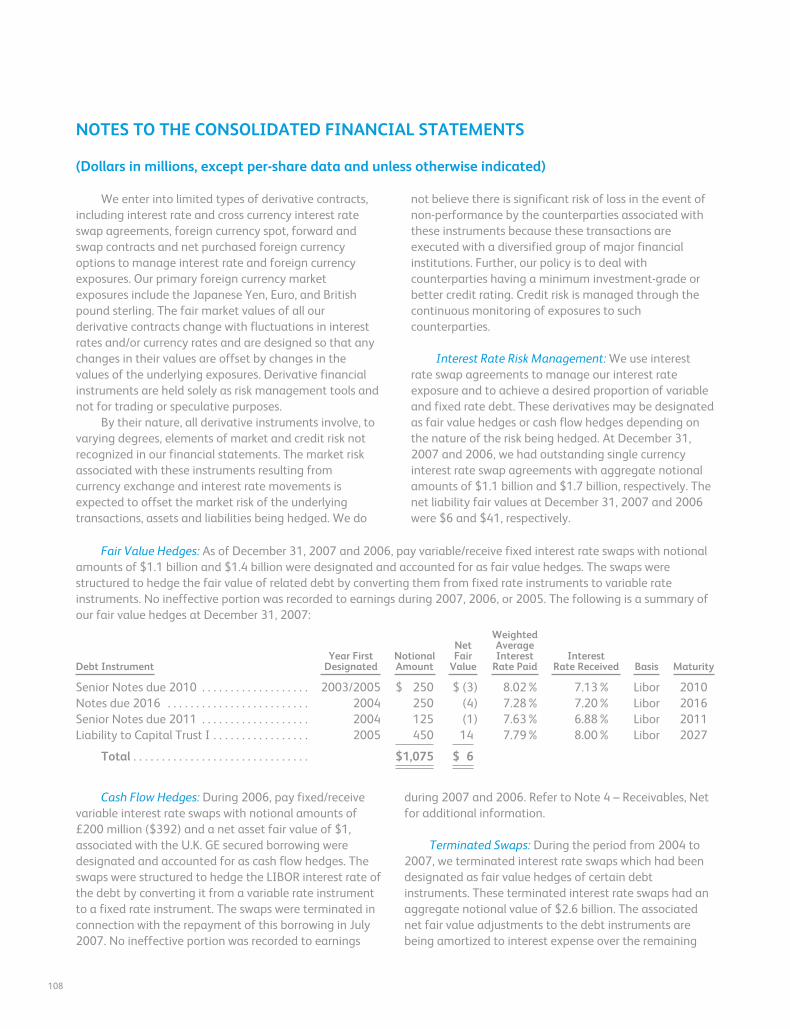
NOTES TO THE CONSOLIDATED FINANCIAL STATEMENTS
(Dollars in millions, except per-share data and unless otherwise indicated)
We enter into limited types of derivative contracts,including interest rate and cross currency interest rateswap agreements, foreign currency spot, forward andswap contracts and net purchased foreign currencyoptions to manage interest rate and foreign currencyexposures. Our primary foreign currency marketexposures include the Japanese Yen, Euro, and Britishpound sterling. The fair market values of all ourderivative contracts change with fluctuations in interestrates and/or currency rates and are designed so that anychanges in their values are offset by changes in thevalues of the underlying exposures. Derivative financialinstruments are held solely as risk management tools andnot for trading or speculative purposes.
By their nature, all derivative instruments involve, tovarying degrees, elements of market and credit risk notrecognized in our financial statements. The market riskassociated with these instruments resulting fromcurrency exchange and interest rate movements isexpected to offset the market risk of the underlyingtransactions, assets and liabilities being hedged. We do
not believe there is significant risk of loss in the event ofnon-performance by the counterparties associated withthese instruments because these transactions areexecuted with a diversified group of major financialinstitutions. Further, our policy is to deal withcounterparties having a minimum investment-grade orbetter credit rating. Credit risk is managed through thecontinuous monitoring of exposures to suchcounterparties.
Interest Rate Risk Management: We use interestrate swap agreements to manage our interest rateexposure and to achieve a desired proportion of variableand fixed rate debt. These derivatives may be designatedas fair value hedges or cash flow hedges depending onthe nature of the risk being hedged. At December 31,2007 and 2006, we had outstanding single currencyinterest rate swap agreements with aggregate notionalamounts of $1.1 billion and $1.7 billion, respectively. Thenet liability fair values at December 31, 2007 and 2006were $6 and $41, respectively.
Fair Value Hedges: As of December 31, 2007 and 2006, pay variable/receive fixed interest rate swaps with notionalamounts of $1.1 billion and $1.4 billion were designated and accounted for as fair value hedges. The swaps werestructured to hedge the fair value of related debt by converting them from fixed rate instruments to variable rateinstruments. No ineffective portion was recorded to earnings during 2007, 2006, or 2005. The following is a summary ofour fair value hedges at December 31, 2007:
Debt InstrumentYear First
DesignatedNotionalAmount
NetFair
Value
WeightedAverageInterest
Rate PaidInterest
Rate Received Basis Maturity
Senior Notes due 2010 . . . . . . . . . . . . . . . . . . . 2003/2005 $ 250 $ (3) 8.02% 7.13% Libor 2010Notes due 2016 . . . . . . . . . . . . . . . . . . . . . . . . . 2004 250 (4) 7.28% 7.20% Libor 2016Senior Notes due 2011 . . . . . . . . . . . . . . . . . . . 2004 125 (1) 7.63% 6.88% Libor 2011Liability to Capital Trust I . . . . . . . . . . . . . . . . . 2005 450 14 7.79% 8.00% Libor 2027
Total . . . . . . . . . . . . . . . . . . . . . . . . . . . . . . . $1,075 $ 6
Cash Flow Hedges: During 2006, pay fixed/receivevariable interest rate swaps with notional amounts of£200 million ($392) and a net asset fair value of $1,associated with the U.K. GE secured borrowing weredesignated and accounted for as cash flow hedges. Theswaps were structured to hedge the LIBOR interest rate ofthe debt by converting it from a variable rate instrumentto a fixed rate instrument. The swaps were terminated inconnection with the repayment of this borrowing in July2007. No ineffective portion was recorded to earnings
during 2007 and 2006. Refer to Note 4 – Receivables, Netfor additional information.
Terminated Swaps: During the period from 2004 to2007, we terminated interest rate swaps which had beendesignated as fair value hedges of certain debtinstruments. These terminated interest rate swaps had anaggregate notional value of $2.6 billion. The associatednet fair value adjustments to the debt instruments arebeing amortized to interest expense over the remaining
108
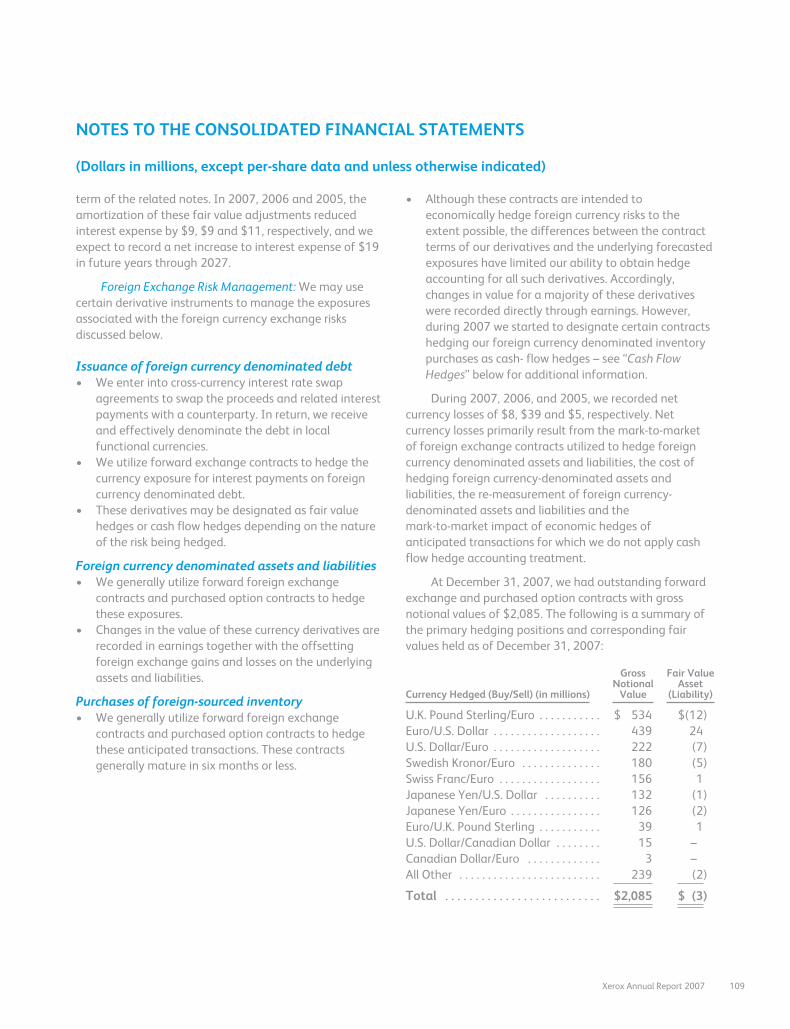
NOTES TO THE CONSOLIDATED FINANCIAL STATEMENTS
(Dollars in millions, except per-share data and unless otherwise indicated)
term of the related notes. In 2007, 2006 and 2005, theamortization of these fair value adjustments reducedinterest expense by $9, $9 and $11, respectively, and weexpect to record a net increase to interest expense of $19in future years through 2027.
Foreign Exchange Risk Management: We may usecertain derivative instruments to manage the exposuresassociated with the foreign currency exchange risksdiscussed below.
Issuance of foreign currency denominated debt• We enter into cross-currency interest rate swap
agreements to swap the proceeds and related interestpayments with a counterparty. In return, we receiveand effectively denominate the debt in localfunctional currencies.
• We utilize forward exchange contracts to hedge thecurrency exposure for interest payments on foreigncurrency denominated debt.
• These derivatives may be designated as fair valuehedges or cash flow hedges depending on the natureof the risk being hedged.
Foreign currency denominated assets and liabilities• We generally utilize forward foreign exchange
contracts and purchased option contracts to hedgethese exposures.
• Changes in the value of these currency derivatives arerecorded in earnings together with the offsettingforeign exchange gains and losses on the underlyingassets and liabilities.
Purchases of foreign-sourced inventory• We generally utilize forward foreign exchange
contracts and purchased option contracts to hedgethese anticipated transactions. These contractsgenerally mature in six months or less.
• Although these contracts are intended toeconomically hedge foreign currency risks to theextent possible, the differences between the contractterms of our derivatives and the underlying forecastedexposures have limited our ability to obtain hedgeaccounting for all such derivatives. Accordingly,changes in value for a majority of these derivativeswere recorded directly through earnings. However,during 2007 we started to designate certain contractshedging our foreign currency denominated inventorypurchases as cash- flow hedges – see “Cash FlowHedges” below for additional information.
During 2007, 2006, and 2005, we recorded netcurrency losses of $8, $39 and $5, respectively. Netcurrency losses primarily result from the mark-to-marketof foreign exchange contracts utilized to hedge foreigncurrency denominated assets and liabilities, the cost ofhedging foreign currency-denominated assets andliabilities, the re-measurement of foreign currency-denominated assets and liabilities and themark-to-market impact of economic hedges ofanticipated transactions for which we do not apply cashflow hedge accounting treatment.
At December 31, 2007, we had outstanding forwardexchange and purchased option contracts with grossnotional values of $2,085. The following is a summary ofthe primary hedging positions and corresponding fairvalues held as of December 31, 2007:
Currency Hedged (Buy/Sell) (in millions)
GrossNotional
Value
Fair ValueAsset
(Liability)
U.K. Pound Sterling/Euro . . . . . . . . . . . $ 534 $(12)Euro/U.S. Dollar . . . . . . . . . . . . . . . . . . . 439 24U.S. Dollar/Euro . . . . . . . . . . . . . . . . . . . 222 (7)Swedish Kronor/Euro . . . . . . . . . . . . . . 180 (5)Swiss Franc/Euro . . . . . . . . . . . . . . . . . . 156 1Japanese Yen/U.S. Dollar . . . . . . . . . . 132 (1)Japanese Yen/Euro . . . . . . . . . . . . . . . . 126 (2)Euro/U.K. Pound Sterling . . . . . . . . . . . 39 1U.S. Dollar/Canadian Dollar . . . . . . . . 15 –Canadian Dollar/Euro . . . . . . . . . . . . . 3 –All Other . . . . . . . . . . . . . . . . . . . . . . . . . 239 (2)
Total . . . . . . . . . . . . . . . . . . . . . . . . . . $2,085 $ (3)
Xerox Annual Report 2007 109
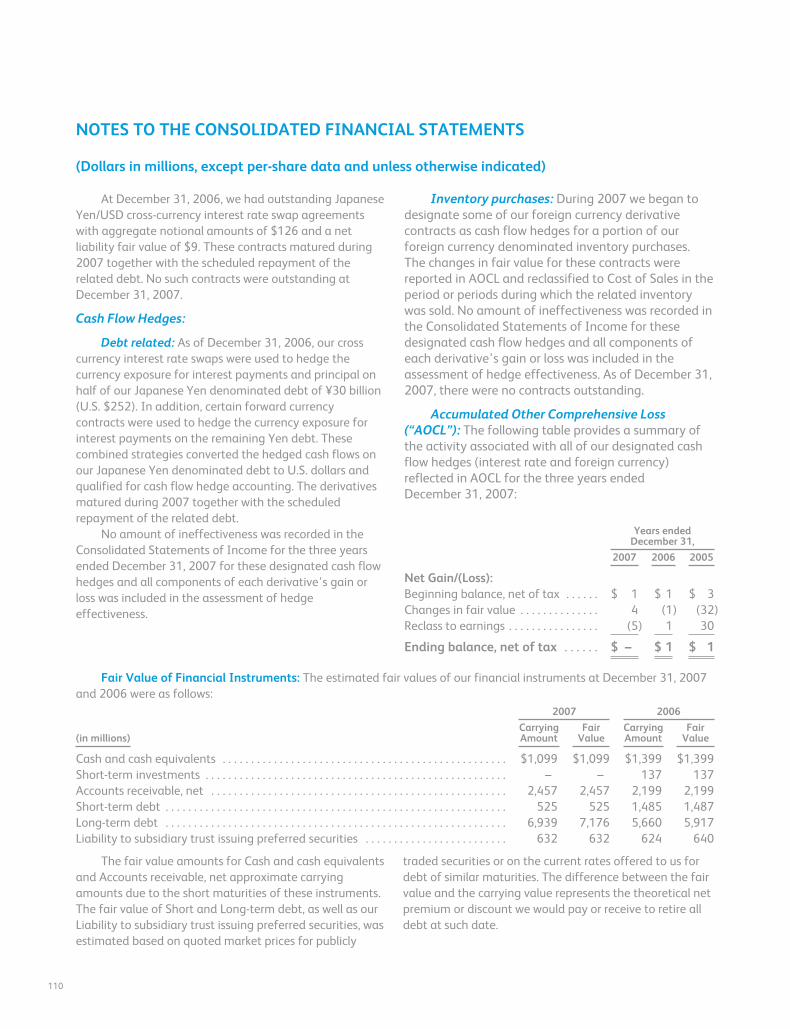
NOTES TO THE CONSOLIDATED FINANCIAL STATEMENTS
(Dollars in millions, except per-share data and unless otherwise indicated)
At December 31, 2006, we had outstanding JapaneseYen/USD cross-currency interest rate swap agreementswith aggregate notional amounts of $126 and a netliability fair value of $9. These contracts matured during2007 together with the scheduled repayment of therelated debt. No such contracts were outstanding atDecember 31, 2007.
Cash Flow Hedges:
Debt related: As of December 31, 2006, our crosscurrency interest rate swaps were used to hedge thecurrency exposure for interest payments and principal onhalf of our Japanese Yen denominated debt of ¥30 billion(U.S. $252). In addition, certain forward currencycontracts were used to hedge the currency exposure forinterest payments on the remaining Yen debt. Thesecombined strategies converted the hedged cash flows onour Japanese Yen denominated debt to U.S. dollars andqualified for cash flow hedge accounting. The derivativesmatured during 2007 together with the scheduledrepayment of the related debt.
No amount of ineffectiveness was recorded in theConsolidated Statements of Income for the three yearsended December 31, 2007 for these designated cash flowhedges and all components of each derivative’s gain orloss was included in the assessment of hedgeeffectiveness.
Inventory purchases: During 2007 we began todesignate some of our foreign currency derivativecontracts as cash flow hedges for a portion of ourforeign currency denominated inventory purchases.The changes in fair value for these contracts werereported in AOCL and reclassified to Cost of Sales in theperiod or periods during which the related inventorywas sold. No amount of ineffectiveness was recorded inthe Consolidated Statements of Income for thesedesignated cash flow hedges and all components ofeach derivative’s gain or loss was included in theassessment of hedge effectiveness. As of December 31,2007, there were no contracts outstanding.
Accumulated Other Comprehensive Loss(“AOCL”): The following table provides a summary ofthe activity associated with all of our designated cashflow hedges (interest rate and foreign currency)reflected in AOCL for the three years endedDecember 31, 2007:
Years endedDecember 31,
2007 2006 2005
Net Gain/(Loss):Beginning balance, net of tax . . . . . . $ 1 $ 1 $ 3Changes in fair value . . . . . . . . . . . . . . 4 (1) (32)Reclass to earnings . . . . . . . . . . . . . . . . (5) 1 30
Ending balance, net of tax . . . . . . $ – $ 1 $ 1
Fair Value of Financial Instruments: The estimated fair values of our financial instruments at December 31, 2007and 2006 were as follows:
2007 2006
(in millions)CarryingAmount
FairValue
CarryingAmount
FairValue
Cash and cash equivalents . . . . . . . . . . . . . . . . . . . . . . . . . . . . . . . . . . . . . . . . . . . . . . . . . . $1,099 $1,099 $1,399 $1,399Short-term investments . . . . . . . . . . . . . . . . . . . . . . . . . . . . . . . . . . . . . . . . . . . . . . . . . . . . . – – 137 137Accounts receivable, net . . . . . . . . . . . . . . . . . . . . . . . . . . . . . . . . . . . . . . . . . . . . . . . . . . . . 2,457 2,457 2,199 2,199Short-term debt . . . . . . . . . . . . . . . . . . . . . . . . . . . . . . . . . . . . . . . . . . . . . . . . . . . . . . . . . . . . 525 525 1,485 1,487Long-term debt . . . . . . . . . . . . . . . . . . . . . . . . . . . . . . . . . . . . . . . . . . . . . . . . . . . . . . . . . . . . 6,939 7,176 5,660 5,917Liability to subsidiary trust issuing preferred securities . . . . . . . . . . . . . . . . . . . . . . . . . 632 632 624 640
The fair value amounts for Cash and cash equivalentsand Accounts receivable, net approximate carryingamounts due to the short maturities of these instruments.The fair value of Short and Long-term debt, as well as ourLiability to subsidiary trust issuing preferred securities, wasestimated based on quoted market prices for publicly
traded securities or on the current rates offered to us fordebt of similar maturities. The difference between the fairvalue and the carrying value represents the theoretical netpremium or discount we would pay or receive to retire alldebt at such date.
110
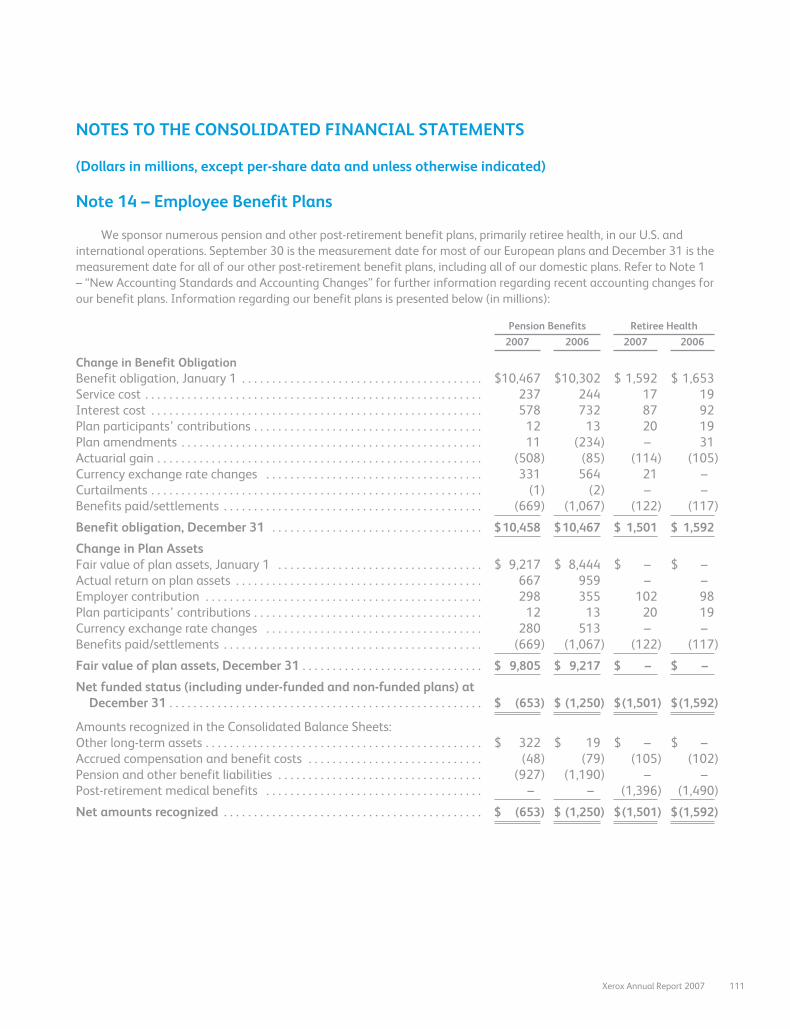
NOTES TO THE CONSOLIDATED FINANCIAL STATEMENTS
(Dollars in millions, except per-share data and unless otherwise indicated)
Note 14 – Employee Benefit Plans
We sponsor numerous pension and other post-retirement benefit plans, primarily retiree health, in our U.S. andinternational operations. September 30 is the measurement date for most of our European plans and December 31 is themeasurement date for all of our other post-retirement benefit plans, including all of our domestic plans. Refer to Note 1– “New Accounting Standards and Accounting Changes” for further information regarding recent accounting changes forour benefit plans. Information regarding our benefit plans is presented below (in millions):
Pension Benefits Retiree Health
2007 2006 2007 2006
Change in Benefit ObligationBenefit obligation, January 1 . . . . . . . . . . . . . . . . . . . . . . . . . . . . . . . . . . . . . . . . $10,467 $10,302 $ 1,592 $ 1,653Service cost . . . . . . . . . . . . . . . . . . . . . . . . . . . . . . . . . . . . . . . . . . . . . . . . . . . . . . . . 237 244 17 19Interest cost . . . . . . . . . . . . . . . . . . . . . . . . . . . . . . . . . . . . . . . . . . . . . . . . . . . . . . . 578 732 87 92Plan participants’ contributions . . . . . . . . . . . . . . . . . . . . . . . . . . . . . . . . . . . . . . 12 13 20 19Plan amendments . . . . . . . . . . . . . . . . . . . . . . . . . . . . . . . . . . . . . . . . . . . . . . . . . . 11 (234) – 31Actuarial gain . . . . . . . . . . . . . . . . . . . . . . . . . . . . . . . . . . . . . . . . . . . . . . . . . . . . . . (508) (85) (114) (105)Currency exchange rate changes . . . . . . . . . . . . . . . . . . . . . . . . . . . . . . . . . . . . 331 564 21 –Curtailments . . . . . . . . . . . . . . . . . . . . . . . . . . . . . . . . . . . . . . . . . . . . . . . . . . . . . . . (1) (2) – –Benefits paid/settlements . . . . . . . . . . . . . . . . . . . . . . . . . . . . . . . . . . . . . . . . . . . (669) (1,067) (122) (117)
Benefit obligation, December 31 . . . . . . . . . . . . . . . . . . . . . . . . . . . . . . . . . . . $10,458 $10,467 $ 1,501 $ 1,592
Change in Plan AssetsFair value of plan assets, January 1 . . . . . . . . . . . . . . . . . . . . . . . . . . . . . . . . . . $ 9,217 $ 8,444 $ – $ –Actual return on plan assets . . . . . . . . . . . . . . . . . . . . . . . . . . . . . . . . . . . . . . . . . 667 959 – –Employer contribution . . . . . . . . . . . . . . . . . . . . . . . . . . . . . . . . . . . . . . . . . . . . . . 298 355 102 98Plan participants’ contributions . . . . . . . . . . . . . . . . . . . . . . . . . . . . . . . . . . . . . . 12 13 20 19Currency exchange rate changes . . . . . . . . . . . . . . . . . . . . . . . . . . . . . . . . . . . . 280 513 – –Benefits paid/settlements . . . . . . . . . . . . . . . . . . . . . . . . . . . . . . . . . . . . . . . . . . . (669) (1,067) (122) (117)
Fair value of plan assets, December 31 . . . . . . . . . . . . . . . . . . . . . . . . . . . . . . $ 9,805 $ 9,217 $ – $ –
Net funded status (including under-funded and non-funded plans) atDecember 31 . . . . . . . . . . . . . . . . . . . . . . . . . . . . . . . . . . . . . . . . . . . . . . . . . . . . $ (653) $ (1,250) $(1,501) $(1,592)
Amounts recognized in the Consolidated Balance Sheets:Other long-term assets . . . . . . . . . . . . . . . . . . . . . . . . . . . . . . . . . . . . . . . . . . . . . . $ 322 $ 19 $ – $ –Accrued compensation and benefit costs . . . . . . . . . . . . . . . . . . . . . . . . . . . . . (48) (79) (105) (102)Pension and other benefit liabilities . . . . . . . . . . . . . . . . . . . . . . . . . . . . . . . . . . (927) (1,190) – –Post-retirement medical benefits . . . . . . . . . . . . . . . . . . . . . . . . . . . . . . . . . . . . – – (1,396) (1,490)
Net amounts recognized . . . . . . . . . . . . . . . . . . . . . . . . . . . . . . . . . . . . . . . . . . . $ (653) $ (1,250) $(1,501) $(1,592)
Xerox Annual Report 2007 111
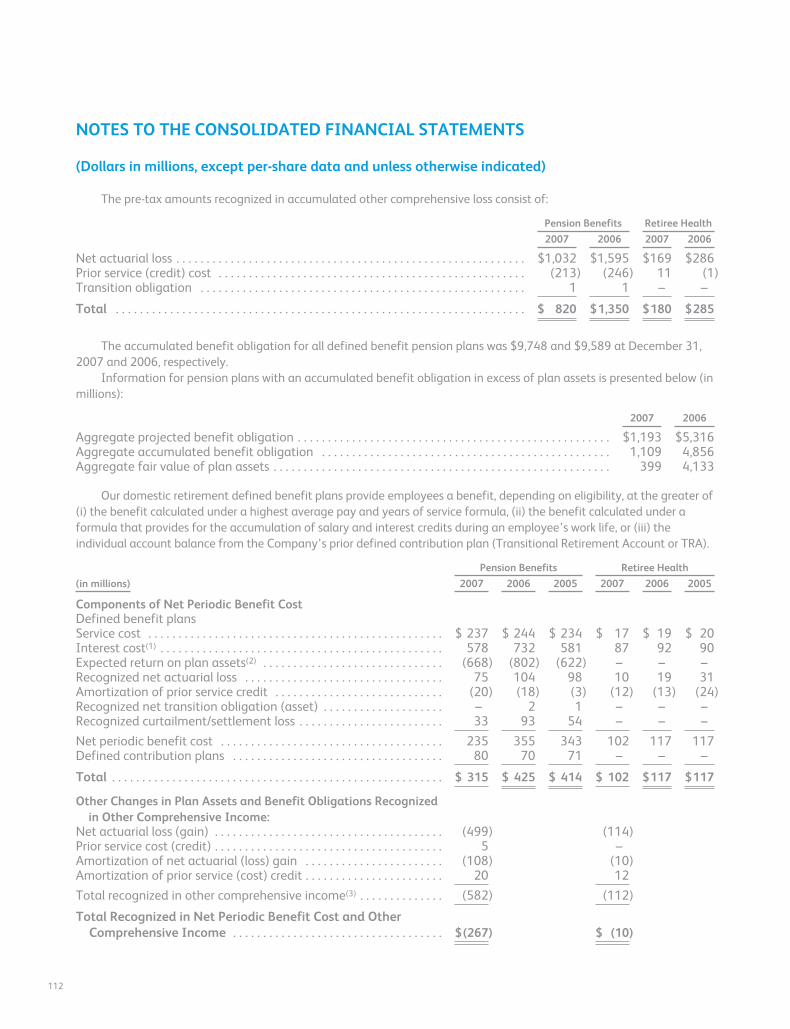
NOTES TO THE CONSOLIDATED FINANCIAL STATEMENTS
(Dollars in millions, except per-share data and unless otherwise indicated)
The pre-tax amounts recognized in accumulated other comprehensive loss consist of:
Pension Benefits Retiree Health
2007 2006 2007 2006
Net actuarial loss . . . . . . . . . . . . . . . . . . . . . . . . . . . . . . . . . . . . . . . . . . . . . . . . . . . . . . . . . . $1,032 $1,595 $169 $286Prior service (credit) cost . . . . . . . . . . . . . . . . . . . . . . . . . . . . . . . . . . . . . . . . . . . . . . . . . . . (213) (246) 11 (1)Transition obligation . . . . . . . . . . . . . . . . . . . . . . . . . . . . . . . . . . . . . . . . . . . . . . . . . . . . . . 1 1 – –
Total . . . . . . . . . . . . . . . . . . . . . . . . . . . . . . . . . . . . . . . . . . . . . . . . . . . . . . . . . . . . . . . . . . . . $ 820 $1,350 $180 $285
The accumulated benefit obligation for all defined benefit pension plans was $9,748 and $9,589 at December 31,2007 and 2006, respectively.
Information for pension plans with an accumulated benefit obligation in excess of plan assets is presented below (inmillions):
2007 2006
Aggregate projected benefit obligation . . . . . . . . . . . . . . . . . . . . . . . . . . . . . . . . . . . . . . . . . . . . . . . . . . . . $1,193 $5,316Aggregate accumulated benefit obligation . . . . . . . . . . . . . . . . . . . . . . . . . . . . . . . . . . . . . . . . . . . . . . . . 1,109 4,856Aggregate fair value of plan assets . . . . . . . . . . . . . . . . . . . . . . . . . . . . . . . . . . . . . . . . . . . . . . . . . . . . . . . . 399 4,133
Our domestic retirement defined benefit plans provide employees a benefit, depending on eligibility, at the greater of(i) the benefit calculated under a highest average pay and years of service formula, (ii) the benefit calculated under aformula that provides for the accumulation of salary and interest credits during an employee’s work life, or (iii) theindividual account balance from the Company’s prior defined contribution plan (Transitional Retirement Account or TRA).
Pension Benefits Retiree Health
(in millions) 2007 2006 2005 2007 2006 2005
Components of Net Periodic Benefit CostDefined benefit plansService cost . . . . . . . . . . . . . . . . . . . . . . . . . . . . . . . . . . . . . . . . . . . . . . . . . $ 237 $ 244 $ 234 $ 17 $ 19 $ 20Interest cost(1) . . . . . . . . . . . . . . . . . . . . . . . . . . . . . . . . . . . . . . . . . . . . . . . 578 732 581 87 92 90Expected return on plan assets(2) . . . . . . . . . . . . . . . . . . . . . . . . . . . . . . (668) (802) (622) – – –Recognized net actuarial loss . . . . . . . . . . . . . . . . . . . . . . . . . . . . . . . . . 75 104 98 10 19 31Amortization of prior service credit . . . . . . . . . . . . . . . . . . . . . . . . . . . . (20) (18) (3) (12) (13) (24)Recognized net transition obligation (asset) . . . . . . . . . . . . . . . . . . . . – 2 1 – – –Recognized curtailment/settlement loss . . . . . . . . . . . . . . . . . . . . . . . . 33 93 54 – – –
Net periodic benefit cost . . . . . . . . . . . . . . . . . . . . . . . . . . . . . . . . . . . . . 235 355 343 102 117 117Defined contribution plans . . . . . . . . . . . . . . . . . . . . . . . . . . . . . . . . . . . 80 70 71 – – –
Total . . . . . . . . . . . . . . . . . . . . . . . . . . . . . . . . . . . . . . . . . . . . . . . . . . . . . . . $ 315 $ 425 $ 414 $ 102 $117 $117
Other Changes in Plan Assets and Benefit Obligations Recognizedin Other Comprehensive Income:
Net actuarial loss (gain) . . . . . . . . . . . . . . . . . . . . . . . . . . . . . . . . . . . . . . (499) (114)Prior service cost (credit) . . . . . . . . . . . . . . . . . . . . . . . . . . . . . . . . . . . . . . 5 –Amortization of net actuarial (loss) gain . . . . . . . . . . . . . . . . . . . . . . . (108) (10)Amortization of prior service (cost) credit . . . . . . . . . . . . . . . . . . . . . . . 20 12
Total recognized in other comprehensive income(3) . . . . . . . . . . . . . . (582) (112)
Total Recognized in Net Periodic Benefit Cost and OtherComprehensive Income . . . . . . . . . . . . . . . . . . . . . . . . . . . . . . . . . . . $(267) $ (10)
112
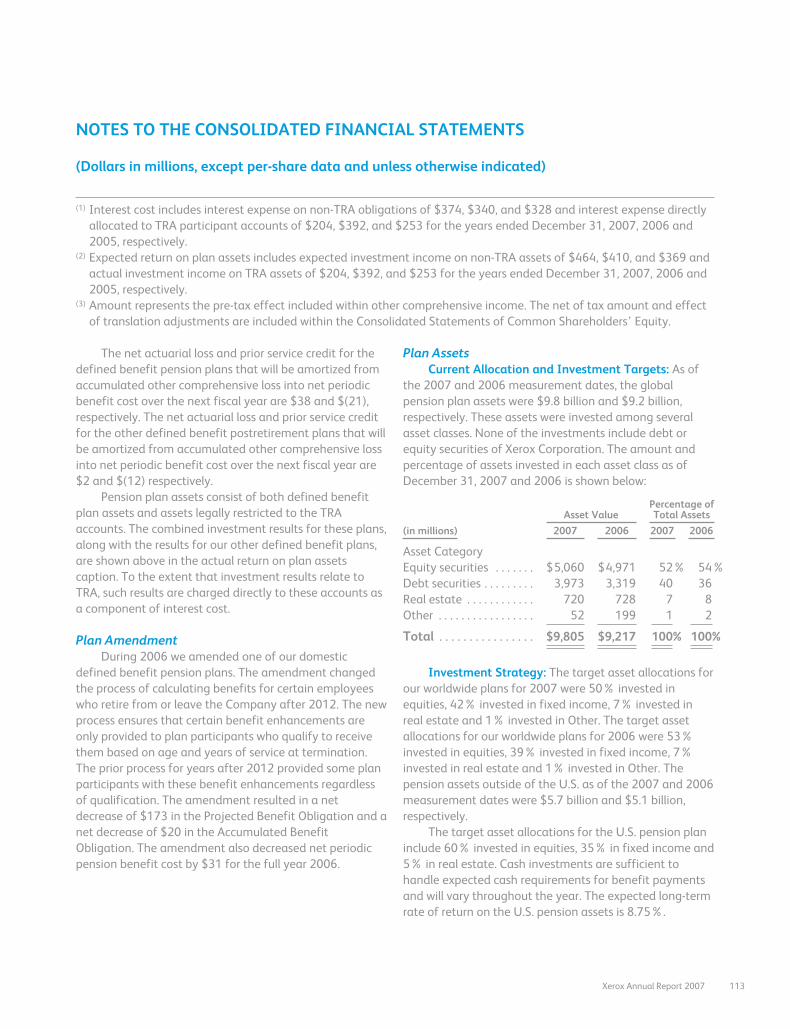
NOTES TO THE CONSOLIDATED FINANCIAL STATEMENTS
(Dollars in millions, except per-share data and unless otherwise indicated)
(1) Interest cost includes interest expense on non-TRA obligations of $374, $340, and $328 and interest expense directlyallocated to TRA participant accounts of $204, $392, and $253 for the years ended December 31, 2007, 2006 and2005, respectively.
(2) Expected return on plan assets includes expected investment income on non-TRA assets of $464, $410, and $369 andactual investment income on TRA assets of $204, $392, and $253 for the years ended December 31, 2007, 2006 and2005, respectively.
(3) Amount represents the pre-tax effect included within other comprehensive income. The net of tax amount and effectof translation adjustments are included within the Consolidated Statements of Common Shareholders’ Equity.
The net actuarial loss and prior service credit for thedefined benefit pension plans that will be amortized fromaccumulated other comprehensive loss into net periodicbenefit cost over the next fiscal year are $38 and $(21),respectively. The net actuarial loss and prior service creditfor the other defined benefit postretirement plans that willbe amortized from accumulated other comprehensive lossinto net periodic benefit cost over the next fiscal year are$2 and $(12) respectively.
Pension plan assets consist of both defined benefitplan assets and assets legally restricted to the TRAaccounts. The combined investment results for these plans,along with the results for our other defined benefit plans,are shown above in the actual return on plan assetscaption. To the extent that investment results relate toTRA, such results are charged directly to these accounts asa component of interest cost.
Plan AmendmentDuring 2006 we amended one of our domestic
defined benefit pension plans. The amendment changedthe process of calculating benefits for certain employeeswho retire from or leave the Company after 2012. The newprocess ensures that certain benefit enhancements areonly provided to plan participants who qualify to receivethem based on age and years of service at termination.The prior process for years after 2012 provided some planparticipants with these benefit enhancements regardlessof qualification. The amendment resulted in a netdecrease of $173 in the Projected Benefit Obligation and anet decrease of $20 in the Accumulated BenefitObligation. The amendment also decreased net periodicpension benefit cost by $31 for the full year 2006.
Plan AssetsCurrent Allocation and Investment Targets: As of
the 2007 and 2006 measurement dates, the globalpension plan assets were $9.8 billion and $9.2 billion,respectively. These assets were invested among severalasset classes. None of the investments include debt orequity securities of Xerox Corporation. The amount andpercentage of assets invested in each asset class as ofDecember 31, 2007 and 2006 is shown below:
Asset ValuePercentage ofTotal Assets
(in millions) 2007 2006 2007 2006
Asset CategoryEquity securities . . . . . . . $5,060 $4,971 52% 54%Debt securities . . . . . . . . . 3,973 3,319 40 36Real estate . . . . . . . . . . . . 720 728 7 8Other . . . . . . . . . . . . . . . . . 52 199 1 2
Total . . . . . . . . . . . . . . . . $9,805 $9,217 100% 100%
Investment Strategy: The target asset allocations forour worldwide plans for 2007 were 50% invested inequities, 42% invested in fixed income, 7% invested inreal estate and 1% invested in Other. The target assetallocations for our worldwide plans for 2006 were 53%invested in equities, 39% invested in fixed income, 7%invested in real estate and 1% invested in Other. Thepension assets outside of the U.S. as of the 2007 and 2006measurement dates were $5.7 billion and $5.1 billion,respectively.
The target asset allocations for the U.S. pension planinclude 60% invested in equities, 35% in fixed income and5% in real estate. Cash investments are sufficient tohandle expected cash requirements for benefit paymentsand will vary throughout the year. The expected long-termrate of return on the U.S. pension assets is 8.75%.
Xerox Annual Report 2007 113
NOTES TO THE CONSOLIDATED FINANCIAL STATEMENTS
(Dollars in millions, except per-share data and unless otherwise indicated)
We employ a total return investment approachwhereby a mix of equities and fixed income investmentsare used to maximize the long-term return of plan assetsfor a prudent level of risk. The intent of this strategy is tominimize plan expenses by exceeding the interest growthin long-term plan liabilities. Risk tolerance is establishedthrough careful consideration of plan liabilities, planfunded status, and corporate financial condition. Thisconsideration involves the use of long-term measures thataddress both return and risk. The investment portfoliocontains a diversified blend of equity and fixed incomeinvestments. Furthermore, equity investments arediversified across U.S. and non-U.S. stocks as well asgrowth, value and small and large capitalizations. Otherassets such as real estate, private equity, and hedge fundsare used to improve portfolio diversification. Derivativesmay be used to hedge market exposure in an efficient andtimely manner; however, derivatives may not be used toleverage the portfolio beyond the market value of theunderlying investments. Investment risks and returns aremeasured and monitored on an ongoing basis throughannual liability measurements and quarterly investmentportfolio reviews.
Expected Long Term Rate of Return: We employ a“building block” approach in determining the long-termrate of return for plan assets. Historical markets arestudied and long-term relationships between equities andfixed income are assessed. Current market factors such asinflation and interest rates are evaluated before long-termcapital market assumptions are determined. The long-termportfolio return is established giving consideration toinvestment diversification and rebalancing. Peer data and
historical returns are reviewed periodically to assessreasonableness and appropriateness.
Contributions: We expect to contributeapproximately $130 to our worldwide defined benefitpension plans and approximately $100 to our other postretirement benefit plans in 2008. The 2008 expectedpension plan contributions do not include any plannedcontribution for our domestic tax-qualified defined benefitplans because there are no required contributions to theseplans for the 2008 fiscal year. However, once theJanuary 1, 2008 actuarial valuations and projected resultsas of the end of the 2008 measurement year are available,the desirability of additional contributions will bereassessed. Based on these results, we may voluntarilydecide to contribute to these plans, even though nocontribution is required. In 2007 and 2006, after makingthis assessment, we contributed $158 and $228,respectively, to our domestic tax qualified plans to makethem 100% funded on a current liability basis under theERISA funding rules.
Estimated Future Benefit Payments: The followingbenefit payments, which reflect expected future service, asappropriate, are expected to be paid during the followingyears (in millions):
PensionBenefits
RetireeHealth
2008 . . . . . . . . . . . . . . . . . . . . . . . . . . . . . . . $ 732 $1052009 . . . . . . . . . . . . . . . . . . . . . . . . . . . . . . . 645 1142010 . . . . . . . . . . . . . . . . . . . . . . . . . . . . . . . 675 1192011 . . . . . . . . . . . . . . . . . . . . . . . . . . . . . . . 690 1232012 . . . . . . . . . . . . . . . . . . . . . . . . . . . . . . . 758 127Years 2013–2017 . . . . . . . . . . . . . . . . . . . . 3,977 635
Assumptions Pension Benefits Retiree Health
2007 2006 2005 2007 2006 2005
Weighted-average assumptions used to determine benefit obligations atthe plan measurement dates
Discount rate . . . . . . . . . . . . . . . . . . . . . . . . . . . . . . . . . . . . . . . . . . . . . . . . . . . . . . . . . . . . 5.9% 5.3% 5.2% 6.2% 5.8% 5.6%Rate of compensation increase . . . . . . . . . . . . . . . . . . . . . . . . . . . . . . . . . . . . . . . . . . . . 4.1 4.1 3.9 – (1) – (1) – (1)
(1) Rate of compensation increase is not applicable to the retiree health benefits as compensation levels do not impactearned benefits.
114
NOTES TO THE CONSOLIDATED FINANCIAL STATEMENTS
(Dollars in millions, except per-share data and unless otherwise indicated)
Pension Benefits Retiree Health
2008 2007 2006 2005 2008 2007 2006 2005
Weighted-average assumptions used to determine netperiodic benefit cost for years ended December 31
Discount rate . . . . . . . . . . . . . . . . . . . . . . . . . . . . . . . . . . . . . . . . . . . . . . . 5.9% 5.3% 5.2% 5.6% 6.2% 5.8% 5.6% 5.8%Expected return on plan assets . . . . . . . . . . . . . . . . . . . . . . . . . . . . . . . 7.6 7.6 7.8 8.0 – (1) – (1) – (1) – (1)
Rate of compensation increase . . . . . . . . . . . . . . . . . . . . . . . . . . . . . . . 4.1 4.1 3.9 4.0 – (2) – (2) – (2) – (2)
(1) Expected return on plan assets is not applicable to retiree health benefits as these plans are not funded.(2) Rate of compensation increase is not applicable to retiree health benefits as compensation levels do not impact
earned benefits.
Assumed health care cost trend rates at December 31:2007 2006
Health care cost trend rate assumed for next year . . . . . . . . . . . . . . . . . . . . . . . . . . . . . . . . . . . . . . . . . . . . . . . . . . . 10.4% 9.9%Rate to which the cost trend rate is assumed to decline (the ultimate trend rate) . . . . . . . . . . . . . . . . . . . . . . . 5.0% 5.2%Year that the rate reaches the ultimate trend rate . . . . . . . . . . . . . . . . . . . . . . . . . . . . . . . . . . . . . . . . . . . . . . . . . . . 2013 2011
Assumed health care cost trend rates have a significant effect on the amounts reported for the health care plans. Aone-percentage-point change in assumed health care cost trend rates would have the following effects (in millions):
One-percentage-pointincrease
One-percentage-pointdecrease
Effect on total service and interest cost components . . . . . . . . . . . . . . . . . . . . . . . $ 7 $ (5)Effect on post-retirement benefit obligation . . . . . . . . . . . . . . . . . . . . . . . . . . . . . . 86 (73)
Note 15 – Income and Other Taxes
Income before income taxes for the three years ended December 31, 2007 were as follows (in millions):
2007 2006 2005
Domestic income . . . . . . . . . . . . . . . . . . . . . . . . . . . . . . . . . . . . . . . . . . . . . . . . . . . . . . . . . . . . . . . . . . . . . . . . $ 667 $429 $386Foreign income . . . . . . . . . . . . . . . . . . . . . . . . . . . . . . . . . . . . . . . . . . . . . . . . . . . . . . . . . . . . . . . . . . . . . . . . . 771 379 444
Income before income taxes . . . . . . . . . . . . . . . . . . . . . . . . . . . . . . . . . . . . . . . . . . . . . . . . . . . . . . . $1,438 $808 $830
Provisions (benefits) for income taxes for the three years ended December 31, 2007 were as follows (in millions):
2007 2006 2005
Federal income taxesCurrent . . . . . . . . . . . . . . . . . . . . . . . . . . . . . . . . . . . . . . . . . . . . . . . . . . . . . . . . . . . . . . . . . . . . . . . . . . . . . $ 30 $ (448) $(94)Deferred . . . . . . . . . . . . . . . . . . . . . . . . . . . . . . . . . . . . . . . . . . . . . . . . . . . . . . . . . . . . . . . . . . . . . . . . . . . . 92 94 (59)
Foreign income taxesCurrent . . . . . . . . . . . . . . . . . . . . . . . . . . . . . . . . . . . . . . . . . . . . . . . . . . . . . . . . . . . . . . . . . . . . . . . . . . . . . 144 50 95Deferred . . . . . . . . . . . . . . . . . . . . . . . . . . . . . . . . . . . . . . . . . . . . . . . . . . . . . . . . . . . . . . . . . . . . . . . . . . . . 120 (9) 37
State income taxesCurrent . . . . . . . . . . . . . . . . . . . . . . . . . . . . . . . . . . . . . . . . . . . . . . . . . . . . . . . . . . . . . . . . . . . . . . . . . . . . . 2 11 9Deferred . . . . . . . . . . . . . . . . . . . . . . . . . . . . . . . . . . . . . . . . . . . . . . . . . . . . . . . . . . . . . . . . . . . . . . . . . . . . 12 14 7
Total . . . . . . . . . . . . . . . . . . . . . . . . . . . . . . . . . . . . . . . . . . . . . . . . . . . . . . . . . . . . . . . . . . . . . . . . . . $400 $(288) $ (5)
Xerox Annual Report 2007 115
NOTES TO THE CONSOLIDATED FINANCIAL STATEMENTS
(Dollars in millions, except per-share data and unless otherwise indicated)
A reconciliation of the U.S. federal statutory income tax rate to the consolidated effective income tax rate for thethree years ended December 31, 2007 was as follows:
2007 2006 2005
U.S. federal statutory income tax rate . . . . . . . . . . . . . . . . . . . . . . . . . . . . . . . . . . . . . . . . . . . . . . . . . . . . . . . 35.0% 35.0% 35.0%Nondeductible expenses . . . . . . . . . . . . . . . . . . . . . . . . . . . . . . . . . . . . . . . . . . . . . . . . . . . . . . . . . . . . . . . . . . . 0.9 1.4 3.4Effect of tax law changes . . . . . . . . . . . . . . . . . . . . . . . . . . . . . . . . . . . . . . . . . . . . . . . . . . . . . . . . . . . . . . . . . . 1.1 (1.8) 0.3Change in valuation allowance for deferred tax assets . . . . . . . . . . . . . . . . . . . . . . . . . . . . . . . . . . . . . . . . 1.0 1.4 (4.6)State taxes, net of federal benefit . . . . . . . . . . . . . . . . . . . . . . . . . . . . . . . . . . . . . . . . . . . . . . . . . . . . . . . . . . . 1.3 1.8 1.6Audit and other tax return adjustments . . . . . . . . . . . . . . . . . . . . . . . . . . . . . . . . . . . . . . . . . . . . . . . . . . . . . (4.2) (62.5) (25.5)Tax-exempt income . . . . . . . . . . . . . . . . . . . . . . . . . . . . . . . . . . . . . . . . . . . . . . . . . . . . . . . . . . . . . . . . . . . . . . . (0.6) (0.9) (0.7)Other foreign, including earnings taxed at different rates . . . . . . . . . . . . . . . . . . . . . . . . . . . . . . . . . . . . . (7.4) (10.5) (10.3)Other . . . . . . . . . . . . . . . . . . . . . . . . . . . . . . . . . . . . . . . . . . . . . . . . . . . . . . . . . . . . . . . . . . . . . . . . . . . . . . . . . . . . 0.7 0.5 0.2
Effective income tax rate . . . . . . . . . . . . . . . . . . . . . . . . . . . . . . . . . . . . . . . . . . . . . . . . . . . . . . . . 27.8% (35.6)% (0.6)%
On a consolidated basis, we paid a total of $104, $76,and $186 in income taxes to federal, foreign and statejurisdictions in 2007, 2006 and 2005, respectively.
Total income tax expense (benefit) for the threeyears ended December 31, 2007 was allocated as follows(in millions):
2007 2006 2005
Pre-tax income . . . . . . . . . . . . . . . . $400 $(288) $ (5)Common shareholders’ equity:
Defined benefit plans/minimum pensionliability(1) . . . . . . . . . . . . . . . 222 (432) (18)
Stock option and incentiveplans, net . . . . . . . . . . . . . . (22) (25) (12)
Translation adjustmentsand other . . . . . . . . . . . . . . 24 (9) (12)
Total . . . . . . . . . . . . . . . . . . . . . . . . . $624 $(754) $(47)
(1) 2006 includes the effects of the adoption of FAS 158 –see Note 1 for further information.
Unrecognized Tax Benefits and Audit ResolutionsDue to the extensive geographical scope of our
operations, we are subject to ongoing tax examinations innumerous jurisdictions. Accordingly, we may recordincremental tax expense based upon the more-likely-than-not outcomes of any uncertain tax positions. Inaddition, when applicable, we adjust the previously
recorded tax expense to reflect examination results whenthe position is effectively settled. Our ongoingassessments of the more-likely-than-not outcomes of theexaminations and related tax positions require judgmentand can increase or decrease our effective tax rate, as wellas impact our operating results. The specific timing ofwhen the resolution of each tax position will be reached isuncertain. As of December 31, 2007, we do not believethat there are any positions for which it is reasonablypossible that the total amount of unrecognized taxbenefits will significantly increase or decrease within thenext 12 months.
Unrecognized Tax Benefits: A reconciliation of thebeginning and ending amount of unrecognized taxbenefits is as follows (in millions):
Balance at January 1, 2007 . . . . . . . . . . . . . . . . . . . . . $287Additions from acquisitions . . . . . . . . . . . . . . . . . . . . . 4Additions related to current year . . . . . . . . . . . . . . . . 33Additions related to prior years positions . . . . . . . . . 78Reductions related to prior years positions . . . . . . . . (33)Settlements with taxing authorities(1) . . . . . . . . . . . . (66)Reductions related to lapse of statute of
limitations . . . . . . . . . . . . . . . . . . . . . . . . . . . . . . . . . . (14)Currency . . . . . . . . . . . . . . . . . . . . . . . . . . . . . . . . . . . . . . 14
Balance at December 31, 2007 . . . . . . . . . . . . . . . . . . $303
(1) Majority of settlements resulted in utilization ofdeferred tax assets.
116
NOTES TO THE CONSOLIDATED FINANCIAL STATEMENTS
(Dollars in millions, except per-share data and unless otherwise indicated)
Included in the balance at January 1, 2007 and as ofDecember 31, 2007 are $93 and $137, respectively, of taxpositions that are highly certain of realizability but forwhich there is uncertainty about the timing or may bereduced through an indirect benefit from other taxingjurisdictions. Because of the impact of deferred taxaccounting, other than interest and penalties, thedisallowance of these positions would not affect theannual effective tax rate.
We have filed claims in certain jurisdictions to assertour position should the law be clarified by judicial means.At this point in time, we believe it is unlikely that we willreceive any benefit from these types of claims but we willcontinue to analyze as the issues develop. Accordingly, wehave not included any benefit for these types of claims inthe amount of unrecognized tax benefits.
Upon the adoption of FIN 48, we recognize interestand penalties accrued on unrecognized tax benefits aswell as interest received from favorable settlements withinincome tax expense. In 2007, net interest and penaltieswere less than $1. We had $28 and $23 accrued for thepayment of interest and penalties associated withunrecognized tax benefits at January 1, 2007 andDecember 31, 2007, respectively.
We file income tax returns in the U.S. federaljurisdiction and various foreign jurisdictions. In the U.S. weare no longer subject to U.S. federal income taxexaminations by tax authorities for years before 2006.With respect to our major foreign jurisdictions, we are nolonger subject to tax examinations by tax authoritiesbefore 2000.
2006 Audit Resolution: In the first quarter 2006, werecognized an income tax benefit of $24 from thefavorable resolution of certain tax issues associated withour 1999-2003 Internal Revenue Service (“IRS”) auditwhich at the time had not yet been finalized. In thesecond quarter 2006, we recognized an income taxbenefit of $46 related to the favorable resolution ofcertain tax matters associated with the finalization offoreign tax audits. In the third quarter 2006, we receivednotice that the U.S. Joint Committee on Taxation hadcompleted its review of our 1999-2003 IRS audit and as aresult of that review our audit for those years had been
finalized. Accordingly, we recorded an aggregate incometax benefit of $448 associated with the favorableresolution of certain tax matters from this audit. Therecorded benefit did not result in a significant cash refund,but it did increase tax credit carryforwards and reducetaxes otherwise potentially due.
2005 Audit Resolution: In the second quarter of2005, the 1996-1998 IRS audit was finalized. As aresult, we recorded an aggregate second quarter 2005net income benefit of $343. $260 of this benefit, whichincludes an after-tax benefit of $33 for interest ($54pre-tax benefit), is the result of a change in tax lawthat allowed us to recognize a benefit for $1.2 billion ofcapital losses associated with the disposition of ourinsurance group operations in those years. The claim ofadditional losses and related tax benefits requiredreview by the U.S. Joint Committee on Taxation, whichwas completed in June 2005. The benefit did not resultin a significant cash refund, but increased tax creditcarryforwards and reduced taxes otherwise potentiallydue.
Deferred Income Taxes
In substantially all instances, deferred incometaxes have not been provided on the undistributedearnings of foreign subsidiaries and other foreigninvestments carried at equity. The amount of suchearnings included in consolidated retained earnings atDecember 31, 2007 was approximately $7.5 billion.These earnings have been indefinitely reinvested andwe currently do not plan to initiate any action thatwould precipitate the payment of income taxesthereon. It is not practicable to estimate the amount ofadditional tax that might be payable on the foreignearnings. Our 2001 sale of half of our ownershipinterest in Fuji Xerox resulted in our investment nolonger qualifying as a foreign corporate joint venture.Accordingly, deferred taxes are required to be providedon the undistributed earnings of Fuji Xerox, arisingsubsequent to such date, as we no longer have theability to ensure indefinite reinvestment.
Xerox Annual Report 2007 117
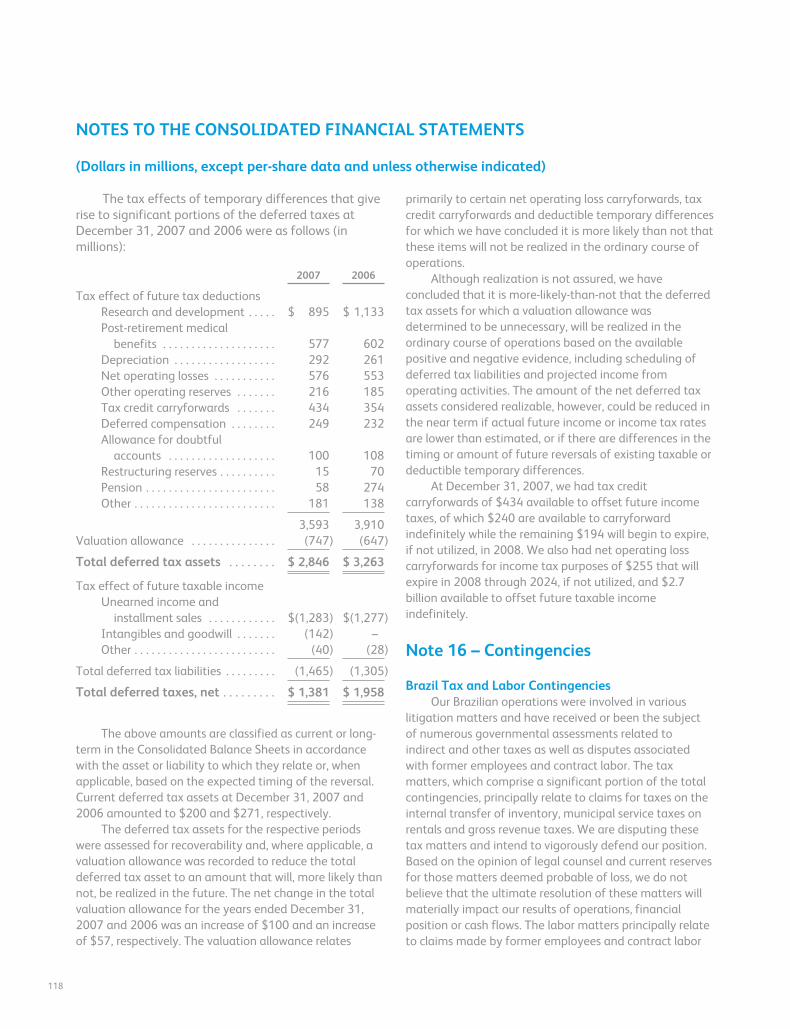
NOTES TO THE CONSOLIDATED FINANCIAL STATEMENTS
(Dollars in millions, except per-share data and unless otherwise indicated)
The tax effects of temporary differences that giverise to significant portions of the deferred taxes atDecember 31, 2007 and 2006 were as follows (inmillions):
2007 2006
Tax effect of future tax deductionsResearch and development . . . . . $ 895 $ 1,133Post-retirement medical
benefits . . . . . . . . . . . . . . . . . . . . 577 602Depreciation . . . . . . . . . . . . . . . . . . 292 261Net operating losses . . . . . . . . . . . 576 553Other operating reserves . . . . . . . 216 185Tax credit carryforwards . . . . . . . 434 354Deferred compensation . . . . . . . . 249 232Allowance for doubtful
accounts . . . . . . . . . . . . . . . . . . . 100 108Restructuring reserves . . . . . . . . . . 15 70Pension . . . . . . . . . . . . . . . . . . . . . . . 58 274Other . . . . . . . . . . . . . . . . . . . . . . . . . 181 138
3,593 3,910Valuation allowance . . . . . . . . . . . . . . . (747) (647)
Total deferred tax assets . . . . . . . . $ 2,846 $ 3,263
Tax effect of future taxable incomeUnearned income and
installment sales . . . . . . . . . . . . $(1,283) $(1,277)Intangibles and goodwill . . . . . . . (142) –Other . . . . . . . . . . . . . . . . . . . . . . . . . (40) (28)
Total deferred tax liabilities . . . . . . . . . (1,465) (1,305)
Total deferred taxes, net . . . . . . . . . $ 1,381 $ 1,958
The above amounts are classified as current or long-term in the Consolidated Balance Sheets in accordancewith the asset or liability to which they relate or, whenapplicable, based on the expected timing of the reversal.Current deferred tax assets at December 31, 2007 and2006 amounted to $200 and $271, respectively.
The deferred tax assets for the respective periodswere assessed for recoverability and, where applicable, avaluation allowance was recorded to reduce the totaldeferred tax asset to an amount that will, more likely thannot, be realized in the future. The net change in the totalvaluation allowance for the years ended December 31,2007 and 2006 was an increase of $100 and an increaseof $57, respectively. The valuation allowance relates
primarily to certain net operating loss carryforwards, taxcredit carryforwards and deductible temporary differencesfor which we have concluded it is more likely than not thatthese items will not be realized in the ordinary course ofoperations.
Although realization is not assured, we haveconcluded that it is more-likely-than-not that the deferredtax assets for which a valuation allowance wasdetermined to be unnecessary, will be realized in theordinary course of operations based on the availablepositive and negative evidence, including scheduling ofdeferred tax liabilities and projected income fromoperating activities. The amount of the net deferred taxassets considered realizable, however, could be reduced inthe near term if actual future income or income tax ratesare lower than estimated, or if there are differences in thetiming or amount of future reversals of existing taxable ordeductible temporary differences.
At December 31, 2007, we had tax creditcarryforwards of $434 available to offset future incometaxes, of which $240 are available to carryforwardindefinitely while the remaining $194 will begin to expire,if not utilized, in 2008. We also had net operating losscarryforwards for income tax purposes of $255 that willexpire in 2008 through 2024, if not utilized, and $2.7billion available to offset future taxable incomeindefinitely.
Note 16 – Contingencies
Brazil Tax and Labor ContingenciesOur Brazilian operations were involved in various
litigation matters and have received or been the subjectof numerous governmental assessments related toindirect and other taxes as well as disputes associatedwith former employees and contract labor. The taxmatters, which comprise a significant portion of the totalcontingencies, principally relate to claims for taxes on theinternal transfer of inventory, municipal service taxes onrentals and gross revenue taxes. We are disputing thesetax matters and intend to vigorously defend our position.Based on the opinion of legal counsel and current reservesfor those matters deemed probable of loss, we do notbelieve that the ultimate resolution of these matters willmaterially impact our results of operations, financialposition or cash flows. The labor matters principally relateto claims made by former employees and contract labor
118
NOTES TO THE CONSOLIDATED FINANCIAL STATEMENTS
(Dollars in millions, except per-share data and unless otherwise indicated)
for the equivalent payment of all social security and otherrelated labor benefits, as well as consequential tax claims,as if they were regular employees. As of December 31,2007, the total amounts related to the unreserved portionof the tax and labor contingencies, inclusive of any relatedinterest, amounted to approximately $1,130, with theincrease from December 31, 2006 balance of $960primarily related to indexation, interest and currency. Inconnection with the above proceedings, customary localregulations may require us to make escrow cash depositsor post other security of up to half of the total amount indispute. As of December 31, 2007 we had $200 of escrowcash deposits for matters we are disputing and there areliens on certain Brazilian assets with a net book value of$64 and additional letters of credit of approximately $84.Generally, any escrowed amounts would be refundableand any liens would be removed to the extent the mattersare resolved in our favor. We routinely assess all thesematters as to probability of ultimately incurring a liabilityagainst our Brazilian operations and record our bestestimate of the ultimate loss in situations where we assessthe likelihood of an ultimate loss as probable.
Legal
As more fully discussed below, we are involved in avariety of claims, lawsuits, investigations and proceedingsconcerning securities law, intellectual property law,environmental law, employment law and the EmployeeRetirement Income Security Act (“ERISA”). We determinewhether an estimated loss from a contingency should beaccrued by assessing whether a loss is deemed probableand can be reasonably estimated. We assess our potentialliability by analyzing our litigation and regulatory mattersusing available information. We develop our views onestimated losses in consultation with outside counselhandling our defense in these matters, which involves ananalysis of potential results, assuming a combination oflitigation and settlement strategies. Should developmentsin any of these matters cause a change in ourdetermination as to an unfavorable outcome and result inthe need to recognize a material accrual, or should any ofthese matters result in a final adverse judgment or besettled for significant amounts, they could have amaterial adverse effect on our results of operations, cashflows and financial position in the period or periods inwhich such change in determination, judgment orsettlement occurs.
Litigation Against the Company:
In re Xerox Corporation Securities Litigation: Aconsolidated securities law action (consisting of 17 cases)is pending in the United States District Court for theDistrict of Connecticut. Defendants are the Company,Barry Romeril, Paul Allaire and G. Richard Thoman. Theconsolidated action purports to be a class action on behalfof the named plaintiffs and all other purchasers ofcommon stock of the Company during the period betweenOctober 22, 1998 through October 7, 1999 (“ClassPeriod”). The amended consolidated complaint in theaction alleges that in violation of Section 10(b) and/or20(a) of the Securities Exchange Act of 1934, as amended(“1934 Act”), and SEC Rule 10b-5 thereunder, each of thedefendants is liable as a participant in a fraudulentscheme and course of business that operated as a fraud ordeceit on purchasers of the Company’s common stockduring the Class Period by disseminating materially falseand misleading statements and/or concealing materialfacts relating to the defendants’ alleged failure todisclose the material negative impact that the April 1998restructuring had on the Company’s operations andrevenues. The amended complaint further alleges that thealleged scheme: (i) deceived the investing publicregarding the economic capabilities, sales proficiencies,growth, operations and the intrinsic value of theCompany’s common stock; (ii) allowed several corporateinsiders, such as the named individual defendants, to sellshares of privately held common stock of the Companywhile in possession of materially adverse, non-publicinformation; and (iii) caused the individual plaintiffs andthe other members of the purported class to purchasecommon stock of the Company at inflated prices. Theamended consolidated complaint seeks unspecifiedcompensatory damages in favor of the plaintiffs and theother members of the purported class against alldefendants, jointly and severally, for all damagessustained as a result of defendants’ alleged wrongdoing,including interest thereon, together with reasonable costsand expenses incurred in the action, including counsel feesand expert fees. On September 28, 2001, the Court deniedthe defendants’ motion for dismissal of the complaint. OnNovember 5, 2001, the defendants answered thecomplaint. On or about January 7, 2003, the plaintiffsfiled a motion for class certification. Xerox and theindividual defendants filed their opposition to that motionon June 28, 2005. On or about November 8, 2004, the
Xerox Annual Report 2007 119
NOTES TO THE CONSOLIDATED FINANCIAL STATEMENTS
(Dollars in millions, except per-share data and unless otherwise indicated)
International Brotherhood of Electrical Workers WelfareFund of Local Union No. 164 (“IBEW”) filed a motion tointervene as a named plaintiff and class representative.Separately, on June 8, 2005, IBEW and Robert W. Roten(“Roten”) moved to substitute as lead plaintiffs andproposed class representatives. On May 12, 2006, theCourt denied, without prejudice to refiling, plaintiffs’motion for class certification, IBEW’s motion to interveneand serve as named plaintiff and class representative, andIBEW and Roten’s joint motion to substitute as leadplaintiffs and proposed class representatives. The Courtalso ordered the parties to submit to it a notice to certainputative class members to inform them of thecircumstances surrounding the withdrawal of several leadplaintiffs, and to advise them of the opportunity toexpress their desire to serve as a representative of theputative class. On July 25, 2006, the Court so-ordered aform of notice, and plaintiffs thereafter distributed thenotice. Thereafter, Roten, Robert Agius (“Agius”) andGeorgia Stanley (“Stanley”) filed applications to beconsidered lead plaintiffs. On November 13, 2006, IBEW,Roten, Agius and Stanley filed a motion for appointmentas additional lead plaintiffs. Defendants filed theirresponse on November 28, 2006. On February 2, 2007, theCourt granted the motion of IBEW, Roten, Agius andStanley and appointed them as additional lead plaintiffs.On February 15, 2007, lead plaintiffs IBEW, Roten, Agius,Stanley and Thomas Dalberth filed their renewed motionfor class certification. On July 18, 2007, the Court enteredan order denying plaintiffs’ renewed motion for classcertification, without prejudice to renewal after the Courtholds a pre-filing conference to identify factual disputesthe Court will be required to resolve in ruling on themotion. On December 12, 2007, the Court held a pre-filingconference and granted, absent objection, the motion ofAgius to withdraw as lead plaintiff and proposed classrepresentative. On February 5, 2008 plaintiffs filed asecond renewed motion for class certification. The partiesare currently engaged in discovery. The individualdefendants and we deny any wrongdoing and arevigorously defending the action. In the course oflitigation, we periodically engage in discussions withplaintiffs’ counsel for possible resolution of the matter.Should developments cause a change in ourdetermination as to an unfavorable outcome, or result in afinal adverse judgment or be settled for significantamounts, there could be a material adverse effect on our
results of operations, cash flows and financial position inthe period in which such change in determination,judgment or settlement occurs. Based on the presentstage of the litigation, it is not possible to estimate theamount of loss or range of possible loss that might resultfrom this matter.
Carlson v. Xerox Corporation, et al.: A consolidatedsecurities law action (consisting of 21 cases) is pending inthe United States District Court for the District ofConnecticut against the Company, KPMG and Paul A.Allaire, G. Richard Thoman, Anne M. Mulcahy, Barry D.Romeril, Gregory Tayler and Philip Fishbach. OnSeptember 11, 2002, the Court entered an endorsementorder granting plaintiffs’ motion to file a thirdconsolidated amended complaint. According to the thirdconsolidated amended complaint, plaintiffs purport tobring this case as a class action on behalf of a classconsisting of all persons and/or entities who purchasedXerox common stock and/or bonds during the periodbetween February 17, 1998 through June 28, 2002 andwho were purportedly damaged thereby (“Class”). Thethird consolidated amended complaint sets forth twoclaims: one alleging that each of the Company, KPMG,and the individual defendants violated Section 10(b) ofthe 1934 Act and SEC Rule 10b-5 thereunder; and theother alleging that the individual defendants are alsoliable as “controlling persons” of the Company pursuant toSection 20(a) of the 1934 Act. Plaintiffs claim that thedefendants participated in a fraudulent scheme thatoperated as a fraud and deceit on purchasers of theCompany’s common stock and bonds by disseminatingmaterially false and misleading statements and/orconcealing material adverse facts relating to various ofthe Company’s accounting and reporting practices andfinancial condition. The plaintiffs further allege that thisscheme deceived the investing public regarding the truestate of the Company’s financial condition and causedthe plaintiffs and other members of the purported Classto purchase the Company’s common stock and bonds atartificially inflated prices, and prompted a SECinvestigation that led to the April 11, 2002 settlementwhich, among other things, required the Company to paya $10 penalty and restate its financials for the years1997-2000 (including restatement of financials previouslycorrected in an earlier restatement which plaintiffscontend was improper). The third consolidated amendedcomplaint seeks unspecified compensatory damages in
120
NOTES TO THE CONSOLIDATED FINANCIAL STATEMENTS
(Dollars in millions, except per-share data and unless otherwise indicated)
favor of the plaintiffs and the other Class membersagainst all defendants, jointly and severally, includinginterest thereon, together with reasonable costs andexpenses, including counsel fees and expert fees. OnDecember 2, 2002, the Company and the individualdefendants filed a motion to dismiss the complaint. OnJuly 13, 2005, the Court denied the motion. OnOctober 31, 2005, the defendants answered thecomplaint. On January 19, 2006, plaintiffs filed a motionfor class certification. On July 18, 2007, the Court enteredan order denying plaintiffs’ motion for class certification,without prejudice to renewal after the Court holds apre-filing conference to identify factual disputes the Courtwill be required to resolve in ruling on the motion.Plaintiffs have filed notices of withdrawal of proposedclass representatives Sol Sachs, Leonard Nelson andFernan Cepero. The Court has approved plaintiffs’ noticeof withdrawal of proposed class representative FernanCepero. The parties are engaged in discovery. Theindividual defendants and we deny any wrongdoing andare vigorously defending the action. In the course oflitigation, we periodically engage in discussions withplaintiffs’ counsel for possible resolution of the matter.Should developments cause a change in ourdetermination as to an unfavorable outcome, or result in afinal adverse judgment or be settled for significantamounts, there could be a material adverse effect on ourresults of operations, cash flows and financial position inthe period in which such change in determination,judgment or settlement occurs. Based on the presentstage of the litigation, it is not possible to estimate theamount of loss or range of possible loss that might resultfrom this matter.
Florida State Board of Administration, et al. v. XeroxCorporation, et al.: A securities law action brought by fourinstitutional investors, namely the Florida State Board ofAdministration, the Teachers’ Retirement System ofLouisiana, Franklin Mutual Advisers and PPM America,Inc., is pending in the United States District Court for theDistrict of Connecticut against the Company, Paul Allaire,G. Richard Thoman, Barry Romeril, Anne Mulcahy, PhilipFishbach, Gregory Tayler and KPMG. The plaintiffs bringthis action individually on their own behalves. In anamended complaint filed on October 3, 2002, one or moreof the plaintiffs allege that each of the Company, theindividual defendants and KPMG violated Sections 10(b)and 18 of the 1934 Act, SEC Rule 10b-5 thereunder, the
Florida Securities Investors Protection Act, Fl. Stat. ss.517.301, and the Louisiana Securities Act, R.S. 51:712(A).The plaintiffs further claim that the individual defendantsare each liable as “controlling persons” of the Companypursuant to Section 20 of the 1934 Act and that each ofthe defendants is liable for common law fraud andnegligent misrepresentation. The complaint generallyalleges that the defendants participated in a scheme andcourse of conduct that deceived the investing public bydisseminating materially false and misleading statementsand/or concealing material adverse facts relating to theCompany’s financial condition and accounting andreporting practices. The plaintiffs contend that in relyingon false and misleading statements allegedly made bythe defendants, at various times from 1997 through 2000they bought shares of the Company’s common stock atartificially inflated prices. As a result, they allegedlysuffered aggregated cash losses in excess of $200. Theplaintiffs further contend that the alleged fraudulentscheme prompted a SEC investigation that led to theApril 11, 2002 settlement which, among other things,required the Company to pay a $10 penalty and restateits financials for the years 1997-2000 includingrestatement of financials previously corrected in an earlierrestatement which plaintiffs contend was false andmisleading. The plaintiffs seek, among other things,unspecified compensatory damages against theCompany, the individual defendants and KPMG, jointlyand severally, including prejudgment interest thereon,together with the costs and disbursements of the action,including their actual attorneys’ and experts’ fees. OnDecember 2, 2002, the Company and the individualdefendants filed a motion to dismiss all claims in thecomplaint that are in common with the claims in theCarlson action. On July 13, 2005, the Court denied themotion. On December 9, 2005, the defendants moved todismiss claims based on issues uniquely related toplaintiffs. On September 28, 2007, the Court entered anorder proposed by the parties to resolve motions todismiss, pursuant to which plaintiffs voluntarily dismissedcertain claims, the Xerox defendants withdrew as moottheir partial motion to dismiss the amended complaintand KPMG withdrew without prejudice its motion todismiss the amended complaint. Defendants served theiranswer with respect to claims unique to this case onNovember 9, 2007. The parties are engaged in discovery.The individual defendants and we deny any wrongdoing
Xerox Annual Report 2007 121
NOTES TO THE CONSOLIDATED FINANCIAL STATEMENTS
(Dollars in millions, except per-share data and unless otherwise indicated)
and are vigorously defending the action. In the course oflitigation, we periodically engage in discussions withplaintiffs’ counsel for possible resolution of the matter.Should developments cause a change in ourdetermination as to an unfavorable outcome, or result in afinal adverse judgment or be settled for significantamounts, there could be a material adverse effect on ourresults of operations, cash flows and financial position inthe period in which such change in determination,judgment or settlement occurs. Based on the presentstage of the litigation, it is not possible to estimate theamount of loss or range of possible loss that might resultfrom this matter.
In Re Xerox Corp. ERISA Litigation: On July 1, 2002, aclass action complaint captioned Patti v. Xerox Corp. et al.was filed in the United States District Court for the Districtof Connecticut (Hartford) alleging violations of the ERISA.Three additional class actions (Hopkins, Uebele and Saba)were subsequently filed in the same court makingsubstantially similar claims. On October 16, 2002, the fouractions were consolidated as In Re Xerox CorporationERISA Litigation. On November 15, 2002, a consolidatedamended complaint was filed. A fifth class action (Wright)was filed in the District of Columbia. It has beentransferred to Connecticut and consolidated with theother actions. The purported class includes all persons whoinvested or maintained investments in the Xerox StockFund in the Xerox 401(k) Plans (either salaried or union)during the proposed class period, May 12, 1997 throughNovember 15, 2002, and allegedly exceeds 50,000persons. The defendants include Xerox Corporation andthe following individuals or groups of individuals duringthe proposed class period: the Plan Administrator, theBoard of Directors, the Fiduciary Investment ReviewCommittee, the Joint Administrative Board, the FinanceCommittee of the Board of Directors, and the Treasurer.The complaint claimed that the defendants breachedtheir fiduciary duties under ERISA to protect the Plan’sassets and act in the interest of Plan participants.Specifically, plaintiffs claim that the defendants failed toprovide accurate and complete material information toparticipants concerning Xerox stock, including accountingpractices which allegedly artificially inflated the value ofthe stock, and misled participants regarding thesoundness of the stock and the prudence of investing theirretirement assets in Xerox stock. Defendants filed amotion to dismiss the complaint for failure to state claim.
On April 17, 2007, the Court ruled on the motion todismiss, granting it in part and denying it in part, andgiving the plaintiffs an opportunity to replead. Theplaintiffs subsequently filed a Second ConsolidatedAmended Complaint, alleging that some or all defendantsbreached their ERISA fiduciary duties during 1997-2002by (1) maintaining the Xerox Stock Fund as an investmentoption under the Plan; (2) failing to monitor the conductof Plan fiduciaries; and (3) misleading Plan participantsabout Xerox stock as an investment option under thePlans. The complaint does not specify the amount ofdamages sought. However, it asks that the losses to thePlans be restored, which it describes as “millions ofdollars.” It also seeks other legal and equitable relief, asappropriate, to remedy the alleged breaches of fiduciaryduty, as well as interest, costs and attorneys’ fees. OnJuly 18, 2007, Defendants answered the new complaintand also filed a partial motion to dismiss. On August 9,2007, the plaintiffs filed their motion for classcertification and on August 31, 2007 filed their oppositionto defendants’ partial motion to dismiss. Discovery isongoing. The Company and the other defendants denyany wrongdoing and will continue to vigorously defendthe action. In the course of litigation, we periodicallyengage in discussions with plaintiffs’ counsel for possibleresolution of the matter. Should developments cause achange in our determination as to an unfavorableoutcome, or result in a final adverse judgment or besettled for significant amounts, there could be a materialadverse effect on our results of operations, cash flows andfinancial position in the period in which such change indetermination, judgment or settlement occurs. At thisstage of the litigation, it is not possible to estimate theamount of loss or range of possible loss that might resultfrom this matter.
Digwamaje et al. v. IBM et al.: A purported classaction was filed in the United States District Court for theSouthern District of New York on September 27, 2002.Service of the First Amended Complaint on the Companywas deemed effective as of December 6, 2002. OnMarch 19, 2003, Plaintiffs filed a Second AmendedComplaint that eliminated a number of corporatedefendants but was otherwise identical in all materialrespects to the First Amended Complaint. The defendantsinclude the Company and a number of other corporatedefendants who are accused of providing materialassistance to the apartheid government in South Africa
122
NOTES TO THE CONSOLIDATED FINANCIAL STATEMENTS
(Dollars in millions, except per-share data and unless otherwise indicated)
from 1948 to 1994, by engaging in commerce in SouthAfrica and with the South African government and byemploying forced labor, thereby violating bothinternational and common law. Specifically, plaintiffsclaim violations of the Alien Tort Claims Act, the TortureVictims Protection Act and RICO. They also assert humanrights violations and crimes against humanity. Plaintiffsseek compensatory damages in excess of $200 billion andpunitive damages in excess of $200 billion. The foregoingdamages are being sought from all defendants, jointlyand severally. Xerox filed a motion to dismiss the SecondAmended Complaint. Oral argument of the motion washeard on November 6, 2003. By Memorandum Opinionand Order filed November 29, 2004, the Court granted themotion to dismiss. A clerk’s judgment of dismissal wasfiled on November 30, 2004. On December 27, 2004, theCompany received a notice of appeal dated December 24,2004. On February 16, 2005, the parties filed a stipulationwithdrawing the December 24, 2004 appeal on theground that the November 30, 2004 judgment ofdismissal was not appealable. On March 28, 2005,plaintiffs submitted a letter requesting permission to file amotion for leave to file an amended and consolidatedcomplaint. By Summary Order filed April 6, 2005, theCourt denied the request. In a second Summary Orderfiled the same day, the Court amended its November 29,2004, Opinion and Order, which dismissed the action, soas to render the Opinion and Order appealable andplaintiffs filed a new appeal on May 3, 2005. OnAugust 19, 2005, plaintiffs-appellants filed their brief inthe Second Circuit Court of Appeals. On October 4, 2005,defendants-appellees filed their brief in the Second CircuitCourt of Appeals. On October 12, 2007, the United StatesCourt of Appeals affirmed the dismissal of the claimsasserted under the Torture Victim Protection Act, vacatedthe dismissal of the claims asserted under the Alien TortClaims Act and remanded those claims to the districtcourt for further proceedings. On January 10, 2008,defendants-appellees filed a petition for a writ ofcertiorari in the Supreme Court of the United States,seeking review of the Second Circuit’s October 12, 2007opinion. Xerox denies any wrongdoing and is vigorouslydefending the action. Based upon the present stage of thelitigation, it is not possible to estimate the amount of lossor range of possible loss that might result from thismatter.
Arbitration between MPI Technologies, Inc. andXerox Canada Ltd. and Xerox Corporation: In anarbitration proceeding the hearing of which commencedon January 18, 2005, MPI Technologies, Inc. and MPITech S.A. (collectively “MPI”) sought damages from theCompany and Xerox Canada Ltd. (“XCL”) for royaltiesowed under a license agreement made as of March 15,1994 between MPI and XCL (the “Agreement”) andbreach of fiduciary duty, breach of confidence, equitableroyalties and punitive damages and disgorgement ofprofits and injunctive relief with respect to a claim ofcopyright infringement. On September 9, 2005, thearbitration panel rendered its decision, holding in partthat the Agreement had been assigned to Xerox and thatno punitive damages should be granted, and awardedMPI approximately $89, plus interest thereon. OnDecember 12, 2005, the arbitration panel rendered itsdecision on the applicable rate of pre-judgment interestresulting in an award of $13 for pre- and post-judgmentinterest. In June 2006, Xerox’s application for judicialreview of the award, seeking to have the award set asidein its entirety, was heard by the Ontario Superior Court inToronto. The Ontario Superior Court issued a decision onNovember 30, 2006 dismissing Xerox’s appeal. InDecember 2006, Xerox released all monies and software ithad placed in escrow prior to its application for review insatisfaction of the arbitration panel’s final award. OnJanuary 30, 2007, Xerox and XCL served an arbitrationclaim against MPI seeking a declaratory award concerningthe preclusive effect of the remedy awarded by the priorarbitration panel. On March 27, 2007, MPI delivered toXerox a statement of defense and counterclaim inresponse to Xerox’s arbitration claim. MPI claimsentitlement to an unspecified amount of damages forroyalties. In addition, MPI claims damages of $50 foralleged “misuse” of its licensed software by Xerox afterDecember 2006. MPI also claims entitlement tounspecified amounts of pre and post-judgment interestand its costs of the arbitration. Xerox delivered a reply andanswer to MPI’s defense and counterclaim on May 29,2007 and MPI delivered a reply to that pleading on July 5,2007. A panel of three arbitrators has been appointed tohear the dispute. The panel has established a schedule forhearing preliminary dispositive motions with oralargument to be held in May, 2008. In the course oflitigation, we periodically engage in discussions with MPI’scounsel for possible resolution of the matter. Should
Xerox Annual Report 2007 123
NOTES TO THE CONSOLIDATED FINANCIAL STATEMENTS
(Dollars in millions, except per-share data and unless otherwise indicated)
developments cause a change in our determination as toan unfavorable outcome, or result in a final adversejudgment or be settled for significant amounts, therecould be a material adverse effect on our results ofoperations, cash flows and financial position in the periodin which such change in determination, judgment orsettlement occurs. Based on the present stage of theproceeding, it is not possible to estimate the amount ofany material loss or range of material loss that mightresult from any of the claims advanced in suchcounterclaim.
National Union Fire Insurance Company v. XeroxCorporation, et al.: On October 24, 2003, a declaratoryjudgment action was filed in the Supreme Court of theState of New York, County of New York against theCompany and several current and former officers and/ormembers of the Board of Directors. Plaintiff claims that itissued an Excess Directors & Officers Liability andCorporate Reimbursement Policy to the Company inreliance on information from the Company that allegedlymisrepresented the Company’s financial condition andoutlook. The policy at issue provides for $25 of coverageas a component of the company reimbursement portionof an insurance program that provides for up to $135coverage (after deductibles and coinsurance and subjectto other policy limitations and requirements) over a three-year period. However, $10 of the entire amount may beunavailable due to the liquidation of one of the otherinsurers. Plaintiff seeks judgment (i) that it is entitled torescind the policy as void from the outset; (ii) in thealternative, limiting coverage under the policy andawarding plaintiff damages in an unspecified amountrepresenting that portion of any required payment underthe policy that is attributable to the Company’s and theindividual defendants’ own misconduct; and (iii) for thecosts and disbursement of the action and such other reliefas the court deems just and proper. On December 19,2003, the Company and individual defendants moved todismiss the complaint. On November 10, 2004, the Courtissued an opinion partially granting and partially denyingthe motions. Among other things, the Court granted themotions to dismiss all of the claims for rescission anddenied plaintiff’s request to replead. The Court denied theCompany’s and some of the individual defendants’motions to dismiss certain claims that seek to limitcoverage based on particular provisions in the policy andthat at least in part related to settlement with the SEC.
Plaintiff filed notices of appeal on January 10, 2005 andFebruary 11, 2005. By order entered on January 3, 2006,the Appellate Division affirmed the portions of the Court’sNovember 10, 2004 decision which dismissed several ofplaintiff’s claims and denied leave to replead. OnFebruary 2, 2006, plaintiff moved for reargument or forleave to appeal to the Court of Appeals. On May 30, 2006,the Appellate Division denied plaintiff’s motion.Separately, on February 22, 2005, the defendants filed amotion seeking dismissal of any remaining claims in lightof Xerox’s representation that it will not seek coveragefrom plaintiff for settlement payments to the SEC. Byorder dated July 12, 2005, the Court denied the motion.On August 23, 2005, defendants moved for leave toreargue the February 22 motion and separately moved forleave to renew the December 19, 2003 motions. OnApril 10, 2006, the Court issued an order granting thosemotions, dismissing one cause of action and partiallydismissing the two other causes of action that were thesubject of those motions. Subsequently, at a statusconference on May 4, 2006, the parties appeared beforethe Court and discussed inconsistencies between theCourt’s April 10, 2006 order and its November 10, 2004decision. As a result, on May 5, 2006 the Court executedan order, which was later rendered on July 27, 2006,withdrawing the April 10, 2006 order and substituting anew order which clarified and confirmed the dismissal ofall claims asserted in the original complaint. OnAugust 31, 2006, plaintiff filed with the Appellate Divisiona notice of appeal of the May 5, 2006 order andsubsequently filed a withdrawal of such notice of appeal,without prejudice, dated May 11, 2007. On September 5,2006, plaintiff served a motion to the Court of Appealsseeking leave to appeal directly to that court from theMay 5, 2006 order, and seeking review of the AppellateDivision’s January 3, 2006 order. On November 20, 2006,the Court of Appeals denied plaintiff’s motion. Plaintiffhad earlier filed an amended complaint on February 27,2006, naming all defendants named in the originalcomplaint and adding four causes of action against Xeroxonly, as well as a demand for unspecified monetary relief.On May 11, 2006, Xerox served its motion to dismiss theamended complaint and for sanctions. On August 2, 2006,the Court granted Xerox’s motion to dismiss and forsanctions. All claims asserted by National Union now havebeen dismissed. In accordance with the Court’sinstructions during the August 2, 2006 oral argument,
124
NOTES TO THE CONSOLIDATED FINANCIAL STATEMENTS
(Dollars in millions, except per-share data and unless otherwise indicated)
Xerox submitted an affidavit, sworn to on August 16,2006, specifying the precise amount of fees and sanctionsrequested by Xerox. On September 11, 2006, NationalUnion submitted an opposition to Xerox’s specific requestfor fees and sanctions and requested a hearing before theCourt. The Court has not scheduled a hearing on the feesissues, nor has it issued a decision.
Warren, et al. v. Xerox Corporation: On March 11,2004, the United States District Court for the EasternDistrict of New York entered an order certifying anationwide class of all black salespersons employed byXerox from February 1, 1997 to the present under TitleVII of the Civil Rights Act of 1964, as amended, and theCivil Rights Act of 1871. The suit was commenced onMay 9, 2001 by six black sales representatives. Theplaintiffs allege that Xerox has engaged in a pattern orpractice of race discrimination against them and otherblack sales representatives by assigning them to lessdesirable sales territories, denying them promotionalopportunities, and paying them less than their whitecounterparts. Although the complaint does not specify theamount of damages sought, plaintiffs do seek, on behalfof themselves and the classes they seek to represent, frontand back pay, compensatory and punitive damages, andattorneys’ fees. We deny any wrongdoing. Fact discoveryhas concluded and expert reports have been exchanged.Following three days of mediation with a privatemediator, a tentative settlement agreement was reached,the terms of which are not material to Xerox. OnMarch 16, 2007, the parties submitted the settlementagreement to the Court for preliminary approval. At astatus conference held on June 6, 2007, the judgeindicated that he would not approve the current version ofthe settlement agreement. He was concerned that thenamed plaintiffs may be receiving a disproportionateamount of damages as compared to the other classmembers. He has directed the parties to revise this aspectof the agreement and bring it back to him. If preliminaryapproval is obtained, the agreement will then be subjectto a fairness hearing at which any objections to theagreement shall be heard. If the Court still finds theagreement to be acceptable, it will give its final approvaland administration of the settlement shall commence.
Other Matters:
It is our policy to promptly and carefully investigate,often with the assistance of outside advisers, allegations
of impropriety that may come to our attention. If theallegations are substantiated, appropriate promptremedial action is taken. When and where appropriate, wereport such matters to the U.S. Department of Justice andto the SEC, and/or make public disclosure.
India: In recent years we became aware of anumber of matters at our Indian subsidiary, Xerox IndiaLtd. (formerly Xerox Modicorp Ltd.), that occurred over aperiod of several years, much of which occurred beforewe obtained majority ownership of these operations inmid 1999. These matters include misappropriations offunds and payments to other companies that may havebeen inaccurately recorded on the subsidiary’s booksand certain improper payments in connection with salesto government customers. These transactions were notmaterial to the Company’s financial statements. Wereported these transactions to the Indian authorities,the U.S. Department of Justice and to the SEC. Theprivate Indian investigator engaged by the IndianMinistry of Company Affairs has completed aninvestigation of these matters. In February 2005, theIndian Ministry of Company Affairs provided our Indiansubsidiary with the investigator’s report which addressesthe previously disclosed misappropriation of funds andimproper payments and requested comments. Thereport included allegations that Xerox India Ltd.’s seniorofficials and the Company were aware of such activities.The report also asserted the need for furtherinvestigation into potential criminal acts related to theimproper activities addressed by the report. The matteris now pending in the Indian Ministry of CompanyAffairs. The Company reported these developments andmade a copy of the report received by Xerox India Ltd.available to the U.S. Department of Justice and the SEC.
On November 17, 2005, Xerox filed its reply with theDCA (now called the “Ministry of Company Affairs” or“MCA”). Xerox sent copies of the Xerox Reply to the SECand DOJ in the United States. In our reply, we argue thatthe alleged violations of Indian Company Law by meansof alleged improper payments and alleged defaults/failures of the Xerox India Ltd. board of directors weregenerally unsubstantiated and without any basis in law.Further, we stated that the Report’s findings of otheralleged violations were unsubstantiated and unproven.The MCA will consider our Reply and will let us know theirconclusions. There is the possibility of fines or criminalpenalties if conclusive proof of wrongdoing is found. We
Xerox Annual Report 2007 125
NOTES TO THE CONSOLIDATED FINANCIAL STATEMENTS
(Dollars in millions, except per-share data and unless otherwise indicated)
have told the MCA that Xerox’s conduct in voluntarilydisclosing the initial information and readily and willinglysubmitting to investigation, coupled with thenon-availability of earlier records, warrants completeclosure and early settlement. In January 2006, we learnedthat the MCA has issued a “Show Cause Notice” to certainformer executives of Xerox India Ltd. seeking a responseto allegations of potential violations of the IndianCompanies Act. We also learned that Xerox India Ltd. hasreceived a formal Notice of Enquiry from the IndianMonopolies & Restrictive Trade Practices Commission(“MRTP Commission”) alleging that Xerox India Ltd.committed unfair trading practices arising from theevents described in the DCA investigator’s Report.Following a hearing on August 29, 2006, the MRTPCommission ordered a process with deadlines betweenXerox India Ltd. and the investigating officer for provisionof relevant documents to Xerox India Ltd., after whichXerox India Ltd. will have four weeks to file its reply. TheMRTP Commission scheduled a hearing for framing of theissues on January 9, 2007, but this hearing was delayed. Anew hearing was scheduled for January 29, 2007 forconsideration of Xerox India Ltd.’s motion for the MRTPCommission to direct the investigating officer to supply usthe relevant documents. At the hearing on January 29th,no additional documents were supplied to us. The MRTPCommission directed us to file our reply to the originalNotice of Enquiry within four weeks. At a hearing onApril 2, 2007, the investigating officer requested anothercopy of our reply for the purpose of filing a response. Anadditional period of four weeks to file this response wasgranted, and the next hearing date was set for May 15,2007 for further consideration and framing of issues. Thematter was heard on May 15, 2007, but the investigatingofficer sought additional time to file his response, which infact was filed on June 27, 2007. The Commissionrescheduled the matter for August 17, 2007 for furtherproceedings. At the hearing on August 17, 2007, counselfor Xerox India Ltd. argued that the Enquiry is notproperly maintainable under the Commission’sjurisdiction. The issue of maintainability of the Notice ofEnquiry has been framed as the preliminary issue and theCommission will decide this at the next hearing date,which has been rescheduled for March 2008. Our Indiansubsidiary plans to contest the Notice of Enquiry and hasbeen fully cooperating with the authorities.
Other contingencies
Guarantees, Indemnifications and WarrantyLiabilities: Guarantees and claims arise during theordinary course of business from relationships withsuppliers, customers and nonconsolidated affiliates whenthe Company undertakes an obligation to guarantee theperformance of others if specified triggering events occur.Nonperformance under a contract could trigger anobligation of the Company. These potential claims includeactions based upon alleged exposures to products, realestate, intellectual property such as patents,environmental matters, and other indemnifications. Theultimate effect on future financial results is not subject toreasonable estimation because considerable uncertaintyexists as to the final outcome of these claims. However,while the ultimate liabilities resulting from such claimsmay be significant to results of operations in the periodrecognized, management does not anticipate they willhave a material adverse effect on the Company’sconsolidated financial position or liquidity. As ofDecember 31, 2007, we have accrued our estimate ofliability incurred under our indemnification arrangementsand guarantees.
Indemnifications provided as part of contracts andagreements: We are a party to the following types ofagreements pursuant to which we may be obligated toindemnify the other party with respect to certain matters:• Contracts that we entered into for the sale or purchase
of businesses or real estate assets, under which wecustomarily agree to hold the other party harmlessagainst losses arising from a breach of representationsand covenants, including obligations to pay rent.Typically, these relate to such matters as adequatetitle to assets sold, intellectual property rights,specified environmental matters and certain incometaxes arising prior to the date of acquisition.
• Guarantees on behalf of our subsidiaries with respectto real estate leases. These lease guarantees mayremain in effect subsequent to the sale of thesubsidiary.
• Agreements to indemnify various service providers,trustees and bank agents from any third party claimsrelated to their performance on our behalf, with theexception of claims that result from third-party’s ownwillful misconduct or gross negligence.
126
NOTES TO THE CONSOLIDATED FINANCIAL STATEMENTS
(Dollars in millions, except per-share data and unless otherwise indicated)
• Guarantees of our performance in certain sales andservices contracts to our customers and indirectly theperformance of third parties with whom we havesubcontracted for their services. This includesindemnifications to customers for losses that may besustained as a result of the use of our equipment at acustomer’s location.
In each of these circumstances, our payment isconditioned on the other party making a claim pursuant tothe procedures specified in the particular contract, whichprocedures typically allow us to challenge the otherparty’s claims. In the case of lease guarantees, we maycontest the liabilities asserted under the lease. Further, ourobligations under these agreements and guarantees maybe limited in terms of time and/or amount, and in someinstances, we may have recourse against third parties forcertain payments we made.
Patent indemnifications: In most sales transactions toresellers of our products, we indemnify against possibleclaims of patent infringement caused by our products orsolutions. These indemnifications usually do not includelimits on the claims, provided the claim is made pursuantto the procedures required in the sales contract.
Indemnification of Officers and Directors: Ourcorporate by-laws require that, except to the extentexpressly prohibited by law, we must indemnify XeroxCorporation’s officers and directors against judgments,fines, penalties and amounts paid in settlement, includinglegal fees and all appeals, incurred in connection with civilor criminal action or proceedings, as it relates to theirservices to Xerox Corporation and our subsidiaries.
Although the by-laws provide no limit on the amount ofindemnification, we may have recourse against ourinsurance carriers for certain payments made by us.However, certain indemnification payments may not becovered under our directors’ and officers’ insurancecoverage. In addition, we indemnify certain fiduciaries ofour employee benefit plans for liabilities incurred in theirservice as fiduciary whether or not they are officers of theCompany.
Product Warranty Liabilities: In connection with ournormal sales of equipment, including those under sales-type leases, we generally do not issue product warranties.Our arrangements typically involve a separate full servicemaintenance agreement with the customer. Theagreements generally extend over a period equivalent tothe lease term or the expected useful life under a cashsale. The service agreements involve the payment of feesin return for our performance of repairs and maintenance.As a consequence, we do not have any significant productwarranty obligations including any obligations undercustomer satisfaction programs. In a few circumstances,particularly in certain cash sales, we may issue a limitedproduct warranty if negotiated by the customer. We alsoissue warranties for certain of our lower-end products inthe Office segment, where full service maintenanceagreements are not available. In these instances, werecord warranty obligations at the time of the sale.Aggregate product warranty liability expenses for thethree years ended of December 31, 2007 were $40, $43and $45, respectively. Total product warranty liabilities asof December 31, 2007 and 2006 were $26 and $22,respectively.
Note 17 – Shareholders’ Equity
Preferred Stock
As of December 31, 2007, we had no preferred stockshares or preferred stock purchase rights outstanding. Weare authorized to issue approximately 22 million shares ofcumulative preferred stock, $1.00 par value.
Series C Mandatory Convertible Preferred StockAutomatic Conversion: In 2006, all 9.2 million shares of6.25% Series C Mandatory Convertible Preferred Stockwere converted at a rate of 8.1301 shares of our commonstock, or 74.8 million common stock shares. The recorded
value of outstanding shares at the time of conversion was$889. The conversion occurred pursuant to the mandatoryautomatic conversion provisions set at original issuance ofthe Series C Preferred Stock. As a result of the automaticconversion, there are no remaining outstanding shares ofour Series C Mandatory Convertible Preferred Stock.
Common Stock
We have 1.75 billion authorized shares of commonstock, $1 par value. At December 31, 2007, 97 millionshares were reserved for issuance under our incentive
Xerox Annual Report 2007 127
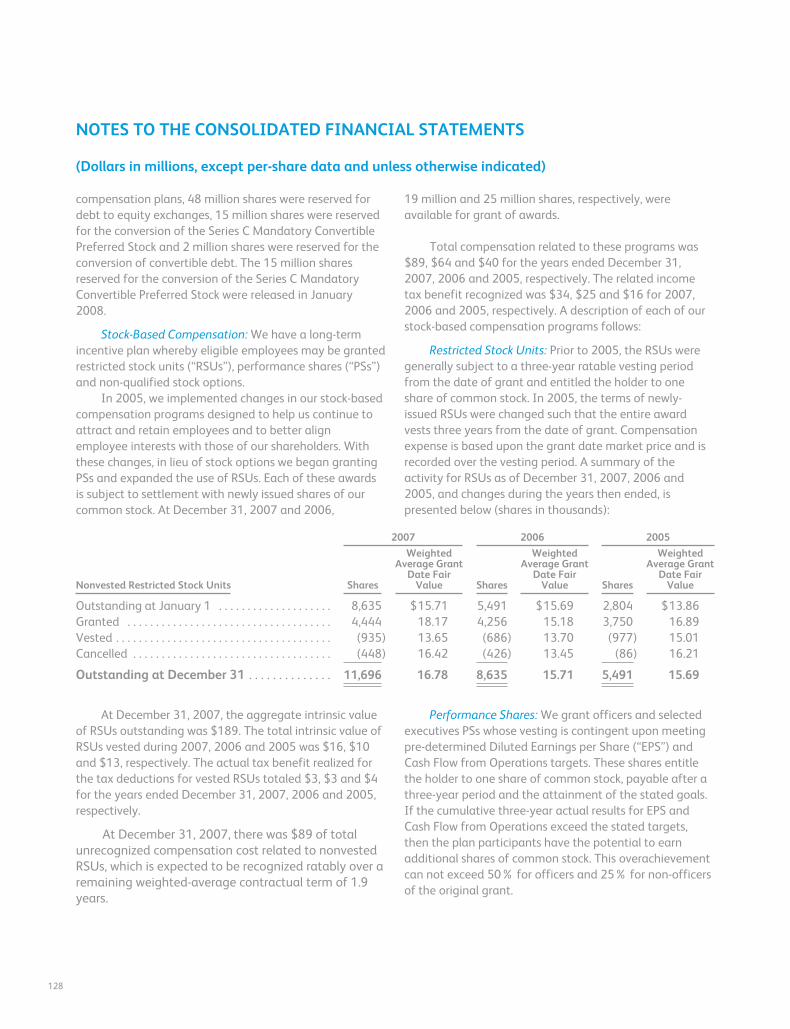
NOTES TO THE CONSOLIDATED FINANCIAL STATEMENTS
(Dollars in millions, except per-share data and unless otherwise indicated)
compensation plans, 48 million shares were reserved fordebt to equity exchanges, 15 million shares were reservedfor the conversion of the Series C Mandatory ConvertiblePreferred Stock and 2 million shares were reserved for theconversion of convertible debt. The 15 million sharesreserved for the conversion of the Series C MandatoryConvertible Preferred Stock were released in January2008.
Stock-Based Compensation: We have a long-termincentive plan whereby eligible employees may be grantedrestricted stock units (“RSUs”), performance shares (“PSs”)and non-qualified stock options.
In 2005, we implemented changes in our stock-basedcompensation programs designed to help us continue toattract and retain employees and to better alignemployee interests with those of our shareholders. Withthese changes, in lieu of stock options we began grantingPSs and expanded the use of RSUs. Each of these awardsis subject to settlement with newly issued shares of ourcommon stock. At December 31, 2007 and 2006,
19 million and 25 million shares, respectively, wereavailable for grant of awards.
Total compensation related to these programs was$89, $64 and $40 for the years ended December 31,2007, 2006 and 2005, respectively. The related incometax benefit recognized was $34, $25 and $16 for 2007,2006 and 2005, respectively. A description of each of ourstock-based compensation programs follows:
Restricted Stock Units: Prior to 2005, the RSUs weregenerally subject to a three-year ratable vesting periodfrom the date of grant and entitled the holder to oneshare of common stock. In 2005, the terms of newly-issued RSUs were changed such that the entire awardvests three years from the date of grant. Compensationexpense is based upon the grant date market price and isrecorded over the vesting period. A summary of theactivity for RSUs as of December 31, 2007, 2006 and2005, and changes during the years then ended, ispresented below (shares in thousands):
2007 2006 2005
Nonvested Restricted Stock Units Shares
WeightedAverage Grant
Date FairValue Shares
WeightedAverage Grant
Date FairValue Shares
WeightedAverage Grant
Date FairValue
Outstanding at January 1 . . . . . . . . . . . . . . . . . . . . 8,635 $15.71 5,491 $15.69 2,804 $13.86Granted . . . . . . . . . . . . . . . . . . . . . . . . . . . . . . . . . . . . 4,444 18.17 4,256 15.18 3,750 16.89Vested . . . . . . . . . . . . . . . . . . . . . . . . . . . . . . . . . . . . . . (935) 13.65 (686) 13.70 (977) 15.01Cancelled . . . . . . . . . . . . . . . . . . . . . . . . . . . . . . . . . . . (448) 16.42 (426) 13.45 (86) 16.21
Outstanding at December 31 . . . . . . . . . . . . . . 11,696 16.78 8,635 15.71 5,491 15.69
At December 31, 2007, the aggregate intrinsic valueof RSUs outstanding was $189. The total intrinsic value ofRSUs vested during 2007, 2006 and 2005 was $16, $10and $13, respectively. The actual tax benefit realized forthe tax deductions for vested RSUs totaled $3, $3 and $4for the years ended December 31, 2007, 2006 and 2005,respectively.
At December 31, 2007, there was $89 of totalunrecognized compensation cost related to nonvestedRSUs, which is expected to be recognized ratably over aremaining weighted-average contractual term of 1.9years.
Performance Shares: We grant officers and selectedexecutives PSs whose vesting is contingent upon meetingpre-determined Diluted Earnings per Share (“EPS”) andCash Flow from Operations targets. These shares entitlethe holder to one share of common stock, payable after athree-year period and the attainment of the stated goals.If the cumulative three-year actual results for EPS andCash Flow from Operations exceed the stated targets,then the plan participants have the potential to earnadditional shares of common stock. This overachievementcan not exceed 50% for officers and 25% for non-officersof the original grant.
128
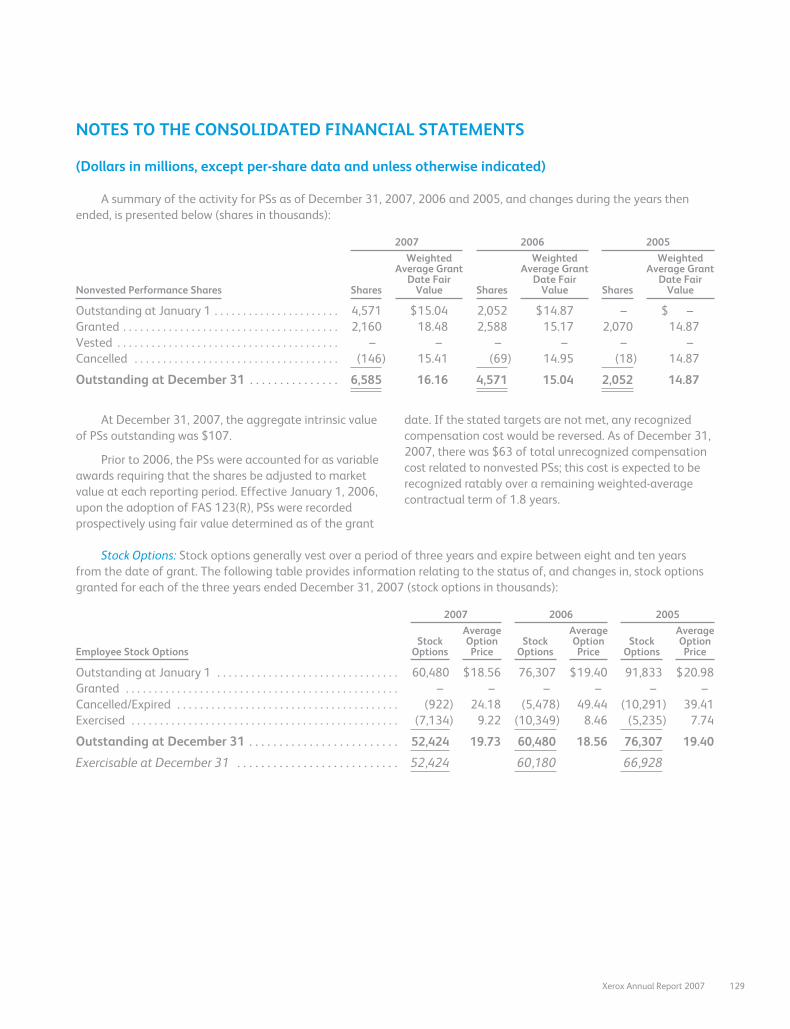
NOTES TO THE CONSOLIDATED FINANCIAL STATEMENTS
(Dollars in millions, except per-share data and unless otherwise indicated)
A summary of the activity for PSs as of December 31, 2007, 2006 and 2005, and changes during the years thenended, is presented below (shares in thousands):
2007 2006 2005
Nonvested Performance Shares Shares
WeightedAverage Grant
Date FairValue Shares
WeightedAverage Grant
Date FairValue Shares
WeightedAverage Grant
Date FairValue
Outstanding at January 1 . . . . . . . . . . . . . . . . . . . . . . 4,571 $15.04 2,052 $14.87 – $ –Granted . . . . . . . . . . . . . . . . . . . . . . . . . . . . . . . . . . . . . . 2,160 18.48 2,588 15.17 2,070 14.87Vested . . . . . . . . . . . . . . . . . . . . . . . . . . . . . . . . . . . . . . . – – – – – –Cancelled . . . . . . . . . . . . . . . . . . . . . . . . . . . . . . . . . . . . (146) 15.41 (69) 14.95 (18) 14.87
Outstanding at December 31 . . . . . . . . . . . . . . . 6,585 16.16 4,571 15.04 2,052 14.87
At December 31, 2007, the aggregate intrinsic valueof PSs outstanding was $107.
Prior to 2006, the PSs were accounted for as variableawards requiring that the shares be adjusted to marketvalue at each reporting period. Effective January 1, 2006,upon the adoption of FAS 123(R), PSs were recordedprospectively using fair value determined as of the grant
date. If the stated targets are not met, any recognizedcompensation cost would be reversed. As of December 31,2007, there was $63 of total unrecognized compensationcost related to nonvested PSs; this cost is expected to berecognized ratably over a remaining weighted-averagecontractual term of 1.8 years.
Stock Options: Stock options generally vest over a period of three years and expire between eight and ten yearsfrom the date of grant. The following table provides information relating to the status of, and changes in, stock optionsgranted for each of the three years ended December 31, 2007 (stock options in thousands):
2007 2006 2005
Employee Stock OptionsStock
Options
AverageOptionPrice
StockOptions
AverageOptionPrice
StockOptions
AverageOptionPrice
Outstanding at January 1 . . . . . . . . . . . . . . . . . . . . . . . . . . . . . . . . 60,480 $18.56 76,307 $19.40 91,833 $20.98Granted . . . . . . . . . . . . . . . . . . . . . . . . . . . . . . . . . . . . . . . . . . . . . . . . – – – – – –Cancelled/Expired . . . . . . . . . . . . . . . . . . . . . . . . . . . . . . . . . . . . . . . (922) 24.18 (5,478) 49.44 (10,291) 39.41Exercised . . . . . . . . . . . . . . . . . . . . . . . . . . . . . . . . . . . . . . . . . . . . . . . (7,134) 9.22 (10,349) 8.46 (5,235) 7.74
Outstanding at December 31 . . . . . . . . . . . . . . . . . . . . . . . . . 52,424 19.73 60,480 18.56 76,307 19.40
Exercisable at December 31 . . . . . . . . . . . . . . . . . . . . . . . . . . . 52,424 60,180 66,928
Xerox Annual Report 2007 129
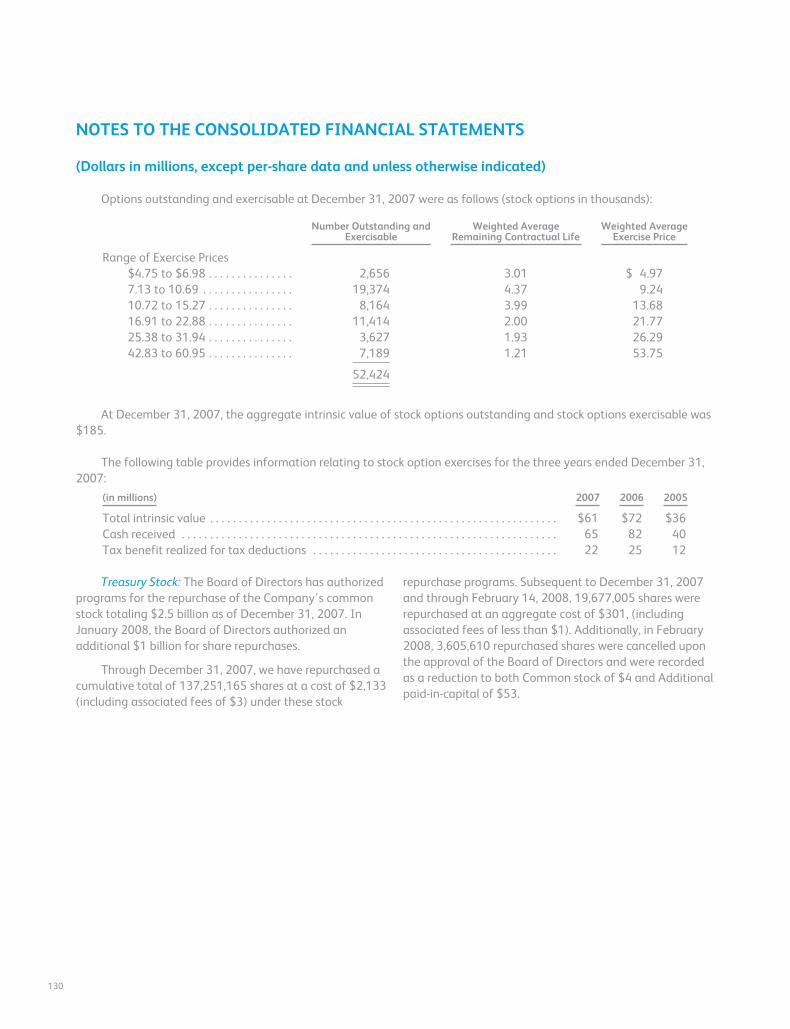
NOTES TO THE CONSOLIDATED FINANCIAL STATEMENTS
(Dollars in millions, except per-share data and unless otherwise indicated)
Options outstanding and exercisable at December 31, 2007 were as follows (stock options in thousands):
Number Outstanding andExercisable
Weighted AverageRemaining Contractual Life
Weighted AverageExercise Price
Range of Exercise Prices$4.75 to $6.98 . . . . . . . . . . . . . . . 2,656 3.01 $ 4.977.13 to 10.69 . . . . . . . . . . . . . . . . 19,374 4.37 9.2410.72 to 15.27 . . . . . . . . . . . . . . . 8,164 3.99 13.6816.91 to 22.88 . . . . . . . . . . . . . . . 11,414 2.00 21.7725.38 to 31.94 . . . . . . . . . . . . . . . 3,627 1.93 26.2942.83 to 60.95 . . . . . . . . . . . . . . . 7,189 1.21 53.75
52,424
At December 31, 2007, the aggregate intrinsic value of stock options outstanding and stock options exercisable was$185.
The following table provides information relating to stock option exercises for the three years ended December 31,2007:
(in millions) 2007 2006 2005
Total intrinsic value . . . . . . . . . . . . . . . . . . . . . . . . . . . . . . . . . . . . . . . . . . . . . . . . . . . . . . . . . . . . . $61 $72 $36Cash received . . . . . . . . . . . . . . . . . . . . . . . . . . . . . . . . . . . . . . . . . . . . . . . . . . . . . . . . . . . . . . . . . . 65 82 40Tax benefit realized for tax deductions . . . . . . . . . . . . . . . . . . . . . . . . . . . . . . . . . . . . . . . . . . . 22 25 12
Treasury Stock: The Board of Directors has authorizedprograms for the repurchase of the Company’s commonstock totaling $2.5 billion as of December 31, 2007. InJanuary 2008, the Board of Directors authorized anadditional $1 billion for share repurchases.
Through December 31, 2007, we have repurchased acumulative total of 137,251,165 shares at a cost of $2,133(including associated fees of $3) under these stock
repurchase programs. Subsequent to December 31, 2007and through February 14, 2008, 19,677,005 shares wererepurchased at an aggregate cost of $301, (includingassociated fees of less than $1). Additionally, in February2008, 3,605,610 repurchased shares were cancelled uponthe approval of the Board of Directors and were recordedas a reduction to both Common stock of $4 and Additionalpaid-in-capital of $53.
130
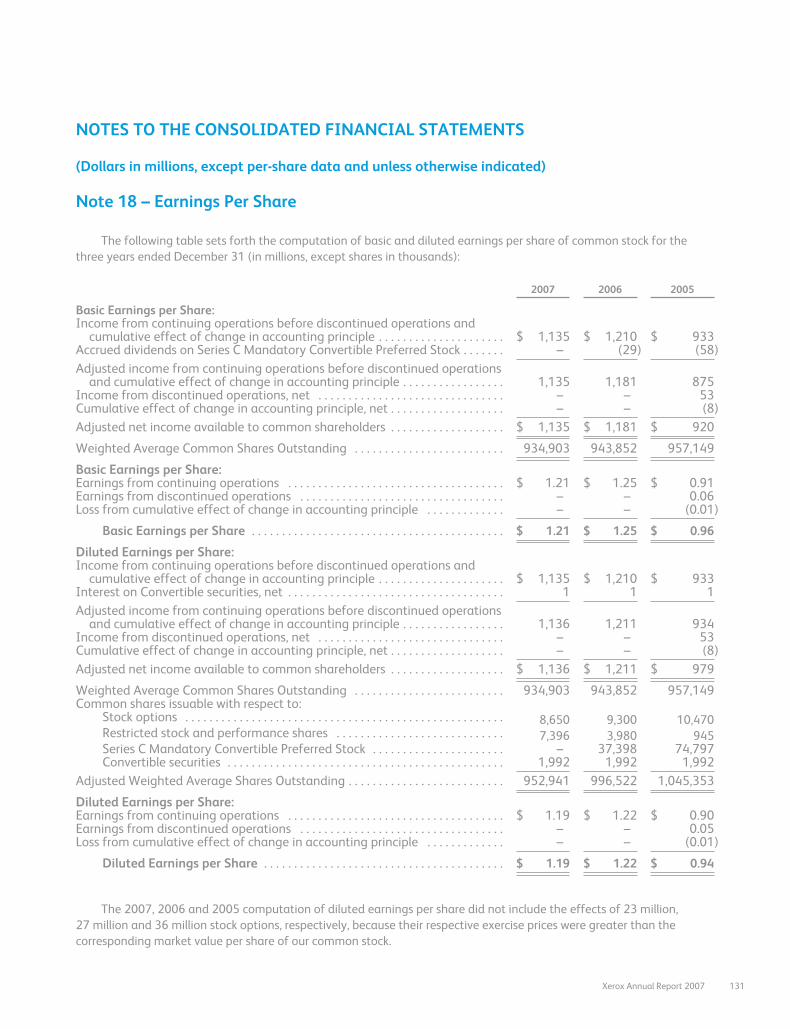
NOTES TO THE CONSOLIDATED FINANCIAL STATEMENTS
(Dollars in millions, except per-share data and unless otherwise indicated)
Note 18 – Earnings Per Share
The following table sets forth the computation of basic and diluted earnings per share of common stock for thethree years ended December 31 (in millions, except shares in thousands):
2007 2006 2005
Basic Earnings per Share:Income from continuing operations before discontinued operations and
cumulative effect of change in accounting principle . . . . . . . . . . . . . . . . . . . . . $ 1,135 $ 1,210 $ 933Accrued dividends on Series C Mandatory Convertible Preferred Stock . . . . . . . – (29) (58)Adjusted income from continuing operations before discontinued operations
and cumulative effect of change in accounting principle . . . . . . . . . . . . . . . . . 1,135 1,181 875Income from discontinued operations, net . . . . . . . . . . . . . . . . . . . . . . . . . . . . . . . – – 53Cumulative effect of change in accounting principle, net . . . . . . . . . . . . . . . . . . . – – (8)Adjusted net income available to common shareholders . . . . . . . . . . . . . . . . . . . $ 1,135 $ 1,181 $ 920
Weighted Average Common Shares Outstanding . . . . . . . . . . . . . . . . . . . . . . . . . 934,903 943,852 957,149
Basic Earnings per Share:Earnings from continuing operations . . . . . . . . . . . . . . . . . . . . . . . . . . . . . . . . . . . . $ 1.21 $ 1.25 $ 0.91Earnings from discontinued operations . . . . . . . . . . . . . . . . . . . . . . . . . . . . . . . . . . – – 0.06Loss from cumulative effect of change in accounting principle . . . . . . . . . . . . . – – (0.01)
Basic Earnings per Share . . . . . . . . . . . . . . . . . . . . . . . . . . . . . . . . . . . . . . . . . . $ 1.21 $ 1.25 $ 0.96
Diluted Earnings per Share:Income from continuing operations before discontinued operations and
cumulative effect of change in accounting principle . . . . . . . . . . . . . . . . . . . . . $ 1,135 $ 1,210 $ 933Interest on Convertible securities, net . . . . . . . . . . . . . . . . . . . . . . . . . . . . . . . . . . . . 1 1 1Adjusted income from continuing operations before discontinued operations
and cumulative effect of change in accounting principle . . . . . . . . . . . . . . . . . 1,136 1,211 934Income from discontinued operations, net . . . . . . . . . . . . . . . . . . . . . . . . . . . . . . . – – 53Cumulative effect of change in accounting principle, net . . . . . . . . . . . . . . . . . . . – – (8)Adjusted net income available to common shareholders . . . . . . . . . . . . . . . . . . . $ 1,136 $ 1,211 $ 979
Weighted Average Common Shares Outstanding . . . . . . . . . . . . . . . . . . . . . . . . . 934,903 943,852 957,149Common shares issuable with respect to:
Stock options . . . . . . . . . . . . . . . . . . . . . . . . . . . . . . . . . . . . . . . . . . . . . . . . . . . . . 8,650 9,300 10,470Restricted stock and performance shares . . . . . . . . . . . . . . . . . . . . . . . . . . . . 7,396 3,980 945Series C Mandatory Convertible Preferred Stock . . . . . . . . . . . . . . . . . . . . . . – 37,398 74,797Convertible securities . . . . . . . . . . . . . . . . . . . . . . . . . . . . . . . . . . . . . . . . . . . . . . 1,992 1,992 1,992
Adjusted Weighted Average Shares Outstanding . . . . . . . . . . . . . . . . . . . . . . . . . . 952,941 996,522 1,045,353
Diluted Earnings per Share:Earnings from continuing operations . . . . . . . . . . . . . . . . . . . . . . . . . . . . . . . . . . . . $ 1.19 $ 1.22 $ 0.90Earnings from discontinued operations . . . . . . . . . . . . . . . . . . . . . . . . . . . . . . . . . . – – 0.05Loss from cumulative effect of change in accounting principle . . . . . . . . . . . . . – – (0.01)
Diluted Earnings per Share . . . . . . . . . . . . . . . . . . . . . . . . . . . . . . . . . . . . . . . . $ 1.19 $ 1.22 $ 0.94
The 2007, 2006 and 2005 computation of diluted earnings per share did not include the effects of 23 million,27 million and 36 million stock options, respectively, because their respective exercise prices were greater than thecorresponding market value per share of our common stock.
Xerox Annual Report 2007 131
NOTES TO THE CONSOLIDATED FINANCIAL STATEMENTS
(Dollars in millions, except per-share data and unless otherwise indicated)
Note 19 – Divestitures and Other Sales
During the three years ended December 31, 2007, thefollowing significant divestitures occurred:
Ridge Re: In March 2006, Ridge Re, a wholly ownedsubsidiary included in our net investment in discontinuedoperations (within Other long-term assets), completed anagreement to transfer its obligations under its remainingreinsurance agreement, together with related investmentsheld in trust, to another insurance company as part of acomplete exit from this business. As a result of thistransaction, the remaining investments held by Ridge Rewere sold and the excess cash held by Ridge Re of $119,after the payment of its remaining liabilities, wasdistributed back to the Company as part of a plan ofliquidation. This amount is presented within investingactivities in the Consolidated Statements of Cash Flows.
Integic: In March 2005, we completed the sale of ourentire equity interest in Integic Corporation (“Integic”) for$96 in cash, net of transaction costs. The sale resulted in apre-tax gain of $93. Prior to this transaction, ourinvestment in Integic was accounted for using the equitymethod and was included in Investments in affiliates, atequity within our Consolidated Balance Sheets. Thepre-tax gain is classified within Other (income) expenses,net in the accompanying Consolidated Statements ofIncome. In May 2006, we recognized an additional pre-taxgain of $10 on this sale from the receipt of additionalproceeds from escrow. The proceeds were placed in escrowupon the sale of Integic pending completion of anindemnification period.
REPORTS OF MANAGEMENT
Management’s Responsibility for Financial StatementsOur management is responsible for the integrity andobjectivity of all information presented in this annualreport. The consolidated financial statements wereprepared in conformity with accounting principlesgenerally accepted in the United States of America andinclude amounts based on management’s best estimatesand judgments. Management believes the consolidatedfinancial statements fairly reflect the form and substanceof transactions and that the financial statements fairlyrepresent the Company’s financial position and results ofoperations.
The Audit Committee of the Board of Directors, whichis composed solely of independent directors, meetsregularly with the independent auditors,PricewaterhouseCoopers LLP, the internal auditors andrepresentatives of management to review accounting,financial reporting, internal control and audit matters, aswell as the nature and extent of the audit effort. The AuditCommittee is responsible for the engagement of theindependent auditors. The independent auditors andinternal auditors have free access to the Audit Committee.
Management’s Report on Internal Control Over Financial ReportingOur management is responsible for establishing andmaintaining adequate internal control over financialreporting, as such term is defined in the rules promulgatedunder the Securities Exchange Act of 1934. Under thesupervision and with the participation of ourmanagement, including our principal executive, financialand accounting officers, we have conducted an evaluation
of the effectiveness of our internal control over financialreporting based on the framework in “Internal Control –Integrated Framework” issued by the Committee ofSponsoring Organizations of the Treadway Commission.
Based on the above evaluation, management hasconcluded that our internal control over financial reportingwas effective as of December 31, 2007.
Anne M. MulcahyChief Executive Officer
Lawrence A. ZimmermanChief Financial Officer
Gary R. KabureckChief Accounting Officer
132
REPORT OF INDEPENDENT REGISTEREDPUBLIC ACCOUNTING FIRM
To the Board of Directors and Shareholders of XeroxCorporation:
In our opinion, the accompanying consolidatedbalance sheets and the related consolidated statementsof income, cash flows and common shareholders’ equitypresent fairly, in all material respects, the financialposition of Xerox Corporation and its subsidiaries atDecember 31, 2007 and 2006, and the results of theiroperations and their cash flows for each of the three yearsin the period ended December 31, 2007 in conformitywith accounting principles generally accepted in theUnited States of America. Also, in our opinion, theCompany maintained, in all material respects, effectiveinternal control over financial reporting as ofDecember 31, 2007, based on criteria established inInternal Control – Integrated Framework issued by theCommittee of Sponsoring Organizations of the TreadwayCommission (COSO). The Company’s management isresponsible for these financial statements, for maintainingeffective control over financial reporting and for itsassessment of the effectiveness of internal control overfinancial reporting, included in the accompanyingManagement’s Report on Internal Control Over FinancialReporting. Our responsibility is to express opinions onthese financial statements and on the Company’s internalcontrol over financial reporting based on our integratedaudits. We conducted our audits in accordance with thestandards of the Public Company Accounting OversightBoard (United States). Those standards require that weplan and perform the audits to obtain reasonableassurance about whether the financial statements are freeof material misstatement and whether effective internalcontrol over financial reporting was maintained in allmaterial respects. Our audits of the financial statementsincluded examining, on a test basis, evidence supportingthe amounts and disclosures in the financial statements,assessing the accounting principles used and significantestimates made by management, and evaluating theoverall financial statement presentation.
Our audit of internal control over financial reportingincluded obtaining an understanding of internal controlover financial reporting, assessing the risk that a materialweakness exists, and testing and evaluating the designand operating effectiveness of internal control based onthe assessed risk. Our audits also included performing suchother procedures as we considered necessary in thecircumstances. We believe that our audits provide areasonable basis for our opinions.
As discussed in Note 1, the Company adopted therecognition and disclosure provisions of Statement ofFinancial Accounting Standards No. 158, “Employers’Accounting for Defined Benefit Pension and OtherPostretirement Plans, an amendment of FASB StatementsNo. 87, 88, 106 and 132(R)” as of December 31, 2006.
A company’s internal control over financial reportingis a process designed to provide reasonable assuranceregarding the reliability of financial reporting and thepreparation of financial statements for external purposesin accordance with generally accepted accountingprinciples. A company’s internal control over financialreporting includes those policies and procedures that(i) pertain to the maintenance of records that, inreasonable detail, accurately and fairly reflect thetransactions and dispositions of the assets of thecompany; (ii) provide reasonable assurance thattransactions are recorded as necessary to permitpreparation of financial statements in accordance withgenerally accepted accounting principles, and thatreceipts and expenditures of the company are being madeonly in accordance with authorizations of managementand directors of the company; and (iii) provide reasonableassurance regarding prevention or timely detection ofunauthorized acquisition, use, or disposition of thecompany’s assets that could have a material effect on thefinancial statements.
Because of its inherent limitations, internal controlover financial reporting may not prevent or detectmisstatements. Also, projections of any evaluation ofeffectiveness to future periods are subject to the risk thatcontrols may become inadequate because of changes inconditions, or that the degree of compliance with thepolicies or procedures may deteriorate.
PricewaterhouseCoopers LLPStamford, ConnecticutFebruary 15, 2008
Xerox Annual Report 2007 133
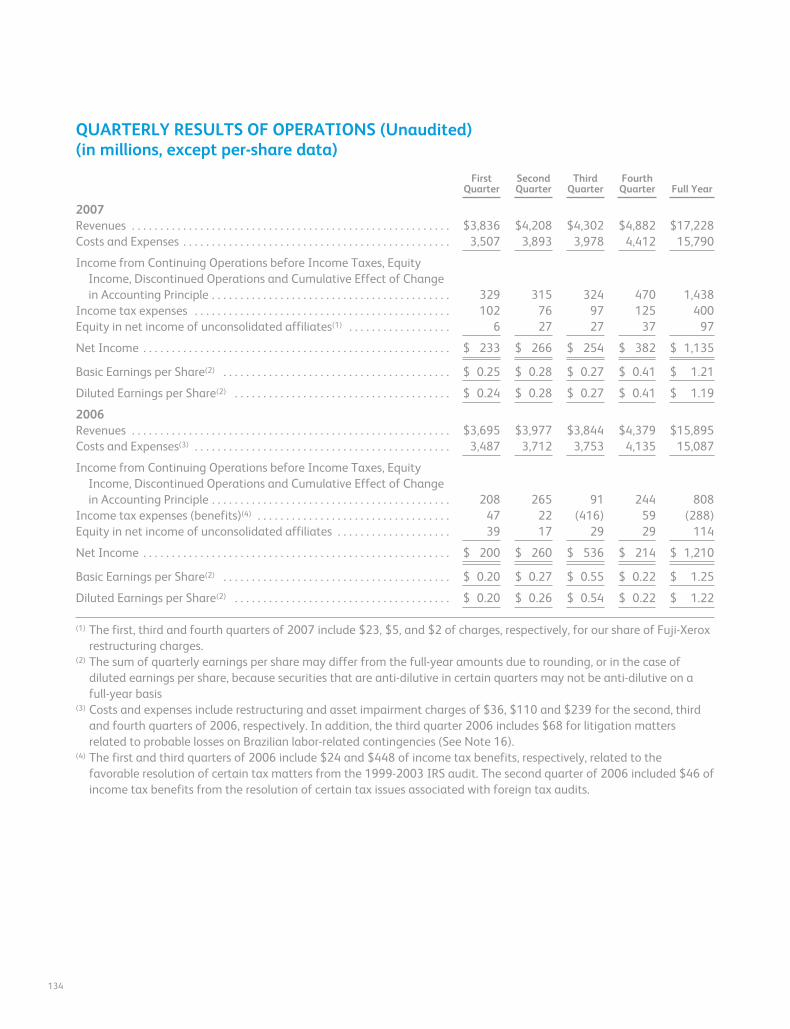
QUARTERLY RESULTS OF OPERATIONS (Unaudited)(in millions, except per-share data)
FirstQuarter
SecondQuarter
ThirdQuarter
FourthQuarter Full Year
2007Revenues . . . . . . . . . . . . . . . . . . . . . . . . . . . . . . . . . . . . . . . . . . . . . . . . . . . . . . . . $3,836 $4,208 $4,302 $4,882 $17,228Costs and Expenses . . . . . . . . . . . . . . . . . . . . . . . . . . . . . . . . . . . . . . . . . . . . . . . 3,507 3,893 3,978 4,412 15,790
Income from Continuing Operations before Income Taxes, EquityIncome, Discontinued Operations and Cumulative Effect of Changein Accounting Principle . . . . . . . . . . . . . . . . . . . . . . . . . . . . . . . . . . . . . . . . . . 329 315 324 470 1,438
Income tax expenses . . . . . . . . . . . . . . . . . . . . . . . . . . . . . . . . . . . . . . . . . . . . . 102 76 97 125 400Equity in net income of unconsolidated affiliates(1) . . . . . . . . . . . . . . . . . . 6 27 27 37 97
Net Income . . . . . . . . . . . . . . . . . . . . . . . . . . . . . . . . . . . . . . . . . . . . . . . . . . . . . . $ 233 $ 266 $ 254 $ 382 $ 1,135
Basic Earnings per Share(2) . . . . . . . . . . . . . . . . . . . . . . . . . . . . . . . . . . . . . . . . $ 0.25 $ 0.28 $ 0.27 $ 0.41 $ 1.21
Diluted Earnings per Share(2) . . . . . . . . . . . . . . . . . . . . . . . . . . . . . . . . . . . . . . $ 0.24 $ 0.28 $ 0.27 $ 0.41 $ 1.19
2006Revenues . . . . . . . . . . . . . . . . . . . . . . . . . . . . . . . . . . . . . . . . . . . . . . . . . . . . . . . . $3,695 $3,977 $3,844 $4,379 $15,895Costs and Expenses(3) . . . . . . . . . . . . . . . . . . . . . . . . . . . . . . . . . . . . . . . . . . . . . 3,487 3,712 3,753 4,135 15,087
Income from Continuing Operations before Income Taxes, EquityIncome, Discontinued Operations and Cumulative Effect of Changein Accounting Principle . . . . . . . . . . . . . . . . . . . . . . . . . . . . . . . . . . . . . . . . . . 208 265 91 244 808
Income tax expenses (benefits)(4) . . . . . . . . . . . . . . . . . . . . . . . . . . . . . . . . . . 47 22 (416) 59 (288)Equity in net income of unconsolidated affiliates . . . . . . . . . . . . . . . . . . . . 39 17 29 29 114
Net Income . . . . . . . . . . . . . . . . . . . . . . . . . . . . . . . . . . . . . . . . . . . . . . . . . . . . . . $ 200 $ 260 $ 536 $ 214 $ 1,210
Basic Earnings per Share(2) . . . . . . . . . . . . . . . . . . . . . . . . . . . . . . . . . . . . . . . . $ 0.20 $ 0.27 $ 0.55 $ 0.22 $ 1.25
Diluted Earnings per Share(2) . . . . . . . . . . . . . . . . . . . . . . . . . . . . . . . . . . . . . . $ 0.20 $ 0.26 $ 0.54 $ 0.22 $ 1.22
(1) The first, third and fourth quarters of 2007 include $23, $5, and $2 of charges, respectively, for our share of Fuji-Xeroxrestructuring charges.
(2) The sum of quarterly earnings per share may differ from the full-year amounts due to rounding, or in the case ofdiluted earnings per share, because securities that are anti-dilutive in certain quarters may not be anti-dilutive on afull-year basis
(3) Costs and expenses include restructuring and asset impairment charges of $36, $110 and $239 for the second, thirdand fourth quarters of 2006, respectively. In addition, the third quarter 2006 includes $68 for litigation mattersrelated to probable losses on Brazilian labor-related contingencies (See Note 16).
(4) The first and third quarters of 2006 include $24 and $448 of income tax benefits, respectively, related to thefavorable resolution of certain tax matters from the 1999-2003 IRS audit. The second quarter of 2006 included $46 ofincome tax benefits from the resolution of certain tax issues associated with foreign tax audits.
134
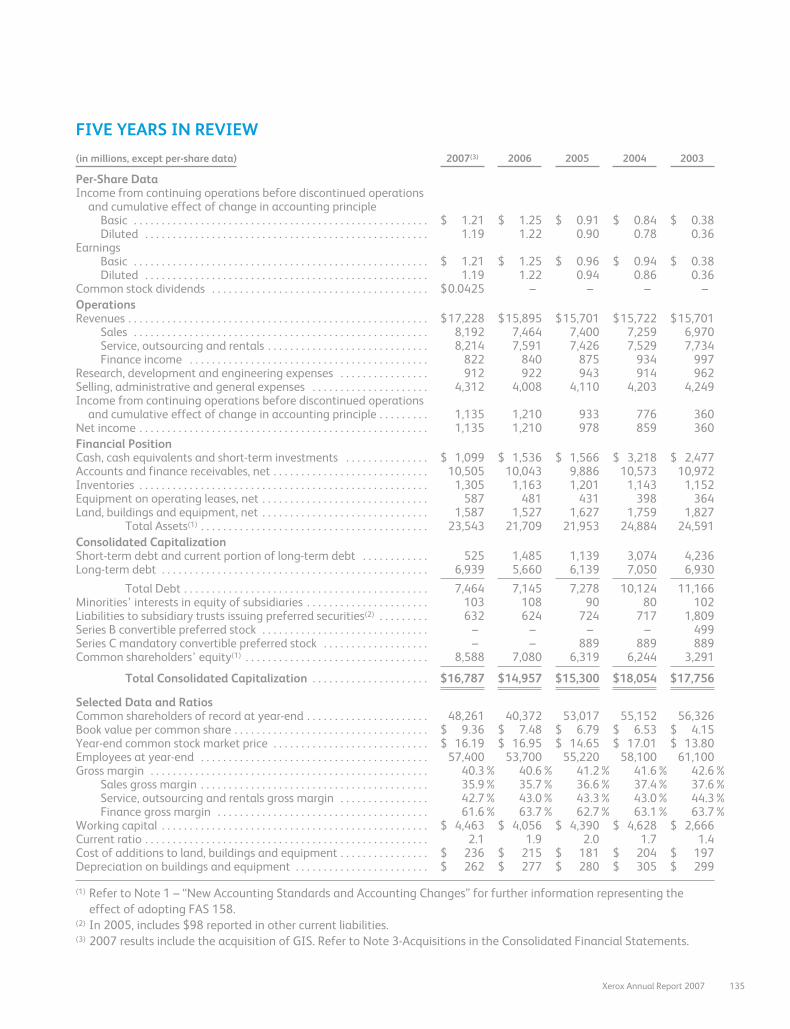
FIVE YEARS IN REVIEW
(in millions, except per-share data) 2007(3) 2006 2005 2004 2003
Per-Share DataIncome from continuing operations before discontinued operations
and cumulative effect of change in accounting principleBasic . . . . . . . . . . . . . . . . . . . . . . . . . . . . . . . . . . . . . . . . . . . . . . . . . . . . . $ 1.21 $ 1.25 $ 0.91 $ 0.84 $ 0.38Diluted . . . . . . . . . . . . . . . . . . . . . . . . . . . . . . . . . . . . . . . . . . . . . . . . . . . 1.19 1.22 0.90 0.78 0.36
EarningsBasic . . . . . . . . . . . . . . . . . . . . . . . . . . . . . . . . . . . . . . . . . . . . . . . . . . . . . $ 1.21 $ 1.25 $ 0.96 $ 0.94 $ 0.38Diluted . . . . . . . . . . . . . . . . . . . . . . . . . . . . . . . . . . . . . . . . . . . . . . . . . . . 1.19 1.22 0.94 0.86 0.36
Common stock dividends . . . . . . . . . . . . . . . . . . . . . . . . . . . . . . . . . . . . . . . $0.0425 – – – –OperationsRevenues . . . . . . . . . . . . . . . . . . . . . . . . . . . . . . . . . . . . . . . . . . . . . . . . . . . . . . $17,228 $15,895 $15,701 $15,722 $15,701
Sales . . . . . . . . . . . . . . . . . . . . . . . . . . . . . . . . . . . . . . . . . . . . . . . . . . . . . 8,192 7,464 7,400 7,259 6,970Service, outsourcing and rentals . . . . . . . . . . . . . . . . . . . . . . . . . . . . . 8,214 7,591 7,426 7,529 7,734Finance income . . . . . . . . . . . . . . . . . . . . . . . . . . . . . . . . . . . . . . . . . . . 822 840 875 934 997
Research, development and engineering expenses . . . . . . . . . . . . . . . . 912 922 943 914 962Selling, administrative and general expenses . . . . . . . . . . . . . . . . . . . . . 4,312 4,008 4,110 4,203 4,249Income from continuing operations before discontinued operations
and cumulative effect of change in accounting principle . . . . . . . . . 1,135 1,210 933 776 360Net income . . . . . . . . . . . . . . . . . . . . . . . . . . . . . . . . . . . . . . . . . . . . . . . . . . . . 1,135 1,210 978 859 360Financial PositionCash, cash equivalents and short-term investments . . . . . . . . . . . . . . . $ 1,099 $ 1,536 $ 1,566 $ 3,218 $ 2,477Accounts and finance receivables, net . . . . . . . . . . . . . . . . . . . . . . . . . . . . 10,505 10,043 9,886 10,573 10,972Inventories . . . . . . . . . . . . . . . . . . . . . . . . . . . . . . . . . . . . . . . . . . . . . . . . . . . . 1,305 1,163 1,201 1,143 1,152Equipment on operating leases, net . . . . . . . . . . . . . . . . . . . . . . . . . . . . . . 587 481 431 398 364Land, buildings and equipment, net . . . . . . . . . . . . . . . . . . . . . . . . . . . . . . 1,587 1,527 1,627 1,759 1,827
Total Assets(1) . . . . . . . . . . . . . . . . . . . . . . . . . . . . . . . . . . . . . . . . . 23,543 21,709 21,953 24,884 24,591Consolidated CapitalizationShort-term debt and current portion of long-term debt . . . . . . . . . . . . 525 1,485 1,139 3,074 4,236Long-term debt . . . . . . . . . . . . . . . . . . . . . . . . . . . . . . . . . . . . . . . . . . . . . . . . 6,939 5,660 6,139 7,050 6,930
Total Debt . . . . . . . . . . . . . . . . . . . . . . . . . . . . . . . . . . . . . . . . . . . . 7,464 7,145 7,278 10,124 11,166Minorities’ interests in equity of subsidiaries . . . . . . . . . . . . . . . . . . . . . . 103 108 90 80 102Liabilities to subsidiary trusts issuing preferred securities(2) . . . . . . . . . 632 624 724 717 1,809Series B convertible preferred stock . . . . . . . . . . . . . . . . . . . . . . . . . . . . . . – – – – 499Series C mandatory convertible preferred stock . . . . . . . . . . . . . . . . . . . – – 889 889 889Common shareholders’ equity(1) . . . . . . . . . . . . . . . . . . . . . . . . . . . . . . . . . 8,588 7,080 6,319 6,244 3,291
Total Consolidated Capitalization . . . . . . . . . . . . . . . . . . . . . $16,787 $14,957 $15,300 $18,054 $17,756
Selected Data and RatiosCommon shareholders of record at year-end . . . . . . . . . . . . . . . . . . . . . . 48,261 40,372 53,017 55,152 56,326Book value per common share . . . . . . . . . . . . . . . . . . . . . . . . . . . . . . . . . . . $ 9.36 $ 7.48 $ 6.79 $ 6.53 $ 4.15Year-end common stock market price . . . . . . . . . . . . . . . . . . . . . . . . . . . . $ 16.19 $ 16.95 $ 14.65 $ 17.01 $ 13.80Employees at year-end . . . . . . . . . . . . . . . . . . . . . . . . . . . . . . . . . . . . . . . . . 57,400 53,700 55,220 58,100 61,100Gross margin . . . . . . . . . . . . . . . . . . . . . . . . . . . . . . . . . . . . . . . . . . . . . . . . . . 40.3% 40.6% 41.2% 41.6% 42.6%
Sales gross margin . . . . . . . . . . . . . . . . . . . . . . . . . . . . . . . . . . . . . . . . . 35.9% 35.7% 36.6% 37.4% 37.6%Service, outsourcing and rentals gross margin . . . . . . . . . . . . . . . . 42.7% 43.0% 43.3% 43.0% 44.3%Finance gross margin . . . . . . . . . . . . . . . . . . . . . . . . . . . . . . . . . . . . . . 61.6% 63.7% 62.7% 63.1% 63.7%
Working capital . . . . . . . . . . . . . . . . . . . . . . . . . . . . . . . . . . . . . . . . . . . . . . . . $ 4,463 $ 4,056 $ 4,390 $ 4,628 $ 2,666Current ratio . . . . . . . . . . . . . . . . . . . . . . . . . . . . . . . . . . . . . . . . . . . . . . . . . . . 2.1 1.9 2.0 1.7 1.4Cost of additions to land, buildings and equipment . . . . . . . . . . . . . . . . $ 236 $ 215 $ 181 $ 204 $ 197Depreciation on buildings and equipment . . . . . . . . . . . . . . . . . . . . . . . . $ 262 $ 277 $ 280 $ 305 $ 299
(1) Refer to Note 1 – “New Accounting Standards and Accounting Changes” for further information representing theeffect of adopting FAS 158.
(2) In 2005, includes $98 reported in other current liabilities.(3) 2007 results include the acquisition of GIS. Refer to Note 3-Acquisitions in the Consolidated Financial Statements.
Xerox Annual Report 2007 135
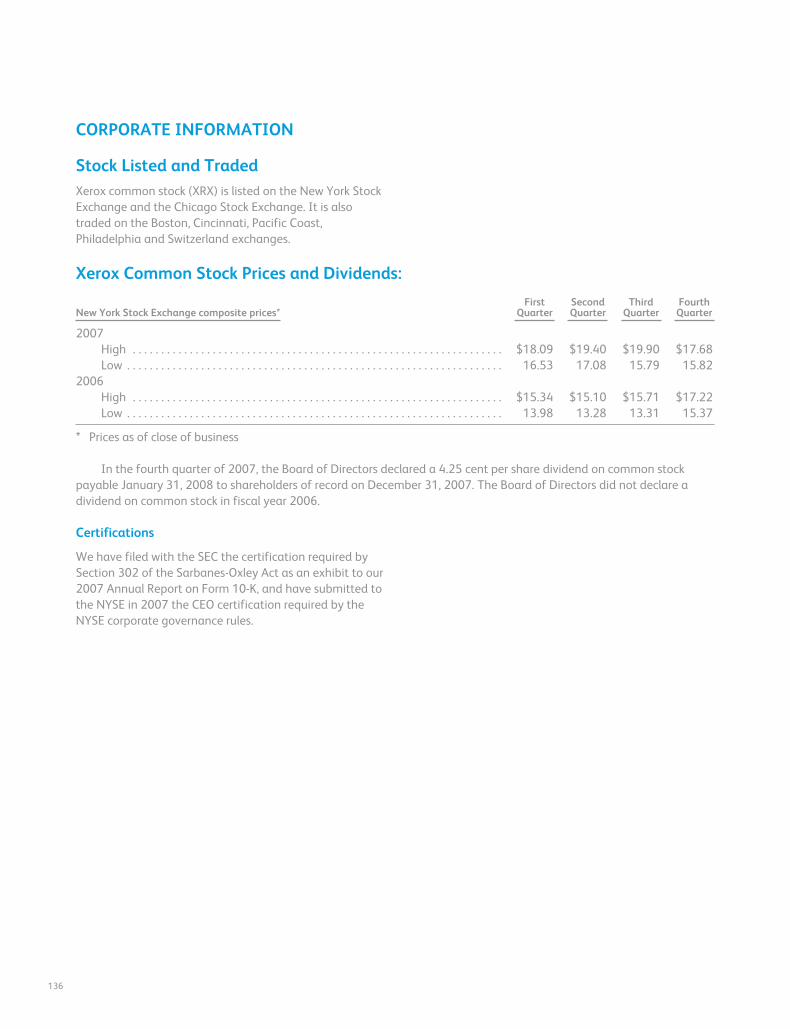
CORPORATE INFORMATION
Stock Listed and TradedXerox common stock (XRX) is listed on the New York StockExchange and the Chicago Stock Exchange. It is alsotraded on the Boston, Cincinnati, Pacific Coast,Philadelphia and Switzerland exchanges.
Xerox Common Stock Prices and Dividends:
New York Stock Exchange composite prices*First
QuarterSecondQuarter
ThirdQuarter
FourthQuarter
2007High . . . . . . . . . . . . . . . . . . . . . . . . . . . . . . . . . . . . . . . . . . . . . . . . . . . . . . . . . . . . . . . . . $18.09 $19.40 $19.90 $17.68Low . . . . . . . . . . . . . . . . . . . . . . . . . . . . . . . . . . . . . . . . . . . . . . . . . . . . . . . . . . . . . . . . . . 16.53 17.08 15.79 15.82
2006High . . . . . . . . . . . . . . . . . . . . . . . . . . . . . . . . . . . . . . . . . . . . . . . . . . . . . . . . . . . . . . . . . $15.34 $15.10 $15.71 $17.22Low . . . . . . . . . . . . . . . . . . . . . . . . . . . . . . . . . . . . . . . . . . . . . . . . . . . . . . . . . . . . . . . . . . 13.98 13.28 13.31 15.37
* Prices as of close of business
In the fourth quarter of 2007, the Board of Directors declared a 4.25 cent per share dividend on common stockpayable January 31, 2008 to shareholders of record on December 31, 2007. The Board of Directors did not declare adividend on common stock in fiscal year 2006.
Certifications
We have filed with the SEC the certification required bySection 302 of the Sarbanes-Oxley Act as an exhibit to our2007 Annual Report on Form 10-K, and have submitted tothe NYSE in 2007 the CEO certification required by theNYSE corporate governance rules.
136
Gary R. KabureckVice President
Chief Accounting Officer
John M. KellyVice President
President, Xerox Global Services
North America
James H. LeskoVice President
Investor Relations
Douglas C. LordVice President
President, U.S. Solutions Group
Timothy J. MacCarrickVice President
Finance, Xerox North America
John E. McDermottVice President
Chief Information Officer
Ivy Thomas McKinneyVice President
Deputy General Counsel
Patricia M. NazemetzVice President
Chief Human Resources
and Ethics Officer
Shaun W. PantlingVice President
Director and General Manager
Xerox Global Services Europe
Russell M. PeacockVice President
President, Xerox Office Group
Rhonda L. SeegalVice President
Treasurer
Sophie V. VandebroekVice President
President, Xerox Innovation Group
Chief Technology Officer
Leslie F. VaronVice President
Controller
Carol Ann McFateAssistant Treasurer
Chief Investment Officer
OfficersAnne M. MulcahyChairman and
Chief Executive Officer
Ursula M. BurnsPresident
James A. FirestoneExecutive Vice President
President, Xerox North America
Lawrence A. ZimmermanExecutive Vice President
Chief Financial Officer
Willem T. AppeloSenior Vice President
President, Xerox Strategic Services Group
Thomas J. DolanSenior Vice President
President, Xerox Global Accounts
Don H. LiuSenior Vice President
General Counsel and Secretary
Michael C. Mac DonaldSenior Vice President
President, Marketing Operations
Jean-Noël MachonSenior Vice President
President, Developing Markets
Operations
Armando Zagalo de LimaSenior Vice President
President, Xerox Europe
Quincy L. AllenVice President
President, Production
Systems Group
Eric ArmourVice President
Corporate Business Strategy
Richard F. CerroneVice President
Marketing Integration and Strategy
M. Stephen CroninVice President
President, Xerox Global Services
Kathleen S. FanningVice President
Worldwide Tax
Anthony M. FedericoVice President
Chief Engineer/Graphic Communications
D. Cameron HydeVice President
President, North American Partners Group
Shareholder informationFor investor information, including
comprehensive earnings releases:
www.xerox.com/investor or call
1.888.979.8378.
For shareholder services, call
800.828.6396 (TDD: 800.368.0328)
or 781.575.3222, or write to
Computershare Trust Company, N.A.,
P.O. Box 43078, Providence, RI
02940-3078 or use e-mail available
at www.computershare.com.
Annual meetingThursday, May 22, 2008, 9:00 a.m. EDT Hyatt Regency Greenwich
1800 East Putnam Avenue
Greenwich, Connecticut
Proxy material mailed on April 11, 2008,
to shareholders of record March 24, 2008.
Investor contactsJames H. Lesko, Vice President,
Investor Relations
Jennifer Horsley, Manager,
Investor Relations
This annual report is available at
www.xerox.com/investor.
Electronic delivery enrollmentXerox offers shareholders the convenience
of electronic delivery including:
Immediate receipt of the
Proxy Statement and Annual Report
Online proxy voting
Registered Shareholders, visit
www.eTree.com/Xerox
You are a registered shareholder if
you have your stock certificate in your
possession or if the shares are being held
by our transfer agent, Computershare.
Beneficial Shareholder, visit
http://enroll.icsdelivery.com/xrx
You are a beneficial shareholder if you
maintain your position in Xerox within a
brokerage account.
Ma
rke
tin
g C
om
mu
nic
ati
on
s: P
ap
pa
s M
acD
on
ne
ll, I
nc.
, So
uth
po
rt, C
T
Ph
oto
of
An
ne
Mu
lca
hy
: ©2
00
6 A
nn
e R
ya
n, z
rIM
AG
ES
fyi
1
Products and serviceswww.xerox.com or by phone:
800 ASK-XEROX (800.275.9376)
Additional informationThe Xerox Foundation 203.849.2478
Contact: Evelyn Shockley
Diversity Programs and EEO-1 Reports 585.423.6157
www.xerox.com/diversity
Minority and Women Owned Business Suppliers 585.422.2295
www.xerox.com/supplierdiversity
Xerox Ethics Helpline 866.XRX.0001 North America;
International numbers and Web
submission tool on www.xerox.com/ethics
e-mail: [email protected]
Environment, Health and Safety Progress Report 800.828.6571
www.xerox.com/environment
Global Citizenship www.xerox.com/citizenship
e-mail: [email protected]
Governance www.xerox.com/investor
Questions from Students and Educators e-mail: [email protected]
Xerox Innovation www.xerox.com/innovation
Independent Auditors PricewaterhouseCoopers LLP
300 Atlantic Street
Stamford, CT 06901
203.539.3000
Thank you to our customers who participated in this report: U.K. Department for Work and Pensions, Strålfors, Behr, and Potting Shed Creations. All of us at Xerox deeply appreciate our relationships and look forward to making them even stronger.
© 2008 Xerox Corporation. All rights reserved. Xerox®, the sphere of connectivity design, DocuColor®, DocuPrint®, DocuTech®, Extensible Interface Platform™, FreeFlow®, The New Business of Printing®, Phaser®, ProfitAccelarator™, WorkCentre®, iGen3®, and Xerox Nuvera® are trademarks of, or licensed to Xerox Corporation in the United States and/or other countries. XMPie® is a trademark of XMPie Inc.
A portion of this report is printed on paper made using wind-generated electricity and 15% post-consumer waste. 002CS-61282
How to reach usXerox CorporationP.O. Box 4505
45 Glover Avenue
Norwalk, CT 06856-4505
203.968.3000
www.xerox.com
Xerox EuropeRiverview
Oxford Road
Uxbridge
Middlesex
United Kingdom
UB8 1HS
+44.1895.25113
Fuji Xerox Co., Ltd.Tokyo Midtown West
9-7-3, Akasaka
Minato-ku, Tokyo 107-0052
Japan
+81.3.6271.5111