Committed to our customers' success. Driven by sustainable ...
123
I&M GROUP PLC (FORMERLY I&M HOLDINGS PLC) ANNUAL INTEGRATED REPORT AND FINANCIAL STATEMENTS 2021 I&M GROUP PLC (FORMERLY I&M HOLDINGS PLC) ANNUAL INTERGRATED REPORT & FINANCIAL STATEMENTS 2021 Committed to our customers’ success. Driven by sustainable and efficient growth.
-
Upload
khangminh22 -
Category
Documents
-
view
0 -
download
0
Transcript of Committed to our customers' success. Driven by sustainable ...

I&M GROUP PLC (FORMERLY I&M HOLDINGS PLC) ANNUAL INTEGRATED REPORT AND FINANCIAL STATEMENTS 2021
I&M GROUP PLC(FORMERLY I&M HOLDINGS PLC)
ANNUAL INTERGRATED REPORT & FINANCIAL STATEMENTS 2021
Committed to our customers’ success.
Driven by sustainable and efficient growth.

I&M GROUP PLC (FORMERLY I&M HOLDINGS PLC) ANNUAL INTEGRATED REPORT AND FINANCIAL STATEMENTS 2021 I&M GROUP PLC (FORMERLY I&M HOLDINGS PLC) ANNUAL INTEGRATED REPORT AND FINANCIAL STATEMENTS 2021 32Ke
y m
ilest
ones
Regi
ster
ed a
s a
Fina
ncia
l In
stitu
tion
I&M
acq
uire
d Bi
asha
ra B
ank
of
Keny
a
19
74
19
80
19
96
20
02
Two
lead
ing
Euro
pean
DFI
s-
Prop
arco
and
D
EG b
ecam
e sh
areh
olde
rs
Acqu
isitio
n of
st
ake
in I&
M B
ank
(T) L
imite
d
20
07
20
08
20
10
20
12
Set u
p of
I&M
H
oldi
ngs a
s a
non-
oper
atin
g ho
ldin
g co
mpa
ny,
liste
d on
the
NSE
Addi
tiona
l Tie
r II
Capi
tal r
aise
Acqu
isitio
n of
I&
M B
ank
(Rw
anda
)
I&M
lice
nsed
as a
Co
mm
erci
al B
ank
I&M
inco
rpor
ated
I&M
Ban
k op
erat
ions
mov
ed
to th
e ne
w I&
M
Tow
er
I&M
1st T
ier I
I ca
pita
l iss
ue
Acqu
isitio
n of
sh
ares
in B
ank
One
Lim
ited,
M
aurit
ius
20
03
20
13
I&M
Ban
k ve
ntur
ed
into
Age
ncy
Bank
ing
20
15
20
16
20
17
Acqu
isitio
n of
I&M
Ba
nk U
gand
a Lt
d (fo
rmer
ly k
now
n as
O
rient
Ban
k Lt
d)
Laun
ch o
f I&
M C
apita
l Lt
d, K
enya
I&M
Hol
ding
s Plc
chan
ged
its n
ame
toI&
M G
roup
Plc
20
19
20
20
Acqu
isitio
n of
Yo
ujay
s In
sura
nce
Brok
ers L
td b
y I&
M A
genc
y Lt
d
Relo
catio
n of
H
ead
Offi
ce to
1 Pa
rk A
venu
e
Reva
mp
of iM
ara
2.0
stra
tegy
20
18
I&M
Ban
k Lt
d ac
hiev
ed
I&M
Fou
ndat
ion
esta
blish
ed
stat
usTIER
1
CDC
Gro
up P
lc
beca
me
a sig
nifc
ant
shar
ehol
der o
f I&
M
Hol
ding
s
Laun
ch o
f iM
ara
Stra
tegy
Acqu
isitio
n of
Bu
rbid
ge C
apita
l
20
14
Form
atio
n of
I&M
In
sura
nce
Agen
cy
Lim
ited
Esta
blish
ed so
cial
m
edia
pre
senc
e
Form
atio
n of
a R
eal
Esta
te C
ompa
ny -
I&M
Rea
lty L
td
Acqu
isitio
n of
G
iro
Com
mer
cial
Ba
nk L
td
20
21
About this report 5
Chairman Statement 9
Our Governance Framework 12
Board of Directors - I&M Group Plc 14
Separation of Roles and Responsibilities 18
2021 Activities 18
Board Committees 19
Induction, Orientation & Continuous Professional Development 22
Board Meeting 23
Board Evaluation 23
Board Attendance 23
Management Delegations& Accountability 24
Management Committees 24
Risk Management, Internal Controls & Compliance 25
Ethics & Social Responsibility 26
Stakeholder Management 29
Other Key Matters 29
Our Approach to Risk Management 30
Our Business 36GED Statement 40
Group Leadership Team 44
Group Management Team 45
Performance Highlights 46
2021 Group Milestones 48
Our Material Matters 49
How We Create Value 52
Our Capitals 55
A Review of Our Strategy 57Our Relationships 65Our People 67
Sustainability Review 70
Subsidiary Overview 84Management Discussion and Analysis 105
2019 OVERVIEW BUSINESS REVIEWOUR BUSINESSOUR GOVERNANCE
Our Financials 112
Abbreviations 114
Corporate Information 115
Report of the Directors 117
Statement of Directors Responsibilities 119
Directors Remuneration Report 120
Independent Auditor's Report 125
Consolidated and CompanyStatements of Profit or Loss and Other Comprehensive Income 130
Consolidated and Company Statements of Financial Position 132
Consolidated Statement of ChangesIn Equity 133
Company Statement of Changes In Equity 134
Consolidated and Company Statements of Cash Flows 136
Notes 137
AGM Notice 238
Proxy 240
OUR FINANCIALS

I&M GROUP PLC (FORMERLY I&M HOLDINGS PLC) ANNUAL INTEGRATED REPORT AND FINANCIAL STATEMENTS 2021 I&M GROUP PLC (FORMERLY I&M HOLDINGS PLC) ANNUAL INTEGRATED REPORT AND FINANCIAL STATEMENTS 2021 54
The I&M Group integrated report presents the consolidated operations of the Group, with a greater focus on
I&M Bank LIMITED in Kenya which represents two thirds by asset value. The report provides material information relating to the Group’s Governance framework, strategy and business model, operating context, material matters, stakeholder interests and performance for the period 1 January 2021 to 31 December 2021. With this report the Group aims to comprehensively communicate to our existing and potential stakeholders on how it creates value.
Reporting framework and principlesThe integrated reporting process and the content of this report are guided by the principles and requirements of the International Integrated Reporting Framework of the International Integrated Reporting Council (IIRC), as well as the International Financial Reporting Standards (IFRS).
ABOUT THIS REPORT
As a non-operating holding company listed on the Nairobi Securities Exchange (NSE) and licensed and regulated by the Central Bank of Kenya, I&M complies with the NSE and Capital Markets Authority (CMA) Listing Requirements, the Kenya Companies Act of 2015, Corporate Governance Guidelines and Codes of Conduct prescribed by the Central Bank of Kenya (CBK) and to The Code of Corporate Governance Practices for Issuers of Securities to the Public 2015 issued by CMA.
AssuranceI&M employs a combined assurance model to optimise the effectiveness of its business operations, including elements of external reporting. These assurances are provided by the management, the Board, and its independent external auditors, KPMG Kenya, on the true and fair presentation of the annual financial statements included in this report.
The report provides material information relating to the Group’s Governance framework, strategy and business model, operating context, material matters, stakeholder interests and performance.
Like any forward-thinking organisation, we do business today with our eye on tomorrow.
COMMITTED TO OUR CUSTOMERS' SUCCESS.
DRIVEN BY SUSTAINABLE AND EFFICIENT GROWTH
It is our intent to create a sustainable organisation by minimising wastage of resources and investing in systems that will make us more efficient in how we operate and in cementing our brand promise that “We are on your side”. We are driven by offering you tailor made solutions that are guaranteed to put you first so as to enjoy a seamless banking/ partnership experience.

7
Group overviewWho we areThe Group has a long-standing presence in the Kenyan market as a provider of a wide range of financial and real-estate services. Incorporated on 16th August 1950 under the name City Trust Limited, it is one of the oldest companies to list on the NSE.
I&M Bank was founded in 1974 as a financial services company and later converted into a commercial bank in 1996. I&M Bank undertook a reverse acquisition of City Trust Limited in 2013 and renamed the entity to I&M Group Plc (formerly I&M Holdings Plc).
What drives us
OUR ASPIRATION To be Eastern Africa’s Leading Financial Partner for Growth.
OUR PURPOSEEmpowering Your Prosperity.
OUR VALUESIntegrity, Trust, Respect, Innovation, Courage.
OUR BEHAVIOURSCollaborative, Candid, Agile, Data-Driven, Empowered, Risk Intelligent.
OUR BRAND PROMISEWe are on your side.
01
02
03
04
05
I&M GROUP PLC (FORMERLY I&M HOLDINGS PLC) ANNUAL INTEGRATED REPORT AND FINANCIAL STATEMENTS 20216
Whatevertomorrowbrings you,we are onyour side#StayWinning
I&M Group Plc is regulated by the Central Bank of Kenya
www.imbankgroup.com
We Are OnYour Side

98 8. I&M GROUP PLC (FORMERLY I&M HOLDINGS PLC) ANNUAL INTEGRATED REPORT AND FINANCIAL STATEMENTS 2021I&M GROUP PLC (FORMERLY I&M HOLDINGS PLC) ANNUAL INTEGRATED REPORT AND FINANCIAL STATEMENTS 2021
Daniel Ndonye
IntroductionIn sharp contrast to an upbeat global outlook at the start of the year, 2021 continued to be plagued by new variants of the COVID-19 virus. The second and third waves of the pandemic, continued lockdowns and travel restrictions led to delayed economic recovery and continued uncertainty. The commendable efforts of mass vaccinations programs, in nearly every part of the world, gave us hope for a gradual return to a more familiar environment even as we adapt to a future of uncertainties.
Despite the uncertainty, the Group has remained focused on reinforcing business resilience across all entities by ensuring continuity of service to our customers and the safety of our staff.
On behalf of the Board, I would like to extend my gratitude to all the Group Entities Boards, Management and Staff for their dedication and service as we resolutely navigate these challenging operating environments.
Regional economic reviewThe pandemic had varied impacts across the East Africa region, with countries highly dependent on tourism being the hardest hit. In addition, the slow rollout of COVID-19 vaccines and risks of spikes in infections during the year 2021 affected the recovery process of most economies in the region. It is heartening to note that according to the World Bank, the region continues to explore policy interventions needed to accelerate the recovery and build resilience in the wake of the pandemic. This includes measures to ramp up vaccinations and designing and implementing economic stimulus packages and recovery strategies.
The silver lining in these grey clouds is witnessing how the pandemic has helped accelerate the push for structural and macroeconomic reforms paving the way for increased inclusive growth over the long term. One such reform addresses digital infrastructure gaps geared towards making the digital economy more inclusive ensuring affordability and building skills for all segments of society.
We acknowledge the unfortunate geopolitical events and heightened economic shocks coming in the wake of the Russian invasion of Ukraine. This has already impacted the supply and price of crude oil and essential commodities resulting in inflationary pressures and is likely to have a significant effect on our regional economies for a large part of this year.
OUR GOVERNANCE
Chairman’s Statement
THE GROUP'S FINANCIAL STRENGTH REMAINS ROBUST, PROVIDING THE NECESSARY SUPPORT TO PURSUE NEW INVESTMENT OPPORTUNITIES AND DELIVER SHAREHOLDER VALUE
OUR GOVERNANCE FRAMEWORK

I&M GROUP PLC (FORMERLY I&M HOLDINGS PLC) ANNUAL INTEGRATED REPORT AND FINANCIAL STATEMENTS 2021 I&M GROUP PLC (FORMERLY I&M HOLDINGS PLC) ANNUAL INTEGRATED REPORT AND FINANCIAL STATEMENTS 2021 1110
DividendsYour Board has resolved to pay a dividend of Kshs 1.5 per share (2020: Kshs 1.1250 per share). This is a payout ratio of 29%, a significant improvement from the payout ratio of 22% in the prior year. Careful consideration has been taken in making this decision, including the outlook for future growth and profitability, and the views of key stakeholders, including regulators and shareholders. The dividend is subject to your approval at the Annual General Meeting.
Following your approval at the last Annual General Meeting held in May 2021, your Company issued bonus shares of one (1) new fully paid-up share of a par value of Ksh 1/- for (1) ordinary share of a par value of Ksh 1/-. With the increase in the number of shares, your Company expects to see an increase in retail investors' participation in the stock.
In addition, the Group appointed a senior resource in charge of Investor Relations and is enhancing structures around investor interactions and communications to ensure that all our stakeholders have access to all the relevant information on a timely basis.
OutlookThe I&M Group's brand promise 'We Are on Your Side' speaks volumes as we continuously operate with the "customer first" perspective. With our digitisation and product innovation initiatives at the forefront in supporting exceptional service delivery across the region, we aim to deliver exceptional value to our customers. This, coupled with renewed investor confidence and a rebound in the economies in the latter half of the year, we expect higher growth and new opportunities in 2022.
I want to acknowledge that 2022 is an election year in Kenya, where our Group is headquartered. We shall be looking to the new Government to provide leadership and clarity on policy, including the regulations around digital financial services, as we focus on facilitating financial inclusion.
On behalf of the Board, we appreciate the invaluable efforts of all the teams within the I&M Group to ensure the Company's sustained growth. In addition, all our customers and service providers continue to extend invaluable support and patronage and for that we are grateful. Finally, I wish to thank my fellow Board members and members of the Board of every entity in the Group for providing strategic guidance to the business.
Daniel NdonyeChairman29 March 2022
Chairman's Statement (Continued)Chairman's Statement (Continued)
OUR GOVERNANCE FRAMEWORKOUR GOVERNANCE FRAMEWORK
PerformanceThe Group closed the year with a profit before tax growth of 13% above the 2020 performance and a return on equity of 12%.
The Group’s flagship subsidiary I&M Bank Ltd, Kenya took a more cautious approach during the period under review and has worked to support its clients as well as setting aside higher loan loss provisions than its industry peers. This was necessitated to cushion the Bank from the continuing impact of the pandemic and the heightened geopolitical risks. The Group’s Net Non-Performing Loans, however, reduced by 22% during the period under review. This is better than the industry average and can be attributed to a significantly expanded loan book, which grew by 12%, and positive recovery efforts across multiple operations.
We maintained sufficient liquidity throughout the year, supported by a 11% growth in deposits.
The Group's performance is expected to further improve with increased efforts towards promoting digital access for our customers to enhance efficiencies through a cashless ecosystem. The year 2021 also saw the Group launch several digital initiatives across our entities: Kenya launched the I&M On-the-Go platform, Bank One in Mauritius launched POP, a universal payment solution, while Tanzania and Rwanda launched WhatsApp Banking.
I am also delighted to note the launch of I&M Capital Ltd through which the Group will offer Wealth Management and Advisory Business. This is expected to drive business growth through revenue diversification. I&M Capital is licensed by the Capital Markets Authority as a Fund Manager and it is heartening to note that in a short span of a few months since its launch, the Assets under Management have grown to over Kshs 700 million.
In 2021, we completed the acquisition of Orient Bank Ltd, Uganda. This entity was rebranded to I&M Bank Uganda Ltd in October 2021. Cross-border regional business has been a major area of focus, with regional customers being introduced and onboarded. We are hopeful for improved performance from the banking entity in the coming months.
CapitalisationThe Group has maintained solid capital levels across all its banking entities meeting regulatory requirements. Diverse funding solutions including deposits, debt and equity supported the execution of the Group's strategy in 2021. Low-cost deposits grew by over 30% driving down the cost of funds enabling the provision of the best solutions to our customers while borrowings grew by 32% attributed to DFI funds to support SME sector funding.
We are continuously reviewing our capital requirements, focusing on minimizing the cost of funds while maximizing shareholder value.
GovernanceOur business operations are underpinned by our strong governance structures and risk management principles. As in the past, we strive to ensure that our governance structures are suitably modified to adapt to changes in the operating environment. We, therefore, continue to review and update our policies and procedures on an ongoing basis. Accordingly, the Board reviewed and updated Group policies and frameworks on Business Continuity, Enterprise Risk Management, Operational Risk Management, Strategy, and Credit Risk during the year.
Sustainability initiativesThe Group well appreciates the linkage between business and society and recognizes its responsibility to support the communities within the region with the hope of creating shared value and a positive impact.
The I&M Foundation in Kenya has adopted a collaborative approach with partners that facilitates its participation in more impactful CSR initiatives. As a result, in 2021, 2% of I&M Kenya's 2020 PBT approximately Kshs 206M was allocated for I&M Foundation activities to drive the Group's environmental & social sustainability initiatives. In addition, our regional subsidiaries in Tanzania, Rwanda and Mauritius continued to support activities within the education, conservation and health sector, following on activities from the previous year. As a Group, we continue to refine our sustainability agenda reflecting the Group’s vision across the subsidiaries.
On climate risk management, I&M Kenya is spearheading the implementation project to develop targeted initiatives that leverage climate opportunities for the Group's continued sustainable growth.
We remain committed to mitigating direct social and environmental impacts and managing indirect impacts.
Our
Gov
erna
nce
Our
Bus
ines
sO
ur F
inan
cial
s

I&M GROUP PLC (FORMERLY I&M HOLDINGS PLC) ANNUAL INTEGRATED REPORT AND FINANCIAL STATEMENTS 2021 I&M GROUP PLC (FORMERLY I&M HOLDINGS PLC) ANNUAL INTEGRATED REPORT AND FINANCIAL STATEMENTS 2021 1312
The Board has consistently placed great importance on good corporate governance practices of the Company, its subsidiaries, and joint venture investment (together the ‘Group’) as it believes that this is vital in achieving the Group’s objectives in a sustainable manner. The Board is committed to ensuring that the Group complies with the laws, regulations and practices applicable to it. The Board regularly reviews its corporate governance framework in line with developments in regulation, best practice and shareholder expectations.
The Directors present below the Group’s statement on Corporate Governance which outlines the key tenets of the Group’s corporate governance framework and provides guidance to the Board, Management and employees of the Group. It sets out how the Company has applied the principles of good governance in accordance and in compliance with the Code of Corporate Governance issued by the Capital Markets Authority in Kenya (the Code), the Central Bank of Kenya Guidelines on Corporate Governance and the Companies Act, 2015.
Governance structure The Company is licensed as a non-operating holding company (‘NOHC’) by the Central Bank of Kenya and operates within a clearly defined governance framework established by the Board of Directors. It includes a robust management structure built on a platform of stringent internal control and pre-approved policies, practices and procedures to deliver sustainable value to its shareholders, whilst remaining focused on its responsibility to society at large. This underpins the Group’s commitment to ensuring that it conducts its business with the highest standards of integrity, transparency and accountability across all levels.
The Company’s banking, advisory subsidiaries and joint venture are governed by different statutory and regulatory requirements across the region. As a NOHC, the Board takes full ownership of its responsibility to provide effective and responsible leadership, characterised by ethical values of responsibility, accountability and fairness to promote the long-term success of the Group and deliver sustainable shareholder value.
Name No of Shares held % Shareholding
Minard Holdings Limited 357,035,864 21.6%
Tecoma Limited 304,179,232 18.4%
Ziyungi Limited 294,192,000 17.8%
CDC Group PLC (through Standard Chartered Kenya Nominees Ltd A/C KE002796) 167,526,000 10.1%
Bhagwanji Raja Charitable Foundation The Registered Trustees 42,270,120 2.6%
Investments & Mortgages Nominees Ltd A/C 0001229 34,024,744 2.1%
Investments & Mortgages Nominees Ltd A/C 0004047 33,581,872 2.0%
Blanford Investments Limited 18,314,408 1.1%
Lombard Holdings Limited 14,745,448 0.9%
Sentinel Investments Limited 13,847,972 0.8%
Others (3,707 shareholders not holding more than 5% individually) 373,903,816 22.6%
Total 1,653,621,476 100.0%
Share range Number of shareholders No of Shares held % Shareholding
Less than 1 million shares 3,626 143,480,212 8.7%
> 1 million < 2 million shares 54 72,818,696 4.4%
> 2 million < 3 million shares 10 24,389,112 1.5%
> 3 million shares 27 1,412,933,456 85.4%
Grand Total 3,717 1,653,621,476 100.0%
Our shareholdersThe Company is listed on the Nairobi Securities Exchange and had 3,717 shareholders as at 31 December 2021. The top 10 shareholders of the Company listed below hold 77.4% of the shares.
I&M recognises the importance of transparency and accountability to all stakeholders and in particular, to shareholders. The Company has various channels and mechanisms to communicate and engage with shareholders in addition to the Annual General Meeting. These include availing information on the website, publication of quarterly financial results and holding quarterly investor briefings. The Company remains committed to ensuring open communication with its shareholders and observing the highest standards of governance and shareholder communications.
The Shareholder Communication Policy sets out the processes that the Company has put in place to facilitate and encourage participation by shareholders. This policy is aimed at nurturing the loyalty and confidence of the Company’s shareholders through frequent and forthright communication, both directly to shareholders and indirectly through analysts and the media. The Company seeks to ensure that interaction with each investor meets the highest levels of professionalism and quality. A copy of the policy is available on the Group’s website (https://www.imbankgroup.com/).
The following contacts are also available on the website for shareholders to contact the Group: 24-hour Call Centre: +254 20 322 1000 or
email: [email protected].
The table below sets out the timelines of the key events and shareholder communication forums during the year.
Event/communication Date
Release of full year results 31 March 2021
Investor briefing full year 2020 results 15 April 2021
Announcement of the Annual General Meeting 20 April 2021
Announcement on the completion of the acquisition of 90% of issued share capital of Orient Bank Limited, Uganda
30 April 2021
Annual General Meeting 20 May 2021
Release of quarter 1 2021 financial results 27 May 2021
Investor briefing quarter 1 financial results 9 June 2021
Announcement of change of Name 30 June 2021
Release of half year 2021 financial results 30 August 2021
Investor briefing half year results 8 September 2021
Release of quarter 3 2021 financial results 29 November 2021
Investor briefing quarter 3 financial results 2 December 2021
Shareholder engagement and communicationIntroduction
OUR GOVERNANCE FRAMEWORKOUR GOVERNANCE FRAMEWORK
Our
Gov
erna
nce
Our
Bus
ines
sO
ur F
inan
cial
s

I&M GROUP PLC (FORMERLY I&M HOLDINGS PLC) ANNUAL INTEGRATED REPORT AND FINANCIAL STATEMENTS 2021 I&M GROUP PLC (FORMERLY I&M HOLDINGS PLC) ANNUAL INTEGRATED REPORT AND FINANCIAL STATEMENTS 2021 1514
Committee membership/(s)Board Nomination, Remuneration and Governance Committee.
QualificationsBachelor of Commerce Degree.Fellow of the Institute of Chartered Accountants in England and Wales, the Institute of Certified Public Accountants of Kenya and the Institute of Certified Secretaries of Kenya.
ProfileMr. Daniel Ndonye is a chartered accountant by profession, having worked with Deloitte & Touche for over 30 years, 20 of which he was the Managing/Senior Partner. He has a broad range experience at Board level and sits on the boards of several companies.
Committee membership/(s)None.
QualificationFounder member.
ProfileMr. Suresh Bhagwanji Raja Shah is a founder member and former Chairman of I&M Bank Ltd. He has vast experience in the banking industry and in business. In December 2002, he was bestowed the Honour of the Moran of the Order of the Burning Spear. He sits on the boards of several companies.
DANIEL NDONYEIndependent Chairman Tenure on BoardAppointed Chairman of the Board on 14 June 2013.
SURESH B R SHAH, MBSNon - Executive Director Tenure on BoardAppointed on 14 June 2013.
The Board collectively sets the Group’s strategy and oversees the execution and implementation against this strategy. The Board recognises the value in providing an independent and objective judgement on strategic deliberations. To this end, the Company’s Board Charter and the Corporate Governance Policy stipulate that the Board shall at all times have at least one third of its members as independent Directors. During the year under review, the Board consisted of nine (9) members. Of these five (5) are independent directors, two (2) are non-executive directors and two (2) are executive directors. Independent Directors constituted 55% of the Board, well above the stipulated threshold of 33%. The tenure of independent Directors is set at a maximum of 9 years. The Board is supported by a Company Secretary who advises and supports the Board on governance matters.
Collectively, the Board has vast experience, stemming out of the individual director’s varied backgrounds across a multitude of disciplines. To ensure that this diversity of experience and skills is maintained, the Board, through the Board Nomination, Remuneration & Governance Committee, regularly reviews its composition and skills. This process was undertaken in the latter part of the year following a review and enhancement of the existing Board Skills Matrix. This exercise confirmed that the Board was well balanced and had the relevant skills and experience required to drive the company forward. Gender diversity was highlighted as an area that presented an opportunity for improvement.
Board of Directors - I&M Group Plc Board of Directors - I&M Group Plc (Continued)
Committee membership/(s)Board Nomination, Remuneration and Governance Committee.Board Strategy Steering Committee.
QualificationMasters Degree in Internal Audit and Management from City University London.
ProfileMr. Sarit S Raja Shah has been the Executive Director of I&M Bank since 1993 with extensive experience in leadership and management. He also sits on the Boards of several companies including subsidiaries and associates of I&M Group Plc.
SARIT S RAJA SHAHGroup Executive DirectorTenure on BoardAppointed on 14 June 2013.
Committee membership/(s)Board Audit and Risk Management Committee.Board Nomination, Remuneration and Governance Committee (Chair).
QualificationsBachelor of Science Degree in Civil Engineering from the University of Southampton.Fellow of the Institute of Chartered Accountants in England and Wales.
ProfileMr. Michael Turner is the Managing Director of Actis (East Africa). He has vast experience in investment banking. He sits on the Boards of various companies.
Committee membership/(s)None.
QualificationBachelors of Science degree in Banking and Finance from City University London.
ProfileMr. Sachit S Raja Shah is the Executive Director of GA Insurance Limited. He previously worked with AMP Asset management in London and HSBC Bank PLC London. He sits on the Boards of various companies.
MICHAEL TURNERIndependent DirectorTenure on BoardAppointed on 1 August 2014.
SACHIT S RAJA SHAHNon - Executive DirectorTenure on BoardAppointed on 10 July 2015.
OUR GOVERNANCE FRAMEWORKOUR GOVERNANCE FRAMEWORK
Our
Gov
erna
nce
Our
Bus
ines
sO
ur F
inan
cial
s

I&M GROUP PLC (FORMERLY I&M HOLDINGS PLC) ANNUAL INTEGRATED REPORT AND FINANCIAL STATEMENTS 2021 I&M GROUP PLC (FORMERLY I&M HOLDINGS PLC) ANNUAL INTEGRATED REPORT AND FINANCIAL STATEMENTS 2021 1716
Committee membership/(s)Board Strategy Steering Committee (Chair).
QualificationElectrical engineer and economist from Yale University.
ProfileMr. Suleiman Kiggundu Jr. has served in senior leadership roles at various institutions, including Equator Bank, HSBC Bank Plc and CDC Group Plc. He sits on the boards of several companies. He is also the Chairman of the Board Strategy Steering Committee.
Committee membership/(s)None.
QualificationsGlobal Executive Masters of Business Administration (GeMBA) from United States International UniversityBachelor of Laws (LLB) from the University of NairobiCertified Public Secretary (CPS)Member of the Institute of Certified Public SecretariesMember of the Law Society of Kenya.ProfileMs. Bilha W Mwangi is an advocate of the High Court of Kenya and Certified Public Secretary. Bilha is a partner at Wanjiru Kinyanjui Advocates LLP and specialises in company secretarial practice, commercial law, banking and security law and conveyancing.
SULEIMAN KIGGUNDU JrIndependent Director
Tenure on BoardAppointed on 5 June 2018.
BILHA WANJIRU MWANGICompany Secretary
Tenure on BoardAppointed on 20 December 2018.
Committee membership/(s)Board Audit and Risk Management Committee.
QualificationsDoctorate of Business Administration from the Nelson Mandela Metropolitan UniversityMasters of Business Administration and Bachelor of Arts Degree both from the University of Nairobi. Fellow of the Institute of Certified Secretaries of Kenya and the Kenya Institute of Management.
ProfileDr. Nyambura has worked in various capacities in the financial sector including banking, business development, information technology and was the Managing Director at Postbank for nine years.Dr. Nyambura is also trained in management of Pensions Funds, is a certified trainer in corporate governance and a certified mediator. She sits in several private and public sector boards.
ALICE NYAMBURA KOIGIIndependent Director
Tenure on BoardAppointed on 28 October 2015.
Committee membership/(s)Board Audit and Risk Management Committee.Board Nomination, Remuneration and Governance Committee.Board Strategy Steering Committee.
QualificationsMA. From Oxford UniversityFellow of the Institute of Chartered Accountants in England and Wales.ProfileMr. Christopher Low is the Regional Director of the Group. He brings on board a vast wealth of experience having served as the Group Chief Executive Officer at Letshego Holdings Limited, one of Botswana’s largest publicly listed and multinational groups, operating financial services business across eleven countries in Sub-Saharan Africa. He has experience in International Banking, Digital Transformation, Risk Management and Financial Inclusion.
CHRIS LOWRegional Director
Tenure on BoardAppointed on 15 January 2021.
Committee membership/(s)Board Audit and Risk Management Committee (Chair).
QualificationsMaster of Science degree in Risk Management from New York University, New YorkMaster of Business Administration from Adelphi University, New York Bachelor of Arts from the University of Nairobi, Nairobi.
ProfileMs. Rose Kinuthia brings on board wealth of experience and knowledge having spent a significant part of her career as a seasoned risk practitioner for 20 years with extensive experience in risk management and specialising in banking, pension funds and insurance.
ROSE WANJIRU KINUTHIAIndependent Director
Tenure on BoardAppointed on 3 March 2020.
Board of Directors - I&M Group Plc (Continued)Board of Directors - I&M Group Plc (Continued)
OUR GOVERNANCE FRAMEWORK OUR GOVERNANCE FRAMEWORK
Our
Gov
erna
nce
Our
Bus
ines
sO
ur F
inan
cial
s

I&M GROUP PLC (FORMERLY I&M HOLDINGS PLC) ANNUAL INTEGRATED REPORT AND FINANCIAL STATEMENTS 2021 I&M GROUP PLC (FORMERLY I&M HOLDINGS PLC) ANNUAL INTEGRATED REPORT AND FINANCIAL STATEMENTS 2021 1918
The Board has put in place the necessary mechanisms to enable it effectively discharge its roles and responsibilities. The specific roles and responsibilities to be discharged by the Board, its Committees, Chairman of the Board, Group Executive Director, other Directors individually and collectively as well as the Company Secretary are outlined in the Board Charter. The Board Charter is reviewed every two years to ensure relevance amidst changes in the Group’s operating environment.
The Board Charter clearly distinguishes between the roles and responsibilities of the Group Chairman and Group Executive Director. The Chairman is tasked with the responsibility of effectively leading the Board, fostering a constructive governance culture and maintain relevant links between all stakeholders. The Group Executive Director is responsible for providing leadership and direction in the day-to-day operations of the Group directed toward implementation of the Group’s long-term vision and strategy. The Group Executive Director ensures that the strategy and decisions of the Board are implemented in each of the Group’s entity by ensuring that each CEO is accountable for the achievement of the strategic initiatives and financial performance. The independent Non-Executive Directors have the responsibility to constructively challenge Management and oversee the implementation of the strategy within the set risk control environment. The current Board Charter is available on the Group website (www.imbankgroup.com).
2021 activitiesThe Board held four scheduled meetings in the year.
The Board undertook the following activities:
• The Board steered the Group through the challenging business environment on account of the ongoing COVID-19 pandemic, including seamlessly holding of the AGM and board meetings virtually
• Reviewed and approved the Group consolidated forecasts for 2022
• Reviewed and approved the annual budgets for the various subsidiaries in the Group
• Reviewed strategic plans and objectives for the Group and status of implementation against the strategic plan
• Reviewed the Group structure and Group organization structure
• Reviewed the Group succession plan
• Reviewed the company’s Management Accounts
• Reviewed the quarterly unaudited consolidated Group Accounts and annual audited financial statements including the statements to accompany the various mandated publications
• Considered and proposed a final dividend for the year
• Reviewed quarterly performance as compared to listed peer banks
• Reviewed and approved the agenda and notice for the Annual General Meeting
• Reviewed quarterly updates from the banking and non-banking subsidiaries in the Group
• Reviewed updates from the Board Committees
• Reviewed changes in shareholding structure
• Approved its annual calendar of meetings for 2022
• Reviewed results from the annual board evaluation exercise
• Reviewed results from the Legal & Compliance and Governance Audit including progress on implementation of the actions agreed
• Reviewed and approved an annual Board work plan
• Reviewed the director development plan for 2022
Separation of roles and responsibilities Board committeesThe Board has delegated authority to three Board Committees to assist the Board to effectively discharge its mandate. Each Committee has in place Terms of Reference approved by the Board that outline its responsibilities. The Terms of Reference are reviewed annually. The Board regularly reviews the membership of the Committees.
The relationship between the Board and Board Committees is illustrated below:
I&M Group Plc Board
Board Audit & Risk Management Committee
(BARMC)
Board Strategy Steering Committee
(BSSC)
Board Nomination, Remuneration &
Governance Committee
(BNRGC)
OUR GOVERNANCE FRAMEWORKOUR GOVERNANCE FRAMEWORK
Our
Gov
erna
nce
Our
Bus
ines
sO
ur F
inan
cial
s

I&M GROUP PLC (FORMERLY I&M HOLDINGS PLC) ANNUAL INTEGRATED REPORT AND FINANCIAL STATEMENTS 2021 I&M GROUP PLC (FORMERLY I&M HOLDINGS PLC) ANNUAL INTEGRATED REPORT AND FINANCIAL STATEMENTS 2021 2120
Board committees (Continued)
(i) Board Audit and Risk Management Committee (BARMC)
The BARMC consists of three independent directors and one Non-Executive Director. It is chaired by an Independent Director.
MembersMs. Rose Kinuthia (Chairperson), Dr. Nyambura Koigi, Mr. Michael Turner & Mr. Chris Low. Responsibilities The key responsibilities of the BARMC are to assist the Board in fulfilling its statutory and fiduciary responsibilities, by providing an objective and independent review of the effectiveness of the external reporting of financial information and the internal control environment of the Group. The BARMC is also responsible for the oversight of the Group’s risk management framework and reviewing the Group’s risk appetite from time to time.
2021 ActivitiesBARMC held four scheduled meetings in the year.
The Committee undertook the following activities:
• Reviewed the unaudited and audited financial statements for the full year 2020 for consideration and ultimate approval by the Board
• Approved the annual internal audit plan• Reviewed the internal audit reports presented by the Internal Auditor
for audits undertaken during the year• Reviewed the Group’s Compliance and Risk reports including Cyber
Risk and Enterprise Risk Management Framework • Reviewed and recommended various policies for approval by the
Board• Provided oversight on the annual Group Audit & Risk Conference and
monitored progress on the actions agreed • Reviewed progress on implementation of the requirements under the
Data Protection Act
The Committee held separate meetings with the external auditors KPMG without Management present and is satisfied that the auditors remain independent.
(ii) Board Nomination, Remuneration and Governance Committee (BNRGC)
The BNRGC consists of two Independent Directors and two Executive Directors. It is chaired by an Independent Director.
MembersMr. Michael Turner (Chairman), Mr. Daniel Ndonye, Mr. Sarit S. Raja Shah & Mr. Chris Low.
ResponsibilitiesThe BNRGC assists the Board in fulfilling its responsibilities by undertaking structured assessment of candidates for membership of the Board and Board Committees and the establishment of an appropriate harmonized framework for remuneration of the Board members across the Group, in line with clearly defined remuneration principles. The Committee also provides oversight on governance-related matters at the Group level such as Board succession planning, induction for new board members, assisting the Board in reviewing the mix of skills and expertise of board members, reviewing the performance and effectiveness of the Board through the board evaluation process and generally providing oversight in relation to the general governance of the entities within the Group. This is to ensure that there is continued compliance with the corporate governance laws, regulations and best practice.
In addition, the Committee provides oversight in relation to the development and implementation of governance related policies at the Group level and ensures compliance with the prevailing corporate governance regulations and principles.
2021 ActivitiesBNRGC held two scheduled meetings in the year.
The Committee undertook the following activities:
• Approved revision of the Committee’s Terms of Reference to include the Regional Director as a member of the Committee
• Reviewed the training and development reports for the Directors in the Group entities
• Reviewed results of the annual board evaluation for the year including follow up on agreed remedial actions
• Reviewed board composition and succession for the entities within the Group
• Reviewed the Group’s reward framework and approved Directors benefits
• Reviewed progress on remedial action from the legal & compliance and governance audits
• Reviewed related party transactions• Received reports on the progress made in relation to the Culture
Transformation Program
The Company has received an exemption from the Capital Markets Authority on the requirement to have three Independent Directors on each of the BARMC and BNRGC.
(iii) Board Strategy Steering Committee (BSSC)
The BSSC consists of one Independent Director, two Executive Directors and 4 management team members.
MembersMr. Suleiman Kiggundu Jr. (Chairman), Mr. Sarit S. Raja Shah& Mr. Chris Low
ResponsibilitiesThe BSSC assists and provides guidance to the Board in fulfilling its responsibilities by considering matters pertaining to the Group’s overall long term strategic direction as well as corporate objectives. The BSSC assists the Board in review of the optimum level of the Group’s capital structure to support the Group’s strategic and financial goals and review the Group’s major strategic and investment decisions (including Merger & Acquisition transactions).
2021 ActivitiesBSSC held four scheduled meetings in the year.
The Committee undertook the following activities:
• Reviewed the business and strategy performance over the year and provided guidance on proposed initiatives
• Recommended areas for improved regional synergies • Monitored an update on the progress of integration of I&M Uganda
Ltd (formerly Orient Bank Limited)• Reviewed the Committee structure and terms of reference for the
Committee
Board committees (Continued)
The entity Boards have ultimate responsibility for their local business performance and are guided by regulations within the respective jurisdiction and the Group minimum standards.
The Group Executive Office is headed by the Group Executive Director (GED). He is ably supported by the Regional Director, Group Nominated Directors and other team members in the Group Executive Office.
Each banking entity in the Group has set up various Board Committees to oversee the conduct of its business.
The key ones include the following:
All directors receive formal letters of appointment setting out the main terms and conditions of their appointment.
The BPC is responsible for reviewing and approving significant procurement proposals as well as proposed consultancy assignments and unbudgeted capital expenditure. In addition, the BPC also vets any agreements with and procurement from related parties.
The BNRC is responsible for assessment of Board requirements for non-executive directors, induction programs for new Directors and development programs to build individual skills and improve Board effectiveness, Board succession planning, Performance evaluation of the Board of Individual Directors and of the senior executives, setting remuneration policies & strategic objectives of senior executives, providing oversight over HR matters and input into HR policies as appropriate.
The Board, through the Board Nomination, Remuneration and Governance Committee, is responsible for nominating members to the Board and for filling vacancies on the Board that occur between annual meetings of shareholders. In considering potential directors, the Board seeks to not only identify candidates with appropriate skills, knowledge and experience to contribute to effective direction of the Group but also ensure achievement of diversity in its composition as set out in the Board Succession Policy.
Board Audit Committee(BAC)
Board Risk Committee(BRC)
Board Credit Committee(BCC)
Board Procurement Committee (BPC)
Board Nomination &Remuneration Committee (BNRC)
Director Appointment
The BAC assists the Board in fulfilling its responsibilities by reviewing the financial condition of the Bank, its internal controls, performance and findings of the Internal Audit functions. Two BAC meetings are held in each year independent of management giving the internal and external auditors an opportunity to raise matters directly with members of the BAC.
The BRC, through the risk management function, is responsible for translating the Risk Management Framework established by the Board of Directors into specific policies, processes and procedures that can be implemented and verified within the different business units, so that risks faced by the Bank are adequately considered and mitigated.
The BCC is responsible for review of the overall lending policy, conducting independent loan reviews, delegation and review of lending limits. It also ensures compliance with all statutory and regulatory requirements and is responsible for the overall management of credit risk. The Credit Risk Management Committee (CRMC) assists the BCC in its role.
Our
Gov
erna
nce
Our
Bus
ines
sO
ur F
inan
cial
s
OUR GOVERNANCE FRAMEWORKOUR GOVERNANCE FRAMEWORK

I&M GROUP PLC (FORMERLY I&M HOLDINGS PLC) ANNUAL INTEGRATED REPORT AND FINANCIAL STATEMENTS 2021 I&M GROUP PLC (FORMERLY I&M HOLDINGS PLC) ANNUAL INTEGRATED REPORT AND FINANCIAL STATEMENTS 2021 2322
All new Directors are appropriately introduced to the business of the Company and the Group and are provided with a comprehensive induction and information pack containing a brief presentation on the affairs of the Group, the governance structure & conduct of meetings, the director’s duties & responsibilities, the Company’s Constitution and such other useful documents.
All directors have access to the advice and services of the Company Secretary, who is responsible for providing guidance to the Directors as to their duties, responsibilities and powers.
Directors also have access to Senior Executives to obtain information on items to be discussed at board meetings or meetings of board committees or on any other area they consider to be appropriate.
The Board and its Committees also have the authority to obtain external or independent professional advice as they may consider necessary to carry out their duties.
In addition, the Company organizes up-skilling and continuous development programs for Directors across the Group in order to enhance governance practices within the Board itself and in the interest of the Group. Tabulated below are the programs held during the year.
Training Description Date Undertaken No. Of Hours
Training on Emerging Laws & Legislations 21 May 2021 4
Audit & Risk Conference on future proofing resilience, embedding ESG into the risk management process and climate change 13-14 October 2021 16
Board meetings
The Board meets at least once every quarter for scheduled meetings and on other occasions as and when required to deal with specific matters in-between scheduled meetings. Board members receive board papers well in advance of their meetings, thereby facilitating meaningful deliberations therein. Proceedings of all meetings are recorded by the Company Secretary and the minutes of each meeting signed by the Chairperson of the meeting.
Board evaluationThe Board has established a mechanism for evaluating the performance of the Board and its members annually with the process being reviewed and refined periodically. The review and evaluation includes; the functioning of the Board and Board committees as collective bodies, and the performance of the Chairperson, individual directors, Group Executive Director and Company Secretary.
Board attendanceThe following table shows the number of meetings held during the year and the attendance of the individual directors:
Where a director did not attend a Board or Board Committee meeting, an acceptable apology had been received by the Chairman well in advance of the scheduled meeting.
Directors 18-Jan-21 25-Mar-21 20 May-21*** 9-Jul-21 18-Oct-21 Total Board
meetings
attended
in 2021
Daniel Ndonye √ √ √ √ √ 100%
Suresh B R Shah, MBS √ √ √ √ √ 100%
Sarit S Raja Shah √ √ √ √ √ 100%
Michael Turner √ √ √ √ √ 100%
Oliver Fowler* √ X X X X 100%
Sachit S Raja Shah √ √ √ √ √ 100%
Nyambura Koigi √ √ √ √ √ 100%
Suleiman Kiggundu √ √ √ √ √ 100%
Rose Kinuthia √ √ √ √ √ 100%
Chris Low** √ √ √ √ √ 100%
Induction, orientation & continuous professional development
Our
Gov
erna
nce
Our
Bus
ines
sO
ur F
inan
cial
s
*Resigned on 18th March 2021** Appointed on 15th January 2021***Special Board Meeting (AGM)
√ AttendedX Not AttendedN/A Not Applicable / Meeting preceded appointment and regulatory approval.
OUR GOVERNANCE FRAMEWORKOUR GOVERNANCE FRAMEWORK

I&M GROUP PLC (FORMERLY I&M HOLDINGS PLC) ANNUAL INTEGRATED REPORT AND FINANCIAL STATEMENTS 2021 I&M GROUP PLC (FORMERLY I&M HOLDINGS PLC) ANNUAL INTEGRATED REPORT AND FINANCIAL STATEMENTS 2021 2524
The Board has set up a Group Executive Office to lead and direct the implementation of business strategy, performance delivery and safe and compliant execution of the Group’s banking and other business to deliver sustainable long-term value for shareholders. The Group Executive Office coordinates the dissemination of information between the Directors and the Management of the entities and is also responsible for the establishment, execution and delivery of agreed strategic objectives approved by the Board.
Management committeesEach banking entity in the Group has set up various management committees. The key ones include:
Management delegations & accountability
EXCO/MANCO provides the link between the Board, Top Management and Department Heads. It is responsible for reviewing the individual Bank’s corporate and strategic objectives, business performance review of progress of special projects and to strategise on the way forward in line with market dynamism / conditions. The committee also considers and plans the required action, including assessment of impact thereof on the agreed Corporate Objectives for the year on significant matters agreed upon at the quarterly Board meetings.
Executive/Management Committee (EXCO/MANCO)
ALCO is a sub-committee of the Board Risk Management Committee responsible for setting, monitoring and reviewing financial risk management policy and controls including devising the most appropriate strategy for each individual bank in terms of the mix of assets and liabilities and this is based on the committee expectations of the future and the potential impact of interest-rate movements, liquidity constraints, foreign exchange exposure and capital adequacy.
Assets & LiabilitiesCommittee (ALCO)
CRMC is the link between the Board and Management in terms of implementing the credit and lending policies of each bank. It is responsible for the sanction of credit proposals in line with the bank’s Credit Policy, effective management and follow-up of all credit-related matters and review of Non-Performing Accounts. The Non Performing Accounts Committee and the Card Centre Credit Appraisal Committee assist the CRMCin its role.
Credit Risk ManagementCommittee (CRMC)
TO SteerCo provides the link between the Board and Management in terms of implementing and monitoring of each bank’s Strategic direction, intent and objectives. The committee plays a significant role in providing direction and focus on the emerging issues/challenges in respect of the implementation of the bank’s strategy.
Transformation OfficeSteering Committe (TO SteerCo)
RISKCO is primarily responsible for integrating risk management into the organisation’s goals. RISKCO defines risk review activities regarding the decisions, initiatives, transactions and exposures and prioritises these before prior to presentation to the Board. The committee also periodically reviews and assess the effectiveness of the bank’s enterprise-wide risk assessment processes and recommends improvements, where appropriate.
Risk & ComplianceManagement Committee(RISKCO)
HRC assists the Board in fulfilling its Human Resource Management responsibilities with due recognition to this key resource. HRC oversees implementation of all major HR initiatives, rendering support and guidance as appropriate. It also facilitates periodic review of the bank’s HR policies and practices to ensure the bank remains competitive and able to attract and retain competent talent for its business.
Human Resources Committee (HRC)
The Group has an integrated risk management framework in place to identify, assess, manage and report risks as well as risk adjusted returns on a consistent and reliable basis. Further, the Group maintains a keen focus on ensuring that the risk management framework at a Group level is robust enough to safeguard the business processes and products of each entity.
Given that risk taking is core to the Group’s innovation capacity and ultimately its entrepreneurial success, the Group’s approach to risk management is characterized by strong risk oversight at the Board level and a strong risk management culture at all levels and across all functions. Such an approach supports and facilitates decision making processes across the Group.
The risk management framework is set so that risks identified are adequately considered and mitigated as follows:
• The Board of Directors at the Group and individual entity level assume the ultimate responsibility for the level of risks taken and are responsible for overseeing the effective implementation of the risk strategies;
• The organisational risk structure and the functions, tasks and powers of the committees, staff and departments involved in the risk processes are continuously reviewed to ensure their effectiveness and the clarity of their roles and responsibilities;
• Risk issues are taken into consideration in all business decisions. Measures are in place to develop risk-based performance measures and this is being supplemented by setting risk limits at the company level;
• Risk management has been integrated into various management processes such as strategic planning, annual budgeting and performance measurement;
• Identified risks are reported in a transparent and timely manner: and
• Appropriate and effective controls exist for all processes.
Each entity in the Group endeavours to be compliant with best practices in its risk management and uses the Committee of Sponsoring Organisations of the Treadway Commission “COSO” framework as a reference and adopts compatible processes and terminology.
An area of increased focus for the Group is ESG (Environment, Social, Governance) given the growing global emphasis on climate change. The Group's risk management framework has been aligned to ensure formulation and implementation of an ESG framework to focus on this risk in line with international best practice, the guidance on climate-related risk management issued by the Central Bank of Kenya and Nairobi Stock Exchange (NSE) manual that guides listed companies on measuring and reporting ESG matters.
Business continuity managementThe COVID-19 pandemic continued in 2021 with the virus mutating to various variants throughout the year. The vaccines were a significant development in mitigating the impact of the virus however in line with government directives on containment of the pandemic, the Group continued to operate within its Business Continuity Plan. The previous laid down protocols continued to be implemented in 2021 including enhanced hygiene at the work place, social distancing for physical interactions, continued preference for virtual meetings, isolation of affected staff amongst others.
Compliance The Board ensures that laws, rules and regulations, codes and standards applicable to the Group have been identified, documented and observed. Each of the banking entities within the Group have independent Compliance functions to continuously monitor the Company and its subsidiaries’ compliance with applicable laws, rules and regulations, codes and standards to provide assurance in this respect to the Board on a quarterly basis.
All policies and procedures are tailored to ensure that the Group processes are fully compliant with all relevant laws and regulations.
Additionally, the Board receives a report at each of its scheduled meetings on changes to the legislation and regulatory framework and evaluates its impact in addition to ensuring that the Company puts in place the appropriate processes to ensure compliance from the effective date.
Risk based internal audit & assurance While the Board is responsible for the overall risk management and internal control systems, oversight of the Group’s risk management process has been delegated to the Board Audit and Risk Management Committee. Every banking and regulated entity within the Group has established an independent Internal Audit function.
The respective Boards and Management set out the mandate for Internal Audit, defining its purpose, authority and responsibilities.
Risk management, internal controls & compliance
Our
Gov
erna
nce
Our
Bus
ines
sO
ur F
inan
cial
s
OUR GOVERNANCE FRAMEWORKOUR GOVERNANCE FRAMEWORK

I&M GROUP PLC (FORMERLY I&M HOLDINGS PLC) ANNUAL INTEGRATED REPORT AND FINANCIAL STATEMENTS 2021 I&M GROUP PLC (FORMERLY I&M HOLDINGS PLC) ANNUAL INTEGRATED REPORT AND FINANCIAL STATEMENTS 2021 2726
The respective Boards ensure as above that the Chief Audit Executive in each entity is not responsible for any other function in the entity and functionally reports directly to its Board Audit Committee.
The Internal Audit function provides an independent assurance to its respective Board and Management that the governance, risk management and control processes are adequate and effective to enable the organisation meet its objectives.
In addition, the Group has set up the Group Internal Audit function to provide independent assurance to the Company’s Board through the Board Audit & Risk Management Committee and to inter alia:
• Highlight high risk areas as reported by Internal Audit, External Auditors and Regulators for the respective group entities and action being taken by the respective entity Management and Board Audit Committee;
• Bring to the attention any areas of concern on the adequacy and effectiveness of the respective entity processes for controlling its activities and managing its risks in the areas set forth under the scope of work that may require group direction; and
• Provide quality assurance on the audit activity deployed in the respective entities.
External auditorsThe Board has put in place mechanisms to ensure that external auditors:
• Maintain a high standard of auditing;
• Have complete independence;
• Have no pecuniary relationship with the auditee entity or a related party;
• Bring to the attention of management and supervisor any matters that require urgent action.
Audit and other fees paid to the external auditors during the year have been separately disclosed under Note 15 of the financial statements.
Ethics & social responsibilityCode of ethicsThe Group has in place a Code of Conduct and Code of Ethics that binds all its Directors and Staff to ensure that business is carried out in an ethical, fair and transparent manner, in keeping with the local regulations and international best practices.
The Code of Ethics encompasses, inter alia, matters touching upon safety and health, environment, compliance with laws and regulations, confidentiality of customer information, financial integrity and relationships with external parties. This Code of Ethics is reviewed periodically and amendments are incorporated if necessary.
Conflicts of interestThe Board has in place a policy to provide guidance on what constitutes a conflict of interest. The Board expects its members, both individually and collectively, to act ethically and in a manner consistent with the values of the business. Each Director is obligated to, as far as practically possible, minimize the possibility of any conflict of interest with the Company or the Group by restricting involvement in other businesses that would be likely to lead to a conflict of interest.
Where any Director considers that they may have a conflict of interest in any matter pertaining to the Group or being considered at a Board or Committee meeting, they are required to immediately declare the potential conflict for the Board to review. The Director will excuse themselves from the relevant discussions and will not exercise their right to vote in respect of such matters. Directors also declare their pecuniary interests annually. At the Group subsidiaries, policy is directed not only to Directors but to all senior management and employee who can influence any decisions of these subsidiaries.
Risk based internal audit & assurance (Continued)
Insider trading & related party transactionsThe Group has adopted an Insider trading & related party transactions policy that prohibits Directors, Staff of all Group entities; and contractors who have or may have access to material non-public information regarding the Company from:
• Market Manipulations - artificially inflating or deflating the price of a security or otherwise influencing the behaviour of the market for personal gain
• False Trading and Market Rigging – dissemination of favourable or unfavourable information likely to induce the subscription, sale or purchase of shares by other people, or raise, lower or maintain the market price of shares
• Fraudulently inducing trading in securities
• Front Running - entering into a securities trade to capitalise on advance, non-public knowledge of a large (“block”) pending transaction that will influence the price of the underlying security
• Obtaining gain by fraud
• Communicating unpublished price-sensitive information to other people.
The policy also prohibits anyone having inside information relating to the Group from buying or selling the entity’s securities, except within certain stipulated open periods.
Insiders handling price sensitive information are subjected to preclearance restrictions which requires them to declare their intention to purchase or sell company’s securities before entering into a transaction.
The Board Audit and Risk Management Committee (BARMC) has oversight on insider trading and is made aware of insider trades as well as any breach of the Insider Trading Policy through quarterly returns.
The Group Board has also adopted a related party policy that outlines how to deal with related parties in a transparent manner and at arm’s length
on related party transactions. Related parties, whether body corporate or natural persons, fall into two main groups:
• those that are related to the Group because of ownership interest; and
• those that related otherwise, such as directors and senior officers who may also have some ownership interest in the Group.
In line with the above-mentioned guidelines, the Board has adopted a policy which sets out the rules governing the identification of related parties and the terms and conditions applicable to transactions entered into with them. All related party dealings/transactions are disclosed under Note 38.
Whistle blowing policy The Board has adopted a Whistle blowing policy and appropriate mechanisms to demonstrate its commitment to the highest standards of
openness, probity and accountability. These mechanisms enable staff of the Group to voice concerns in a responsible and effective manner.
The policy is designed to encourage and facilitate employees to raise concerns internally and at a high level and to disclose information which the individual believes shows malpractice or impropriety. The policy is reviewed regularly to ensure relevance with best practice. The policy aims to:
• Encourage employees to feel confident in raising their apprehensions and to question any act that may raise concerns about practice that may bring disrepute to the Group and or cause financial or other loss to the Group and or any malicious act that may adversely affect a staff member.
• Provide avenues for employees to raise those concerns and receive feedback on any action taken.
• Reassure employees that they will be protected from possible reprisals or victimisation if they have reasonable belief that they have made any disclosure in good faith.
Ethics & social responsibility (Continued)
Our
Gov
erna
nce
Our
Bus
ines
sO
ur F
inan
cial
s
OUR GOVERNANCE FRAMEWORKOUR GOVERNANCE FRAMEWORK

I&M GROUP PLC (FORMERLY I&M HOLDINGS PLC) ANNUAL INTEGRATED REPORT AND FINANCIAL STATEMENTS 2021 I&M GROUP PLC (FORMERLY I&M HOLDINGS PLC) ANNUAL INTEGRATED REPORT AND FINANCIAL STATEMENTS 2021 2928
Whistle blowing policy (Continued)• Minimise the Group’s exposure to the damage that can occur when employees circumvent internal mechanisms.
• Let employees know the Group is serious about adherence to the code of conduct and the various policies in place.
The Whistle Blowing Policy is also available on the company's website.
Sustainability & Corporate Social Responsibility (CSR)The Group is very conscious of its Corporate Social Responsibility towards the community and those around it. It is in this endeavour that the Group, through I&M Foundation, has put in place guidelines that aid in carrying out its Corporate Social Responsibility mandate at each entity’s level. The Group, through each of its entities, seeks to deepen its relationship with various stakeholders, while providing opportunities to its staff members to participate in various CSR activities, with a focus towards health, education and skills development, economic empowerment and the environment. Additional details on the activities of I&M Foundation undertaken during the year have been provided further on this report.
Information Technology (IT) policy The Group has implemented an appropriate Information technology policy in its business processes to provide IT enabled solutions to its customers. The Group acknowledges that it is essential for its continued successful operation that the availability, integrity and confidentiality of its information systems and associated data are maintained, in a cost-effective manner and at a level that is appropriate to its business needs. The need for such protection arises because information systems are potentially vulnerable to unwanted events or threats.
The Group’s Information security policy is aimed at enhancement of its ability to collect, store, process and transmit Information. Information Systems and Information Processing are vital to the various entities in the Group in pursuit of its business objectives and it is important that it is managed with regard to:
• Confidentiality – ensuring that information is accessible only to those authorised to have access
• Integrity – safeguarding the accuracy and completeness of information and processing methods
• Availability – ensuring that authorised users have access to information and associated assets when required.
• Effectiveness- the capability to produce the desired results especially to ensure that regulatory, operational and contractual requirement are fulfilled.
• Efficiency- the extent to which resources are used to achieve the desired results.
Procurement policyThe Group has put in place a Group procurement policy aimed at guiding the approach to procurement in the areas of systems implementation or significant upgrades of existing systems, acquisition of significant ICT infrastructure, deployment of standardised specifications such as for branding and marketing and for provision of critical services across the Group entities.
The coordinated approach to procurement of major goods and services is designed to deliver benefits in terms of standardised specifications, platforms for delivery of critical business operations and for deriving synergies, competitive pricing arising from economies of scale, a harmonised approach to business continuity in major business and operational matters and more importantly an efficient and reliable financial and management reporting as may be required from time to time by various stakeholders.
The policy is guided by key governance principles to maintain the highest level of integrity and transparency. It is a pre-requisite that no entity shall seek to gain undue advantage over another in pursuance of any one procurement initiative at Group level. The Procurement policy is also available on the Company’s website.
Ethics & social responsibility (Continued)
I&M recognises and appreciates that engagement with, and active cooperation of its stakeholders is essential for the Group’s strong business performance on a sustainable basis as well as to achieve and maintain public trust and confidence. The Group’s stakeholder management policy is founded on the principles of transparency, active listening, and equitable treatment that favours a consultative and collaborative engagement with all stakeholders.
The Group engages both formally and informally throughout the year to:
• Develop and promote a good understanding of stakeholder needs, interests, and expectations;
• Provide guidance on how the Group should engage with its stakeholders to strengthen and maintain relationships with them;
• Identify the opportunities and threats arising from stakeholders’ material issues; and
• Assist with strategic and sustainable decision-making.
Stakeholder engagement is decentralised within I&M. All I&M Group employees are accountable for managing relationships and meeting expectations of internal and external stakeholders within their areas of responsibility. Should a stakeholder not be satisfied with the service or assistance that they receive from their I&M point of contact, there are a number of opportunities that allow for anonymity (if desired) as well as independence to ensure a voice for concerned stakeholders. These include our client call centre that is the first point of call for all clients’ requests and the section “Contact us” on the Group’s corporate website.
Concerns raised by stakeholders are monitored on an ongoing basis for compliance by the Group Risk and Compliance Team and by the Board Audit and Risk Management Committee.
Other key matters
Stakeholder management
Governance Audit
The Board is committed to ensure that the company has sound Corporate Governance practices and strives for continuous improvement by seeking to identify any loopholes and gaps in the Company’s governance structures and processes. The Board ensures that it subjects the Company to a bi-annual Governance Audit by an accredited Governance Auditor as required by Section 2.11 of the Code. The Company subjected itself to an independent external Governance Audit in 2020 and received an unqualified report noting that the Board has put in place a governance framework that is to a large extent in compliance with the Corporate Governance framework. The next governance audit will be for the year 2022. In the intervening period, the Board remains committed to reviewing and implementing the recommendations from the report to ensure continued enhancement in corporate governance.
Legal & Compliance Audit
In accordance with the Compliance Audit, the Company undertook an external and independent Legal and Compliance Audit FY 2020. The outcome of the audit process confirmed that during the year under review the Company was generally compliant with applicable legislation, regulations, standards, and codes. Capital Markets Authority (CMA) Corporate Governance Assessment Report for the year ended 31st December 2020The CMA conducted a comprehensive assessment on the Group for the year ended 31st December 2020 as per the Code of Corporate Governance Practices for Issuers of Securities to the Public. During the assessment, the results of which were advised in November 2021, CMA reviewed the Group’s governance and sustainability practices and noted the Group’s demonstrated commitment to good governance and sustainability. CMA commended the Group for achieving an overall ‘Leadership’ rating of 87% and for continued efforts to strengthen the company’s governance structures and practices.
Our
Gov
erna
nce
Our
Bus
ines
sO
ur F
inan
cial
s
OUR GOVERNANCE FRAMEWORKOUR GOVERNANCE FRAMEWORK

I&M GROUP PLC (FORMERLY I&M HOLDINGS PLC) ANNUAL INTEGRATED REPORT AND FINANCIAL STATEMENTS 2021 I&M GROUP PLC (FORMERLY I&M HOLDINGS PLC) ANNUAL INTEGRATED REPORT AND FINANCIAL STATEMENTS 2021 3130
Robust risk management is particularly significant for businesses in financial services. In light of this, below is a more detailed description of the risk management framework for I&M Group Plc.
The Group has an integrated risk management framework in place to identify, assess, manage and report risks and risk adjusted returns on a consistent and reliable basis. I&M Group Plc maintains a keen focus on ensuring that the risk management framework at a Group level is robust enough to safeguard the business processes and products of each entity. Given that risk taking is core to the Group’s innovation capacity and ultimately its entrepreneurial success, I&M Group Plc’s approach to risk management is characterised by strong risk oversight at the board level and a strong risk management culture at all levels and across all functions. Such an approach supports and facilitates decision making processes across the Group.
RISK GOVERNANCE
The Enterprise Risk Management (ERM) enables Management across all I&M Group to effectively deal with uncertainty and associated risk as well as opportunity and enhance the capacity to build value across the different geographic locations where it is present. The Group approach to ERM is informed by principles outlined by the Committee of Sponsoring Organisations of the Tread Way Commission (COSO).The COSO Framework addresses the strategic, organisational, operational, analytical, reporting and control and is driven by a governance structure consisting of Board of Directors and Executive Management Committees both at the Group and at subsidiaries and joint venture levels respectively.
ENTERPRISE RISKMANAGEMENT POLICY FRAMEWORK
The Group acknowledges that subsidiaries and the joint venture are separate entities with independent local boards of Directors and Regulatory authorities, as a result and in order to ensure that uniform standards are implemented across all I&M Group entities the Board has established Group Minimum risk standards and policies in line with global best practices, such as the Basel Committee for Banking Supervision. Each subsidiary is expected to develop and benchmark their policies against these minimum requirements as long as these standards do not contradict the local regulations and guidelines.
SUBSIDIARY RISKGOVERNANCE
Our approach to risk management Our approach to risk management (Continued)
Group risk management oversight functionRisk-related issues are taken into consideration in all business decisions and the Group continually strives to maintain a balance between risk and revenue. Additionally, the Group continues to emphasise ongoing education of effective risk management practices to strengthen and enhance a culture of risk consciousness across the Group. The Group Board of Directors sets the tone from the top and inculcates the appropriate risk culture throughout the Group. The Group Board has delegated the oversight of risk and compliance across I&M Group to the Board Audit and Risk Management Committee (BARMC), whose role is to:
• Ensure that Senior Management maintains a sound system of risk management and internal controls to safeguard stakeholders’ interests and the Group’s assets and shall determine the nature and extent of the significant risks which the Board is willing to take in achieving its strategic objectives.
• Approve the undertaking of any major activities such as business strategy, material modifications to existing products, and major management initiatives (such as systems, processes, business model and major acquisitions) that may potentially present material risks including those relevant to the Group’s risk profile, capital and liquidity needs.
• At least annually, review the adequacy and effectiveness of the risk management and internal control systems, including financial, operational, compliance, internal audit and information technology and Cyber risk management controls.
• Review on a quarterly basis the Group ’s risk profile, risk tolerance and risk strategy.
In order to discharge the functions above on a daily basis, the BARMC is supported by the Group Chief Risk Officer (GCRO). The role of the GCRO, is independent from other Senior Management roles and business line responsibilities, and includes:
• Establishing the Enterprise Risk Management framework for the Group.
• Developing Enterprise Risk Management tools, practices, and policies to identify, assess, analyse and report enterprise risks, and with the support of the Senior Management to manage and mitigate these risks according to this enterprise risk management framework.
• Ensuring the Group’s risk management policies and strategies are in compliance with applicable regulations, standards, and strategic imperatives of the Group.
• Providing key inputs into the Group’s enterprise risk or other committee that oversees the enterprise risk management process across the Group.
• Providing guidance and training to promote risk culture- control awareness, ownership and accountability.
The Board of Directors at individual entity level assume the ultimate responsibility for the level of risks taken and are responsible for overseeing the effective implementation of the risk strategies.
The Group Internal Audit function is responsible for providing assurance to the Board regarding the implementation, operation and effectiveness of internal control and risk management within the Group.
All I&M Group subsidiaries have adopted ‘The Three Lines of Defense Approach’, to support accountability in risk management. The three lines are: Business units/teams, Risk and Compliance Management and relevant Risk Committees and Internal Audit.
Our
Gov
erna
nce
Our
Bus
ines
sO
ur F
inan
cial
s
OUR GOVERNANCE FRAMEWORKOUR GOVERNANCE FRAMEWORK

I&M GROUP PLC (FORMERLY I&M HOLDINGS PLC) ANNUAL INTEGRATED REPORT AND FINANCIAL STATEMENTS 2021 I&M GROUP PLC (FORMERLY I&M HOLDINGS PLC) ANNUAL INTEGRATED REPORT AND FINANCIAL STATEMENTS 2021 3332
Third Line of Defense
Board Audit and Risk Management Committee I&M
Group Plc
Fourth Line of Defense Board of Directors I&M Group Plc
Second Line of Defense: Subsidiary Board Risk Committees
Board RiskCommittee
Kenya
Board RiskCommittee
Rwanda
Board RiskCommittee
Tanzania
Board RiskCommitteeBank One, Mauritius
(JV)
Board RiskCommittee
Uganda
First Line of Defense: Group Level Management Committees
Group Assetand LiabilityCommittee
(GALCO
Group Riskand Compliance
Committee(GRMC)
Group CreditRisk Management
Committee(GCRMC)
The detailed risk governance structure is articulated below:
Our approach to risk management (Continued) Our approach to risk management (Continued)
Group risk appetiteThe Group integrates enterprise risk management, strategy, and objective-setting in the strategic planning process. The risk appetite (or tolerance) is aligned to the strategy and objectives and this serves as a basis for continuous identification, assessment and proactive management of risk. The risk appetite expresses the level of risk that the Group is willing to assume in order to achieve its strategic objectives. It includes a set of minimum quantitative metrics and qualitative standards adopted by all subsidiaries in the achievement of their specific country objectives.
Enterprise Risk Management FrameworkThis enterprise risk management framework (ERMF) affirms the Group’s commitment to building a robust and ethical risk management culture, as well as guide towards a consistent approach to managing risk across the Group.
Embedded into the broader Enterprise Risk Management Framework is the Environmental and Financial Risk. Accordingly, the Board has put in place ERM governance structures and processes to identify, assess, manage, monitor and communicate ESG related risks. This is evidenced through our robust risk appetite and policy framework, procedures and management information system which provides a path for the Board and senior management and all other stakeholders to create, preserve and optimise returns and ultimately attain long-term sustainability.
Our approach to Environmental and Social Risk Management is guided by the Committee of Sponsoring Organisations of the Treadway Commission (COSO), which provides principles for applying Enterprise Risk Management (ERM) to ESG related risks, the Central Bank of Kenya Climate Risk Management Guidelines and the Nairobi Securities Exchange ESG guidelines.
I&M Group’s ESG principles are set on the following:
• Incorporating financial risks arising from environmental and social impacts in the strategy and performance setting and ensuring that these are consistent with I&M’s commitment to responsible financing.
• Applying scenario analysis to inform environmental and social risk identification, strategy setting, assessment and embedding those risks into the existing risk management system and business processes.
• Developing an approach to disclosures on the financial risks posed by environmental and social impacts. Our sustainability strategy is based on four focus areas. These are social, environmental, economic and financial sustainability.
• Incorporating an assessment of environmental and social risk factors in line with local laws and IFC Performance Standards as an integral part of our credit risk analysis process. Actual site visits and client corrective action monitoring are central to a robust Environmental and Social Management System (ESMS). In this way, we do not rely solely on permits and approvals.
QUALITATIVE QUANTITATIVEThe Group’s risk appetite framework will involve the following:• Return on Equity (ROE) above Cost of Equity;• Aggregate operational loss not to exceed the
pre-defined threshold;• Ensuring the Group’s Capital Adequacy ratio exceeds
that of required by regulator and the pre-specified buffer at all times; and
• Ensuring the ratio of non-performing assets to total assets does not exceed the pre-defined threshold.
Managed risk appetite that aligns with our vision by:• Living the risk philosophy that ‘sustainability of the
bank’s business and enhancement of our stakeholder’s value will always inform our business decisions’.
• Implementation of the three lines of defense approach to strengthen and embed risk culture where everyone within the bank assumes responsibility for risk and control.
Our
Gov
erna
nce
Our
Bus
ines
sO
ur F
inan
cial
s
OUR GOVERNANCE FRAMEWORKOUR GOVERNANCE FRAMEWORK

I&M GROUP PLC (FORMERLY I&M HOLDINGS PLC) ANNUAL INTEGRATED REPORT AND FINANCIAL STATEMENTS 2021 I&M GROUP PLC (FORMERLY I&M HOLDINGS PLC) ANNUAL INTEGRATED REPORT AND FINANCIAL STATEMENTS 2021 3534
Our approach to risk management (Continued)
Our E&S performance metrics for the year
1. Portfolio review and compliance
Number of transactions meeting E&S high risk threshold that were screened against E&S criteria.
Out of the 267 accounts screened in 2020, 82 required action to be taken to mitigate associated risk. Of this, 21 accounts are fully resolved, valued at 27 billion.
2. Staff training
Number of group staff trained in E&S risk management within the bank.
120
3. Lending practices
Green/sustainable lending products. Introduction of green loans disbursed in renewable energy transition for manufacturing clients.
4. Resource footprint management in operations
Resource reduction initiatives in operations.
• Transitioning to LED lighting in all I&M buildings in order to save on energy.
• The solar photovoltaic panel system at I&M’s new building in Nairobi, Kenya produces more energy than the building requires, with the surplus energy qualifying for trading under Energy Act 2019.
• The I&M Rwanda building is also solar powered and is the country’s first green building.
• Shift from single use plastics and introduction of print paper consumption tracking were a positive step in the sustainability journey, illustrating commitment of the Group’s leadership towards environmental responsibility.
Recap of the year• Continued movement and distancing restrictions forced a desk assessment approach of credit facilities, where there were
fewer client visits and more desk reviews on client compliance. Communication technology was significantly leveraged for continued client engagement and support.
• Training of staff also shifted to online platforms forcing creativity in methods for active trainee engagement and saving on the transport footprint for group travels
Going forwardA maturity framework has been developed to guide on the ESG integration process. It looks holistically at the implementation success of ESG in the bank’s operations, addressing various issues such as governance, sustainability in operations, bank infrastructure management and eventually culminating in quantitative sustainability reporting and a strong ESG group risk culture. The ESG integration journey is expected to come to completion in 2024.
Our approach to risk management (Continued)
Risk category Definition & management
Credit risk Inability or unwillingness of a customer or a counter party to meet contractual financial obligations. Credit risk comprises counterparty risk and concentration risk. The Bank through its approach to prudent lending remained resilient despite the macroeconomic shocks caused by COVID-19. For example, I&M Kenya only restructured about 16% of its loan portfolio against 30% Industry average.
Market risk Arises from adverse changes in market variables, such as interest and foreign exchange rates. Exchange Rate risk arises from a mismatch between the value of assets, liabilities, income and expenditure denominated in foreign currency, whereas Interest Rate risk relates to the sensitivity of a bank’s financial performance to changes in interest rates. This risk is closely monitored at Group and Subsidiaries ALCO and Board Risk Committees.
Operational risk Relates to the loss resulting from inadequate or failed internal processes, people, and systems or from external events and legal risks. The respective Risk and Compliance Management Committees at Subsidiaries and Group level, meets monthly and quarterly respectively to review key operational risk exposures and give guidance on mitigation strategies. The output of this meeting is reviewed quarterly by the Board Risk Committee that has the oversight responsibility of all risks in the Bank.
Liquidity risk Inability of the Group to meet its payment and collateral obligations under extreme but plausible liquidity stress scenarios without recourse to extraordinary Central Bank support. ALCO that is charged with the responsibility of optimizing the Bank’s balance sheet meets every month monitor liquidity risks. Despite the impact of COVID-19, the bank’s liquidity ratio has remained stable and healthy.
Strategic risk This risk is the current and prospective impact on earnings or capital arising from adverse business decisions, improper implementation of decisions, or lack of responsiveness to industry changes.
Compliance risk The risk of legal or regulatory sanctions, financial loss, or loss to reputation that a group entity may suffer as a result of its failure to comply with all applicable laws, regulations, codes of conduct and standards of good practice.
Country risk The risk that economic, social, and political conditions and events in a foreign country will adversely affect the Group’s financial condition.
Transfer risk The risk that a government may impose restrictions on the transfer of funds by debtors/corporations (subsidiary) in the country in question to foreign creditors or parent company for financial or other reasons.
Information, communication and technology risk
This represents threats to information systems which may result in the compromise of confidentiality, integrity or availability of the information being processed, stored, or transmitted by those systems.
Cyber security risk Any risk associated with financial loss, disruption or damage to the reputation from failure, unauthorized or erroneous use of information systems.
Reputational risk This is the potential that negative publicity regarding an Group’s business practices, whether true or not, will cause a decline in the customer base, costly litigation, or revenue reductions.
Legal risk This is the risk of losses arising from an unintentional or negligent failure to meet a professional (legal) obligation to specific clients (including fiduciary and suitability requirements), or from the nature or design of a product.
Third party risk This is risk that arises from the Group relying on outside parties to perform business services or activities on its behalf.
Environmental, social and governance risk
This is the consideration of non-financial risks arising from the environment and sustainability, reputation or brand, legal, technological, product or service quality, labor, ethical conduct, compliance, and strategic considerations.
Business continuity risk
The capability of the Group and its entities to continue delivery of products or services at acceptable predefined levels following a disruptive incident. It also includes the possibility of financial loss, reputational damage to a group entity as a result of not adequately planning for natural disasters, terrorist incidents, or blackouts etc. that could lead to business disruptions. Through effective BCM, COVID-19 pandemic did not have any major business disruptions on the Group. The Group quickly adopted split operations as well as remote working that ensured seamless provision of baking services to customers under the guidance of Crisis Management Committee that continues to meet weekly to oversee the implementation of the Crisis Management Plan.
In line with global best practices, the Group categorises and defines its risks as follows:
Our
Gov
erna
nce
Our
Bus
ines
sO
ur F
inan
cial
s
OUR GOVERNANCE FRAMEWORKOUR GOVERNANCE FRAMEWORK

I&M GROUP PLC (FORMERLY I&M HOLDINGS PLC) ANNUAL INTEGRATED REPORT AND FINANCIAL STATEMENTS 2021 I&M GROUP PLC (FORMERLY I&M HOLDINGS PLC) ANNUAL INTEGRATED REPORT AND FINANCIAL STATEMENTS 2021 3736 2020 ANNUAL REPORT & FINANCIAL STATEMENT We Are OnYour SideWhatever
your nextsteps, weare on your side#StayWinning
I&M Group Plc Bank is regulated by the Central Bank of Kenya
www.imbankgroup.com
2020 ANNUAL REPORT & FINANCIAL STATEMENT
OUR BUSINESS
THE GROUP IS WELL POSITIONED TO EXPLOIT OPPORTUNITIES TO SOLIDIFY OUR MARKET LEADERSHIP POSITION

38
Where we operateSubsidiaries outside Kenya contribute 34% to the Group’s total Assets.
RWANDA
MAURITIUS
KENYA UGANDA
Over 400kCustomersBranches
86 Over3.5kShareholdersATMs
123 Over2.5kStaff
Bank One Ltd
• 35,000+ customers
• 8 Branches
• 10 ATMs
• 424 staff
I&M Bank (T) Ltd
• 17,000+ customers
• 8 Branches
• 9 ATMs
• 182 staff
I&M Bank (Rwanda) Plc
• 65,000+ customers
• 18 Branches
• 33 ATMs
• 424 staff
• 75,000+ customers
• 14 Branches
• 17 ATMs
• 314 staff
I&M Bank Ltd
• 210,000+ customers
• 39 Branches
• 54 ATMs
• 1,157 staff
TANZANIA
I&M Bank Uganda Ltd (formerly Orient Bank Ltd, Uganda)
OUR BUSINESS
I&M GROUP PLC (FORMERLY I&M HOLDINGS PLC) ANNUAL INTEGRATED REPORT AND FINANCIAL STATEMENTS 2021
OUR BUSINESS (Continued)
Customer segments
Commercial banking represents the largest portion of the Group’s assets with presence throughout the East Africa region. The products and services are segmented to meet the needs of each customer base and which in turn stems from our strategic goals of being the best bank for our customers. This now includes increased convenience through the digitisation of our services.
Although I&M Bank is traditionally known for its large customer base of high net worth customers and large corporate clients, the Bank has also been recognised for its services to small and medium-sized enterprises including many that have grown with the Bank.
Premium Banking:O�ering top notch services to high
networth individuals
Business Banking: Providing �nancial solutions across medium, small and micro businesses
Corporate Banking:Providing an array of �nancial solutions for large corporates
Personal Banking:Delivering the highest level of personal �nancial services
Commercial Banking(Retail, SME, Corporate & Institutional)
Bancassurance
Financial Advisory Services
Custody and Investment Services
Real Estate Investment
1) Commercial Banking (.....)2) Bancassurance
3) Custody & Investment Services 4) Financial Services
5) Real Estate Investment
Products and services
What we offer
Who we serve
I&M GROUP PLC (FORMERLY I&M HOLDINGS PLC) ANNUAL INTEGRATED REPORT AND FINANCIAL STATEMENTS 2021 39
Our
Gov
erna
nce
Our
Bus
ines
sO
ur F
inan
cial
s

41I&M GROUP PLC (FORMERLY I&M HOLDINGS PLC) ANNUAL INTEGRATED REPORT AND FINANCIAL STATEMENTS 202140
KenyaIn Kenya, I&M Bank remained resilient during the period under review to deliver strong and consistent results in 2021. The Bank’s results depict a modest improvement during the period under review in line with the set targets under our iMara 2.0 strategy. Profit before tax for the period was Kshs 10.6 billion, reflecting a marginal increase of 3%. However, in terms of top line growth, the Bank reported the highest total net revenue growth of 119% as compared to its peer banks. The Balance sheet closed at Kshs 308 billion, 8.5% higher than the previous year.
The Bank is accelerating its digital transformation initiatives to position itself for future growth. In 2021, significant strides were made in the implementation of various initiatives. These included the launch of the new mobile and internet banking platform dubbed ‘I&M On- The-Go’ through a partnership with Backbase – a leading global digital banking platform provider, the launch of wealth management and advisory services, unsecured personal lending, and MSME banking offering.
TanzaniaThe Bank in Tanzania reported an increase of 21% in profitability, closing the year with a Profit Before Tax of Tzs 10.2 billion (Kshs 492 million). The balance sheet grew by 15% year on year, with Total Assets at Tzs 587.09 billion (Kshs 28.8 billion) as of December 2021. In addition, asset quality improved significantly with a reduction in the gross non-performing loans from 16.1% in 2020 to 9.2% in 2021.
As part of the Bank’s medium-term strategy to drive business growth through improved customer value proposition and enhancing its presence in the digital space, the Bank in partnership with Airtel Tanzania and Comviva, launched a unique mobile lending platform named ‘Kamilisha’. Demonstrating its product and service innovation, the Bank was among the first in East Africa to launch the ‘Rafiki Chat WhatsApp Banking’. This not only makes banking convenient and easier, but customers can also check balances and transact through this platform.
Other initiatives during the year included the launch of Select Banking catering to the affluent customers with exceptional product offerings and specialised services as well as the introduction of Visa multicurrency Prepaid cards.
RwandaI&M Bank in Rwanda reported a Profit Before Tax for the year of Rwf 11 billion (Kshs 1.2 billion), a 41% increase compared to Rwf 7.8 billion (Kshs 0.9 billion) in 2020. The balance sheet grew by 11%, with Total Assets closing at Rwf 466 billion (Kshs 50.9 billion). This growth was driven by growth in net loans and advances of 7% and an improved operating environment.
In 2021, the Bank continued its digitisation journey focused on increasing banking convenience and accessibility. Some of the initiatives undertaken within the year include introducing WhatsApp banking, launch of 14 contactless ATMs in major tactical locations and the launch of MSME banking in partnership with SPENN. The MSME offering has seen exponential growth since its launch resulting in a 72% growth in customer base.
Keeping in line with the Group’s sustainability objectives, in September 2021, I&M Rwanda relocated to Rwanda’s first ‘green’ building. The structure has the roofing overlaid with solar panels that allows the building to generate solar energy for its power requirements while the siphonic drainage system allows the building to capture and reuse rainwater for all its water needs.
UgandaThe Group’s consolidated results include results from the Ugandan Bank for 8 months following the completion of the acquisition of 90% shareholding in Orient Bank on 30th April 2021. The Bank was rebranded as I&M Bank Uganda Limited during the year and in this period the focus has been to integrate it as part of the Group. Significant efforts were expended to steer the Bank on a growth trajectory based on solid fundamentals including loan book cleanup and alignment with the Group’s policies, systems, and processes.
The Bank recorded a post-acquisition loss of Ugx12.1 million (Kshs 373 million) largely driven by loan loss provisions as the Bank worked on improving its asset quality.
Group Executive Director'sStatement
Group Executive Director's Statement (Continued)
OUR BUSINESSOUR BUSINESS
Our
Gov
erna
nce
Our
Bus
ines
sO
ur F
inan
cial
s
Sarit S Raja Shah
IntroductionAs we look back on the year, I am pleased to note that the Group successfully navigated 2021 despite the several adverse macroeconomic challenges it faced. Two years into the pandemic, economies and societies worldwide continue to face significant impacts calling for changes in the way people live and work. In addition, market conditions resulted in a significant reduction in foreign currency trading since Q2 2021.We, however, remain hopeful for an improvement in conditions soon with the significant progress in vaccination campaigns worldwide and behavioural changes as the world comes to terms with this new normal. In addition, we appreciate the countermeasures implemented by central banks and governments at the onset of the pandemic, which have supported the stability of our financial systems.
Similar to other financial institutions, the Group acknowledges and continues to play its critical role in the economy, relying on accumulated capital reserves, operational efficiency, enhanced risk management practices, and other effective countermeasures implemented to ride out the current crisis.
Financial performance and operationsOn an overall basis, we maintained consistent year-on-year performance in 2021. Compared to the prior year’s performance, the Group Profit Before Tax saw a growth of 8% to Kshs 11.9 billion, including a loss of Kshs 0.37 billion in I&M Uganda, driven by resizing and consolidation of the subsidiary.
The Group recorded a 16% year-on-year growth in its balance sheet, mainly supported by 13% growth in customer deposits and 12% growth in loans and advances.
The level of non-performing loans has remained relatively static while the loan loss provisions increased by 11% as the Group continues to focus on gradually increasing the coverage ratio. The recovery of non-performing loans remained subdued due to market conditions that continue to adversely affect our business.
Our emphasis remains on underwriting good quality assets, and as a result of consistent efforts on this front, we have succeeded in reducing our net NPL ratio from 4.2% in December 2020 to 2.9% as of December 2021.
I&M GROUP PLC (FORMERLY I&M HOLDINGS PLC) ANNUAL INTEGRATED REPORT AND FINANCIAL STATEMENTS 2021

I&M GROUP PLC (FORMERLY I&M HOLDINGS PLC) ANNUAL INTEGRATED REPORT AND FINANCIAL STATEMENTS 2021 I&M GROUP PLC (FORMERLY I&M HOLDINGS PLC) ANNUAL INTEGRATED REPORT AND FINANCIAL STATEMENTS 2021 4342
Bank OneContinued support from the Central Bank and the Government of Mauritius on initiatives such as social payment support mechanisms, forbearance, the provision of foreign currency liquidity to the market and the Mauritius Investment Corporation provided a cushion as the island continued to weather the impact of the COVID-19 pandemic.
Despite the challenging operating environment, the Bank successfully turned around to achieve a profit after tax of Mur 522 million (Kshs 1.3 billion) from the Mur 532 million (Kshs 1.5 billion) loss reported in 2020. The improved performance was attributed to recoveries as well as a growth of 14% in non-funded income.
The Bank remains focused on its strategy to become a bridge to Sub Saharan Africa supported by its digitisation plans and investments in systems and its people to drive business efficiencies. One such initiative is launching a Universal Payment Solution (POP) which enables instant payments across the domestic banking sector.
Non-banking subsidiariesOur non-banking subsidiaries continue to add value to our business with I&M Bancassurance Intermediary Ltd, reporting a 24% growth in its commission revenues. In addition, I&M Realty, the Group’s real estate Holding Company, recorded a 35% growth in revenue and 28% profit before tax. However, I&M Burbidge Capital Limited, the Group’s financial services subsidiary, saw a decline in revenues of 13% year on year and registered a Loss Before Tax of Kshs 9 million on the back of adverse market conditions.
iMara 2.0 2021 was the first year into our 3-year iMara 2.0 Strategy. The journey was not without challenges as we faced the pandemic’s second, third, and fourth waves. Some of the markets we operate in experienced severe effects resulting in lockdowns that impacted the business environment and strategy performance.
As a Group, implementing our digital transformation remains a priority as we move into the new banking era. Our drive for sustainable growth calls for portfolio diversification and bold decisions toward reinforcing all our resources that support our value creation. As a result, 2021 saw the I&M Group undertake significant investments and revamp products in response to the changing business environment to ensure we continue to deliver value to all our stakeholders.
Digitisation progress across the region for revenue diversificationIn response to the changing business environment and the drive to grow the business in uncertain times, the Group has focused on digitising the business and exploring revenue diversification opportunities. In addition, the Group has made significant investments toward reinforcing sustainable infrastructure and systems for operational efficiency. The digitisation journey supporting business initiatives has increased our cost to income ratio to 46%, up from 42% in 2020. A sizable portion of the increase in cost to income ratio relates to the rebranding and integration of I&M Uganda, and excluding this, the ratio was at 43%.
Some of the initiatives undertaken include launching the I&M ‘On-The-Go’ digital platform at our anchor subsidiary in Kenya. Through this platform, our customers can now enjoy our services and convenience at the touch of a button and provide critical support in driving up our volume of digital transactions. Most of our Retail Customers in Kenya have been successfully onboarded on the platform. We are working to roll out I&M ‘On-The-Go’ at the subsidiaries as we continue to build our digital services across the region, aiming to have 90% of all our Group transactions digital by 2023.
Our subsidiaries have also undertaken digital transformation initiatives that are showing positive results.
New product development for revenue diversificationGuided by our strategic focus on revenue diversification through products and services, the Group supported the launch of I&M Rwanda’s SME offering tailored towards the micro, small and medium-sized enterprises (MSMEs), which has experienced exponential growth since its launch in March 2021. We have supported over 2200 new SMEs through this offering, resulting in a 72% growth in the customer base. In addition, our wealth management business launched in Kenya through I&M Capital Limited is showing good momentum with over Kshs 700Mn in assets under management.
We are glad to report that the initiatives undertaken within the Group entities are leading to improved customer experience, evident from the net promoter score (NPS) of 71% in 2021. We are determined to sustain this NPS performance trend as we continue to entrench our ‘customers first’ philosophy fully.
Group Executive Director's Statement (Continued)
OUR BUSINESS OUR BUSINESS
Cultural transformation programThe Group embarked on a cultural transformation program in the latter half of 2021 to strengthen our ‘employer brand’ and ‘employee value proposition’ that will differentiate us in the industry. This is a critical enabler in achieving the iMara 2.0 strategy. We established the ‘I&M Way’ through a series of internal engagements and brainstorming sessions. This, not only defines our purpose as “Empowering your Prosperity” but also sets out the core behaviours at the heart of our culture being collaborative, candid, agile, data-driven, empowering, and evaluating risk and reward to make risk-intelligent decisions.
OutlookIn the short to medium-term we expect the East African economies to recover and gradually rebound to growth rates of over 5%. However, while the 2022 GDP growth is projected at above 4%, we remain cognizant of the downside risks emanating predominantly from the Russia-Ukraine conflict, such as supply chain challenges, inflationary pressures, currency depreciation, and a deteriorating current account deficit.
Against the backdrop of this outlook in our operating environment, we remain confident that our investments in infrastructure and systems and the revamp of our product offerings will enable the delivery of sustainable value to our stakeholders.
Going forward, we remain committed to making steady progress toward further enhancing our medium to long-term value for our shareholders by delivering best-in-class services for our customers.
We want to thank you for continuing to work with us as your trusted financial partner!
Sarit S Raja ShahGroup Executive Director29 March 2022
Group Executive Director's Statement (Continued)
Our
Gov
erna
nce
Our
Bus
ines
sO
ur F
inan
cial
s

I&M GROUP PLC (FORMERLY I&M HOLDINGS PLC) ANNUAL INTEGRATED REPORT AND FINANCIAL STATEMENTS 2021 I&M GROUP PLC (FORMERLY I&M HOLDINGS PLC) ANNUAL INTEGRATED REPORT AND FINANCIAL STATEMENTS 2021 4544
Group leadership team
Sarit S Raja ShahGroup Executive Director
Robin BairstowChief Executive Officer,I&M Bank (Rwanda) Plc
Chris LowRegional Director
Kihara MainaChief Executive Officer,I&M Bank Ltd, Kenya
Baseer MohammedChief Executive Officer,I&M Bank (T) Ltd, Tanzania
Silas MutukuChief Executive Officer,I&M Capital Ltd
Edward BurbidgeChief Executive Officer,I&M Burbidge Capital, Kenya
Mark WatkinsonChief Executive Officer & Executive Director
OUR BUSINESS OUR BUSINESS
Group management team
Bhartesh ShahGroup Chief Operations Officer
Amit BudhdevGroup Chief Finance Officer
Zipporah GitauGroup Chief Risk Officer
Gauri GuptaGroup GM, Corporate Advisory
Josephine MwanikiGroup GM, Human Resources
Rohit GuptaGroup Chief Information Officer
Suprio Sen GuptaGroup GM, Marketing
Ruma ShahGroup GM, Internal Audit
Kennedy MakaleGroup GM, Shared Services
Sandeep SinhaGroup GM, Credit

I&M GROUP PLC (FORMERLY I&M HOLDINGS PLC) ANNUAL INTEGRATED REPORT AND FINANCIAL STATEMENTS 2021 I&M GROUP PLC (FORMERLY I&M HOLDINGS PLC) ANNUAL INTEGRATED REPORT AND FINANCIAL STATEMENTS 2021 4746
OUR BUSINESS
Financial performance highlights Dec 2021 vs prior year
1
23
4
5
67
8
PROFIT BEFORE TAX
Mn22%
Bn
13%
NET OPERATING INCOME
12%
Bn
LOANS & ADVANCES
13%
Bn
CUSTOMER DEPOSITS
16%
Bn
TOTAL ASSETS
Absolute4%
%
COST/INCOME RATIO
Absolute2%
%
RETURN ON EQUITY
Absolute0.9%
%
RETURN ON ASSETS
Our
Gov
erna
nce
Our
Bus
ines
sO
ur F
inan
cial
s
Non-financial performance highlights Dec 2021 vs prior year
Number of unique innovations
79%
%742020
Number of employees
25362021
21762020
Transactions done on digital channels
2021
72020
52021
82%
%752020
System uptime
Cyber risk maturity
score
2021
98.62021
99.62020
%
%
OUR BUSINESS
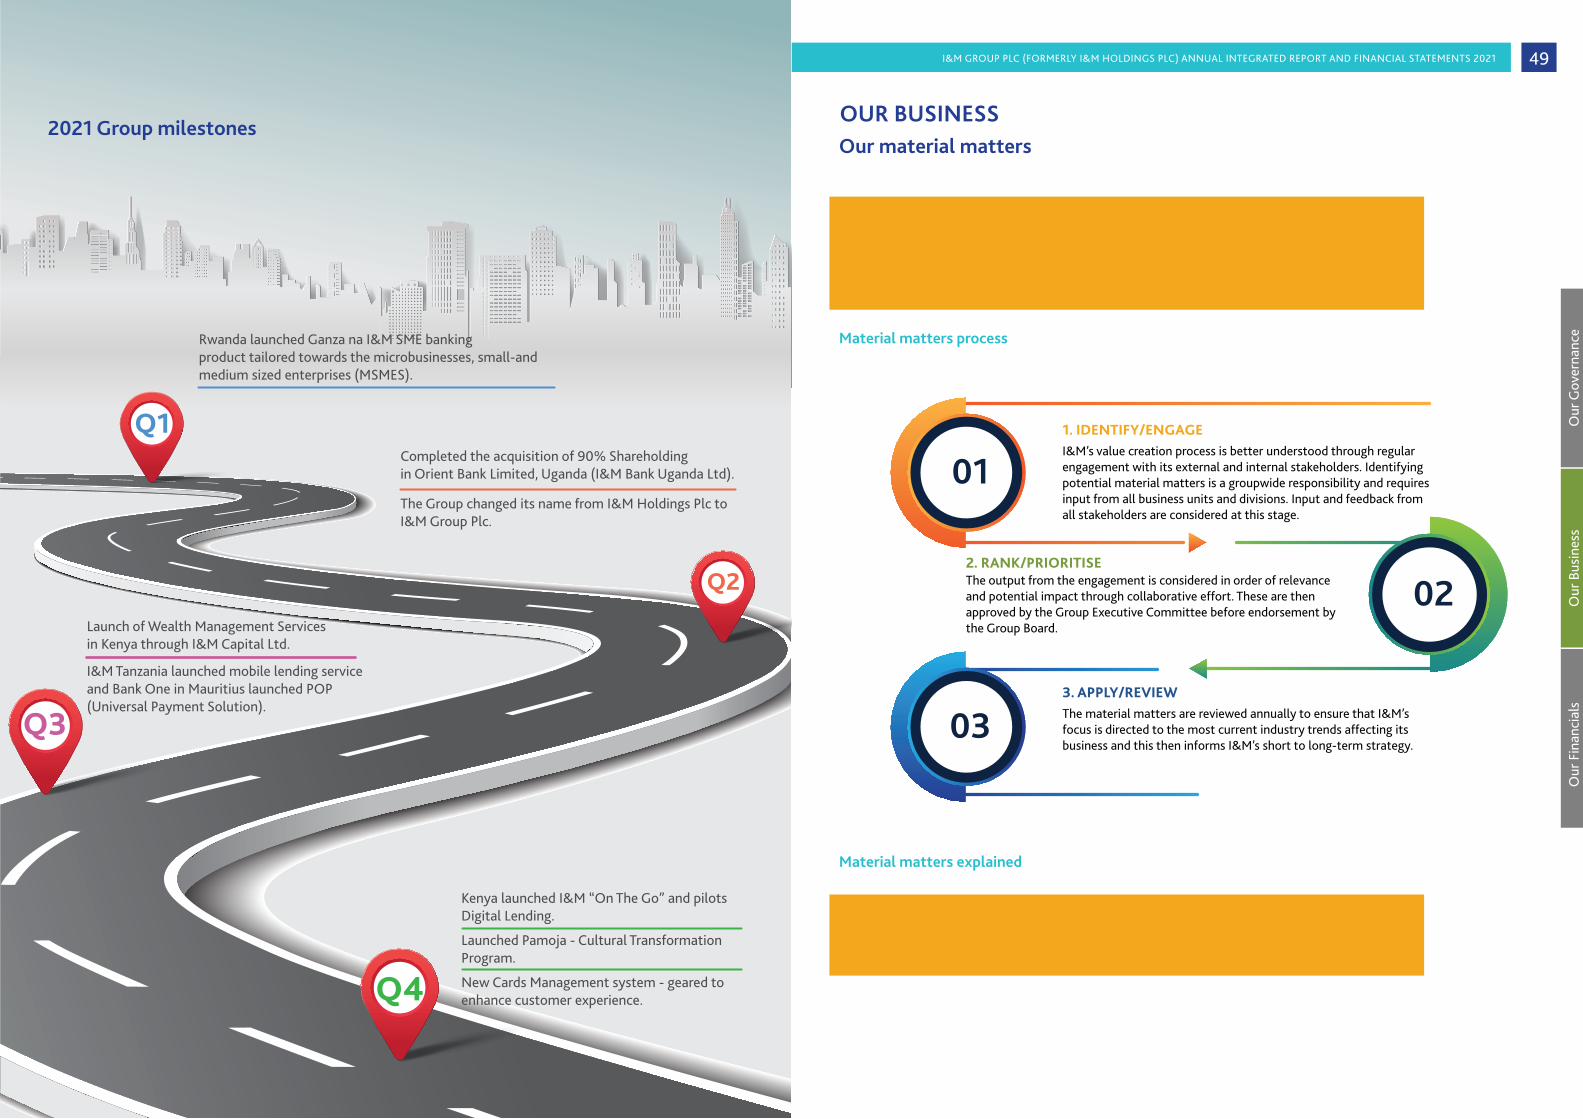
I&M GROUP PLC (FORMERLY I&M HOLDINGS PLC) ANNUAL INTEGRATED REPORT AND FINANCIAL STATEMENTS 202148
Q4
Q1
Q2
Q3
Rwanda launched Ganza na I&M SME banking product tailored towards the microbusinesses, small-and medium sized enterprises (MSMES).
Launch of Wealth Management Services in Kenya through I&M Capital Ltd.
I&M Tanzania launched mobile lending service and Bank One in Mauritius launched POP (Universal Payment Solution).
Kenya launched I&M “On The Go” and pilots Digital Lending.
Launched Pamoja - Cultural Transformation Program.
New Cards Management system - geared to enhance customer experience.
Completed the acquisition of 90% Shareholding in Orient Bank Limited, Uganda (I&M Bank Uganda Ltd).
The Group changed its name from I&M Holdings Plc to I&M Group Plc.
2021 Group milestones
I&M GROUP PLC (FORMERLY I&M HOLDINGS PLC) ANNUAL INTEGRATED REPORT AND FINANCIAL STATEMENTS 2021 49
Our material matters
I&M Group annually reviews the matters that substantively impact its commercial viability, social relevance, and quality of stakeholder relationships. It is a collaborative internal process that engages staff, senior management, and the Board. Through this process, the Group identifies the matters most frequently raised by the different stakeholders and ranks and prioritises matters with higher importance. This informs the strategy, policies and action plans taken by the Group to ensure the Group’s strategy remains relevant.
Material matters process
I&M’s value creation process is better understood through regular engagement with its external and internal stakeholders. Identifying potential material matters is a groupwide responsibility and requires input from all business units and divisions. Input and feedback from all stakeholders are considered at this stage.
1. IDENTIFY/ENGAGE
The material matters are reviewed annually to ensure that I&M’s focus is directed to the most current industry trends affecting its business and this then informs I&M’s short to long-term strategy.
3. APPLY/REVIEW
The output from the engagement is considered in order of relevance and potential impact through collaborative effort. These are then approved by the Group Executive Committee before endorsement by the Group Board.
2. RANK/PRIORITISE
01
03
02
Material matters explained
In 2021, we reviewed the material matters through the above process. The matters identified remain valid to the Group and these have been ranked based on their relevance and potential impact to the Group’s business.
Next, we elaborate on the top 5 material matters to I&M and how the Group responds to these matters.
OUR BUSINESS
Our
Gov
erna
nce
Our
Bus
ines
sO
ur F
inan
cial
s

I&M GROUP PLC (FORMERLY I&M HOLDINGS PLC) ANNUAL INTEGRATED REPORT AND FINANCIAL STATEMENTS 2021 I&M GROUP PLC (FORMERLY I&M HOLDINGS PLC) ANNUAL INTEGRATED REPORT AND FINANCIAL STATEMENTS 2021 5150
Our material matters (Continued)
Marco economic environment and continued uncertainty around COVID-19 The connection to and the dependency on the macroeconomic environment and key economic drivers impacts our ability to create value and our response to them, thus having a significant impact on our stakeholders. Additionally, increasing regulation within the East African banking industry calls for careful consideration on how to navigate the new regulatory environment to maintain our operational standards to avoid disruption to the services we provide our customers.
Evolving consumer demands in the face of changing technologies and increased competition The banking sector has increasingly become more competitive with a growing number of non-bank financial institutions such as insurance companies, venture capital-funded fintech, currency exchanges, payment service providers and microfinance organisations providing varied financial services. As a result, successful financial institutions need to keep pace with the evolving industry by focusing on what customers want today and anticipating how their needs will evolve in the coming years.
We continue to rely upon our sound risk management policies practices and policies to manage this. At the same time we remain focused on achieving our growth and expansion strategies for a well-diversified and balanced portfolio that considers short, medium, and long-term risks and returns regionally and across the financial services sector.
Over the past few years, I&M has invested significantly in upgrading its core IT systems and its product and service delivery applications. In addition, we have rolled out our “digital factory” called iCube to develop transformative digital financial solutions aimed at improving operational efficiencies and enhancing customer delivery standards.
Our corporate strategy captures the customer experience in its design and delivery, prioritising the customer needs and expectations. The strategy also includes a cultural transformation program to embrace a digital and agile culture. Performance is measured through targets set to have at least 80% of total transactions via digital channels and a Net Promoter Score of above 55%.
Increasing threats of cyber crime and fraudInnovations in financial technology have led to new types of financial crimes, particularly cyberattacks. Banks are therefore required to invest significant sums in antivirus and cybersecurity software and continuously train their staff on preventing and detecting cybersecurity fraud to ensure data security.
Existence of illicit financial flows and unethical conduct The banking industry plays a vital role through enhanced customer awareness, anti-money laundering policies, procedures, and sound corporate governance policies to support the global efforts to curb illicit flows that deprive national governments of tax revenue.
The Group has instituted strong controls at all its entities through stringent “Know Your Customer” processes, anti-money laundering policies and guidelines, and counter anti-money AML/CFT tools to prevent illicit funds from being held, received, transferred and managed by any entity across the Group. The Group has a zero-tolerance policy for bribery and corruption and has established policies that reinforce the Group’s commitment to conducting its business ethically.
We measure this through fines and penalties levied for breaches. No penalties nor breaches have been incurred due to non-compliance related to proceeds of crime and money laundering, prudential, or banking act requirements.
Climate change, environmental degradation, and resource constraints Our economy is dependent on natural resources; therefore, as a financial institution, our core role is to channel capital to commercially, socially and environmentally sustainable projects in the long term. At the same time, our risk management considers the impacts of climate and other environmental risks disproportionately felt in regions like ours.
We see safeguarding the environment as an intrinsic part of long-term commercial success. This is reflected in our credit policy, new business/product development efforts, environmental footprint and commitment to the I&M Foundation.
We measure our success by complying with environmental and sustainability screening requirements and increasing green loans in our portfolio as a business. Core to our strategy is data-driven decision-making, which includes data and risk analysis related to climate change and other environmental and social trends. We also measure success through the work of the I&M Foundation by monitoring the spending and impact under each of the four pillars: Environment & Conservation, Education and Skills Development, Economic Empowerment and Enabling Giving.
I&M respects and takes our clients' data privacy seriously and strives to prevent cyber risk and the occurrence of data breaches. Hence, we have rolled out cyber risk e-learning for all employees and applicable partners. All this has enabled I&M to detect cyber-crime attempts before they materialize and prevent malicious actors’ activities (from thousands of phishing emails to zero)
One of our key performance indicators measures the successful prevention of incidents of cyber-attacks and fraud measured through our Cyber Risk Maturity Score with a minimum target of 82% for 2021. Efforts to manage cyber risk have been replicated across the Group and we continue to enhance our cyber maturity by setting annual key performance indicators on the following components:• Management & oversight • Cyber security controls • External dependencies • Incident management & resilience • Threat intelligence
The strategic performance in these areas is measured via profit before tax and return on equity. I&M’s consistent, positive, long-term financial performance illustrated by average return on equity levels of 15% in the last five years and growing profit before tax coupled with an excellent governance track record is a testimony to our solid and sustainable business model.
Material matter Strategic response How we measure success
OUR BUSINESS
Our
Gov
erna
nce
Our
Bus
ines
sO
ur F
inan
cial
s
In addition to these, I&M Group continues to monitor the following areas that have relevance to our business operations:
• Enterprise agility and purpose - The rapid pace of digitisation in the financial services industry has resulted in changes in human resource requirements. Banks now require skill sets not previously required, yet today are considered critical to the present and future sustainability of the institutions in which they work. The Group is very aware of these changes and is taking steps towards addressing them through the roll-out of the cultural transformation program dubbed ‘Pamoja’ as we build a collaborative, agile, and digitally focused workforce.
• Business diversification - The Group continuously assesses its geographical presence and considers opportunities for entry to new markets, client segmentation, and product offerings.
• Evolving consumer protection and public perception in the banking sector - Financial services offerings are continuously enhanced through innovative information and automation technology. Therefore, as a financial institution, we must keep pace with the evolving industry by focusing on what customers want today and anticipating what they will want in the coming years.
• Equitable economic growth - As a Group, we remain cognisant of the difficulties faced in accessing financing for lower-income individuals and its impact on job creation and opportunities for women and youth. The Group continues to ramp up product offerings to the micro and small business segment. More recently, we have seen success in I&M Rwanda, witnessing exponential growth in its MSME product.
The Group will continue to determine and assess material matters through a collaborative process to ensure our corporate strategy and action plans correspond to the matters identified.
Our material matters (Continued)
OUR BUSINESS

I&M GROUP PLC (FORMERLY I&M HOLDINGS PLC) ANNUAL INTEGRATED REPORT AND FINANCIAL STATEMENTS 2021 I&M GROUP PLC (FORMERLY I&M HOLDINGS PLC) ANNUAL INTEGRATED REPORT AND FINANCIAL STATEMENTS 2021 5352
S U S T A I N A B I L I T Y P I L L A R S
FIN
AN
CIAL
ECONOMIC SOCIAL ENVIRO
NM
ENTA
L
CU
STOM
ERS STRATEGIC PARTNERS
EMPL
OYE
ES
OUR PURPOSEEmpowering your Prosperity
STRATEGIC ASPIRATIONEastern Africa’s Leading
Financial Partner for Growth
CORE VALUESIntegrity, Trust, Respect,
Innovation, Courage
I M P A C T I N G
13% Growth in Deposits8% Growth in Shareholders Equity12% Return on Average Equity
Driving business growth
Building a resilient organisation
Optimising the operating model
INPUTCapital Value Created
OUR PURPOSEEmpowering your Prosperity
STRATEGIC ASPIRATIONEastern Africa’s Leading
Financial Partner for Growth
CORE VALUESIntegrity, Trust, Respect,
Innovation, Courage
FINANCIAL
HUMAN &INTELLECTUAL
SOCIAL &RELATIONSHIP
NATURAL
OUTPUT OUTCOMESValue Shared
I&M Group’s 2021 retained earnings.
117 additional loans restructured.
125 scholarships provided through the I&M Foundation
Supporting the recovery of our customers' businesses post COVID-19 Pandemic
Dividends to shareholders in 2021.
Kshs 44Bn
Kshs 2.5Bn
2021 overall Group Engagement score
Group’s transactions executed digitally
73%
79%
Kshs 12Mn
Value of the digital transactions in 2021
Kshs 534Bn
Group commitment to the environment contributed to screening loans worth
Kshs 27 Bn
Solar power generated at1 Park Avenue ( I&M HQ)
6.2 MW
GROUP STRATEGIC OBJECTIVES
BUSINESS ACTIVITIES
Commercial Banking / Bancassurance / Real EstateFinancial Advisory / Custody & Investment Management
Private Banking
2536 Number of staff
12mn Revenue per staff
Investment in digital initiatives
2021 I&M Foundation investment of KShs 206Mn
Revenue per staff
Initiatives to monitor carbon footprint
• Green products
• Renewable energy generation
Male:Female 58:42 Gender ratio
OUR BUSINESS OUR BUSINESS
How we create value How we create value (Continued)
S U S T A I N A B I L I T Y P I L L A R S
FIN
AN
CIAL
ECONOMIC SOCIAL ENVIRO
NM
ENTA
L
CU
STOM
ERS STRATEGIC PARTNERS
EMPL
OYE
ES
OUR PURPOSEEmpowering your Prosperity
STRATEGIC ASPIRATIONEastern Africa’s Leading
Financial Partner for Growth
CORE VALUESIntegrity, Trust, Respect,
Innovation, Courage
I M P A C T I N G
13% Growth in Deposits8% Growth in Shareholders Equity12% Return on Average Equity
Driving business growth
Building a resilient organisation
Optimising the operating model
INPUTCapital Value Created
OUR PURPOSEEmpowering your Prosperity
STRATEGIC ASPIRATIONEastern Africa’s Leading
Financial Partner for Growth
CORE VALUESIntegrity, Trust, Respect,
Innovation, Courage
FINANCIAL
HUMAN &INTELLECTUAL
SOCIAL &RELATIONSHIP
NATURAL
OUTPUT OUTCOMESValue Shared
I&M Group’s 2021 retained earnings.
117 additional loans restructured.
125 scholarships provided through the I&M Foundation
Supporting the recovery of our customers' businesses post COVID-19 Pandemic
Dividends to shareholders in 2021.
Kshs 44Bn
Kshs 2.5Bn
2021 overall Group Engagement score
Group’s transactions executed digitally
73%
79%
Kshs 12Mn
Value of the digital transactions in 2021
Kshs 534Bn
Group commitment to the environment contributed to screening loans worth
Kshs 27 Bn
Solar power generated at1 Park Avenue ( I&M HQ)
6.2 MW
GROUP STRATEGIC OBJECTIVES
BUSINESS ACTIVITIES
Commercial Banking / Bancassurance / Real EstateFinancial Advisory / Custody & Investment Management
Private Banking
2536 Number of staff
12mn Revenue per staff
Investment in digital initiatives
2021 I&M Foundation investment of KShs 206Mn
Revenue per staff
Initiatives to monitor carbon footprint
• Green products
• Renewable energy generation
Male:Female 58:42 Gender ratio

I&M GROUP PLC (FORMERLY I&M HOLDINGS PLC) ANNUAL INTEGRATED REPORT AND FINANCIAL STATEMENTS 2021 I&M GROUP PLC (FORMERLY I&M HOLDINGS PLC) ANNUAL INTEGRATED REPORT AND FINANCIAL STATEMENTS 2021 5554
OUR BUSINESS
Our
Gov
erna
nce
Our
Bus
ines
sO
ur F
inan
cial
s
Our capitals
Financial CapitalI&M Group is well-capitalised with diverse funding solutions that support its business growth strategy and regulatory requirements.
In 2021, the Group utilised a mix of customer deposits, debt, and equity to run our operations and execute our strategy.
Although 2021 was still a challenging year, the Group maintained a solid capital base to continue growing the business and providing the best solutions to our customers. In 2021, total equity grew by 8% to Kshs 69Bn, while TIER II capital grew by 32% to Kshs 20Bn, being funds from DFIs for onward lending to SMEs. I&M Bank Uganda received a capital injection from the Group to support its operations and integration into the Group. All our banking entities met their core and total capital.
Through several initiatives and campaigns across the entities, the Group grew its deposit base to Kshs 297Bn from Kshs. 263Bn in 2020. The majority of the deposits mobilised during the year were low-cost deposits, which helped reduce our funding cost.
During the year 2021, the Group paid out shareholder dividends amounting Kshs. 1.9Bn relating to the 2020 financial year.
The Group continuously reviews various scenarios that could emerge across all the entities to determine the capital requirements based on internal and regulatory levels. The choice of funding is the one that minimises our cost of funding while maximising shareholder value.
Human & Intellectual Capital To drive the I&M strategy, the Group has a team of 2536 staff equipped with the relevant knowledge, skills and competencies. Our people are recruited from diverse backgrounds, providing an inclusive workforce.
The Group is continuously investing, focusing on developing its human capital, employee wellness, talent management, training, career growth and competitive remuneration.
As a critical enabler to the delivery of the iMara 2.0 Strategy, employee engagement is necessary in the transformation journey. The overall Group Engagement score for the year under review was at 73%.
The Group’s outstanding reputation in its markets and sustained performance enables it to attract talent. To retain and motivate key talent within the business, the Group is leveraging Group synergies such as career growth transfers and trainings across borders.
The Group aims to build and strengthen intellectual capital as a driver for business growth, focusing on developing innovative products, brand health and safeguarding its reputation.
Continued investment in innovation resulted in 79% of the Group’s transactions being executed digitally in 2021, with a value of KShs 543Bn. The launch of several innovative digital solutions has supported this improved performance across the Group. Part of the Group's innovation strategy is to leverage partnerships with Fintechs to accelerate the delivery of our promise. For example, I&M Bank Rwanda has partnered with SPENN, a fintech company, to provide financial services to the underbanked/unbanked. For this solution, it has been recognised by the SME Finance Forum in partnership with the International Finance Corporation.(IFC). We expect improved efficiencies and better customer service through investments in innovation.
Total Equity Growth
8%
Deposit Growth
13%
42%
58%
STAFF
OUR BUSINESS
| 61I&M Holdings PLC Annual Integrated Report & Financial Statements 2020
OUR BUSINESS
Seamless banking across East Africa Deposit, withdraw or transfer funds now across Rwanda, Kenya and Tanzania seamlessly.
One I&M Bank Account across 3 Countries
Call us 020 3221000 or visit www.imbank.com
Brisk

56
Our capitals (Continued)
I&M Group’s sustainable business performance depends on its stakeholders’ prosperity. Our engagement in corporate social responsibility and sustainable initiatives builds trust with our stakeholders. Amid the COVID-19 pandemic, the Group has continued to support its customers’ businesses through loan restructuring and accommodating specific requests for relief, while support for the larger community has been through contributions to specific COVID-19 programs within the region.
The I&M Foundation drives our environmental and social sustainability initiatives anchored on environmental conservation, education and skills development, economic empowerment and enabling giving. The primary purpose for the foundation is to deliver a positive impact to society through lasting solutions by applying the “planet, people and profit” concept to create shared value for all our stakeholders. In addition, the Group collaborates with partners that facilitate our participation in more impactful development initiatives through the foundation.
I&M Group is committed to its environmental responsibility. In 2021, it demonstrated its commitment to the environment by screening loans worth Kshs 27 billion as part of its Environmental and Social assessment. The new I&M building at 1 Park Avenue generated 6.2 mw amount of energy, while in Rwanda, I&M moved to a new environmentally friendly building, the country’s first green building. The Group is committed to transitioning to LED lighting in all I&M buildings to save on energy.
As a Group, we continue to remain conscious of the use of paper, plastic etc. I&M Foundation continued to work with Kenya Communities Development Fund (KCDF) to create awareness on environmental sustainability within learning institutions by helping set up environmental clubs, organizing school and community-based forums on environment conservation and planting close to 200,000 trees in learning institutions. Further, to enhance environmentally friendly footprint among the youth, the foundation moved several institutions towards eco-friendly cooking alternatives.
By 2023, we target digital transactions to be at 90%.
With the drive towards innovation and building a digital ecosystem for our customers, the Group recognises the need to protect customer information. Therefore, the cyber risks and security systems are continuously reviewed and upgraded to comply with the data protection and governance requirements and for continued trust from our stakeholders as they entrust us with their personal information.
The Group undertook a brand health review in 2021. The results indicated the Group is a trusted and innovative brand.
We have also enhanced stakeholder engagements, such as increasing our investor briefing sessions from 2 to 4 annually, the frequency of our engagement with media personnel etc. These events ensure that stakeholders have access to relevant business performance information.
233,846
53,001
39,698
604
9,170
Followers
Followers
Followers
Followers
Followers
Social And Relationships Capital
Natural Capital
billion
In 2021, it demonstrated
its commitment to
the environment by
screening loans worth
Kshs
I&M GROUP PLC (FORMERLY I&M HOLDINGS PLC) ANNUAL INTEGRATED REPORT AND FINANCIAL STATEMENTS 2021 I&M GROUP PLC (FORMERLY I&M HOLDINGS PLC) ANNUAL INTEGRATED REPORT AND FINANCIAL STATEMENTS 2021 57
A review of our strategy1st year of iMara 2.0
Eastern Africa’s Leading Financial Partner for growth
01Driving business
growth
02Building a resilient
organisation
03Optimising the
operating model
Cultural Transformation
StrategicPartnerships
DataAnalytics
CustomerExperience
% growth of new business
revenuePBT ROE
% Digitally Active
customers
Net Promoter Score
Employee Engagement
Asp
irat
ion
Stra
tegi
c Pi
llar
san
d In
itia
tive
sEn
able
rsK
PIs
2021 marked the first year of the group’s 3-year strategy, iMara 2.0The Group extended its footprint into Uganda with the acquisition of Orient Bank Limited (rebranded to I&M Bank Uganda Limited), launched our new omni channel mobile and Internet banking platform dubbed I&M On The Go in Kenya in 2021 and delivered several initiatives under our innovation strategy across the Group.
Our
Gov
erna
nce
Our
Bus
ines
sO
ur F
inan
cial
s
OUR BUSINESS OUR BUSINESS

I&M GROUP PLC (FORMERLY I&M HOLDINGS PLC) ANNUAL INTEGRATED REPORT AND FINANCIAL STATEMENTS 2021 I&M GROUP PLC (FORMERLY I&M HOLDINGS PLC) ANNUAL INTEGRATED REPORT AND FINANCIAL STATEMENTS 2021 5958
A review of our strategy (Continued)1st year of iMara 2.0
Growth incustomer base
Asset undermanagement
Kshs
The iMara 2.0 Strategy is built on three distinct strategic pillars:
• Driving business growth through diversification
• Building a resilient organisation
• Optimising the operating model
These pillars are underpinned by four key enablers: Customer Experience, Cultural Transformation, Strategic Partnerships and Data Analytics.
Below is a review of the Group performance on the three pillars.
Pillar 1: Driving business growth through diversificationThe Group maintained focus on delivering under this strategic pillar despite the challenges that the economies continued to face due to the COVID-19 pandemic. As part of the expansion plan into new markets, the Group expanded its banking operations into Uganda with the acquisition of Orient Bank Ltd, now rebranded to I&M Bank Uganda Ltd, rolled out MSME banking offering in Rwanda, rolled out wealth management offering, revamped digital offering across all its banking subsidiaries and improved it's customer experience.
Geographical diversificationIntegration of I&M Uganda Ltd
As part of our aspiration to be Eastern Africa’s Leading Financial Partner for Growth, we acquired Orient Bank Ltd (now I&M Uganda) under our strategic pillar to diversify revenue.
The Group is currently focused on integrating the newly acquired subsidiary into the Group operations. The acquisition of the banking entity in Uganda is expected to improve customer service to the Group’s regional customers as we provide them with financial solutions for their trading needs across the region.
Revenue diversificationMSME Banking Offering - I&M Rwanda
The product is aimed at elevating the microbusinesses small and medium-sized enterprises (MSMES).
I&M Rwanda relaunched its MSME products during the year at the height of the third wave of COVID-19. Since its relaunch in March 2021, the segment has experienced exponential growth with an average growth of Rwf 725Million per month on assets. In addition, the bank invested in digital tools that will further enhance the customer experience within this sub-segment. As a result, immediate results have been evident in reducing the turn-around time on loan application.
Business Banking, I&M Kenya
The Kenyan banking subsidiary has established a sub-segment within the Business Banking segment with a client base of over 2,524 New to Bank (NTB) customers. Since its establishment, the bank has issued over KShs 262Mn in loans. Several initiatives are being considered to enhance the offering for this sub-segment, including an automated loan application process and eventually access to a digital lending platform.
Wealth Management – I&M Capital Ltd
In 2021 the Group launched wealth management services through I&M Capital, a wholly-owned subsidiary of I&M Group PLC. The focus for this offering to our customers is services in financial planning, estate planning, investment advisory, and tax advisory. As of December 2021, the assets under management were over KES 700Mn with over 45 newly acquired customers since its launch in July 2021. Investment products being offered include local government bonds, sovereign bonds, offshore investment, leverage products and money market funds.
””
The Group expanded its banking operations into Uganda with the
acquisition of Orient Bank Ltd, now rebranded to I&M Bank Uganda Ltd, rolled out MSME banking offering in
Rwanda, rolled out wealth management offering
OUR BUSINESS
Our
Gov
erna
nce
Our
Bus
ines
sO
ur F
inan
cial
s
KenyaI&M On-The-Go
In Kenya, through the Bank’s redesigned app and web platform, I&M On-the-Go, our customers can now enjoy our services and convenience at the touch of a button. The platform is undergoing further enhancements to improve user experience and fully utilise the solutions’ capabilities. The launch of the platform in other entities is planned for in 2023.
The continuous changes in customer touch points called for the need to invest in tools to support customer access to our services. The launch of WhatsApp Banking in I&M Tanzania has improved our interaction with our customers in the country.
Mobile LendingWithin the Group, I&M Tanzania is the pioneer of these products, having launched in September 2021. Other Group entities are following closely and are at different stages of implementation.
Retail customers 9,872
Corporate customers 670
I&M On the Go
Number of loans
Total amount disbursed Kshs
Digital unsecured lending
Number of registered users
Transaction value (Kshs 305Mn)
WhatsApp Banking
Mobile LendingNumber of active customers
(Kshs 158 Mn)
Loans disbursed
Mobile Lending
Digital Unsecured Lending
In October 2021, Kenya piloted its digital unsecured lending platform, enabling customers to access funds at their convenience.
Pillar 1: Driving business growth through diversification (Continued)
To improve access to financial services and customer experience, the Group launched several digital services to accelerate the shift to digital channels. As a result, 79% of the Group’s transactions were executed digitally in 2021, with a transactional value of over KShs 440Mn. By 2023, the Group aims to have 90% of its transaction digitally execute.
A review of our strategy (Continued)
OUR BUSINESS
TanzaniaWhatsApp Banking

I&M GROUP PLC (FORMERLY I&M HOLDINGS PLC) ANNUAL INTEGRATED REPORT AND FINANCIAL STATEMENTS 2021 I&M GROUP PLC (FORMERLY I&M HOLDINGS PLC) ANNUAL INTEGRATED REPORT AND FINANCIAL STATEMENTS 2021 6160
The Group’s joint venture Bank One Ltd in Mauritius, in September 2021, launched a Universal Payment Solution (POP) that is gradually revolutionising the payment methods in the island.
Number of transactions
Number of registeredcustomers
Number of merchantsonboarded
Improved customer experienceOur digital transformation journey has enabled us to engage our customers and deliver on their expectations of a seamless customer experience regardless of channel or location. The initiatives undertaken under this pillar have led to improved customer experience and digital uptake.
”
”
NPS 71%well above prior year’s 34%
I&M Rwanda’s WhatsApp banking platform has enabled more than 1,000 registered customers to interact with the bank at their convenience. In addition, at the end of December 2021, Rwanda piloted its digital on-boarding platform to enable customers to open an account without visiting the branch.
Number of registeredcustomers +
Rwanda
Mauritius
A review of our strategy (Continued)
Pillar 1: Driving business growth through diversification (Continued)
OUR BUSINESS
Our
Gov
erna
nce
Our
Bus
ines
sO
ur F
inan
cial
s
To build a resilient organisation, the transformation journey calls for the development of efficient, productive and sustainable systems.
Funding and liquidity managementWe are working on improving our funding and liquidity management with the immediate focus on lowering our cost of funds.
The CASA deposit campaigns held throughout the year across the Group resulted to 13% growth in total deposits. 75% of the total deposits are held within the Corporate and Premium banking segments. There is focused effort to rebalance this through mobilising increased deposits from SME and Personal Banking segments.
So far, all banking entities show strong consistent liquidity across all entities, which has improved the overall liquidity to 50%
Enterprise risk managementTo enhance efficiency in our Enterprise risk management, we completed the AML system implementation across the Group and are now looking into the analytics for managing financial crime with the capability that has been built through this system.
The Group further embarked on setting up an Operational Risk Management System with its completion planned for 2022.
Embedding cyber security The Group is conscious that its digitisation journey is not without risk, especially cyber risk emanating from automation and online user access to banking services such as internet banking, mobile banking and digital cards.
Considering this, the Group has embarked on an information and cyber security awareness journey for its customers, ensuring value creation by safeguarding our customers' online transactions.
Our awareness program has involved the following:
1. Customer awareness – We can keep our customers abreast of the emerging cyber fraud trends through periodic emails, short messaging services and reliable information on our website.
2. Young savers training sessions - We have taken time to educate and enlighten our bankers of the future by providing custom content on information security awareness for the young. Apart from explaining the benefits of technology in this 4th industrial revolution, this content also points out areas where abuse may arise during utilisation.
3. Inter-university, capture the flag (CTF) competitions – While we acknowledge the existence of cyber risks, very little has been done to prepare and equip future generations with the skillset required to fight cybercrime. At I&M, we have taken up the task of training and mentoring interested university students to be cyber security professionals. Through CTF competitions, we identify and nurture cyber security talent. Upon graduation, the top performers in these competitions eventually join the bank’s information and cyber security team. So far 48 students from 9 universities have gone through the program.
65%
75%82%
2019 2020 2021
Growth in CASA deposits
Pillar 2: Building a resilient organisation
A review of our strategy (Continued)
OUR BUSINESS
Our cyber maturity score improved to 82%

I&M GROUP PLC (FORMERLY I&M HOLDINGS PLC) ANNUAL INTEGRATED REPORT AND FINANCIAL STATEMENTS 2021 I&M GROUP PLC (FORMERLY I&M HOLDINGS PLC) ANNUAL INTEGRATED REPORT AND FINANCIAL STATEMENTS 2021 6362
Pillar 2: Building a resilient organisation (Continued)
Embedding environmental, social and governance responsibilityTop on the agenda for 2022 is to tackle climate risk, which is also seen as a significant threat to the long-term growth of financial institutions worldwide.
Our anchor subsidiary, I&M Bank Kenya, is spearheading the Group’s ESG journey, with the key focus being to implement a climate risk management project as guided by the Central Bank of Kenya. The climate risk management project aims to develop targeted initiatives that leverage climate opportunities for the Bank’s continued sustainable growth. This will include an assessment of the bank’s vulnerability to climate risk in terms of client lending exposure and the bank’s low carbon transition pathway.
Pillar 3: Optimising the operating modelCore IT infrastructure resilienceTo align with the digital transformation journey, the Group embarked on a program to build the Future State Enterprise Infrastructure which would be reliable, secure and fit for purpose. The program is now in its 3rd year of implementation, with most sub-initiatives having been fully implemented. Expected benefits from the program will include the following:
• Integration of service monitoring for uptime, performance and experience
• Automation of our infrastructure through API Gateways as well as enabling our cloud computing capabilities
• Ensure uptime our service and reliability of our network
• Ensure data protection and security including intrusion prevention systems.
Leveraging group synergiesi. Cross border business development
There is good momentum in the initiative to grow business with our regional customers. Over 50 regional customers were referred in 2021 across all the Group entities with a total value of $130 Million booked in assets, deposits and off-balance sheet business. The relaunch of the cross-border instant payment platform to support our customers’ regional business operations/aspirations is a key enabler in these initiatives ensuring unmatched customer experience for regional businesses.
ii. Process efficiency – standardisation and shared services
I&M Group is investing in its infrastructure to support its strategy and reduce duplication of functions; standardise operations, systems and processes across its subsidiaries in the region and manage risks better.
The proposed integrated business services aims to create value by enhancing customer experience and leveraging on synergies with service excellence being at the heart of all its operations. It will be multifunctional and include services such as Finance, HR, IT, Customer Service, Procurement and Operations.
While the Group’s cost to income ratio has increased in the short term, we envision that these initiatives will create operational efficiencies in the future.
A review of our strategy (Continued)
40%42% 46%*
2019 2020 2021
Cost to income ratio (CIR)
*Excluding Uganda, the CIR was 43%
OUR BUSINESS
Our
Gov
erna
nce
Our
Bus
ines
sO
ur F
inan
cial
s
Cultural transformationThe Group launched a culture transformation program dubbed ‘Pamoja’ in October 2021. Culture transformation is at the heart of our iMara 2.0 strategy execution. This program is expected to be a key tool in strengthening the employee value proposition and the employer brand. So far, the program has progressed well, having defined culture behaviors, named the “I&M Way”; which now includes courage as one of its values and a defined company purpose - Empowering your prosperity.
A review of our strategy (Continued)
OUR BUSINESS
Pillar 3: Optimising the operating model (Continued)
RIS
K IN
TELL
IGEN
TW
e ev
alua
te ri
sk a
nd re
war
d to
mak
eba
lanc
ed a
nd q
uick
dec
isio
ns
CA
ND
IDW
e ho
ld h
ones
t, re
spec
tful
and
em
path
etic
conv
ersa
tions
and
sha
re re
gula
r fee
dbac
k
CO
LLA
BOR
ATIV
EW
e w
ork
toge
ther
to d
eliv
er o
n pr
omis
es to
our
clie
nts,
our
peo
ple
and
our s
hare
hold
ers
EMPO
WER
EDW
e tr
ust a
nd e
quip
our
peo
ple,
and
del
egat
e to
pro
mot
eow
ners
hip
and
auth
ority
to d
rive
chan
ge a
nd e
xecu
tion
DA
TA-D
RIV
ENW
e us
e da
ta to
info
rm o
ur c
hoic
es a
ndm
ake
bett
er d
ecis
ions
The
I&M
Way
(Our
Cul
ture
)D
efine
s th
e co
mm
on b
ehav
iour
s w
e w
ant o
ur p
eopl
e to
de
mon
stra
te e
very
day
; it’s
how
we
do th
ings
aro
und
here
Del
iver
ing
on o
ur B
rand
Pro
mis
e: W
e A
re O
n Yo
ur S
ide
D
esire
d O
utco
mes
The
I&M
Val
ues
Defi
nes
our d
eepl
y he
ld p
rinci
ples
that
gui
de o
ur d
ecis
ions
and
und
erpi
n ho
w w
e be
have
; our
refr
eshe
d va
lues
are
our
foun
datio
n
AG
ILE
We
are
flexi
ble
and
adap
tive;
we
act
with
spe
ed a
nd d
eliv
er w
ith e
xcel
lenc
e
Inte
grit
yTr
ust
Res
pect
Inno
vati
onC
oura
ge
East
ern
Afr
ica’
s Le
adin
gFi
nanc
ial P
artn
er fo
r Gro
wth
Our
Pur
pose
Empo
wer
ing
You
rPr
ospe
rity
We
are
trut
hful
, eth
ical
, and
com
mitt
ed t
o do
ing
the
right
thin
g
We
belie
ve in
, cou
nt o
n an
d re
ly o
n ea
ch o
ther
to d
eliv
er c
onsi
sten
tly
and
wal
k th
e ta
lk
We
valu
e ev
eryo
ne a
nd tr
eat t
hem
with
resp
ect
and
fairn
ess
We
are
crea
tive,
bol
d an
d em
brac
e do
ing
thin
gs d
iffer
entl
y, w
ith o
ur c
usto
mer
s in
min
d
We
spea
k up
, hol
d ea
ch o
ther
to
acco
unt a
nd c
halle
nge
each
oth
er to
cons
tant
ly im
prov
e

I&M GROUP PLC (FORMERLY I&M HOLDINGS PLC) ANNUAL INTEGRATED REPORT AND FINANCIAL STATEMENTS 2021 I&M GROUP PLC (FORMERLY I&M HOLDINGS PLC) ANNUAL INTEGRATED REPORT AND FINANCIAL STATEMENTS 2021 6564
Our relationshipsMode and purpose of our stakeholder engagement
We are guided by our Stakeholder Engagement Policy which has been developed to ensure the policy is applied consistently across all Group operations. We engage both formally and informally throughout the year to:
• Develop and promote a firm understanding of stakeholder needs, interests and expectations;
• Provide guidance on how the Group should engage with its stakeholders to strengthen and maintain relationships with them;
• Identify the opportunities and threats arising from stakeholders’ material issues; and
• Assist with strategic and sustainable decision-making.
Stakeholder engagement is decentralised within I&M. All I&M Group employees are accountable for managing relationships and meeting the expectations of stakeholders within their areas of responsibility. Should a stakeholder not be satisfied with the service or assistance they receive, several channels ensure they can voice their concerns. These include our client call centre, social media pages, or bank email addresses. All available channels are indicated on the “Contact us" page available on the Group’s corporate website. Stakeholder concerns are monitored annually for compliance by the Group Risk and Compliance Team and by the Board Audit and Risk Management Committee. I&M has identified the following stakeholders and methods of engagement, including the various channels and means of communications reliant on each specific stakeholder group.
OUR BUSINESS
Our
Gov
erna
nce
Our
Bus
ines
sO
ur F
inan
cial
s
We Are OnYour Side
I&M Group Plc Bank is regulated by the Central Bank of Kenya
www.imbankgroup.com
Whereverthe roadtakes you,we are onyour side#StayWinning

I&M GROUP PLC (FORMERLY I&M HOLDINGS PLC) ANNUAL INTEGRATED REPORT AND FINANCIAL STATEMENTS 2021 I&M GROUP PLC (FORMERLY I&M HOLDINGS PLC) ANNUAL INTEGRATED REPORT AND FINANCIAL STATEMENTS 2021 6766
Our
Gov
erna
nce
Our
Bus
ines
sO
ur F
inan
cial
s
• To understand their aspirations, businesses and financial-services needs better • To provide appropriate advice, proactive financial solutions, and
value-adding services • To ensure the Group maintains high service levels that they expect and deserve • To inform product development and prioritisation • To develop products that embody customer-centric innovation • To ensure accuracy of customers’ personal and/or business information
• Interactions through sales agents, branch outlets, relationship managers, regional heads, senior management, call centers, and other alternate banking channels
• Customer events, face-to-face meetings, and other surveys, as well as marketing and advertising activities Formal written correspondence, emailers and newsletters and messages disseminated through social media
• To provide staff with strategic direction and keep them informed about group activities
• To ensure that we remain an employer of choice that provides a safe, positive, and inspiring working environment
• To understand and respond to the needs and concerns of staff members
• Regular, direct communication between managers, teams and individuals • Robust combination of face-to-face, written, digital and
broadcast communications, culture and engagement surveys that include emails and intranet communications
• CEO’s monthly newsletter, town hall meetings, cluster and group recognition functions
• To maintain open, honest, and transparent relationships and ensure compliance with all legal and regulatory requirements
• To retain our various operating licenses and minimise operational risk
• Various industry and regulatory forums, meetings between regulators and our board and management
• This includes one-on-one discussions with various executive officials at prudential meetings as well as onsite meetings
• To provide current and future shareholders with relevant and timely information • To manage shareholder expectations and reputational risk • To maintain strong relationships and keep abreast of market developments • To ensure good governance and deepen the trust placed in us and our brand • To get feedback that informs our strategy, business operations and how we govern
• Annual General Meetings, Extraordinary General Meetings as and when called for
• Investor briefings for year-end and /or interim results announcements and roadshows
• Various investor group meetings • Individual meetings with media,shareholders and analysts
• To build and strengthen relationships with the various governments, both as partners in the development of the country and as key clients
• To provide input into legislative development processes that will affect the economy and our activities and operations
• To participate visibly in and be a partner to the transformation of the local economy
• To continue learning through interaction with the industry and cross-sectoral organisations
• To use business associations as a forum through which we can promote our viewpoints on key industry issues
• To influence and/or promote common agendas
• Various engagements with national and county officials, participation in consultative industry and sector forums
• To leverage the reach and influence of media channels to share our business and value creation story with stakeholders
• To empower their audiences to make informed financial decisions
• To leverage the reach and influence of media channels to share our business and value creation story with stakeholders
• To empower their audiences to make informed financial decisions
Stakeholder Purpose of engagement Methods of engagement
Customers
Employees
Regulators
Shareholders
Governmentagencies, localauthoritiesand industryforums
Media
• As required or dictated by performance contracts and/or agreements • To obtain products or services required for conducting Group business • To maintain an ideal and timely supply of goods and services for operations • To encourage responsible practices across our supply chain, local
procurement, supplier conduct and environmental considerations • To include critical suppliers in cross-functional teams to contribute
expertise and advice before specifications are developed for products or services
• One-on-one negotiations and meetings for finalisation follow up and after sales serviceService
providersand suppliers
• To create partnerships that serve to facilitate our integrated sustainability activities • To obtain input from environmental experts, communities and
non-governmental organisations regarding key focus areas • To create awareness of our “shared growth” commitment and initiatives
• Group’s website, annual report, Group’s social media handles, press releases and media statements
Others -Communityand publicat large,environment
Mode and purpose of our stakeholder engagement (Continued)
OUR BUSINESSOur relationships (Continued)
Our peopleThis year, our human capital across the Group increased by 17% to reach 2,536 as at December 2021 as shown below. The increase in staff numbers was driven by the need to support our digital strategy and information technology infrastructure and bring in new skills and capabilities required to deliver our strategic imperatives.
1157
Kenya Uganda Tanzania Rwanda
1148
314326
182 184
424399
I&M Human Capital Strength
2021 2020
Uganda Rwanda Mauritius
% of women in Senior Roles
2%
Kenya
34%25% 3% 46% 7% 6%23%
Tanzania
10% 30%
2021 2020
Uganda Rwanda Mauritius
Gender Diversity by Entity
Kenya
10%
90% 80%
20%45%
55% 58%
42%47%
53% 50%
50%58%
42% 40%
60%50%
50% 50%
50%
Tanzania
Male Female
2021 2020 2021 2020 2021 2020 2021 2020 2021 2020
OUR BUSINESS

I&M GROUP PLC (FORMERLY I&M HOLDINGS PLC) ANNUAL INTEGRATED REPORT AND FINANCIAL STATEMENTS 2021 I&M GROUP PLC (FORMERLY I&M HOLDINGS PLC) ANNUAL INTEGRATED REPORT AND FINANCIAL STATEMENTS 2021 6968
Our
Gov
erna
nce
Our
Bus
ines
sO
ur F
inan
cial
s
Employee engagement
A key focus has been on upskilling and re-skilling our team in digital business, cyber security, leadership, change management, forensic risk, compliance management, information systems, sales and business development. About 80% of the learning has been facilitated virtually except for the culture change workshops. In addition, we are beginning to leverage Group synergies such as career growth transfers and learning visits across borders which we anticipate will serve to retain and motivate key talent within the business.
COVID-19 vaccination Over 70% of our Group Staff population is fully vaccinated. The challenges presented by the pandemic have been addressed through work from home policy, rotation of staff in the office, and ensuring staff adheres to the COVID 19 protocols.
2022 outlookOur focus in 2022 will be to continue to grow our rollout of our talent and development programs, leadership development programs, and culture change initiatives facilitated through Employment Engagement Index and progress our culture transformation through the Pamoja initative.
70Kenya Uganda
Tanzania
Rwanda Mauritius
%
%
%
%
%
%
The overall Group Employee Engagement score has continued to be above
Action planning was carried out in the first quarter of the year. Several initiatives have been implemented in response to employee feedback received during the previous engagement survey. A key focus has been safeguarding employee welfare, wellness and mental health, ensuring a robust career planning and development framework, providing learning and development opportunities and the roll-out of the culture transformation program. By country, the employee engagement indices were as above.
70% of our Group Staff population is fully vaccinated
OUR BUSINESS (Continued)Our people (Continued)
From a people perspective, the key highlight for 2021 was launching our Culture Transformation Program in October called
Pamoja!
Pamoja is a Kiswahili word meaning “together”. The culture transformation is a critical enabler to achieving the iMara 2.0. Strategy and is geared towards building a digitally savvy and agile teams in response to the changing business needs and challenges. In addition, it is a tool to strengthen our employer brand, enhance the employee value proposition and differentiate us in the industry.
The approach to the culture change process was highly collaborative with the participation of 25 Board Members, 18 Senior Group Leadership Team members, 107 Senior management executives and all staff across the five countries.
The outcome of the sessions was an update of the Company’s values to include ‘Courage’; and the identification of I&M’s change markers and behaviors, culminating in establishing the “I&M Way”. The ‘I&M Way’ describes the culture at I&M and defines our purpose as ‘Empowering your prosperity’.
139Changemakers were trainedand certified to roll out theculture cascade sessions
Kenya
Kenya
Uganda
Uganda
Tanzania
Tanzania
Rwanda
Rwanda
Mauritius
Mauritius
The cascade of the culture change workshops commenced in December 2021 and will be completed by early March 2022. About 1,274 staff have been trained to date.
Learning and development
Learning and development has been a key focus in 2021 despite the ongoing COVID-19 pandemic. Over 200 technical and non-technical courses were completed during the year broken down by country as follows:
Pamoja culture transformation - together we shine!
Our people (Continued)
OUR BUSINESS (Continued)

I&M GROUP PLC (FORMERLY I&M HOLDINGS PLC) ANNUAL INTEGRATED REPORT AND FINANCIAL STATEMENTS 2021 I&M GROUP PLC (FORMERLY I&M HOLDINGS PLC) ANNUAL INTEGRATED REPORT AND FINANCIAL STATEMENTS 2021 7170
Our
Gov
erna
nce
Our
Bus
ines
sO
ur F
inan
cial
s
Our sustainability strategy is based on the four pillars of social, environmental, economic and financial sustainability; considerations that are central to the long-term commercial success of our business.
Social
SOCIAL
Environmental
ENVIRONMENTAL
Economic
ECONOMIC FINANCIAL
The Group is committed to ensuring that all its stakeholders prosper through access to equitable and inclusive products and services that drive value creation.
The Group is committed to reducing its environmental footprint and supports responsible financing by providing specific opportunities to our customers in ‘green’ areas to ensure we contribute to protecting our environment.
No. of OTG registered mobile banking users
No. of loans screened reduction
CUSTOMERS
RESPONSIBLE LENDING
No. of training days per employee
Women in leadership positions
%
EMPLOYEES
No. of Students supported through sponsorships
Value of commitment to support our community
Mn
Value of facilities that have undergone environmental-social assessment
BnNo. of staff trained on
Environmental & Risk Assessment
COMMUNITY
The Group’s purpose is ingrained in the prosperity of all its stakeholders as it offers products and services that creat value.
No. of mobile banking transactions
INNOVATION & PRODUCT DEVELOPMENT
No. of new productsdeveloped
OUR BUSINESS
Sustainability review (Continued)Sustainability review
I&M FoundationThe Group is committed to integrating the Social , Environmental, Economic and Financial sustainability pillars into our subsidiaries’ business activities through a phased approach. The Group remains committed to mitigating direct social and environmental impacts, as well as managing indirect effects, while continuously working to integrate environmental, social and broader governance factors into its core business operations across all its subsidiaries.
In 2021, 2% of I&M Kenya's PBT(Kshs 206Mn) was allocated to I&M Foundation to drive our sustainability.
I&M Foundation spearheads the shared value agenda for I&M Bank and is responsible for positively impacting society through social investment programs. The Foundation’s program approach is to work through partners to deliver the objectives of the Foundation. It does so by leveraging and complementing partner organizations’ resources, skills, experiences, knowledge and track records in a catalytic and value-adding manner.
2017 2018 2019 2020 2021
205.8
240.2
174.5
150.3173
Figu
res
in K
shs.
Mill
ions
Financial commitment to I&M
Funding to I&M Foundation
Kshs
MISSIONTo deliver positive impact to society through lasting solutions by engaging planet, people, and profit to create shared value for our stakeholders.
VISIONTo see communities whose physical, social, and economic environments are positively impacted as a result of our partnership.
CORE VALUES
Our core values are:• Trust• Integrity• Respect• Innovation• Courage
million
OUR BUSINESS

I&M GROUP PLC (FORMERLY I&M HOLDINGS PLC) ANNUAL INTEGRATED REPORT AND FINANCIAL STATEMENTS 2021 I&M GROUP PLC (FORMERLY I&M HOLDINGS PLC) ANNUAL INTEGRATED REPORT AND FINANCIAL STATEMENTS 2021 7372
Our
Gov
erna
nce
Our
Bus
ines
sO
ur F
inan
cial
s
I&M Foundation (Continued)
I&M Bank believes that the prosperity of business and society is inextricably linked. I&M has therefore opted to support community projects that help remove environmental, social and economic barriers. To create shared value and positive impact for societies, I&M through its Foundation, seeks to deliver programs under four strategic thematic areas: environmental conservation, education and skills development, economic empowerment and enabling giving.
Education and skills
development
Environmental conservation
Enabling givingEconomic empowerment
I&M Foundation Strategic Pillars
Sustainability review (Continued)
OUR BUSINESS
Kenya Community Development Foundation (KCDF)I&M Foundation supported Kenya Community Development Foundation (KCDF), to inculcate the spirit of environmental conservation and sustainable management of natural resources, for communities around the learning institutions. The project whose targeted key beneficiaries are children and youth in 172 learning institutions, is being implemented over three years and is expected to benefit over 5,000 households in Narok and Kilifi counties. The project is being implemented by the following four community-based organisations:
• Narok County
• Nguzo Africa in Narok South
• Nkoilale Community Development Organization (NCDO) in Narok West
• Kilifi County
• Malindi Education and Development Foundation (MEDA-F) in Magarini
• A Roche Kenya in Kilifi North
Achievements
90 learning institutions have been engaged to participate in the environmental conservation program and have set up environmental clubs
26 community and school-based forums on environmental awareness and conservation were conducted
More than 200,000 trees have been planted around learning institutions and community grounds
Energy saving jikos were installed in 11 learning institutions
90 solar lanterns and 43 energy-saving jikos were procured for sale to community members at a subsidized cost
Members of the Wildlife Club at Mjombani Primary School in Gede, Kilifi County. Teachers and pupils have taken to environmental restoration by planting trees within and outside of the school.
Key Partner
Sustainability review (Continued)I&M Foundation (Continued)Strategic theme 1: Environmental conservation
OUR BUSINESS “Where we preserve, protect and restore the environment and promote sustainable use of
ecosystems”

I&M GROUP PLC (FORMERLY I&M HOLDINGS PLC) ANNUAL INTEGRATED REPORT AND FINANCIAL STATEMENTS 2021 I&M GROUP PLC (FORMERLY I&M HOLDINGS PLC) ANNUAL INTEGRATED REPORT AND FINANCIAL STATEMENTS 2021 7574
Our
Gov
erna
nce
Our
Bus
ines
sO
ur F
inan
cial
s
1. Newly established tree nursery for raising indigenous tree seedlings at Magarini Malindi Sub County (MEDA-F).
2. A section of students from Olashapani girls displaying their trees (Nguzo Africa).
3. Nkoilale Primary School pupils sorting and packing soil in preparation for tree planting under their 4k Agricultural Club. The school is one of the targeted school partners for the environment project (NCDO).
4. Energy-saving jiko donation to Kotolian Secondary School (Nguzo Africa)
5. Parents posing after receiving their solar lanterns at Kahingoni (A Rocha).
6. Nguzo Africa supported Oloshapani Girls Secondary School with institutional energy saving jikos (Nguzo Africa).
1 5
62
3
4
Sustainability review (Continued)I&M Foundation (Continued)Strategic theme 1: Environmental conservation
OUR BUSINESSSustainability review (Continued)
I&M Foundation (Continued)Strategic theme 2: Education and skills development
Key Partner
St. Ann Suresh Girls High School
St. Ann Suresh Raja Girls’ High School is located in Kairi village, within Kiambu County, Kenya. The school was mainly established to reach out to young ladies who were disadvantaged by their family set ups and many others faced little or no emphasis for education to empower and give them hope. I&M Foundation has been supporting St Ann Suresh Raja Girls High School by providing scholarships to needy deserving bright students in the school. 36% of the school population comes from disadvantaged families in marginalised areas.
AchievementsI&M Foundation is supporting 25 deserving bright students through a scholarship programme for their secondary school education.
Additionally, 24 of I&M Bank’s management team has provided academic and mentorship sessions to the students, through a mentorship and life skills program facilitated by the I&M Foundation.
I&M Foundation and a team of lead mentors during the ‘Girls Take Over mentorship’ session.
In partnership with Palmhouse Foundation, I&M Bank has offered secondary school scholarships to bright and talented children from financially challenged backgrounds since 2005.
AchievementsI&M Foundation enhanced its partnership with Palmhouse Foundation by sponsoring an additional 25 students who joined Form 1 in National and County Secondary schools in August 2021 at a cost of KES 8 million. Currently, there are 77 continuing students supported by the Foundation.
This program has 108 alumni, 86% of whom qualified for Kenya Universities’ placements, which is a great success story for I&M Foundation.
In addition, I&M Foundation participates in the Palmhouse Foundation’s mentoring session held at the end of 1st and 2nd terms of the school calendar year.
Palmhouse Foundation
St. Ann Suresh Raja Girls high school
Alumni
Continuingstudents
OUR BUSINESS “Where we enhance education outcomes and value-addition life skills that ensure inclusive and
equitable quality education”

I&M GROUP PLC (FORMERLY I&M HOLDINGS PLC) ANNUAL INTEGRATED REPORT AND FINANCIAL STATEMENTS 2021 I&M GROUP PLC (FORMERLY I&M HOLDINGS PLC) ANNUAL INTEGRATED REPORT AND FINANCIAL STATEMENTS 2021 7776
Our
Gov
erna
nce
Our
Bus
ines
sO
ur F
inan
cial
s
1 I&M Foundation team with the scholarship beneficiaries at Strathmore University.
Strathmore University
I&M Foundation partnered with Strathmore University, a private university chartered under the Universities Act, in Kenya, to provide scholarships to bright and financially challenged students to undertake various under-graduate programs.
AchievementsThe third cohort of I&M Foundation scholars consists of 16 students who joined Strathmore University in the academic year 2020-2021.
A unique feature of this scholarship is that each student is to support a community project in the course of four years, playing a leadership role in giving back to society.
The students’ average academic grades distribution indicated that more than 63% of the scholars met the score threshold (B plain and above) as set by the Foundation. The Strathmore University Financial Aid office committed to further supporting the rest to improve their grades.
All the students have attended classes and progressing smoothly as they all portray a high-level commitment to their studies.
Sustainability review (Continued)
I&M Foundation (Continued)Strategic theme 2: Education and skills development
1. James Gatere, Head, I&M Foundation hands over cheque donation to Erick Kimani, Founder Palm House Foundation.
1
1
OUR BUSINESS
The Shamas Rugby Foundation is a public charitable Foundation whose mission is to use rugby to promote the physical, psychological, social and academic development of boys and girls living in urban slums and rural areas in Kenya. I&M Foundation, in partnership with Shamas Rugby Foundation, supports the Take Control Program, which is a life skills development program, tailored to engage young people through the rugby sport and help them to develop holistically. The project is being implemented in target locations in Nairobi and Kiambu County.
Achievements
Shamas Rugby Foundation
1,779 children (954 boys and 825 girls) were reached through these life skills camps.
29% of total camp participants received psycho-social support.
1,126 parents/caregivers were engaged in community barazas on improving their parenting skills.
48 rugby coaches were trained on skills to facilitate life skills to children.
Sustainability review (Continued)
I&M Foundation (Continued)Strategic theme 2: Education and skills development (Continued)
OUR BUSINESS

78
Key Partner
The MAA TrustThe I&M Foundation has been supporting the Maa Beadwork Social Enterprises Project through the Maa Trust, which supports conservation in the Maasai Mara through sustainable community development. It especially works to empower Maasai women, youth and children living around the conservancies to the North of the Maasai Mara National Reserve. Working with the local communities, the Maa Trust aims to create a sustainable balance between pastoralism, sustainable tourism and wildlife conservation.
AchievementsThe Beadwork project has up-skilled 579 Maasai women in their traditional handicraft - beadwork and assists in developing markets for the beaded products.
Through the Elephant Friendly Kitchen Gardens program, 20 kitchen garden training workshops were held. 380 women were trained on developing and managing kitchen gardens to ensure that farming does not affect conservation.
190 women were mentored on applying for the women’s enterprise fund and three women groups have successfully received the women enterprise fund loans.
The Maa Trust has been training the Maasai women on rainwater harvesting methods and has extended it to support women acquiring water tanks in their households.
1. The Maa artisans carrying out their beadwork.
2. Capacity-building workshops for the Maa Beadwork artisans.
3. Kitchen Garden Training workshop.
1
2 3
Sustainability review (Continued)
I&M Foundation (Continued)Strategic theme 3: Economic empowerment
OUR BUSINESS
I&M GROUP PLC (FORMERLY I&M HOLDINGS PLC) ANNUAL INTEGRATED REPORT AND FINANCIAL STATEMENTS 2021
Other partnersKCDF, through the I&M Foundation support, has been working with community-based partners working with vulnerable communities, especially children, women, girls and those living with disabilities, to assist them in recovering from the adversities caused by the COVID-19 pandemic. The target beneficiaries are poor households from the rural, peri-urban and informal settlements.
Beacon of HopeBeacon of Hope (BOH) is a faith-based NGO in Kenya and working among women in poor communities in Ongata Rongai Kajiado North Sub County.
Through I&M Foundation’s support, project beneficiaries now have adequate capacity to engage in economic practices that are likely to increase their productivity and in turn, sustain their livelihoods while maintaining high levels of hygiene at all times.
Achievements
26 Young WomenSupported in adoption hygiene and sanitation health practices as well as social safety nets.
40 Adults (6 Male, 34 Female)We provided support for improvement of positive parenting through capacity enhancement,cultivated open, caring and trusting relationships for 40 teens (21 female, 19 male).
Enhancement of Liveihoodfor 71 HouseholdsThrough partnership with Kenya Institute of Business Training the project contributed to the livelihood’s enhancement of 71 households whereby 52 out of 71 households benefited from business grants ranging from Kshs. 5,000 to Kshs. 8,000 based on the business plan developed; thus, creating jobs for these vulnerable households.
75 Vulnerable HouseholdsWere supportd in enhancing their household food security (Kitchen gardening).
Who joined the SILC groups to mobilise their financial resources through income generation activities and linking them for financial literacy.
Financial Base for 61 Beneficiaries
1. Positive Parenting Session.
2. Gardenung training by Beacon of Hope.
Sustainability review (Continued)
I&M Foundation (Continued)Strategic theme 3: Economic empowerment (Continued)
OUR BUSINESS
Our
Gov
erna
nce
Our
Bus
ines
sO
ur F
inan
cial
s
I&M GROUP PLC (FORMERLY I&M HOLDINGS PLC) ANNUAL INTEGRATED REPORT AND FINANCIAL STATEMENTS 2021 79
“Where we promote sustainable economic growth
and transform livelihoods”

I&M GROUP PLC (FORMERLY I&M HOLDINGS PLC) ANNUAL INTEGRATED REPORT AND FINANCIAL STATEMENTS 2021 I&M GROUP PLC (FORMERLY I&M HOLDINGS PLC) ANNUAL INTEGRATED REPORT AND FINANCIAL STATEMENTS 2021 8180
Our
Gov
erna
nce
Our
Bus
ines
sO
ur F
inan
cial
s
Deaf Empowerment Kenya (DEK)Households of people with disabilities are burdened by debt and financial strains that threaten their survival. The COVID-19 pandemic worsened this. DEK works with persons with impaired hearing to help them access health care and engage in income generation activities. They target youth for employment, while other persons with impaired hearing are supported in agri-preneurship and other small enterprises. The I&M Foundation donated towards this iniative.
Achievements
This intervention led to improved economic status in the percentage of Households of People with Disabilities:
• Providing 24 Households for Persons with Disabilities with opportunities to enhance their financial income to cushion them during curfew and beyond by procuring and transferring productive assets.
• Supporting 30 deaf youth to get a source of livelihood: 20 were linked to employment opportunities and 10 started their own businesses.
• Supporting Persons with Disabilities to access information, education and communication materials on COVID-19.
1. Deaf youth training on life skills and entrepreneurship.
Supporting
deaf youth toget a source oflivelihood
Sustainability review (Continued)
I&M Foundation (Continued)Strategic theme 3: Economic empowerment (Continued)
1
OUR BUSINESSSustainability review (Continued)
I&M Foundation (Continued)Strategic theme 4: Enabling giving
Key Partner
St. Ann Suresh Raja Girls High School
The I&M Foundation invited staff to contribute towards providing scholarships to bright and disadvantaged students in the school. This initiative looks to harness I&M Bank’s staff participation as champions and leaders of transformation in the society. There was positive reception to this partnership resulting in the following:
• I&M Bank staff members have provided scholarships to 5 students.
• The Foundation has matched this in with a ratio of 2:1, thus sponsoring 10 students.
• In total, 15 new students from disadvantaged backgrounds joined the scholarship program in 2021.
St. Ann Suresh Raja Girls high school
1. St. Ann's Suresh Raja girls during a recent I&M Foundation on mentorship session.
1
OUR BUSINESS“Where we strengthen
partnerships for sustainable community development”
Supporting persons with disabilities to access

I&M GROUP PLC (FORMERLY I&M HOLDINGS PLC) ANNUAL INTEGRATED REPORT AND FINANCIAL STATEMENTS 2021 I&M GROUP PLC (FORMERLY I&M HOLDINGS PLC) ANNUAL INTEGRATED REPORT AND FINANCIAL STATEMENTS 2021 8382
Sustainability KPI
2021 2020 2019 2018 2017
104102
105
125
86
2017 2018 2019 2020 2021
92 92 93 93
87
Sustainability review (Continued)
I&M Foundation (Continued)Strategic theme 4: Enabling giving (Continued)
Number of students’ scholarships provided
Survival rate of trees planted -%
OUR BUSINESS
Let us start a journey ofpartnership
We Are OnYour Side
Learn more about our CSR programs atwww.imbank.com

I&M GROUP PLC (FORMERLY I&M HOLDINGS PLC) ANNUAL INTEGRATED REPORT AND FINANCIAL STATEMENTS 2021 I&M GROUP PLC (FORMERLY I&M HOLDINGS PLC) ANNUAL INTEGRATED REPORT AND FINANCIAL STATEMENTS 2021 8584
Subsidiary overview 2021KenyaBoard of Directors
Our Kenyan subsidiary is led by an 11 member board and supported by 18 senior management team members overseeing key areas of the bank.
Oliver Merrick FowlerChairman
Suresh B R Shah, MBSNon- Executive DirectorChariman, Emeritus
Sarit S Raja ShahGroup Executive Director
Kihara MainaChief Executive Officer
Alice Nyambura KoigiIndependent Director
Sachit S Raja Shah Non- Executive Director
Madabhushi SoundararajanIndependent Director
Nikhil HiraIndependent Director
Muchemi Wambugu, MBSIndependent Director
Alan James DoddIndependent Director
Maximilian BiswangerNon- Executive Director
Stella Gacharia-KariukiCompany Secretary
OUR BUSINESSSubsidiary overview 2021Kenya (Continued)
Macroeconomic environment
The Kenyan economy has shown resilience to the COVID-19 shock following the strict containment measures adopted since 2020. Growth is expected to increase by 5.3% year on year following a contraction of 0.3% in 2020, supported by a rebound in services, Private consumption and Manufacturing, and the Hospitality sector.
The Central Bank of Kenya maintained an accommodative monetary policy stance to support the economic recovery, especially with inflation remaining steady. The supportive monetary stance has also helped credit to the private sector increase by 9% year on year, however, asset quality pressures remain elevated as businesses and households adapt to the new normal.
Operational performanceThe year marked the beginning of our journey to implement phase 2 of our corporate strategy, iMara 2.0. This phase has enabled the Bank to place digitisation at the centre of its operations and product development. The Bank, through a partnership with the world’s leading mobile and internet banking platform providers, BackBase, launched I&M On The Go. The platform looks to accelerate digital transformation to improve customer experience when interacting with the Bank. Last year, the Bank also conducted a successful pilot for the unsecured lending solution, which was launched in early 2022.
During the period under review, I&M Bank LIMITED launched the Wealth Management and Advisory Services unit under I&M Capital Limited to diversify into new market segments, by providing holistic financial solutions to its clients. The offering comprises customised investment solutions, asset management, retirement income, and financial planning. It seeks to help clients diversify their assets to balance their financial risks.
Financial performanceDuring the period under review, the balance sheet size grew by 9% to close at Kshs 308 billion. Customer deposits grew from Kshs 218 billion to close at Kshs 228 billion representing a 4.53% increase. The Bank’s lending has recorded a modest growth of 8% compared to December 2020 to close at Kshs 162 billion. The Bank experienced a significant improvement in its NPA as compared to a similar period last year to close at Kshs 19 billion (2020 – 20 billion).
Profit before tax for the period was Kshs 11 billion (2020 – 10 billion), representing a 2.90% increase year on year, driven by net operating income growth of 19% to Kshs. 22 billion.
Key Performance Metrics – Kshs (Billions)
Period December 2021 December 2020 % Growth
Assets
Net Loans and Advances 162 150 8%
Total Assets 308 284 9%
Equity & Liabilities
Customer Deposits 228 218 5%
Shareholder Funds 52 52 -1%
P&L
Total Operating Income 21.9 18.4 19%
Loan Loss Provisions 3.1 1.6 93%
Operating Expenses 8.2 6.6 26%
PBT 10.6 10.2 3%
OUR BUSINESS
Our
Gov
erna
nce
Our
Bus
ines
sO
ur F
inan
cial
s
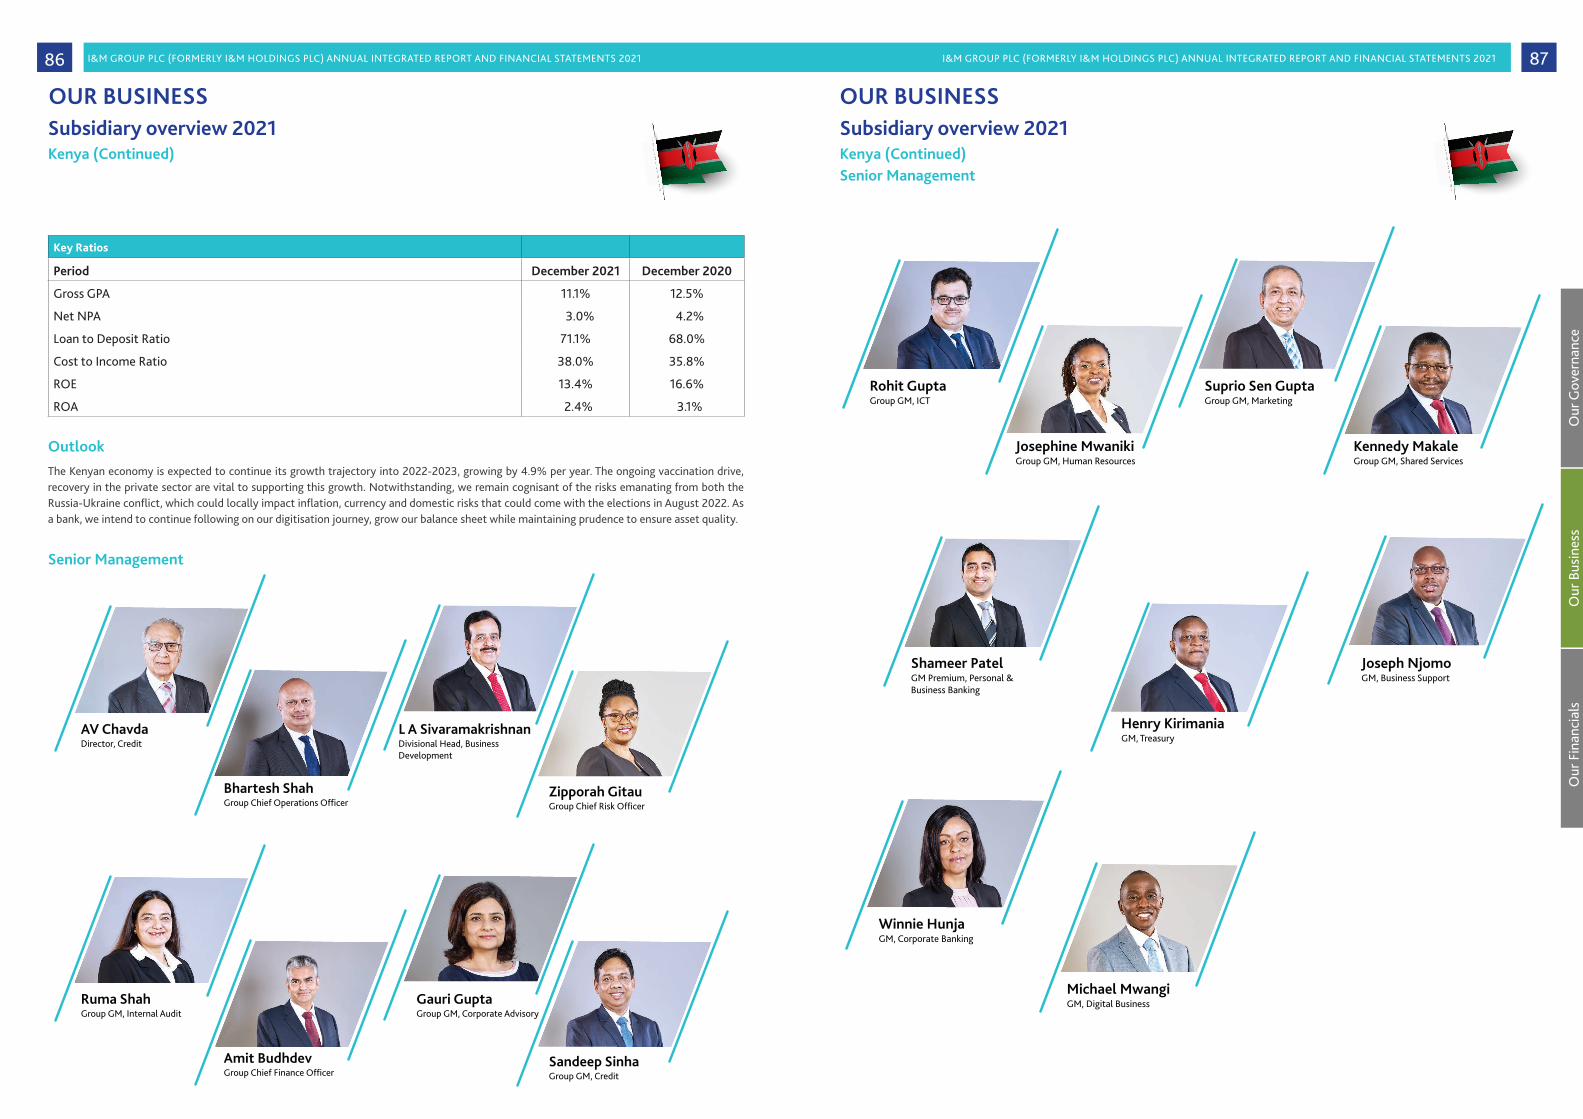
I&M GROUP PLC (FORMERLY I&M HOLDINGS PLC) ANNUAL INTEGRATED REPORT AND FINANCIAL STATEMENTS 2021 I&M GROUP PLC (FORMERLY I&M HOLDINGS PLC) ANNUAL INTEGRATED REPORT AND FINANCIAL STATEMENTS 2021 8786
Subsidiary overview 2021Kenya (Continued)
Key Ratios
Period December 2021 December 2020
Gross GPA 11.1% 12.5%
Net NPA 3.0% 4.2%
Loan to Deposit Ratio 71.1% 68.0%
Cost to Income Ratio 38.0% 35.8%
ROE 13.4% 16.6%
ROA 2.4% 3.1%
OutlookThe Kenyan economy is expected to continue its growth trajectory into 2022-2023, growing by 4.9% per year. The ongoing vaccination drive, recovery in the private sector are vital to supporting this growth. Notwithstanding, we remain cognisant of the risks emanating from both the Russia-Ukraine conflict, which could locally impact inflation, currency and domestic risks that could come with the elections in August 2022. As a bank, we intend to continue following on our digitisation journey, grow our balance sheet while maintaining prudence to ensure asset quality.
Senior Management
AV ChavdaDirector, Credit
Bhartesh ShahGroup Chief Operations Officer
L A SivaramakrishnanDivisional Head, Business Development
Zipporah GitauGroup Chief Risk Officer
Ruma ShahGroup GM, Internal Audit
Amit BudhdevGroup Chief Finance Officer
Gauri GuptaGroup GM, Corporate Advisory
Sandeep SinhaGroup GM, Credit
Rohit GuptaGroup GM, ICT
Josephine MwanikiGroup GM, Human Resources
Suprio Sen GuptaGroup GM, Marketing
Kennedy MakaleGroup GM, Shared Services
OUR BUSINESSSubsidiary overview 2021Kenya (Continued) Senior Management
Shameer PatelGM Premium, Personal & Business Banking
Henry KirimaniaGM, Treasury
Joseph NjomoGM, Business Support
Winnie HunjaGM, Corporate Banking
Michael MwangiGM, Digital Business
AV ChavdaDirector, Credit
Bhartesh ShahGroup Chief Operations Officer
L A SivaramakrishnanDivisional Head, Business Development
Zipporah GitauGroup Chief Risk Officer
Ruma ShahGroup GM, Internal Audit
Amit BudhdevGroup Chief Finance Officer
Gauri GuptaGroup GM, Corporate Advisory
Sandeep SinhaGroup GM, Credit
Rohit GuptaGroup GM, ICT
Josephine MwanikiGroup GM, Human Resources
Suprio Sen GuptaGroup GM, Marketing
Kennedy MakaleGroup GM, Shared Services
OUR BUSINESS
Our
Gov
erna
nce
Our
Bus
ines
sO
ur F
inan
cial
s

I&M GROUP PLC (FORMERLY I&M HOLDINGS PLC) ANNUAL INTEGRATED REPORT AND FINANCIAL STATEMENTS 2021 I&M GROUP PLC (FORMERLY I&M HOLDINGS PLC) ANNUAL INTEGRATED REPORT AND FINANCIAL STATEMENTS 2021 8988
Subsidiary overview 2021TanzaniaBoard of Directors
Our Tanzania subsidiary is led by an 8-member board and supported by 11 senior management team members overseeing key areas of the bank.
Sarit S Raja ShahChairman
Pratul ShahIndependent Director
Emmanuel JohannesIndependent Director
Riyaz TakimIndependent Director
Michael N ShirimaNon-Executive Director
Shameer PatelNon-Executive Director
Thierry HugninNon-Executive Director
Alan MchakiIndependent Director
Hamida SheikhCompany Secretary
OUR BUSINESS
Macroeconomic environmentThe Tanzanian economy was estimated to grow at 4.3% in 2021 compared to 2.0% in 2020. The rollout of the nationwide COVID-19 vaccination has positively impacted the recovery. Key indicators such as Cement Production, Electricity Generation, Exports, Telecommunications, Tourism, and Private Sector credit growth pointed to a strong rebound in the economy. The headline inflation rose to 3.7% in 2021 from 3.3% in 2020 but remained within the target range of 3-5%. The Tanzania Shilling was largely stable, appreciating marginally by 0.11% during the year. Foreign reserves grew to USD 6.4 billion from USD 6.0 billion the year before.
The Bank of Tanzania continued with its accommodative monetary policy stance. This supported the private sector credit growth, which reached pre-pandemic levels, increasing by 10% year on year compared to 3.1% in December 2020. The key sectors that benefitted from this were Trade, Manufacturing, Agriculture, Mining and SMEs. The industry also witnessed a decline in non-performing loans to below 9% in 2021 as the economic recovery boosted market liquidity and outstanding amounts were paid out.
Operational performance The Bank made good progress against the medium-term strategy iMara 2.0 which was refreshed during the year to make I&M Tanzania “Tanzania's leading Financial Partner for Growth”.
Several initiatives were undertaken during the year. One notable event was the bank’s partnership with Airtel Tanzania and Comviva to launch a unique digital lending product dubbed Kamilisha. The product enables Airtel customers to facilitate digital access to funds for meeting their transactional requirements. The bank is also amongst the pioneers in East Africa to launch Rafiki Chat WhatsApp Banking, which makes banking convenient and more accessible. The Customers can check balances and carry out transactions, transfers etc., through this platform.
There were significant improvements in the risk management areas to ensure that the bank remains resilient. This included upgrading the financial crimes software, bolstering cyber resilience capabilities, implementing privilege access management, system information, and events management applications to enforce compliance with data security/protection policies and standards.
Financial performance The bank delivered an admirable performance during the year and is poised to move ahead with renewed confidence in achieving the key strategic and financial objetctives as outlined in iMara 2.0 strategy.
The bank achieved a profit before tax of Tzs 10 billion from Tzs 8 billion reported last year, indicating a 21% YoY growth, the balance sheet grew by 15% with an increase in the total assets to Tzs 587 billion from Tzs 513 billion in 2020. The customer deposits grew by 22% from Tzs 357.5 billion to Tzs 438 billion. The bank reported 11% YoY growth in net loans to close at Tzs 354 billion from Tzs 320 billion in Dec 2020. The asset quality improved with the gross NPA declining to 9.2% from 16.1% in the last year.
Summary of 2021 performance
Key Performance Metrics – Kshs (Billions)
Period December 2021 December 2020 % Growth
Assets
Net Loans and Advances 17 15 15%
Total Assets 28 24 19%
Equity & Liabilities
Customer Deposits 21 17 25%
Shareholder Funds 5 4 22%
P&L
Total Operating Income 2.0 1.7 16%
Loan Loss Provisions 0.3 0.3 2%
Operating Expenses 1.2 1.1 16%
PBT 0.5 0.4 27%
Subsidiary overview 2021Tanzania (Continued)
OUR BUSINESS
Our
Gov
erna
nce
Our
Bus
ines
sO
ur F
inan
cial
s

I&M GROUP PLC (FORMERLY I&M HOLDINGS PLC) ANNUAL INTEGRATED REPORT AND FINANCIAL STATEMENTS 2021 I&M GROUP PLC (FORMERLY I&M HOLDINGS PLC) ANNUAL INTEGRATED REPORT AND FINANCIAL STATEMENTS 2021 9190
Key Ratios
Period December 2021 December 2020
Gross GPA 9.2% 16.1%
Net NPA 5.7% 9.9%
Loan to Deposit Ratio 81.4% 88.0%
Cost to Income Ratio 62.6% 62.8%
ROE 7.8% 7.3%
ROA 1.2% 1.2%
Outlook – 2022The economic outlook for 2022 is broadly positive with no domestic restrictions and lockdowns (contrary to global trends). The forecasts assume that fiscal expansion for the coronavirus response plan, public investment in infrastructure, monetary stimulus measures and trade will drive the GDP growth to 5.2% in 2022. The shift in the government’s approach to COVID-19 under the new administration, its renewed focus on regional trade & co-operation and its commitment to domestic policy reforms have mitigated the downside risks and created an investor-friendly business environment.
The bank will continue to drive the digital strategy, enhance its presence in strategic locations through expansion, introduction of Agency Banking and focusing on customer value proposition and diversification while continuing the innovation.
Subsidiary overview 2021Tanzania (Continued)
OUR BUSINESSSubsidiary overview 2021Tanzania (Continued)Senior Management
Baseer MohammedChief Executive Officer
Donald Aswani Mate Chief Operating Officer
Patrick Richard KapellaHead of Treasury
Lilian Kidee MtaliHead of Retail Banking
Veronica Pascal MagongoHead of Finance
Aimtonga AdolphHead of Internal Audit
Alan MbangulaHead of ICT
Krishnan RamachandranHead of Corporate Banking
Abbas KermalliHead of Credit
Erica William MboyaHead of HR
Emmanuel Wilson MoshaHead of Risk & Compliance
OUR BUSINESS

I&M GROUP PLC (FORMERLY I&M HOLDINGS PLC) ANNUAL INTEGRATED REPORT AND FINANCIAL STATEMENTS 2021 I&M GROUP PLC (FORMERLY I&M HOLDINGS PLC) ANNUAL INTEGRATED REPORT AND FINANCIAL STATEMENTS 2021 9392
Our
Gov
erna
nce
Our
Bus
ines
sO
ur F
inan
cial
s
Subsidiary overview 2021RwandaBoard of Directors
Bonaventure NiyibiziIndependent Chairman
Robin BairstowChief Executive Officer
Paul S MorrisIndependent Director
Crystal RugegeIndependent Director
Nikhil HiraIndependent Director
Alice NkulikiyinkaIndependent Director
Alan DoddIndependent Directorr
Chris LowNon-Executive Director
Julius TichelaarNon-Executive Director
Iddy RugambaCompany Secretary
I&M Rwanda is well led by a 9-member board with 7 non-executive directors and supported by a 9 member senior management team.
OUR BUSINESSSubsidiary overview 2021Rwanda (Continued)
Macroeconomic environment Rwanda’s economy grew by 11.1% in the first nine months of 2021 reflecting a broad based recovery from 2020. Agriculture, Industrial production and Hospitality sectors saw strong growth as mobility eased in the country.
The National Bank of Rwanda (NBR) maintained an accommodative monetary stance in 2021 which supported the recovery. The Banking sector recorded asset growth of 17% year on year. while asset quality improved slightly to 4.6% as NBR’s efforts to allow banks to restructure loans for clients facing temporary cashflow challenges bore fruit.
Operating environment Similar to other subsidiaries, I&M Rwanda has also been on a digital transformation journey over the last two years. The bank launched mobile lending in September 2021 and also introduced WhatsApp banking to increase banking convenience and accessibility. The bank through its partnership with SPENN, a fintech company in Rwanda, introduced MSME banking, which has seen strong growth with 72% growth in the customer base (more than 2200 new MSME customers) in 2021. The effort in supporting the growth of the MSME sector was recognized with the “Product Innovation of the Year” award in the gold category of the SME Finance Forum Awards for delivering outstanding products and services to our SME clients and segment.
Financial performance The bank delivered strong growth in 2021 reflected by the favorable business momentum in the country, following further easing of health and business restrictions and the bank’s commitment to being there for customers and the community.
Profit before income tax for the year was Rwf 11 billion (2020: profit of Rwf 7.8 billion). Net interest income increased from Rwf 22.4 billion in 2020 to Rwf 26.8 billion in 2021 in correlation to the increase in loans and advances to customers from RWF 205 billion to Rwf 222 billion in 2021.
Key Performance Metrics – Kshs (Billions)
Period December 2021 December 2020 % Growth
Assets
Net Loans and Advances 24 23 7%
Total Assets 51 46 11%
Equity & Liabilities
Customer Deposits 29 27 6%
Shareholder Funds 7 6 13%
P&L
Total Operating Income 3.5 2.8 24%
Loan Loss Provisions 0.2 0.6 -69%
Operating Expenses 2.3 1.9 16%
PBT 1.2 0.9 41%
Key Ratios
Period December 2021 December 2020
Gross GPA 4.5% 3.6%
Net NPA 1.1% 0.0%
Loan to Deposit Ratio 83.5% 82.6%
Cost to Income Ratio 64.3% 59.2%
ROE 15.7% 10.9%
ROA 2.0% 1.2%
OUR BUSINESS (Continued)

I&M GROUP PLC (FORMERLY I&M HOLDINGS PLC) ANNUAL INTEGRATED REPORT AND FINANCIAL STATEMENTS 2021 I&M GROUP PLC (FORMERLY I&M HOLDINGS PLC) ANNUAL INTEGRATED REPORT AND FINANCIAL STATEMENTS 2021 9594
Our
Gov
erna
nce
Our
Bus
ines
sO
ur F
inan
cial
s
Subsidiary overview 2021Rwanda (Continued)
OutlookRwanda's economy is expected to continue growing strongly into 2022 at 7.5% especially through Government support through the Economic Recovery Fund aimed to fast track private sector investments in manufacturing and construction. The bank intends to continue on its digitisation journey as per the Group’s overall strategy and deepening its position in the Rwanda market through continued innovation and improvement of its products and services.
Senior Management
Robin BairstowChief Executive Officer
Paul SagniaChief Operating Officer
Lise MugishaChief Risk Officer
Olivier GakubaDirector - Business Development
Dederi WimanaChief Finance Officer
Norbert MwananguGeneral Manager - Retail and Digital Experience
Nicolas UwimanaHead of Legal
Yvon AbaneHead of Treasury
Cynthia RwamamaraHead of Internal Control and Compliance
OUR BUSINESS
Suleiman KiggunduIndependent Chairman
Kumaran PatherChief Executive Officer
Sam NtulumeExecutive Director and Chief Operations Officer
Chris LowNon-Executive Director
Bhartesh ShahNon Executive Director
Francis M ByaruhangaIndependent Director
Joram KahenanoIndependent Director
Ketan MorjariaIndependent Director
Nicholas EcimuCompany Secretary
Subsidiary overview 2021UgandaBoard of Directors
I&M Uganda is the latest addition to our geographical presence in the Eastern African region. The Ugandan entity is led by 1 Board members and 13 senior management team.
OUR BUSINESS

I&M GROUP PLC (FORMERLY I&M HOLDINGS PLC) ANNUAL INTEGRATED REPORT AND FINANCIAL STATEMENTS 2021 I&M GROUP PLC (FORMERLY I&M HOLDINGS PLC) ANNUAL INTEGRATED REPORT AND FINANCIAL STATEMENTS 2021 9796
Our
Gov
erna
nce
Our
Bus
ines
sO
ur F
inan
cial
s
Subsidiary overview 2021Uganda (Continued)
Macroeconomic environmentThe Ugandan economy rebounded in 2021 growing by 3.4% against 2.9% in 2020, since the impact of COVID-19 related restrictions remained for most of the year. This was mainly driven by an improvement in consumption and recovery in public investment. The Ugandan shilling appreciated by 1.3% in 2021, reducing the cost of imports as firms continued to re-open from the impact of the pandemic.
COVID-19 restrictions presented a challenge to the operating environment of many businesses, affecting cash-flows and adjusting business models. However, overall private sector credit grew by 9% year on year in 2021, with agriculture, real estate and manufacturing benefitting the most. Asset quality stood at around 5.27% in December 2021 (similar to 2020) depicting that the Bank of Uganda’s credit relief guidelines cushioned the impact of the challenges faced by the businesses.
Operational performance During the year, the acquisition of 90% shareholding of Orient Bank Ltd was completed and the bank rebranded to I&M Uganda. The year 2021 was a period of integration and consolidation to align the bank’s strategy to the Group strategy. This included the consolidation of the distribution network by merging service delivery centres in micro markets into locations that will drive better customer service and deliver products in a more efficient and effective manner, while taking advantage of the digital channels. While in the process of integration, the bank still managed to leverage on the Group cross- border initiatives, delivered funding to customers of over Ugx 23 billion and assisted transactional requirements by holding deposits of Ugx 21 billion.
Financial performance
Key Performance Metrics – Kshs (Billions)
Period 31 December 2021 Key Ratios
Total Assets 23 Gross NPA 1.8%
Net Loans & Advances 6 Net NPA 1.1%
Customer Deposits 18 Loan to Deposit 33%
Shareholder Funds 3 Cost to Income 95%
Net Operating Income 2 ROE -25%
PBT 0.5 ROA -2%
OutlookWith the easing of the COVID-19 restrictions, the Ugandan economy is expected to continue the growth momentum with GDP expected to grow at around 5.5% in 2022. This is expected to be driven by improvement in consumer demand, gradual return of tourism etc. The bank will continue to integrate and align itself with the Group strategy in 2022 as it positions itself for growth.
OUR BUSINESSSubsidiary overview 2021Uganda (Continued)Senior Management
Kumaran PatherChief Executive Officer
Sam NtulumeExecutive Director and Chief Operations Officer
Edward Gibson NangonoChief Business Officer
Andrew Ssekamwa Chief Financial Officer
Joseph Fetaa Head of Products & Channels
Katherine S TurinaweHead of Human Resources
Duncan George KarugabaHead of Operations
Charles Kiirya Head of Credit
Denis Damba Head of Treasury
Srinallapa KumarHead of IT
Oscar KaramagiHead of Internal Audit
Hope Lorna NakhayenzeHead of Risk
Kironde Erina NatalieHead of Legal and Compliance
OUR BUSINESS

I&M GROUP PLC (FORMERLY I&M HOLDINGS PLC) ANNUAL INTEGRATED REPORT AND FINANCIAL STATEMENTS 2021 I&M GROUP PLC (FORMERLY I&M HOLDINGS PLC) ANNUAL INTEGRATED REPORT AND FINANCIAL STATEMENTS 2021 9998
Our
Gov
erna
nce
Our
Bus
ines
sO
ur F
inan
cial
s
Subsidiary overview 2021MauritiusBoard of Directors
Sandra MartyresIndependent Chairperson*
*Resigned 31/12/2021
Roselyne RenelIndependent Chairperson**+w/e 1/1/2022
Mark WatkinsonChief Executive Officer & Executive Director
Lakshman BheenickNon-executive Director
Jerome De ChasteauneufNon-executive Director
Gauri GuptaNon-executive Director
Chris LowNon-executive Director
Leonard C MususaIndependent Director
Ignasi Serrahima ArbestainIndependent Director
Nikhil TreebhoohunIndependent Director
Bank One is led by 10 Board members and supported by a team of 12 senior managers
OUR BUSINESS
Operating environment Despite the challenges faced in 2021, Bank One continued to pursue its digital transformation programme with the successful launch of PoP a unique payment application that will significantly enhance customer experience.
The Bank also rebounded from the loss of the previous year to post healthy results in terms of growth and profitability. The NPA figure dropped substantially while capital adequacy, liquidity and other critical performance ratios showed a marked improvement.
Financial performance Despite the impact of the pandemic, travel restrictions etc the bank generated a resilient set of results in 2021. Operating income was up by 5% as a result of growth in non funded income relating to the SSA business.
Opex was up by 20% due to the ongoing system investments as discussed above. The bank managed its non-performing loans to bring the ratio down to 3% from 9% in the previous year.
All these initiatives led to the bank generating a PBT of Rupee 522 million against a loss of Rupee 531 million in 2020.
Key Performance Metrics – Kshs (Billions)
Period December 2021 December 2020 % Growth
Assets
Net Loans and Advances 44 51 15%
Total Assets 117 157 19%
Equity & Liabilities
Customer Deposits 97 132 25%
Shareholder Funds 10 9.4 22%
P&L
Total Operating Income 4.0 3.6 2%
Loan Loss Provisions 0.2 3.0 -94%
Operating Expenses 2.5 2.1 15%
PBT 1.4 (1.5) 195%
Key Ratios
Period December 2021 December 2020
Gross GPA 3.2% 8.7%
Net NPA 0.6% 2.1%
Loan to Deposit Ratio 57.2% 46.9%
Cost to Income Ratio 67.1% 73.6%
ROE 11.6% -14.0%
ROA 0.9% -0.9%
OutlookThe outlook for Mauritius remains positive as the economy rebounds. However, geopolitical risks, rising commodity prices, inflationary pressures still remain downside risks that are being closely watched. GDP is expected to grow at 5.2% in 2022. The bank intends continue investing in digital transformation and alongside I&M Group in a cultural transformation journey to create the bank of the future.
Subsidiary overview 2021Mauritius (Continued)
OUR BUSINESS
Macro-economic environmentIn the last quarter of 2021, the Mauritius economy grew by 7.17% year on year despite Omnicron variant becoming prominent. Growth was boosted by several sectors that saw a bounce back such as Manufacturing, Housing, Financial Services, Tourism etc. Inflation increased to 4% year on year. The efforts of Bank of Mauritius and the Government support provided to the market during the pandemic have been instrumental in this recovery. The Reserve Bank of Mauritius maintained an accommodative monetary stance to support economic recovery.
Mauritius also benefitted from its removal from the Financial Action Task Force (FATF) list of countries under increased monitoring in October 2021, while in November 2021, UK also removed the country from its list of high-risk countries. These removals are positive for the financial services sector.
The annual growth of bank credit to the private sector has been generally trending upwards while ratio of NPLs to total loans have been on a downward trend.

I&M GROUP PLC (FORMERLY I&M HOLDINGS PLC) ANNUAL INTEGRATED REPORT AND FINANCIAL STATEMENTS 2021 I&M GROUP PLC (FORMERLY I&M HOLDINGS PLC) ANNUAL INTEGRATED REPORT AND FINANCIAL STATEMENTS 2021 101100
Subsidiary overview 2021Mauritius (Continued)Senior Management
Mark WatkinsonChief Executive Officer & Executive Director
Eric HautefeuilleChief Operations Officer
Ranjeevesingh GowreesunkurChief Financial Officer
Stephen VlokChief Risk Officer
Valerie DuvalHead of Legal
Fareed SoobadarHead of Corporate Banking
Carl S ChirwaHead of International Banking
Guillaume PassebecqHead of Private Banking & Wealth Management
Priscilla MuttyHead of Human Resources
Rishyraj LutchmanHead of Treasury
John Alfred (Kenny) MortonHead of Regulatory Affairs
Bhavya ShahHead of Personal Financial Service
OUR BUSINESS
Our
Gov
erna
nce
Our
Bus
ines
sO
ur F
inan
cial
s
Michael TurnerIndependent Chairman
Edward Burbidge Chief Executive Officer
Arun S MathurNon Executive Director
Pratul ShahIndependent Director
Gauri GuptaNon Executive Director
Subsidiary overview 2021I&M Burbidge Capital Ltd, KenyaBoard of Directors
The advisory business reported a loss of Kshs.9 million as business continued to remain challenging for most sectors in 2021.
The Company hosted its Annual Capital Raising Seminar via a webinar in partnership with ISBI institute, Strathmore University Business School.
The Company also won the deal maker of the year award from EAVCA despite the challenging environment cementing its position as a leading transaction advisor in the region
William Kalema Independent Chairman
Edward Burbidge Non Executive Director
Kumaran PatherNon Executive Director
Jharna KamdarNon Executive Director
I&M Burbidge Capital (Uganda) LtdBoard of Directors
OUR BUSINESS

I&M GROUP PLC (FORMERLY I&M HOLDINGS PLC) ANNUAL INTEGRATED REPORT AND FINANCIAL STATEMENTS 2021 I&M GROUP PLC (FORMERLY I&M HOLDINGS PLC) ANNUAL INTEGRATED REPORT AND FINANCIAL STATEMENTS 2021 103102
Our
Gov
erna
nce
Our
Bus
ines
sO
ur F
inan
cial
s
Subsidiary overview 2021 I&M Bancassurance Intermediary LimitedBoard of Directors
Kihara Maina Chairman
Bhartesh ShahNon Executive Director
L A Sivaramakrishnan Non Executive Director
The Company saw a 21% growth in revenues in 2021 as business continued to grow and also remained profitable during the year, growing by 12%.
I&M Capital LimitedBoard of Directors
Daniel Ndonye Independent Chairman
Silas MutukuChief Executive Officer
Gauri GuptaNon Executive Director
Arun S MathurNon Executive Director
Peter AndersonIndependent Director
I&M Capital was formally launched in July 2021 and shown good growth since its launch. It introduced several products including wealth management, money market fund etc. The Company saw Assets Under Management (AUM) grow to more than 700 million during the year.
OUR BUSINESSSubsidiary overview 2021 I&M Realty LimitedBoard of Directors
Subsidiary overview 2021Investment & Mortgages Nominees Limited Board of Directors
Arun S MathurChairman
Gauri Gupta Non Executive Director
I&M Realty, the Group's real estate Holding Company recorded a 38% growth in revenue and 28% profitabilty.
This is an investment intermediary that supports I&M Bank customers in making investments. The Company is fully owned by the Group.
Suresh B R Shah, MBS Chairman
Sachit S Raja ShahNon Executive Director
Sarit S Raja Shah Non Executive Director
OUR BUSINESS

I&M GROUP PLC (FORMERLY I&M HOLDINGS PLC) ANNUAL INTEGRATED REPORT AND FINANCIAL STATEMENTS 2021 I&M GROUP PLC (FORMERLY I&M HOLDINGS PLC) ANNUAL INTEGRATED REPORT AND FINANCIAL STATEMENTS 2021 105104
Subsidiary overview 2021Giro LimitedBoard of Directors
I&M Foundation Trustees
Formerly Giro Commercial Bank Limited, it was a fully-fledged commercial bank licensed by the CBK and acquired by I&M Group in February 2017.
Alan DoddIndependent Director
Sarit S Raja ShahChairman
Kihara MainaNon Executive Director
Suresh B R Shah, MBSChairman
Sarit S Raja Shah Trustee
Kihara MainaTrustee
Eric KimaniTrustee
Janet MawiyooTrustee
OUR BUSINESS
Our
Gov
erna
nce
Our
Bus
ines
sO
ur F
inan
cial
s
Group performance In view of the particularly difficult East African market conditions including the elevated credit risk environment and subdued business activity despite signs of improvement we operate in; the Group achieved a satisfactory performance for the year under review with the net profit slightly above last year to stand at Kshs 8.6 billion.
During the year we concluded the acquisition of Orient Bank Limited, Uganda (now rebranded to I&M Uganda Ltd) into the Group which will strengthen our presence in Eastern African and propel us towards achieving our goal to become Eastern Africa’s Leading Financial Partner for Growth. The entity returned a loss for the year due to our prudent approach on credit risk and one-off costs relating to the alignment of operational styles to that of the Group.
Operating income The Groups’ performance was consistent during the year buoyed by strong operating income before impairment charges in 2021 to Kshs 29 billion. This was to a large extent aided by the growth in our net interest income by 34%. Non funded income was flat compared to prior year partially impacted by lower forex revenues and mark to market losses on bond trading.
Operating income (Kshs Bn)
2017
21
23
24 24
30
2018 2019 2020 2021
Management discussion and analysis
OUR BUSINESS
Interest income vs. Interest expense (Kshs Bn)
24
2627
12
9
10
2017 2018 2019 2020 2021
28
12
33
12
Interest Income (Kshs Bn) Interest Expense (Kshs Bn)

I&M GROUP PLC (FORMERLY I&M HOLDINGS PLC) ANNUAL INTEGRATED REPORT AND FINANCIAL STATEMENTS 2021 I&M GROUP PLC (FORMERLY I&M HOLDINGS PLC) ANNUAL INTEGRATED REPORT AND FINANCIAL STATEMENTS 2021 107106
Our
Gov
erna
nce
Our
Bus
ines
sO
ur F
inan
cial
s
Cost to income ratio
37% 37% 40% 42% 46%
2017 2018 2019 2020 2021
Our strategy to reduce our cost of funds by increasing our current and savings account book coupled with better yields on the Groups investment in Government securities, was reflected in the growth of our Net Interest Income by 5.4 billion compared to the previous year.
Cost analysis The Group has been amongst the most efficient institutions within the sector. The increase in the cost to income ratio over the last two years has been driven by our move to digitise the business resulting in an increased investment in technology and therefore higher amortisation costs. Further as we build synergies across the Group subsidiaries, we incurred set up costs to enhance our shared services center. The higher cost to income ratio was also a factor of the rebranding and integration of I&M Uganda. Excluding the Uganda costs, our cost to income ratio would have been 43% in 2021. The benefits of these investments are expected to be realised in the short to medium term.
OUR BUSINESS
Our operating profit before impairments grew by 14% year on year.
Operating profit before impairment (Kshs Bn)
13 15 14 14 16
2017 2018 2019 2020 2021
Loan loss expenseWe continue to remain prudent in our business risk management and continuously assess the loan and advances to ensure we adequately cover the risk in our portfolio. As a result, despite a better macro-economic environment in 2021, remaining cognizant of risks in certain sectors and guided by the strategy to increase the loan loss coverage ratio lead to loan loss expenses increasing by 70% during the year.
Impairment charges (Kshs Bn)
4 4 1 2 4
2017 2018 2019 2020 2021
Management discussion and analysis (Continued)Management discussion and analysis (Continued)
OUR BUSINESS
Profit for the yearOur profitability remained solid during the year driven by strong operating income. The profit after tax increased marginally as a result of tax rate change from 25% for year 2020 to 30% in 2021, deferred tax credit reductions and the loss incurred by the Group in Uganda. Excluding the loss in Uganda, our profit after tax would have reported increased by 13% year on year.
Profit for the year (Kshs Bn)
7
9
11
8
9
2017 2018 2019 2020 2021

I&M GROUP PLC (FORMERLY I&M HOLDINGS PLC) ANNUAL INTEGRATED REPORT AND FINANCIAL STATEMENTS 2021 I&M GROUP PLC (FORMERLY I&M HOLDINGS PLC) ANNUAL INTEGRATED REPORT AND FINANCIAL STATEMENTS 2021 109108
Our
Gov
erna
nce
Our
Bus
ines
sO
ur F
inan
cial
s
Balance sheet performance The Group’s total assets grew by 16%, driven by growth investment in Government securities of 23%, and loans and advances of 13%.
Loans and advances The Loans and advances portfolio expanded during the year as we saw economic activity pick up in certain sectors, following the withdrawal of lockdown measures in the second half of the year. Key sectors of growth were manufacturing, retail and trade, services and construction increasing the demand for credit facilities.
153
167
175
187
211
2017 2018 2019 2020 2021
Loans & advances (Kshs Bn)
Management discussion and analysis (Continued)
OUR BUSINESS
Sector distribution of loans and advances
ManufacturingOthers
Businessservices
Transport &communication
Real estate
AgricultureBuilding &
construction
Wholesale &retail trade
25%
16%
8%
7%
15%
4%
6%
19%
Sector distribution of loans and advances
Funding Overall the funding base grew by 18%. This was driven by customer deposit growth of 13% as the Group continued to focus on bringing the cost of funds. This is reflected in the growth of our Current and Savings (CASA) deposits. The ratio of the CASA to term deposits moved from 28:72 to 39:61 in 2021. The funding base was also supported by a 32% growth in borrowings from DFIs for onward lending to the SME sector, which remains a key focus for the business.
Customer deposits
169
213
230
263
297
2017 2018 2019 2020 2021
Customer deposits (Kshs Bn)
Management discussion and analysis (Continued)
OUR BUSINESS
Current andSaving Account
39%
Term Deposits
Deposits segmentation (Kshs Bn)
61%
39%
With this our loan to deposit ratio remained steady at 71% while loans to total funding was at 62%, ensuring the Group is well funded for future growth of the balance sheet. The Group continued to remain strong in terms of regulatory capital requirements as a result of proactive capital planning and management. The Group’s Capital Adequacy stood at 21.5% on a Total Capital basis while liquidity ratio closed at 50% at as 31 December 2021.

I&M GROUP PLC (FORMERLY I&M HOLDINGS PLC) ANNUAL INTEGRATED REPORT AND FINANCIAL STATEMENTS 2021 I&M GROUP PLC (FORMERLY I&M HOLDINGS PLC) ANNUAL INTEGRATED REPORT AND FINANCIAL STATEMENTS 2021 111110
Our
Gov
erna
nce
Our
Bus
ines
sO
ur F
inan
cial
s
Management discussion and analysis (Continued)
OUR BUSINESS
Overview of performance against our key performance indicators - KPI schedule
2021 2020 2019 2018 2017
Statement of profit or loss (Kshs millions)
Operating income before loan loss provisions 19,146 23,909 23,481 22,933 21,091
Operating profit before impairment 16,064 14,104 14,335 14,710 13,483
Operating profit 11,864 11,631 13,698 10,902 9,340
Profit before tax 12,413 10,952 14,603 11,498 9,895
Profit for the year 8,624 8,413 10,769 8,503 7,264
Statement of financial position (Kshs millions)
Total assets 415,181 358,100 315,291 288,522 240,111
Total net loans 210,620 187,391 175,329 166,737 153,018
Investment securities 125,535 101,711 53,924 85,832 57,226
Total deposits 296,747 262,681 229,737 213,139 169,282
Subordinated liabilities 10,029 4,455 4,645 5,509 4,512
Other borrowed funds 9,517 10,318 6,211 8,247 8,150
Shareholder funds 69,593 64,189 57,739 49,481 44,320
Performance ratios
Return on average assets 2.1% 2.3% 3.4% 2.9% 3.0%
Return on average equity 12% 12% 18% 16% 15%
Non-interest income to operating income 29% 36% 35% 33% 27%
Loans to deposit ratio 71% 71% 76% 78% 90%
Cost to income ratio 46% 42% 40% 37% 37%
Capital adequacy ratio 21.5% 22.0% 21.5% 17.7% 18.2%
Asset quality
Non-performing loans 21.4 23.6 21.3 23.8 19.5
Gross NPL Ratio 10% 13% 12% 14% 13%
Dividend payout
Profit attributable to equity holders of the Company Kshs millions 8,131 8,074 10,309 7,951 6,766
Dividend Kshs millions 2,480 1,860 2,108 1,612 1,447
Issued shares as per financials Kshs millions 1,654 827 827 413 413
Issued shares restated after bonus issue millions 1,654 1,654 1,654 1,654 1,654
Dividend per share 1.50 2.25 2.55 3.90 3.50
*Dividend per share 1.50 1.125 1.275 0.975 0.875
*Restatement after issue of bonus share
OU
R BU
SIN
ESS
(Con
tinu
ed)
Man
agem
ent d
iscu
ssio
n an
d an
alys
is (C
onti
nued
)
Our
per
form
ance
tren
ds -
five
year
revi
ew &
val
ue a
dded
sta
tem
ent
VA
LUE
AD
DED
STA
TEM
ENT
2021
KSh
s '0
0020
20K
Shs
'000
2019
KSh
s '0
0020
18K
Shs
'000
2017
KSh
s '0
00
Inte
rest
inco
me,
fees
com
mis
ion
and
othe
r rev
enue
s 4
1,35
1 3
6,15
8 35
,135
33,
338
29,9
60
Inte
rest
pai
d to
dep
osito
rs a
nd c
ost o
f oth
er s
ervi
ces
(18,
825)
(17,1
89)
(12,
891)
(15,
965)
(14,
653)
Inte
rest
pai
d on
bor
row
ings
(1,9
48)
(1,6
96)
(1,5
72)
(1,0
19)
(926
)
Wea
lth
crea
ted
20,
578
17,2
7320
,672
16,
354
14,3
81
Dis
trib
utio
n of
wea
lth
Empl
oyee
s - s
alar
ies,
wag
es a
nd o
ther
ben
efits
6,00
2 29
.2%
4,5
55
22.1%
4,72
8 22
.9%
4,10
9 25
.1%3,
752
26.1%
Gov
ernm
ent -
Tax
3,78
918
.4%
2,5
3912
.3%
3,83
418
.5%
2,99
418
.3%
2,63
018
.3%
Shar
ehol
der's
div
iden
ds2,
480
12.1%
1,8
60
9.0%
2,10
8 10
.2%
1,61
29.
9%1,
447
10.1%
Rete
ntio
n to
sup
port
futu
re b
usin
ess
grow
th
Reta
ined
ear
ning
s6,
144
29.9
%6,
553
31.8
% 8
,661
41
.9%
6,89
2 42
.1% 5
,817
40
.4%
Dep
reci
atio
n an
d am
ortis
atio
n 2
,023
9.8%
1,52
67.4
% 1
,166
5.6%
597
3.7%
562
3.9%
Soci
al c
apita
l - I&
M F
ound
atio
n 1
40
0.7%
240
1.2%
175
0.8%
150
0.9%
173
1.2%
Wea
lth
dist
ribut
ed 2
0,57
810
0%17
,273
84%
20,
672
100%
16,3
5410
0% 1
4,38
1 10
0%

I&M GROUP PLC (FORMERLY I&M HOLDINGS PLC) ANNUAL INTEGRATED REPORT AND FINANCIAL STATEMENTS 2021112 2020 ANNUAL REPORT & FINANCIAL STATEMENT
OUR FINANCIALS
THE GROUPIS NOW WELLPOSITIONEDTO EXPLOITOPPORTUNITIESIN THE NEXTPHASE OFOUR GROWTHTO SOLIDIFYOUR MARKETLEADERSHIPPOSITION GOINGFORWARD

I&M GROUP PLC (FORMERLY I&M HOLDINGS PLC) ANNUAL INTEGRATED REPORT AND FINANCIAL STATEMENTS 2021 I&M GROUP PLC (FORMERLY I&M HOLDINGS PLC) ANNUAL INTEGRATED REPORT AND FINANCIAL STATEMENTS 2021 115114
In this document we have used the following abbreviations:
AFS Available-for-sale
AGM Annual General Meeting
BNRGC Board Nomination, Remuneration and Governance Committee
CBK Central Bank of Kenya
CMA Capital Markets Authority
CRMC Credit Risk Management Committee
EAD Exposure at default
ECL Expected credit losses
ESOP Employee Share Ownership Plan
FVOCI Fair value through other comprehensive income
FVTPL Fair value through profit or loss
GROUP I&M Group PLC (formerly I&M Holdings PLC) together with its subsidiary undertakings and joint venture
HRC Human Resource Committee
IAS International Accounting Standards
IFC International Finance Corporation
IFRSs International Financial Reporting Standards
IMGP I&M Group PLC (formerly I&M Holdings PLC)
GDP Gross Domestic Product
GPO General Post Office
LGD Loss given default
ITSC IT steering Committee
KShs Kenya Shillings
MPC Management Procurement committee
NSE Nairobi Securities Exchange
OCI Other comprehensive income
PBT Profit before tax
PPE Property and Equipment
PD Probability of default
RISKO Risk and Compliance Management committee
SICR Significant increase in credit risk
SPPI Solely payments of principal and interest
YIB Youjays Insurance Brokers Limited
TO STeerCO Transformation Office Steering committee
AbbreviationsOUR FINANCIALS
Corporate information
Board of directorsDaniel Ndonye Chairman Suresh B R Shah, MBSSarit S Raja ShahMichael Turner*Sachit S. Raja ShahAlice Nyambura KoigiSuleiman Kiggundu Jr. **Rose Wanjiru KinuthiaAllan Christopher Michael Low* (Appointed on 15 January 2021)Oliver Fowler (Resigned on 18 March 2021)
* British** Ugandan
Company secretaryBilha Wanjiru Mwangi (CS Kenya)12th Floor, One Padmore PlacePO Box 51922, 00100 GPONairobi
AuditorKPMG KenyaCertified Public Accountants8th Floor, ABC TowersWaiyaki WayPO Box 40621, 00100 GPONairobi
Registered office1 Park Avenue1st Parklands AvenuePO Box 30238, 00100 GPONairobi
BankersI&M Bank LIMITEDPO Box 30238, 00100 GPONairobi
OUR FINANCIALS (Continued)
Our
Gov
erna
nce
Our
Bus
ines
sO
ur F
inan
cial
s
I&M GROUP PLC (FORMERLY I&M HOLDINGS PLC) ANNUAL INTEGRATED REPORT AND FINANCIAL STATEMENTS 2021 I&M GROUP PLC (FORMERLY I&M HOLDINGS PLC) ANNUAL INTEGRATED REPORT AND FINANCIAL STATEMENTS 2021 117116
Legal advisorsKaplan & StrattonWilliamson House4th Ngong AvenuePO Box 40111, 00100 GPONairobi
Banking entities registered officesI&M Bank limited1 Park Avenue1st Parklands AvenuePO Box 30238 – 00100 GPONairobi, Kenya
I&M Bank (T) limitedMaktaba SquareMaktaba StreetPO Box 1509Dar es Salaam, Tanzania
I&M Bank (Rwanda) plc11, Boulevard de la RevolutionPO BOX 354Kigali, Rwanda
I&M Bank (Uganda) limitedPlot 6/6a, Kampala RoadP.O BOX 3072Kampala, Uganda
Bank One limited16 Sir William Newton StreetPort Louis, Mauritius
Company registrarsCDSC Registrars Limited1st Floor, Occidental PlazaMuthithi RoadP.O Box 6341 – 00100 GPONairobi, Kenya
Corporate information (Continued)OUR FINANCIALS (Continued)
Our
Gov
erna
nce
Our
Bus
ines
sO
ur F
inan
cial
s
OUR FINANCIALS (Continued)Report of the directors
The Directors have pleasure in submitting their annual report together with the audited financial statements of I&M Group PLC (formerly I&M Holdings PLC) (“the Company”), its subsidiaries and its joint venture (together “the Group”) for the year ended 31 December 2021, which shows the state of affairs of the Group and of the Company.
1. Principal activitiesThe Group provides an extensive range of banking, financial and related services through its banking subsidiaries in Kenya, Tanzania, Rwanda, Uganda and a joint venture in Mauritius. The Companies that make up the Group are contained in Note 1 to the financial statements. The Company is listed on the Nairobi Securities Exchange and is regulated by the Capital Markets Authority and the Central Bank of Kenya as a non-operational holding company.
2. Acquisition of I&M Bank (Uganda) limited (Formerly Orient Bank Limited)On 17 July 2020 I&M Group PLC (Formerly I&M Holdings PLC) entered into a Share Purchase Agreement with the shareholders of I&M Bank (Uganda) Limited (Formerly Orient Bank Limited (OBL)), to acquire 90% shareholding in OBL.
On 30 April 2021, I&M Group PLC (Formerly I&M Holdings PLC) acquired the 90% issued share capital of Orient Bank Limited following the receipt of all regulatory approvals and being satisfied that all conditions precedent as stipulated in the Share Purchase Agreement were met. The results of I&M Bank (Uganda) Limited (formerly Orient Bank Limited) from the date of acquisition are consolidated in these financials.
3. Results/business reviewThe consolidated results for the year are as follows:
2021KShs’000
2020KShs’000
Profit before income tax 12,412,906) 10,952,004)
Income tax expense ( 3,788,970) ( 2,539,446)
Profit for the year 8,623,936 8,412,558
Net profit closed at KShs 8.6 billion, an increase of 2.5% (or KShs 211 Million) compared to prior year. The marginal increase was due to increase in loan provisions due to increased expected credit losses to cater for increased credit risk for sectors still affected by COVID-19 and increase in operating expenses. The Directors and employees re-affirm their commitment to achieving the laid down strategies and consequently delivering key value to shareholders.
The principal risks and uncertainties facing the Group and Company as well as the risk management framework are outlined in Note 5 to the consolidated and separate financial statements.
The Company changed its name from I&M Holdings PLC to I&M Group PLC effective 28 June 2021.
I&M GROUP PLC (FORMERLY I&M HOLDINGS PLC) ANNUAL INTEGRATED REPORT AND FINANCIAL STATEMENTS 2021 I&M GROUP PLC (FORMERLY I&M HOLDINGS PLC) ANNUAL INTEGRATED REPORT AND FINANCIAL STATEMENTS 2021 119118
4. DividendsThe Directors recommend payment of a first and final dividend of KShs. 1.50 per share amounting to KShs. 2,480,432,214 for the year ended 31 December, 2021. A dividend of KShs. 1.125 per share amounting to KShs. 1,860,324,161 in respect of the year ended 31 December 2020 was paid on 20 May, 2021.
The dividend will be payable to shareholders registered on the Company’s Register at the close of business on Thursday 21 April 2022 and will be paid on or around Thursday, 26 May 2022. The Register of Members will be closed from Friday, 22 April 2022 to Monday, 25 April 2022 (both days inclusive) for the purpose of processing the dividend.
5. DirectorsThe Directors who served during the year and up to the date of this report are set out on page 115.
6. Relevant audit information The Directors in office at the date of this report confirm that:
(i) There is no relevant audit information of which the Company’s auditor is unaware; and(ii) Each director has taken all the steps that they ought to have taken as a director so as to be aware of any relevant audit information and to
establish that the Company’s auditor is aware of that information.
7. AuditorTo note that Messrs KPMG Kenya continue in office as the Auditor by virtue of section 721 of the Companies Act, 2015 and subject to section 24(1) of the Banking Act (Cap. 488) and to authorise the Directors to fix the Auditor’s remuneration for the ensuing financial year.
8. Approval of financial statementsThe financial statements were approved and authorised for issue at a meeting of the Board of Directors held on 29 March 2022.
BY ORDER OF THE BOARDSecretary
Date: 29 March 2022.
Report of the directors (Continued)OUR FINANCIALS (Continued)
Our
Gov
erna
nce
Our
Bus
ines
sO
ur F
inan
cial
s
OUR FINANCIALS (Continued)Statement of directors’ responsibilities
The Directors are responsible for the preparation and presentation of the consolidated and separate financial statements of I&M Group PLC (formerly I&M Holdings PLC) (the “Group” or “Company”) set out on pages 130 to 237 which comprise the consolidated and company statements of financial position at 31 December 2021, and the consolidated and company statements of profit or loss and other comprehensive income, the consolidated and company statements of changes in equity and the consolidated and company statements of cash flows for the year then ended, and the notes to the consolidated and separate financial statements including a summary of significant accounting policies and other explanatory information, in conformity with International Financial Reporting Standards and in the manner required by the Kenyan Companies Act, 2015.
The Directors’ responsibilities include: determining that the basis of accounting described in Note 2 is an acceptable basis for preparing and presenting the financial statements in the circumstances, preparation and presentation of financial statements in accordance with International Financial Reporting Standards and in the manner required by the Kenyan Companies Act, 2015 and for such internal control as the Directors determine is necessary to enable the preparation of financial statements that are free from material misstatements, whether due to fraud or error.
Under the Kenyan Companies Act, 2015, the Directors are required to prepare financial statements for each financial year which give a true and fair view of the financial position of the Group and the Company as at the end of the financial year and of the profit or loss of the Group and the Company for that period. It also requires the Directors to ensure the Group and Company, its subsidiaries and joint venture keep proper accounting records which disclose with reasonable accuracy the financial position of the Group and the Company and its profit or loss.
The Directors accept responsibility for the maintenance of accounting records which may be relied upon in the preparation of consolidated and separate financial statements, as well as adequate systems of internal financial control.
The Directors have made an assessment of the Group and Company’s ability to continue as a going concern and have no reason to believe the Group and/or the Company will not be a going concern for at least the next twelve months from the date of this statement.
Approval of the consolidated and separate financial statements
The consolidated and separate financial statements, as indicated above, were approved and authorised for issue by the Board of Directors on 29 March 2022.
____________________________ ________________________________
Daniel Ndonye Dr. Nyambura KoigiChairman Director
______________________________
Sachit Raja ShahDirector
Date: 29 March 2022.

I&M GROUP PLC (FORMERLY I&M HOLDINGS PLC) ANNUAL INTEGRATED REPORT AND FINANCIAL STATEMENTS 2021 I&M GROUP PLC (FORMERLY I&M HOLDINGS PLC) ANNUAL INTEGRATED REPORT AND FINANCIAL STATEMENTS 2021 121120
Directors’ remuneration report
The Board Nomination and Remuneration Committee [BNRC] of I&M Group PLC (formerly I&M Holdings PLC) (IMGP) is pleased to present the Directors’ remuneration report for the year ended 31 December 2021. This report is in compliance with the IMGP’s Board Charter on Directors’ reward and remuneration, the Code of Corporate Governance Guidelines issued by the Capital Markets Authority (CMA) on Directors’ remuneration and the new Companies Act, 2015, enacted in September 2015, which became operational in June 2016. In the course of executing these policies, the Board’s desire is to align rewards with a clear and measurable linkage to business performance.
IMGP is regulated by the Capital Markets Authority and the Central Bank of Kenya as a non-operational holding company. IMGP Board is therefore comprised of Non-Executive directors as detailed out on corporate information page.
Information not subject to audit comprise the following:
• Policy on Directors’ remuneration• Directors’ contract of service• Directors’ shareholding• Share option and long-term incentives
Board remuneration At IMGP, Directors’ remuneration is paid in the form of (i) Directors’ Sitting Fees and (ii) Annual Retainer fees. The fees available to be paid to Directors are subject to shareholder ratification /approval as appropriate and in accordance with the provisions of the Companies Act, 2015 and the CMA Regulations and Guidelines on Corporate Governance.
The BNRC is tasked with ensuring that Directors’ remuneration levels are reviewed with sufficient regularity and are subject to external benchmarking to ensure that IMGP continuously offers competitive reward packages for its Directors. The remuneration to Directors is comprised of the following:
1. Fixed Annual Retainer Fees
These fees are determined taking into account market rates of pay. Fees are reviewed with sufficient regularity to align to prevailing market movements. Any increases are determined in accordance with the business’ ability to fund the increase. Retainer fees are paid quarterly in arrears.
2. Sitting or Attendance Fees
All Directors are paid sitting or attendance fee in recognition of the time spent attending Board or Committee meetings. The level of fees paid are also benchmarked to market rates and trends.
During the year, the BRNC carried out a review of fees paid to directors and adopted the following:
Particulars Annual retainer fees 2021 - KShs Annual retainer fees 2020 - KShs
Chairman 1,040,000 1,040,000
Director 598,000 – 832,000 598,000 – 832,000
Non-Executive Directors are not entitled to any pension, bonus or long-term incentive plans. There will be no changes to these policies in the next financial year.
OUR FINANCIALS (Continued)
Our
Gov
erna
nce
Our
Bus
ines
sO
ur F
inan
cial
s
OUR FINANCIALS (Continued)Directors’ remuneration report (Continued)
Directors’ contract of service Directors who serve on the Board of IMGP are elected to office during the AGM and offer themselves up for re-election as mandated in the Companies Act, 2015. The tenure of the Directors is for a period of three years, upon which the Directors can elect to offer themselves for re-election, in accordance with Article No. 112 of the Company’s Articles of Association. A Director’s appointment ceases immediately upon termination by resignation or a resolution by the shareholders, and no further remuneration accrues to the Director thereafter. The tenures of the Directors in office at the end of the last financial year are tabulated below:
Director Board membership Appointment date Last re-election date
Notice period
Daniel Ndonye Non-Executive, Independent 14-June-13 26-June-20 3 months
Suresh Bhagwanji Raja Shah, MBS Non-Executive 14-June-13 26-June-20 3 months
Sarit S Raja Shah Executive 14-June-13 24-May-18 3 months
Michael Turner Non-Executive, Independent 1-August-14 26-June-20 3 months
Sachit S Raja Shah Non-Executive 10-July-15 23-May-19 3 months
Nyambura Koigi Non-Executive, Independent 28-October-15 26-June-20 3 months
Suleiman Kiggundu Non-Executive, Independent 5-June-18 23-May-19 3 months
Rose Kinuthia Non-Executive, Independent 3-March-20 26-June-20 3 months
Allan Christopher Michael Low Executive 15-January-21 20-May-21 3 months
Oliver Fowler, Independent Non-Executive Director, resigned from the Board of I&M Group PLC (Formerly I&M Holdings PLC) effective 18 March 2021.
Directors shareholding Directors’ direct and indirect interests as at 31 December 2021 are tabulated below.
Name of Director Number of Shares % Shareholding
SBR Shah, MBS 174,947,573 10.58%
Sarit S Raja Shah 37,595,102 2.27%
Sachit S Raja Shah 37,152,230 2.25%
The other members of the Board do not hold shares in their personal capacity in the Company.
Share Options and long term incentive schemes
Directors are not entitled to any share option arrangement or long term share incentive schemes.
Non-Executive Directors
Non-Executive Directors receive fees and other emoluments in recognition of their contribution to the Company for Board and Committee meetings. The attendance fees is payable after the occurrence of the meetings. The Non-Executive Directors do not receive any performance-based remuneration.

I&M GROUP PLC (FORMERLY I&M HOLDINGS PLC) ANNUAL INTEGRATED REPORT AND FINANCIAL STATEMENTS 2021 I&M GROUP PLC (FORMERLY I&M HOLDINGS PLC) ANNUAL INTEGRATED REPORT AND FINANCIAL STATEMENTS 2021 123122
Dire
ctor
s’ re
mun
erat
ion
repo
rt (C
onti
nued
)In
form
atio
n su
bjec
t to
audi
t (a
udit
able
par
t)In
form
atio
n su
bjec
t to
audi
t com
pris
e th
e am
ount
s of e
ach
Dire
ctor
s’ c
ompe
nsat
ion
in e
ach
of th
e re
leva
nt y
ears
.
The
rem
uner
atio
n pa
id to
Dire
ctor
s in
the
year
und
er re
view
, and
com
para
tive
figur
es fo
r 202
0, a
re s
umm
aris
ed b
elow
:
2021
2020
Dir
ecto
r
Ann
ual
reta
iner
KSh
s
Att
enda
nce
fees
KSh
s
Fees
ea
rned
in
subs
idia
ries
KSh
sTo
tal
KSh
s
Ann
ual
reta
iner
KSh
s
Att
enda
nce
fees
K
shs
Fees
ea
rned
in
subs
idia
ries
KSh
sTo
tal
KSh
s
Dan
iel N
dony
e1,
040,
000
670,
800
360,
000
2,07
0,80
01,
040,
000
873,
600
-1,
913,
600
Sure
sh B
hagw
anji
Raja
Sha
h, M
BS59
8,00
028
6,00
01,
560,
094
2,44
4,09
4 5
98,0
00
286
,000
1,
391,
778
2,27
5,77
8
Sarit
S R
aja
Shah
598,
000
880,
400
403,
858
1,88
2,25
8 5
98,0
00
1,05
7,600
38
8,44
42,
044,
044
Mic
hael
Tur
ner
832,
000
806,
000
1,45
3,60
03,
091,
600
832
,000
9
20,4
00
1,27
9,07
13,
031,
471
Sach
it S
Raja
Sha
h59
8,00
028
6,00
03,
027,6
253,
911,
625
598
,000
2
86,0
00
3,38
2,87
74,
266,
877
Oliv
er F
owle
r17
5,51
857
,200
1,27
1,35
81,
504,
076
832
,000
4
57,6
00
-1,
289,
600
Nya
mbu
ra K
oigi
598,
000
514,
800
3,07
0,94
04,
183,
740
598
,000
2
86,0
00
4,80
6,75
55,
690,
755
Sule
iman
Kig
gund
u83
2,00
01,
000,
400
1,08
2,23
92,
914,
639
832,
000
1,20
7,600
-
2,03
9,60
0
Rose
Kin
uthi
a83
2,00
075
4,00
0-
1,58
6,00
0 6
37,6
39
722
,800
-
1,36
0,43
9
6,10
3,51
85,
255,
600
12,2
29,7
1423
,588
,832
6,56
5,63
96,
097,
600
11,2
48,
925
23,9
12,1
64
Our
Gov
erna
nce
Our
Bus
ines
sO
ur F
inan
cial
s
Directors’ remuneration report (Continued)
Information subject to audit (auditable part) (Continued)Mr. Sarit S Raja Shah also received the following remuneration from I&M Bank LIMITED, a wholly owned subsidiary of I&M Group PLC (formerly I&M Holdings PLC):
Details 2021KShs
2020KShs
Salary 31,941,935 31,350,911
Bonus 4,925,152 7,387,728
Pension 3,003,296 2,661,982
Insurance 4,076,235 3,073,330
Total 43,946,618 44,473,951
Mr. Allan Christopher Low received the following remuneration from I&M Bank LIMITED, a wholly owned subsidiary of I&M Group PLC (formerly I&M Holdings PLC):
Details 2021KShs
2020KShs
Salary 36,258,377 -
Pension 2,400 -
Insurance 1,224,622 -
Total 37,485,399 -
Mr. Vincent De Brouwer received the following remuneration from I&M Bank LIMITED, a wholly owned subsidiary of I&M Group PLC (formerly I&M Holdings PLC):
Details 2021KShs
2020KShs
Salary - 21,419,373
Pension - 1,400
Insurance - 1,134,464
Total - 22,555,237
In the AGM held on 20 May 2021, the Directors’ remuneration was approved unanimously.
Information on aggregate amount of emoluments and fees paid to directors are disclosed in Note 15 of the financial statements.
Other key policies influencing directors remuneration Discretions retained by the Bnrgc The Company does not operate any long-term incentive plan such as a Share Option Plan or a Share Performance Plan. There are, therefore, no areas of discretion to disclose.
Insurance coverThe Company provides professional indemnity for all the Directors in line with best practice in the market.

I&M GROUP PLC (FORMERLY I&M HOLDINGS PLC) ANNUAL INTEGRATED REPORT AND FINANCIAL STATEMENTS 2021 I&M GROUP PLC (FORMERLY I&M HOLDINGS PLC) ANNUAL INTEGRATED REPORT AND FINANCIAL STATEMENTS 2021 125124
Directors’ remuneration report (Continued)
Approval of the directors’ remuneration reportThe Directors confirm that this report has been prepared in accordance with the Kenyan Companies Act, 2015, Capital Markets Authority (CMA) Code and listing rules.
________________________
For Michael Turner
Chairman, Board Nomination and Remuneration Committee
Date: 29 March 2022.
OUR FINANCIALS (Continued)
Our
Gov
erna
nce
Our
Bus
ines
sO
ur F
inan
cial
s
Report on the audit of the consolidated and separate financial statementsOpinion
We have audited the consolidated and separate financial statements of I&M Group PLC (Formerly I&M Holdings PLC) (the “Group” and “Company”) as set out on pages 130 to 237, which comprise the consolidated and company statements of financial position as at 31 December 2021, and the consolidated and company statements of profit or loss and other comprehensive income, the consolidated and company statements of changes in equity and the consolidated and company statements of cash flows for the year then ended, and notes to the consolidated and separate financial statements, including a summary of significant accounting policies and other explanatory information.
In our opinion, the accompanying consolidated and separate financial statements give a true and fair view of the consolidated and separate financial position of I&M Group PLC (Formerly I&M Holdings PLC) as at 31 December 2021, and of its consolidated and separate financial performance and its consolidated and separate cash flows for the year then ended in accordance with International Financial Reporting Standards (IFRSs) and in the manner required Kenyan Companies Act, 2015.
Basis for opinion
We conducted our audit in accordance with International Standards on Auditing (ISAs). Our responsibilities under those standards are further described in the Auditor’s Responsibilities for the Audit of the Consolidated and Separate Financial Statements section of our report. We are independent of the Group and the Company in accordance with the International Ethics Standards Board for Accountants' International Code of Ethics for Professional Accountants (including International Independence Standards) (IESBA Code), together with the ethical requirements that are relevant to our audit of the consolidated and separate financial statements in Kenya, and we have fulfilled our other ethical responsibilities in accordance with these requirements and the IESBA Code. We believe that the audit evidence we have obtained is sufficient and appropriate to provide a basis for our opinion.
Key audit matters
Key audit matters are those matters that, in our professional judgment, were of most significance in our audit of the consolidated and separate financial statements of the current period. These matters were addressed in the context of our audit of the consolidated and separate financial statements as a whole, and in forming our opinion thereon, and we do not provide a separate opinion on these matters.
Expected credit losses on loans and advances at amortised cost in the consolidated financial statements
The disclosure associated with credit risk is set out in the financial statements in the following notes:
• Note 3 (f) (iii) – Significant accounting policies, Impairment on financial assets (page 145 – 148)
• Note 5(a) – Financial risk management, Credit risk (page 159 – 178)
• Note 21 (b) – Change in expected credit losses and other credit impairement charges (page 208)
INDEPENDENT AUDITOR’S REPORTTO THE MEMBERS OF I&M GROUP PLC (FORMERLY I&M HOLDINGS PLC)

I&M GROUP PLC (FORMERLY I&M HOLDINGS PLC) ANNUAL INTEGRATED REPORT AND FINANCIAL STATEMENTS 2021 I&M GROUP PLC (FORMERLY I&M HOLDINGS PLC) ANNUAL INTEGRATED REPORT AND FINANCIAL STATEMENTS 2021 127126
Report on the audit of the consolidated and separate financial statements (Continued)Key audit matters (continued)
Expected credit losses on loans and advances at amortised cost in the consolidated financial statements (Continued)
The key audit matter How the matter was addressed in our audit
Subjective estimate Our procedures in this area included:
The estimation of expected credit losses (“ECL”) on loans and advances and off balance sheet elements, involves significant judgement and estimates. The key areas where we identified greater levels of management judgement in the Group’s financial statements and therefore increased levels of audit focus in the estimation of ECLs are:
• Forward looking Information – IFRS 9 requires the Group to measure ECLs on a forward-looking basis reflecting a range of future economic conditions. Significant management judgement is applied in determining the macroeconomic information used and the probability weightings applied especially when considering the current uncertain economic environment as a result of COVID-19.
• Significant increase in credit risk (“SICR”) – the criteria selected to identify a significant increase in credit risk is a key area of judgement within the Group’s ECL calculation as these criteria determine whether a 12 month or lifetime provision is recorded
• Model estimations – inherently judgemental modelling is used to estimate ECL which involves determining probabilities of default (“PD”), loss given default (“LGD”), and exposures at default (“EAD”). The PD model is a key driver of complexity in the Group’s and Bank’s ECL modelling approach.
We determined that the impairment of loans and advances to customers to be a key audit matter due to the high degree of estimation uncertainty and significant judgement applied by management in determination of ECL.
- Performing process walk-throughs to identify the key systems, applications and controls used in the ECL processes. We tested the relevant general IT and applications controls over key systems used in the ECL process. This included testing the design and operating effectiveness of the key controls over the staging criteria and completeness and accuracy of the key inputs and assumptions into the IFRS 9 impairment models.
- Evaluating key aspects of the ECL model by
• Selecting a sample of outstanding loans from the Group’s loan book and comparing these to the details in the customers’ credit files in order to establish whether facilities are correctly staged/classified and valued based on IFRS as well as regulatory considerations;
• For a sample of key data inputs and assumptions applied in the determination of ECL, assessing for accuracy of economic forecasts and challenging PD assumptions applied by involving our specialists in the reperformance of the economic forecasts and PD calculations;
• Evaluating the appropriateness of the Group’s assessment of the SICR criteria used by assessing the qualitative and quantitative factors applied in the classification of the loans into stage 1, 2 and 3;
• Assessing the appropriateness of parameters used in the impairment models in regards to the probability PDs, LGDs, and EADs by considering the local economic conditions; and
• Evaluating management’s basis for establishing Stage 3 impairment amounts. This includes challenging reasonability of management assumptions on cashflow projections and time to realization for a sample of facilities.
- Involving our internal financial risk modelling specialists to:
• Assess the Group’s methodology for determining the macro-economic scenarios used in the forward looking information by challenging the probability weightings applied to the scenarios, particularly in the COVID – 19 environment.
• Assess the key economic variables used, including agreeing samples of economic variables to external sources, as well as the overall reasonableness of the economic forecasts by comparing the Group’s forecasts to our own modelled forecasts.
- Evaluating the adequacy of the financial statements disclosures, including disclosures of key assumptions and judgements in accordance with IFRS 7 Financial Instruments: Disclosures.
INDEPENDENT AUDITOR’S REPORTTO THE MEMBERS OF I&M GROUP PLC (FORMERLY I&M HOLDINGS PLC)
Impairment of goodwill in the consolidated financial statements
The key audit matter How the matter was addressed
The disclosure on goodwill is set out in the financial statements in the following notes:- Note 3 (j) (ii) – Significant accounting policies, Goodwill (page 151)- Note 26(a) – Intangible assets – Goodwill (page 218 - 221)
Impairment of goodwill is considered a key audit matter because:
• The sectors in which the Group operates are highly regulated and continues to experience competitive market conditions with uncertainty of forecast cash flows used in the models used to determine the value in use of the cash generating units.
• A significant level of judgment is applied on key inputs such as forecast cash flows, discount rates applied, forecast growth rates and terminal growth rates when considering management’s assessment of impairment
The preparation of the estimate of the carrying value and value in use (‘VIU’) involves subjective judgement and uncertainties and hence was considered as akey audit matter.
Our audit procedures in this area included:
• Evaluated the forecasting process undertaken by the Group by assessing the precision of prior year forecast cash flows by comparing with actual outcomes in the current year.
• Involving our internal valuation specialists in challenging the Group’s valuation methodology, discount rates and growth rates by comparing the Group’s input to external data such as economic growth projections and interest rates.
• Assessing the adequacy of the financial statements disclosures, including disclosures of key assumptions and judgements in accordance with IAS 36 Impairment of Assets.
Other information
The Directors are responsible for the other information. The other information comprises the Corporate information, Report of the directors, Statement on corporate governance, Statement of Directors’ responsibilities and directors’ remuneration report, but does not include the consolidated and separate financial statements, and our auditor’s report thereon, which we obtained prior to the date of this auditor’s report, and the additional other information to be included in the Annual Integrated Report and Financial Statements for the year ended 31 December 2021, which is expected to be made available to us after that date.
Our opinion on the consolidated and separate financial statements does not cover the other information and we do not express any form of assurance conclusion thereon, other than that prescribed by the Kenyan Company Act, 2015 as set out below.
In connection with our audit of the consolidated and separate financial statements, our responsibility is to read the other information identified above and, in doing so, consider whether the other information is materially inconsistent with the consolidated and separate financial statements or our knowledge obtained in the audit or otherwise appears to be materially misstated.
If, based on the work we have performed on the other information that we have obtained prior to the date of this auditor’s report, we conclude that there is a material misstatement of this other information, we are required to report that fact. We have nothing to report in this regard.
Directors’ responsibilities for the consolidated and separate financial statements
The Directors are responsible for the preparation of the consolidated and separate financial statements that give a true and fair view in accordance with IFRSs, and in the manner required by the Kenyan Companies Act, 2015 and for such internal control as the Directors determine is necessary to enable the preparation of the consolidated and separate financial statements that are free from material misstatement, whether due to fraud or error.
In preparing the consolidated and separate financial statements, the Directors are responsible for assessing the Group’s and the Company’s ability to continue as a going concern, disclosing, as applicable, matters related to going concern and using the going concern basis of accounting unless the Directors either intend to liquidate the Group and/or the Company or to cease operations, or have no realistic alternative but to do so.
Report on the audit of the consolidated and separate financial statements (Continued)Key audit matters (continued)
INDEPENDENT AUDITOR’S REPORTTO THE MEMBERS OF I&M GROUP PLC (FORMERLY I&M HOLDINGS PLC) (CONTINUED)
Our
Gov
erna
nce
Our
Bus
ines
sO
ur F
inan
cial
s

I&M GROUP PLC (FORMERLY I&M HOLDINGS PLC) ANNUAL INTEGRATED REPORT AND FINANCIAL STATEMENTS 2021 I&M GROUP PLC (FORMERLY I&M HOLDINGS PLC) ANNUAL INTEGRATED REPORT AND FINANCIAL STATEMENTS 2021 129128
Auditor’s responsibilities for the audit of the consolidated and separate financial statements
Our objectives are to obtain reasonable assurance about whether the consolidated and separate financial statements as a whole are free from material misstatement, whether due to fraud or error, and to issue an auditor’s report that includes our opinion. Reasonable assurance is a high level of assurance, but is not a guarantee that an audit conducted in accordance with ISAs will always detect a material misstatement when it exists. Misstatements can arise from fraud or error and are considered material if, individually or in the aggregate, they could reasonably be expected to influence the economic decisions of users taken on the basis of these consolidated and separate financial statements.
As part of an audit in accordance with ISAs, we exercise professional judgment and maintain professional skepticism throughout the audit. We also:
• Identify and assess the risks of material misstatement of the consolidated and separate financial statements, whether due to fraud or error, design and perform audit procedures responsive to those risks, and obtain audit evidence that is sufficient and appropriate to provide a basis for our opinion. The risk of not detecting a material misstatement resulting from fraud is higher than for one resulting from error, as fraud may involve collusion, forgery, intentional omissions, misrepresentations, or the override of internal control.
• Obtain an understanding of internal control relevant to the audit in order to design audit procedures that are appropriate in the circumstances, but not for the purpose of expressing an opinion on the effectiveness of the Group’s and the Company’s internal control.
• Evaluate the appropriateness of accounting policies used and the reasonableness of accounting estimates and related disclosures made by the Directors.
• Conclude on the appropriateness of the Directors’ use of the going concern basis of accounting and, based on the audit evidence obtained, whether a material uncertainty exists related to events or conditions that may cast significant doubt on the Group’s and the Company’s ability to continue as a going concern. If we conclude that a material uncertainty exists, we are required to draw attention in our auditor’s report to the related disclosures in the consolidated and separate financial statements or, if such disclosures are inadequate, to modify our opinion. Our conclusions are based on the audit evidence obtained up to the date of our auditor’s report. However, future events or conditions may cause the Group and/or the Company to cease to continue as a going concern.
• Evaluate the overall presentation, structure and content of the consolidated and separate financial statements, including the disclosures, and whether the consolidated and separate financial statements represent the underlying transactions and events in a manner that achieves fair presentation.
• Obtain sufficient appropriate audit evidence regarding the financial information of the entities or business activities within the Group to express an opinion on the consolidated financial statements. We are responsible for the direction, supervision and performance of the Group audit. We remain solely responsible for our audit opinion.
We communicate with Directors regarding, among other matters, the planned scope and timing of the audit and significant audit findings, including any significant deficiencies in internal control that we identify during our audit.
We also provide the Directors with a statement that we have complied with relevant ethical requirements regarding independence, and communicate with them all relationships and other matters that may reasonably be thought to bear on our independence, and where applicable actions taken to eliminate threats or safeguards applied.
From the matters communicated with the directors, we determine those matters that were of most significance in the audit of the consolidated and separate financial statements of the current period and are therefore the key audit matters. We describe these matters in our auditor’s report unless law or regulation precludes public disclosure about the matter or when, in extremely rare circumstances, we determine that a matter should not be communicated in our report because the adverse consequences of doing so would reasonably be expected to outweigh the public interest benefits of such communication.
INDEPENDENT AUDITOR’S REPORTTO THE MEMBERS OF I&M GROUP PLC (FORMERLY I&M HOLDINGS PLC) (CONTINUED)
Report on other legal and regulatory requirements
As required by the Kenyan Companies Act, 2015 we report to you, based on our audit, that in our opinion
(i) The information given in the Report of the Directors on pages 117 and 118 is consistent with the consolidated and separate financial statements; and
(ii) The auditable part of the directors’ remuneration report on pages 122 to 124 has been properly prepared in accordance with the Kenyan Companies Act, 2015.
The engagement partner responsible for the audit resulting in this independent auditor’s report is CPA Jacob Gathecha – Practicing certificate Number. P/1610.
For and on behalf of:
KPMG KenyaCertified Public Accountants8th Floor, ABC TowersWaiyaki WayPO Box 40602 – 00100Nairobi
Date: 29 March 2022
INDEPENDENT AUDITOR’S REPORTTO THE MEMBERS OF I&M GROUP PLC (FORMERLY I&M HOLDINGS PLC) (CONTINUED)
Our
Gov
erna
nce
Our
Bus
ines
sO
ur F
inan
cial
s

I&M GROUP PLC (FORMERLY I&M HOLDINGS PLC) ANNUAL INTEGRATED REPORT AND FINANCIAL STATEMENTS 2021 I&M GROUP PLC (FORMERLY I&M HOLDINGS PLC) ANNUAL INTEGRATED REPORT AND FINANCIAL STATEMENTS 2021 131130
Consolidated and company statements of profit or loss and other comprehensive income For the year ended 31 December 2021
Group Company
Note 2021KShs ‘000
2020KShs ‘000
2021KShs ‘000
2020KShs ‘000
Interest income 9 33,081,468) 27,848,575) 36,991) 29,175)
Interest expense 10 ( 12,204,574) (12,248,980) -) -)
Net interest income 20,876,894) 15,599,595) 36,991) 29,175)
Fee and commission income 11 4,876,226) 4,170,303) -) -)
Fee and commission expense 11 ( 466,026) ( 327,639) -) -)
Net fee and commission income 11 4,410,200) 3,842,664) -) -)
Revenue 25,287,094) 19,442,259) 36,991) 29,175)
Net trading income 12 3,367,095) 3,870,331) -) -)
Other operating income 13 492,299) 597,119) 6,781,344) 3,377,318)
Net operating income before change in expected credit losses and other credit impairment charges 29,146,488) 23,909,709) 6,818,335) 3,406,493)
Change in expected credit losses and other credit impairment charges 21(b) ( 4,199,601) ( 2,472,836) -) -)
Net operating income 24,946,887) 21,436,873) 6,818,335) 3,406,493)
Staff costs 14 ( 6,001,913) ( 4,555,444) -) -)
Premises and equipment costs 14 ( 568,098) (428,732) -) -)
Other expenses 14 ( 4,489,890) ( 3,295,865) ( 114,249) ( 31,102)
Depreciation and amortisation expenses 14 ( 2,022,970) ( 1,525,866) -) -)
Operating expenses (13,082,871) ( 9,805,907) ( 114,249) ( 31,102)
Operating profit 11,864,016) 11,630,966) 6,704,086) 3,375,391)
Share of profit/(loss) of joint venture 24(a) 548,890) ( 678,962) -) -)
Profit before income tax 15 12,412,906) 10,952,004) 6,704,086) 3,375,391)
Income tax expense 16(a) ( 3,788,970) ( 2,539,446) ( 8,118) ( 4,805)
Profit for the year 8,623,936) 8,412,558) 6,695,968) 3,370,586)
(Continued Page 131)
The notes set out on pages 137 to 237 form an integral part of these consolidated and separate financial statements.
OUR FINANCIALS (Continued) OUR FINANCIALS (Continued)
Group Company
Note 2021KShs '000
2020KShs '000
2021KShs '000
2020KShs '000
Other Comprehensive IncomeItems that will not be reclassified to profit or loss:
Actuarial gains/(losses) on re-measurement of defined benefit scheme net of deferred tax
34(g) 35,022) ( 37,519) - -
Revaluation surplus on property and equipment net of deferred tax charge
111,898) 75,118) - -
Movement in fair value reserve for FVOCI - Equity Instruments 22 ( 9,334) ( 80,436) - -
Items that may be classified to profit or loss:
Movement in fair value reserve for FVOCI debt instruments ( 742,847) 321,564) ( 1,275) 801)
Foreign operations-foreign currency translation differences ( 515,333) 317,658) - -
Total other comprehensive income for the year (1,120,594) 596,385) ( 1,275) 801
Total comprehensive income for the year 7,503,342) 9,008,943) 6,694,693) 3,371,387
Profit attributable to:
Equity holders of the Company 8,130,742) 8,073,855) 6,695,968) 3,370,586
Non-controlling interest 493,194) 338,703) - -
8,623,936) 8,412,558) 6,695,968) 3,370,586
Total comprehensive income attributable to:
Equity holders of the Company 7,011,452) 8,498,802) 6,694,693) 3,371,387
Non-controlling interest 491,890) 510,141) -) -
7,503,342) 9,008,943) 6,694,693) 3,371,387
Basic and diluted earnings per share - (KShs) (2020 restated) 17 4.92) 4.88) 4.05) 2.04
The notes set out on pages 137 to 237 form an integral part of these consolidated and separate financial statements.
Consolidated and company statements of profit or loss and other comprehensive income (Continued) For the year ended 31 December 2021 (Continued)
Our
Gov
erna
nce
Our
Bus
ines
sO
ur F
inan
cial
s

I&M GROUP PLC (FORMERLY I&M HOLDINGS PLC) ANNUAL INTEGRATED REPORT AND FINANCIAL STATEMENTS 2021 I&M GROUP PLC (FORMERLY I&M HOLDINGS PLC) ANNUAL INTEGRATED REPORT AND FINANCIAL STATEMENTS 2021 133132
Consolidated and company statements of financial position As at 31 December 2021
Group Company
Note 2021 2020 2021 2020 KShs '000 KShs '000 KShs '000 KShs'000
ASSETS
Cash and balances with central banks 18 27,546,591 19,403,419 -- -
Items in the course of collection 19 668,114 622,994 -- -
Loans and advances to banks 20 15,517,824 18,335,440 -- -
Loans and advances to customers 21(a) 210,619,661 187,391,266 -- -
Financial assets at fair value through profit or loss (FVTPL) 22(a) 16,368,165 11,869,403 -- -
Financial assets measured at fair value through other comprehensive income (FVOCI) 22(b) 64,010,272 42,477,252 27,019 28,392
Other financial assets at amortised cost 22(c) 45,156,710 47,364,625 -- -
Held for sale assets 23 1,014,651 1,057,056 -- -
Investment in Joint Venture 24(a) 5,226,107 5,177,219 2,515,591 2,515,591
Investment in subsidiaries 24(b) -- -- 30,435,895 26,151,882
Property and equipment 25 12,883,629 12,121,588 -- -
Intangible assets - Goodwill 26(a) 3,894,190 3,155,449 -- -
Intangible assets - Software 26(b) 2,684,869 2,436,493 -- -
Tax recoverable 16(b) 459,760 133,588 3,463 4,369
Deferred tax asset 27 6,104,185 4,211,504 -- -
Due from group companies 38(b)(iii) -- -- 834,431 446,059
Other assets 28 3,025,949 2,342,497 229,786 4,124
TOTAL ASSETS 415,180,677 358,099,793 34,046,185 29,150,417
LIABILITIES AND SHAREHOLDERS' EQUITY
Liabilities
Deposit from banks 29 19,114,307 6,762,835 -- -
Items in course of collection 19 95,530 261,363 -- -
Deposits from customers 30 296,746,509 262,681,402 -- -
Tax payable 16(b) 29,310 155,863 -- -
Due to group companies 38(b)(iv) -- --- 1,931,640 1,881,272
Other liabilities 31 5,600,871 5,402,428 97,423 84,324
Long term debt 32 9,516,698 10,317,827 -- -
Subordinated debt 33 10,029,375 4,454,936 -- -
341,132,600 290,036,654 2,029,063 1,965,596
Shareholders' equity (pages 133 - 135)
Share capital 34(a) 1,653,621 826,811 1,653,621 826,811
Share premium 34(a)/(b) 17,561,629 18,390,507 17,561,629 18,390,507
Retained earnings 43,903,009 39,610,553 12,802,385 7,966,741
Revaluation reserve 34(c) 1,036,048 929,217 -- -
Fair value reserve 34(d) ( 752,545) ( 36,599) ( 513) 762
Translation reserve 34(e) ( 1,756,759) ( 1,260,493) -- -
Statutory credit risk reserve 34(f) 8,051,567 5,867,908- -- -
Defined benefit reserve 34(g) ( 103,539) ( 138,561) -- -
Equity attributable to Owners of the Company 69,593,031 64,189,343 32,017,122 27,184,821
Non-controlling interest 4,455,046 3,873,796 -- -
TOTAL SHAREHOLDERS' EQUITY 74,048,077 68,063,139 32,017,122 27,184,821
TOTAL LIABILITIES AND SHAREHOLDERS' EQUITY 415,180,677 358,099,793 34,046,185 29,150,417
The consolidated and separate financial statements set out on pages 130 to 237 were approved and authorised for issue by the Board of Directors on
29 March 2022 and were signed on its behalf by:
__________________ _________________ _______________ _______________Daniel Ndonye Sachit S Raja Shah Dr. A N Koigi Director Bilha Wanjiru Mwangi
Director Director Director Secretary
The notes set out on pages 137 to 237 form an integral part of these consolidated and separate financial statements.
OUR FINANCIALS (Continued)
Shar
e ca
pita
lK
Shs’
000
Shar
e pr
emiu
mK
Shs’
000
Reta
ined
ea
rnin
gsK
Shs’
000
Defi
ned
bene
fit
rese
rve
KSh
s’00
0
Stat
utor
y cr
edit
risk
re
serv
eK
Shs’
000
Reva
luat
ion
rese
rve
KSh
s’00
0
Fair
val
ue
rese
rve
KSh
s’00
0
Tran
slat
ion
rese
rve
KSh
s’00
0To
tal
KSh
s’00
0
Non
-co
ntro
lling
in
tere
stK
Shs’
000
Tota
lK
Shs’
000
As
prev
ious
ly s
tate
d at
1 Ja
nuar
y 20
2182
6,81
118
,390
,507
)39
,610
,553
)(1
38,5
61)
5,86
7,90
892
9,21
7)(
36,
599)
(1,2
60,4
93)
64,1
89,3
43)
3,87
3,79
6)68
,063
,139
)
Cor
rect
ion
of p
rior
yea
r rev
ersa
l
Fair
valu
e re
valu
atio
n pr
ior y
ear r
ever
sal
--)
(69,
901)
-)-)
-)69
,901
)-)
-)-)
-)
Def
erre
d ta
x - f
air v
alue
reva
l prio
r yea
r re
vers
al-
-)20
,970
)-)
-)-)
(
20,9
70)
-)-)
-)-)
At
1 Ja
nuar
y 20
21 re
stat
ed82
6,81
118
,390
,507
)39
,561
,622
)(1
38,5
61)
5,86
7,90
892
9,21
7)12
,332
)(1
,260
,493
)64
,189
,34
3)3,
873,
796)
68,0
63,1
39)
Com
preh
ensi
ve in
com
e fo
r the
yea
r
Net
pro
fit a
fter
tax
--)
8,13
0,74
2)-)
--)
-)-)
8,13
0,74
2)49
3,19
4)8,
623,
936)
--)
8,13
0,74
2)-)
--)
-)-)
8,13
0,74
2)4
93,1
94)
8,62
3,93
6)
Oth
er c
ompr
ehen
sive
inco
me
Tran
slat
ion
rese
rve
--)
-)-)
--)
-)(
49
6,26
6)(
49
6,26
6)(
1
9,06
7)(
5
15,3
33)
Fair
valu
e re
serv
e (N
ote
22)
--)
-)-)
--)
(1,0
10,9
31)
-)(
1,0
10,9
31)
18,17
7)(
99
2,75
4)
Def
erre
d ta
x ch
arge
- fa
ir va
lue
rese
rve
--)
-)-)
--)
246,
054)
-)24
6,05
4)(
5,4
81)
240,
573)
Reva
luat
ion
rese
rve
--)
-)-)
-15
2,63
5
-)-)
152,
635)
7,254
)15
9,88
9)
Def
erre
d ta
x ch
arge
-rev
alua
tion
rese
rve
--)
-)-)
-(
45
,804
)-)
-)(
4
5,80
4)(
2,18
7)(
47,9
91)
Defi
ned
bene
fit p
lan
--)
-)35
,022
)-
-)-)
-)35
,022
)-)
35,0
22)
Stat
utor
y cr
edit
risk
--)
( 2
,118,
258)
-)2,
118,
258
-)-)
-)-
-)-)
Tota
l oth
er c
ompr
ehen
sive
inco
me
--)
( 2,
118,
258)
35,0
22)
2,11
8,25
810
6,83
1)(
764
,877
)(
496
,266
)(
1,1
19,2
90)
(
1,
304
)(
1,12
0,59
4)
Tota
l com
preh
ensi
ve in
com
e-
-)6,
012,
484
)35
,022
)2,
118,
258
106,
831)
( 76
4,8
77)
( 4
96,2
66)
7,01
1,4
52)
491
,890
)7,
503,
342)
Tran
sact
ions
wit
h ow
ners
Acqu
isiti
on o
f I&
M B
ank
(Uga
nda)
Lim
ited
(For
mer
ly O
rient
Ban
k Li
mite
d)-
-)-)
-)-
-)-)
-)-
398,
842)
398,
842)
Issu
e of
sha
res
- I&
M B
ank
(T) L
imite
d-
-)18
9,22
7)-)
65,4
01-)
-)-)
254,
628)
( 2
19,5
89)
35,0
39)
Issu
e of
bon
us s
hare
s82
6,81
0(
82
6,81
0)-)
-)-
-)-)
-)-)
-)-)
Acqu
istio
n an
d bo
nus
issu
e re
late
d co
st-
(
2
,068
)-)
-)-
-)-)
-)(
2,0
68)
-)(
2,0
68)
Div
iden
ds p
aid
- 202
1-
-)(
1,86
0,32
4)-)
--)
-)-)
( 1,
860,
324)
(
89,
893)
( 1
,950
,217
)
Tota
l tra
nsac
tion
s w
ith
owne
rsfo
r the
yea
r82
6,81
0(
828
,878
)(
1,67
1,09
7)-)
65,4
01-)
-)-)
( 1,
607,
764
)89
,360
)(
1,51
8,4
04)
At
31 D
ecem
ber 2
021
1,65
3,62
117
,561
,629
)4
3,90
3,00
9)(1
03,5
39)
8,05
1,56
71,
036,
048)
( 75
2,54
5)( 1
,756
,759
)69
,593
,031
)4
,455
,04
6)74
,04
8,07
7)
The
note
s se
t out
on
page
137
to 2
37 fo
rm a
n in
tegr
al p
art o
f the
se c
onso
lidat
ed a
nd s
epar
ate
finan
cial
sta
tem
ents
.
Con
solid
ated
sta
tem
ent o
f cha
nges
in e
quit
y Fo
r the
yea
r end
ed 3
1 D
ecem
ber 2
021
OU
R FI
NA
NC
IALS
(Con
tinu
ed)
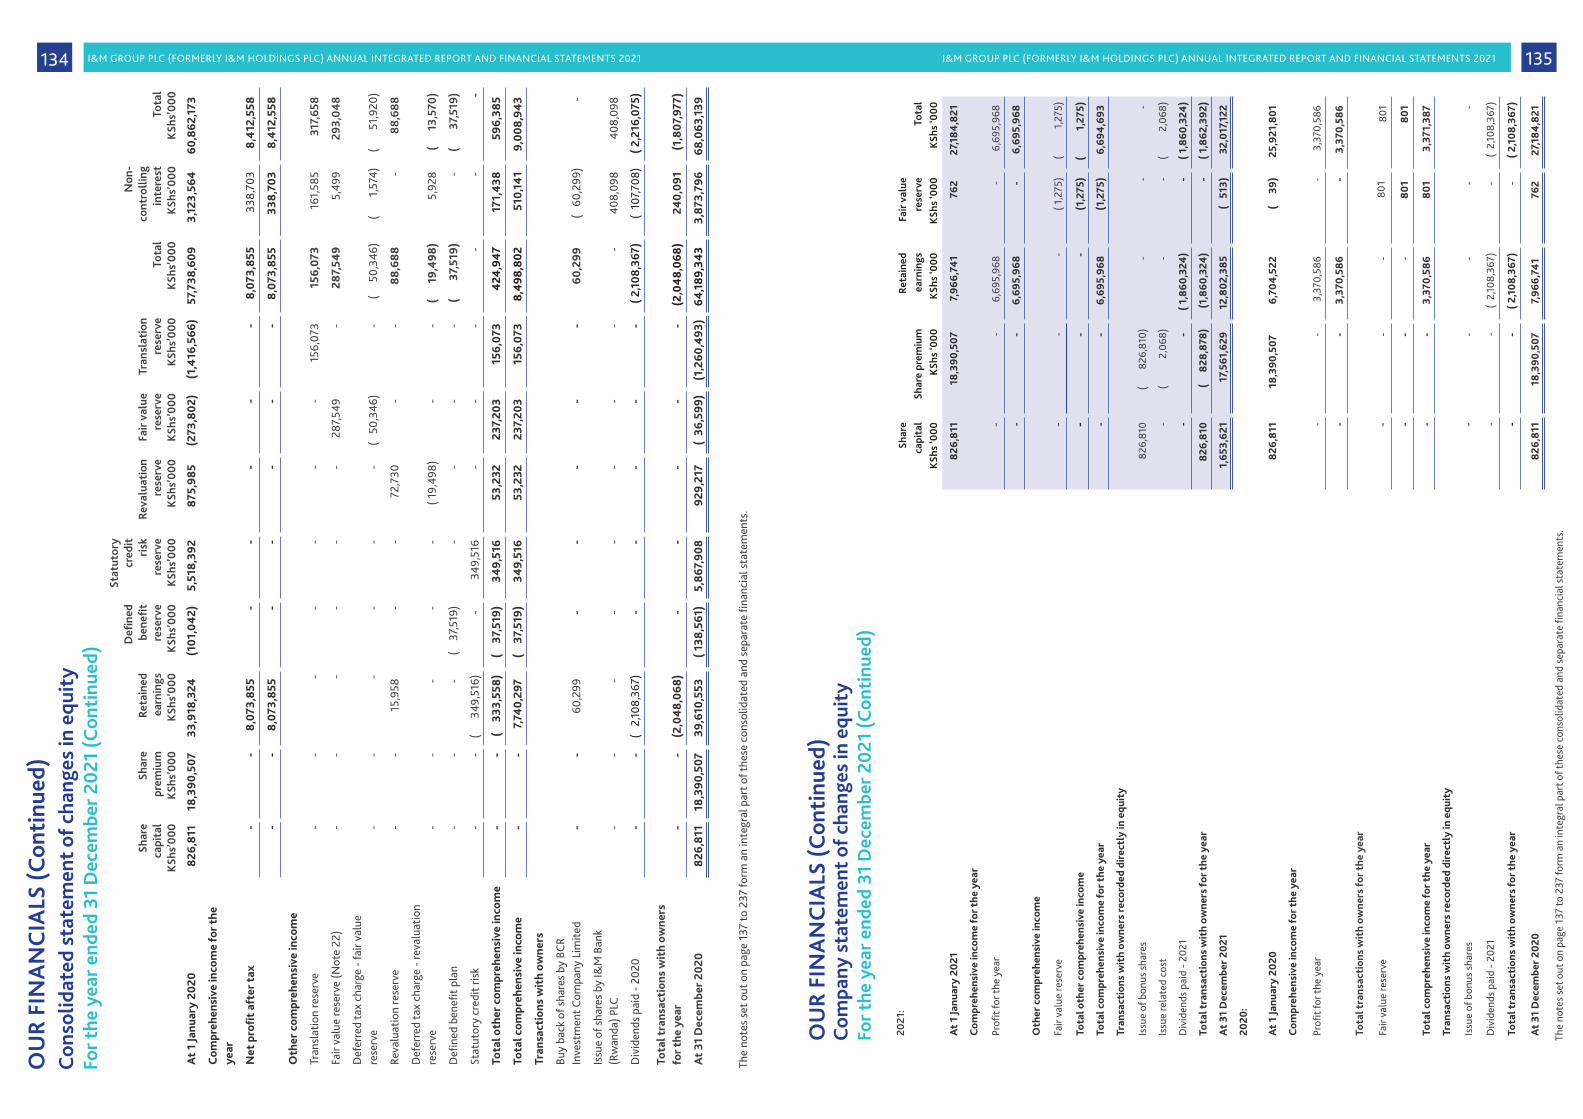
I&M GROUP PLC (FORMERLY I&M HOLDINGS PLC) ANNUAL INTEGRATED REPORT AND FINANCIAL STATEMENTS 2021 I&M GROUP PLC (FORMERLY I&M HOLDINGS PLC) ANNUAL INTEGRATED REPORT AND FINANCIAL STATEMENTS 2021 135134C
onso
lidat
ed s
tate
men
t of c
hang
es in
equ
ity
For t
he y
ear e
nded
31
Dec
embe
r 202
1 (C
onti
nued
)
Shar
e ca
pita
lK
Shs’
000
Shar
e pr
emiu
mK
Shs’
000
Reta
ined
ea
rnin
gsK
Shs’
000
Defi
ned
bene
fit
rese
rve
KSh
s’00
0
Stat
utor
y cr
edit
ri
skre
serv
eK
Shs’
000
Reva
luat
ion
rese
rve
KSh
s’00
0
Fair
val
ue
rese
rve
KSh
s’00
0
Tran
slat
ion
rese
rve
KSh
s’00
0To
tal
KSh
s’00
0
Non
-co
ntro
lling
in
tere
stK
Shs’
000
Tota
lK
Shs’
000
At
1 Ja
nuar
y 20
2082
6,81
118
,390
,507
33,9
18,3
24)
(101
,04
2)5,
518,
392
875,
985)
(273
,802
)(1
,416
,566
)57
,738
,609
)3,
123,
564
)60
,862
,173
)
Com
preh
ensi
ve in
com
e fo
r the
ye
ar
Net
pro
fit
afte
r tax
--
8,07
3,85
5)-
--)
-)-)
8,07
3,85
5)33
8,70
3)8,
412
,558
)
--
8,07
3,85
5)-
--)
-)-)
8,07
3,85
5)33
8,70
3)8,
412
,558
)
Oth
er c
ompr
ehen
sive
inco
me
Tran
slat
ion
rese
rve
--
--
--)
-)15
6,07
3)15
6,07
3)16
1,58
5)31
7,65
8)
Fair
valu
e re
serv
e (N
ote
22)
--
--
--)
287,5
49)
-)28
7,54
9)5,
499)
293,
048)
Def
erre
d ta
x ch
arge
- fa
ir va
lue
rese
rve
--
--
--)
( 5
0,34
6)-)
(
50,3
46)
(
1,5
74)
(
51,
920)
Reva
luat
ion
rese
rve
--
15,9
58)
--
72,7
30)
-)-)
88,6
88)
-)88
,688
)
Def
erre
d ta
x ch
arge
- re
valu
atio
n re
serv
e-
--)
--
( 19,
498)
-)-)
(
19,
498
)5,
928)
(
13,
570)
Defi
ned
bene
fit p
lan
--
-)(
37,5
19)
--)
-)-)
(
37,
519)
-)(
3
7,51
9)
Stat
utor
y cr
edit
risk
--
(
349
,516
)-)
349,
516
-)-)
-)-)
-)-
Tota
l oth
er c
ompr
ehen
sive
inco
me
--
( 3
33,5
58)
( 3
7,51
9)34
9,51
653
,232
)23
7,20
3)15
6,07
3)4
24,9
47)
171,
438
)59
6,38
5)
Tota
l com
preh
ensi
ve in
com
e-
-7,
740,
297)
( 3
7,51
9)34
9,51
653
,232
)23
7,20
3)15
6,07
3)8,
498
,802
)51
0,14
1)9,
008,
943)
Tran
sact
ions
wit
h ow
ners
Buy
back
of s
hare
s by
BC
R In
vest
men
t Com
pany
Lim
ited
--
60,2
99)
-)-
-)-)
-)60
,299
)(
60,
299)
-)
Issu
e of
sha
res
by I&
M B
ank
(Rw
anda
) PLC
--
-)-)
--)
-)-)
-)40
8,09
8)40
8,09
8)
Div
iden
ds p
aid
- 202
0-
-(
2,10
8,36
7)-)
--)
-)-)
( 2,1
08,3
67)
( 10
7,708
)( 2
,216
,075
)
Tota
l tra
nsac
tion
s w
ith
owne
rs
for t
he y
ear
--
(2,0
48,
068)
-)-
-)-)
-)(2
,04
8,06
8)24
0,09
1)(1
,807
,977
)
At
31 D
ecem
ber 2
020
826,
811
18,3
90,5
0739
,610
,553
)( 1
38,5
61)
5,86
7,90
892
9,21
7)(
36,5
99)
(1,2
60,4
93)
64,1
89,3
43)
3,87
3,79
6)68
,063
,139
)
The
not
es s
et o
ut o
n pa
ge 1
37 to
237
form
an
inte
gral
par
t of t
hese
con
solid
ated
and
sep
arat
e fin
anci
al s
tate
men
ts.
OU
R FI
NA
NC
IALS
(Con
tinu
ed)
2021
:Sh
are
capi
tal
KSh
s ‘0
00Sh
are
prem
ium
KSh
s ‘0
00
Reta
ined
ea
rnin
gsK
Shs
‘000
Fair
val
ue
rese
rve
KSh
s ‘0
00To
tal
KSh
s ‘0
00
At
1 Ja
nuar
y 20
2182
6,81
118
,390
,507
)7,
966,
741)
762)
27,1
84,8
21)
Com
preh
ensi
ve in
com
e fo
r the
yea
r
Profi
t for
the
year
--)
6,69
5,96
8)-)
6,69
5,96
8)
--)
6,69
5,96
8)-)
6,69
5,96
8)
Oth
er c
ompr
ehen
sive
inco
me
Fair
valu
e re
serv
e-
-)-
( 1,2
75)
(
1,27
5)
Tota
l oth
er c
ompr
ehen
sive
inco
me
--)
-(1
,275
)(
1,
275)
Tota
l com
preh
ensi
ve in
com
e fo
r the
yea
r-
-)6,
695,
968)
(1,2
75)
6,69
4,6
93)
Tran
sact
ions
wit
h ow
ners
reco
rded
dir
ectl
y in
equ
ity
Issu
e of
bon
us s
hare
s82
6,81
0(
8
26,8
10)
-)-
-)
Issu
e re
late
d co
st-
(
2,06
8)-)
-(
2,0
68)
Div
iden
ds p
aid
- 202
1-
-)( 1
,860
,324
)-
( 1,8
60,3
24)
Tota
l tra
nsac
tion
s w
ith
owne
rs fo
r the
yea
r82
6,81
0(
82
8,87
8)(1
,860
,324
)-
( 1,8
62,3
92)
At
31 D
ecem
ber 2
021
1,65
3,62
117
,561
,629
)12
,802
,385
)(
513
)32
,017
,122
)
2020
:
At
1 Ja
nuar
y 20
2082
6,81
118
,390
,507
)6,
704
,522
)(
39
)25
,921
,801
)
Com
preh
ensi
ve in
com
e fo
r the
yea
r
Profi
t for
the
year
--)
3,37
0,58
6)-
3,37
0,58
6)
--)
3,37
0,58
6)-
3,37
0,58
6)
Tota
l tra
nsac
tion
s w
ith
owne
rs fo
r the
yea
r
Fair
valu
e re
serv
e-
-)-)
801)
801)
--)
-)80
1)80
1)
Tota
l com
preh
ensi
ve in
com
e fo
r the
yea
r-
-)3,
370,
586)
801)
3,37
1,38
7)
Tran
sact
ions
wit
h ow
ners
reco
rded
dir
ectl
y in
equ
ity
Issu
e of
bon
us s
hare
s-
-)-)
-)-)
Div
iden
ds p
aid
- 202
1-
-)(
2,10
8,36
7)-)
( 2,
108,
367)
Tota
l tra
nsac
tion
s w
ith
owne
rs fo
r the
yea
r-
-)( 2
,108
,367
)-)
( 2,1
08,3
67)
At
31 D
ecem
ber 2
020
826,
811
18,3
90,5
07)
7,96
6,74
1 )
762)
27,1
84,8
21)
The
note
s se
t out
on
page
137
to 2
37 fo
rm a
n in
tegr
al p
art o
f the
se c
onso
lidat
ed a
nd s
epar
ate
finan
cial
sta
tem
ents
.
Com
pany
sta
tem
ent o
f cha
nges
in e
quit
y Fo
r the
yea
r end
ed 3
1 D
ecem
ber 2
021
(Con
tinu
ed)
OU
R FI
NA
NC
IALS
(Con
tinu
ed)

I&M GROUP PLC (FORMERLY I&M HOLDINGS PLC) ANNUAL INTEGRATED REPORT AND FINANCIAL STATEMENTS 2021 I&M GROUP PLC (FORMERLY I&M HOLDINGS PLC) ANNUAL INTEGRATED REPORT AND FINANCIAL STATEMENTS 2021 137136
Consolidated and company statements of cash flowsFor the year ended 31 December 2021
Group Company
Note2021
KShs’0002020
KShs’0002021
KShs’0002020
KShs’000
Net cash flows (utilised in)/ generated from operating activities 35(a) (14,406,479) (13,718,921) 6,534,777) 3,369,737)
Cash flows used in investing activities
Purchase of property and equipment (excluding right of use assets) 25 ( 1,327,815) ( 2,300,649) -) -)
Purchase of intangible assets 26(b) ( 873,623) ( 896,157) -) -)
Investment in subsidiaries -) -) ( 4,284,013) -)
Additional Investment in I&M Bank (Rwanda) PLC 24(c) -) -) -) ( 489,588)
Acquisition of I&M Bank (Uganda) Limited (formerly Orient Bank Limited) net of cash and cash equivalent 35(c) 2,300,643) -) -) -)
Additional Investment in Joint venture 24(a) -) ( 405,000) -) ( 405,000)
Proceeds from disposal of property and equipment 39,779) 39,139) -) -)
Net cash used in investing activities 138,984) ( 3,562,667) (4,284,013) ( 894,588)
Cash flows used in financing activities
Net outflows from term subordinated debt 5,763,666) ( 190,119) -) -)
Dividend paid to shareholders of the company ( 1,860,324) ( 2,108,367) ( 1,860,324) ( 2,108,367)
Dividend paid to non-controlling interests ( 89,893) ( 107,708) -) -)
Rights issue - I&M Bank (Rwanda) PLC -) 408,098) -) -)
Rights issue -I&M Bank (T) Limited 65,401) -) -) -)
Payment of lease liabilities 31 ( 419,977) ( 397,328) -) -)
Capital restructuring costs (2,068) -) ( 2,068) -)
Net cash used in financing activities 3,456,805) (2,395,424) (1,862,392) (2,108,367)
Net increase/ (decrease) in cash and cash equivalents (10,810,690) (19,677,012) 388,372) 366,782)
Cash and cash equivalents at start of the year 21,472,404) 41,149,416) 446,059) 79,277)
Cash and cash equivalents at end of the year 35(b) 10,661,714) 21,472,404) 834,431) 446,059)
The notes set out on pages 137 to 237 form an integral part of these consolidated and separate financial statements.
OUR FINANCIALS (Continued) OUR FINANCIALS (Continued)
1. Reporting entityI&M Group PLC (formerly I&M Holdings PLC) (the “Company”), is a non-operating holding company licensed by the Central Bank of Kenya (CBK) under the Kenyan Banking Act (Chapter 488). The Company is incorporated in Kenya under the Kenyan Companies Act,2015 and comprises banking subsidiaries in Kenya, Tanzania, Rwanda, Uganda and a joint venture in Mauritius and non banking Subsidiaries in Kenya, Mauritius and Uganda. The consolidated financial statements as at and for the year ended 31 December 2021 comprise of entities in Kenya – I&M Bank LIMITED, I&M Capital Limited, I&M Realty Limited, I&M Burbidge Capital Limited, Giro Limited, I&M Bancassurance Intermediary Limited, and Youjays Insurance Brokers Limited; Tanzania - I&M Bank (T) Limited; Rwanda - I&M Bank (Rwanda) Plc, Mauritius - BCR Investment Company Limited and a joint venture - Bank One Limited; and Uganda – I&M Bank (Uganda) Limited (formely Orient Bank Limited) and I&M Burbidge Capital (U) Limited (together referred to as the "Group). The address of its registered office is as follows:
1 Park Avenue1st Parklands AvenuePO Box 3023800100 Nairobi GPO
The Company owns the following entities directly:
(i) Bank One Limited - 50% interest in Bank One Limited, a joint venture in a bank licensed in Mauritius;
(ii) I&M Bank Limited – 100% Shareholding;(iii) I&M Capital Limited – 100% Shareholding;(iv) I&M Realty Limited – 100% Shareholding;(v) BCR Investment Company Limited – 100% Shareholding;(vi) I&M Burbidge Capital Limited – 65% Shareholding;(vii) Giro Limited – 100% Shareholding, and;(viii) I&M Bank (Uganda) Limited (formerly Orient Bank Limited) – 90% Shareholding
Through I&M Bank LIMITED, the Company has:
(i) 77.8% (2020 – 70.38%) shareholding in I&M Bank (T) Limited; (ii) 100% shareholding in I&M Bancassurance Intermediary Limited (incorporated on 23 July 2014),(iii) 100% shareholding in Youjays Insurance Brokers Limited (effective 31 March 2018) through I&M Bancassurance Intermediary Limited.
Through BCR Investment Company Limited, the Company has 54.47% effective shareholding in I&M Bank (Rwanda) Plc as BCR Investment Company Limited (Mauritius) owns 54.47% shareholding in I&M Bank (Rwanda) Plc.
Through I&M Burbidge Capital Limited, the Company has 65% effective shareholding in I&M Burbidge Capital (U) Limited as the Company is 100% owned by I&M Burbidge Capital Limited.
2. Basis of preparation(a) Statement of compliance
The Group’s consolidated and separate financial statements for the year 2020 have been prepared in accordance with International Financial Reporting Standards (IFRSs) and in a manner required by the Kenyan Companies Act, 2015. Additional information required by the regulatory bodies is included where appropriate.
Details of the significant accounting policies are included in Note 3.
For the Kenyan Companies Act, 2015 reporting purposes, in these financial statements the “balance sheet” is represented by/is equivalent to the statement of financial position and the “profit and loss account” is presented in the statement of profit or loss and other comprehensive income.
(b) Basis of measurement
These consolidated and separate financial statements have been prepared under the historical cost basis of accounting except for the financial assets classified as Fair Value through Profit or Loss (FVTPL) and Fair Value through Other Comprehensive Income (FVOCI) and buildings which are measured at fair value.
Notes to the consolidated and separate financial statementsFor the year ended 31 December 2021
Our
Gov
erna
nce
Our
Bus
ines
sO
ur F
inan
cial
s

I&M GROUP PLC (FORMERLY I&M HOLDINGS PLC) ANNUAL INTEGRATED REPORT AND FINANCIAL STATEMENTS 2021 I&M GROUP PLC (FORMERLY I&M HOLDINGS PLC) ANNUAL INTEGRATED REPORT AND FINANCIAL STATEMENTS 2021 139138
2. Basis of preparation (Continued)(c) Functional and presentation currency
These consolidated and separate financial statements are presented in Kenya Shillings (KShs), which is also the Group’s functional currency. All financial information presented in KShs has been rounded to the nearest thousand (KShs’000) except where otherwise stated.
(d) Use of estimates and judgments
In preparing these consolidated financial statements, management has made judgements, estimates and assumptions that affect the application of the Group’s accounting policies and the reported amounts of assets, liabilities, income and expenses. Actual results may differ from these estimates.
Estimates and underlying assumptions are reviewed on an on-going basis. Revisions to estimates are recognised prospectively.
In particular information about significant areas of estimation uncertainty and critical judgements in applying accounting policies that have the most significant effect on the amount recognised in the financial statements are described in Note 6.
The classification of financial assets includes the assessment of the business model within which the assets are held and assessment of whether the contractual terms of the financial asset are solely payments of principal and interest on the principal amount outstanding. See Note 3(f)(ii).
The impairment of financial instruments includes the assessment of whether credit risk on the financial asset has increased significantly since initial recognition and incorporation of forward-looking information in the measurement of expected credit losses (ECL). See Notes 3(f)(iii) and 5(a).
3. Significant accounting policiesThe principal accounting policies adopted in the preparation of these consolidated financial statements are set out below:
(a) Basis of consolidation
(i) Business combination
The Group accounts for business combinations using the acquisition method when the acquired set of activities and assets meets the definition of a business and control is transferred to the Group. In determining whether a particular set of activities and assets is a business, the Group assesses whether the set of assets and activities acquired includes, at a minimum, an input and substantive process and whether the acquired set has the ability to produce outputs.
The Group has an option to apply a ‘concentration test’ that permits a simplified assessment of whether an acquired set of activities and assets is not a business. The optional concentration test is met if substantially all of the fair value of the gross assets acquired is concentrated in a single identifiable asset or group of similar identifiable assets.
The consideration transferred in the acquisition is generally measured at fair value, as are the identifiable net assets acquired. Any goodwill that arises is tested annually for impairment. Any gain on a bargain purchase is recognised in profit or loss immediately. Transaction costs are expensed as incurred, except if related to the issue of debt or equity securities.
The consideration transferred does not include amounts related to the settlement of pre-existing relationships. Such amounts are generally recognised in profit or loss.
Any contingent consideration is measured at fair value at the date of acquisition. If an obligation to pay contingent consideration that meets the definition of a financial instrument is classified as equity, then it is not remeasured and settlement is accounted for within equity. Otherwise, other contingent consideration is remeasured at fair value at each reporting date and subsequent changes in the fair value of the contingent consideration are recognised in profit or loss.
If share-based payment awards (replacement awards) are required to be exchanged for awards held by the acquiree’s employees (acquiree’s awards), then all or a portion of the amount of the acquirer’s replacement awards is included in measuring the consideration transferred in the business combination. This determination is based on the market-based measure of the replacement awards compared with the market-based measure of the acquiree’s awards and the extent to which the replacement awards relate to pre-combination service.
Notes to the consolidated and separate financial statementsFor the year ended 31 December 2021 (Continued)
OUR FINANCIALS (Continued)
Notes to the consolidated and separate financial statementsFor the year ended 31 December 2021 (Continued)
OUR FINANCIALS (Continued)
3. Significant accounting policies (Continued)(a) Basis of consolidation (Continued)
(ii) Non-controlling interests
Non-controlling interests are measured at their proportionate share of the acquiree’s identifiable net assets at the acquisition date.
Changes in the Group’s interest in a subsidiary that do not result in a loss of control are accounted for as equity transactions.
(iii) Subsidiaries
Subsidiaries are investees controlled by the Group. The Group controls an investee when it is exposed to, or has rights to, variable returns from its involvement in the investee and has the ability to affect those returns through its power over the investee. The financial statements of subsidiaries are included in the consolidated financial statements from the date that control commences until the date that control ceases. The financial statements have been prepared using uniform accounting policies for like transactions and other events in similar circumstances. All intercompany transactions are eliminated during consolidation.
(iv) Interest in equity-accounted investees
Investments in joint ventures are accounted for using the equity method of accounting in the Consolidated/Group financial statements. These are undertakings in which the Group has between 20% and 50% of the voting rights and over which the Group exercises significant influence but which it does not control. Under the equity method, the Group’s share of its joint ventures’ post-acquisition profits or losses is recognised in profit or loss and its share of other comprehensive income is recognised in other comprehensive income. The cumulative post-acquisition total comprehensive income or loss (including dividends received from the associate) is adjusted against the carrying amount of the investment.
Losses of a joint venture in excess of the Group’s interest in that joint venture are recognised only to the extent that the Group has incurred legal or constructive obligations to make payments on behalf of the associate.
Unrealized gains arising from transaction with equity accounted investees are eliminated against the investment to the extent of the Group’s interest in the investee. Unrealized losses are eliminated in the same way as unrealized gains, but only to the extent that there is no evidence of impairment.
Investments in joint ventures are accounted at cost less impairment loss in the separate financial statements of the Company. They are initially recognised at cost which includes transaction costs.
(v) Loss of control
When the Group loses control over a subsidiary, it derecognises the assets and liabilities of the subsidiary, and any related non-controlling interest (NCI) and other components of equity. Any resulting gain or loss is recognised in profit or loss. Any interest retained in the former subsidiary is measured at fair value when control is lost.
(vi) Transactions eliminated on consolidation
Intra-group balances and transactions, and any unrealised income and expenses (except for foreign currency transaction gains or losses) arising from intra-group transactions, are eliminated. Unrealised gains arising from transactions with equity-accounted investees are eliminated against the investment to the extent of the Group’s interest in the investee. Unrealised losses are eliminated in the same way as unrealised gains, but only to the extent that there is no evidence of impairment.
(b) Foreign currencies
Foreign currency transactions are translated into the functional currency of Group entities using the exchange rates prevailing at the dates of the transactions. Foreign exchange gains and losses resulting from the settlement of such transactions and from the translation at year-end exchange rates of monetary assets and liabilities denominated in foreign currencies are recognised in the profit or loss in the year in which they arise.
Foreign currency non-monetary items measured at fair value are translated into functional currency using the rate of exchange at the date the fair value was determined. Foreign currency gains and losses on non-monetary items are recognized in the Consolidated Statement of profit or loss and other comprehensive income or Income consistent with the gain or loss on the non-monetary item.
Our
Gov
erna
nce
Our
Bus
ines
sO
ur F
inan
cial
s

I&M GROUP PLC (FORMERLY I&M HOLDINGS PLC) ANNUAL INTEGRATED REPORT AND FINANCIAL STATEMENTS 2021 I&M GROUP PLC (FORMERLY I&M HOLDINGS PLC) ANNUAL INTEGRATED REPORT AND FINANCIAL STATEMENTS 2021 141140
3. Significant accounting policies (Continued)(c) Foreign operations
The results and financial position of the subsidiaries have been translated into the presentation currency as follows:
(i) Assets and liabilities at each reporting period are translated at the closing rate at the reporting date; (ii) Income and expenses for each statement of comprehensive income are translated at average exchange rates (unless this average is not a
reasonable approximation of the cumulative effect of the rates prevailing on the transaction dates, in which case income and expenses are translated at the dates of the transactions); and
(iii) All resulting exchange differences are recognised in other comprehensive income.
On consolidation, exchange differences arising from the translation of the net investment in foreign entities, and of borrowings and other currency instruments designated as hedges of such investments, are recognised in other comprehensive income. When a foreign operation is sold, such exchange differences are recognised in profit or loss as part of the gain or loss on sale.
Goodwill and fair value adjustments arising on the acquisition of a foreign entity are treated as assets and liabilities of the foreign entity and translated at the closing rate.
(d) Income recognition
(i) Net interest income
Effective interest rate and amortised cost
Interest income and expense are recognised in profit or loss using the effective interest method. The ‘effective interest rate’ is the rate that exactly discounts estimated future cash payments or receipts through the expected life of the financial instrument to:
• the gross carrying amount of the financial asset; or• the amortised cost of the financial liability.
When calculating the effective interest rate for financial instruments other than credit-impaired assets, the Group estimates future cash flows considering all contractual terms of the financial instrument, but not expected credit losses. For credit-impaired financial assets, a credit-adjusted effective interest rate is calculated using estimated future cash flows including expected credit losses.
The calculation of the effective interest rate includes transaction costs and fees and points paid or received that are an integral part of the effective interest rate. Transaction costs include incremental costs that are directly attributable to the acquisition or issue of a financial asset or financial liability.
Amortised cost and gross carrying amount
The ‘amortised cost’ of a financial asset or financial liability is the amount at which the financial asset or financial liability is measured on initial recognition minus the principal repayments, plus or minus the cumulative amortisation using the effective interest method of any difference between that initial amount and the maturity amount and, for financial assets, adjusted for any expected credit loss allowance.
The ‘gross carrying amount of a financial asset’ is the amortised cost of a financial asset before adjusting for any expected credit loss allowance.
Calculation of interest income and expense
In calculating interest income and expense, the effective interest rate is applied to the gross carrying amount of the asset (when the asset is not credit-impaired) or to the amortised cost of the liability.
However, for financial assets that have become credit-impaired subsequent to initial recognition, interest income is calculated by applying the effective interest rate to the amortised cost of the financial asset. If the asset is no longer credit-impaired, then the calculation of interest income reverts to the gross basis.
For financial assets that were credit-impaired on initial recognition, interest income is calculated by applying the credit-adjusted effective interest rate to the amortised cost of the asset. The calculation of interest income does not revert to a gross basis, even if the credit risk of the asset improves.
For information on when financial assets are credit-impaired, see Note 3(f)(iii).
Notes to the consolidated and separate financial statementsFor the year ended 31 December 2021 (Continued)
OUR FINANCIALS (Continued)
Notes to the consolidated and separate financial statementsFor the year ended 31 December 2021 (Continued)
OUR FINANCIALS (Continued)
3. Significant accounting policies (Continued)(d) Income recognition (Continued)
(i) Net interest income (Continued)
Presentation
Interest income and expense presented in the statement of profit or loss and other comprehensive income include:
• interest on financial assets and financial liabilities measured at amortised cost calculated on an effective interest basis;• interest on debt instruments measured at Fair Value Through Other Comprehensive Income (FVOCI) calculated on an effective interest basis;• the effective portion of fair value changes in qualifying hedging derivatives designated in cash flow hedges of variability in interest cash flows,
in the same period as the hedged cash flows affect interest income/expense; and• the effective portion of fair value changes in qualifying hedging derivatives designated in fair value hedges of interest rate risk.
Interest income and expense on all trading assets and liabilities are considered to be incidental to the Group’s trading operations and are presented together with all other changes in the fair value of trading assets and liabilities in net trading income.
Interest income and expense on other financial assets and financial liabilities at FVTPL are presented in net income from other financial instruments at Fair Value Through Profit or Loss (FVTPL).
(ii) Net fee and commission income
Fee and commission income and expenses that are integral to the effective interest rate of a financial asset or liability are included in the measurement of the effective interest rate.
Other fee and commission income – including account servicing fees, investment management fees, sales commission, placement fees and syndication fees – is recognised as the related services are performed. If a loan commitment is not expected to result in the draw-down of a loan, then the related loan commitment fee is recognised on a straight-line basis over the commitment period.
Corporate advisory fees receivable in the normal course of business, are recognised on the basis of terms and conditions stipulated in the client engagement contract, and are recognised over time as the service is provided. The amounts to be collected from customers at period end are recognised as trade receivables. Variable commission are recognised when it is probable that the fee is payable.
A contract with a customer that results in a recognised financial instrument in the Group’s financial statements may be partially in the scope of IFRS 9 and partially in the scope of IFRS 15. If this is the case, then the Group first applies IFRS 9 to separate and measure the part of the contract that is in the scope of IFRS 9 and then applies IFRS 15 to the residual.
Other fee and commission expenses relate mainly to transaction and service fees, which are expensed as the services are received.
(iii) Net trading income and net income on financial assets at fair value through profit or loss
‘Net trading income and net income on financial assets at fair value through profit or loss’ comprises gains less losses related to trading assets and liabilities, and includes all fair value changes, interest, dividends and foreign exchange differences.
(iv) Other operating income
Other operating income comprises gains less losses related to trading assets and liabilities and includes all realised and unrealised fair value changes, interest and foreign exchange differences. It also includes rental income and gain on disposal of property and equipment.
(v)Rental income – other operating income
Rental income is recognised in the profit or loss on a straight-line basis over the term of the lease.
(vi) Dividend income
Dividend income is recognised when the right to receive income is established. Dividends are reflected as a component of operating income.
Our
Gov
erna
nce
Our
Bus
ines
sO
ur F
inan
cial
s

I&M GROUP PLC (FORMERLY I&M HOLDINGS PLC) ANNUAL INTEGRATED REPORT AND FINANCIAL STATEMENTS 2021 I&M GROUP PLC (FORMERLY I&M HOLDINGS PLC) ANNUAL INTEGRATED REPORT AND FINANCIAL STATEMENTS 2021 143142
3. Significant accounting policies (Continued)(e) Income tax expense
Income tax expense comprises current tax and change in deferred tax. Income tax expense is recognised in profit or loss except to the extent that it relates to items recognised directly in equity or other comprehensive income, in which case it is recognised in equity or in other comprehensive income.
Current tax is the expected tax payable or receivable on the taxable income for the year using tax rates enacted or substantively enacted at the reporting date, and any adjustment to tax payable in respect of previous years.
Deferred tax is recognised on all temporary differences between the carrying amounts of assets and liabilities for financial reporting purposes and the amounts used for taxation purposes, except for:
• Temporary differences relating to the initial recognition of assets or liabilities in a transaction that is not a business combination and which affects neither accounting nor taxable profit;
• Temporary differences related to investments in subsidiaries to the extent that it is probable that they will not reverse in the foreseeable future; and
• Taxable temporary differences arising on the initial recognition of goodwill.
Deferred tax is measured at the tax rates that are expected to be applied to the temporary differences when they reverse, based on the laws that have been enacted or substantively enacted by the reporting date. A deferred tax asset is recognised only to the extent that it is probable that future taxable profits will be available against which the asset can be utilised.
A deferred tax asset is recognised for unused tax losses, tax credits and deductible temporary differences to the extent that it is probable that future taxable profits will be available against which they can be utilised. Deferred tax assets are reviewed at each reporting date and are reduced to the extent that it is no longer probable that the related tax benefit will be realized.
Deferred tax assets and liabilities are offset if there is a legally enforceable right to offset current tax liabilities against current tax assets and they relate to income taxes levied by the same tax authority on the same taxable entity or on different tax entities, but they intend to settle current tax assets and liabilities on a net basis or their tax assets and liabilities will be realized simultaneously.
(f) Financial assets and financial liabilities
(i) Recognition
The Group initially recognises loans and advances, trade receivables, deposits and debt securities on the date at which they are originated. All other financial assets and liabilities (including assets designated at fair value through profit or loss) are initially recognised on the trade date on which the Group becomes a party to the contractual provision of the instrument.
A financial asset (unless it is a trade receivable without a significant financing component) or liability is initially measured at fair value plus (for an item not subsequently measured at fair value through profit or loss) transaction costs that are directly attributable to its acquisition or issue. Subsequent to initial recognition, financial liabilities (deposits and debt securities) are measured at their amortized cost using the effective interest method.
(ii) Classification
On initial recognition, a financial asset is classified as measured at: amortised cost, FVOCI or FVTPL.
A financial asset is measured at amortised cost if it meets both of the following conditions and is not designated as at FVTPL:
• the asset is held within a business model whose objective is to hold assets to collect contractual cash flows; and• the contractual terms of the financial asset give rise on specified dates to cash flows that are solely payments of principal and interest on the
principal amount outstanding.
OUR FINANCIALS (Continued)
Notes to the consolidated and separate financial statementsFor the year ended 31 December 2021 (Continued)
Notes to the consolidated and separate financial statementsFor the year ended 31 December 2021 (Continued)
OUR FINANCIALS (Continued)
3. Significant accounting policies (Continued)(f) Financial assets and financial liabilities (Continued)
(ii) Classification (Continued)
A debt instrument is measured at FVOCI only if it meets both of the following conditions and is not designated as at FVTPL:
• the asset is held within a business model whose objective is achieved by both collecting contractual cash flows and selling financial assets; and• the contractual terms of the financial asset give rise on specified dates to cash flows that are solely payments of principal and interest on the
principal amount outstanding.
On initial recognition of an equity investment that is not held for trading, the Group may irrevocably elect to present subsequent changes in fair value in OCI. This election is made on an investment-by-investment basis.
All other financial assets are classified as measured at FVTPL.
In addition, on initial recognition, the Group may irrevocably designate a financial asset that otherwise meets the requirements to be measured at amortised cost or at FVOCI as at FVTPL if doing so eliminates or significantly reduces an accounting mismatch that would otherwise arise.
Business model assessment
The Group makes an assessment of the objective of a business model in which an asset is held at a portfolio level because this best reflects the way the business is managed and information is provided to management. The information considered includes:
• the stated policies and objectives for the portfolio and the operation of those policies in practice. In particular, whether management’s strategy focuses on earning contractual interest revenue, maintaining a particular interest rate profile, matching the duration of the financial assets to the duration of the liabilities that are funding those assets or realising cash flows through the sale of the assets;
• how the performance of the portfolio is evaluated and reported to the Group’s management;• the risks that affect the performance of the business model (and the financial assets held within that business model) and how those risks are
managed;• how managers of the business are compensated – e.g. whether compensation is based on the fair value of the assets managed or the
contractual cash flows collected; and• the frequency, volume and timing of sales in prior periods, the reasons for such sales and its expectations about future sales activity. However,
information about sales activity is not considered in isolation, but as part of an overall assessment of how the Group’s stated objective for managing the financial assets is achieved and how cash flows are realised.
Financial assets that are held for trading or managed and whose performance is evaluated on a fair value basis are measured at FVTPL because they are neither held to collect contractual cash flows nor held both to collect contractual cash flows and to sell financial assets.
Assessment whether contractual cash flows are Solely Payments of Principal and Interest (SPPI Test)
For the purposes of this assessment, ‘principal’ is defined as the fair value of the financial asset on initial recognition. ‘Interest’ is defined as consideration for the time value of money and for the credit risk associated with the principal amount outstanding during a particular period of time and for other basic lending risks and costs (e.g. liquidity risk and administrative costs), as well as profit margin.
In assessing whether the contractual cash flows are solely payments of principal and interest, the Group considers the contractual terms of the instrument. This includes assessing whether the financial asset contains a contractual term that could change the timing or amount of contractual cash flows such that it would not meet this condition. In making the assessment, the Group considers:
• contingent events that would change the amount and timing of cash flows;• leverage features;• prepayment and extension terms;• terms that limit the Group’s claim to cash flows from specified assets (e.g. non-recourse asset arrangements); and• features that modify consideration of the time value of money – e.g. periodical reset of interest rates.
Our
Gov
erna
nce
Our
Bus
ines
sO
ur F
inan
cial
s

I&M GROUP PLC (FORMERLY I&M HOLDINGS PLC) ANNUAL INTEGRATED REPORT AND FINANCIAL STATEMENTS 2021 I&M GROUP PLC (FORMERLY I&M HOLDINGS PLC) ANNUAL INTEGRATED REPORT AND FINANCIAL STATEMENTS 2021 145144
3. Significant accounting policies (Continued)(f) Financial assets and financial liabilities (Continued)
(ii) Classification (Continued)
Assessment whether contractual cash flows are Solely Payments of Principal and Interest (SPPI Test) (Continued)
The Group holds a portfolio of long-term fixed rate loans for which the Group has the option to propose to revise the interest rate at periodic reset dates. These reset rights are limited to the market rate at the time of revision. The borrowers have an option to either accept the revised rate or redeem the loan at par without penalty.
The Group has determined that the contractual cash flows of these loans are solely payments of principal and interest because the option varies the interest rate in a way that is consideration for the time value of money, credit risk, other basic lending risks and costs associated with the principal amount outstanding.
Debt instruments are measured at amortized cost
Debt instruments are measured at amortized cost if they are held within a business model whose objective is to hold for collection of contractual cash flows where those cash flows represent solely payments of principal and interest. After initial measurement, debt instruments in this category are carried at amortized cost. Interest income on these instruments is recognized in interest income using the effective interest rate method.
The effective interest rate is the rate that discounts estimated future cash payments or receipts through the expected life of the financial asset to the gross carrying amount of a financial asset. Amortized cost is calculated by taking into account any discount or premium on acquisition, transaction costs and fees that are an integral part of the effective interest rate.
Impairment on debt instruments measured at amortized cost is calculated using the expected credit loss approach. Loans and debt securities measured at amortized cost are presented net of the expected credit losses (ECL) in the statement of financial position.
Debt instruments measured at FVOCI
Debt instruments are measured at FVOCI if they are held within a business model whose objective is to hold for collection of contractual cash flows and for selling financial assets, where the assets’ cash flows represent payments that are solely payments of principal and interest. Subsequent to initial recognition, unrealized gains and losses on debt instruments measured at FVOCI are recorded in other comprehensive income (OCI), unless the instrument is designated in a fair value hedge relationship. When designated in a fair value hedge relationship, any changes in fair value due to changes in the hedged risk are recognized in Non-interest income in the Consolidated Statement of Profit or Loss and Other Comprehensive Income. Upon derecognition, realized gains and losses are reclassified from OCI and recorded in Non-interest income in the Consolidated Statement of Profit or Loss and Other Comprehensive Income on an average cost basis. Foreign exchange gains and losses that relate to the amortized cost of the debt instrument are recognized in the Consolidated Statement of Profit or Loss and Other Comprehensive Income.
Premiums, discounts and related transaction costs are amortized over the expected life of the instrument to Interest income in the Consolidated Statement of Profit or Loss and Other Comprehensive Income using the effective interest rate method.
Impairment on debt instruments measured at FVOCI is calculated using the expected credit loss approach. The ECL on debt instruments measured at FVOCI does not reduce the carrying amount of the asset in the Consolidated Statement of Financial Position, which remains at its fair value. Instead, an amount equal to the allowance that would arise if the assets were measured at amortised cost is recognised in OCI with a corresponding charge to Provision for credit losses in the Consolidated Statement of Profit or Loss and Other Comprehensive Income. The accumulated allowance recognised in OCI is recycled to the Consolidated Statement of Profit or Loss and Other Comprehensive Income upon derecognition of the debt instrument.
Debt instruments measured at FVTPL
Debt instruments are measured at FVTPL if assets:
(i) Are held for trading purposes;(ii) Are held as part of a portfolio managed on a fair value basis; or(iii) Whose cash flows do not represent payments that are solely payments of principal and interest.
OUR FINANCIALS (Continued)
Notes to the consolidated and separate financial statementsFor the year ended 31 December 2021 (Continued)
Notes to the consolidated and separate financial statementsFor the year ended 31 December 2021 (Continued)
OUR FINANCIALS (Continued)
3. Significant accounting policies (Continued)(f) Financial assets and financial liabilities (Continued)
(ii) Classification (Continued)
These instruments are measured at fair value in the Consolidated Statement of Financial Position, with transaction costs recognized immediately in the Consolidated Statement of Profit or Loss and Other Comprehensive Income as part of Non-interest income. Realized and unrealized gains and losses are recognized as part of Non-interest income in the Consolidated Statement of Profit or Loss and Other Comprehensive Income.
Debt instruments designated at FVTPL
Financial assets classified in this category are those that have been designated by the Group upon initial recognition, and once designated, the designation is irrevocable. The FVTPL designation is available only for those financial assets for which a reliable estimate of fair value can be obtained.
Financial assets are designated at FVTPL if doing so eliminates or significantly reduces an accounting mismatch which would otherwise arise.
Financial assets designated at FVTPL are recorded in the Consolidated Statement of Financial Position at fair value. Changes in fair value are recognized in Non-interest income in the Consolidated Statement of Profit or Loss and Other Comprehensive Income.
Equity instruments
The Group has elected at initial recognition to irrevocably designate an equity investment, held for purposes other than trading, at FVOCI. The fair value changes, including any associated foreign exchange gains or losses, are recognized in OCI and are not subsequently reclassified in the Consolidated Statement of Profit or Loss and Other Comprehensive Income, including upon disposal. Realized gains and losses are transferred directly to retained earnings upon disposal. Consequently, there is no review required for impairment. Dividends will normally be recognized in the profit or loss.
Reclassifications
Financial assets are not reclassified subsequent to their initial recognition, except in the period after the Group changes its business model for managing financial assets.
Financial liabilities
The Group classifies its financial liabilities, other than financial guarantees and loan commitments, as measured at amortised.
(iii) Impairment on financial assets
The Group recognises loss allowances for expected credit losses (ECL) on the following financial instruments that are not measured at FVTPL:
• financial assets that are debt instruments (amortised cost and FVOCI) including loans and advances, trade receivables from Bancassurance and Advisory, and other financial assets measured at amortised cost.
• lease receivables (rental income collected from Investment properties);• financial guarantee contracts issued; and• loan commitments issued.
No impairment loss is recognised on equity investments.
The Group measures loss allowances at an amount equal to lifetime ECL, except for the following, for which they are measured as 12-month ECL:
• debt investment securities that are determined to have low credit risk at the reporting date i.e. balances held with central banks, domestic government bills and bonds, and loans and advances to banks; and
• other financial instruments (other than lease receivables) on which credit risk has not increased significantly since their initial recognition i.e. stage 1 (see Note 5(a)).
Loss allowances for lease receivables (on investment property), and trade receivables (on advisory and bancassurance) are always measured at an amount equal to lifetime ECL.
When determining whether the credit risk of a financial asset has increased significantly since initial recognition and when estimating ECLs, the Group considers reasonable and supportable information that is relevant and available without undue cost or effort.
Our
Gov
erna
nce
Our
Bus
ines
sO
ur F
inan
cial
s

I&M GROUP PLC (FORMERLY I&M HOLDINGS PLC) ANNUAL INTEGRATED REPORT AND FINANCIAL STATEMENTS 2021 I&M GROUP PLC (FORMERLY I&M HOLDINGS PLC) ANNUAL INTEGRATED REPORT AND FINANCIAL STATEMENTS 2021 147146
3. Significant accounting policies (Continued)(f) Financial assets and financial liabilities (Continued)
(iii) Impairment on financial assets (Continued)
This includes both quantitative and qualitative information and analysis, based on the Group’s historical experience and informed credit assessment and including forward-looking information.
The Group assumes that the credit risk on a financial asset has increased significantly if it is more than 30 days past due.
The Group considers a financial asset to be in default when:
• the borrower is unlikely to pay its credit obligations to the Group in full, without recourse by the Group to actions such as realising security (if any is held); or
• the financial asset is more than 90 days past due.
The Group considers a debt security to have low credit risk when their credit risk rating is equivalent to the globally understood definition of ‘investment grade’.
12-month ECL are the portion of ECL that result from default events on a financial instrument that are possible within the 12 months after the reporting date. Financial instruments for which a 12-month ECL is recognised are referred to as ‘Stage 1 financial instruments’.
Life-time ECL are the ECL that result from all possible default events over the expected life of the financial instrument. Financial instruments for which a lifetime ECL is recognised but which are not credit-impaired are referred to as ‘Stage 2 financial instruments’.
Significant Increase in Credit Risk (SICR)
At each reporting date, the Group performs both qualitative and quantitative assessments whether there has been a significant increase in credit risk for exposures since initial recognition by comparing the risk of default occurring over the remaining expected life from the reporting date and the date of initial recognition. The assessment considers borrower-specific quantitative and qualitative information without consideration of collateral, and the impact of forward-looking macroeconomic factors.
The common assessments for SICR is largely determined by the Prudential Guidelines classification augmented by macroeconomic outlook, management judgement, and delinquency and monitoring.
Quantitative models may not always be able to capture all reasonable and supportable information that may indicate a significant increase in credit risk. Qualitative factors may be assessed to supplement the gap. Examples of situations include a significant departure from the primary source of repayment, changes in adjudication criteria for a particular group of borrowers; changes in portfolio composition; and legislative changes impacting certain portfolios.
With regards to delinquency and monitoring, there is a rebuttable presumption that delinquency backstop when contractual payments are more than 30 days past due.
Measurement of ECL
ECL are a probability-weighted estimate of credit losses. They are measured as follows:
• financial assets that are not credit-impaired at the reporting date (stage 1 and 2): as the present value of all cash shortfalls (i.e. the difference between the cash flows due to the entity in accordance with the contract and the cash flows that the Group expects to receive);
• financial assets that are credit-impaired at the reporting date (stage 3): as the difference between the gross carrying amount and the present value of estimated future cash flows;
• undrawn loan commitments: as the present value of the difference between the contractual cash flows that are due to the Group if the commitment is drawn down and the cash flows that the Group expects to receive; and
• financial guarantee contracts: the expected payments to reimburse the holder less any amounts that the Group expects to recover. See also Note 5(a).
Notes to the consolidated and separate financial statementsFor the year ended 31 December 2021 (Continued)
OUR FINANCIALS (Continued)
Notes to the consolidated and separate financial statementsFor the year ended 31 December 2021 (Continued)
OUR FINANCIALS (Continued)
3. Significant accounting policies (Continued)(f) Financial assets and financial liabilities (Continued)
(iii) Impairment on financial assets (Continued)
Restructured financial assets
If the terms of a financial asset are renegotiated or modified or an existing financial asset is replaced with a new one due to financial difficulties of the borrower, then an assessment is made of whether the financial asset should be derecognised (see note 3(f)(iv)) and ECL are measured as follows.
• If the expected restructuring will not result in derecognition of the existing asset, then the expected cash flows arising from the modified financial asset are included in calculating the cash shortfalls from the existing asset.
• If the expected restructuring will result in derecognition of the existing asset, then the expected fair value of the new asset is treated as the final cash flow from the existing financial asset at the time of its derecognition. This amount is included in calculating the cash shortfalls from the existing financial asset that are discounted from the expected date of derecognition to the reporting date using the original effective interest rate of the existing financial asset.
Credit-impaired financial assets
At each reporting date, the Group assesses whether financial assets carried at amortised cost and debt financial assets carried at FVOCI are credit-impaired (referred to as stage 3 financial assets). A financial asset is ‘credit-impaired’ when one or more events that have a detrimental impact on the estimated future cash flows of the financial asset have occurred.
Evidence that a financial asset is credit-impaired includes the following observable data:
• significant financial difficulty of the borrower or issuer;• a breach of contract such as a default or past due event;• the restructuring of a loan or advance by the Group on terms that the Group would not consider otherwise;• it is becoming probable that the borrower will enter bankruptcy or other financial reorganisation; or• the disappearance of an active market for a security because of financial difficulties.
A loan that is overdue for 90 days or more is considered impaired. In addition, a loan that has been renegotiated due to a deterioration in the borrower’s condition is usually considered to be credit-impaired unless there is evidence that the risk of not receiving contractual cash flows has reduced significantly and there are no other indicators of impairment.
Government securities (debt instruments)
In making an assessment of whether an investment in sovereign debt (government bills and bonds, Balances due from central banks) is credit-impaired, the Group considers the following factors;
(i) The country’s ability to access own local capital markets for new debt issuance. (ii) The respective government ability to maintain sovereignty on its currency(iii) The intentions and capacity, reflected in public statements, of governments and agencies honor these commitments.
Presentation of allowance for ECL in the statement of financial position
Loss allowances for ECL are presented in the statement of financial position as follows:
• financial assets measured at amortised cost: as a deduction from the gross carrying amount of the assets;• loan commitments and financial guarantee contracts: generally, as a provision; • where a financial instrument includes both a drawn and an undrawn component, and the Group cannot identify the ECL on the loan commitment
component separately from those on the drawn component: the Group presents a combined loss allowance for both components. The combined amount is presented as a deduction from the gross carrying amount of the drawn component. Any excess of the loss allowance over the gross amount of the drawn component is presented as a provision; and
• debt instruments measured at FVOCI: no loss allowance is recognised in the statement of financial position because the carrying amount of these assets is their fair value. However, the loss allowance is disclosed and is recognised in the fair value reserve.
Our
Gov
erna
nce
Our
Bus
ines
sO
ur F
inan
cial
s

I&M GROUP PLC (FORMERLY I&M HOLDINGS PLC) ANNUAL INTEGRATED REPORT AND FINANCIAL STATEMENTS 2021 I&M GROUP PLC (FORMERLY I&M HOLDINGS PLC) ANNUAL INTEGRATED REPORT AND FINANCIAL STATEMENTS 2021 149148
3. Significant accounting policies (Continued)(f) Financial assets and financial liabilities (Continued)
(iii) Impairment on financial assets (Continued)
Write-off
Financial assets at both amortised and FVOCI are written off (either partially or in full) when there is no realistic prospect of recovery. This is generally the case when the Group determines that the borrower does not have assets or sources of income that could generate sufficient cash flows to repay the amounts subject to the write-off. However, financial assets that are written off could still be subject to enforcement activities in order to comply with the Group’s procedures for recovery of amounts due.
(iv) De-recognition
Financial assets
The Group derecognises a financial asset when the contractual rights to the cash flows from the financial asset expire or it transfers the rights to receive the contractual cash flows in a transaction in which substantially all of the risks and rewards of ownership of the financial asset are transferred or in which the Group neither transfers nor retains substantially all of the risks and rewards of ownership and it does not retain control of the financial asset.
On derecognition of a financial asset, the difference between the carrying amount of the asset (or the carrying amount allocated to the portion of the asset derecognised) and the sum of (i) the consideration received (including any new asset obtained less any new liability assumed) and (ii) any cumulative gain or loss that had been recognised in OCI is recognised in profit or loss.
Any cumulative gain/loss recognised in OCI in respect of equity investment securities designated as at FVOCI is not recognised in profit or loss on derecognition of such securities. Any interest in transferred financial assets that qualify for derecognition that is created or retained by the Group is recognised as a separate asset or liability.
The Group enters into transactions whereby it transfers assets recognised on its statement of financial position, but retains either all or substantially all of the risks and rewards of the transferred assets or a portion of them. In such cases, the transferred assets are not derecognised. Examples of such transactions are securities lending and sale-and-repurchase transactions.
When assets are sold to a third party with a concurrent total rate of return swap on the transferred assets, the transaction is accounted for as a secured financing transaction similar to sale-and-repurchase transactions, because the Group retains all or substantially all of the risks and rewards of ownership of such assets.
In transactions in which the Group neither retains nor transfers substantially all of the risks and rewards of ownership of a financial asset and it retains control over the asset, the Group continues to recognise the asset to the extent of its continuing involvement, determined by the extent to which it is exposed to changes in the value of the transferred asset.
In certain transactions, the Group retains the obligation to service the transferred financial asset for a fee. The transferred asset is derecognised if it meets the derecognition criteria. An asset or liability is recognised for the servicing contract if the servicing fee is more than adequate (asset) or is less than adequate (liability) for performing the servicing.
The Group securitises various loans and advances to customers and investment securities, which generally result in the sale of these assets to unconsolidated securitisation vehicles and in the Group transferring substantially all of the risks and rewards of ownership. The securitisation vehicles in turn issue securities to investors. Interests in the securitised financial assets are generally retained in the form of senior or subordinated tranches, interest-only strips or other residual interests (retained interests). Retained interests are recognised as investment securities and carried at FVOCI. Gains or losses on securitisation are recorded in other revenue.
Financial liabilities
The Group derecognises a financial liability when its contractual obligations are discharged or cancelled, or expire.
Notes to the consolidated and separate financial statementsFor the year ended 31 December 2021 (Continued)
OUR FINANCIALS (Continued)
Notes to the consolidated and separate financial statementsFor the year ended 31 December 2021 (Continued)
OUR FINANCIALS (Continued)
3. Significant accounting policies (Continued)(f) Financial assets and financial liabilities (Continued)
(v) Modifications of financial assets and financial liabilities
Financial assets
If the terms of a financial asset are modified, the Group evaluates whether the cash flows of the modified asset are substantially different. If the cash flows are substantially different, then the contractual rights to cash flows from the original financial asset are deemed to have expired. In this case, the original financial asset is derecognised and a new financial asset is recognised at fair value.
If the cash flows of the modified asset carried at amortised cost are not substantially different, then the modification does not result in derecognition of the financial asset. In this case, the Group recalculates the gross carrying amount of the financial asset and recognises the amount arising from adjusting the gross carrying amount as a modification gain or loss in profit or loss. If such a modification is carried out because of financial difficulties of the borrower, then the gain or loss is presented together with impairment losses. In other cases, it is presented as interest income.
The impact of modifications of financial assets on the expected credit loss calculation is discussed in Note 3(f)(iii)
Financial liabilities
The Group derecognises a financial liability when its terms are modified and the cash flows of the modified liability are substantially different. In this case, a new financial liability based on the modified terms is recognised at fair value. The difference between the carrying amount of the financial liability extinguished and the new financial liability with modified terms is recognised in profit or loss.
(vi) Offsetting of financial assets and financial liabilities
Financial assets and financial liabilities are offset and the net amount reported in the statement of financial position when there is a legally enforceable right to offset the recognized amounts and there is an intention to settle on a net basis, or to realize the asset and settle the liability simultaneously.
Income and expenses are presented on a net basis only when permitted under IFRSs, or for gains and losses arising from a group of similar transactions such as in the Group’s trading activity.
(g) Fair value measurement
Fair value is the price that would be received to sell an asset or paid to transfer a liability in an orderly transaction between market participants at the measurement date in the principal or, in its absence, the most advantageous market to which the Group has access at that date. The fair value of a liability reflects its non-performance risk.
If there is no quoted price in an active market, then the Group uses valuation techniques that maximise the use of relevant observable inputs and minimise the use of unobservable inputs. The chosen valuation technique incorporates all of the factors that market participants would take into account in pricing a transaction.
The best evidence of the fair value of a financial instrument at initial recognition is normally the transaction price – i.e. the fair value of the consideration given or received. If the Group determines that the fair value at initial recognition differs from the transaction price and the fair value is evidenced neither by a quoted price in an active market for an identical asset or liability nor based on a valuation technique that uses only data from observable markets, then the financial instrument is initially measured at fair value, adjusted to defer the difference between the fair value at initial recognition and the transaction price. Subsequently, that difference is recognised in profit or loss on an appropriate basis over the life of the instrument but no later than when the valuation is wholly supported by observable market data or the transaction is closed out.
If an asset or liability measure at fair value has a bid price and an ask price, then the Group measures assets and long positions at a bid price and liabilities and short positions at an ask price.
Portfolio of financial assets and financial liabilities that are exposed to market risk and credit risk that are managed by the Group on the basis of net exposure to either market or credit risk are measure on the basis of a price that would be received to sell a net long position (or paid to transfer a net short position) for a particular risk exposure. Those portfolio-level adjustments are allocated to the individual assets and liabilities on the basis of the relative risk adjustment of each of the individual instruments in the portfolio.
Our
Gov
erna
nce
Our
Bus
ines
sO
ur F
inan
cial
s
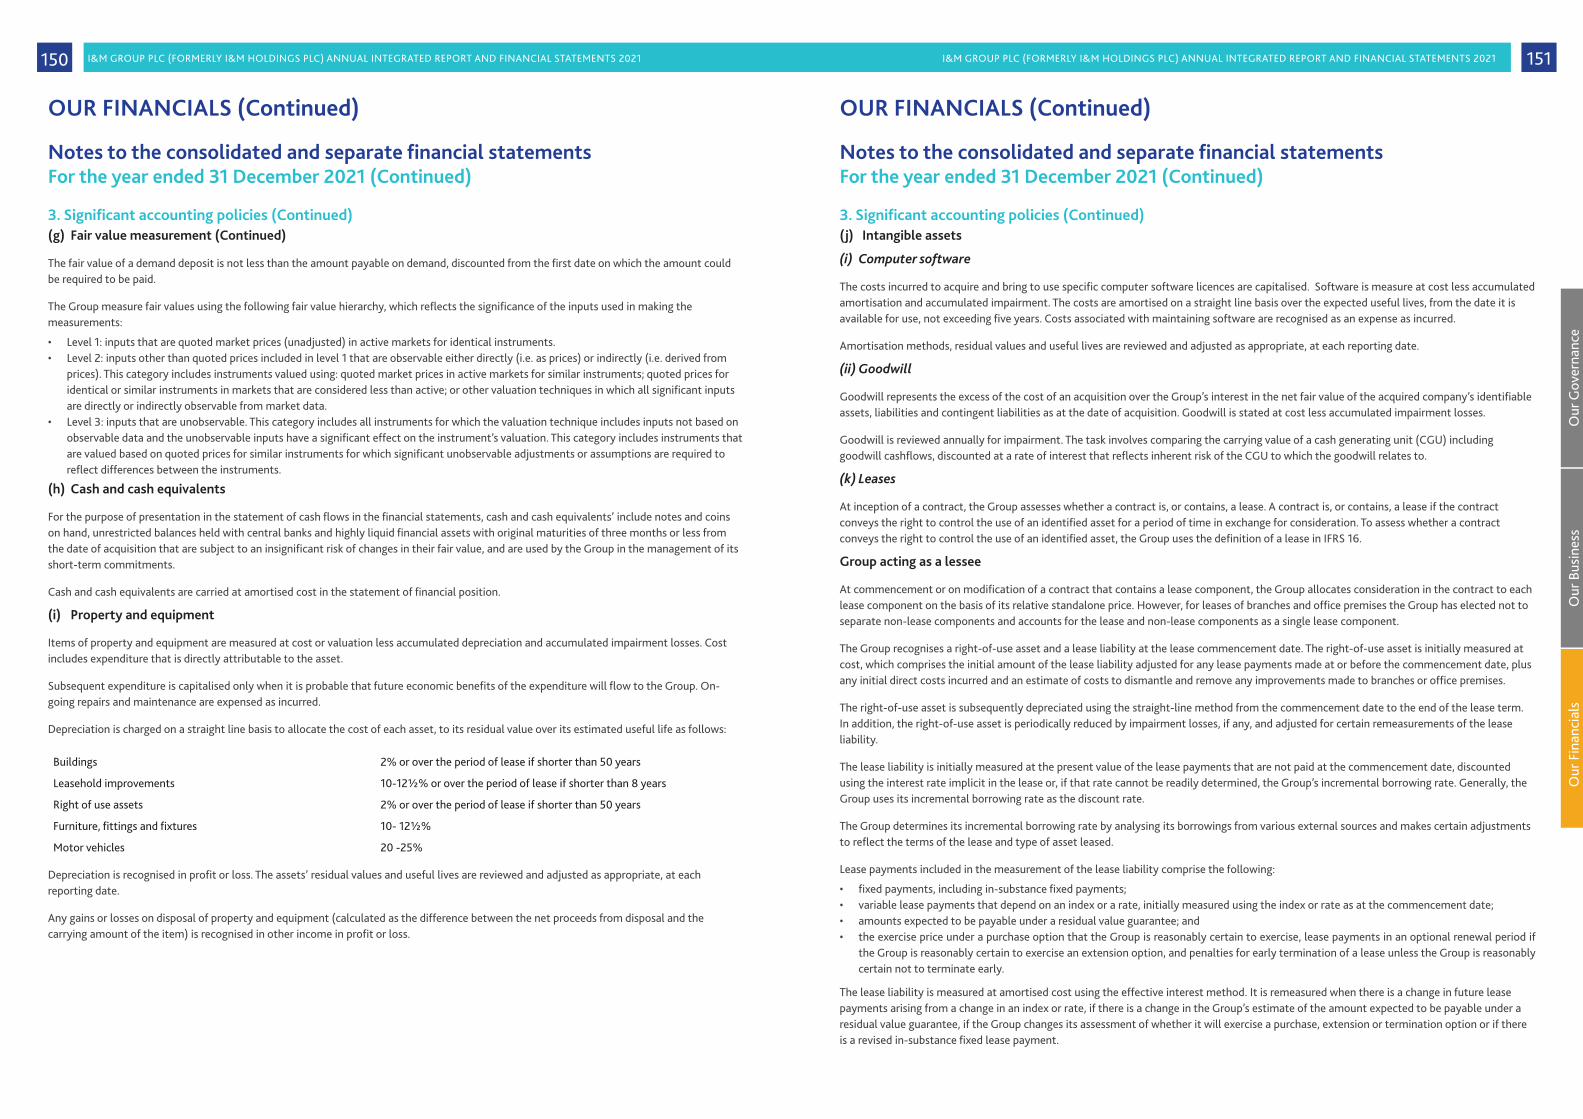
I&M GROUP PLC (FORMERLY I&M HOLDINGS PLC) ANNUAL INTEGRATED REPORT AND FINANCIAL STATEMENTS 2021 I&M GROUP PLC (FORMERLY I&M HOLDINGS PLC) ANNUAL INTEGRATED REPORT AND FINANCIAL STATEMENTS 2021 151150
3. Significant accounting policies (Continued)(g) Fair value measurement (Continued)
The fair value of a demand deposit is not less than the amount payable on demand, discounted from the first date on which the amount could be required to be paid.
The Group measure fair values using the following fair value hierarchy, which reflects the significance of the inputs used in making the measurements:
• Level 1: inputs that are quoted market prices (unadjusted) in active markets for identical instruments.• Level 2: inputs other than quoted prices included in level 1 that are observable either directly (i.e. as prices) or indirectly (i.e. derived from
prices). This category includes instruments valued using: quoted market prices in active markets for similar instruments; quoted prices for identical or similar instruments in markets that are considered less than active; or other valuation techniques in which all significant inputs are directly or indirectly observable from market data.
• Level 3: inputs that are unobservable. This category includes all instruments for which the valuation technique includes inputs not based on observable data and the unobservable inputs have a significant effect on the instrument’s valuation. This category includes instruments that are valued based on quoted prices for similar instruments for which significant unobservable adjustments or assumptions are required to reflect differences between the instruments.
(h) Cash and cash equivalents
For the purpose of presentation in the statement of cash flows in the financial statements, cash and cash equivalents’ include notes and coins on hand, unrestricted balances held with central banks and highly liquid financial assets with original maturities of three months or less from the date of acquisition that are subject to an insignificant risk of changes in their fair value, and are used by the Group in the management of its short-term commitments.
Cash and cash equivalents are carried at amortised cost in the statement of financial position.
(i) Property and equipment
Items of property and equipment are measured at cost or valuation less accumulated depreciation and accumulated impairment losses. Cost includes expenditure that is directly attributable to the asset.
Subsequent expenditure is capitalised only when it is probable that future economic benefits of the expenditure will flow to the Group. On-going repairs and maintenance are expensed as incurred.
Depreciation is charged on a straight line basis to allocate the cost of each asset, to its residual value over its estimated useful life as follows:
Buildings 2% or over the period of lease if shorter than 50 years
Leasehold improvements 10-12½% or over the period of lease if shorter than 8 years
Right of use assets 2% or over the period of lease if shorter than 50 years
Furniture, fittings and fixtures 10- 12½%
Motor vehicles 20 -25%
Depreciation is recognised in profit or loss. The assets’ residual values and useful lives are reviewed and adjusted as appropriate, at each reporting date.
Any gains or losses on disposal of property and equipment (calculated as the difference between the net proceeds from disposal and the carrying amount of the item) is recognised in other income in profit or loss.
Notes to the consolidated and separate financial statementsFor the year ended 31 December 2021 (Continued)
OUR FINANCIALS (Continued)
Notes to the consolidated and separate financial statementsFor the year ended 31 December 2021 (Continued)
OUR FINANCIALS (Continued)
3. Significant accounting policies (Continued)(j) Intangible assets
(i) Computer software
The costs incurred to acquire and bring to use specific computer software licences are capitalised. Software is measure at cost less accumulated amortisation and accumulated impairment. The costs are amortised on a straight line basis over the expected useful lives, from the date it is available for use, not exceeding five years. Costs associated with maintaining software are recognised as an expense as incurred.
Amortisation methods, residual values and useful lives are reviewed and adjusted as appropriate, at each reporting date.
(ii) Goodwill
Goodwill represents the excess of the cost of an acquisition over the Group’s interest in the net fair value of the acquired company’s identifiable assets, liabilities and contingent liabilities as at the date of acquisition. Goodwill is stated at cost less accumulated impairment losses.
Goodwill is reviewed annually for impairment. The task involves comparing the carrying value of a cash generating unit (CGU) including goodwill cashflows, discounted at a rate of interest that reflects inherent risk of the CGU to which the goodwill relates to.
(k) Leases
At inception of a contract, the Group assesses whether a contract is, or contains, a lease. A contract is, or contains, a lease if the contract conveys the right to control the use of an identified asset for a period of time in exchange for consideration. To assess whether a contract conveys the right to control the use of an identified asset, the Group uses the definition of a lease in IFRS 16.
Group acting as a lessee
At commencement or on modification of a contract that contains a lease component, the Group allocates consideration in the contract to each lease component on the basis of its relative standalone price. However, for leases of branches and office premises the Group has elected not to separate non-lease components and accounts for the lease and non-lease components as a single lease component.
The Group recognises a right-of-use asset and a lease liability at the lease commencement date. The right-of-use asset is initially measured at cost, which comprises the initial amount of the lease liability adjusted for any lease payments made at or before the commencement date, plus any initial direct costs incurred and an estimate of costs to dismantle and remove any improvements made to branches or office premises.
The right-of-use asset is subsequently depreciated using the straight-line method from the commencement date to the end of the lease term. In addition, the right-of-use asset is periodically reduced by impairment losses, if any, and adjusted for certain remeasurements of the lease liability.
The lease liability is initially measured at the present value of the lease payments that are not paid at the commencement date, discounted using the interest rate implicit in the lease or, if that rate cannot be readily determined, the Group’s incremental borrowing rate. Generally, the Group uses its incremental borrowing rate as the discount rate.
The Group determines its incremental borrowing rate by analysing its borrowings from various external sources and makes certain adjustments to reflect the terms of the lease and type of asset leased.
Lease payments included in the measurement of the lease liability comprise the following:
• fixed payments, including in-substance fixed payments;• variable lease payments that depend on an index or a rate, initially measured using the index or rate as at the commencement date;• amounts expected to be payable under a residual value guarantee; and• the exercise price under a purchase option that the Group is reasonably certain to exercise, lease payments in an optional renewal period if
the Group is reasonably certain to exercise an extension option, and penalties for early termination of a lease unless the Group is reasonably certain not to terminate early.
The lease liability is measured at amortised cost using the effective interest method. It is remeasured when there is a change in future lease payments arising from a change in an index or rate, if there is a change in the Group’s estimate of the amount expected to be payable under a residual value guarantee, if the Group changes its assessment of whether it will exercise a purchase, extension or termination option or if there is a revised in-substance fixed lease payment.
Our
Gov
erna
nce
Our
Bus
ines
sO
ur F
inan
cial
s

I&M GROUP PLC (FORMERLY I&M HOLDINGS PLC) ANNUAL INTEGRATED REPORT AND FINANCIAL STATEMENTS 2021 I&M GROUP PLC (FORMERLY I&M HOLDINGS PLC) ANNUAL INTEGRATED REPORT AND FINANCIAL STATEMENTS 2021 153152
3. Significant accounting policies (Continued)Group acting as a lessee (Continued)
When the lease liability is remeasured in this way, a corresponding adjustment is made to the carrying amount of the right-of-use asset, or is recorded in profit or loss if the carrying amount of the right-of-use asset has been reduced to zero.
The Group presents right-of-use assets in ‘property and equipment’ and lease liabilities in ‘other liabilities’ in the statement of financial position.
Short-term leases and leases of low-value assets
The Group has elected not to recognise right-of-use assets and lease liabilities for leases of low-value assets and short-term leases, including leases of IT equipment. The Group recognises the lease payments associated with these leases as an expense on a straight-line basis over the lease term.
Group acting as a lessor
At inception or on modification of a contract that contains a lease component, the Group allocates the consideration in the contract to each lease component on the basis of their relative stand-alone selling prices.
When the Group acts as a lessor, it determines at lease inception whether the lease is a finance lease or an operating lease.
To classify each lease, the Group makes an overall assessment of whether the lease transfers substantially all of the risks and rewards incidental to ownership of the underlying asset. If this is the case, then the lease is a finance lease; if not, then it is an operating lease. As part of this assessment, the Group considers certain indicators such as whether the lease is for the major part of the economic life of the asset.
The Group applies the derecognition and impairment requirements in IFRS 9 to the net investment in the lease. The Group further regularly reviews estimated unguaranteed residual values used in calculating the gross investment in the lease.
(l) Impairment of non-financial assets
The carrying amounts of the Group’s non-financial assets, other than deferred tax assets, are reviewed at each reporting date to determine whether there is any indication of impairment. If any such indication exists then the asset’s recoverable amount is estimated.
An impairment loss is recognised if the carrying amount of an asset or its cash-generating unit exceeds its recoverable amount. A cash-generating unit is the smallest identifiable asset group that generates cash flows that largely are independent from other assets and group. Impairment losses are recognised in the profit or loss. Impairment losses recognised in respect of cash-generating units are allocated first to reduce the carrying amount of any goodwill allocated to the units and then to reduce the carrying amount of the other assets in the unit (group of units) on a pro-rata basis.
The recoverable amount of an asset or cash-generating unit is the greater of its value in use and its fair value less costs to sell. In assessing value in use, the estimated future cash flows are discounted to their present value using a pre-tax discount rate that reflects current market assessments of the time value of money and the risks specific to the asset.
(m) Derivative financial instruments
The Group uses financial instruments to hedge its exposure to foreign exchange and interest rate risks arising from operational, financing and investment activities.
Derivative financial instruments are recognised initially at fair value on the date the derivative contract is entered into. Subsequent to initial recognition, derivative financial instruments are stated at fair value.
The fair value of forward exchange contracts is the amount of the mark to market adjustment at the reporting date.
Notes to the consolidated and separate financial statementsFor the year ended 31 December 2021 (Continued)
OUR FINANCIALS (Continued)
Notes to the consolidated and separate financial statementsFor the year ended 31 December 2021 (Continued)
OUR FINANCIALS (Continued)
3. Significant accounting policies (Continued)(n) Employee benefits
(i) Defined contribution plan
The majority of the Group’s employees are eligible for retirement benefits under a defined contribution plan.
The assets of the defined contribution scheme are held in a separate trustee administered guaranteed scheme managed by an insurance company. Retirement
The Group’s contributions are recognised in profit or loss in the year to which they relate.
The Group also contributes to various national social security funds in the countries it operates. Contributions are determined by local statute and the Group’s contributions are charged to the income statement in the year to which they relate.
(ii) Leave accrual
The monetary value of the unutilised leave by staff as at year end is recognised within accruals and the movement in the year is debited/credited to the profit or loss.
(iii) Employee Share Ownership Plan (ESOP)
The grant date fair value of equity-settled share-based payment awards (i.e. stock options) granted to employees is recognised as an employee expense, with a corresponding increase in equity, over the period in which the employees unconditionally become entitled to the awards. The amount recognised as an expense is adjusted to reflect the number of share awards for which the related service and non-market performance vesting conditions are expected to be met such that the amount ultimately recognised as an expense is based on the number of share awards that do meet the related service and non-market performance conditions at the vesting date. For share-based payment awards with non-vesting conditions, the grant-date fair value of the share-based payment is measured to reflect such conditions and there is no true-up for differences between expected and actual outcomes.
(o) Share capital and share issue costs
Ordinary shares are classified as equity. Incremental costs directly attributable to the issue of an equity instrument are deducted from initial measurement of the equity instruments.
(p) Earnings per share
Earnings per share are calculated based on the profit attributable to owners of the company divided by the number of ordinary shares. Diluted earnings per share are computed using the weighted average number of equity shares and dilutive potential ordinary shares outstanding during the year.
(q) Dividends
Dividends are charged to equity in the period in which they are declared. Proposed dividends are not accrued until they have been ratified at the Annual General Meeting.
(r) Contingent liabilities
Letters of credit, acceptances and guarantees are not recognised and are disclosed as contingent liabilities. Estimates of the outcome and the financial effect of contingent liabilities is made by management based on the information available up to the date the financial statements are approved for issue by the directors. Any expected loss is charged to profit or loss.
(s) Provisions
Provisions are recognised when the Company has a present legal or constructive obligation as a result of past events, it is probable that an outflow of resources will be required to settle the obligation and the amount has been reliably estimated. Restructuring provisions comprise lease termination penalties and employee termination payments. Provisions are not recognised for future operating losses.
Our
Gov
erna
nce
Our
Bus
ines
sO
ur F
inan
cial
s

I&M GROUP PLC (FORMERLY I&M HOLDINGS PLC) ANNUAL INTEGRATED REPORT AND FINANCIAL STATEMENTS 2021 I&M GROUP PLC (FORMERLY I&M HOLDINGS PLC) ANNUAL INTEGRATED REPORT AND FINANCIAL STATEMENTS 2021 155154
3. Significant accounting policies (Continued)(t) Fiduciary activities
The Group commonly acts as Trustees and in other fiduciary capacities that result in the holding or placing of assets on behalf of individuals, trusts, retirement benefits plans and institutions. These assets and income arising thereon are excluded from these financial statements, as they are not assets of the Group.
(u) Comparative information
Where necessary, comparative figures have been restated to conform with changes in presentation in the current year.
(v) Non-current assets held for sale
Non-current assets are expected to be recovered primarily through sale rather than through continuing use, are classified as held for sale. Immediately before classification as held for sale, the assets, or components of a disposal, are re-measured in accordance with the Group’s accounting policies. Thereafter, generally the assets, or disposal, are measured at the lower of their carrying amount and fair value less cost to sell. For non-financial assets, fair value takes into account the highest and best use either on a standalone basis or in combination with other assets or other assets and liabilities.
Any impairment loss on a disposal is first allocated to goodwill, and then to remaining assets and liabilities on pro rata basis, except that no loss is allocated to financial assets, deferred tax assets and employee benefit assets which continue to be measured in accordance with the Bank’s accounting policies. Impairment losses on initial classification as held for sale and subsequent gains or losses on re-measurement are recognised in profit or loss. Gains are not recognised in excess of any cumulative impairment loss.
(w) New standards, amendments and interpretations
(i) New standards, amendments and interpretations effective and adopted during the year
The Group and Company has adopted the following new standards and amendments during the year ended 31 December 2021, including consequential amendments to other standards with the date of initial application by the Group and Company being 1 January 2021. The nature and effects of the changes are as explained here in.
New standards or amendments Effective for annual period beginning or after
• Interest Rate Benchmark Reform (Amendments to IFRS 9, IAS 39 and IFRS 7) 1 January 2021
• COVID-l 9-Related Rent Concessions (Amendments to IFRS 16) 1 June 2020
Interest rate benchmark reform (Amendments to IFRS 9, IAS 39 and IFRS 7)
The amendments, provide certain reliefs in connection with interest rate benchmark reform. The reliefs relate to hedge accounting and have the effect that IBOR reform should not generally cause hedge accounting to terminate. However, any hedge ineffectiveness should continue to be recorded in the profit or loss account.
The Financial Stability Board has initiated a fundamental review and reform of the major interest rate benchmarks used globally by financial market participants. This review seeks to replace existing interbank offered rates (IBORs) with alternative risk-free rates (ARRs) to improve market efficiency and mitigate systemic risk across financial markets. During the 2021 financial year, the LIBOR’s administrator, the Intercontinental Exchange Benchmark Administration Limited, announced it would no longer publish EUR, CHF, JPY and GBP related LIBOR rates for all tenors after 31 December 2021. The IBA has adopted a two-stage approach for the cession of the USD LIBOR rates with the 1 week and 2 month USD LIBOR rates no longer being published after 31 December 2021 and the remaining being the overnight, 1 month, 3 month, 6 month and 12 month rates no longer being published after 30 June 2023. The LIBOR rates which the bank is exposed to will be replaced by secured overnight financing rate (SOFR).
Whilst there are plans to replace Johannesburg Interbank Average Rate (JIBAR), there is currently no indication of when the designated successor rate will be made available. Given that the LIBOR rates and ARRs are calculated on a different basis, adjustments may be made to contracts that that are transitioned from LIBOR to ARRs, to ensure economic equivalence. The bank has several LIBOR linked contracts that extend beyond 2021. The bank ceased booking new LIBOR linked exposures from 1 January 2022, apart from in limited circumstances to align with industry guidance and best practice. From this date, new exposure will be booked using the SOFR. In certain instances, other suitable rates may be used, such as Central Bank policy rates. The bank has established a steering committee and within Assets and Liability Committee (ALCO) to manage the transition to ARRs.
Notes to the consolidated and separate financial statementsFor the year ended 31 December 2021 (Continued)
OUR FINANCIALS (Continued)
Notes to the consolidated and separate financial statementsFor the year ended 31 December 2021 (Continued)
OUR FINANCIALS (Continued)
3. Significant accounting policies (Continued)(w) New standards, amendments and interpretations (Continued)
(i) New standards, amendments and interpretations effective and adopted during the year (Continued)
Interest rate benchmark reform (Amendments to IFRS 9, IAS 39 and IFRS 7)- Continued
The objectives of the committee and working group include evaluating the extent to which loans advanced and liabilities reference IBOR cash flows, whether such contracts need to be amended as a result of IBOR reform and how to manage communication about IBOR reform with counterparties. The committee is working closely with business teams across the bank to establish pricing for new lending products indexed to the ARR in impacted jurisdictions.
The adoption of this standard did not have a material impact on the Group's and Company’s financial statements.
Covid-19-related Rent Concessions (Amendments to IFRS 16)
As a result of the COVID-19 pandemic, rent concessions have been granted to lessees. Such concessions might take a variety of forms, including payment holidays and deferral of lease payments. In May 2020, the IASB made an amendment to IFRS 16 Leases which provides lessees with an option to treat qualifying rent concessions in the same way as they would if they were not lease modifications. In many cases, this will result in accounting for the concessions as variable lease payments in the period in which they are granted.
Entities applying the practical expedients must disclose this fact, whether the expedient has been applied to all qualifying rent concessions or, if not, information about the nature of the contracts to which it has been applied, as well as the amount recognised in profit or loss arising from the rent concessions.
The Directors of the Group do not anticipate that the application of the amendments in the future will have an impact on the Group’s and Company’s financial statements.
(ii) New and amended standards and interpretations in issue but not yet effective for the year ended 31 December 2021
A number of new standards, amendments to standards and interpretations are not yet effective for the year ended 31 December 2021 and have not been applied in preparing these financial statements.
The Group does not plan to adopt these standards early. These are summarised below:
New standards or amendments Effective for annual period beginning or after
• Onerous Contracts - Cost of Fulfilling a Contract (Amendments to IAS 37) 1 January 2022
• Annual Improvements to IFRS Standards 2018-2020 1 January 2022
• Property, Plant and Equipment: Proceeds before Intended Use (Amendments to IAS 16) 1 January 2022
• Reference to the Conceptual Framework (Amendments to IFRS 3) 1 January 2022
• IFRS 17 Insurance Contracts and amendments to IFRS 17 Insurance Contracts 1 January 2023
• Classification of Liabilities as current or non-current (Amendments IAS 1) 1 January 2023
• Disclosure of Accounting Policy (Amendments to IAS 1 and IFRS Practice Statement 2 1 January 2023
• Definition of Accounting Estimate (Amendments to IAS 8) 1 January 2023
• Deferred Tax Related to Assets and Liabilities Arising from a Single Transaction – Amendments to IAS 12 Income Taxes
1 January 2023
• Sale or Contribution of Assets between an Investor and its Associate or Company (Amendments to IFRS 10 and IAS 28).
1 January 2022 (Optional)
All standards and interpretations will be adopted at their effective date (except for those standards and interpretations that are not applicable to the entity).
Our
Gov
erna
nce
Our
Bus
ines
sO
ur F
inan
cial
s

I&M GROUP PLC (FORMERLY I&M HOLDINGS PLC) ANNUAL INTEGRATED REPORT AND FINANCIAL STATEMENTS 2021 I&M GROUP PLC (FORMERLY I&M HOLDINGS PLC) ANNUAL INTEGRATED REPORT AND FINANCIAL STATEMENTS 2021 157156
3. Significant accounting policies (Continued)(w) New standards, amendments and interpretations (Continued)
(ii) New and amended standards and interpretations in issue but not yet effective for the year ended 31 December 2021 (Continued)
- Onerous Contracts - Cost of Fulfilling a Contract (Amendments to IAS 37)
The amendment to IAS 37 clarifies that the direct costs of fulfilling a contract include both the incremental costs of fulfilling the contract and an allocation of other costs directly related to fulfilling contracts. Before recognising a separate provision for an onerous contract, the entity recognises any impairment loss that has occurred on assets used in fulfilling the contract.
The Directors of the Group do not anticipate that the application of the amendments in the future will have an impact on the Group's and Company’s consolidated financial statements.
- Annual Improvement cycle (2018 – 2020) – various standards
The following improvements were finalised in May 2020
Standards
IFRS 9 Financial Instruments IFRS 9 Financial Instruments - clarifies which fee should be included in the 10% test for derecognition of financial liabilities.
IFRS 16 Leases IFRS 16 Leases - amendment of illustrative example 13 to remove the illustration of payments from the lessor relating to leasehold improvements, to remove any confusion about the treatment of lease incentives.
IFRS 1 First-time Adoption of International Financial Reporting Standards
IFRS I First-time Adoption of International Financial Reporting Standards - allows entities that have measured their assets and liabilities at carrying amounts recorded in their parent's books to also measure any cumulative translation differences using the amounts reported by the parent. This amendment will also apply to associates and joint ventures that have taken the same IFRS I exemption.
The Directors of the Group do not anticipate that the application of the amendments in the future will have an impact on the Group's consolidated and Company’s financial statements.
- Property, Plant and Equipment: Proceeds before intended use (Amendments to IAS 16)
The amendment to IAS 16 Property, Plant and Equipment (PP&E) prohibits an entity from deducting from the cost of an item of PP&E any proceeds received from selling items produced while the entity is preparing the asset for its intended use. It also clarifies that an entity is 'testing whether the asset is functioning properly' when it assesses the technical and physical performance of the asset. The financial performance of the asset is not relevant to this assessment.
Entities must disclose separately the amounts of proceeds and costs relating to items produced that are not an output of the entity's ordinary activities.
The Directors of the Group do not anticipate that the application of the amendments in the future will have an impact on the Group's and Company’s financial statements.
- Reference to the Conceptual Framework (Amendments to IFRS 3)
Minor amendments were made to IFRS 3 Business Combinations to update the references to the Conceptual Framework for Financial Reporting and add an exception for the recognition of liabilities and contingent liabilities within the scope of IAS 37 Provisions, Contingent Liabilities and Contingent Assets and Interpretation 21 Levies. The amendments also confirm that contingent assets should not be recognised at the acquisition date.
The Directors of the Group do not anticipate that the application of the amendments in the future will have an impact on the Group's and Company’s financial statements.
Notes to the consolidated and separate financial statementsFor the year ended 31 December 2021 (Continued)
OUR FINANCIALS (Continued)
Notes to the consolidated and separate financial statementsFor the year ended 31 December 2021 (Continued)
OUR FINANCIALS (Continued)
3. Significant accounting policies (Continued)(w) New standards, amendments and interpretations (Continued)
(ii) New and amended standards and interpretations in issue but not yet effective for the year ended 31 December 2021 (Continued)
- Classification of Liabilities as Current or Non-current (Amendments IAS 1)
The narrow-scope amendments to IAS 1 Presentation of Financial Statements clarify that liabilities are classified as either current or non-current, depending on the rights that exist at the end of the reporting period. Classification is unaffected by the expectations of the entity or events after the reporting date (eg the receipt of a waver or a breach of covenant). The amendments also clarify what IAS 1 means when it refers to the ‘settlement’ of a liability.
The amendments could affect the classification of liabilities, particularly for entities that previously considered management’s intentions to determine classification and for some liabilities that can be converted into equity.
They must be applied retrospectively in accordance with the normal requirements in IAS 8 Accounting Policies, Changes in Accounting Estimates and Errors.
- IFRS 17 Insurance Contracts
IFRS 17 Insurance Contracts sets out the requirements that an entity should apply in reporting information about insurance contracts it issues and reinsurance contracts it holds. An entity shall apply IFRS 17 Insurance Contracts to:
(a) insurance contracts, including reinsurance contracts, it issues;(b) reinsurance contracts it holds; and (c) investment contracts with discretionary participation features it issues, provided the entity also issues insurance contracts.
IFRS 17 requires an entity that issues insurance contracts to report them on the statement of financial position as the total of:
(a) the fulfilment cash flows - the current estimates of amounts that the entity expects to collect from premiums and pay out for claims, benefits and expenses, including an adjustment for the timing and risk of those amounts; and
(b) the contractual service margin - the expected profit for providing insurance coverage. The expected profit for providing insurance coverage is recognised in profit or loss over time as the insurance coverage is provided.
IFRS 17 requires an entity to recognise profits as it delivers insurance services, rather than when it receives premiums, as well as to provide information about insurance contract profits that the Company expects to recognise in the future.
IFRS 17 requires an entity to distinguish between groups of contracts expected to be profit making and groups of contracts expected to be loss making. Any expected losses arising from loss-making, or onerous, contracts are accounted for in profit or loss as soon as the Company determines that losses are expected. IFRS 17 requires the entity to update the fulfilment cash flows at each reporting date, using current estimates of the amount, timing and uncertainty of cash flows and of discount rates. The entity:
(a) accounts for changes to estimates of future cash flows from one reporting date to another either as an amount in profit or loss or as an adjustment to the expected profit for providing insurance coverage, depending on the type of change and the reason for it; and
(b) chooses where to present the effects of some changes in discount rates—either in profit or loss or in other comprehensive income.
IFRS 17 also requires disclosures to enable users of financial statements to understand the amounts recognised in the entity’s statement of financial position and statement of profit or loss and other comprehensive income, and to assess the risks the Company faces from issuing insurance contracts.
IFRS 17 replaces IFRS 4 Insurance Contracts. IFRS 17 is effective for financial periods commencing on or after 1 January 2021. An entity shall apply the standard retrospectively unless impracticable. A Company can choose to apply IFRS 17 before that date, but only if it also applies IFRS 9 Financial Instruments and IFRS 15 Revenue from Contracts with Customers.
The adoption of these changes will not affect the amounts and disclosures of the Group’s and Company’s financial statements.
Our
Gov
erna
nce
Our
Bus
ines
sO
ur F
inan
cial
s

I&M GROUP PLC (FORMERLY I&M HOLDINGS PLC) ANNUAL INTEGRATED REPORT AND FINANCIAL STATEMENTS 2021 I&M GROUP PLC (FORMERLY I&M HOLDINGS PLC) ANNUAL INTEGRATED REPORT AND FINANCIAL STATEMENTS 2021 159158
3. Significant accounting policies (Continued)(w) New standards, amendments and interpretations (Continued)
(ii) New and amended standards and interpretations in issue but not yet effective for the year ended 31 December 2021 (Continued)
- Sale or Contribution of Assets between an Investor and its Associate or Company (Amendments to IFRS 10 and IAS 28)
The amendments require the full gain to be recognised when assets transferred between an investor and its associate or Company meet the definition of a ‘business’ under IFRS 3 Business Combinations. Where the assets transferred do not meet the definition of a business, a partial gain to the extent of unrelated investors’ interests in the associate or Company is recognised. The definition of a business is key to determining the extent of the gain to be recognised.
The effective date for these changes has now been postponed until the completion of a broader review.
The adoption of these changes will not affect the amounts and disclosures of the Group’s and Company’s financial statements.
The Group did not early adopt new or amended standards in the year ended 31 December 2021.
4. Impact of COVID-19The COVID-19 pandemic and its effect on the global economy has impacted our customers, operations and Group performance. The outbreak necessitated governments to respond at unprecedented levels to protect the health of the population, local economies and livelihoods. It has affected different regions at different times and at varying degrees and there remains a risk of subsequent waves of infection. Thus the pandemic has significantly increased the estimation uncertainty in the preparation of these financial statements including:
• the extent and duration of the disruption to business arising from the actions of governments, businesses and consumers to contain the spread of the virus;
• the extent and duration of the expected economic downturn, and subsequent recovery. This includes the impacts on capital markets and liquidity, credit quality, increasing unemployment, declines in consumer spending, reductions in production, and other restructuring activities; and
• the effectiveness of governments and central banks measures to support businesses and consumers through this disruption and economic downturn.
The Group has made various accounting estimates in these financial statements based on forecasts of economic conditions which reflect expectations and assumptions as at 31 December 2021 about future events that the Directors believe are reasonable in the circumstances. There is a considerable degree of judgement involved in preparing these estimates. The underlying assumptions are also subject to uncertainties which are often outside the control of the Group. Accordingly, actual economic conditions are likely to be different from those forecast since anticipated events frequently do not occur as expected, and the effect of those differences may significantly impact accounting estimates included in these financial statements.
The significant accounting estimates impacted by these forecasts and associated uncertainties are predominantly related to expected credit losses. The impact of the COVID-19 pandemic on each of these estimates is discussed further in the relevant note of these financial statements. Readers should carefully consider these disclosures in light of the inherent uncertainty described above.
Notes to the consolidated and separate financial statementsFor the year ended 31 December 2021 (Continued)
OUR FINANCIALS (Continued)
Notes to the consolidated and separate financial statementsFor the year ended 31 December 2021 (Continued)
OUR FINANCIALS (Continued)
5. Financial risk managementThis section provides details of the group’s exposure to risk and describes the methods used by management to control risk.
Financial risk
The more significant types of risk to which the Group is exposed are credit risk, liquidity risk, market risk and operational risk. Market risk includes currency risk and interest rate risk.
(a) Credit risk
Credit risk is the risk of financial loss to the Group if a customer or counterparty to a financial instrument fails to meet its contractual obligations, and arises principally from the Group’s loans and advances to customers and other banks and investment securities. For risk management reporting purposes, the Group considers and consolidates all elements of credit risk exposure.
The Board of Directors of the individual Group entities have delegated responsibility of the management of credit risk to their respective Board Credit Committees. Further, each entity has its own and separate Credit Risk Management Committee that reports to its Board Credit Committee. The Group’s credit exposure at the reporting date from financial instruments held or issued for trading purposes is represented by the fair value of instruments with a positive fair value at that date, as recorded on the statement of financial position.
Derivative financial instruments
Credit risk arising from derivative financial instruments is, at any time, limited to those with positive fair values, as recorded on the statement of financial position. In the case of credit derivatives, the Group is also exposed to or protected from the risk of default of the underlying entity referenced by the derivative. With gross-settled derivatives, the Group is also exposed to a settlement risk, being the risk that the Group honours its obligation but the counterparty fails to deliver the counter-value.
The Group makes available to its customers guarantees which may require that the Group makes payments on their behalf and enters into commitments to extend credit lines to secure their liquidity needs. Letters of credit and guarantees (including standby letters of credit) commit the Group to make payments on behalf of customers in the event of a specific act, generally related to the import or export of goods. Such
commitments expose the Group to similar risks to loans and are mitigated by the same control processes and policies.
Credit-related commitment risks
The Board of Directors of the individual Group entities have delegated responsibility of the management of credit risk to their respective Board Credit Committees. Further, each entity has its own and separate Credit Risk Management Committee that reports to its Board Credit Committee. The Group’s credit exposure at the reporting date from financial instruments held or issued for trading purposes is represented by the fair value of instruments with a positive fair value at that date, as recorded on the statement of financial position.
The risk that the counter-parties to trading instruments might default on their obligation is monitored on an on-going basis. In monitoring credit risk exposure, consideration is given to trading instruments with a positive fair value and to the volatility of the fair value of trading instruments over their remaining life.
To manage the level of credit risk, the Group deals with counter parties of good credit standing wherever possible and when appropriate, obtains collateral.
An assessment of the extent to which fair values of collaterals cover existing credit risk exposure on loans and advances to customers is highlighted below.
The Group also monitors concentrations of credit risk that arise by industry and type of customer in relation to Group loans and advances to customers by carrying a balanced portfolio. The Group has no significant exposure to any individual customer or counter-party.
To determine impairment of loans and advances, the Group assesses whether it is probable that it will be unable to collect all principal and interest according to the contractual terms of the loans and advances.
Our
Gov
erna
nce
Our
Bus
ines
sO
ur F
inan
cial
s
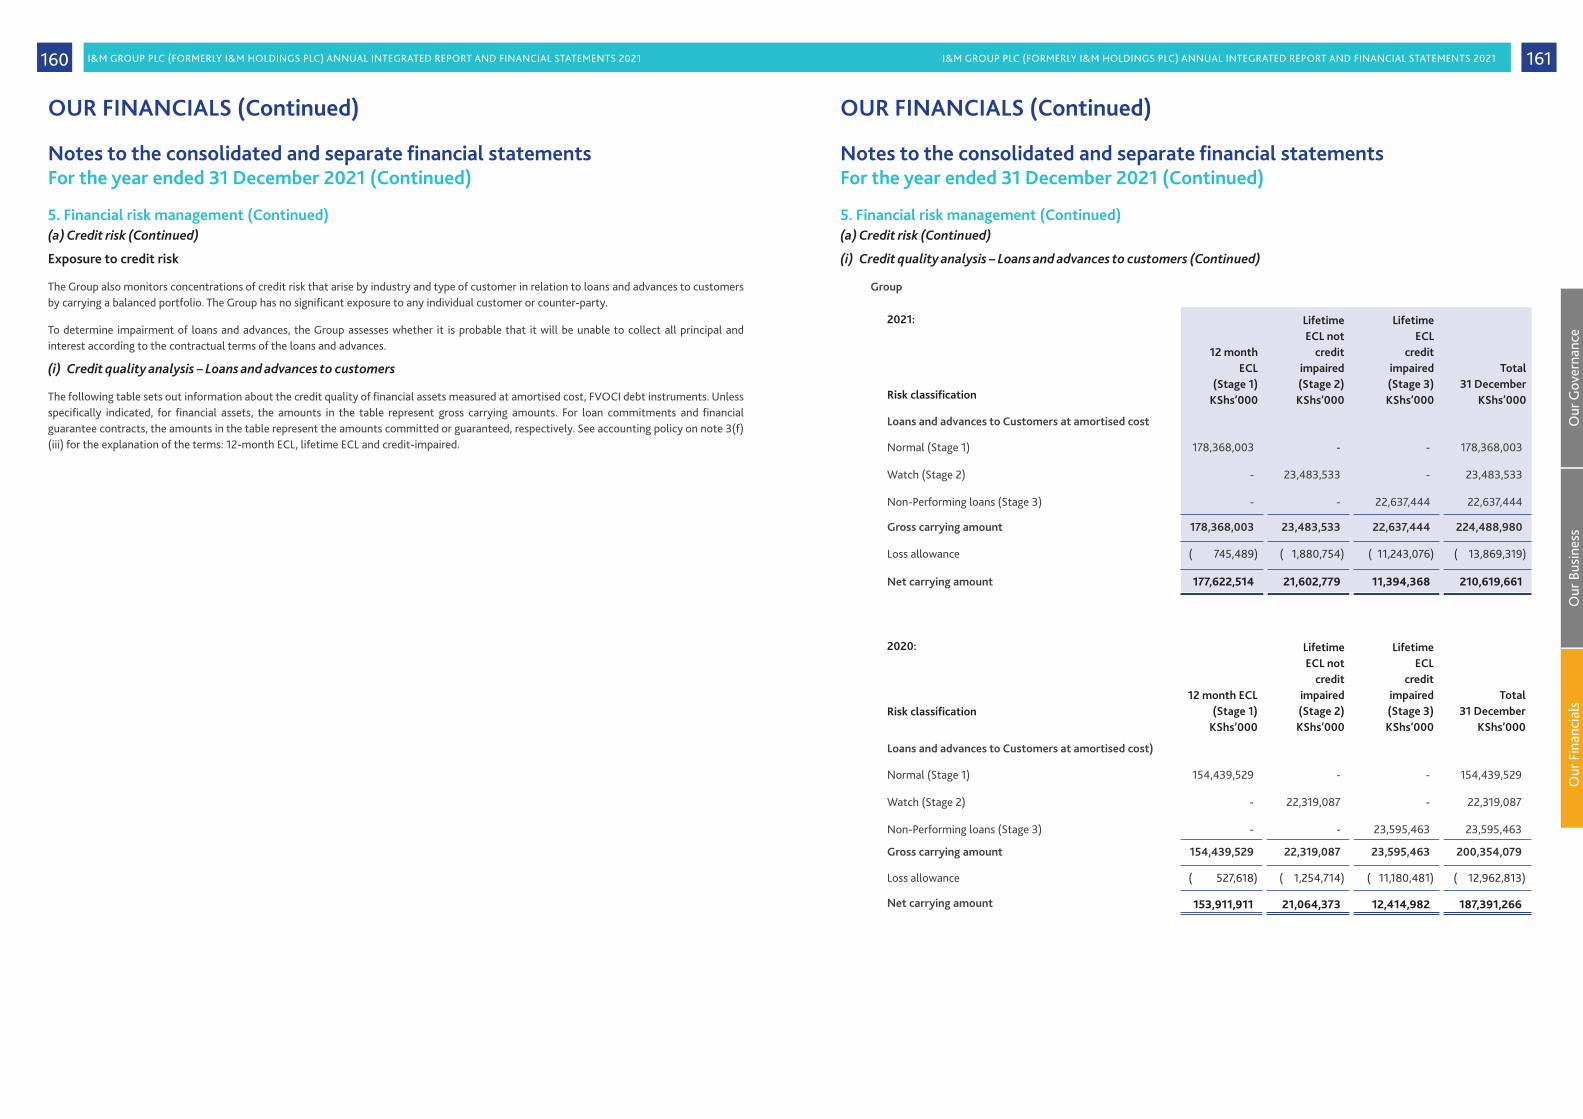
I&M GROUP PLC (FORMERLY I&M HOLDINGS PLC) ANNUAL INTEGRATED REPORT AND FINANCIAL STATEMENTS 2021 I&M GROUP PLC (FORMERLY I&M HOLDINGS PLC) ANNUAL INTEGRATED REPORT AND FINANCIAL STATEMENTS 2021 161160
5. Financial risk management (Continued)(a) Credit risk (Continued)
Exposure to credit risk
The Group also monitors concentrations of credit risk that arise by industry and type of customer in relation to loans and advances to customers by carrying a balanced portfolio. The Group has no significant exposure to any individual customer or counter-party.
To determine impairment of loans and advances, the Group assesses whether it is probable that it will be unable to collect all principal and interest according to the contractual terms of the loans and advances.
(i) Credit quality analysis – Loans and advances to customers
The following table sets out information about the credit quality of financial assets measured at amortised cost, FVOCI debt instruments. Unless specifically indicated, for financial assets, the amounts in the table represent gross carrying amounts. For loan commitments and financial guarantee contracts, the amounts in the table represent the amounts committed or guaranteed, respectively. See accounting policy on note 3(f)(iii) for the explanation of the terms: 12-month ECL, lifetime ECL and credit-impaired.
Notes to the consolidated and separate financial statementsFor the year ended 31 December 2021 (Continued)
OUR FINANCIALS (Continued)
Notes to the consolidated and separate financial statementsFor the year ended 31 December 2021 (Continued)
OUR FINANCIALS (Continued)
5. Financial risk management (Continued)(a) Credit risk (Continued)
(i) Credit quality analysis – Loans and advances to customers (Continued)
Group
2021:
12 month ECL
(Stage 1)KShs’000
Lifetime ECL not
credit impaired (Stage 2)KShs’000
LifetimeECL
credit impaired (Stage 3)KShs’000
Total31 December
KShs’000Risk classification
Loans and advances to Customers at amortised cost
Normal (Stage 1)
Watch (Stage 2)
Non-Performing loans (Stage 3)
178,368,003)
-)
-)
-)
23,483,533)
-)
-)
-)
22,637,444)
178,368,003)
23,483,533)
22,637,444)
Gross carrying amount 178,368,003) 23,483,533) 22,637,444) 224,488,980)
Loss allowance ( 745,489) ( 1,880,754) ( 11,243,076) ( 13,869,319)
Net carrying amount 177,622,514) 21,602,779) 11,394,368) 210,619,661)
2020:
12 month ECL (Stage 1)
KShs’000
LifetimeECL not
credit impaired (Stage 2)KShs’000
Lifetime ECL
credit impaired (Stage 3)KShs’000
Total31 December
KShs’000Risk classification
Loans and advances to Customers at amortised cost)
Normal (Stage 1)
Watch (Stage 2)
Non-Performing loans (Stage 3)
154,439,529)
-)
-)
-)
22,319,087)
-)
-)
-)
23,595,463)
154,439,529)
22,319,087)
23,595,463)
Gross carrying amount 154,439,529) 22,319,087) 23,595,463) 200,354,079)
Loss allowance ( 527,618) ( 1,254,714) ( 11,180,481) ( 12,962,813)
Net carrying amount 153,911,911) 21,064,373) 12,414,982) 187,391,266)
Our
Gov
erna
nce
Our
Bus
ines
sO
ur F
inan
cial
s

I&M GROUP PLC (FORMERLY I&M HOLDINGS PLC) ANNUAL INTEGRATED REPORT AND FINANCIAL STATEMENTS 2021 I&M GROUP PLC (FORMERLY I&M HOLDINGS PLC) ANNUAL INTEGRATED REPORT AND FINANCIAL STATEMENTS 2021 163162
5. Financial risk management (Continued)(a) Credit risk (Continued)(i) Credit quality analysis – Loans and advances to customers (Continued)
The following shows the grading of loans and advances to customers in line with local prudential guidelines
Group:2021
KShs’0002020
KShs’000
Loans and advances to customers
Identified impairment:
Grade 3: Substandard 1,423,884) 4,288,655)
Grade 4: Doubtful 14,906,087) 15,177,428)
Grade 5: Loss 6,307,473) 4,129,380)
22,637,444) 23,595,463)
Specific allowances for impairment ( 11,243,076) ( 11,180,481)
Carrying amounts 11,394,368) 12,414,982)
Unidentified impairment:
Grade 2: Watch 23,483,533) 22,319,087)
Grade 1: Normal 178,368,003) 154,439,529)
201,851,536) 176,758,616)
Portfolio allowances for impairment ( 2,626,243) ( 1,782,332)
Carrying amounts 199,225,293) 174,976,284)
Total carrying amounts 210,619,661) 187,391,266)
Gross Net
Identified impairment: KShs’000 KShs’000
31 December 2021
Grade 3: Substandard 1,423,884) 669,067)
Grade 4: Doubtful 14,906,087) 8,344,804)
Grade 5: Loss 6,307,473) 2,380,497)
22,637,444) 11,394,368)
31 December 2020
Grade 3: Substandard 4,288,655) 2,271,621)
Grade 4: Doubtful 15,177,428) 8,373,021)
Grade 5: Loss 4,129,380) 1,770,340)
23,595,463) 12,414,982)
Notes to the consolidated and separate financial statementsFor the year ended 31 December 2021 (Continued)
OUR FINANCIALS (Continued)
Notes to the consolidated and separate financial statementsFor the year ended 31 December 2021 (Continued)
OUR FINANCIALS (Continued)
5. Financial risk management (Continued)(a) Credit risk (Continued)(i) Credit quality analysis – Loans and advances to customers (Continued)
GrossKShs’000
NetKShs’000Unidentified impairment:
31 December 2021
Grade 1: Normal 178,368,003 177,622,514
Grade 2: Watch 23,483,533 21,602,779
201,851,536 199,225,293
31 December 2020
Grade 1: Normal 154,439,529 153,911,911
Grade 2: Watch 22,319,087 21,064,373
176,758,616 174,976,284
Impaired loans and securities
Impaired loans and securities are loans for which the Group determines that it is probable that it will be unable to collect all principal and interest due according to the contractual terms of the loan agreement(s). These loans are graded 3 (Substandard) to 5 (Loss) in the Group’s internal credit risk and grading system.
Neither past due nor impaired
The credit quality of the portfolio of loans and advances that were neither past due nor impaired can be assessed with reference to the Group’s internal rating system. All such loans must be performing in accordance with the contractual terms and are expected to continue doing so. Loans in this category are fully protected by their current sound net worth and paying capacity of the borrower. These loans and advances are categorised as normal in line with the prudential guidelines of the respective jurisdictions.
Past due but not impaired loans
These are loans where contractual interest or principal payments are past due but the Group believes that impairment is not appropriate on the basis of the level of security/collateral available and/or the stage of collection of amounts owed to the Group. These loans are stage 2 (Watch) in the Group’s internal credit risk and grading system.
(ii) Credit quality analysis – Trade receivables
The Group’s exposure to trade receivables credit risk is influenced mainly by the individual characteristics of each customer. The Group uses an allowance matrix, using the simplified approach, to measure the lifetime ECLs of trade receivables. Loss rates are calculated using a ‘roll rate’ method based on the probability of a receivable progressing through successive stages of delinquency to write-off.
2021:Gross
KShs’000Impairment
KShs’000Net
KShs’000Credit
impaired
Current 26,632 2,130 24,502 No
Past due:
30-90 days 15,395 1,992 13,403 No
91-180 days 20,349 8,519 11,830 Yes
180-360 days 58,360 39,343 19,017 Yes
Over 360 days 17,597 17,597 - Yes
138,333 69,581 68,752
Our
Gov
erna
nce
Our
Bus
ines
sO
ur F
inan
cial
s

I&M GROUP PLC (FORMERLY I&M HOLDINGS PLC) ANNUAL INTEGRATED REPORT AND FINANCIAL STATEMENTS 2021 I&M GROUP PLC (FORMERLY I&M HOLDINGS PLC) ANNUAL INTEGRATED REPORT AND FINANCIAL STATEMENTS 2021 165164
5. Financial risk management (Continued)(a) Credit risk (Continued)
(ii) Credit quality analysis – Trade receivables (Continued)
2020: GrossKShs’000
ImpairmentKShs’000
NetKShs’000
Creditimpaired
Current 57,651 4,449 53,202 No
Past due:
30-90 days 20,499 2,672 17,827 No
91-180 days 39,709 11,050 28,659 No
180-360 days 55,103 31,997 23,106 Yes
Over 360 days 7,944 7,944 - Yes
180,906 58,112 122,794
Impairment loss movement on trade receivable
2021KShs’000
2020KShs’000
At 1 January 58,103 43,119
Charge for the year 11,442 14,956
Translation difference 36 37
At 31 December 69,581 58,112
Loss rates are based on actual credit loss experience over the past three years. All trade receivables that are past due over 180 days are considered uncollectible and fully impaired. All financial assets that are contractually 90 days in arrears are automatically classified as impaired under IFRS 9. The group therefore is of the view that due to the short term nature of these instruments, the impact of economic conditions is immaterial. Consequently, the impact of forward looking information has not been taken on these financial statements.
The risk management committee has established a credit policy under which each new customer is analysed individually for creditworthiness before the Group’s standard payment and delivery terms and conditions are offered.
The Group’s review includes, if they are available; financial statements, credit agency information, industry information and in some cases references from other credible sources. Credit limits are established for each customer and reviewed frequently. Any credit exceeding those limits require approval from the risk management committee.
In addition, the Group limits its exposure to credit risk from trade receivables by establishing a maximum payment period of six months for customers. A significant part of the Group’s customers have been transacting with the larger banking group.
The Group does not require collateral in respect of trade and other receivables. The Group does not have trade receivable and contract assets for which no loss allowance is recognised because of collateral.
Notes to the consolidated and separate financial statementsFor the year ended 31 December 2021 (Continued)
OUR FINANCIALS (Continued)
Notes to the consolidated and separate financial statementsFor the year ended 31 December 2021 (Continued)
OUR FINANCIALS (Continued)
5. Financial risk management (Continued)(a) Credit risk (Continued)
(iii) Credit quality analysis – Other assets
The Group has estimated that the ECL for the following financial assets is not significant as at 31 December 2021. These financial assets have been assessed to be in Stage 1 (low credit risk). Consequently, no ECL has been recorded as at 31 December 2021
Group Company
2021KShs’000
2020KShs’000
2021KShs’000
2020KShs’000
Balances with central banks (Note 18) 21,343,955 15,412,097 - -
Items in the course of collection (Note 19) 668,114 622,994 - -
Loans and advances to banks (Note 20) 15,517,824 18,335,440 - -
Financial assets at fair value through other comprehensive income (FVOCI) - Debt instruments (Note 22)
64,010,272 42,477,252 27,019 28,392
Other financial assets at amortised cost; Government securities (Note 22) 45,087,958 47,241,831 - -
Due from group companies (Note 38 - - 834,431 446,059
146,628,123 124,089,614 861,450 474,451
(iv) Collateral and other security enhancements
The Group holds collaterals against loans and advances to customers in the form of mortgage interests over property, other registered securities over assets, and guarantees. Estimate of fair value are based on the value of collateral assessed at the time of borrowing, and generally are not updated except when a loan is individually assessed as impaired. Collateral generally is not held over loans and advances to banks, except when securities are held as part of reverse repurchase and securities borrowings activity. Collateral usually is not held against investment securities, and no such collateral was held at 31 December 2021 or 2020.
An estimate of the fair value of collateral and other security enhancements held against financial assets is shown below:
Group 2021KShs’000
2020KShs’000
Fair value of collateral held – against impaired loans 11,394,368 12,414,982
(v) Amounts arising from ECL
Inputs, assumptions and techniques used for estimating impairment
See accounting policy in Note 3(f)(iii).
Significant increase in credit risk
When determining whether the risk of default on a financial instrument has increased significantly since initial recognition, the Group considers reasonable and supportable information that is relevant and available without undue cost or effort. This includes both quantitative and qualitative information an analysis, based on the Group’s historical experience and expert credit assessment and including forward-looking information.
As a backstop, the Group considers that a significant increase in credit risk occurs no later than when an asset is more than 30 days past due. Days past due are determined by counting the number of days since the earliest elapsed due date in respect of which full payment has not been received. Due dates are determined without considering any grace period that might be available to the borrower.
Our
Gov
erna
nce
Our
Bus
ines
sO
ur F
inan
cial
s

I&M GROUP PLC (FORMERLY I&M HOLDINGS PLC) ANNUAL INTEGRATED REPORT AND FINANCIAL STATEMENTS 2021 I&M GROUP PLC (FORMERLY I&M HOLDINGS PLC) ANNUAL INTEGRATED REPORT AND FINANCIAL STATEMENTS 2021 167166
5. Financial risk management (Continued)(a) Credit risk (continued)
(v) Amounts arising from ECL (Continued)
Significant increase in credit risk (Continued)
The Group monitors the effectiveness of the criteria used to identify significant increases in credit risk by regular reviews to confirm that:
• the criteria are capable of identifying significant increases in credit risk before an exposure is in default;• the criteria do not align with the point in time when an asset becomes 30 days past due; and• there is no unwarranted volatility in loss allowance from transfers between 12-month PD (stage 1) and lifetime PD (stage 2).
Credit risk grading
Other than for loans and advances to banks and investment securities where the Group relies on internal credit rating models, the Group relies substantially on the prudential guidelines applicable in the market it operates in for credit risk grading that reflect its assessment of the probability of default of individual counterparties.
In addition, the prudential guidelines are supplemented
• by Borrower and loan specific information collected at the time of application (such as disposable income, and level of collateral for retail exposures; and turnover and industry type for wholesale exposures.
• External data such as credit bureau scoring information on individual borrowers.• Expert judgement from the Credit Risk Officer to be fed into the final credit rating for each exposure. This allows for considerations which may
not be captured as part of the other data inputs into the model.
The credit grades are calibrated such that the risk of default increases exponentially at each higher risk grade.
The following are additional considerations for each type of portfolio held by the Group:
Customer loans and advances
After the date of initial recognition, the payment behaviour of the borrower is monitored on a periodic basis to develop a behavioural score. Any other known information about the borrower which impacts their creditworthiness. A relationship manager will also incorporate any updated or new information/credit assessments into the credit system on an ongoing basis.
Generating the term structure of PD
Credit risk grades are a primary input into the determination of the term structure of PD for loans and advances. The Group collects performance and default information about its credit risk exposures analysed by country and borrower as well as by credit risk grading.
The Group employs statistical models to analyse the data collected and generate estimates of the remaining lifetime PD of exposures and how these are expected to change as a result of the passage of time.
This analysis includes the identification and calibration of relationships between changes in default rates and changes in key macro-economic factors as well as in-depth analysis of the impact of certain other factors (e.g. forbearance experience) on the risk of default. For most exposures, key macro-economic indicators include: GDP growth, benchmark interest rates and exchange rate.
Based on advice from the Risk Committees and economic experts and consideration of a variety of external actual and forecast information, the Group formulates a ‘base case’ view of the future direction of relevant economic variables as well as a representative range of other possible forecast scenarios (see discussion below on incorporation of forward-looking information). The Group then uses these forecasts to adjust its estimates of PDs.
The Group has applied a simpler methodology (lifetime ECL) for it's other exposures including lease receievables and trade receivables
Notes to the consolidated and separate financial statementsFor the year ended 31 December 2021 (Continued)
OUR FINANCIALS (Continued)
Our
Gov
erna
nce
Our
Bus
ines
sO
ur F
inan
cial
s
Notes to the consolidated and separate financial statementsFor the year ended 31 December 2021 (Continued)
OUR FINANCIALS (Continued)
5. Financial risk management (Continued)(a) Credit risk (Continued)
(v) Amounts arising from ECL (Continued)
- COVID-19 considerations for the year ended 31 December 2021
The key consideration for probability weightings in the current period is the continuing impact of COVID-19.
The Group considers these weightings in each geography to provide the best estimate of the possible loss outcomes and has analysed inter-relationships and correlations (over both the short and long term) within the Group’s credit portfolios in determining them.
In addition to the base case forecast which reflects the negative economic consequences of COVID-19, greater weighting has been applied to the downside scenario given the Group’s assessment of downside risks.
The assigned probability weightings in Kenya, Tanzania, Rwanda and Rest of world are subject to a high degree of inherent uncertainty and therefore the actual outcomes may be significantly different to those projected.
Modified financial assets
The contractual terms of a loan may be modified for a number of reasons, including changing market conditions, customer retention and other factors not related to a current or potential credit deterioration of the customer.
An existing loan whose terms have been modified may be derecognised and the renegotiated loan recognised as a new loan at fair value in accordance with the accounting policy set out in Note 3(f)(v).
When the terms of a financial asset are modified and the modification does not result in derecognition, the determination of whether the asset’s credit risk has increased significantly reflects comparison of:
• its remaining lifetime PD at the reporting date based on the modified terms; with and;• the remaining lifetime PD estimated based on data at initial recognition and the original contractual terms.
The Group renegotiates loans to customers in financial difficulties (referred to as ‘forbearance activities’) to maximise collection opportunities and minimise the risk of default. Loan forbearance is granted on a selective basis if the debtor is currently in default on its debt or if there is a high risk of default, there is evidence that the debtor made all reasonable efforts to pay under the original contractual terms and the debtor is expected to be able to meet the revised terms.
The revised terms usually include extending the maturity, changing the timing of interest payments and amending the terms of loan covenants.
Generally, forbearance is a qualitative indicator of a significant increase in credit risk and an expectation of forbearance may constitute evidence that an exposure is credit-impaired/in default. A customer needs to demonstrate consistently good payment behaviour over a period of time before the exposure is no longer considered to be credit-impaired/ in default or the PD is considered to have decresed such that the lose allowance reverts to being measured at an amount equal to 12-month ECL.
During the year, the Group has offered various forms of assistance to customers to counteract the impact of COVID-19 on the ability of customers to meet their loan obligations. The assistance provided has included arrangements such as temporary deferral of principal and interest repayments, replacing principal and interest with interest only repayments, and extension of loan maturity dates. Refer to Key Judgements and Estimates in this Note for details of the impact of deferrals when determining if there has been a Significant Increase in Credit Risk (SICR).

I&M GROUP PLC (FORMERLY I&M HOLDINGS PLC) ANNUAL INTEGRATED REPORT AND FINANCIAL STATEMENTS 2021 I&M GROUP PLC (FORMERLY I&M HOLDINGS PLC) ANNUAL INTEGRATED REPORT AND FINANCIAL STATEMENTS 2021 169168
5. Financial risk management (Continued)(a) Credit risk (Continued)
(v) Amounts arising from ECL (Continued)
Modified financial assets (Continued)
The loan repayment deferral package is considered to be a loan modification under IFRS 9. This either results in the loan being derecognised and replaced with a new loan (substantial modification) or the existing loan continuing to be recognised (non-substantial modification). The table below shows the outstanding balance as at 31 December 2021 of all loans that have been modified (both substantial and non-substantial modifications):
2021KShs’000
2020KShs’000
Assistance package category
Loan deferral package
Corporate & Institutional Banking 15,022,134 8,201,657
Business Banking 2,457,204 429,365
Premium Banking 247,053 100,164
Personal Banking 21,667 129,141
Interest only
Corporate Institutional Banking 392,377 1,586,777
Business Banking - 213,475
Premium Banking - -
Personal Banking - 16,345
Term extensions
Corporate Institutional Banking 2,474,680 14,245,720
Business Banking 1,280,961 5,539,981
Premium Banking - 1,175,221
Personal Banking 1,905,569 2,430,319
Total
Corporate Institutional Banking 17,889,191 24,034,154
Business Banking 3,738,165 6,182,821
Premium Banking 247,053 1,275,385
Personal Banking 1,927,236 2,575,805
23,801,645 34,068,165
If the terms of a financial asset are modified or an existing financial asset is replaced with a new one for either credit or commercial reasons, an assessment is made to determine if the changes to the terms of the existing financial asset are considered substantial. This assessment considers both changes in cash flows arising from the modified terms as well as changes in the overall instrument risk profile; for example, changes in the principal (credit limit), term, or type of underlying collateral. Where a modification is considered non-substantial, the existing financial asset is not derecognised and its date of origination continues to be used to determine SICR. Where a modification is considered substantial, the existing financial asset is derecognised and a new financial asset is recognised at its fair value on the modification date, which also becomes the date of origination used to determine SICR for this new asset.
Notes to the consolidated and separate financial statementsFor the year ended 31 December 2021 (Continued)
OUR FINANCIALS (Continued)
Our
Gov
erna
nce
Our
Bus
ines
sO
ur F
inan
cial
s
Notes to the consolidated and separate financial statementsFor the year ended 31 December 2021 (Continued)
OUR FINANCIALS (Continued)
5. Financial risk management (Continued)(a) Credit risk (Continued)
(v) Amounts arising from ECL (Continued)
Definition of default
The Group considers a financial asset to be in default when:
• the borrower is unlikely to pay its credit obligations to the Group in full, without recourse by the Group to actions such as realising security (if any is held); or
• the borrower is past due more than 90 days on any material credit obligation to the Group. Overdrafts are considered as being past due once the customer has breached an advised limit or been advised of a limit smaller than the current amount outstanding.
In assessing whether a borrower is in default, the Group considers indicators that are:
• qualitative – e.g. breaches of covenant;• quantitative – e.g. overdue status and non-payment on another obligation of the same issuer to the Group; and• based on data developed internally and obtained from external sources.
Inputs into the assessment of whether a financial instrument is in default and their significance may vary over time to reflect changes in circumstances.
The definition of default largely aligns with that applied by the Group for regulatory capital purposes.
Incorporation of forward-looking information
For banking subsidiaries, the Group incorporates forward-looking information into both its assessment of whether the credit risk of an instrument has increased significantly since its initial recognition and its measurement of ECL. Based on advice from the respective country Assets and Liabilities Committee (ALCO) and consideration of a variety of external actual and forecast information, the banking subsidiaries formulate a ‘base case’ view of the future direction of relevant economic variables as well as a representative range of other possible forecast scenarios. This process involves developing two additional economic scenarios and considering the relative probabilities of each outcome. External information includes economic data and forecasts published by governmental bodies and monetary authorities in the countries where the Bank operates, supranational organisations such as the International Monetary Fund (IMF), World Bank and selected private-sector and academic forecasters.
The base case represents a most-likely outcome and is aligned with information used for other purposes such as strategic planning and budgeting. The other scenarios represent more optimistic and more pessimistic outcomes. Periodically, the banking subsidiaries carry out stress testing of more extreme shocks to calibrate its determination of these other representative scenarios.
The banking subsidiaries have identified and documented key drivers of credit risk and credit losses for each portfolio of financial instruments and, using an analysis of historical data, has estimated relationships between macro-economic variables, credit risk and credit losses.
In each country, the Banking Industry non-performing loans (NPL %) was a reasonable approximation to the default risk. The correlation between the Banking Industry non-performing loans (NPL%) with the macroeconomic factors was then inferred to the Bank's predicated Probabilities of Default.
Further, in determining the economic scenarios to be applied, each of the economic variable was adjusted either upside or downside using the historical standard deviation.
- COVID-19 considerations for the year ended 31 December 2021
There have been no changes to the types of forward-looking variables (key economic drivers) used as model inputs in the current year.
As at 31 December 2021, the base case assumptions have been updated to reflect the rapidly evolving situation with respect to COVID-19. This includes an assessment of the impact of central bank policies, governments’ actions, the response of business, and institution specific responses (such as repayment deferrals). These are considered in determining the length and severity of the forecast economic downturn. The expected outcomes of key economic drivers for the base case scenario as at 31 December 2021 are described below.
In determining the likelihood of each of the macroeconomic scenarios based on sectors, weighting are applied to three scenarios; base, upside and downside.

I&M GROUP PLC (FORMERLY I&M HOLDINGS PLC) ANNUAL INTEGRATED REPORT AND FINANCIAL STATEMENTS 2021 I&M GROUP PLC (FORMERLY I&M HOLDINGS PLC) ANNUAL INTEGRATED REPORT AND FINANCIAL STATEMENTS 2021 171170
5. Financial risk management (Continued)(a) Credit risk (Continued)
(v) Amounts arising from ECL (Continued)
Incorporation of forward-looking information (Continued)
- COVID-19 considerations for the year ended 31 December 2021 (Continued)
The assessment of SICR and the calculation of ECL both incorporate forward-looking information. The Bank has performed historical analysis and identified the key economic variables impacting credit risk and expected credit losses for each portfolio. These economic variables and their associated impact on PD, EAD and LGD vary by financial instrument.
The economic scenarios used as at 31 December 2021 included the following ranges of key indicators based on sectors
Building and construction Weighting
Coefficients Base Upside Downside
91% 8% 1%
Public debt to GDP 0.14955) 54.24% 53.51% 54.97%
Deposit (1.41220) 6.35% 6.41% 6.30%
Constant 0.12088) - - -
Trade Weighting
Coefficients Base Upside Downside
91% 8% 1%
Public debt to GDP 0.14014) 54.24% 53.51% 54.97%
Deposit (0.87030) 6.35% 6.41% 6.30%
Constant 0.05072) - - -
Personal and household Weighting
Coefficients Base Upside Downside
91% 8% 1%
Deposit (1.78440) 6.35% 6.41% 6.30%
Constant 0.22005) - - -
Some sectors did not have correlations with macro-economic factors. These include: Agriculture, Building and Construction, Mining and Quarrying, Trade, Tourism Restaurant and Hotels. In view of this, management judgements were applied by taking an average of the percentage macro-adjustments from the sectors above for purposes of ECL calculation.
Other forward-looking considerations not otherwise incorporated within the above scenarios, such as the impact of any regulatory, legislative or political changes, have been considered, but are not deemed to have a material impact on therefore no adjustment has been made to the ECL for such factors. This is reviewed and monitored for appropriateness on a quarterly basis.
In determining the likelihood of each of the macroeconomic scenarios based on sectors, a weighting of 50% (base case), 25% (upside case) and 25% (downside case) was applied for Tanzania.
Notes to the consolidated and separate financial statementsFor the year ended 31 December 2021 (Continued)
OUR FINANCIALS (Continued) OUR FINANCIALS (Continued)
Notes to the consolidated and separate financial statementsFor the year ended 31 December 2021 (Continued)
5. Financial risk management (Continued)(a) Credit risk (Continued)
(v) Amounts arising from ECL (Continued)
Incorporation of forward-looking information (Continued)
Energy and Water Weighting
Coefficients Base Upside Downside
95% 3% 3%
Interbank 0.43020) 4.17% 3.18% 5.16%
Deposit 1.65410) 6.93% 6.64% 7.21%
Constant (0.13170) - - -
Transport Weighting
Coefficients Base Upside Downside
54% 12% 25%
GDP (4.51880) 5.10% 5.18% 5.02%
Public debt to GDP 0.85030) 38.92% 36.93% 40.90%
Constant 0.06960) - - -
Building and construction Weighting
Coefficients/ sensitivity
Base%
Upside%
Downside%
95% 3% 3%
Reverse REPO (1.3590) 6.17% 7.12% 2.76%
91 Day T-Bills (8.9820) 6.69% 4.63% 6.26%
Inflation (2.5400) 3.90% 7.21% 3.00%
Deposit (5.9970) 6.93% 0.17% 7.00%
Housing price index (2.3440) -0.19% - -0.54%
Constant 1.5290) - -
Personal and household Weighting
Coefficients/ sensitivity
Base%
Upside%
Downside%
95% 3% 3%
91 Day T-Bills 0.9753) 6.69% 6.26% 7.12%
Central Bank Rate (2.8373) 6.83% 7.29% 6.37%
Deposit (1.3227) 6.93% 7.21% 6.64%
Lending 0.3628) 12.09% 10.72% 13.46%
Constant 0.2508) - - -
Our
Gov
erna
nce
Our
Bus
ines
sO
ur F
inan
cial
s

I&M GROUP PLC (FORMERLY I&M HOLDINGS PLC) ANNUAL INTEGRATED REPORT AND FINANCIAL STATEMENTS 2021 I&M GROUP PLC (FORMERLY I&M HOLDINGS PLC) ANNUAL INTEGRATED REPORT AND FINANCIAL STATEMENTS 2021 173172
5. Financial risk management (Continued)(a) Credit risk (Continued)
(v) Amounts arising from ECL (Continued)
Incorporation of forward-looking information (Continued)
Real estate Weighting
Coefficients/ sensitivity
Base%
Upside%
Downside%
95% 3% 3%
Reverse REPO ( 0.1763) 6.72% 10.13% 3.32%
Central Bank Rate (2.2284) 6.83% 7.29% 6.37%
Deposit ( 2.1285) 6.93% 7.21% 6.64%
Constant 0.3948) - - -
Trade Weighting
Coefficients/ sensitivity
Base%
Upside%
Downside%
66% 33% 1%
91 Day T-Bills 1.1520) 6.69% 6.26% 7.12%
Central Bank Rate (0.9119) 6.83% 7.29% 6.37%
Deposit ( 1.1587) 6.93% 7.21% 6.64%
Public debt to GDP 0.5706) 63.00% 60.45% 65.55%
Constant (0.2361) - - -
Some sectors did not have an intuitive relationship with macro-economic factors and had weak correlations. These include: housing, transport and communication, mining and quarrying, other services, tourism, agriculture, education and hotels and restaurants. For these sectors, an average adjustment of sectors with intuitive relationship with macroeconomic factors and CC above 40% was used to adjust Historical PDs.
Other Sectors had no historical default rates and historical PDs were noted as 0%. This included education, agriculture (Stage 2) and tourism restaurant and hotels (Stage 2). In view of this, management judgements were applied by taking a minimum PD of 0.05% for purposes of ECL calculation.
In Rwanda, the backward elimination multiple regression model led to the following macro-economic factors per sector for the year ended 31 December 2021;
Sector Macro-economic factors
i) Agriculture Central Bank Rate
ii) Manufacturing Treasury bills 182 days. GDP
iii) Building and Construction Repo
iv) Tourism Restaurants and Hotels InflationPublic debt to GDP
v) Mining and Quarrying Treasury bills 91 daysTreasury bills 182 daysLending rates
vi) Personal/Households Public debt to GDP
vii) Social, Community and Personal Public debt to GDP
Notes to the consolidated and separate financial statementsFor the year ended 31 December 2021 (Continued)
OUR FINANCIALS (Continued) OUR FINANCIALS (Continued)
Notes to the consolidated and separate financial statementsFor the year ended 31 December 2021 (Continued)
5. Financial risk management (Continued)(a) Credit risk (Continued)
(v) Amounts arising from ECL (Continued)
Incorporation of forward-looking information (Continued)
With incorporation of forward looking information the followings were used as micro adjusted PDs;
2021
Macro-Economic variable Base%
Upside%
Downside%
Weighting 58.33% 16.67% 25.00%
Central Bank Rate 4.50% 5% 4%
Repo rate 4.50% 5% 4%
Reverse Repo 4.50% 5% 4%
T-Bills 91 days 6.83% 7.45% 6.20%
Lending rate 16.23% 16.91% 15.54%
GDP 7.20% 7.65% 6.75%
Inflation 5.70% 7.00% 4.40%
Public debt to GDP 77.90% 84.80% 71.00%
Measurement of ECL
The key inputs into the measurement of ECL are the term structure of the following variables:
• probability of default (PD);• loss given default (LGD);• exposure at default (EAD).
These parameters are generally derived from internally developed statistical models and other historical data. They are adjusted to reflect forward-looking information as described above.
PD estimates are estimates at a certain date, which are calculated based on statistical models, and assessed using rating tools tailored to the various categories of counterparties and exposures. These statistical models are based on internally compiled data comprising both quantitative and qualitative factors. Where it is available, market data may also be used to derive the PD for loans and advances to banks and investment securities.
LGD is the magnitude of the likely loss if there is a default. The Group estimates LGD parameters based mainly on the counterparties’ collateral and also on the history of recovery rates of claims against defaulted counterparties. The LGD models consider the structure, collateral, seniority of the claim, counterparty industry and recovery costs of any collateral that is integral to the financial asset. They are calculated on a discounted cash flow basis using the effective interest rate as the discounting factor.
Our
Gov
erna
nce
Our
Bus
ines
sO
ur F
inan
cial
s
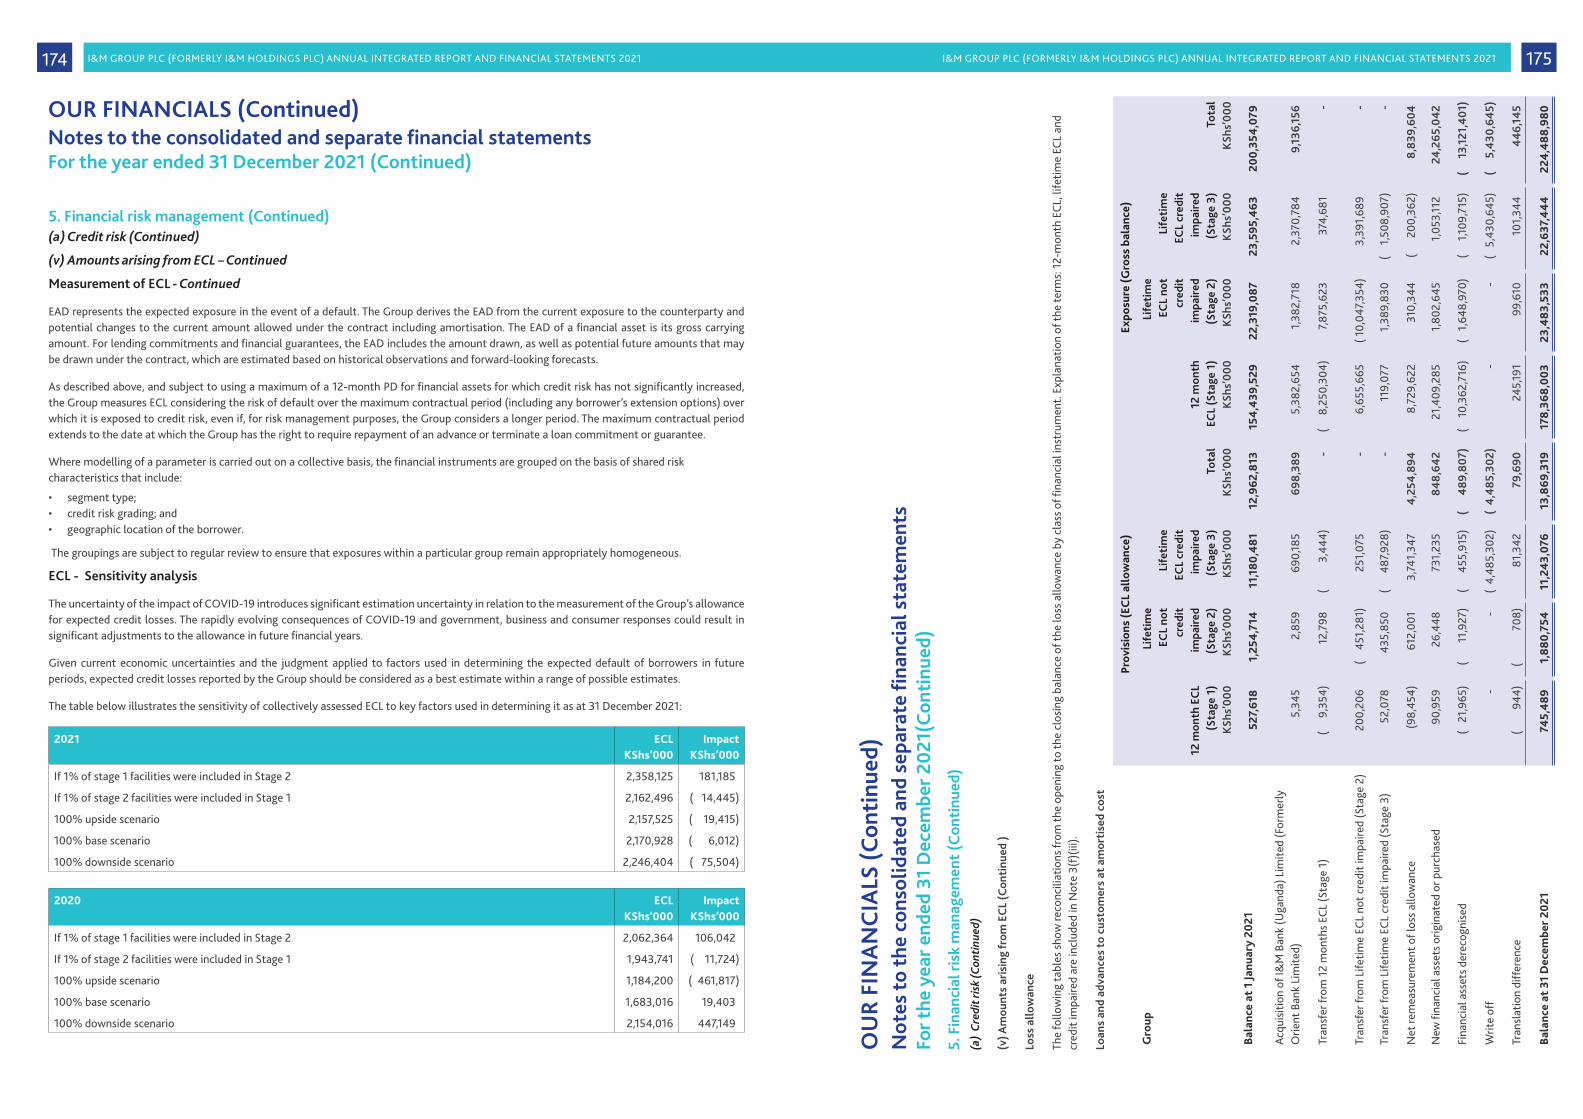
I&M GROUP PLC (FORMERLY I&M HOLDINGS PLC) ANNUAL INTEGRATED REPORT AND FINANCIAL STATEMENTS 2021 I&M GROUP PLC (FORMERLY I&M HOLDINGS PLC) ANNUAL INTEGRATED REPORT AND FINANCIAL STATEMENTS 2021 175174
5. Financial risk management (Continued)(a) Credit risk (Continued)
(v) Amounts arising from ECL – Continued
Measurement of ECL - Continued
EAD represents the expected exposure in the event of a default. The Group derives the EAD from the current exposure to the counterparty and potential changes to the current amount allowed under the contract including amortisation. The EAD of a financial asset is its gross carrying amount. For lending commitments and financial guarantees, the EAD includes the amount drawn, as well as potential future amounts that may be drawn under the contract, which are estimated based on historical observations and forward-looking forecasts.
As described above, and subject to using a maximum of a 12-month PD for financial assets for which credit risk has not significantly increased, the Group measures ECL considering the risk of default over the maximum contractual period (including any borrower’s extension options) over which it is exposed to credit risk, even if, for risk management purposes, the Group considers a longer period. The maximum contractual period extends to the date at which the Group has the right to require repayment of an advance or terminate a loan commitment or guarantee.
Where modelling of a parameter is carried out on a collective basis, the financial instruments are grouped on the basis of shared risk characteristics that include:
• segment type;• credit risk grading; and• geographic location of the borrower.
The groupings are subject to regular review to ensure that exposures within a particular group remain appropriately homogeneous.
ECL - Sensitivity analysis
The uncertainty of the impact of COVID-19 introduces significant estimation uncertainty in relation to the measurement of the Group’s allowance for expected credit losses. The rapidly evolving consequences of COVID-19 and government, business and consumer responses could result in significant adjustments to the allowance in future financial years.
Given current economic uncertainties and the judgment applied to factors used in determining the expected default of borrowers in future periods, expected credit losses reported by the Group should be considered as a best estimate within a range of possible estimates.
The table below illustrates the sensitivity of collectively assessed ECL to key factors used in determining it as at 31 December 2021:
2021 ECLKShs’000
ImpactKShs’000
If 1% of stage 1 facilities were included in Stage 2 2,358,125 181,185)
If 1% of stage 2 facilities were included in Stage 1 2,162,496 ( 14,445)
100% upside scenario 2,157,525 ( 19,415)
100% base scenario 2,170,928 ( 6,012)
100% downside scenario 2,246,404 ( 75,504)
2020 ECLKShs’000
ImpactKShs’000
If 1% of stage 1 facilities were included in Stage 2 2,062,364 106,042)
If 1% of stage 2 facilities were included in Stage 1 1,943,741 ( 11,724)
100% upside scenario 1,184,200 ( 461,817)
100% base scenario 1,683,016 19,403)
100% downside scenario 2,154,016 447,149)
Notes to the consolidated and separate financial statementsFor the year ended 31 December 2021 (Continued)
OUR FINANCIALS (Continued)
Not
es to
the
cons
olid
ated
and
sep
arat
e fin
anci
al s
tate
men
tsFo
r the
yea
r end
ed 3
1 D
ecem
ber 2
021(
Con
tinu
ed)
5. F
inan
cial
risk
man
agem
ent
(Con
tinu
ed)
(a)
Cre
dit r
isk
(Con
tinu
ed)
(v) A
mou
nts
aris
ing
from
EC
L (C
onti
nued
)
Loss
allo
wan
ce
The
follo
win
g ta
bles
sho
w re
conc
iliat
ions
from
the
open
ing
to th
e cl
osin
g ba
lanc
e of
the
loss
allo
wan
ce b
y cl
ass o
f fina
ncia
l ins
trum
ent.
Expl
anat
ion
of th
e te
rms:
12-
mon
th E
CL,
life
time
ECL
and
cred
it im
paire
d ar
e in
clud
ed in
Not
e 3(
f)(ii
i).
Loan
s an
d ad
vanc
es to
cus
tom
ers
at a
mor
tise
d co
st
Prov
isio
ns (E
CL
allo
wan
ce)
Expo
sure
(Gro
ss b
alan
ce)
Gro
up
12 m
onth
EC
L(S
tage
1)
KSh
s’00
0
Life
tim
e EC
L no
tcr
edit
impa
ired
(Sta
ge 2
)K
Shs’
000
Life
tim
eEC
L cr
edit
impa
ired
(Sta
ge 3
)K
Shs’
000
Tota
lK
Shs’
000
12 m
onth
ECL
(Sta
ge 1
)K
Shs’
000
Life
tim
eEC
L no
t cr
edit
im
paire
d(S
tage
2)
KSh
s’00
0
Life
tim
eEC
L cr
edit
impa
ired
(Sta
ge 3
)K
Shs’
000
Tota
lK
Shs’
000
Bala
nce
at 1
Janu
ary
2021
527,
618)
1,25
4,7
14)
11,1
80,4
81)
12,9
62,8
13)
154
,439
,529
)22
,319
,087
)23
,595
,463
)20
0,35
4,0
79)
Acqu
isiti
on o
f I&
M B
ank
(Uga
nda)
Lim
ited
(For
mer
ly
Orie
nt B
ank
Lim
ited)
5,34
5)2,
859)
690,
185)
698,
389)
5,38
2,65
4)1,
382,
718)
2,37
0,78
4)9,
136,
156)
Tran
sfer
from
12
mon
ths
ECL
(Sta
ge 1
)(
9,
354)
12,7
98)
(
3
,444
)-)
(
8,25
0,30
4)7,8
75,6
23)
374,
681)
-)
Tran
sfer
from
Life
time
ECL
not c
redi
t im
paire
d (S
tage
2)
200,
206)
( 4
51,2
81)
251,
075)
-)6,
655,
665)
( 10,
047,3
54)
3,39
1,68
9)-)
Tran
sfer
from
Life
time
ECL
cred
it im
paire
d (S
tage
3)
52,0
78)
435,
850)
(
487
,928
)-)
119,
077)
1,38
9,83
0)(
1,5
08,9
07)
-)
Net
rem
easu
rem
ent o
f los
s al
low
ance
(98,
454)
612,
001)
3,74
1,34
7)4,
254,
894)
8,72
9,62
2)31
0,34
4)(
2
00,3
62)
8,83
9,60
4)
New
fina
ncia
l ass
ets o
rigin
ated
or p
urch
ased
90,9
59)
26,4
48)
731,
235)
848,
642)
21,4
09,2
85)
1,80
2,64
5)1,
053,
112)
24,2
65,0
42)
Fina
ncia
l ass
ets d
erec
ogni
sed
( 2
1,96
5)(
1
1,92
7)(
4
55,9
15)
(
489
,807
)(
10,
362,
716)
( 1
,648
,970
)(
1,1
09,7
15)
(
13,1
21,4
01)
Writ
e of
f-)
-)(
4,48
5,30
2)(
4,48
5,30
2)-)
-)(
5,4
30,6
45)
(
5,43
0,64
5)
Tran
slat
ion
diff
eren
ce(
944)
(
708
)81
,342
)79
,690
)24
5,19
1)99
,610
)10
1,34
4)44
6,14
5)
Bala
nce
at 3
1 D
ecem
ber 2
021
745,
489
)1,
880,
754
)11
,24
3,07
6)13
,869
,319
)17
8,36
8,00
3)23
,483
,533
)22
,637
,44
4)
224
,488
,980
)
OU
R FI
NA
NC
IALS
(Con
tinu
ed)

I&M GROUP PLC (FORMERLY I&M HOLDINGS PLC) ANNUAL INTEGRATED REPORT AND FINANCIAL STATEMENTS 2021 I&M GROUP PLC (FORMERLY I&M HOLDINGS PLC) ANNUAL INTEGRATED REPORT AND FINANCIAL STATEMENTS 2021 177176
Not
es to
the
cons
olid
ated
and
sep
arat
e fin
anci
al s
tate
men
tsFo
r the
yea
r end
ed 3
1 D
ecem
ber 2
021
(Con
tinu
ed)
5. F
inan
cial
risk
man
agem
ent
(Con
tinu
ed)
(a)
Cre
dit r
isk
(Con
tinu
ed)
(v) A
mou
nts
aris
ing
from
EC
L (C
onti
nued
)
Loan
s an
d ad
vanc
es to
cus
tom
ers
at a
mor
tise
d co
st (C
onti
nued
)
Prov
isio
ns (E
CL
allo
wan
ce)
Expo
sure
(Gro
ss b
alan
ce)
Gro
up
12 m
onth
EC
L (S
tage
1)
KSh
s’00
0
Life
tim
eEC
L no
tcr
edit
impa
ired
(Sta
ge 2
)K
Shs’
000
Life
tim
eEC
L cr
edit
impa
ired
(Sta
ge 3
)K
Shs’
000
Tota
lK
Shs’
000
12 m
onth
ECL
(Sta
ge 1
)K
Shs’
000
Life
tim
eEC
L no
tcr
edit
impa
ired
(Sta
ge 2
)K
Shs’
000
Life
tim
eEC
L cr
edit
impa
ired
(Sta
ge 3
)K
Shs’
000
Tota
lK
Shs’
000
Bala
nce
at 1
Janu
ary
2020
283,
411
)55
0,53
6)10
,184
,692
)11
,018
,639
)14
6,18
4,7
74))
18,8
52,7
92)
21,3
10,4
99)
186,
348,
065)
Tran
sfer
from
12
mon
ths
ECL
(Sta
ge 1
)(
15,9
37)
13,6
79)
2,25
8)-)
( 1
0,48
6,51
2)9,
434,
489)
1,05
2,02
3)-)
Tran
sfer
from
Life
time
ECL
not c
redi
t im
paire
d (S
tage
2)
119,
675)
( 3
07,2
73)
187,5
98)
-)5,
002,
819)
)(
8,2
43,3
91)
3,24
0,57
2)-)
Tran
sfer
from
Life
time
ECL
cred
it im
paire
d (S
tage
3)
7,555
)1,
226,
346)
( 1
,233
,901
)-)
36,3
13))
2,84
5,99
0)(
2,88
2,30
3)-)
Net
rem
easu
rem
ent o
f los
s al
low
ance
39,4
73)
(
251,
811)
2,46
3,12
8)2,
250,
790)
9,83
7,825
))(
2
77,2
59)
1,58
2,89
1)11
,143
,457
)
New
fina
ncia
l ass
ets o
rigin
ated
or p
urch
ased
111,
208)
41,6
62)
29,4
79)
182,
349)
16,7
55,8
12))
368,
505)
34,19
2)17
,158
,509
)
Fina
ncia
l ass
ets d
erec
ogni
sed
( 20
,377
)(
2
1,83
6)(
2
05,6
12)
(
247
,825
)(
14,
096,
917)
)(
8
00,7
82)
(
524
,911
)(
15,
422,
610)
Writ
e of
f-)
-)(
32
3,00
9)(
32
3,00
9)-)
)-)
)(
3
58,2
76)
(
3
58,2
76)
Tran
slat
ion
diff
eren
ce2,
610)
3,41
1)75
,848
)81
,869
)1,
205,
415)
)13
8,74
3)14
0,77
6)1,
484,
934)
Bala
nce
at 3
1 D
ecem
ber 2
020
527,
618)
1,25
4,7
14)
11,1
80,4
81)
12,9
62,8
13)
154
,439
,529
))22
,319
,087
)23
,595
,463
)20
0,35
4,0
79)
OU
R FI
NA
NC
IALS
(Con
tinu
ed)
Not
es to
the
cons
olid
ated
and
sep
arat
e fin
anci
al s
tate
men
tsFo
r the
yea
r end
ed 3
1 D
ecem
ber 2
021
(Con
tinu
ed)
5. F
inan
cial
risk
man
agem
ent
(Con
tinu
ed)
(a)
Cre
dit r
isk
(Con
tinu
ed)
(v) A
mou
nts
aris
ing
from
EC
L (C
onti
nued
)
Loan
com
mit
men
ts a
nd fi
nanc
ial g
uara
ntee
con
trac
ts
Prov
isio
ns (E
CL
allo
wan
ce)
Expo
sure
(Gro
ss b
alan
ce)
Gro
up
12 m
onth
EC
L(S
tage
1)
KSh
s’00
0
Life
tim
eEC
L no
t cr
edit
im
paire
d(S
tage
2)
KSh
s’00
0
Life
tim
eEC
L cr
edit
impa
ired
(Sta
ge 3
)K
Shs’
000
Tota
lK
Shs’
000
12 m
onth
ECL
(Sta
ge 1
)K
Shs’
000
Life
tim
eEC
L no
t cr
edit
im
paire
d(S
tage
2)
KSh
s’00
0
Life
tim
eEC
L cr
edit
impa
ired
(Sta
ge 3
)K
Shs’
000
Tota
lK
Shs’
000
Bala
nce
at 1
Janu
ary
2021
112,
933)
61,0
57)
229,
395)
403
,385
)83
,587
,060
)3,
983,
401
)99
4,2
99)
88,5
64,7
60)
Acqu
isiti
on o
f I&
M B
ank
(Uga
nda)
Lim
ited
(For
mer
ly O
rient
Ba
nk L
imite
d)3,
006)
759)
-3,
765)
2,20
2,01
5)26
5,47
6)75
)2,
467,
566)
Tran
sfer
from
12
mon
ths
ECL
(Sta
ge 1
)2,
340)
( 2
,340
)-
-(
3
10,4
19)
190,
880)
119,
539)
-
Tran
sfer
from
Life
time
ECL
not c
redi
t im
paire
d (S
tage
2)
50,9
58)
( 50,
958)
--
3,18
2,93
0)( 3
,182,
930)
--
Tran
sfer
from
Life
time
ECL
cred
it im
paire
d (S
tage
3)
14,5
24)
-(
14,5
24)
-69
8,46
2)-
(698
,462
)-
Net
rem
easu
rem
ent o
f los
s al
low
ance
3,76
9)22
,648
)-
26,4
17)
(
803,
049)
386,
193)
1,52
1)(
4
15,3
35)
New
fina
ncia
l ass
ets o
rigin
ated
or p
urch
ased
71,8
91)
1,99
5)2,
365)
76,2
51)
18,8
36,9
85)
43,5
97)
7,992
)18
,888
,574
Fina
ncia
l ass
ets d
erec
ogni
sed
( 1
5,86
1)(
7
47)
(212
,798
)(2
29,4
06)
(12,
089,
645)
(
117,7
60)
(293
,229
)( 1
2,50
0,63
4)
Tran
slat
ion
diff
eren
ce36
4)18
1)(
1,9
98)
(
1,4
53)
228,
443)
(
4,
653)
(
2,68
3)22
1,10
7)
Bala
nce
at 3
1 D
ecem
ber 2
021
243,
924
)32
,595
)2,
44
0)27
8,95
9)95
,532
,782
)1,
564
,204
)12
9,05
2)97
,226
,038
)
OU
R FI
NA
NC
IALS
(Con
tinu
ed)
Our
Gov
erna
nce
Our
Bus
ines
sO
ur F
inan
cial
s
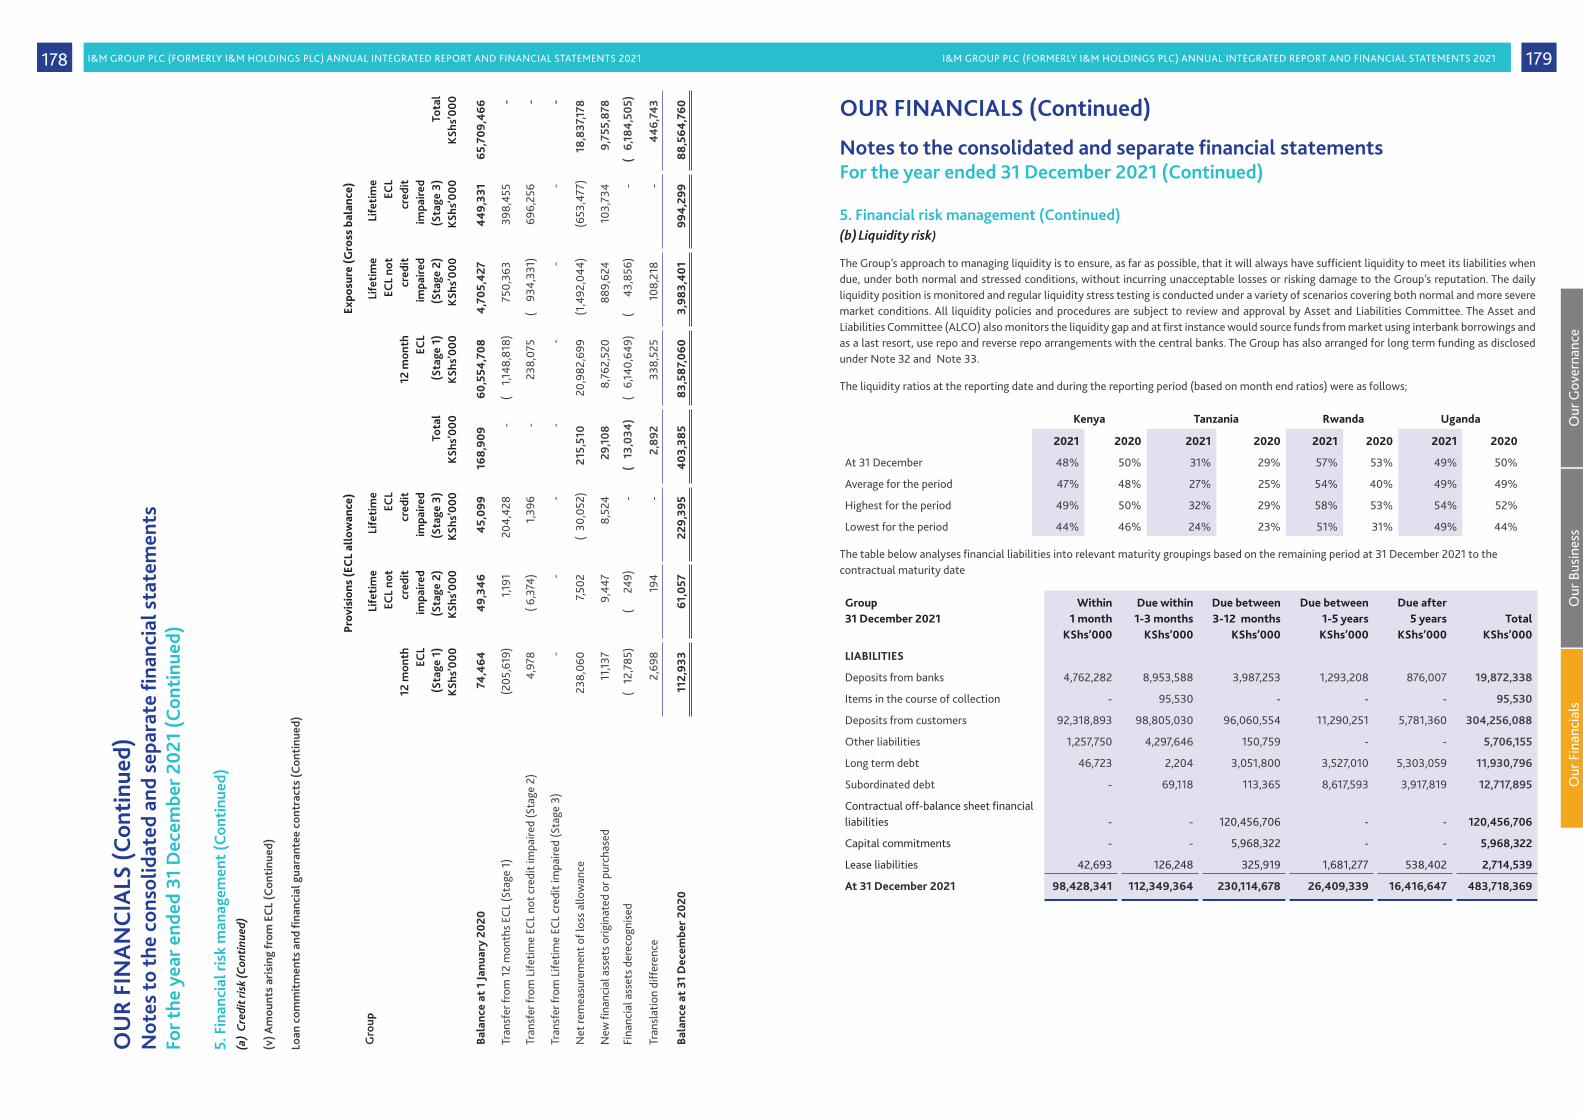
I&M GROUP PLC (FORMERLY I&M HOLDINGS PLC) ANNUAL INTEGRATED REPORT AND FINANCIAL STATEMENTS 2021 I&M GROUP PLC (FORMERLY I&M HOLDINGS PLC) ANNUAL INTEGRATED REPORT AND FINANCIAL STATEMENTS 2021 179178
Not
es to
the
cons
olid
ated
and
sep
arat
e fin
anci
al s
tate
men
tsFo
r the
yea
r end
ed 3
1 D
ecem
ber 2
021
(Con
tinu
ed)
5. F
inan
cial
risk
man
agem
ent
(Con
tinu
ed)
(a)
Cre
dit r
isk
(Con
tinu
ed)
(v) A
mou
nts
aris
ing
from
EC
L (C
onti
nued
)
Loan
com
mit
men
ts a
nd fi
nanc
ial g
uara
ntee
con
trac
ts (C
onti
nued
)
Prov
isio
ns (E
CL
allo
wan
ce)
Expo
sure
(Gro
ss b
alan
ce)
Gro
up
12 m
onth
ECL
(Sta
ge 1
)K
Shs’
000
Life
tim
eEC
L no
tcr
edit
im
paire
d(S
tage
2)
KSh
s’00
0
Life
tim
eEC
Lcr
edit
impa
ired
(Sta
ge 3
)K
Shs’
000
Tota
lK
Shs’
000
12 m
onth
EC
L(S
tage
1)
KSh
s’00
0
Life
tim
eEC
L no
tcr
edit
im
paire
d (S
tage
2)
KSh
s’00
0
Life
tim
eEC
L cr
edit
impa
ired
(Sta
ge 3
)K
Shs’
000
Tota
lK
Shs’
000
Bala
nce
at 1
Janu
ary
2020
74,4
64)
49,
346)
45,
099)
168,
909)
))60
,554
,708
)4
,705
,427
)4
49,
331)
65,7
09,4
66)
Tran
sfer
from
12
mon
ths
ECL
(Sta
ge 1
)(2
05,6
19)
1,191
)20
4,42
8)-)
)(
1,14
8,81
8)75
0,36
3)39
8,45
5)-)
Tran
sfer
from
Life
time
ECL
not c
redi
t im
paire
d (S
tage
2)
4,97
8)( 6
,374
))1,
396)
-))
238,
075)
( 9
34,3
31)
696,
256)
-)
Tran
sfer
from
Life
time
ECL
cred
it im
paire
d (S
tage
3)
-)-)
-)-)
)-)
-)-)
-)
Net
rem
easu
rem
ent o
f los
s al
low
ance
238,
060)
7,502
)(
30,0
52)
215,
510
))20
,982
,699
)(1
,492
,044
)(6
53,4
77)
18,8
37,1
78)
New
fina
ncia
l ass
ets o
rigin
ated
or p
urch
ased
11,13
7)9,
447)
8,52
4)29
,108
))8,
762,
520)
889,
624)
103,
734)
9,75
5,87
8)
Fina
ncia
l ass
ets d
erec
ogni
sed
( 1
2,78
5)(
2
49)
-)(
13,
034)
)(
6,14
0,64
9)(
4
3,85
6)-)
( 6
,184
,505
)
Tran
slat
ion
diff
eren
ce2,
698)
194)
-)2,
892
))33
8,52
5)10
8,21
8)-)
446,
743)
Bala
nce
at 3
1 D
ecem
ber 2
020
112,
933)
61,0
57)
229,
395)
403
,385
))83
,587
,060
)3,
983,
401
)99
4,2
99)
88,5
64,7
60)
OU
R FI
NA
NC
IALS
(Con
tinu
ed)
5. Financial risk management (Continued)(b) Liquidity risk)
The Group’s approach to managing liquidity is to ensure, as far as possible, that it will always have sufficient liquidity to meet its liabilities when due, under both normal and stressed conditions, without incurring unacceptable losses or risking damage to the Group’s reputation. The daily liquidity position is monitored and regular liquidity stress testing is conducted under a variety of scenarios covering both normal and more severe market conditions. All liquidity policies and procedures are subject to review and approval by Asset and Liabilities Committee. The Asset and Liabilities Committee (ALCO) also monitors the liquidity gap and at first instance would source funds from market using interbank borrowings and as a last resort, use repo and reverse repo arrangements with the central banks. The Group has also arranged for long term funding as disclosed under Note 32 and Note 33.
The liquidity ratios at the reporting date and during the reporting period (based on month end ratios) were as follows;
Kenya Tanzania Rwanda Uganda
2021 2020 2021 2020 2021 2020 2021 2020
At 31 December 48% 50% 31% 29% 57% 53% 49% 50%
Average for the period 47% 48% 27% 25% 54% 40% 49% 49%
Highest for the period 49% 50% 32% 29% 58% 53% 54% 52%
Lowest for the period 44% 46% 24% 23% 51% 31% 49% 44%
The table below analyses financial liabilities into relevant maturity groupings based on the remaining period at 31 December 2021 to the contractual maturity date
Group31 December 2021
Within1 month
KShs’000
Due within 1-3 months
KShs’000
Due between 3-12 months
KShs’000
Due between 1-5 years
KShs’000
Due after5 years
KShs’000Total
KShs’000
LIABILITIES
Deposits from banks 4,762,282 8,953,588 3,987,253 1,293,208 876,007 19,872,338
Items in the course of collection - 95,530 - - - 95,530
Deposits from customers 92,318,893 98,805,030 96,060,554 11,290,251 5,781,360 304,256,088
Other liabilities 1,257,750 4,297,646 150,759 - - 5,706,155
Long term debt 46,723 2,204 3,051,800 3,527,010 5,303,059 11,930,796
Subordinated debt - 69,118 113,365 8,617,593 3,917,819 12,717,895
Contractual off-balance sheet financial liabilities - - 120,456,706 - - 120,456,706
Capital commitments - - 5,968,322 - - 5,968,322
Lease liabilities 42,693 126,248 325,919 1,681,277 538,402 2,714,539
At 31 December 2021 98,428,341 112,349,364 230,114,678 26,409,339 16,416,647 483,718,369
Notes to the consolidated and separate financial statementsFor the year ended 31 December 2021 (Continued)
OUR FINANCIALS (Continued)
Our
Gov
erna
nce
Our
Bus
ines
sO
ur F
inan
cial
s

I&M GROUP PLC (FORMERLY I&M HOLDINGS PLC) ANNUAL INTEGRATED REPORT AND FINANCIAL STATEMENTS 2021 I&M GROUP PLC (FORMERLY I&M HOLDINGS PLC) ANNUAL INTEGRATED REPORT AND FINANCIAL STATEMENTS 2021 181180
5. Financial risk management (Continued)(b) Liquidity risk (Continued)
Group31 December 2020
Within1 month
KShs’000
Due within 1-3 months
KShs’000
Due between 3-12 months
KShs’000
Due between 1-5 years
KShs’000
Due after5 years
KShs’000Total
KShs’000
LIABILITIES
Deposits from banks 2,096,593 1,458,899 2,392,637 763,192 513,063 7,224,384
Items in the course of collection - 261,363 - - - 261,363
Deposits from customers 72,677,497 109,882,907 72,938,752 7,852,171 5,786,692 269,138,019
Other liabilities 613,365 4,707,505 167,054 - - 5,487,924
Long term debt - - 2,229,677 5,738,563 4,927,725 12,895,965
Subordinated debt - 65,412 349,746 4,970,696 - 5,385,854
Contractual off-balance sheet financial liabilities - - 98,056,514 - - 98,056,514
Capital commitments - - 5,997,153 - - 5,997,153
Leases 43,093 126,548 334,847 1,713,437 540,576 2,758,501
At 31 December 202075,430,548 116,502,634 182,466,380 21,038,059 11,768,056 407,205,677
Deposits from customers represent business transaction, personal transaction, savings, call and fixed deposit balances, which past experience has shown to be stable.
(c) Market risk
Market risk is the risk that changes in market prices, such as interest rate, equity prices, foreign exchange rates and credit spread (not relating to changes in the obligator’s/issuer’s credit standing) will affect the Group’s income or the value of its holdings of financial instruments.
All trading instruments are subject to market risk, the risk that the future changes in market conditions may make an instrument less valuable or more onerous. The Group manages its use of trading instruments in response to changing market conditions.
The Board of Directors of the individual Group entities have delegated responsibility for management of Market Risk to their respective Board Risk Committees. Exposure to market risk is formally managed within Risk Limits and Policy Guidelines issued by the Board, on recommendation of the Board Risk Committee. ALCO, a Management Committee is charged with the responsibility of ensuring implementation and monitoring of the risk management framework in line with policy guidelines. The Group is primarily exposed to Interest Rate and Foreign Exchange Risk. The policy guidelines and procedures in place are adequate to effectively manage these risks.
Exposure to interest rate risk
This is the risk of loss from fluctuations in the future cash flows of fair values of financial instruments because of a change in market interest rates. Interest rate risk is managed principally through monitoring interest rate gaps. A summary of the group’s interest rate gap position reflecting assets and liabilities at carrying amounts, categorised by the earlier of contractual re-pricing or maturity dates is shown below.
Notes to the consolidated and separate financial statementsFor the year ended 31 December 2021 (Continued)
OUR FINANCIALS (Continued)
Not
es to
the
cons
olid
ated
and
sep
arat
e fin
anci
al s
tate
men
tsFo
r the
yea
r end
ed 3
1 D
ecem
ber 2
021
(Con
tinu
ed)
5. F
inan
cial
risk
man
agem
ent
(Con
tinu
ed)
(c) M
arke
t ris
k (C
onti
nued
)Ex
posu
re to
inte
rest
rate
risk
(Con
tinu
ed)
This
is t
he ri
sk o
f los
s fr
om fl
uctu
atio
ns in
the
futu
re c
ash
flow
s of
fair
valu
es o
f fina
ncia
l ins
trum
ents
bec
ause
of a
cha
nge
in m
arke
t in
tere
st ra
tes.
Inte
rest
rate
risk
is m
anag
ed p
rinci
pally
thr
ough
m
onito
ring
inte
rest
rate
gap
s. A
sum
mar
y of
the
grou
p’s
inte
rest
rate
gap
pos
ition
refle
ctin
g as
sets
and
liab
ilitie
s at
car
ryin
g am
ount
s, c
ateg
oris
ed b
y th
e ea
rlier
of c
ontr
actu
al re
-pric
ing
or m
atur
ity
date
s is
sho
wn
belo
w
Gro
up31
Dec
embe
r 202
1W
ithi
n1
mon
thK
Shs’
000
Due
wit
hin
1-3
mon
ths
KSh
s’00
0
Due
bet
wee
n 3-
12 m
onth
sK
Shs’
000
Due
bet
wee
n 1-
5 ye
ars
KSh
s’00
0
Due
aft
er5
year
sK
Shs’
000
Non
-int
eres
t be
arin
gK
Shs’
000
Tota
lK
Shs’
000
ASS
ETS
Cas
h an
d ba
lanc
es w
ith c
entr
al b
anks
-)-
--
-27
,546
,591
27,5
46,5
91
Item
s in
the
cour
se o
f col
lect
ion
-)-
--
-66
8,11
466
8,11
4
Loan
s an
d ad
vanc
es to
ban
ks4,
733,
372)
7,003
,301
)31
5,33
8)-
-3,
465,
813
15,5
17,8
24
Loan
s an
d ad
vanc
es to
cus
tom
ers
7,772
,925
)16
4,46
3,66
2)4,
286,
798)
19,8
82,9
11)
14,0
98,9
68)
114,
397
210,
619,
661
Fina
ncia
l ass
ets
at fa
ir va
lue
thro
ugh
profi
t or l
oss
(FV
TPL)
15,5
60)
14,2
93)
423,
631)
2,48
2,47
3)13
,432
,208
)-
16,3
68,1
65
Fina
ncia
l ass
ets
mea
sure
d at
fair
valu
e th
roug
h ot
her c
ompr
ehen
sive
in
com
e (F
VO
CI)
-)3,
862,
212)
12,7
65,0
30)
8,42
5,55
5)38
,704
,743
)25
2,73
264
,010
,272
Oth
er fi
nanc
ial a
sset
s at
am
ortis
ed c
ost
329,
585)
8,28
9,46
0)11
,675
,075
)18
,347
,968
)6,
514,
622)
-45
,156
,710
Oth
er a
sset
s-)
--)
--
3,02
5,94
93,
025,
949
At
31 D
ecem
ber 2
021
12,8
51,4
42)
183,
632,
928)
29,4
65,8
72)
49,
138,
907)
72,7
50,5
41)
35,0
73,5
9638
2,91
3,28
6
LIA
BILI
TIES
Dep
osits
from
ban
ks6,
609,
067)
8,50
8,20
4)3,
415,
672)
399,
606)
-18
1,75
819
,114
,307
Item
s in
the
cour
se o
f col
lect
ion
-)-
-)-
-95
,530
95,5
30
Dep
osits
from
cus
tom
ers
84,7
58,3
57)
97,9
94,8
01)
89,2
20,16
1)4,
865,
067)
83,0
96)
19,8
25,0
2729
6,74
6,50
9
Oth
er li
abili
ties
-)79
,596
)15
0,75
9)-
-5,
370,
516)
5,60
0,87
1
Long
term
deb
t46
,368
)2,
154)
3,72
9,46
0)2,
108,
386)
3,46
7,075
163,
255)
9,51
6,69
8
Subo
rdin
ated
deb
t-)
8,92
4,81
6)3,
326)
1,101
,233
)-
-10
,029
,375
At
31 D
ecem
ber 2
021
91,4
13,7
92)
115,
509,
571)
96,5
19,3
78)
8,4
74,2
92)
3,55
0,17
1)25
,636
,086
)34
1,10
3,29
0
Inte
rest
rate
gap
(78,
562,
350)
68,1
23,3
57)
(67,
053,
506)
40,
664
,615
)69
,200
,370
)9,
437
,510
)41
,809
,996
OU
R FI
NA
NC
IALS
(Con
tinu
ed)
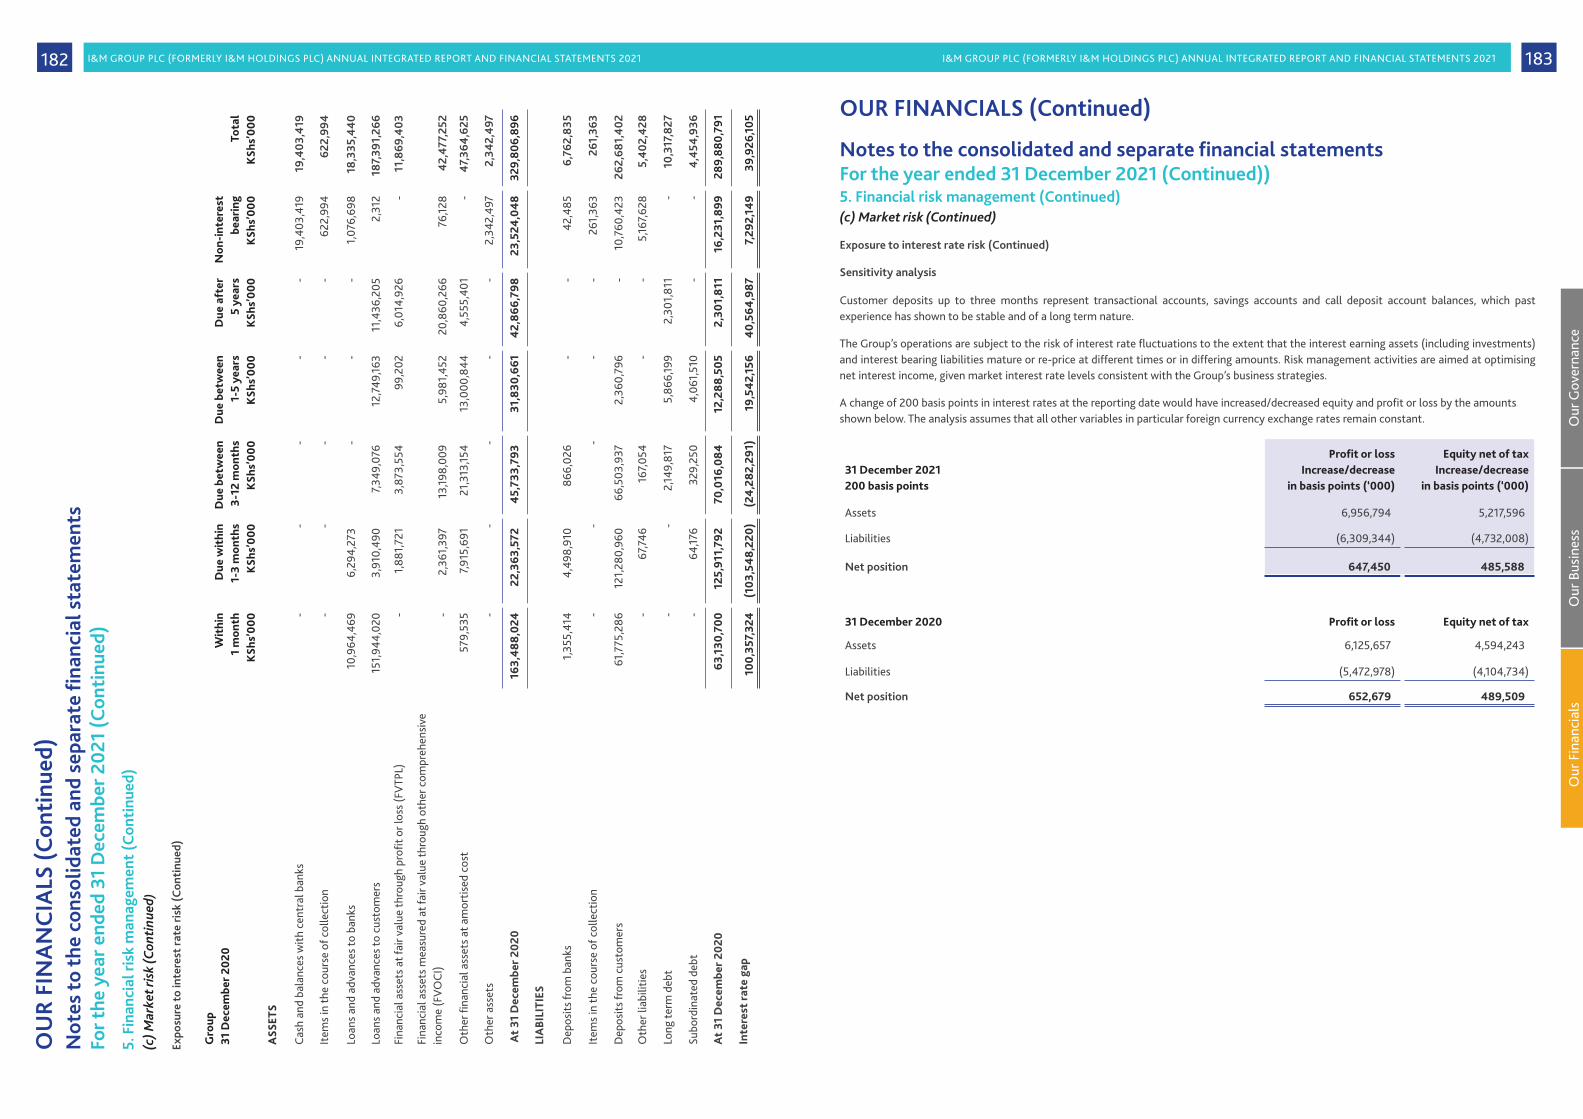
I&M GROUP PLC (FORMERLY I&M HOLDINGS PLC) ANNUAL INTEGRATED REPORT AND FINANCIAL STATEMENTS 2021 I&M GROUP PLC (FORMERLY I&M HOLDINGS PLC) ANNUAL INTEGRATED REPORT AND FINANCIAL STATEMENTS 2021 183182N
otes
to th
e co
nsol
idat
ed a
nd s
epar
ate
finan
cial
sta
tem
ents
For t
he y
ear e
nded
31
Dec
embe
r 202
1 (C
onti
nued
)5.
Fin
anci
al ri
sk m
anag
emen
t (C
onti
nued
)(c
) Mar
ket r
isk
(Con
tinu
ed)
Expo
sure
to in
tere
st ra
te ri
sk (C
onti
nued
)
Gro
up31
Dec
embe
r 202
0W
ithi
n 1
mon
thK
Shs’
000
Due
wit
hin
1-3
mon
ths
KSh
s’00
0
Due
bet
wee
n 3-
12 m
onth
sK
Shs’
000
Due
bet
wee
n 1-
5 ye
ars
KSh
s’00
0
Due
aft
er5
year
sK
Shs’
000
Non
-int
eres
t be
arin
gK
Shs’
000
Tota
lK
Shs’
000
ASS
ETS
Cas
h an
d ba
lanc
es w
ith c
entr
al b
anks
--
--
-19
,403
,419
19,4
03,4
19
Item
s in
the
cour
se o
f col
lect
ion
--
--
-62
2,99
462
2,99
4
Loan
s an
d ad
vanc
es to
ban
ks10
,964
,469
6,29
4,27
3)-
--
1,07
6,69
818
,335
,440
Loan
s an
d ad
vanc
es to
cus
tom
ers
151,
944,
020
3,91
0,49
0)7,3
49,0
76)
12,7
49,16
311
,436
,205
2,31
218
7,39
1,26
6
Fina
ncia
l ass
ets
at fa
ir va
lue
thro
ugh
profi
t or l
oss
(FV
TPL)
-1,
881,
721)
3,87
3,55
4)99
,202
6,01
4,92
6-
11,8
69,4
03
Fina
ncia
l ass
ets
mea
sure
d at
fair
valu
e th
roug
h ot
her c
ompr
ehen
sive
in
com
e (F
VO
CI)
-2,
361,
397)
13,19
8,00
9)5,
981,
452
20,8
60,2
6676
,128
42,4
77,2
52
Oth
er fi
nanc
ial a
sset
s at
am
ortis
ed c
ost
579,
535
7,915
,691
)21
,313
,154)
13,0
00,8
444,
555,
401
-47
,364
,625
Oth
er a
sset
s-
--
--
2,34
2,49
72,
342,
497
At
31 D
ecem
ber 2
020
163,
488
,024
22,3
63,5
72)
45,
733,
793)
31,8
30,6
614
2,86
6,79
823
,524
,04
832
9,80
6,89
6
LIA
BILI
TIES
Dep
osits
from
ban
ks1,
355,
414
4,49
8,91
0)86
6,02
6)-
-42
,485
6,76
2,83
5
Item
s in
the
cour
se o
f col
lect
ion
--
--
-26
1,36
326
1,36
3
Dep
osits
from
cus
tom
ers
61,7
75,2
8612
1,28
0,96
0)66
,503
,937
)2,
360,
796
-10
,760
,423
262,
681,
402
Oth
er li
abili
ties
-67
,746
)16
7,054
)-
-5,
167,6
285,
402,
428
Long
term
deb
t-
-2,
149,
817)
5,86
6,19
92,
301,
811
-10
,317
,827
Subo
rdin
ated
deb
t-
64,17
6)32
9,25
0)4,
061,
510
--
4,45
4,93
6
At
31 D
ecem
ber 2
020
63,1
30,7
0012
5,91
1,79
2)70
,016
,084
)12
,288
,505
2,30
1,81
116
,231
,899
289,
880,
791
Inte
rest
rate
gap
10
0,35
7,32
4(1
03,5
48,
220)
(24
,282
,291
)19
,54
2,15
64
0,56
4,9
877,
292,
149
39,9
26,1
05
OU
R FI
NA
NC
IALS
(Con
tinu
ed)
Customer deposits up to three months represent transactional accounts, savings accounts and call deposit account balances, which past experience has shown to be stable and of a long term nature.
The Group’s operations are subject to the risk of interest rate fluctuations to the extent that the interest earning assets (including investments) and interest bearing liabilities mature or re-price at different times or in differing amounts. Risk management activities are aimed at optimising net interest income, given market interest rate levels consistent with the Group’s business strategies.
A change of 200 basis points in interest rates at the reporting date would have increased/decreased equity and profit or loss by the amounts shown below. The analysis assumes that all other variables in particular foreign currency exchange rates remain constant.
31 December 2021200 basis points
Profit or lossIncrease/decrease
in basis points (‘000)
Equity net of taxIncrease/decrease
in basis points (‘000)
Assets 6,956,794) 5,217,596)
Liabilities (6,309,344) (4,732,008)
Net position 647,450) 485,588)
31 December 2020 Profit or loss Equity net of tax
Assets 6,125,657) 4,594,243)
Liabilities (5,472,978) (4,104,734)
Net position 652,679) 489,509)
Notes to the consolidated and separate financial statementsFor the year ended 31 December 2021 (Continued))5. Financial risk management (Continued)(c) Market risk (Continued)
Exposure to interest rate risk (Continued)
Sensitivity analysis
OUR FINANCIALS (Continued)
Our
Gov
erna
nce
Our
Bus
ines
sO
ur F
inan
cial
s

I&M GROUP PLC (FORMERLY I&M HOLDINGS PLC) ANNUAL INTEGRATED REPORT AND FINANCIAL STATEMENTS 2021 I&M GROUP PLC (FORMERLY I&M HOLDINGS PLC) ANNUAL INTEGRATED REPORT AND FINANCIAL STATEMENTS 2021 185184N
otes
to th
e co
nsol
idat
ed a
nd s
epar
ate
finan
cial
sta
tem
ents
For t
he y
ear e
nded
31
Dec
embe
r 202
1 (C
onti
nued
)5.
Fin
anci
al ri
sk m
anag
emen
t (C
onti
nued
)(c
) Mar
ket r
isk
(Con
tinu
ed)
Cur
renc
y ra
te ri
sk
The
Gro
up is
exp
osed
to c
urre
ncy
risk
thro
ugh
tran
sact
ions
in fo
reig
n cu
rren
cies
. The
Gro
up’s
tran
sact
iona
l exp
osur
e gi
ves
rise
to fo
reig
n cu
rren
cy g
ains
and
loss
es th
at a
re re
cogn
ised
in th
e pr
ofit
or lo
ss. I
n re
spec
t of m
onet
ary
asse
ts a
nd li
abili
ties
in fo
reig
n cu
rren
cies
, the
Gro
up e
nsur
es th
at it
s ne
t exp
osur
e is
kep
t to
an a
ccep
tabl
e le
vel b
y bu
ying
and
sel
ling
fore
ign
curr
enci
es a
t spo
t rat
es
whe
n co
nsid
ered
app
ropr
iate
. The
tabl
e be
low
ana
lyse
s the
cur
renc
ies
whi
ch th
e G
roup
is e
xpos
ed to
as
at 3
1 D
ecem
ber 2
021
and
31 D
ecem
ber 2
020.
Gro
up
At
31 D
ecem
ber 2
021
USD
KSh
s’00
0G
BPK
Shs’
000
EUR
KSh
s’00
0O
ther
KSh
s’00
0To
tal
KSh
s’00
0
ASS
ETS
Cas
h an
d ba
lanc
es w
ith c
entr
al b
anks
9,71
7,549
)2,
362,
062)
1,06
5,89
734
2,99
413
,488
,502
)
Item
s in
the
cour
se o
f col
lect
ion
44,2
76)
-82
5-
45,1
01)
Loan
s an
d ad
vanc
es to
ban
ks7,4
23,9
80)
8,37
7)1,1
17,0
728,
727
8,55
8,15
6)
Loan
s an
d ad
vanc
es to
cus
tom
ers
72,9
90,0
48)
3,98
8,64
8)3,
847,2
42-
80,8
25,9
38)
Oth
er fi
nanc
ial a
sset
s at
am
ortis
ed c
ost
17,9
24,7
23)
117,1
50)
87,19
05,
752
18,1
34,8
15)
Oth
er a
sset
s3,
924,
181)
13,2
53)
10,7
8718
,360
3,96
6,58
1)
At
31 D
ecem
ber 2
021
112,
024
,757
)6,
489
,490
)6,
129,
013
375,
833
125,
019,
093)
LIA
BILI
TIES
Dep
osits
from
ban
ks4,
266,
830)
18,6
15)
96,3
391,
601
4,38
3,38
5)
Item
s in
the
cour
se o
f col
lect
ion
-)-)
19,3
157
19,3
22)
Dep
osits
from
cus
tom
ers
94,2
77,6
18)
8,44
9,89
1)3,
768,
446
239,
576
106,
735,
531)
Oth
er li
abili
ties
2,86
4,26
2)19
,058
)31
9,50
129
,242
3,23
2,06
3)
Long
-ter
m d
ebt
7,666
,134)
-)-
-7,
666,
134)
Subo
rdin
ated
deb
t10
,026
,049
)-)
--
10,0
26,0
49)
At
31 D
ecem
ber 2
021
119,
100,
893)
8,4
87,5
64)
4,2
03,6
0127
0,4
2613
2,06
2,48
4)
Net
on
stat
emen
t of fi
nanc
ial p
osit
ion
(
7,07
6,13
6)(1
,998
,074
)1,
925,
412
105,
407
(
7,04
3,39
1)
Net
not
iona
l off
bal
ance
she
et p
osit
ion
519,
355)
2,00
8,62
1)2,
601,
085
32,7
225,
161,
783)
Ove
rall
net
pos
itio
n –
2021
( 6
,556
,781
)10
,54
7)4
,526
,497
138,
129
( 1
,881
,608
)
OU
R FI
NA
NC
IALS
(Con
tinu
ed)
Not
es to
the
cons
olid
ated
and
sep
arat
e fin
anci
al s
tate
men
tsFo
r the
yea
r end
ed 3
1 D
ecem
ber 2
021
(Con
tinu
ed)
5. F
inan
cial
risk
man
agem
ent
(Con
tinu
ed)
(c) M
arke
t ris
k (C
onti
nued
)
Cur
renc
y ra
te ri
sk (C
onti
nued
)
Gro
up (C
onti
nued
)
At
31 D
ecem
ber 2
020
USD
KSh
s’00
0G
BPK
Shs’
000
EUR
KSh
s’00
0O
ther
KSh
s’00
0To
tal
KSh
s’00
0
ASS
ETS
Cas
h an
d ba
lanc
es w
ith c
entr
al b
anks
7,144
,584
)5,
685,
680)
1,95
9,79
237
3,57
3)15
,163
,629
)
Item
s in
the
cour
se o
f col
lect
ion
31,2
36)
-)1,
341
-)32
,577
)
Loan
s an
d ad
vanc
es to
ban
ks5,
950,
654)
121,
450)
1,34
2,57
922
,157)
7,43
6,84
0)
Loan
s an
d ad
vanc
es to
cus
tom
ers
64,5
36,5
93)
3,63
0,88
6)4,
183,
726
13,3
23)
72,3
64,5
28)
Oth
er fi
nanc
ial a
sset
s at
am
ortis
ed c
ost
2,22
7,615
)-)
-)-)
2,22
7,61
5)
Oth
er a
sset
s1,
436,
280)
-)-)
-)1,
436,
280)
At
31 D
ecem
ber 2
020
81,3
26,9
62)
9,4
38,0
16)
7,4
87,4
384
09,0
53)
98,6
61,4
69)
LIA
BILI
TIES
Dep
osits
from
ban
ks1,1
82,8
67)
62,5
25)
56,11
27,3
69)
1,30
8,87
3)
Item
s in
the
cour
se o
f col
lect
ion
10,0
20)
9,25
5)39
,676
16,0
77)
75,0
28)
Dep
osits
from
cus
tom
ers
72,0
94,9
56)
9,90
2,32
4)3,
902,
673
308,
067)
86,2
08,0
20)
Oth
er li
abili
ties
666,
696)
17,7
44)
420,
280
45,7
52)
1,15
0,47
2)
Long
-ter
m d
ebt
8,58
3,72
1)-)
103,
698
-)8,
687,
419)
Subo
rdin
ated
deb
t4,
454,
936)
-)-)
-)4,
454,
936)
At
31 D
ecem
ber 2
020
86,9
93,1
96)
9,99
1,84
8)4
,522
,439
377,
265)
101,
884,
748)
Net
on
stat
emen
t of fi
nanc
ial p
osit
ion
( 5,
666,
234
)(
553
,832
)2,
964
,999
31,7
88)
( 3
,223
,279
)
Net
not
iona
l off
bal
ance
she
et p
osit
ion
3,70
0,4
85)
552,
608)
3,00
1,73
9(
10,
332)
7,24
4,50
0)
Ove
rall
net
pos
itio
n –
2020
( 1
,965
,74
9)(
1,2
24)
5,96
6,73
821
,456
)4,
021,
221)
OU
R FI
NA
NC
IALS
(Con
tinu
ed)

I&M GROUP PLC (FORMERLY I&M HOLDINGS PLC) ANNUAL INTEGRATED REPORT AND FINANCIAL STATEMENTS 2021 I&M GROUP PLC (FORMERLY I&M HOLDINGS PLC) ANNUAL INTEGRATED REPORT AND FINANCIAL STATEMENTS 2021 187186
5. Financial risk management (Continued)(c) Market risk (Continued)
Currency rate risk (Continued)
Sensitivity analysis
A reasonable possible strengthening or weakening of the USD, GBP, EUR against the Kenya shilling (KShs) would have affected the measurement of financial instruments denominated in foreign currency and effected equity and profit or loss by the amounts shown below. The analysis assumes that all other variables, in particular interest rates remain constant.
At 31 December 2021 Profit or lossStrengthening/weakening
of currencyKShs’000
Equity net of tax Strengthening/weakening
of currencyKShs’000
USD (± 2.5% movement) ( 163,920) (114,744)
GBP (± 2.5% movement) 264) 185)
EUR (± 2.5% movement) 113,162) 79,213)
At 31 December 2020 Profit or lossStrengthening/weakening
of currencyKShs’000
Equity net of taxStrengthening/weakening
of currencyKShs’000
USD (± 2.5% movement) ( 49,144) ( 36,858)
GBP (± 2.5% movement) ( 31) ( 23)
EUR (± 2.5% movement) 149,168) 111,876)
(d) Capital management
The Group’s policy is to maintain a strong capital base so as to maintain regulatory, investor, creditor and market confidence and to sustain future development of business. The impact of the level of capital of shareholders’ return is also recognized in addition to recognizing the need to maintain a balance between the higher returns that may be possible with greater gearing and the advantages and security afforded by sound capital position.
Regulatory capital – Kenya
The Central Bank of Kenya sets and monitors capital requirements for all banks.
The objective of the Central Bank of Kenya is to ensure that a bank maintains a level of capital which:
• Is adequate to protect its depositors and creditors; • Is commensurate with the risks associated with its activities and profile • Promotes public confidence in the bank.
In implementing current capital requirements, the Central Bank of Kenya requires banks to maintain a prescribed ratio of total capital to total risk-weighted assets. Banks are expected to assess the Credit risk, Market risk and the Operational risk of the risk weighted assets to derive the ratios. The Capital adequacy and use of regulatory capital are monitored regularly by management employing techniques based on the guidelines developed by the Basel Committee, as implemented by the Central Bank of Kenya for supervisory purposes.
Notes to the consolidated and separate financial statementsFor the year ended 31 December 2021 (Continued)
OUR FINANCIALS (Continued)
Our
Gov
erna
nce
Our
Bus
ines
sO
ur F
inan
cial
s
Notes to the consolidated and separate financial statementsFor the year ended 31 December 2021 (Continued)
OUR FINANCIALS (Continued)
5. Financial risk management (Continued)(d) Capital management (Continued)
Regulatory capital – Kenya (Continued)
The Central Bank of Kenya requires a bank to maintain at all times:
• The minimum level of regulatory capital of KShs 1 billion.• A core capital of not less than 10.5% of total risk weighted assets, plus risk weighted off-balance sheet items. • A core capital of not less than 10.5% of its total deposit liabilities.• A total capital of not less than 14.5% of its total risk weighted assets, plus risk weighted off-balance sheet items.
I&M Bank LIMITED’s regulatory capital is analysed into two tiers:
• Tier 1 capital. This includes ordinary share capital, share premium, retained earnings and after deduction of investment in subsidiaries, goodwill, other intangible assets and other regulatory adjustments relating to items that are included in equity which are treated differently for capital adequacy purposes.
• Tier 2 capital. This includes 25% of revaluation reserves of property, subordinated debt not exceeding 50% of core capital, collective impairment allowances and any other approved reserves.
The risk based approach to capital adequacy measurement is applied to both on and off balance sheet items. Risk weights are assigned based on an assessment of the following:
• Credit risk arising from the possibility of losses associated with reduction of credit quality of borrowers or counterparties;• Market risk is the risk of losses arising from movements in market prices pertaining to interest rate related instruments and foreign
exchange risk;• Operational risk is the risk of loss resulting from inadequate or failed internal processes, people and systems or from external events.

I&M GROUP PLC (FORMERLY I&M HOLDINGS PLC) ANNUAL INTEGRATED REPORT AND FINANCIAL STATEMENTS 2021 I&M GROUP PLC (FORMERLY I&M HOLDINGS PLC) ANNUAL INTEGRATED REPORT AND FINANCIAL STATEMENTS 2021 189188
5. Financial risk management (Continued)(d) Capital management (Continued)
Regulatory capital – Kenya (Continued)
The regulatory capital position for I&M Bank LIMITED being the Kenyan banking subsidiary was as follows:
2021KShs’000
2020KShs’000
Core capital (Tier 1)
Share capital 2,980,000) 2,980,000)
Share premium 5,531,267) 5,531,267)
Retained earnings 32,937,303) 36,447,470)
41,448,570) 44,958,737)
Less: Deferred tax (66,019) -)
Less: Investment in subsidiary ( 3,057,585) ( 2,750,653)
Total Core capital 38,324,966) 42,208,084)
Supplementary capital (Tier 2)
Term subordinated debt 7,778,208) 2,546,106)
Statutory loan loss reserve 6,747,297) 4,580,387)
14,525,505) 7,126,493)
Total capital 52,850,471) 49,334,577)
Risk weighted assets
Credit risk weighted assets 195,827,487) 181,977,999)
Market risk weighted assets 17,800,488) 12,306,196)
Operational risk weighted assets 33,513,810) 29,691,747)
Total risk weighted assets 247,141,785) 223,975,942)
Deposits from customers 232,110,990) 219,831,712)
Capital ratios Minimum*
Core capital/Total deposit liabilities 8.0% 16.51% 19.20%
Core capital /Total risk weighted assets 10.5% 15.51% 18.84%
Total capital /Total risk weighted assets 14.5% 21.38% 22.03%
* As defined by the Central Bank of Kenya
Notes to the consolidated and separate financial statementsFor the year ended 31 December 2021 (Continued)
OUR FINANCIALS (Continued)
Our
Gov
erna
nce
Our
Bus
ines
sO
ur F
inan
cial
s
Notes to the consolidated and separate financial statementsFor the year ended 31 December 2021 (Continued)
OUR FINANCIALS (Continued)
5. Financial risk management (Continued)(d) Capital management (Continued)
Regulatory capital – Tanzania
The Bank of Tanzania sets and monitors capital requirements for the banking industry as a whole. The Bank of Tanzania has set among other measures, the rules and ratios to monitor adequacy of a bank’s capital. In implementing current capital requirements, The Bank of Tanzania requires banks to maintain a prescribed ratio of total capital to total risk-weighted assets. The Bank’s regulatory capital is analysed in two tiers:
• Tier 1 capital, which includes ordinary share capital, share premium, retained earnings, after deductions for prepaid expenses, goodwill, other intangible assets, and other regulatory adjustments relating to items that are included in equity but are treated differently for capital adequacy purposes.
• Tier 2 capital, which includes qualifying subordinated liabilities, collective impairment allowances and the element of fair value reserve relating to unrealised gains on equity instruments classified as available for sale.
Various limits are applied to elements of the capital base such as qualifying Tier 2 Capital cannot exceed Tier 1 Capital and qualifying subordinated debt may not exceed 50 percent of Tier 1 Capital. There are also restrictions on the amount of collective impairment allowances that may be included as part of Tier 2 Capital. Tier 1 Capital (Core capital) is also subjected to various limits such as Tier 1 Capital should not be less than 10 percent of the risk weighted assets and premises investments should not exceed 50 percent of the Core capital and movable assets should not exceed 20% of Core capital.
The Bank’s policy is to maintain a strong capital base so as to maintain investor, creditor and market confidence and to sustain future development of business. The impact of the level of capital of shareholders’ return is also recognized in addition to recognizing the need to maintain a balance between the higher returns that may be possible with greater gearing and the advantages and security afforded by sound capital position.

I&M GROUP PLC (FORMERLY I&M HOLDINGS PLC) ANNUAL INTEGRATED REPORT AND FINANCIAL STATEMENTS 2021 I&M GROUP PLC (FORMERLY I&M HOLDINGS PLC) ANNUAL INTEGRATED REPORT AND FINANCIAL STATEMENTS 2021 191190
5. Financial risk management (Continued)(d) Capital management (Continued)
Regulatory capital – Tanzania ( Continued)
2021TZS’000
2020TZS’000
Core capital (Tier 1)
Share capital 23,192,000) 16,202,000)
Share premium 18,090,228) 18,090,228)
Retained earnings 40,288,096) 29,788,752)
81,570,324) 64,080,980)
Less: Prepaid expenses ( 1,743,051) ( 1,902,527)
Deferred tax asset ( 6,898,287) ( 7,211,017)
Intangible assets -) -)
Total Core capital 72,928,986) 54,967,436)
Supplementary capital (Tier 2)
Term subordinated debt -) 930,400)
General provisions in equity 15,820,613) 19,294,170)
Fair value reserve 253,891) 248,938)
16,074,504) 20,473,508)
Total capital 89,003,490) 75,440,944)
Risk weighted assets
On balance sheet 350,105,298) 316,632,102)
Off balance sheet 56,124,462) 50,713,528 )
Capital charge for market risk 48,111,594) 890,274)
Operational risk weighted assets 861,975) 30,156,410)
Total risk weighted assets 455,203,329) 398,392,314)
Capital ratios Minimum*
Core capital /Total risk weighted assets 10.0% 16.02% 13.80%
Total capital /Total risk weighted assets 12.0% 19.55% 18.94%
* As defined by the Bank of Tanzania
The minimum level of regulatory capital is TZS 15 billion
Notes to the consolidated and separate financial statementsFor the year ended 31 December 2021 (Continued)
OUR FINANCIALS (Continued)
Notes to the consolidated and separate financial statementsFor the year ended 31 December 2021 (Continued)
OUR FINANCIALS (Continued)
5. Financial risk management (Continued)(d) Capital management (Continued)
Regulatory capital – Rwanda
The Bank’s objectives when managing capital, which is a broader concept than the “equity” on the balance sheet, are:
• To comply with the capital requirements set by the National Bank of Rwanda; • To safeguard the Bank’s ability to continue as a going concern, so that it can continue to provide returns for shareholders and benefits for
other stakeholders; • To maintain a strong capital base to support the development of its business.
The National Bank of Rwanda (BNR) sets and monitors capital requirements for the banking industry as a whole. In implementing its current capital requirements, BNR, requires Banks in Rwanda to maintain a prescribed ratio of total capital to total risk-weighted assets.
The Bank’s regulatory capital consists only of Tier 1 capital, which includes ordinary share capital, retained earnings, revaluation reserves and statutory reserves. The Bank’s policy is to maintain a strong capital base so as to maintain investor, creditor and market confidence and to sustain future development of the business. The impact of the level of capital on shareholders’ return is also recognized and the Bank recognizes the need to maintain a balance between the higher returns that might be possible with greater gearing and the advantages and security afforded by a sound capital position.
2021Frw’000
2020Fwr’000
Core capital (Tier 1)
Share capital 15,150,000)) 12,120,000)
Share premium 6,249,832)) 6,249,832)
Retained earnings 38,335,411)) 32,968,671)
59,735,243)) 51,338,503)
Less: Other reserves 606,828)) 249,453)
Intangible assets ( 2,943,460)) ( 3,814,403)
Total Core capital (Tier 1 Capital) 57,398,611)) 47,773,553)
Supplementary capital
Revaluation reserves 4,433,435)) 3,660,400)
Term subordinated debt 4,038,471)) 5,834,850)
8,471,906)) 9,495,250)
Total capital (Tier 2 Capital) 65,870,517)) 57,268,803)
Total risk weighted assets 317,436,863)) 296,639,446)
Capital ratios Minimum*
Core capital /Total risk weighted assets 10.0% 18.08%) 16.10%
Total capital /Total risk weighted assets 15.0% 20.75%) 19.31%
* As defined by the Bank of Rwanda
The minimum level of regulatory capital is Rwf 5 billion.
Our
Gov
erna
nce
Our
Bus
ines
sO
ur F
inan
cial
s

I&M GROUP PLC (FORMERLY I&M HOLDINGS PLC) ANNUAL INTEGRATED REPORT AND FINANCIAL STATEMENTS 2021 I&M GROUP PLC (FORMERLY I&M HOLDINGS PLC) ANNUAL INTEGRATED REPORT AND FINANCIAL STATEMENTS 2021 193192
5. Financial risk management (Continued)(d) Capital management (Continued)
Regulatory capital – Uganda
The Bank’s objectives when managing capital, which is a broader concept than the ‘equity’ on the face of the statement of financial position, are:
• To comply with the capital requirements set by the Central Bank;• To safeguard the Bank’s ability to continue as a going concern so that it can continue to provide returns for shareholders and benefits for
other stakeholders; and• To maintain a strong capital base to support the development of its business.
Capital adequacy and the use of regulatory capital are monitored daily by the Bank’s management, employing techniques based on the guidelines developed by the Basel Committee, as implemented by the Bank of Uganda (the Authority), for supervisory purposes. The required information is filed with the Authority on a quarterly basis.
The Financial Institutions (Capital Buffers) Regulations 2020 were issued in 2020 which will increase the Bank’s minimum capital requirement from 10% and 12% to 12.5% and 14.5% for core and total capital respectively effective 31 December 2021.
The regulatory capital requirements are strictly observed when managing economic capital. The Bank’s regulatory capital is managed by its Bank Treasury and comprises two tiers:
• Tier 1 capital: permanent shareholder’s equity, share premium, prior years’ retained profits, net after tax profits current year to date (50% only), general reserves, less goodwill and other intangible assets, current year losses, investment in unconsolidated subsidiaries, deficiencies in provisions for losses, prohibited loans to insiders and other deductions determined by Central Bank
• Tier 2 capital: Revaluation reserves on fixed assets, unencumbered general provisions for losses, hybrid capital instruments and others and subordinated term debt.
The risk-weighted assets are measured by means of a hierarchy of four risk weights classified according to the nature of and reflecting an estimate of the credit risk associated with each asset and counterparty. A similar treatment is adopted for off-balance sheet exposure, with some adjustments to reflect the more contingent nature of the potential losses.
The table below summarises the composition of regulatory capital and the ratios of the Bank for the years ended 31 December 2021 and 2020. During those two years, the Bank complied with all of the externally imposed capital requirements to which it is subject.
I&M Bank (Uganda) Limited was prudent in taking specific provisions on loans and advances as per Bank of Uganda prudential guidelines on credit classification regulations, 2005, which resulted into breach of Capital adequacy requirements as at 31 December 2020. However, the Directors prior to the breach had notified the shareholders, who took the remedial steps to arrest the breach through a resolution, dated 28 December 2020 committing to injection of Capital of Ushs 14,700,000,000.
Notes to the consolidated and separate financial statementsFor the year ended 31 December 2021 (Continued)
OUR FINANCIALS (Continued)
Notes to the consolidated and separate financial statementsFor the year ended 31 December 2021 (Continued)
OUR FINANCIALS (Continued)
5. Financial risk management (Continued)(d) Capital management (Continued)
Regulatory capital – Uganda (Continued)
The funds were subsequently received within the time lines stipulated by Bank of Uganda (forty five days from date of breach) as per the Financial Institution's Act, 2004 as amended in 2016, section 86, which corrected the breach.
2021Ushs’000
2020Ushs’000
Core capital (Tier 1)
Share capital 132,000,000) 96,750,000)
Retained earnings ( 28,612,072) ( 24,716,375)
103,387,928) 72,033,625)
Less: Intangible assets ( 1,773,227) ( 3,043,717)
Deferred income tax asset ( 60,227,771) ( 43,114,532)
Unrealised foreign exchange gains 626,881) ( 33,455)
Investment in subsidiary -) ( 80,000)
Total Core capital (Tier 1 Capital) 42,013,811) 25,761,921)
Supplementary capital
Revaluation reserves -) 1,195,445)
General provisions 2,492,904) 3,355,707)
2,492,904) 4,551,152)
Total capital (Tier 2 Capital) 44,506,715) 30,313,073)
Risk weighted assets:
On-balance sheet 257,331,779) 283,655,899)
Off-balance sheet 26,936,185) 46,355,332)
Market risk 9,704,985) 5,118,023)
Total risk weighted assets 293,972,949) 335,129,254)
Capital ratios Minimum*
Core capital /Total risk weighted assets 12.5% 14.29% ) 7.69% )
Total capital /Total risk weighted assets 14.5% 15.14% 9.05% )
* As defined by the Bank of Uganda
Our
Gov
erna
nce
Our
Bus
ines
sO
ur F
inan
cial
s

I&M GROUP PLC (FORMERLY I&M HOLDINGS PLC) ANNUAL INTEGRATED REPORT AND FINANCIAL STATEMENTS 2021 I&M GROUP PLC (FORMERLY I&M HOLDINGS PLC) ANNUAL INTEGRATED REPORT AND FINANCIAL STATEMENTS 2021 195194
5. Financial risk management (Continued)(d) Capital management (Continued)
Regulatory capital – Mauritius
Under the BASEL II methodology, Bank of Mauritius has issued guidelines for the measurement of Credit Risk, Market Risk and Operational Risk. The minimum required capital as set by the Bank of Mauritius, under BASEL II guidelines, is a capital to Risk Weighted Assets of 10%.
The Bank’s capital management policy is to provide sufficient capital for the banking business to achieve its strategic objectives, taking into account the regulatory, economic and commercial environment in which it operates. The capital adequacy framework is supported by a Board approved Internal Capital Adequacy Assessment Process (ICAAP), which encompasses capital planning for current and future periods, taking into consideration strategic focus and business plan and assessment of all material risks under stress conditions.
The Bank’s objectives when managing capital are:
• To comply to the capital requirements set by the regulator;• To safeguard the Bank’s ability to continue its business as a going concern;• To maximize returns to shareholders and optimize the benefits to stakeholders;• To maintain a strong capital base to support the development of its business.
The Bank’s eligible capital as managed by the Bank’s management is divided into two tiers:
• Core capital or Tier 1 Capital: Comprising Share capital, profit and loss, and reserves created by appropriations of retained earnings. The book value of goodwill and other intangible assets is deducted in arriving at core capital; and
• Supplementary capital or Tier 2 Capital: Qualifying perpetual and term subordinated debts, collectively assessed impairment allowances, regulatory reserve, and fair value gains arising on revaluation of holdings of land and buildings and available-for sale equities and debt securities. Investment in subsidiaries, significant investments in non-subsidiary companies and shares, and investments in other banks’ equity are deducted 50 % from Tier-1 capital and 50% from supplementary capital to arrive at the eligible capital.
Capital Adequacy and the use of eligible capital are monitored regularly by Management, employing techniques based on the guidelines developed by the Basel Committee, as implemented by Bank of Mauritius for supervisory purposes. The required information is submitted to the Bank of Mauritius on a quarterly basis.
The ratio of its capital to aggregate risk weighted assets being the Capital Adequacy Ratio as at 31 December 2021 was 20.89% (2020 - 19.81%) .
Notes to the consolidated and separate financial statementsFor the year ended 31 December 2021 (Continued)
OUR FINANCIALS (Continued) OUR FINANCIALS (Continued)
6. Use of estimates and judgementKey sources of estimation uncertainty
(a) Expected credit losses
The measurement of the expected credit loss allowance for financial assets measured at amortised cost and FVOCI debt instruments is an area that requires the use of complex models and significant assumptions about future economic conditions and credit behaviour (e.g. the likelihood of customers defaulting and the resulting losses). Explanation of the inputs, assumptions and estimation techniques used in measuring ECL is further detailed in Note 3(f)(iii) which also sets out key sensitivities of the ECL to changes in these elements.
A number of significant judgements are also required in applying the accounting requirements for measuring ECL, such as:
• Determining criteria for significant increase in credit risk; • Choosing appropriate models and assumptions for the measurement of ECL; • Establishing the number and relative weightings of forward-looking scenarios for each type of product/market and the associated ECL; and • Establishing groups of similar financial assets for the purposes of measuring ECL.
(b) Income taxes
Significant estimates are required in determining the liability for income taxes. There are many transactions and calculations for which the ultimate tax determination is uncertain during the ordinary course of business. Where the final tax outcome is different from the amounts that were initially recorded, such differences will impact the income tax balances and deferred tax liability in the period in which such determination is made.
(c) Property and equipment
Property and equipment is depreciated over its useful life taking into account residual values, where appropriate. The actual lives of the assets and residual values are assessed annually and may vary depending on a number of factors. In reassessing asset lives, factors such as technological innovation, product life cycles and maintenance programs are taken into account which involves extensive subjective judgment. Residual value assessments consider issues such as future market conditions, the remaining life of the asset and projected disposal values. The rates used are set out under accounting policy Note 3(i).
(d) Impairment of goodwill
The Group tests annually whether goodwill has suffered any impairment, in accordance with the accounting policy 3(j)(ii) and computed in Note 26(a). The recoverable amounts of cash-generating units have been determined based on value-in-use calculations.
(e) Lease term
The Group makes judgement on whether it is reasonably certain that it will exercise extension options.
(f) Critical accounting judgements in applying the Group’s accounting policies
Critical accounting judgements made in applying the Group’s accounting policies include financial asset and liability classification. The Group’s accounting policies provide scope for assets and liabilities to be designated at inception into different accounting categories in certain circumstances.
In classifying financial assets as held to maturity, the Group has determined that it has both positive intention and ability to hold the assets until their maturity date as required by the group’s accounting policies
Notes to the consolidated and separate financial statementsFor the year ended 31 December 2021 (Continued)
Our
Gov
erna
nce
Our
Bus
ines
sO
ur F
inan
cial
s

I&M GROUP PLC (FORMERLY I&M HOLDINGS PLC) ANNUAL INTEGRATED REPORT AND FINANCIAL STATEMENTS 2021 I&M GROUP PLC (FORMERLY I&M HOLDINGS PLC) ANNUAL INTEGRATED REPORT AND FINANCIAL STATEMENTS 2021 197196N
otes
to th
e co
nsol
idat
ed a
nd s
epar
ate
finan
cial
sta
tem
ents
For t
he y
ear e
nded
31
Dec
embe
r 202
1 (C
onti
nued
)7.
Fai
r val
ue h
eira
rchy
for a
sset
s ca
rrie
d at
fair
val
ueA
ccou
ntin
g cl
assi
ficat
ions
and
fair
val
ues
The
tabl
es b
elow
sho
w th
e ca
rryi
ng a
mou
nts
and
fair
valu
es o
f ass
ets
and
liabi
litie
s, in
clud
ing
thei
r lev
els
in th
e fa
ir va
lue
hier
arch
y. It
doe
s no
t inc
lude
fair
valu
e in
form
atio
n fo
r fina
ncia
l ass
ets
and
finan
cial
liab
ilitie
s no
t mea
sure
d at
fair
valu
e if
the
carr
ying
am
ount
is a
reas
onab
le a
ppro
xim
atio
n of
fair
valu
e.
Acc
ount
ing
clas
sific
atio
ns a
t car
ryin
g am
ount
s and
fair
val
ues
Gro
up31
Dec
embe
r 202
1C
arry
ing
amou
nts
Fair
val
ue
Non
fi
nanc
ial
asse
tK
Shs‘
000
Fina
ncia
l as
sets
at
amor
tise
d co
stK
Shs‘
000
Fina
ncia
l as
sets
at
FVO
CI
KSh
s‘00
0
Fina
ncia
l as
sets
at
FVTP
LK
Shs‘
000
Oth
er
fina
ncia
l lia
bilit
ies
at
amor
tise
d co
stK
Shs‘
000
Tota
lK
Shs‘
000
Leve
l 1K
Shs‘
000
Leve
l 2K
Shs‘
000
Leve
l 3
KSh
s‘00
0To
tal
KSh
s‘00
0
Cas
h an
d ba
lanc
es w
ith c
entr
al b
anks
-
27,5
46,5
91-
--
27,5
46,
591
--
--
Item
s in
the
cour
se o
f col
lect
ion
-66
8,11
4-
--
668,
114
--
--
Loan
s an
d ad
vanc
es to
ban
ks-
15,5
17,8
24-
--
15,5
17,8
24-
--
-
Loan
s an
d ad
vanc
es to
cus
tom
ers
-21
0,61
9,66
1-
--
210,
619,
661
--
--
Fina
ncia
l ass
ets
at fa
ir va
lue
thro
ugh
profi
t or l
oss
(FV
TPL)
--
-16
,368
,165
-16
,368
,165
16,3
68,16
5-
-16
,368
,165
Fina
ncia
l ass
ets
mea
sure
d at
fair
valu
e th
roug
h ot
her c
ompr
ehen
sive
inco
me
(FV
OC
I)-
-64
,010
,272
--
64,0
10,2
7263
,533
,858
-47
6,41
464
,010
,272
Oth
er fi
nanc
ial a
sset
s at
am
ortis
ed c
ost
-45
,156,
710
--
-4
5,15
6,71
045
,087
,958
--
45,0
87,9
58
Prop
erty
and
equ
ipm
ent:B
uild
ings
7,352
,451
--
--
7,35
2,4
51-
7,352
,451
-7,3
52,4
51
Oth
er a
sset
s-
3,02
5,94
9-
--
3,02
5,94
9-
--
-
7,35
2,4
5130
2,53
4,8
49
64,0
10,2
7216
,368
,165
-39
0,26
5,73
712
4,9
89,9
817,
352,
451
476
,414
132,
818,
846
Dep
osits
from
ban
ks-
--
-19
,114,
307
19,1
14,3
07-
--
-
Item
s in
cou
rse
of c
olle
ctio
n-
--
-95
,530
95,5
30-
--
-
Dep
osits
from
cus
tom
ers
--
--
296,
746,
509
296,
746,
509
--
--
Oth
er li
abili
ties
--
--
5,60
0,87
15,
600,
871
--
--
Long
term
deb
t-
--
-9,
516,
698
9,51
6,69
8-
--
-
Subo
rdin
ated
deb
t-
--
-10
,029
,375
10,0
29,3
75-
--
-
-
--
-34
1,10
3,29
034
1,10
3,29
0-
--
-
OU
R FI
NA
NC
IALS
(Con
tinu
ed)
Not
es to
the
cons
olid
ated
and
sep
arat
e fin
anci
al s
tate
men
tsFo
r the
yea
r end
ed 3
1 D
ecem
ber 2
021
(Con
tinu
ed)
7. F
air v
alue
hei
rarc
hy fo
r ass
ets
carr
ied
at fa
ir v
alue
(Con
tinu
ed)
Acc
ount
ing
clas
sific
atio
ns a
t car
ryin
g am
ount
s and
fair
val
ues (
Cont
inue
d)
Gro
up31
Dec
embe
r 202
0C
arry
ing
amou
nts
Fair
val
ue
Non
fi
nanc
ial
asse
tK
Shs‘
000
Fina
ncia
l as
sets
at
amor
tise
d co
stK
Shs‘
000
Fina
ncia
l as
sets
at
FVO
CI
KSh
s‘00
0
Fina
ncia
l as
sets
at
FVTP
LK
Shs‘
000
Oth
er
fina
ncia
l lia
bilit
ies
at
amor
tise
d co
stK
Shs‘
000
Tota
lK
Shs‘
000
Leve
l 1K
Shs‘
000
Leve
l 2K
Shs‘
000
Leve
l 3
KSh
s‘00
0To
tal
KSh
s‘00
0
Cas
h an
d ba
lanc
es w
ith c
entr
al b
anks
-
19,4
03,4
19-
-19
,403
,419
--
--
Item
s in
the
cour
se o
f col
lect
ion
-62
2,99
4-
--
622,
994
--
--
Loan
s an
d ad
vanc
es to
ban
ks-
18,3
35,4
40-
--
18,3
35,4
40
--
--
Loan
s an
d ad
vanc
es to
cus
tom
ers
-18
7,391
,266
--
-18
7,39
1,26
6-
--
-
Fina
ncia
l ass
ets
at fa
ir va
lue
thro
ugh
profi
t or l
oss
(FV
TPL)
--
-11
,869
,403
-11
,869
,403
11,8
69,4
03-
-11
,869
,403
Fina
ncia
l ass
ets
mea
sure
d at
fair
valu
e th
roug
h ot
her c
ompr
ehen
sive
inco
me
(FV
OC
I)-
-42
,477
,252
--
42,
477
,252
42,0
28,3
95-
448,
857
42,4
77,2
52
Oth
er fi
nanc
ial a
sset
s at
am
ortis
ed c
ost
-47
,364
,625
--
-4
7,36
4,6
2547
,241
,831
--
47,2
41,8
31
Prop
erty
and
equ
ipm
ent:B
uild
ings
4,48
7,375
--
-4
,487
,375
-4,
487,3
75-
4,48
7,37
5
Oth
er a
sset
s-
2,34
2,49
7-
--
2,34
2,4
97-
--
-
4
,487
,375
275,
460
,24
14
2,4
77,2
5211
,869
,403
-33
4,2
94,2
7110
1,13
9,62
94
,487
,375
44
8,85
710
6,07
5,86
1
Dep
osits
from
ban
ks-
--
-6,
762,
835
6,76
2,83
5-
--
-
Item
s in
cou
rse
of c
olle
ctio
n-
--
-26
1,36
326
1,36
3-
--
-
Dep
osits
from
cus
tom
ers
--
--
262,
681,
402
262,
681,
402
--
--
Due
to g
roup
com
pani
es-
--
-5,
402,
428
5,4
02,4
28-
--
-
Long
term
bor
row
ings
--
--
10,3
17,8
2710
,317
,827
--
--
Subo
rdin
ated
deb
t-
--
-4,
454,
936
4,4
54,9
36-
--
-
--
--
289
,880
,791
289,
880,
791
--
--
OU
R FI
NA
NC
IALS
(Con
tinu
ed)

I&M GROUP PLC (FORMERLY I&M HOLDINGS PLC) ANNUAL INTEGRATED REPORT AND FINANCIAL STATEMENTS 2021 I&M GROUP PLC (FORMERLY I&M HOLDINGS PLC) ANNUAL INTEGRATED REPORT AND FINANCIAL STATEMENTS 2021 199198
Not
es to
the
cons
olid
ated
and
sep
arat
e fin
anci
al s
tate
men
tsFo
r the
yea
r end
ed 3
1 D
ecem
ber 2
021
(Con
tinu
ed)
7. F
air v
alue
hei
rarc
hy fo
r ass
ets
carr
ied
at fa
ir v
alue
(Con
tinu
ed)
Acc
ount
ing
clas
sific
atio
ns a
t car
ryin
g am
ount
s and
fair
val
ues (
Cont
inue
d)
Com
pany
Car
ryin
g am
ount
sFa
ir v
alue
31 D
ecem
ber 2
021
Fina
ncia
las
sets
at
amor
tise
dco
stK
Shs‘
000
Fina
ncia
l as
sets
at
FVO
CI
KSh
s‘00
0
Oth
er
fina
ncia
l lia
bilit
ies
at
amor
tise
d co
stK
Shs‘
000
Tota
lK
Shs‘
000
Leve
l 1K
Shs‘
000
Leve
l 3K
Shs‘
000
Tota
lK
Shs‘
000
Fina
ncia
l ass
ets
Fina
ncia
l ass
ets
mea
sure
d at
fair
valu
e th
roug
h ot
her c
ompr
ehen
sive
inco
me
(FV
OC
I)-
27,0
19-
27,0
1927
,019
-27
,019
Due
from
gro
up c
ompa
nies
834,
431
--
834
,431
--
-
Oth
er a
sset
s22
9,78
6-
-22
9,78
6-
--
1,
064
,217
27,0
19-
1,09
1,23
627
,019
-27
,019
Fina
ncia
l lia
bilit
ies
Due
to g
roup
com
pani
es-
-1,
931,
640
1,93
1,64
0-
--
Oth
er li
abili
ties
--
97,4
2397
,423
--
-
-
-2,
029,
063
2,02
9,06
3-
--
OU
R FI
NA
NC
IALS
(Con
tinu
ed)
Not
es to
the
cons
olid
ated
and
sep
arat
e fin
anci
al s
tate
men
tsFo
r the
yea
r end
ed 3
1 D
ecem
ber 2
021
(Con
tinu
ed)
7. F
air v
alue
hei
rarc
hy fo
r ass
ets
carr
ied
at fa
ir v
alue
(Con
tinu
ed)
Acc
ount
ing
clas
sific
atio
ns a
t car
ryin
g am
ount
s and
fair
val
ues (
Cont
inue
d)
Com
pany
Car
ryin
g am
ount
sFa
ir v
alue
31 D
ecem
ber 2
020
Fina
ncia
las
sets
at
amor
tise
d co
stK
Shs‘
000
Fina
ncia
l as
sets
at
FVO
CI
KSh
s‘00
0
Oth
er
fina
ncia
l lia
bilit
ies
at
amor
tise
d co
stK
Shs‘
000
Tota
lK
Shs‘
000
Leve
l 1K
Shs‘
000
Leve
l 3K
Shs‘
000
Tota
lK
Shs‘
000
Fina
ncia
l ass
ets
Fina
ncia
l ass
ets
mea
sure
d at
fair
valu
e th
roug
h ot
her c
ompr
ehen
sive
inco
me
(FV
OC
I)-
28,3
92-
28,3
9228
,392
-28
,392
Due
from
gro
up c
ompa
nies
446,
059
--
44
6,05
9-
--
Oth
er a
sset
s4,
124
--
4,1
24-
--
4
50,1
8328
,392
-4
78,5
7528
,392
-28
,392
Fina
ncia
l lia
bilit
ies
Due
to g
roup
com
pani
es-
-1,
881,
272
1,88
1,27
2-
--
Oth
er li
abili
ties
--
84,3
2484
,324
--
-
-
-1,
965,
596
1,96
5,59
6-
--
Mea
sure
men
t of f
air v
alue
s
(i) V
alua
tion
tech
niqu
es a
nd si
gnifi
cant
uno
bser
vabl
e in
puts
Fina
ncia
l ass
ets
mea
sure
d at
fair
valu
e - A
t 31
Dec
embe
r 202
1 an
d 31
Dec
embe
r 202
0
Type
Val
uati
on te
chni
que
Sign
ifica
nt u
nobs
erva
ble
inpu
tsIn
ter-
rela
tion
ship
bet
wee
n si
gnifi
cant
un
obse
rvab
le in
puts
and
fair
val
ue m
easu
rem
ent
Inve
stm
ent s
ecur
ities
– F
air V
alue
thro
ugh
Oth
er
Com
preh
ensi
ve In
com
ePr
ices
quo
ted
in a
n ac
tive
mar
ket
Non
eN
ot a
pplic
able
OU
R FI
NA
NC
IALS
(Con
tinu
ed)
Our
Gov
erna
nce
Our
Bus
ines
sO
ur F
inan
cial
s

I&M GROUP PLC (FORMERLY I&M HOLDINGS PLC) ANNUAL INTEGRATED REPORT AND FINANCIAL STATEMENTS 2021 I&M GROUP PLC (FORMERLY I&M HOLDINGS PLC) ANNUAL INTEGRATED REPORT AND FINANCIAL STATEMENTS 2021 201200
Not
es to
the
cons
olid
ated
and
sep
arat
e fin
anci
al s
tate
men
tsFo
r the
yea
r end
ed 3
1 D
ecem
ber 2
021
(Con
tinu
ed)
8. O
pera
ting
seg
men
tsTh
e G
roup
ope
ratio
ns a
re w
ithin
five
geo
grap
hica
l seg
men
ts, K
enya
, Tan
zani
a, R
wan
da, U
gand
a an
d M
aurit
ius.
The
tabl
e be
low
con
tain
s seg
men
tal i
nfor
mat
ion
for t
he y
ear e
nded
31
Dec
embe
r 202
1.
Keny
aTa
nzan
iaR
wan
daM
auri
tius
Uga
nda
Elim
inat
ion
Tota
l
KSh
s’00
0K
Shs’
000
KSh
s’00
0K
Shs’
000
KSh
s’00
0K
Shs’
000
KSh
s’00
0
2021
Net
inte
rest
inco
me
15,7
57,4
95)
1,50
9,03
3)2,
946,
533)
-)66
3,83
3)-)
20,8
76,8
94)
Net
fee
com
mis
sion
and
oth
er in
com
e6,
892,
473)
478,
328)
720,
175)
-)38
0,71
7)(
202,
099)
8,26
9,59
4)
Ope
rati
ng in
com
e22
,64
9,96
8)1,
987,
361)
3,66
6,70
8)-)
1,04
4,5
50)
(
202
,099
)29
,14
6,4
88)
Ope
ratin
g ex
pens
es(
7
,238
,187)
(
1,06
4,55
1)(
1,8
94,3
76)
(
15,
830)
(
861
,604
)14
,647
)(
11,
059,
901)
Dep
reci
atio
n an
d A
mor
tisat
ion
(
1,3
31,3
01)
(
17
6,82
8)(
381,1
92)
-)(
1
33,6
49)
-)(
2,0
22,9
70)
Net
impa
irmen
t los
ses o
n lo
ans
and
adva
nces
(
3,11
3,28
9)(
2
54,5
53)
(
186
,895
)-)
(
644,
864)
-)(
4
,199
,601
)
Ope
rati
ng e
xpen
ses
( 1
1,68
2,77
7)(
1,4
95,9
32)
( 2,
462
,463
)(
15
,830
)(
1,6
40,
117)
14,6
47)
( 1
7,28
2,4
72)
Resu
lts f
rom
join
t ven
ture
-)-)
-)54
8,89
0)-)
-)54
8,89
0)
Profi
t be
fore
tax
10,9
67,1
91)
491
,429
)1,
204
,24
5)53
3,06
0)(
59
5,56
7)(
187,
452
)12
,412
,906
)
Profi
t af
ter t
ax7,
402
,568
)33
6,83
8)1,
005,
300)
533,
059)
(
372,
279)
(
28
1,55
0)8,
623,
936)
Loan
s an
d ad
vanc
es to
cus
tom
ers
168,
945,
534
)17
,413
,506
)24
,260
,621
)-)
-)-)
210,
619,
661)
Dep
osit
s fr
om c
usto
mer
s24
6,27
8,28
8)21
,404
,04
8)29
,064
,173
)-)
-)-)
296,
746,
509)
Tota
l ass
ets
347,1
55,7
15)
28,8
55,3
93)
50,5
49,
818)
4,8
17,5
45)
22,6
15,6
50)
(38,
813,
44
4)
415
,180
,677
)
Tota
l lia
bilit
ies
254
,880
,391
)24
,016
,267
)4
3,76
4,9
69)
7,33
6)19
,317
,684
)(
8
54,0
47)
341,
132,
600)
Cap
ital
exp
endi
ture
1,26
7,81
8)10
0,24
6)69
3,95
0)-)
139,
424
)-)
2,20
1,4
38)
OU
R FI
NA
NC
IALS
(Con
tinu
ed)
Not
es to
the
cons
olid
ated
and
sep
arat
e fin
anci
al s
tate
men
tsFo
r the
yea
r end
ed 3
1 D
ecem
ber 2
021
(Con
tinu
ed)
8. O
pera
ting
seg
men
ts (C
onti
nued
)
Keny
aTa
nzan
iaR
wan
daM
auri
tius
Uga
nda
Elim
inat
ion
Tota
l
KSh
s’00
0K
Shs’
000
KSh
s’00
0K
Shs’
000
KSh
s’00
0K
Shs’
000
KSh
s’00
0
2020
Net
inte
rest
inco
me
11,8
64,2
20)
1,29
0,45
9)2,
444,
916)
-)-)
-)15
,599
,595
)
Net
fee
com
mis
sion
and
oth
er in
com
e7,0
01,4
71)
417,2
17)
957,5
95)
-)6,
970)
(
73,13
9)8,
310,
114
)
Ope
rati
ng in
com
e18
,865
,691
)1,
707,
676)
3,4
02,5
11)
-)6,
970)
(
7
3,13
9)23
,909
,709
)
Ope
ratin
g ex
pens
es(
5
,694
,512
)(
910,
269)
(
1,60
4,41
9)(
8,0
87)
( 3,
072)
(
5
9,68
2)(
8,
280,
041)
Dep
reci
atio
n an
d A
mor
tisat
ion
(
1,
027,2
97)
(
15
9,42
4)(
339
,131)
-)(1
4)-)
(
1,5
25,8
66)
Net
impa
irmen
t los
ses o
n lo
ans
and
adva
nces
(
1,6
16,6
46)
(
25
2,28
3)(
6
03,9
07)
-)-)
-)(
2,
472
,836
)
Ope
rati
ng e
xpen
ses
(
8,33
8,4
55)
( 1
,321
,976
)(
2,5
47,
457
)(
8,08
7)(3
,086
)(
59,
682)
( 1
2,27
8,74
3)
Resu
lts f
rom
join
t ven
ture
-)-)
-)(
67
8,96
2)-)
-)(
678
,962
)
Profi
t be
fore
tax
10,5
27,2
36)
385,
700)
855,
054
)(
687
,04
9)3,
884
)(
132,
821)
10,9
52,0
04)
Profi
t af
ter t
ax8,
488
,500
)27
4,6
31)
560,
678)
( 6
87,0
48)
2,71
8)(
2
26,9
21)
8,4
12,5
58)
Loan
s an
d ad
vanc
es to
cus
tom
ers
149,
675,
064
)15
,101
,900
)22
,614
,302
)-)
-)-)
187,
391,
266)
Dep
osit
s fr
om c
usto
mer
s21
8,15
2,86
4)
17,1
53,2
94)
27,3
75,2
44
)-)
-)-)
262,
681,
402
)
Tota
l ass
ets
317,
738,
409
)24
,192
,273
)4
5,79
4,5
44
)4
,687
,258
)9,
377)
(34
,322
,068
)35
8,09
9,79
3)
Tota
l lia
bilit
ies
230,
653,
849)
20,2
06,5
50)
39,7
91,7
12)
3,33
2)1,
674
)(
6
20,4
63)
290,
036,
654
)
Cap
ital
exp
endi
ture
2,07
3,4
51)
120,
645)
1,00
2,71
0)-)
-)-)
3,19
6,80
6)
OU
R FI
NA
NC
IALS
(Con
tinu
ed)
Our
Gov
erna
nce
Our
Bus
ines
sO
ur F
inan
cial
s

I&M GROUP PLC (FORMERLY I&M HOLDINGS PLC) ANNUAL INTEGRATED REPORT AND FINANCIAL STATEMENTS 2021 I&M GROUP PLC (FORMERLY I&M HOLDINGS PLC) ANNUAL INTEGRATED REPORT AND FINANCIAL STATEMENTS 2021 203202
9.Interest incomeGroup Company
2021KShs’000
2020KShs’000
2021KShs’000
2020KShs’000
Loans and advances to customers 23,769,022 21,885,324 - -
Loans and advances to banks 231,501 364,446 33,963 26,139
Investment securities:-
- At amortised cost 4,234,596 3,346,508 - -
- FVOCI - Debt instruments 4,846,349 2,252,297 3,028 3,036
33,081,468 27,848,575 36,991 29,175
10. Interest expense
Group Company
2021KShs’000
2020KShs’000
2021KShs’000
2020KShs’000
Deposits from customers 10,256,364 10,552,655 - -
Deposits from banks 961,451 860,925 - -
Long term debt 434,967 390,107 - -
Subordinated debt 427,850 297,423 - -
Lease liabilities (Note 31) 123,942 147,870 - -
12,204,574 12,248,980 - -
11.Net fee and commission income
Group Company
2021KShs’000
2020KShs’000
2021KShs’000
2020KShs’000
Fee and commission income - -
Commissions 3,612,857) 3,080,687) - -
Service fees 1,263,369) 1,089,616) - -
4,876,226) 4,170,303) - -
Fee and commission expense
Interbank transaction fees ( 143,589) ( 76,152) - -
Other ( 322,437) ( 251,487) - -
( 466,026) ( 327,639) - -
Net fee and commission income 4,410,200) 3,842,664) - -
Notes to the consolidated and separate financial statementsFor the year ended 31 December 2021 (Continued)
OUR FINANCIALS (Continued) OUR FINANCIALS (Continued)
Notes to the consolidated and separate financial statementsFor the year ended 31 December 2021 (Continued)
12. Net trading income
Group Company
2021KShs’000
2020KShs’000
2021KShs’000
2020KShs’000
Foreign exchange income 1,732,746 1,883,939 - -
Net income on financial assets at fair value through profit or loss (FVTPL) 1,634,349 1,986,392 - -
3,367,095 3,870,331 - -
13. Other operating incomeGroup Company
2021KShs’000
2020KShs’000
2021KShs’000
2020KShs’000
Rental income 320,647 299,157 - -
Profit on sale of property and equipment 17,595 4,470 - -
Other income 154,057 293,492 2,817 318
Dividend income - - 6,778,527 3,377,000
492,299 597,119 6,781,344 3,377,318
14. Operating expenses
Group Company
2021KShs’000
2020KShs’000
2021KShs’000
2020KShs’000
Staff Costs
Salaries and wages 5,120,297 3,765,906 - -
Contribution to defined contribution plan 226,373 170,988 - -
Statutory contribution 123,208 86,245 - -
Other staff costs 532,035 532,305 - -
6,001,913 4,555,444 - -
Premises and equipment costs
Service charge 164,346 146,950 - -
Electricity 301,863 148,715 - -
Other premises and equipment costs 101,889 133,067 - -
568,098 428,732 - -
Our
Gov
erna
nce
Our
Bus
ines
sO
ur F
inan
cial
s

I&M GROUP PLC (FORMERLY I&M HOLDINGS PLC) ANNUAL INTEGRATED REPORT AND FINANCIAL STATEMENTS 2021 I&M GROUP PLC (FORMERLY I&M HOLDINGS PLC) ANNUAL INTEGRATED REPORT AND FINANCIAL STATEMENTS 2021 205204
14. Operating expenses (Continued)Group Company
2021KShs’000
2020KShs’000
2021KShs’000
2020KShs’000
Other expenses
Deposit protection insurance contribution 438,624 342,512 -) -
Loss on disposal of property and equipment 30,200 7,802 -) -
Other general administrative expenses 4,021,066 2,945,551 114,249 31,102
4,489,890 3,295,865 114,249 31,102
Depreciation and amortisation
Depreciation on property and equipment (Note 25) 1,320,783 993,125 -) -
Amortisation of intangible assets (Note 26(b)) 702,187 532,741 -) -
2,022,970 1,525,866 -) -
The average number of employees employed by the Group are as follows
Group Company
2020KShs’000
2020KShs’000
2021KShs’000
2020KShs’000
Management 1,730 1,472 -) -
Others 401 279 -) -
2,131 1,751 -) -
15.Profit before income tax
Group Company
2021KShs’000
2020KShs’000
2021KShs’000
2020KShs’000
Profit before income tax is arrived at after charging/(crediting):
Depreciation 1,320,783) 993,125) -) -
Amortisation of intangible assets 702,187) 532,741) -) -
Directors' emoluments:
: Fees 23,589) 23,912) 11,360) 12,663
: Other 81,432) 67,029) -) -
Auditor's remuneration 34,373) 34,171) 2,414) 1,680
Net profit on disposal of property and equipment ( 12,605) ( 3,332) -) -
Dividend income -) -) 6,778,527) 3,377,000
Notes to the consolidated and separate financial statementsFor the year ended 31 December 2021 (Continued)
OUR FINANCIALS (Continued)
Notes to the consolidated and separate financial statementsFor the year ended 31 December 2021 (Continued)
OUR FINANCIALS (Continued)
16. Income tax expense and tax payable/(recoverable)(a) Income tax expense
Group Company
2021KShs’000
2020KShs’000
2021KShs’000
2020KShs’000
Current tax
Current year’s 3,850,229) 3,884,357) 8,796) 7,235)
(Over)/under provision in prior year 33,345) ( 99,263) ( 678) (2,430)
3,883,574) 3,785,094) 8,118) 4,805)
Deferred tax (Note 27)
Current year ( 66,770) ( 1,496,080) - -)
Prior year adjustment ( 27,834) 250,432) - -)
( 94,604) ( 1,245,648) - -)
Income tax expense 3,788,970) 2,539,446) 8,118) 4,805)
The tax on the Group's profit differs from the theoretical amount using the basic tax rate as follows:
Group Company
2021KShs’000
2020KShs’000
2021KShs’000
2020KShs’000
Accounting profit before income tax 12,412,906) 10,952,004) 6,704,086) 3,375,391)
Computed tax using the applicable corporation tax rate 30% (2020 - 25%)
Effect of change in tax rate 3,723,872) 2,738,001) 2,011,226) 843,848)
Under(over) provision in the prior year - ( 196,852) - ( 138)
Impact of share of joint venture's loss/(profit) 33,345) ( 99,263) ( 678) ( 2,430)
Effect on non-deductible costs/non-taxable income ( 164,667) 169,741) - -)
Over provision in prior year - deferred tax (Note 27) 224,254) ( 322,613) (2,002,430) (836,475)
( 27,834) 250,432) - -)
3,788,970) 2,539,446) 8,118) 4,805)
(b) Tax (recoverable)/payable
Group Company
2021KShs’000
2020KShs’000
2021KShs’000
2020KShs’000
At 1 January 22,275) 856,875) ( 4,369) ( 5,253)
Income tax expense (Note 16(a)) 3,883,574) 3,785,094) 8,118) 4,805)
Effect of tax in foreign jurisdiction ( 97,379) 41) - -)
Tax paid (4,238,920) ( 4,619,735) ( 7,212) ( 3,921)
At 31 December ( 430,450) 22,275) ( 3,463) (4,369)
Tax recoverable ( 459,760) ( 133,588) (3,463) ( 4,369)
Tax payable 29,310) 155,863) - -)
Net payable ( 430,450) 22,275) ( 3,463) (4,369)
Our
Gov
erna
nce
Our
Bus
ines
sO
ur F
inan
cial
s
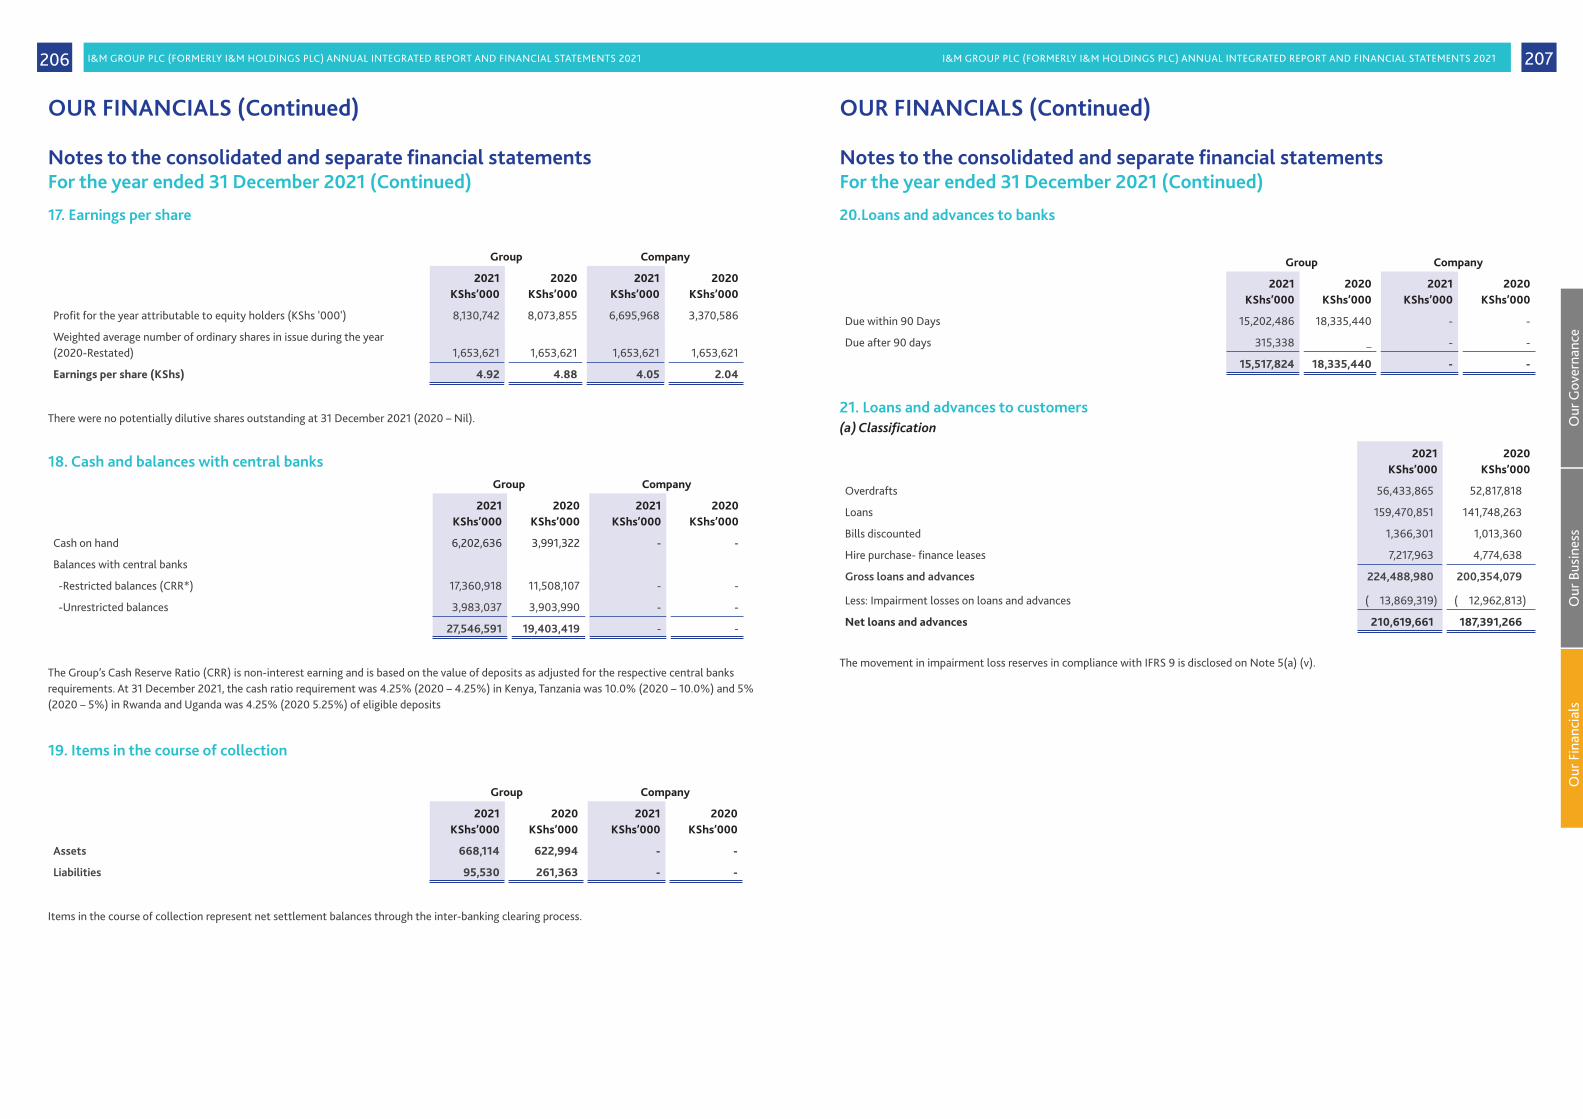
I&M GROUP PLC (FORMERLY I&M HOLDINGS PLC) ANNUAL INTEGRATED REPORT AND FINANCIAL STATEMENTS 2021 I&M GROUP PLC (FORMERLY I&M HOLDINGS PLC) ANNUAL INTEGRATED REPORT AND FINANCIAL STATEMENTS 2021 207206
17. Earnings per share
Group Company
2021KShs’000
2020KShs’000
2021KShs’000
2020KShs’000
Profit for the year attributable to equity holders (KShs '000') 8,130,742 8,073,855 6,695,968 3,370,586
Weighted average number of ordinary shares in issue during the year (2020-Restated) 1,653,621 1,653,621 1,653,621 1,653,621
Earnings per share (KShs) 4.92 4.88 4.05 2.04
There were no potentially dilutive shares outstanding at 31 December 2021 (2020 – Nil).
18. Cash and balances with central banksGroup Company
2021KShs’000
2020KShs’000
2021KShs’000
2020KShs’000
Cash on hand 6,202,636 3,991,322 - -
Balances with central banks
-Restricted balances (CRR*) 17,360,918 11,508,107 - -
-Unrestricted balances 3,983,037 3,903,990 - -
27,546,591 19,403,419 - -
The Group’s Cash Reserve Ratio (CRR) is non-interest earning and is based on the value of deposits as adjusted for the respective central banks requirements. At 31 December 2021, the cash ratio requirement was 4.25% (2020 – 4.25%) in Kenya, Tanzania was 10.0% (2020 – 10.0%) and 5% (2020 – 5%) in Rwanda and Uganda was 4.25% (2020 5.25%) of eligible deposits
19. Items in the course of collection
Group Company
2021KShs’000
2020KShs’000
2021KShs’000
2020KShs’000
Assets 668,114 622,994 - -
Liabilities 95,530 261,363 - -
Items in the course of collection represent net settlement balances through the inter-banking clearing process.
Notes to the consolidated and separate financial statementsFor the year ended 31 December 2021 (Continued)
OUR FINANCIALS (Continued)
Notes to the consolidated and separate financial statementsFor the year ended 31 December 2021 (Continued)
20.Loans and advances to banks
Group Company
2021KShs’000
2020KShs’000
2021KShs’000
2020KShs’000
Due within 90 Days 15,202,486 18,335,440 - -
Due after 90 days 315,338 _ - -
15,517,824 18,335,440 - -
21. Loans and advances to customers(a) Classification
2021KShs’000
2020KShs’000
Overdrafts 56,433,865) 52,817,818))
Loans 159,470,851) 141,748,263))
Bills discounted 1,366,301) 1,013,360))
Hire purchase- finance leases 7,217,963) 4,774,638))
Gross loans and advances 224,488,980) 200,354,079))
Less: Impairment losses on loans and advances ( 13,869,319) ( 12,962,813))
Net loans and advances 210,619,661) 187,391,266))
The movement in impairment loss reserves in compliance with IFRS 9 is disclosed on Note 5(a) (v).
OUR FINANCIALS (Continued)
Our
Gov
erna
nce
Our
Bus
ines
sO
ur F
inan
cial
s

I&M GROUP PLC (FORMERLY I&M HOLDINGS PLC) ANNUAL INTEGRATED REPORT AND FINANCIAL STATEMENTS 2021 I&M GROUP PLC (FORMERLY I&M HOLDINGS PLC) ANNUAL INTEGRATED REPORT AND FINANCIAL STATEMENTS 2021 209208
Not
es to
the
cons
olid
ated
and
sep
arat
e fin
anci
al s
tate
men
tsFo
r the
yea
r end
ed 3
1 D
ecem
ber 2
021
(Con
tinu
ed)
21. L
oans
and
adv
ance
s to
cus
tom
ers
(Con
tinu
ed)
(b) I
mpa
irm
ent l
osse
s on
loan
s and
adv
ance
s and
oth
er fi
nanc
ial a
sset
s at a
mor
tise
d co
st -
Gro
up
2021
:Lo
ans
and
adva
nces
to
Cus
tom
ers at
am
orti
sed
cost
KSh
s’00
0
Loan
co
mm
itm
ents
an
d fi
nanc
ial
guar
ante
e co
ntra
cts
KSh
s’00
0
Tota
l ba
nkin
g re
late
d fi
nanc
ial
asse
tsK
Shs’
000
Oth
er
fina
ncia
l as
sets
at
amor
tise
d co
st -
trad
e re
ceiv
able
KSh
s’00
0To
tal
KSh
s’00
0
Net
rem
easu
rem
ent o
f los
s al
low
ance
4,25
4,89
4)26
,417
)4,
281,
311)
11,4
42)
4,29
2,75
3)
New
fina
ncia
l ass
ets o
rigin
ated
or p
urch
ased
848,
642)
76,2
51)
924,
893)
-92
4,89
3)
5,10
3,53
6)10
2,66
8)5,
206,
204)
11,4
42)
5,21
7,64
6)
Reco
verie
s an
d im
pairm
ent n
o lo
nger
requ
ired
( 4
89,8
07)
(229
,406
)(
71
9,21
3)-
(
719
,213
)
Reco
verie
s of l
oans
and
adv
ance
s p
revi
ousl
y w
ritte
n of
f(
846
,880
)-
( 8
46,8
80)
-(
846
,880
)
Am
ount
s dire
ctly
writ
ten
off d
urin
g th
e ye
ar54
7,964
)-
547,9
64)
78)
548,
042)
4,3
14,8
13)
(126
,738
)4
,188
,075
)11
,520
)4
,199
,595
)
2020
:Lo
ans
and
adva
nces
to
Cus
tom
ers
at a
mor
tise
d co
stK
Shs’
000
Loan
co
mm
itm
ents
an
d fi
nanc
ial
guar
ante
e co
ntra
cts
KSh
s’00
0
Tota
l ba
nkin
g re
late
d fi
nanc
ial
asse
tsK
Shs’
000
Oth
er
fina
ncia
l as
sets
at
amor
tise
d co
st -
trad
e re
ceiv
able
KSh
s’00
0To
tal
KSh
s’00
0
Net
rem
easu
rem
ent o
f los
s al
low
ance
2,25
0,79
0)21
5,51
0)2,
466,
300)
14,9
562,
481,
256)
New
fina
ncia
l ass
ets o
rigin
ated
or p
urch
ased
182,
349)
29,10
8)21
1,45
7)-
211,
457)
2,43
3,13
9)24
4,61
8)2,
677,
757)
14,9
562,
692,
713)
Reco
verie
s an
d im
pairm
ent n
o lo
nger
requ
ired
(
247,8
25)
( 1
3,03
4)(
260
,859
)-
( 2
60,8
59)
Reco
verie
s of l
oans
and
adv
ance
s p
revi
ousl
y w
ritte
n of
f42
6,80
3)( 4
21,0
88)
5,71
5)-
5,71
5)
Am
ount
s dire
ctly
writ
ten
off d
urin
g th
e ye
ar35
,267
)-
35,2
67)
-35
,267
)
2,64
7,38
4)
(189
,504
)2,
457
,880
)14
,956
2,4
72,8
36)
OU
R FI
NA
NC
IALS
(Con
tinu
ed)
21. Loans and advances to customers (Continued)(c) Non-performing loans and advances
Non-performing loans and advances net of impairment losses and estimated value of securities are disclosed in Note 5(a)
Group 2021KShs’000
2020KShs’000
Interest on impaired loans and advances which have not yet been received in cash 1,424,285 1,272,415
(d) Loans and advances to customers concentration by sector
Group 2021 2020
KShs'000 % KShs'000 %
Manufacturing 57,403,877 26% 52,057,820 26%
Wholesale and retail trade 42,349,653 19% 35,736,622 18%
Building and construction 13,935,854 6% 15,904,791 8%
Agriculture 8,667,994 4% 7,002,635 3%
Real estate 34,548,392 15% 37,397,337 19%
Transport and communication 15,027,689 7% 13,482,552 7%
Business services 17,390,341 8% 13,870,994 7%
Electricity and water 1,265,651 1% 680,901 0%
Finance and insurance 4,994,388 2% 3,324,456 2%
Mining and quarrying 1,653,721 1% 1,456,910 1%
Others 27,251,420 11% 19,439,061 9%
224,488,980 100% 200,354,079 100%
(e) Finance leases
Loans and advances to customers include finance leases receivable as follows:
Group 2021KShs’000
2020KShs’000
Receivable no later than 1 year 561,842 399,879
Receivable later than 1 year and no later than 5 years 5,500,870 4,362,357
Receivable later than 5 years 1,155,251 12,402
7,217,963 4,774,638
Notes to the consolidated and separate financial statementsFor the year ended 31 December 2021 (Continued)
OUR FINANCIALS (Continued)
Our
Gov
erna
nce
Our
Bus
ines
sO
ur F
inan
cial
s

I&M GROUP PLC (FORMERLY I&M HOLDINGS PLC) ANNUAL INTEGRATED REPORT AND FINANCIAL STATEMENTS 2021 I&M GROUP PLC (FORMERLY I&M HOLDINGS PLC) ANNUAL INTEGRATED REPORT AND FINANCIAL STATEMENTS 2021 211210
22. Financial assets(a) Financial assets at fair value through profit or loss (FVTPL)
Group 2021KShs’000
2020KShs’000
Derivative assets 342,477 70,969
Government securities (Non liquid) 16,025,688 11,798,434
16,368,165 11,869,403
(b) Financial assets measured at fair value through other comprehensive income (FVOCI)
Group 2021KShs’000
2020KShs’000
Equity investment 476,414 448,857
Corporate bonds 362,346 -
Government securities (Non liquid) 63,171,512 42,028,395
64,010,272 42,477,252
Company 2021KShs’000
2020KShs’000
Government securities (Non liquid) 27,019 28,392
(c) Other financial assets at amortised cost
Group 2021KShs’000
2020KShs’000
Government securities (Non liquid) 45,087,958 47,241,831
Trade receivables 68,752 122,794
45,156,710 47,364,625
Notes to the consolidated and separate financial statementsFor the year ended 31 December 2021 (Continued)
OUR FINANCIALS (Continued)
Not
es to
the
cons
olid
ated
and
sep
arat
e fin
anci
al s
tate
men
tsFo
r the
yea
r end
ed 3
1 D
ecem
ber 2
021
(Con
tinu
ed)
22. F
inan
cial
ass
ets
(Con
tinu
ed)
The
chan
ge in
the
carr
ying
am
ount
of i
nves
tmen
t sec
uriti
es h
eld
by th
e G
roup
is a
s sh
own
belo
w:
Fina
ncia
l ass
ets
at
fair
val
ue th
roug
h pr
ofit o
r los
s (F
VTP
L)G
over
nmen
t se
curi
ties
KSh
s’00
0
Oth
er fi
nanc
ial
asse
ts a
t am
orti
sed
cost
Gov
ernm
ent
secu
riti
esK
Shs’
000
Fina
ncia
l ass
ets
mea
sure
d at
fair
val
ue
thro
ugh
othe
r com
preh
ensi
ve in
com
e (F
VO
CI)
Gov
ernm
ent
secu
riti
esK
Shs’
000
Equi
ty
inve
stm
ents
KSh
s’00
0
Cor
pora
te
bond
KSh
s’00
0To
tal
KSh
s’00
0
31 D
ecem
ber 2
021
At 1
Janu
ary
2021
11,8
69,4
03)
47,2
41,8
31)
42,0
28,3
95)
448,
857)
-)10
1,58
8,48
6)
Acqu
isiti
on o
f I&
M B
ank
(Uga
nda)
Lim
ited
(for
mer
ly O
rient
Ban
k Li
mite
d)12
1,75
2)2,
930,
813)
-)-)
-)3,
052,
565)
Addi
tions
15,0
17,3
05)
25,9
15,0
83)
46,5
90,6
65)
-)35
6,19
4)87
,879
,247
)
Dis
posa
ls a
nd m
atur
ities
( 11,
009,
852)
( 33,
098,
558)
( 25,
545,
049)
-)-)
( 6
9,65
3,45
9)
Reva
luat
ion
gain
111,
697)
-)80
,556
)-)
-)19
2,25
3)
Cha
nges
in fa
ir va
lue
201,
884)
-)(
9
79,3
51)
( 1
3,33
4)(
6
9)(
790
,870
)
Am
ortis
atio
n of
dis
coun
ts a
nd p
rem
ium
s, u
near
ned
inte
rest
and
inte
rest
rece
ivab
le
48,7
75)
1,71
1,40
1)1,
051,
277)
38,8
85)
6,22
1)2,
856,
559)
Tran
slat
ion
rese
rve
7,201
)38
7,388
)(
54,
981)
2,00
6)-)
341,
614)
At
31 D
ecem
ber 2
021
16,3
68,1
65)
45,
087,
958)
63,1
71,5
12)
476
,414
)36
2,34
6)12
5,4
66,3
95)
31 D
ecem
ber 2
020
At 1
Janu
ary
2020
13,7
44,0
48)
26,9
93,2
17)
12,5
49,6
29)
559,
569)
-)53
,846
,463
)
Recl
assi
ficat
ion
-)-)
-)-)
)-)
-))
Addi
tions
22,7
08,4
90)
43,9
97,12
6)33
,791
,053
)-)
)-)
100,
496,
669)
Dis
posa
ls a
nd m
atur
ities
(24,
400,
846)
( 24,
845,
736)
( 5
,233
,901
)-)
)-)
( 5
4,48
0,48
3)
Reva
luat
ion
gain
53,12
2)-)
39,2
68)
-))
-)92
,390
)
Cha
nges
in fa
ir va
lue
40,2
11)
-)40
7,956
)(
114,
908)
-)33
3,25
9)
Am
ortis
atio
n of
dis
coun
ts a
nd p
rem
ium
s, u
near
ned
inte
rest
and
inte
rest
rece
ivab
le
(
276
,569
)78
1,03
2)58
5,23
1)1,1
52)
-)1,
090,
846)
Tran
slat
ion
rese
rve
947)
316,
192)
(
11
0,84
1)3,
044)
-)20
9,34
2)
At
31 D
ecem
ber 2
020
11,8
69,4
03)
47,
241,
831)
42,
028,
395)
44
8,85
7)-)
101,
588,
486
)
OU
R FI
NA
NC
IALS
(Con
tinu
ed)

I&M GROUP PLC (FORMERLY I&M HOLDINGS PLC) ANNUAL INTEGRATED REPORT AND FINANCIAL STATEMENTS 2021 I&M GROUP PLC (FORMERLY I&M HOLDINGS PLC) ANNUAL INTEGRATED REPORT AND FINANCIAL STATEMENTS 2021 213212
22. Financial assets (Continued)The change in the carrying amount of investment securities held by the Company is as shown below:
Financial assets measured at fair value through other comprehensive income (FVOCI)
Group 2021KShs’000
2020KShs’000
At 1 January 28,392) 27,679)
Changes in fair value ( 1,275) 801)
Amortisation of discounts and premiums, unearned interest and interest receivable ( 98) ( 88)
At 31 December 27,019) 28,392)
23. Held for sale assets
Group 2021KShs’000
2020KShs’000
Held for sale assets 1,014,651 1,057,056
Assets held for sale are assets foreclosed by the Group in the normal course of business and are primarily recovered through sale.
24.Investment in subsidiaries and joint ventureThe Company holds investments in subsidiaries in I&M Bank (T) Limited, I&M Bancassurance Intermediary Limited and Youjays Insurance Brokers Limited through I&M Bank LIMITED. All the three entities have been consolidated with the results of I&M Bank LIMITED. I&M Bank (Rwanda) PLC (subsidiary through BCR Investment Company Limited), I&M Bank (Uganda) Limited (Formerly Orient Bank Limited), I&M Capital Limited, I&M Realty Limited, I&M Burbidge Capital Limited, I&M Burbidge Capital (U) Limited are the other subsidiaries of I&M Group PLC (Formerly I&M Holdings PLC). I&M Group PLC (Formerly I&M Holdings PLC) owns 50% of a joint venture in Mauritius (Bank One Limited).
(a) Investment in joint venture
The Company has 50% (2020 – 50%) control over Bank One Limited with the other joint venture, CIEL Finance Limited. The joint venture was formerly owned through I&M Bank LIMITED until 22 August 2014 when it was transferred to I&M Group PLC (Formerly I&M Holdings PLC).
Notes to the consolidated and separate financial statementsFor the year ended 31 December 2021 (Continued)
OUR FINANCIALS (Continued) OUR FINANCIALS (Continued)
Notes to the consolidated and separate financial statementsFor the year ended 31 December 2021 (Continued)
24. Investment in subsidiaries and joint venture (Continued)(a) Investment in joint venture (Continued)
Group 2021KShs’000
2020KShs’000
Balance at start of the year 5,177,219) 5,398,545)
Additional investment in the year -) 405,000)
Share of:
Profit/(loss) from operations 548,890) ( 678,962)
Dividends received -) -)
Other comprehensive income ( 500,002) 52,636)
Balance at end of the year 5,226,107) 5,177,219)
Percentage ownership 50.00% 50.00%
Total assets (including cash and cash equivalents) 117,238,231) 157,194,516)
Total liabilities (including cash and cash equivalents) ( 107,736,829) ( 147,790,890)
Net assets (100%) 9,501,402) 9,403,626)
Group's share of net assets (50%) 4,750,701) 4,701,813)
Goodwill 475,406) 475,406)
Carrying amount of interest in joint venture 5,226,107) 5,177,219)
Interest income 3,067,823) 4,106,490)
Interest expense ( 903,706) ( 1,546,038)
Other income 1,500,121) 1,078,002)
Operating expenses ( 2,276,915) ( 5,106,340)
Income tax credit/(expense) ( 289,543) 109,962)
Profit and total comprehensive income (100%) 1,097,780) ( 1,357,924)
(Loss)/profit and loss (50%) 548,890) ( 678,962)
Groups share of total comprehensive income 48,888) ( 626,326)
Company:
At 1 January 2,515,591) 2,110,591)
Additional investment in Bank One Limited -) 405,000)
At 31 December 2,515,591) 2,515,591)
Our
Gov
erna
nce
Our
Bus
ines
sO
ur F
inan
cial
s

I&M GROUP PLC (FORMERLY I&M HOLDINGS PLC) ANNUAL INTEGRATED REPORT AND FINANCIAL STATEMENTS 2021 I&M GROUP PLC (FORMERLY I&M HOLDINGS PLC) ANNUAL INTEGRATED REPORT AND FINANCIAL STATEMENTS 2021 215214
Notes to the consolidated and separate financial statementsFor the year ended 31 December 2021 (Continued)
24. Investment in subsidiaries and joint venture (Continued)
(b) Investment in subsidiaries
Company Activity Shareholding 2021KShs'000
2020KShs'000
I&M Bank LIMITED Banking 100.00% 19,840,176 19,840,176
I&M Capital Limited Wealth management 100.00% 6,611 6,611
I&M Bank (Rwanda) PLC through BCR Investment Company Limited Banking 54.47% 2,118,865 2,118,865
I&M Realty Limited Real estate 100.00% 5,170 5,170
I&M Burbidge Capital Limited Investment 65.00% 66,037 66,037
Giro Limited Investment 100.00% 4,115,023 4,115,023
I&M Bank (Uganda) Limited (Formerly Orient Bank Limited) Banking 90.00% 4,284,013 -
30,435,895 26,151,882
The Group owns the following subsidiaries through I&M Bank LIMITED, its wholly owned subsidiary:
Company Activity Jurisdiction Shareholding
I&M Bancassurance Intermediary Limited Bancassurance Kenya 100.00%
I&M Bank (T) Limited Banking Tanzania 77.80%
Youjays Insurance Brokers Limited Bancassurance Kenya 100.00%
In addition, the Group owns I&M Burbidge Capital (U) Limited through I&M Burbidge Capital Limited, its wholly owned subsidiary.
(c) Movement in investment in subsidiaries
2021KShs’000
2020KShs’000
At 1 January 26,151,882 25,662,294
Acquisition of I&M Bank (Uganda) Limited (Formerly Orient Bank Limited) 3,288,168 -
Additional investment in I&M Bank (Uganda) Limited (Formerly Orient Bank Limited) 995,845 -
Additional investment in I&M Bank (Rwanda) PLC - 489,588
At December 30,435,895 26,151,882
OUR FINANCIALS (Continued)
Not
es to
the
cons
olid
ated
and
sep
arat
e fin
anci
al s
tate
men
tsFo
r the
yea
r end
ed 3
1 D
ecem
ber 2
021
(Con
tinu
ed)
24. I
nves
tmen
t in
sub
sidi
arie
s an
d jo
int v
entu
re (C
onti
nued
)Be
low
is th
e su
mm
ary
of fi
nanc
ials
of t
he b
anki
ng s
ubsi
diar
ies.
I&M
Ban
k LI
MIT
EDI&
M B
ank
(T) L
imit
edI&
M B
ank
(Rw
anda
) PLC
I&M
Ban
k (U
gand
a) L
imit
ed
(For
mer
ly O
rien
t Ba
nk
Lim
ited
)
2021
KSh
s’M
2020
KSh
s’M
2021
KSh
s’M
2020
KSh
s’M
2021
KSh
s’M
2020
KSh
s’M
2021
KSh
s’M
2020
KSh
s’M
Sum
mar
ized
sta
tem
ent o
f fina
ncia
l pos
itio
n
Tota
l ass
ets
307,8
02)
283,
569)
28,8
07)
24,14
4)50
,930
)45
,972
)22
,604
)-
Tota
l lia
bilit
ies
255,
882)
231,
245)
24,0
16)
20,2
07)
44,14
5)39
,969
)19
,314
)-
Net
ass
ets
51,9
20)
52,3
24)
4,7
91)
3,93
7)6,
785)
6,00
3)3,
290)
-
Sum
mar
ized
sta
tem
ent o
f pro
fit a
nd lo
ss a
nd o
ther
co
mpr
ehen
sive
inco
me
Net
inte
rest
inco
me
15,6
67)
11,8
22)
1,50
91,
295)
2,94
7)2,
44
5)66
4)
-
Profi
t bef
ore
inco
me
tax
10,5
87)
10,2
89)
492)
386)
1,20
4)85
5)(
5
96)
-
Inco
me
tax
expe
nse
( 3
,582
)(
2,
027)
(
155
)(
1
11)
(
199
)(
2
94)
223)
-Pr
ofit f
or th
e ye
ar7,
005)
8,26
2)33
7)27
5)1,
005)
561)
(
373
)-
Sum
mar
ised
sta
tem
ent o
f cas
h fl
ows
Net
cas
h ge
nera
ted
from
ope
ratin
g ac
tiviti
es(
14,
051)
( 1
9,35
5)1,
372)
1,74
5)3,
749)
( 1
,645
)(
1,9
26)
-
Net
cas
h us
ed in
inve
stin
g ac
tiviti
es(
1,
520)
(
1,7
93)
(
99
)(
71)
(
700
)(
1,0
30)
(
84
)-
Net
cas
h (u
sed
in)/
gene
rate
d fr
om fi
nanc
ing
activ
ities
(
1,22
5)(
3,
437)
(
304)
(
739
)1,
411)
4,08
5)(
70)
-
Net
incr
ease
/(de
crea
se) i
n ca
sh a
nd c
ash
equi
vale
nts
( 16,
796)
( 24
,585
)96
9)93
5)4
,460
)1,
410
)(
2,08
0)-
Cas
h an
d ca
sh e
quiv
alen
ts a
t be
ginn
ing
of y
ear
18,3
58)
42,
943)
1,4
13)
478
)6,
533)
5,12
3)9,
355)
-
Cas
h an
d ca
sh e
quiv
alen
ts a
t en
d of
yea
r1,
562)
18,3
58)
2,38
2)1,
413
)10
,993
)6,
533)
7,27
5)-
OU
R FI
NA
NC
IALS
(Con
tinu
ed)
Our
Gov
erna
nce
Our
Bus
ines
sO
ur F
inan
cial
s

I&M GROUP PLC (FORMERLY I&M HOLDINGS PLC) ANNUAL INTEGRATED REPORT AND FINANCIAL STATEMENTS 2021 I&M GROUP PLC (FORMERLY I&M HOLDINGS PLC) ANNUAL INTEGRATED REPORT AND FINANCIAL STATEMENTS 2021 217216N
otes
to th
e co
nsol
idat
ed a
nd s
epar
ate
finan
cial
sta
tem
ents
For t
he y
ear e
nded
31
Dec
embe
r 202
1 (C
onti
nued
)
25. P
rope
rty
and
equi
pmen
t
2021
:
Build
ings
KSh
s’00
0
Leas
ehol
d im
prov
emen
tsK
Shs’
000
Furn
itur
e,
fitt
ings
, fi
xtur
es
and
offi
ce
equi
pmen
tK
Shs’
000
Com
pute
rsK
Shs’
000
Mot
or
vehi
cles
KSh
s’00
0
Rig
htof
use
as
set
KSh
s’00
0
Cap
ital
w
ork
in
prog
ress
KSh
s’00
0To
tal
KSh
s’00
0
Cos
t/va
luat
ion
At 1
Janu
ary
2021
4,71
5,12
7)2,
053,
158)
2,11
8,50
4)1,
211,
525)
212,
729)
2,94
2,77
2)3,
402,
012)
16,6
55,8
27)
Acqu
isiti
on o
f I&
M B
ank
(Uga
nda)
Lim
ited
(For
mer
ly
Orie
nt B
ank
Lim
ited)
-)11
7,274
)23
0,97
6)30
6,11
9)28
,260
)30
3,93
3)26
,092
)1,
012,
654)
Addi
tions
100,
382)
59,6
34)
221,
088)
74,4
61)
25,6
48)
328,
104)
846,
602)
1,65
5,91
9)
Reva
luat
ion
rese
rve
45,18
9)-)
-)-)
-)-)
-)45
,189)
On
disp
osal
s-)
(
24,
251)
(
39,
206)
(
3,
628)
( 3
1,85
7)(
9
8,65
3)(
6,0
59)
(
203
,654
)
Item
s ex
pens
ed-)
-)(
7,9
29)
-)-)
-)-)
(7,9
29)
Recl
assi
ficat
ion/
inte
rnal
tran
sfer
s2,
768,
127)
53,9
20)
432,
50)
667,0
85)
-)-)
( 3,8
68,0
39)
53,6
02)
Writ
e of
fs/b
ack
(
384,
165)
-)-)
-)-)
-)-)
(
38
4,16
5)
Surp
lus o
n re
valu
atio
n27
1,81
1)-)
-)-)
-)-)
-)27
1,81
1)
Tran
slat
ion
diff
eren
ce(
1
3,00
1)11
,028
)15
,304
)9,
581)
1,02
2)6,
558)
(
12
,940
)17
,552
)
At
31 D
ecem
ber 2
021
7,50
3,4
70)
2,27
0,76
3)2,
971,
246)
2,26
5,14
3)23
5,80
2)3,
482
,714
)38
7,66
8)19
,116
,806
)
Dep
reci
atio
n
At 1
Janu
ary
2021
227,7
52)
1,133
,282
)1,1
26,5
05)
1,03
8,38
9)15
7,867
)85
0,44
4)-)
4,53
4,23
9)
Acqu
isiti
on o
f I&
M B
ank
(Uga
nda)
Lim
ited
(For
mer
ly
Orie
nt B
ank
Lim
ited)
-)91
,298
)18
4,64
2)28
0,28
1)21
,806
)15
6,61
6)-)
734,
643)
Cha
rge
for t
he y
ear
159,
941)
215,
460)
228,
414)
197,8
48)
34,0
36)
485,
084)
-)1,
320,
783)
Writ
e-of
fs(
13
5,98
1)-)
-)-)
-)-)
-)(
135,
981)
Reve
rsal
on
reva
luat
ion
(
98,
767)
-)-)
-)-)
-)-)
(
9
8,76
7)
On
disp
osal
s-)
(
16,
849)
(
33,
593)
(
3,
433)
( 2
8,72
2)(
6
8,67
3)-)
(
15
1,27
0)
Tran
slat
ion
diff
eren
ces
(
1
,926
)8,
005)
10,3
16)
8,11
9)76
5)4,
251)
-)29
,530
)
At
31 D
ecem
ber 2
021
151,
019)
1,4
31,1
96)
1,51
6,28
4)
1,52
1,20
4)
185,
752)
1,4
27,7
22)
-)6,
233,
177)
Net
boo
k va
lue
at 3
1 D
ecem
ber 2
021
7,35
2,4
51)
839,
567)
1,4
54,9
62)
743,
939)
50,0
50)
2,05
4,9
92)
387,
668)
12,8
83,6
29)
In 2
021,
the
build
ings
on
LR N
o: 2
09/7
265,
LR
No:
187
0/1/
579
and
L.R
No.
209
/217
05 w
ere
reva
lued
by
an in
depe
nden
t val
uer,
Cora
l val
uers
(202
0 Ki
ragu
& M
wan
gi L
imite
d). T
he v
alua
tion
is le
vel 3
un
der t
he F
air v
alue
hie
rarc
hy.
OU
R FI
NA
NC
IALS
(Con
tinu
ed)
Not
es to
the
cons
olid
ated
and
sep
arat
e fin
anci
al s
tate
men
tsFo
r the
yea
r end
ed 3
1 D
ecem
ber 2
021
(Con
tinu
ed)
25. P
rope
rty
and
equi
pmen
t (C
onti
nued
)
2020
:
Build
ings
KSh
s’00
0
Leas
ehol
d im
prov
emen
tsK
Shs’
000
Furn
itur
e,
fitt
ings
, fi
xtur
es
and
offi
ce
equi
pmen
tK
Shs’
000
Com
pute
rsK
Shs’
000
Mot
or
vehi
cles
KSh
s’00
0
Rig
htof
use
as
set
KSh
s’00
0
Cap
ital
w
ork
in
prog
ress
KSh
s’00
0To
tal
KSh
s’00
0
At 1
Janu
ary
2020
2,57
0,41
0)1,
334,
796)
1,50
2,23
8)1,1
71,2
93)
202,
469)
2,35
7,500
)4,
632,
714)
13,7
71,4
20)
Tran
sfer
from
pre
paid
ope
ratin
g le
ase
rent
als
-)-)
-)-)
-)-)
-)-)
Addi
tions
-)53
,482
)93
,443
)25
,784
)13
,281
)57
3,87
4)2,
114,
659)
2,87
4,52
3)
Reva
luat
ion
rese
rve
(
5,
464)
-)-)
-)-)
-)-)
(
5,46
4)
On
disp
osal
s(
3
4,23
7)(
71)
(
6
,721
)(
6,6
88)
( 1
0,68
2)(
6,6
22)
-)(
65,
021)
Recl
assi
ficat
ion/
inte
rnal
tran
sfer
s2,
170,
129)
652,
986)
505,
702)
13,5
82)
4,77
1)-)
( 3,
391,
706)
(
4
4,53
6)
Tran
sfer
s fro
m in
tang
ible
ass
ets
-)-)
-)-)
-)-)
-)-)
Writ
e of
fs/b
ack
-)-)
-)-)
-)-)
-)-)
Tran
slat
ion
diff
eren
ce14
,289
)11
,965
)23
,842
)7,5
54)
2,89
0)18
,020
)46
,345
)12
4,90
5)
At
31 D
ecem
ber 2
020
4,7
15,1
27)
2,05
3,15
8)2,
118,
504
)1,
211,
525)
212,
729)
2,94
2,77
2)3,
402
,012
)16
,655
,827
)
Dep
reci
atio
n
At 1
Janu
ary
2020
182,
459)
996,
036)
969,
565)
871,
347)
138,
447)
461,1
37)
-)3,
618,
991)
Tran
sfer
from
pre
paid
ope
ratin
g le
ase
rent
als
-)-)
-)-)
-)-)
-)-)
Cha
rge
for t
he y
ear
139,
381)
130,
021)
148,
240)
167,0
14)
27,8
66)
380,
603)
-)99
3,12
5)
Writ
e-of
fs-)
-)-)
-)-)
-)-)
-)
Reve
rsal
on
reva
luat
ion
(
94,0
99)
-)-)
-)-)
-)-)
(
94
,099
)
On
disp
osal
s(
4,13
8)(
71)
(
4,
696)
(
6
,128)
( 1
0,68
0)3,
163)
-)(
22,
550)
Tran
slat
ion
diff
eren
ces
4,14
9)7,2
96)
13,3
96)
6,15
6)2,
234)
5,54
1)-)
38,7
72)
At
31 D
ecem
ber 2
020
227,
752)
1,13
3,28
2)1,
126,
505)
1,03
8,38
9)15
7,86
7)85
0,44
4)-)
4,53
4,23
9)
Net
boo
k va
lue
at 3
1 D
ecem
ber 2
020
4,48
7,37
5)91
9,87
6)99
1,99
9)17
3,13
6)54
,862
)2,
092,
328)
3,40
2,01
2)12
,121
,588
)
OU
R FI
NA
NC
IALS
(Con
tinu
ed)
Our
Gov
erna
nce
Our
Bus
ines
sO
ur F
inan
cial
s

I&M GROUP PLC (FORMERLY I&M HOLDINGS PLC) ANNUAL INTEGRATED REPORT AND FINANCIAL STATEMENTS 2021 I&M GROUP PLC (FORMERLY I&M HOLDINGS PLC) ANNUAL INTEGRATED REPORT AND FINANCIAL STATEMENTS 2021 219218
26. Intangible assets(a) Goodwill
2021KShs’000
2020KShs’000
I&M Bank LIMITED 1,195 1,195
I&M Bank (T) Limited 526,504 505,276
I&M Bank (Rwanda) PLC 433,256 437,690
I&M Burbidge Capital Limited 35,481 34,865
Giro Limited 1,944,139 1,944,139
Youjays Insurance Brokers Limited 232,284 232,284
I&M Bank (Uganda) Limited (Formerly Orient Bank Limited) 721,331 -
3,894,190 3,155,449
Movement of Goodwill
At 1 January 3,155,449 3,113,771
Acquisition of I&M Bank (Uganda) Limited (Formerly Orient Bank Limited) 721,331 -
Exchange differences 17,410 41,678
At 31 December 3,894,190 3,155,449
Acquisition of I&M Bank (Uganda) Limited (Formerly Orient Bank Limited)
2021KShs’000
Total purchase consideration paid in cash 3,288,168)
Total assets 20,030,162)
Total liabilites (17,436,437)
Net assets acquired 2,593,725)
Exchange differences 26,888)
Goodwill 721,331)
Notes to the consolidated and separate financial statementsFor the year ended 31 December 2021 (Continued)
OUR FINANCIALS (Continued)
Not
es to
the
cons
olid
ated
and
sep
arat
e fin
anci
al s
tate
men
tsFo
r the
yea
r end
ed 3
1 D
ecem
ber 2
021
(Con
tinu
ed)
26. I
ntan
gibl
e as
sets
(Con
tinu
ed)
(a)
Goo
dwill
(Con
tinu
ed)
With
resp
ect t
o go
odw
ill a
sses
smen
t for
impa
irmen
t, no
impa
irmen
t los
ses
have
bee
n re
cogn
ised
as
the
reco
vera
ble
amou
nts
of th
e C
ash
Gen
erat
ing
Uni
ts (C
GU
s) w
ere
dete
rmin
ed to
be
high
er
than
thei
r car
ryin
g am
ount
s. T
he re
cove
rabl
e am
ount
s ha
ve b
een
calc
ulat
ed b
y di
scou
ntin
g th
e fu
ture
cas
h flo
ws
expe
cted
to b
e ge
nera
ted
from
the
cont
inui
ng u
se o
f the
resp
ectiv
e C
GU
s. T
he
key
assu
mpt
ions
use
d in
the
calc
ulat
ion
of v
alue
in u
se w
ere
as fo
llow
s:
2021
:
I&M
Ban
k (T
) Lt
dI&
M B
ank
(Rw
anda
) PLC
I&M
Bur
bidg
e C
apit
al
Lim
ited
Gir
o Li
mit
edYo
ujay
s In
sura
nce
Brok
ers
Lim
ited
I&M
Ban
k (U
gand
a) L
imit
ed
(For
mer
ly O
rien
t Ba
nk L
imit
ed)
5 ye
ar ri
sk fr
ee ra
te9.
10%
11.2
0%10
.46%
10.4
6%10
.46%
13.0
0%
Risk
pre
miu
m11
.95%
10.4
3%9.
33%
9.33
%9.
33%
9.68
%
Term
inal
gro
wth
rate
3.00
%3.
00%
4.00
%4.
00%
4.00
%5.
00%
Pret
ax d
isco
unt r
ate
21%
21%
20%
20%
20%
21%
Exch
ange
rate
KShs
1 =
Tzs
20.
59KS
hs 1
= R
wf 9
.17KS
hs 1
= K
Shs
1KS
hs 1
= K
Shs
1KS
hs 1
= K
Shs
1KS
hs 1
= U
shs
31.4
3
Pres
ent v
alue
of t
he re
cove
rabl
e am
ount
s KS
hs in
bi
llion
s4.
318
4.91
50.
173
6.40
10.
340
3.82
0
Goo
dwill
impa
ired
Nil
Nil
Nil
Nil
Nil
Nil
2020
I&M
Ban
k (T
) Lt
dI&
M B
ank
(Rw
anda
) PLC
I&M
Bur
bidg
e C
apit
al
Lim
ited
Gir
o Li
mit
edYo
ujay
s In
sura
nce
Brok
ers
Lim
ited
5 ye
ar ri
sk fr
ee ra
te9.
10%
10.9
8%10
.46%
10.4
6%10
.46%
Risk
pre
miu
m10
.83%
10.3
3%9.
33%
9.33
%9.
33%
Term
inal
gro
wth
rate
3.00
%3.
00%
4.00
%4.
00%
4.00
%
Pret
ax d
isco
unt r
ate
20%
21%
20%
20%
20%
Exch
ange
rate
KShs
1 =
Tzs
21.
24KS
hs 1
= R
wf 9
.08
KShs
1 =
KSh
s 1
KShs
1 =
KSh
s 1
KShs
1 =
KSh
s 1
Pres
ent v
alue
of t
he re
cove
rabl
e am
ount
s KS
hs in
bi
llion
s3.
428
3.17
90.
195.
242
5.24
2
Goo
dwill
impa
ired
Nil
Nil
Nil
Nil
Nil
OU
R FI
NA
NC
IALS
(Con
tinu
ed)
Our
Gov
erna
nce
Our
Bus
ines
sO
ur F
inan
cial
s

I&M GROUP PLC (FORMERLY I&M HOLDINGS PLC) ANNUAL INTEGRATED REPORT AND FINANCIAL STATEMENTS 2021 I&M GROUP PLC (FORMERLY I&M HOLDINGS PLC) ANNUAL INTEGRATED REPORT AND FINANCIAL STATEMENTS 2021 221220
26.Intangible assets (Continued)(a) Goodwill (Continued)
The discount rate utilised was the risk free rate on the rate of 5 year government bonds issued by the governments in the respective markets and in the same currency as the cash flows.
These cash flows have been projected for 7 years, based on the approved Business plans of the respective units.
In the opinion of the Directors, there was no impairment of goodwill during the year.
Sensitivity analysis
The CGUs are sensitive to possible adverse changes in the key assumptions that support the recoverable amount:
Cash flows: The medium term plans used to determine the cash flows used in the Value In Use (VIU) calculation rely on macroeconomic forecasts. including interest rates. GDP and unemployment. and forecast levels of market and client activity. Interest rate assumptions impact planned cash flows from both customer income and structural hedge contributions and therefore cash flow expectations are highly sensitive to movements in the yield curve. The cash flows also contain assumptions with regards to the prudential and financial conduct regulatory environment which may be subject to change. Given the current level of economic uncertainty. a 10% reduction in cash flows has been provided to show the sensitivity of the outcome to a change in these key assumptions.
Discount rate: The discount rate should reflect the market risk free rate adjusted for the inherent risks of the business it is applied to. Management have identified discount rates for comparable businesses and consider these to be a reasonable estimate of a suitable market rate for the profile of the business unit being tested. The risk that these discount rates may not be appropriate is quantified below and show the impact of a 100 bps change in the discount rate.
Terminal growth rate: The terminal growth rate is used to estimate the cash flows into perpetuity based on the expected longevity of the CGU's businesses. The terminal growth rate is sensitive to uncertainties in the macroeconomic environment. The risk that using inflation data may not be appropriate for its determination is quantified below and shows the impact of a 100 bps change in the terminal value.
Notes to the consolidated and separate financial statementsFor the year ended 31 December 2021 (Continued)
OUR FINANCIALS (Continued)
Not
es to
the
cons
olid
ated
and
sep
arat
e fin
anci
al s
tate
men
tsFo
r the
yea
r end
ed 3
1 D
ecem
ber 2
021
(Con
tinu
ed)
26. I
ntan
gibl
e as
sets
(Con
tinu
ed)
(a) G
oodw
ill (C
onti
nued
)
Sens
itiv
ity
anal
ysis
(Con
tinu
ed)
The
sens
itivi
ty o
f the
val
ue in
use
to k
ey ju
dgem
ents
in th
e ca
lcul
atio
ns is
set
out
bel
ow:
Redu
ctio
n in
hea
droo
mC
hang
e re
quir
ed to
redu
ce th
e he
ad ro
om to
zer
o
Cas
h G
ener
atin
g U
nit
Car
ryin
g va
lue
KSh
s’M
illio
n
Val
ue
in u
seK
Shs’
Mill
ion
Val
ue in
use
ex
ceed
ing
carr
ying
va
lue
KSh
s’M
illio
n
Pret
ax
disc
ount
ra
te %
Term
inal
gr
owth
ra
te %
100b
ps
incr
ease
in
dis
coun
t ra
teK
Shs’
Mill
ion
100b
ps
decr
ease
in
term
inal
rate
KSh
s’M
illio
n
10%
re
duct
ion
in
fore
cast
ed
cash
flow
sK
Shs’
Mill
ion
Pret
ax
disc
ount
ra
te %
Term
inal
gr
owth
ra
te %
Redu
ctio
n in
fore
cast
ed
cash
flow
s %
I&M
Ban
k (T
) Lim
ited
527
4,31
83,
791
20%
3%( 1
41.0
0)(
59.0
0)(
575.
00)
-5%
-7%
-6%
I&M
Ban
k (R
wan
da) P
LC43
34,
915
4,48
221
%3%
(464
.90)
(170
.70)
(1,11
5.50
)-1
%-2
%-1
0%
I&M
Bur
bidg
e C
apita
l Lim
ited
3517
313
820
%4%
( 1
2.20
)(
7.4
0)(
17
.30)
204%
N/A
-80%
Youj
ays
Insu
ranc
e Br
oker
s Li
mite
d23
234
010
821
%4%
( 2
1.00
)(
11.
80)
( 1
5.80
)-5
%-8
%-5
0%
Giro
Lim
ited
1,94
46,
401
4,45
721
%5%
( 377
.00)
(215
.60)
( 64
0.10
)-9
%-2
0%-2
7%
I&M
Ban
k (U
gand
a) L
imite
d (F
orm
erly
O
rient
Ban
k Li
mite
d)72
13,
820
3,09
921
%5%
( 187
.40)
( 72
.00)
( 41
0.60
)-0
.2%
0.6%
-1.1%
Tota
l3,
892
19,9
6716
,075
OU
R FI
NA
NC
IALS
(Con
tinu
ed)
Our
Gov
erna
nce
Our
Bus
ines
sO
ur F
inan
cial
s

I&M GROUP PLC (FORMERLY I&M HOLDINGS PLC) ANNUAL INTEGRATED REPORT AND FINANCIAL STATEMENTS 2021 I&M GROUP PLC (FORMERLY I&M HOLDINGS PLC) ANNUAL INTEGRATED REPORT AND FINANCIAL STATEMENTS 2021 223222
26. Intangible assets (Continued)(b) Software
2021
SoftwareKShs'000
Capital work in
progressKShs'000
TotalKShs'000
Cost
At 1 January 2021 4,134,885) 436,690) 4,571,575)
Acquisition of I&M Bank (Uganda) Limited (Formerly Orient Bank Limited) 667,642) -) 667,642)
Additions 372,814) 500,809) 873,623)
Reclassification 419,164) ( 419,164) -)
Write offs ( 960) -) ( 960)
Translation differences 30,810) ( 799) 30,011)
At 31 December 2021 5,624,355) 517,536) 6,141,891)
Amortisation
At 1 January 2021 2,135,082) -) 2,135,082)
Acquisition of I&M Bank (Uganda) Limited (Formerly Orient Bank Limited) 597,251) -) 597,251)
Amortisation for the year 702,187) -) 702,187)
Write offs ( 960) -) ( 960)
Translation differences 23,462) -) 23,462)
At 31 December 2021 3,457,022) -) 3,457,022)
Carrying amount at 31 December 2021 2,167,333) 517,536) 2,684,869)
2020
Cost
At 1 January 2020 3,537,629) 127,322) 3,664,951)
Additions 422,946) 473,211) 896,157)
Reclassification 165,449) ( 165,449) -)
Disposals ( 39,353) -) ( 39,353)
Translation differences 48,214) 1,606) 49,820)
At 31 December 2020 4,134,885) 436,690) 4,571,575)
Amortisation
At 1 January 2020 1,622,044) -) 1,622,044)
Amortisation for the year 532,741) -) 532,741)
On disposals ( 39,353) -) ( 39,353)
Translation differences 19,650) -) 19,650)
At 31 December 2020 2,135,082) -) 2,135,082)
Carrying amount at 31 December 2020 1,999,803) 436,690) 2,436,493)
Notes to the consolidated and separate financial statementsFor the year ended 31 December 2021 (Continued)
OUR FINANCIALS (Continued)
Not
es to
the
cons
olid
ated
and
sep
arat
e fin
anci
al s
tate
men
tsFo
r the
yea
r end
ed 3
1 D
ecem
ber 2
021
(Con
tinu
ed)
27. D
efer
red
tax
asse
t - G
roup
2021
Bala
nce
at1
Janu
ary
KSh
s'00
0
Acq
uisi
tion
of
sub
sidi
ary
KSh
s'00
0
Prio
r yea
r ad
just
men
tK
Shs'
000
Reco
gnis
ed
in e
quit
yK
Shs'
000
Tran
slat
ion
diff
eren
ces
KSh
s'00
0
Reco
gnis
ed in
pr
ofit o
r los
sK
Shs'
000
Bala
nce
at31
Dec
embe
rK
Shs'
000
Prop
erty
and
equ
ipm
ent
(
550,
877)
-)13
,873
)(
47,9
91)
2,73
4)(
41
5,18
8)(
997
,449
)
Righ
t of u
se o
f ass
et(
2
4,60
6)-)
32,3
53)
-)30
0)(
2
6,04
5)(
1
7,998
)
Gen
eral
pro
visi
ons
544,
628)
1,35
3,00
6)11
3,15
6)-)
66,5
64)
627,4
17)
2,70
4,77
1)
Oth
er p
rovi
sion
s4,
061,
558)
-)(
130
,647
)-)
187,1
10)
(
105,
857)
4,01
2,16
4)
Fair
valu
e re
serv
es18
0,80
1)(
4,05
5)(
90
1)24
0,57
3)(
164
)(
13,5
57)
402,
697)
4,2
11,5
04)
1,34
8,95
1)27
,834
)19
2,58
2)25
6,54
4)
66,7
70)
6,10
4,1
85)
2020
Prop
erty
and
equ
ipm
ent
(
487
,278
)-)
(
2,2
85)
( 1
3,57
0)3,
138)
(
50,
882)
( 5
50,8
77)
Righ
t of u
se o
f ass
et16
,580
)(
25
,800
)-)
395)
(
15
,781
)(
2
4,60
6)
Gen
eral
pro
visi
ons
352,
858)
-)43
,632
)-)
15,6
19)
132,
519)
544,
628)
Oth
er p
rovi
sion
s2,
900,
145)
-)(
265
,979
)-)
(
2,5
59)
1,42
9,95
1)4,
061,
558)
Fair
valu
e re
serv
es23
2,53
1)-)
-)(
51,
920)
(
83)
273)
180,
801)
3,01
4,8
36)
-)( 2
50,4
32)
( 65
,490
)16
,510
)1,
496
,080
)4
,211
,504
)
OU
R FI
NA
NC
IALS
(Con
tinu
ed)
Our
Gov
erna
nce
Our
Bus
ines
sO
ur F
inan
cial
s

I&M GROUP PLC (FORMERLY I&M HOLDINGS PLC) ANNUAL INTEGRATED REPORT AND FINANCIAL STATEMENTS 2021 I&M GROUP PLC (FORMERLY I&M HOLDINGS PLC) ANNUAL INTEGRATED REPORT AND FINANCIAL STATEMENTS 2021 225224
28. Other Assets
Group Company
2021KShs'000
2020KShs'000
2021KShs'000
2020KShs'000
Prepayments 624,290 574,688 500 500
Other receivables 2,401,659 1,767,809 229,286 3,624
3,025,949 2,342,497 229,786 4,124
29.Deposits from banks
Group Company
2021KShs'000
2020KShs'000
2021KShs'000
2020KShs'000
Due within 90 days 15,299,029 5,119,979 - -
Due after 90 days 3,815,278 1,642,856 - -
19,114,307 6,762,835 - -
30. Deposits from customers
Group Company
2021KShs'000
2020KShs'000
2021KShs'000
2020KShs'000
Government and Parastatals 7,057,426 6,028,854 - -
Private sector and individuals 289,689,083 256,652,548 - -
296,746,509 262,681,402 - -
31 .Other liabilities
Group Company
2021KShs'000
2020KShs'000
2021KShs'000
2020KShs'000
Bankers cheques payable 108,680 141,705 - -
Accruals 1,817,442 1,656,161 6,658 3,580
Lease liabilities 1,696,214 1,798,872 - -
Provisions for loan commitments* 278,959 403,385 - -
Other accounts payable 1,608,811 1,288,027 - 2,633
Dividend payable 90,765 78,111 90,765 78,111
Derivative liabilities - 36,167 - -
5,600,871 5,402,428 97,423 84,324
*This represents impairment allowance for loan commitments and financial guarantee contracts.
Notes to the consolidated and separate financial statementsFor the year ended 31 December 2021 (Continued)
OUR FINANCIALS (Continued)
Notes to the consolidated and separate financial statementsFor the year ended 31 December 2021 (Continued)
OUR FINANCIALS (Continued)
31 .Other liabilities (Continued)Lease liability
Group 2021KShs'000
2020KShs'000
Expected to be settled within 12 months after the year end 494,860 504,488
Expected to be settled more than 12 months after the year end 1,201,354 1,294,384
1,696,214 1,798,872
The total cash outflow for leases in the year was:
Group roup 2021KShs'000
2020KShs'000
Payment of principal portion of lease liability 419,977 397,328
Intrest paid on lease liabilities 123,942 147,870
543,919 545,198
Lease liability movement
Group 2021KShs'000
2020KShs'000
Balance at 1 January 1,798,872) 1,619,632)
Acquisition of I&M Bank (Uganda) Limited (Formerly Orient Bank Limited) 155,081) -)
Additions 328,104) 550,523)
Interest expense 123,942) 147,870)
Lease payments ( 543,919) ( 545,198)
Disposal ( 27,037) -)
Translation difference ( 138,829) 26,045)
Balance at 31 December 1,696,214) 1,798,872)
Amounts recognized in profit or loss
Group 2021KShs'000
2020KShs'000
Interest on lease liabilities (Note 10) 123,942 147,870
Depreciation of right to use asset (Note 25) 485,084 380,603
609,026 528,473
Extension options
Some leases of office premises contain extension options exercisable by the Group up to one term after the end of the non-cancellable contract period. Where practicable, the Group seeks to include extension options in new leases to provide operational flexibility. The Group assesses at lease commencement date whether it is reasonably certain to exercise the extension options. The Group reassesses whether it is reasonably certain to exercise the options if there is a significant event or significant changes in circumstances within its control.
Our
Gov
erna
nce
Our
Bus
ines
sO
ur F
inan
cial
s

I&M GROUP PLC (FORMERLY I&M HOLDINGS PLC) ANNUAL INTEGRATED REPORT AND FINANCIAL STATEMENTS 2021 I&M GROUP PLC (FORMERLY I&M HOLDINGS PLC) ANNUAL INTEGRATED REPORT AND FINANCIAL STATEMENTS 2021 227226
32. Long term debt
Group Company
2021KShs'000
2020KShs'000
2021KShs'000
2020KShs'000
Less than one year 1,623,410 2,839,442 - -
One to five years 7,893,288 7,478,385 - -
9,516,698 10,317,827 - -
Loan movement schedule
Group Company
2021KShs'000
2020KShs'000
2021KShs'000
2020KShs'000
At 1 January 10,317,827) 6,210,571) - -
Acquisition of I&M Bank (Uganda) Limited (Formerly Orient Bank Limited) 75,118) -)
Funds received 1,872,226) 6,375,389) - -
Payments on principal and interest ( 3,114,889) ( 2,406,296) - -
Exchange differences 366,416) 138,163) - -
At 31 December 9,516,698) 10,317,827) - -
Long term borrowings constituted the following:
(i) USD 15,000,000 facility granted on 9 November 2018 by FMO repayable semi-annually over 4 and a half years after an initial one year grace period.
(ii) TZS 3,250 million facility granted by Tanzania Mortgage Refinance Company Limited (TMRC) in two tranches. TZS 1,800 million granted on 13 August 2018 for a tenure of 5 years and TZS 1,450 million granted on 30 August 2018 for a tenure of 3 years. The interest on the facility repayable quarterly basis and the principal at maturity.
(iii) USD 12,000,000 granted on 16th March 2016 by FMO as senior debts for tenor of 6 years. The interest and principal on the facility is repayable on a quarterly basis. Final Repayment date is 10 October 2021.
(iv) USD 15,000,000 granted on December 2018 by FMO as senior debts for tenor of 5 years. The interest and principal on the facility is repayable on a quarterly basis.
(v) USD 4,657,777 granted on 21 January 2019 and USD 5,342,223 granted on 12 April 2019 unsecured loans from European Investment Bank repayable in Rwandan Francs. The loans maturing on 17 November 2025, 15 May 2025 respectively.
Notes to the consolidated and separate financial statementsFor the year ended 31 December 2021 (Continued)
OUR FINANCIALS (Continued)
Notes to the consolidated and separate financial statementsFor the year ended 31 December 2021 (Continued)
OUR FINANCIALS (Continued)
33. Subordinated debt
Group Company
2021KShs'000
2020KShs'000
2021KShs'000
2020KShs'000
Less than one year 172,663 86,007 - -
One to five years 5,923,403 3,294,040 - -
Over five years 3,933,309 1,074,889 - -
10,029,375 4,454,936 - -
Subordinated debt comprises:
In Kenya, USD 27,350,000 medium term unsecured subordinated fixed and floating rate notes issued on 14 August 2019 for a tenure of 5 years with redemption on maturity date.
USD 50,000,000 subordinated facility issued on 28 June 2021 by IFC for a tenor of 6 years 9 months with redemption in four consecutive approximately equal instalments starting 15 Sept 2026 and on each interest payment date thereafter until and including 15 Mar 2028.
In Tanzania, USD 10 million granted on January 2015 by DEG of which USD 8 Million was received in January 2015 and matured on September 2021.
In Rwanda, USD 10 million 5-year subordinated loan with IFC.
The subordinated debt would in the event of winding up of the respective companies be subordinated to the claims of depositors and all other creditors. The Group and Company has not had any defaults of principal or interest with respect to these debts.
34. Share capital and reserves(a) Share capital and share premium – Group and Company
2021KShs'000
2020KShs'000
Authorised:
1,653,621,476 ordinary shares of KShs 1 each 1,653,621 1,500,000
Issued and fully paid:
Ordinary shares of KShs 1 each at 31 December 1,653,621 826,811
Movement of share capital and premium
2021 Number of shares
'000
Sharecapital
Kshs'000
Share premiumKshs'000
TotalKshs'000
At 1 January 826,811 826,811 18,390,507) 19,217,318)
Issued of bonus shares 826,810 826,810 ( 826,810) -)
Issue related costs - - ( 2,068) ( 2,068)
31 December 1,653,621 1,653,621 17,561,629) 19,215,250)
2020
1 January and 31 December 826,811 826,811 18,390,507) 19,217,318)
Our
Gov
erna
nce
Our
Bus
ines
sO
ur F
inan
cial
s

I&M GROUP PLC (FORMERLY I&M HOLDINGS PLC) ANNUAL INTEGRATED REPORT AND FINANCIAL STATEMENTS 2021 I&M GROUP PLC (FORMERLY I&M HOLDINGS PLC) ANNUAL INTEGRATED REPORT AND FINANCIAL STATEMENTS 2021 229228
34. Share capital and reserves (Continued)(a) Share capital and share premium – Group and Company (Continued)
During the Annual General Meeting (AGM) of 20 May 2021, shareholders approved issuance of bonus shares at a proportion of one (1) new share for every one (1) of existing and paid up shares held by shareholders respectively. The shares were treated as an increase in the amount of nominal amount of capital of the Company held by each shareholder. Requisite approvals were received and KShs 826,810,738 was capitalized from Share Premium account to form part of un-distributable capital.
The ordinary shares rank equally with regard to the company residual assets and are entitled to receive dividends as declared from time to time and to one vote per share at general meetings of the Company. The par value per share is KShs 1.00.
(b) Share premium
Share premium is the amount which the Company raises in excess of the par value/nominal value of the shares. This is disclosed in the statement of changes in equity appearing on pages 133-135.
(c) Revaluation reserve
The revaluation reserve arises on revaluation of buildings. When revalued property is disposed, the portion of the revaluation reserve that relates to that asset is transferred to retained earnings. This is disclosed in the statement of changes in equity appearing on pages 133-135.
(d) Fair value reserve
The fair value reserve includes the cumulative net change in the fair value of FVOCI investments, excluding impairment losses, until the investment is derecognised. This is disclosed in the statement of changes in equity appearing on pages 133-135.
(e) Translation reserve
The translation reserve comprises foreign exchange differences arising from the translation of the financial statements of foreign operations. Details of the Group investments outside Kenya are disclosed in Note 1 of the financial statements. This is disclosed in the statement of changes in equity appearing on pages 133-135.
(f) Statutory credit risk statutory reserve
Where impairment losses required by legislation or regulations exceed those computed under International Financial Reporting Standards (IFRSs), the excess is recognised as a statutory reserve and accounted for as an appropriation of retained profits and the reverse for reductions. These reserves are not distributable. This is disclosed in the statement of changes in equity appearing on pages 133-135.
(g) Defined benefit reserve
Bank One Limited (a joint venture for I&M Group PLC (Formerly I&M Holdings PLC)) operates a defined benefit scheme. The net obligation is calculated by estimating the amount of future benefit that employees have earned in return for their service in the current and prior periods; that benefit is discounted to determine its present value. The calculation is performed annually by a qualified actuary using the projected unit credit method. The Group share of actuarial gains or losses arising from the calculation are recognised in other comprehensive income.
Notes to the consolidated and separate financial statementsFor the year ended 31 December 2021 (Continued)
OUR FINANCIALS (Continued)
Notes to the consolidated and separate financial statementsFor the year ended 31 December 2021 (Continued)
OUR FINANCIALS (Continued)
35. Notes to the statement of cash flows(a) Reconciliation of profit before income tax to cash flow from operating activities
Group Company
2021 2020 2021 2020
Note KShs’000 KShs’000 KShs’000 KShs’000
Profit before income tax 12,412,906) 10,952,004) 6,704,086) 3,375,391)
Adjustments for:
Depreciation on property and equipment 25 835,699) 612,522) -) -)
Depreciation on right of use asset 25 485,084) 380,603) -) -)
Amortisation of intangible asset 26(b) 702,187) 532,741) -) -)
Interest on lease liabilities 31 123,942) 147,870) -) -)
Net loss/(gain) on sale of property and equipment 12,605) 3,332) -) -)
Profit on sale of available for sale securities ( 1,634,349) ( 1,986,392) -) -)
Profit/(loss) from joint venture 24(a) ( 548,890) 678,962) -) -)
Exchange reserves ( 50,290) 289,757) -) -)
12,338,894) 11,611,399) 6,704,086) 3,375,391)
Increase/(decrease) in operating assets
Movement in loans and advances to customers ( 17,454,205) ( 1 2,061,840)
Financial assets at fair value through profit or loss (FVTPL) ( 2,586,496) 3,861,037) -) -)
Financial assets measured at fair value through other comprehensive income (FVOCI) ( 22,589,549) ( 29,088,745) -) 88)
Other financial assets at amortised cost 5,314,260) ( 20,331,125) -) -)
Held for sale assets 42,405) ( 425,722) -) -)
Loans and advances to banks 1,597,194) -) -) -)
Cash and balances with Central Banks
– Cash Reserve Ratio ( 4,540,508) ( 683,367) -) -)
Other assets 18 ( 328,514) ( 281,847) ( 225,564) 4,756)
( 40,545,413) (59,011,609) ( 225,564) 4,844)
Increase/(decrease) in operating liabilities
Customer deposits 17,653,655) 32,944,893) -) -)
Deposits from banks 1,982,203) 1,100,467) -) -)
Long-term borrowings ( 939,292) 3,969,093) -) -)
Other liabilities ( 533,664) 434,441) 13,099) ( 6,257)
Amounts due to group company -) -) 50,368) ( 320)
18,162,902) 38,448,894) 63,467) ( 6,577)
Cash flows (utilised in)/ generated from operating activities ( 10,043,617) ( 8,951,316) 6,541,989) 3,373,658)
Tax paid 16(b) ( 4,238,920) ( 4,619,735) ( 7,212) ( 3,921)
Interest on lease liabilities 31 ( 123,942) ( 147,870) -) -)
Net cash flows (utilised in)/ generated from operating activities (14,406,479) (13,718,921) 6,534,777) 3,369,737)
Our
Gov
erna
nce
Our
Bus
ines
sO
ur F
inan
cial
s

I&M GROUP PLC (FORMERLY I&M HOLDINGS PLC) ANNUAL INTEGRATED REPORT AND FINANCIAL STATEMENTS 2021 I&M GROUP PLC (FORMERLY I&M HOLDINGS PLC) ANNUAL INTEGRATED REPORT AND FINANCIAL STATEMENTS 2021 231230
35. Notes to the statement of cash flows (Continued)(b) Analysis of cash and cash equivalents
Note 2021 KShs’000
a
2020 KShs’000
b
Change KShs’000c =(a – b)
Group
Cash and balances with Central Banks – excluding Cash Reserve Ratio 18 10,185,673) 7,895,312) 2,290,361)
Items in the process of collection 19 572,584) 361,631) 210,953)
Loans and advances to banks 20 15,202,486) 18,335,440) ( 3,132,954)
Deposits from banks 29 (15,299,029) ( 5,119,979) ( 10,179,050)
10,661,714) 21,472,404) (10,810,690)
Company
Cash and bank balances 38b 834,431) 446,059) 388,372)
(c) Acquisition of I&M Bank (Uganda) Limited (Formerly Orient Bank Limited) net of cash and cash equivalents
2021KShs’000
Total assets 20,030,162)
Total liabilities ( 17,436,437)
Net assets acquired 2,593,725)
Goodwill 694,443)
Net cash outflow 3,288,168)
Notes to the consolidated and separate financial statementsFor the year ended 31 December 2021 (Continued)
OUR FINANCIALS (Continued)
Notes to the consolidated and separate financial statementsFor the year ended 31 December 2021 (Continued)
OUR FINANCIALS (Continued)
36. Off balance sheet contingencies and commitments - Group(a) Legal proceedings
There were a number of legal proceedings outstanding against the Group as at 31 December 2021. No provision has been made as professional advice indicates that it is unlikely that any significant loss will arise (2020 – Nil).
(b) Contractual off-balance sheet financial liabilities
In the ordinary course of business, banking entities in the Group conduct business involving guarantees, acceptances and letters of credit. These facilities are offset by corresponding obligations of third parties. At the period end, the contingent liabilities were as follows:
Group 2021KShs'000
2020KShs'000
Contingencies related to:
Letters of credit 45,873,793 37,561,024
Guarantees 25,672,265 25,712,137
Other credit commitments 25,679,980 25,291,599
97,226,038 88,564,760
Commitments related to:
Outstanding spot/forward contracts 23,230,668 9,491,754
120,456,706 98,056,514
Nature of contingent liabilities
Guarantees are generally written by a bank to support performance by a customer to third parties. The Group will only be required to meet these obligations in the event of the customer’s default.
Letters of credit commit a bank to make payment to third parties, on production of documents, which are subsequently reimbursed by customers.
An acceptance is an undertaking by a bank to pay a bill of exchange drawn on a customer. The Group expects most acceptances to be presented, and reimbursement by the customer is almost immediate.
Forward contracts are arrangements to buy or sell a specified quantity of foreign currency, usually on a specified future date at an agreed rate.
The fair values of the respective currency forwards are carried on the face of the balance sheet.
Our
Gov
erna
nce
Our
Bus
ines
sO
ur F
inan
cial
s
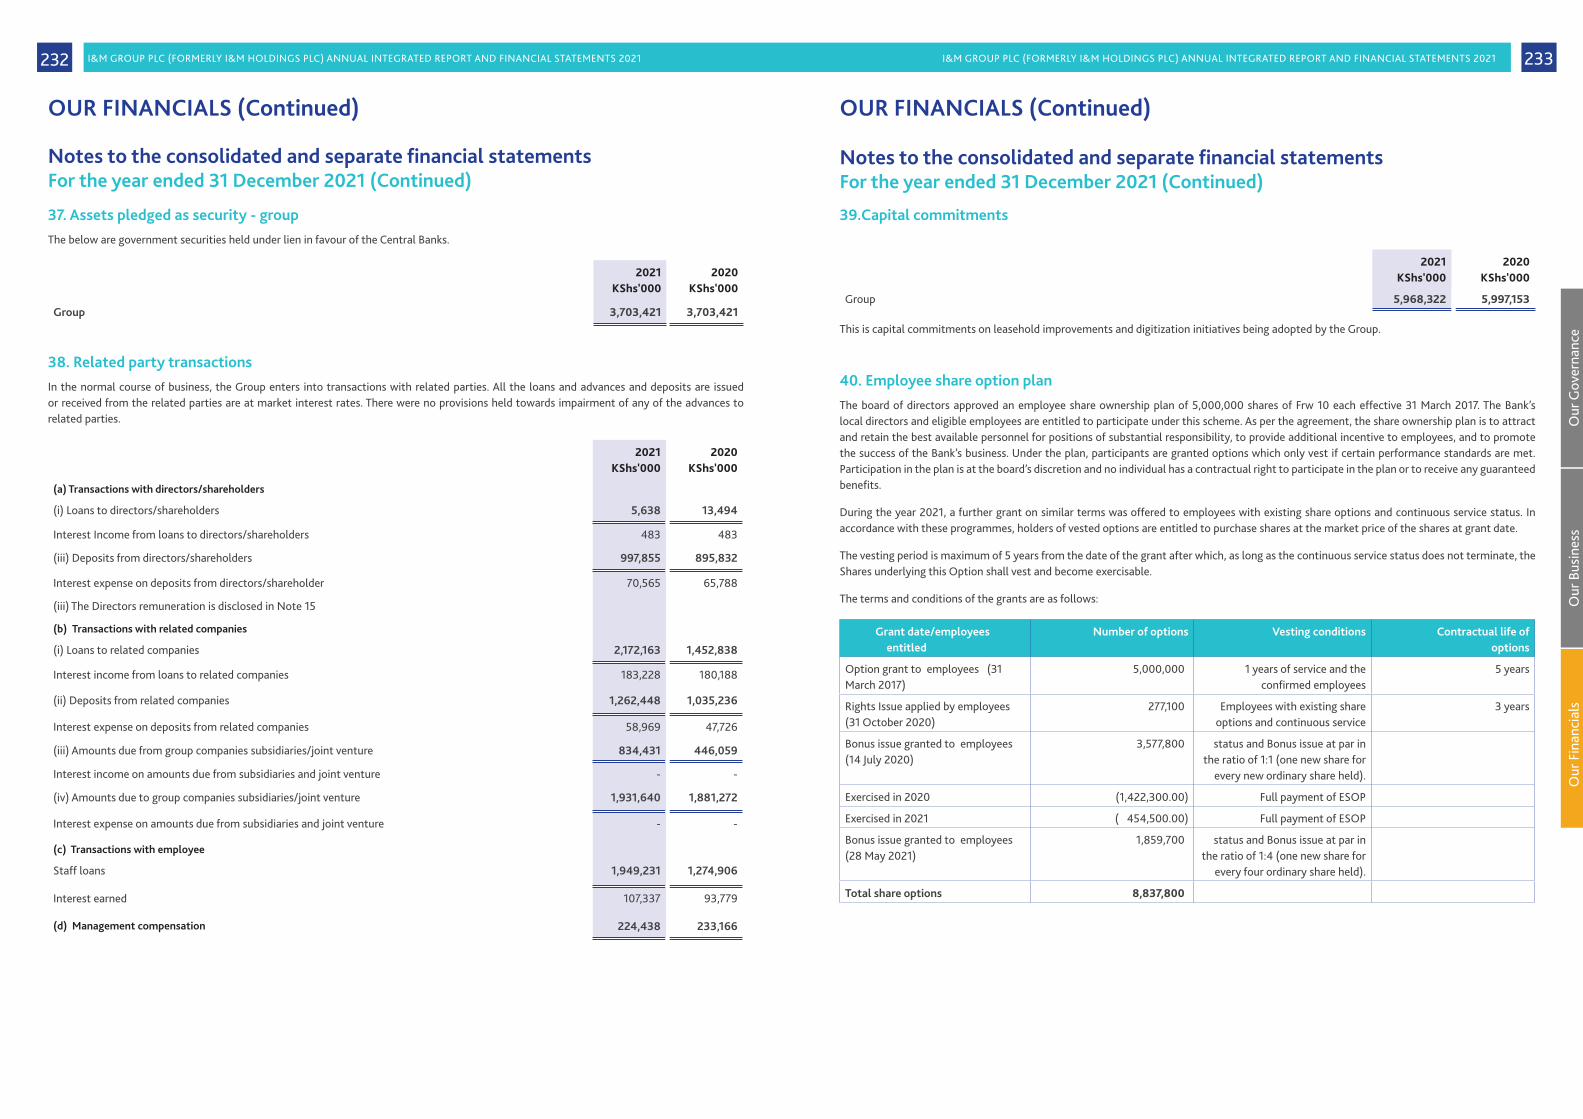
I&M GROUP PLC (FORMERLY I&M HOLDINGS PLC) ANNUAL INTEGRATED REPORT AND FINANCIAL STATEMENTS 2021 I&M GROUP PLC (FORMERLY I&M HOLDINGS PLC) ANNUAL INTEGRATED REPORT AND FINANCIAL STATEMENTS 2021 233232
37. Assets pledged as security - groupThe below are government securities held under lien in favour of the Central Banks.
2021KShs'000
2020KShs'000
Group 3,703,421 3,703,421
38. Related party transactionsIn the normal course of business, the Group enters into transactions with related parties. All the loans and advances and deposits are issued or received from the related parties are at market interest rates. There were no provisions held towards impairment of any of the advances to related parties.
2021KShs'000
2020KShs'000
(a) Transactions with directors/shareholders
(i) Loans to directors/shareholders 5,638 13,494
Interest Income from loans to directors/shareholders 483 483
(iii) Deposits from directors/shareholders 997,855 895,832
Interest expense on deposits from directors/shareholder 70,565 65,788
(iii) The Directors remuneration is disclosed in Note 15
(b) Transactions with related companies
(i) Loans to related companies 2,172,163 1,452,838
Interest income from loans to related companies 183,228 180,188
(ii) Deposits from related companies 1,262,448 1,035,236
Interest expense on deposits from related companies 58,969 47,726
(iii) Amounts due from group companies subsidiaries/joint venture 834,431 446,059
Interest income on amounts due from subsidiaries and joint venture - -
(iv) Amounts due to group companies subsidiaries/joint venture 1,931,640 1,881,272
Interest expense on amounts due from subsidiaries and joint venture - -
(c) Transactions with employee
Staff loans 1,949,231 1,274,906
Interest earned 107,337 93,779
(d) Management compensation 224,438 233,166
Notes to the consolidated and separate financial statementsFor the year ended 31 December 2021 (Continued)
OUR FINANCIALS (Continued)
Notes to the consolidated and separate financial statementsFor the year ended 31 December 2021 (Continued)
OUR FINANCIALS (Continued)
39.Capital commitments
2021KShs'000
2020KShs'000
Group 5,968,322 5,997,153
This is capital commitments on leasehold improvements and digitization initiatives being adopted by the Group.
40. Employee share option planThe board of directors approved an employee share ownership plan of 5,000,000 shares of Frw 10 each effective 31 March 2017. The Bank’s local directors and eligible employees are entitled to participate under this scheme. As per the agreement, the share ownership plan is to attract and retain the best available personnel for positions of substantial responsibility, to provide additional incentive to employees, and to promote the success of the Bank’s business. Under the plan, participants are granted options which only vest if certain performance standards are met. Participation in the plan is at the board’s discretion and no individual has a contractual right to participate in the plan or to receive any guaranteed benefits.
During the year 2021, a further grant on similar terms was offered to employees with existing share options and continuous service status. In accordance with these programmes, holders of vested options are entitled to purchase shares at the market price of the shares at grant date.
The vesting period is maximum of 5 years from the date of the grant after which, as long as the continuous service status does not terminate, the Shares underlying this Option shall vest and become exercisable.
The terms and conditions of the grants are as follows:
Grant date/employees entitled
Number of options Vesting conditions Contractual life of options
Option grant to employees (31 March 2017)
5,000,000) 1 years of service and the confirmed employees
5 years
Rights Issue applied by employees (31 October 2020)
277,100) Employees with existing share options and continuous service
3 years
Bonus issue granted to employees (14 July 2020)
3,577,800) status and Bonus issue at par in the ratio of 1:1 (one new share for
every new ordinary share held).
Exercised in 2020 (1,422,300.00) Full payment of ESOP
Exercised in 2021 ( 454,500.00) Full payment of ESOP
Bonus issue granted to employees (28 May 2021)
1,859,700) status and Bonus issue at par in the ratio of 1:4 (one new share for
every four ordinary share held).
Total share options 8,837,800)
Our
Gov
erna
nce
Our
Bus
ines
sO
ur F
inan
cial
s

I&M GROUP PLC (FORMERLY I&M HOLDINGS PLC) ANNUAL INTEGRATED REPORT AND FINANCIAL STATEMENTS 2021 I&M GROUP PLC (FORMERLY I&M HOLDINGS PLC) ANNUAL INTEGRATED REPORT AND FINANCIAL STATEMENTS 2021 235234
41. Events after reporting dateNo material events or circumstances have arisen between the accounting date and the date of this Report.
42. Contingent liabilitiesOn completion of the tax audit by Kenya Revenue Authority (KRA), covering the years of income 2011 to 2013, KRA raised an additional tax assessment on I&M Bank LIMITED (a wholly owned subsidiary of I&M Group PLC (formerly I&M Holdings PLC)) on June 2015. The Bank immediately settled amounts not in dispute and objected to all other items which were in the directors’ view erroneously assessed. The KRA confirmed the assessment on 13 March 2017 amounting to KShs 238,811,243. The matter was subsequently referred to the Tax Appeal Tribunal (Tribunal) by the High Court. The Tribunal issued its judgement and ruled partly in favour of the Bank and partly for the KRA for the various items assessed. The potential liability arising as a result of the Tribunal’s decision amounts to KShs 34,679,257. The Bank lodged an appeal against the Tribunal’s ruling at the High Court. Based on the prevailing Tax Procedure Act that defines, inter alia, timeframes in conduct of tax assessments, the directors in consultation with the bank’s legal and tax advisors are of the opinion the ruling will be in the Bank’s favour.
On completion of an excise duty audit by KRA covering the period from 1 January 2014 to 30 September 2018, KRA raised an additional excise duty assessment for an amount KShs 283,512,550 on the Bank on 17 January 2019. The Bank objected to all items which were in the Directors’ view erroneously assessed. The KRA subsequently confirmed the assessment on 15 April 2019 for an amount of KShs 231,220,414. The Bank lodged an appeal against this assessment to the Tax Appeal Tribunal. The matter was heard on 16 February 2021 and the tribunal ruled in favour of the Bank on 4 March 2022.
43. Other disclosures(a) Operational risk
The overall responsibility of managing operational risks - the risk arising from failed or inadequate internal processes, people, systems and external events - is vested with the Board of Directors. The Board’s of the various subsidiaries through their Board Risk Committee or equivalent, issues policies that guide management on appropriate practices of operational risk mitigation.
An independent Risk Manager assures the Board Risk Committee or equivalent of the implementation of the said policies.
The following are key measures that the Group undertakes in managing operational risk:
Documentation of procedures and controls, including regular review and updates to reflect changes in the dynamic business environment.
Appropriate segregation of duties, including the independent authorisation of transactions
• Reconciliation and monitoring of transactions • Compliance with regulatory and other legal requirements• Reporting of operational losses and ensuring appropriate remedial action to avoid recurrence. • Development and implementation of Business Continuity and Disaster Recovery Plans• Training and professional development of employees to ensure they are well equipped to identify and mitigate operational risks in a timely
manner.• Establishment of ethical practices at business and individual employee’s level. • Implementation of Risk mitigation parameters, including insurance where this is considered effective.
The entire operational risk management framework is subjected to periodic independent audits (internal) in order for the Group to obtain an independent opinion on the effectiveness and efficiency of the framework. Further, the findings of the Internal Audit department are reviewed by the Board Audit Committee or equivalent committees of the respective subsidiaries and recommendations made implemented in line with the agreed timeframe.
(b) Compliance and regulatory risk
Compliance and regulatory risk includes the risk of bearing the consequences of non-compliance with regulatory requirements. The compliance function is responsible for establishing and maintaining an appropriate framework of Group compliance policies and procedures. Compliance with such policies and procedures is the responsibility of all managers.
Notes to the consolidated and separate financial statementsFor the year ended 31 December 2021 (Continued)
OUR FINANCIALS (Continued)
Notes to the consolidated and separate financial statementsFor the year ended 31 December 2021 (Continued)
OUR FINANCIALS (Continued)
43. Other disclosures (Continued)(c) Environmental and social risks
Environmental and social risks are the risks that the Group could bear the consequences of socio-environmental fall-out of transactions. Such risks could arise from failure of the Group to assess the impacts of activities (of both the group and its clients) which could harm the environment or have negative social impact.
The Group is aware that it has a responsibility to ensure that its internal practice and its lending activities do not have negative environmental and social impacts and is thus committed to ensure that such risks are sufficiently managed through its environmental and social management policy and by adopting the country’s labour and environmental laws.
The Group also adheres to international best practice i.e. International Finance Corporation (IFC) performance standards and International Labour Organisation (ILO) standards, as ratified by the Kenya government and Governments of the various jurisdictions in which the Group operates. An environmental and social management system is being put in place to ensure due diligence and monitoring of the environmental and social risk is done efficiently. Compliance to these laws is monitored by the compliance function.
The Directors are responsible for selection and disclosure of the Group’s critical accounting policies and estimates and the application of these policies and estimates.
44. Acquisiton of subsidiaryOn 30 April 2021, the Group acquired 90% of the shares and voting interests in I&M Bank (Uganda) Limited (formerly Orient Bank Limited). The acquisition is expected to provide the Group with an enhanced presence in the Eastern Africa Region in line with the group’s strategy of being Eastern Africa’s leading financial partner for growth.
For the eight months ended 31 December 2021, the subsidiary contributed revenue of KShs 1 billion and loss after tax of KShs 373 million to the Group’s results. If the acquisition had occurred on 1 January 2021, management estimates that the consolidated revenue would have been KShs 1.4 billion and the consolidated loss after tax should have been KShs 704.5 million. In determining these amounts, management has assumed that the fair value adjustments, determined provisionally, that arose on the date of acquisition would have been the same if the acquisition had occurred on 1 January 2021.
(a) Consideration transferred
The following summarises the acquisition consideration transferred.
2021KShs'000
Cash consideration 3,288,168
Contingent consideration -
Purchase consideration 3,288,168
(b) Acquisition-related cost
The Group incurred acquisition-related costs of Kshs 52 million on legal and professional fees, licenses fees and due diligence expenses. These costs have been included in the company administrative expenses.
Our
Gov
erna
nce
Our
Bus
ines
sO
ur F
inan
cial
s
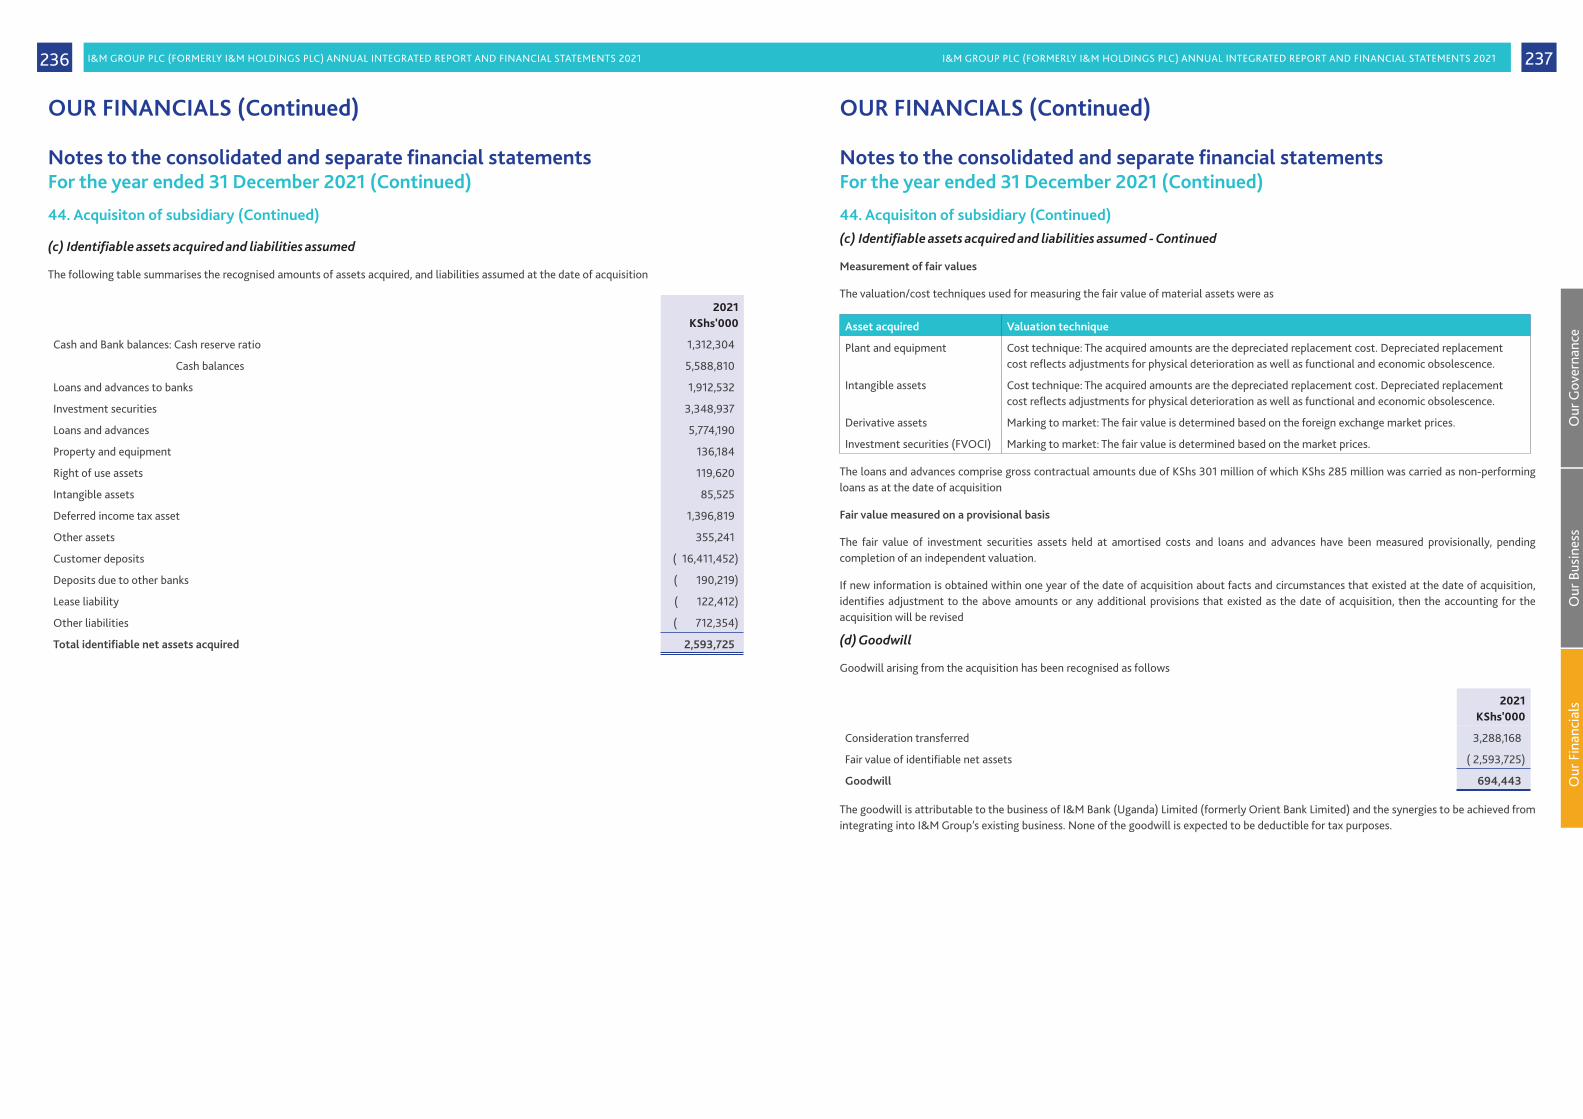
I&M GROUP PLC (FORMERLY I&M HOLDINGS PLC) ANNUAL INTEGRATED REPORT AND FINANCIAL STATEMENTS 2021 I&M GROUP PLC (FORMERLY I&M HOLDINGS PLC) ANNUAL INTEGRATED REPORT AND FINANCIAL STATEMENTS 2021 237236
44. Acquisiton of subsidiary (Continued)
(c) Identifiable assets acquired and liabilities assumed
The following table summarises the recognised amounts of assets acquired, and liabilities assumed at the date of acquisition
2021KShs'000
Cash and Bank balances: Cash reserve ratio 1,312,304)
Cash balances 5,588,810)
Loans and advances to banks 1,912,532)
Investment securities 3,348,937)
Loans and advances 5,774,190)
Property and equipment 136,184)
Right of use assets 119,620)
Intangible assets 85,525)
Deferred income tax asset 1,396,819)
Other assets 355,241)
Customer deposits ( 16,411,452)
Deposits due to other banks ( 190,219)
Lease liability ( 122,412)
Other liabilities ( 712,354)
Total identifiable net assets acquired 2,593,725)
Notes to the consolidated and separate financial statementsFor the year ended 31 December 2021 (Continued)
OUR FINANCIALS (Continued)
44. Acquisiton of subsidiary (Continued)(c) Identifiable assets acquired and liabilities assumed - Continued
Measurement of fair values
The valuation/cost techniques used for measuring the fair value of material assets were as
Asset acquired Valuation technique
Plant and equipment Cost technique: The acquired amounts are the depreciated replacement cost. Depreciated replacement cost reflects adjustments for physical deterioration as well as functional and economic obsolescence.
Intangible assets Cost technique: The acquired amounts are the depreciated replacement cost. Depreciated replacement cost reflects adjustments for physical deterioration as well as functional and economic obsolescence.
Derivative assets Marking to market: The fair value is determined based on the foreign exchange market prices.
Investment securities (FVOCI) Marking to market: The fair value is determined based on the market prices.
The loans and advances comprise gross contractual amounts due of KShs 301 million of which KShs 285 million was carried as non-performing loans as at the date of acquisition
Fair value measured on a provisional basis
The fair value of investment securities assets held at amortised costs and loans and advances have been measured provisionally, pending completion of an independent valuation.
If new information is obtained within one year of the date of acquisition about facts and circumstances that existed at the date of acquisition, identifies adjustment to the above amounts or any additional provisions that existed as the date of acquisition, then the accounting for the acquisition will be revised
(d) Goodwill
Goodwill arising from the acquisition has been recognised as follows
2021KShs'000
Consideration transferred 3,288,168
Fair value of identifiable net assets ( 2,593,725)
Goodwill 694,443)
The goodwill is attributable to the business of I&M Bank (Uganda) Limited (formerly Orient Bank Limited) and the synergies to be achieved from integrating into I&M Group’s existing business. None of the goodwill is expected to be deductible for tax purposes.
Notes to the consolidated and separate financial statementsFor the year ended 31 December 2021 (Continued)
OUR FINANCIALS (Continued)
Our
Gov
erna
nce
Our
Bus
ines
sO
ur F
inan
cial
s

I&M GROUP PLC (FORMERLY I&M HOLDINGS PLC) ANNUAL INTEGRATED REPORT AND FINANCIAL STATEMENTS 2021 I&M GROUP PLC (FORMERLY I&M HOLDINGS PLC) ANNUAL INTEGRATED REPORT AND FINANCIAL STATEMENTS 2021 239238
AGM Notice
Notice of the Annual General Meeting
The Company will conduct the virtual Annual General Meeting in accordance with Article 66A of its Articles of Association. Shareholders will be able to register for, access information pertaining to the Integrated Report, Audited Financial Statements of I&M Group PLC for the year ending 31 December, 2021 and the proposed resolutions, follow the meeting in the manner detailed below and vote electronically or by proxy. Shareholders may ask questions in advance of the meeting as detailed below:
A. ORDINARY BUSINESS1. To receive the Group’s audited financial statements for the year ended 31 December, 2021 together with the Chairman’s,
Directors’ and Auditors’ reports thereon.2. To approve the Directors’ remuneration as provided in the accounts for the year ended 31 December 2021.3. To approve payment of a first and final dividend of Kshs. 1.50 per share amounting to Kshs. 2,480,432,214 for the year ended 31
December 2021. The dividend will be payable to the shareholders in the Company’s Register of Members at the close of business on Thursday, 21st April 2022 and will be paid on or around Thursday, 26th May 2022.
4. To re-elect directors:i. In accordance with Article 2.5 of the CMA Code of Corporate Governance Practices for Issuers of Securities to the Public, 2015,
Mr. Daniel Ndonye, having attained the age of 70 years retires and offers himself for re-election.ii. In accordance with Article 2.5 of the CMA Code of Corporate Governance Practices for Issuers of Securities to the Public, 2015,
Mr. S B R Shah having attained the age of 70 years retires and offers himself for re-election.iii. In accordance with Article No. 112 of the Company’s Articles of Association Mr. Michael Turner, retires by rotation and being
eligible offers himself for re-election.iv. In accordance with Article No. 112 of the Company’s Articles of Association Dr. Alice Nyambura Koigi, retires by rotation and
being eligible offers herself for re-election.v. In accordance with Article No. 112 of the Company’s Articles of Association Ms. Rose Wanjiru Kinuthia, retires by rotation and
being eligible offers herself for re-election.5.Pursuant to the provisions of Section 769 of the Companies Act, 2015, Ms. Rose Wanjiru Kinuthia, Mr. Michael Turner, Dr. Alice
Nyambura Koigi and Mr. Allan Christopher Michael Low being members of the Board Audit and Risk Management Committee, be elected to continue to serve as Members of this Committee.
6.To note that the auditors Messrs. KPMG Kenya Certified Public Accountants (K), having expressed their willingness, continue in office in accordance with Section 721 (2) of the Companies Act, 2015 and to authorize the Directors to fix their remuneration for the ensuing financial year.
B. SPECIAL BUSINESS7. Amendment of the Articles of AssociationTo consider and if thought fit to pass the following resolutions as SPECIAL RESOLUTIONS;
a. THAT, the new Articles of Association (a copy of which were tabled at the meeting) be and are hereby adopted as the Articles of Association of the Company in complete substitution for, and to the exclusion of, the Company's existing Articles of Association, including any provisions contained in the Company's memorandum of association that were automatically deemed to form part of the Company's existing articles under section 26 of the Companies Act, 2015.
b. THAT, the Company Secretary or any other person authorised by the board of directors of the Company be and is hereby instructed to take all necessary action and file all applicable returns required to implement this resolution.
8. To transact any other business which may be properly transacted at an Annual General Meeting.BY ORDER OF THE BOARD
Bilha Wanjiru Mwangi Company Secretary, P.O. Box 51922-00100, Nairobi.
Friday, 29th April 2022
Notice is hereby given that the Seventieth Annual General Meeting of the Shareholders of I&M Group Plc will be held via electronic communication on 26th May, 2022 at 10.00 a.m. for purposes of transacting the business set out below.
AGM Notice (Continued)
Notice of the Annual General Meeting
1. The Companies Act, 2015 was amended to permit companies to convene and conduct virtual general meetings. In this respect, I&M Group Plc amended its Articles of Association accordingly. I&M Group PLC has convened and is conducting this virtual Annual General Meeting in accordance with Article 66A of its Articles of Association. Shareholders wishing to participate in the meeting should register using either of the following:a. Through the web portal By logging onto https://escrowagm.com/imbank/login.aspx and filling in the registration form. In order to complete the
registration process, shareholders will need to have their ID/Passport Numbers which were used to purchase their shares and/or their CDSC or Share Account Number at hand. For assistance shareholders should dial the following helpline number: (+254) 710 888 000 between 9:00 a.m. to 4:00 p.m. from Monday to Friday.
b. Unstructured Supplementary Service Data (USSD) By dialing *483*560# and following the prompts. In order to complete the registration process, shareholders will need to
have their ID/Passport Numbers which were used to purchase their shares and/or their CDSC or Share Account Number at hand. For assistance shareholders should dial the following helpline number: (+254) 710 888 000 between 9:00 a.m. to 4:00 p.m. from Monday
to Friday. The USSD service cost will be borne by the Company.2. Registration for the AGM opens on Wednesday 18th May, 2022 at 8:00 am and shall remain open to any Shareholder wishing to
participate in the meeting.3. In accordance with Section 283 (2) (c) of the Companies Act, the following documents may be viewed on the Company’s website
at https://www.imbankgroup.com/investor-relationsi.A copy of this Notice and the proxy form; andii.The Company’s Integrated Report and Audited Financial Statements for the year 2021.iii.New Articles of Association of the Companyiv. Explanatory notes for special resolutions to be passed at the annual general meeting4. Shareholders wishing to raise any questions or clarifications regarding the AGM may do so by:
a. Sending their written questions by email to [email protected] orb. To the extent possible, physically delivering their written questions with a return physical address or email address to the
registered office of the Company at 1 Park Avenue, First Parklands Avenue, P.O. Box 30238-00100, Nairobi or to CDSC Registrars Limited’s offices at 1st Floor, Occidental Plaza, Westlands, Nairobi; or . Sending their written questions with a return physical address or email address by registered post to the Company’s address at P.O. Box 30238 -00100 Nairobi.
c. Shareholders must provide their full details (full names, ID/Passport Number/CDSC or Share Account Number) when submitting their questions and clarifications.
d. All questions and clarification must reach the Company on or before 23rd May, 2022 at 5:00pm.e. Following receipt of the questions and clarifications, the directors of the Company shall provide written responses to the
questions received to the return physical address or email address provided by the Shareholder no later than 24 hours before the start of the general meeting.
f. A full list of all questions received and the answers thereto will be published on the Company’s website not later than 24 hours before the start of the general meeting.
5.In accordance with Section 298 (1) of the Companies Act, shareholders entitled to attend and vote at the AGM are entitled to appoint a proxy to vote on their behalf. A proxy need not be a member of the Company but if not the Chairman of the AGM, the appointed proxy will need access to a mobile telephone.
A proxy form is available on the Company’s website via this link: https://www.imbankgroup.com/investor-relations. Physical copies of the proxy form are also available at the following
address: CDSC Registrars Limited’s offices at 1st Floor, Occidental Plaza, Westlands, Nairobi. A proxy must be signed by the appointor or his attorney duly authorized in writing. If the appointer is a body corporate, the
instrument appointing the proxy shall be given under the hand of an officer or duly authorized attorney of such body corporate. A completed form of proxy should be emailed to [email protected] or delivered to CDSC Registrars Limited’s offices at 1st Floor, Occidental Plaza, Westlands, P.O. Box 6341- 001000 Nairobi, so as to be received not later than 24th May 2022 at 5.00 p.m. Any shareholder appointing a proxy must provide the phone number, Identity Card Number and e-mail address of the proxy on the proxy form. Any proxy registration that is rejected will be communicated to the shareholder concerned no later than 25th May, 2022 to allow time to address any issues.
6. All proxies should register using either the web portal or USSD. When registering, the proxy will be required to use their identity card/Passport Number. For further assistance, Proxies may call CDSC Registrars Limited on +254 710 888 000.
7. The AGM will be streamed live via a link which shall be provided to all shareholders who will have registered to participate in the generalmeeting. Duly registered shareholders and proxies shall be able to join the meeting either by logging into the system using their registration credentials or following proceedings on the link to be shared.
8. Duly registered shareholders and proxies may follow the proceedings of the AGM using the live stream platform. Duly registered shareholders and proxies may vote (when prompted by the Chairman) for resolutions on a panel provided next to the live stream screen or via the USSD prompts.
9. Results of the AGM shall be published within 24 hours following conclusion of the AGM. The results will also be available on the web portal and summarized results on the USSD menu.
Our
Gov
erna
nce
Our
Bus
ines
sO
ur F
inan
cial
s
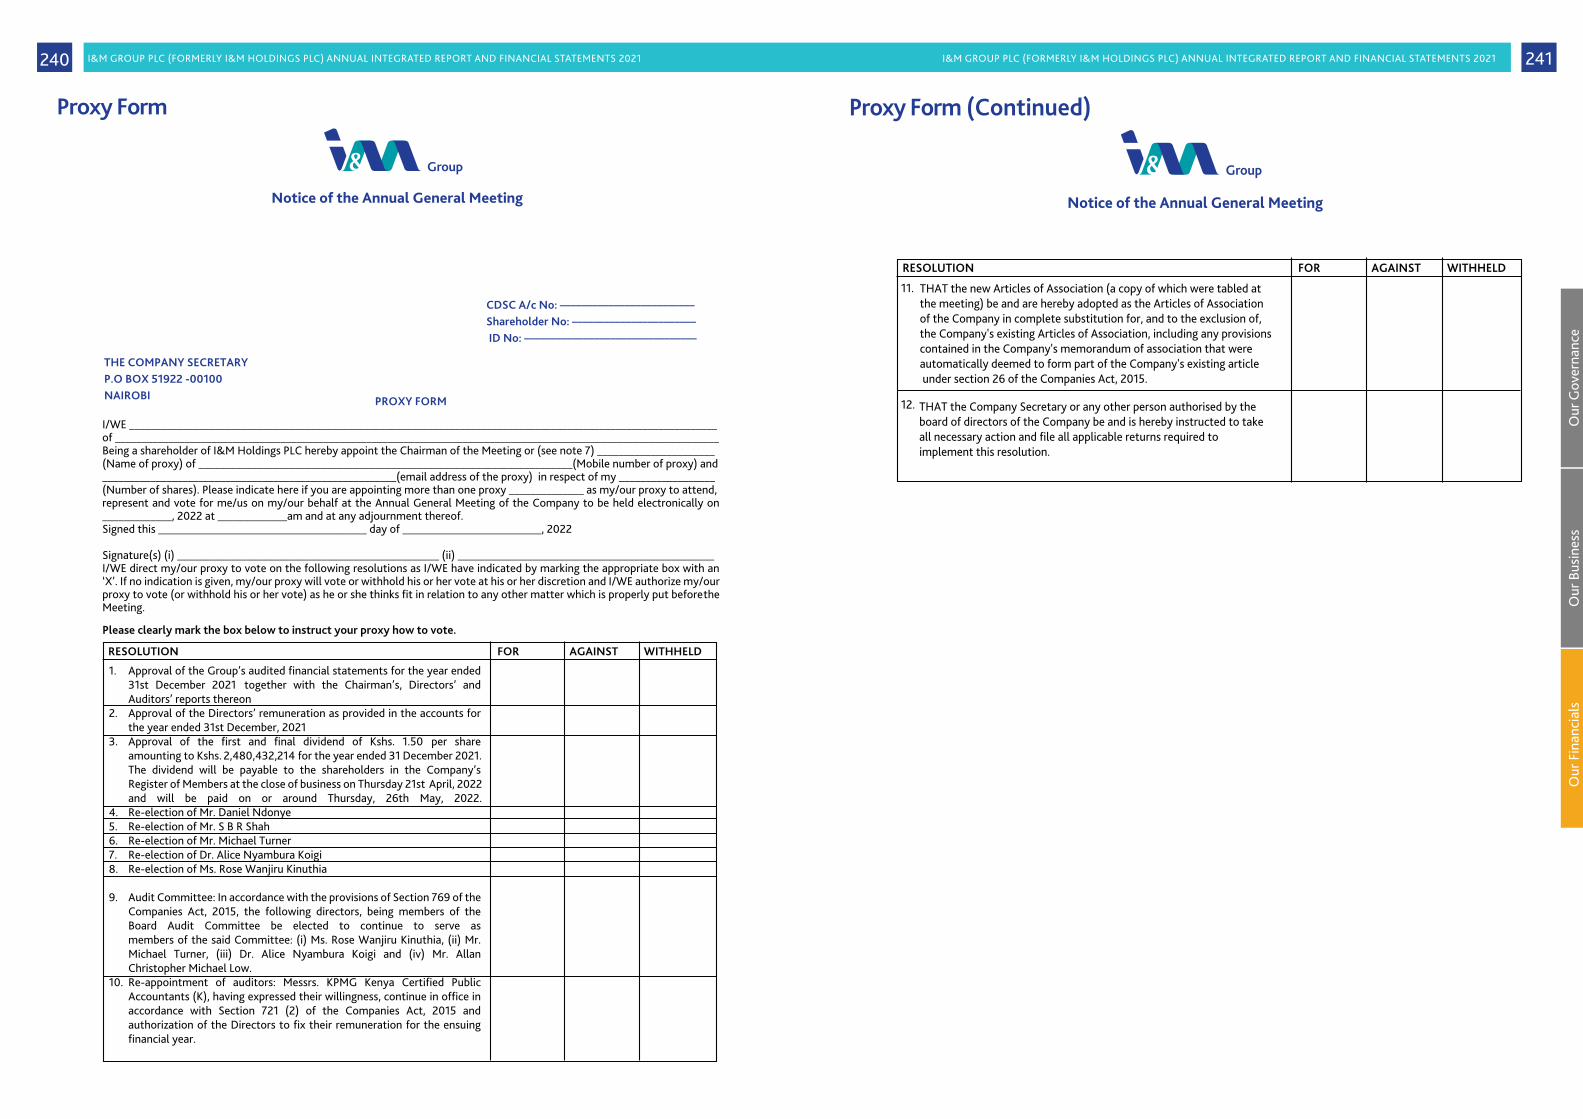
I&M GROUP PLC (FORMERLY I&M HOLDINGS PLC) ANNUAL INTEGRATED REPORT AND FINANCIAL STATEMENTS 2021 I&M GROUP PLC (FORMERLY I&M HOLDINGS PLC) ANNUAL INTEGRATED REPORT AND FINANCIAL STATEMENTS 2021 241240
Proxy Form
Notice of the Annual General Meeting
PROXY FORM
CDSC A/c No: –––––––––––––––––––––––––Shareholder No: ––––––––––––––––––––––– ID No: ––––––––––––––––––––––––––––––––
THE COMPANY SECRETARYP.O BOX 51922 -00100NAIROBI
I/WE ______________________________________________________________________________________________________________of _________________________________________________________________________________________________________________Being a shareholder of I&M Holdings PLC hereby appoint the Chairman of the Meeting or (see note 7) ______________________ (Name of proxy) of ______________________________________________________________________(Mobile number of proxy) and _______________________________________________________(email address of the proxy) in respect of my __________________ (Number of shares). Please indicate here if you are appointing more than one proxy ______________ as my/our proxy to attend,represent and vote for me/us on my/our behalf at the Annual General Meeting of the Company to be held electronically on _____________, 2022 at _____________am and at any adjournment thereof.Signed this _______________________________________ day of __________________________, 2022
Signature(s) (i) _________________________________________________ (ii) ________________________________________________I/WE direct my/our proxy to vote on the following resolutions as I/WE have indicated by marking the appropriate box with an ‘X’. If no indication is given, my/our proxy will vote or withhold his or her vote at his or her discretion and I/WE authorize my/our proxy to vote (or withhold his or her vote) as he or she thinks fit in relation to any other matter which is properly put before the Meeting.
Approval of the Group’s audited financial statements for the year ended 31st December 2021 together with the Chairman’s, Directors’ and Auditors’ reports thereonApproval of the Directors’ remuneration as provided in the accounts for the year ended 31st December, 2021Approval of the first and final dividend of Kshs. 1.50 per share amounting to Kshs. 2,480,432,214 for the year ended 31 December 2021. The dividend will be payable to the shareholders in the Company’s Register of Members at the close of business on Thursday 21st April, 2022 and will be paid on or around Thursday, 26th May, 2022.Re-election of Mr. Daniel NdonyeRe-election of Mr. S B R ShahRe-election of Mr. Michael TurnerRe-election of Dr. Alice Nyambura KoigiRe-election of Ms. Rose Wanjiru Kinuthia
Audit Committee: In accordance with the provisions of Section 769 of the Companies Act, 2015, the following directors, being members of the Board Audit Committee be elected to continue to serve as members of the said Committee: (i) Ms. Rose Wanjiru Kinuthia, (ii) Mr. Michael Turner, (iii) Dr. Alice Nyambura Koigi and (iv) Mr. Allan Christopher Michael Low. Re-appointment of auditors: Messrs. KPMG Kenya Certified Public Accountants (K), having expressed their willingness, continue in office in accordance with Section 721 (2) of the Companies Act, 2015 and authorization of the Directors to fix their remuneration for the ensuing financial year.
1.
2.
3.
4.5.6.7.8.
9.
10.
Please clearly mark the box below to instruct your proxy how to vote.
RESOLUTION FOR AGAINST WITHHELD
Proxy Form (Continued)
Notice of the Annual General Meeting
THAT the new Articles of Association (a copy of which were tabled atthe meeting) be and are hereby adopted as the Articles of Associationof the Company in complete substitution for, and to the exclusion of,the Company's existing Articles of Association, including any provisionscontained in the Company's memorandum of association that wereautomatically deemed to form part of the Company's existing article under section 26 of the Companies Act, 2015.
11.
12.
RESOLUTION FOR AGAINST WITHHELD
THAT the Company Secretary or any other person authorised by the board of directors of the Company be and is hereby instructed to take all necessary action and file all applicable returns required to implement this resolution.
Our
Gov
erna
nce
Our
Bus
ines
sO
ur F
inan
cial
s

I&M GROUP PLC (FORMERLY I&M HOLDINGS PLC) ANNUAL INTEGRATED REPORT AND FINANCIAL STATEMENTS 2021 I&M GROUP PLC (FORMERLY I&M HOLDINGS PLC) ANNUAL INTEGRATED REPORT AND FINANCIAL STATEMENTS 2021 243242
Your money shouldn’t retirewhen you do.
Download Now
Simplicity at its best

I&M GROUP PLC (FORMERLY I&M HOLDINGS PLC) ANNUAL INTEGRATED REPORT AND FINANCIAL STATEMENTS 2021244
I&M Group Plc1 Park Avenue,1st Parklands [email protected]. Box 30238-00100+254 (0)20 3221002www.imbankgroup.com