
Transforming Electricity Consumers into Customers - USAID
63
Transforming Electricity Consumers into Customers: Case Study of a Slum Electrification and Loss Reduction Project in São Paulo, Brazil FEBRUARY 2009 This publication was produced for review by the United States Agency for International Development. It was prepared by Nexant, Inc. and its subcontractor Smyser Associates under Contract No. EPP-I-02-03-00007-00 Order 02 Bureau for Economic Growth, Agriculture and Trade U.S. Agency for International Development Washington, D.C. 20523
-
Upload
khangminh22 -
Category
Documents
-
view
1 -
download
0
Transcript of Transforming Electricity Consumers into Customers - USAID

Transforming Electricity Consumers into Customers: Case Study of a Slum Electrification and Loss Reduction Project in São Paulo, Brazil
FEBRUARY 2009This publication was produced for review by the
United States Agency for International Development. It was prepared by Nexant, Inc. and
its subcontractor Smyser Associates under Contract No. EPP-I-02-03-00007-00 Order 02
Bureau for Economic Growth, Agriculture and Trade
U.S. Agency for International DevelopmentWashington, D.C. 20523

Contents
Section Page
Executive Summary .......................................................................................................... 1 Overview........................................................................................................................................................1 Pilot Project Components..........................................................................................................................1 Results Obtained and Key Performance Indicators .............................................................................2 Lessons Learned Regarding Sustainability and Replication .................................................................3
Section 1 .................................................................... 7 Introduction and Background1.1 .....................................................................................................................................7 Introduction1.2 ..............................................................................................................8 The SELR Brazil Partners
1.2.1 .....................................................8 United States Agency for International Development1.2.2 ........................................................................................................................8 AES Eletropaulo1.2.3 .............................................................................9 ICA – International Copper Association
1.3 .......................9 Background on the Challenges and Opportunities of Slum Electrification1.3.1 ......................................... 10 USAID’s Slum Electrification and Loss Reduction Program
1.4 ..................................................................... 11 Background on the Brazilian Electricity Sector1.4.1 ................................................................................................................ 11 Low Income Tariffs1.4.2 ............. 13 ANEEL’s Program to Reduce Non-technical Losses in Low Income Areas
1.5 ........................ 13 Description, History and Organization of the Paraisópolis Community1.5.1 ......................................................................................... 13 Slums in Brazil and in São Paulo1.5.2 ................................................................................................................. 13 Paraisópolis Today
Section 2 ............................................................18 Pilot Design and Implementation2.1 ........................... 18 Objectives, Key Performance Indicators and Partner Responsibilities2.2 ....................................................................................................................... 20 Pilot Components
2.2.1 ............................................................................................ 21 Project Concept and Timeline2.2.2 . 21 Distribution System Efficiency Upgrades and Customer ‘Anti-Theft’ Technology2.2.3
...................................................................... 23 Preparation of Consumers for Regularization, Affordability Measures,
and Energy Efficiency and Safety Education2.2.4 ...................................................................................................................... 28 Safety Measures2.2.5 ................................................................................................................... 29 Consumer Polling2.2.6 ...................................................................................... 30 Financial Analysis and Case Study
2.3 ............................................................. 30 Summary of the Changes in the Original Pilot PlanSection 3 .................................................................................32 Evaluation of Results
3.1 .................................................................................................................................. 32 Introduction3.2 ................................................................................ 33 Company Perspective or Business Case
3.2.1 ......................................................................... 36 Discussion of the Cases and Sensitivities3.3 ........................................................................................................................... 39 Consumer Case
3.3.1 ............................................................ 40 Reduction in Inefficient Consumption Achieved3.3.2 .................................................................................. 43 Affordability of Billed Consumption3.3.3 ..................................................... 50 Improvement in the Reliability of Electricity Service3.3.4 ......................................... 50 Improvement in Personal Safety and Physical Environment3.3.5 .................................................. 51 Improved legal and Institutional Status within Society3.3.6 .................................................... 51 Awareness of Changes and Satisfaction with Service
Transforming Electricity Consumers into Customers: i Case Study of a Slum Electrification and Loss Reduction Project in São Paulo, Brazil

Section Page
3.4 ................................................................................................... 51 Society and Community Case3.4.1 ........................................................... 51 Community and Other Stakeholder Acceptance3.4.2 .............................................................................................. 52 Improved Security and Safety3.4.3 ............................................................................... 52 Regulator and Ratepayer Acceptance
Section 4 ........................54 Lessons Learned, Replication and Sustainability Issues4.1 .......................................................................................................................... 54 Lessons Learned
4.1.1 ....................................................................... 54 Customer Registration and Area Mapping4.1.2 .............................................................................................. 54 Connecting New Customers4.1.3
................................................................................. 54 Communication with Customers and Preparing Them for Regularization
and Controlling Their Consumption4.1.4 ......................................................................... 55 Delivering and Installing Safety Measures
4.2 ................................................................................................ 55 Replication in Other Countries4.3 ................................................................... 56 Sustainability Issues for the SELR Brazil Project
4.3.1 ..................................................................................................................... 56 Collection Rates4.3.2 ............................................................................................... 56 Possible Regulatory Changes4.3.3 ................................. 57 Degradation of Efficiency Gains and Bill Payment Performance
4.4 .................................................................... 57 Next Steps for AES and International PartnersAppendix A ..............................59 Additional Information on Brazilian Tariff Reviews
Transforming Electricity Consumers into Customers: ii Case Study of a Slum Electrification and Loss Reduction Project in São Paulo, Brazil

Transforming Electricity Consumers into Customers: iii Case Study of a Slum Electrification and Loss Reduction Project in São Paulo, Brazil
Figures and Tables
Figure Page
Figure 3-1 Results of Cases and Sensitivities .................................................................................37 Figure 3-2 Proportion of Post-Regularization Consumption by Customer Type.................39 Figure 3-3 Effect of Regularization and Energy Efficiency Measures on Consumption ........41 Figure 3-4 General Bad Debt (# of Customers with Unpaid Bills) ..........................................44 Figure 3-5 Comparison of Bad Debts during Capped and Uncapped Billing Periods ..........45 Figure 3-6 Distribution of Bad Debt by Size of Consumption (all customers) (October to December).................................................................................................45 Figure 3-7 Breakdown of Residential Customers by Salary Range...........................................46 Figure 3-8 Effect of EE Measures on the Average Bill by Consumption Class.......................47 Figure 3-9 Range of Consumption Before and After the Refrigerator Replacement...........48 Figure 3-10 Correlation of Average Income and Number of Debts.........................................48 Figure 3-11 Comparison of Payment Performance between Control Group and Refrigerator Group..................................................................................................49 Table
Table ES-1 Main Project Outputs........................................................................................................4 Table ES-2 Comparison of Key Performance Indicators to Results ...........................................5 Table 2-1 Financial Responsibilities of the Partners for Pilot Components ..........................20 Table 3-1 Financial Results from the Pilot from the Company’s Perspective: Actual Case .......................................................................................................................33 Table 3-2 Average Per Customer Costs and Revenues ............................................................36 Table 3-3 Comparison of Cases and Sensitivity Results ............................................................36 Table 3-4 Consumer Measure Optimization Sensitivity ............................................................38 Table 3-5 Composition of Types of Consumers in Pilot Area.................................................39 Table 3-6 Effects on Consumption of Individual EE Measures .................................................42 Table 3-7 Effect of Project on Non-Payment Rate .....................................................................43 Table 3-8 Total Collected (%) for Capped and Un-capped Billing Periods ...........................46 Table 3-9 Distribution of Bad Debt by Size of Consumption Level and Change After Cap Lifted................................................................................................................46

Executive Summary
OVERVIEW
In late 2006, the U.S. Agency for International Development, the International Copper Association, and AES Eletropaulo, an electricity distribution company, embarked as partners on an ambitious project in São Paulo, Brazil to test their integrated approach to slum electrification and loss reduction. This approach aims to solve a large-scale and long-term problem of electricity losses from theft and non-payment in slums while bringing more reliable and safer electricity service to its residents as well as helping them to reduce their electricity consumption dramatically to affordable levels.
After the first year of operation in the slum selected as the pilot area (called Paraisópolis and described in Box ES-1), results show a rapid payback for the distribution company of less than 1.4 years and the transformation of non-paying or illegal electricity consumers into paying customers while providing ancillary benefits to the community and society at large. This case study documents what was done and the results obtained and suggests how the approach might be replicated in other slums in Brazil as well as many other countries with similar problems.
PILOT PROJECT COMPONENTS
The pilot project’s objectives were to convert formerly ‘free’ electricity consumers into satisfied and paying customers in a manner that was financially viable for the distribution company. This in turn depended on securing community support for the project and improving customers’ willingness and ability to pay for their consumption. The pilot had distinct phases: pre-regularization, regularization, post regularization, and evaluation.
Pre-regularization involved first contacting the community leadership and other stakeholders to gain support for the project, customer mapping and registration, and an extensive community campaign to prepare the population for the upcoming changes. Educational activities included printed materials, community events, door-to-door visits and presentations in schools.
Regularization comprised replacement of much of the distribution system, installation of new service drops and meters for the new (or returning) customers, and the start of billing and collections. The upgrades of the distribution system and service infrastructure made it more difficult to steal electricity and provided safer, better quality, more reliable and efficient electricity service within the area. Non-standard technologies used to accomplish the upgrade included anti-theft cables, remotely controlled meters, and efficient transformers.
Post-regularization activities included additional community campaigns as well as working on an individual basis with the new customers to improve the efficiency and affordability of their electricity use. All households received new efficient lights. The poorest of the households that had inefficient refrigerators received refrigerator replacements and those with the riskiest internal electrical wiring received upgrades of internal wiring including safer and somewhat more efficient electrical showers. To further reduce the impact of paying for electricity, bills were capped at 150 kWh for a period of at least 3 months. Commercial customers were visited to identify efficiency measures that would be cost-effective for them to take. Additional public lighting improved the overall ambiance and personal security of the community.
Transforming Electricity Consumers into Customers: 1 Case Study of a Slum Electrification and Loss Reduction Project in São Paulo, Brazil

Evaluation included a consumer poll to test changes in attitudes and satisfaction with the results of the project from customers’ perspective. Financial analysis of the results from the perspectives of the company and the consumer provided a measure of the overall impact of the pilot, advisability of replicating it and lessons learned that could be used to improve effectiveness in replication.
RESULTS OBTAINED AND KEY PERFORMANCE INDICATORS
Outputs of the project included the number of residences that were regularized, the number of energy efficiency benefits delivered, as well as the physical infrastructure that was installed in the area. Table ES-1 enumerates the Key Pilot Outputs. These energy efficiency and safety measures combined with the ‘regularization effect’ reduced consumption in the targeted 4365 households and commercial entities from an average of 250 kWh down to 151 kWh per customer for a reduction on average of 40%.
The average post-regularization consumption, prior to installation of energy efficiency measures was 192 kWh per month. This drop in consumption can be considered the ‘regularization’ effect. That is, the effect on consumption of the new anti-theft measures, the ‘price signal’ sent by now billing for electricity service, and changes in consumer behavior as a result of the community campaign. The regularization effect amounted to about a 23% reduction in overall consumption during the pilot period. The remainder of the reduction in consumption can be attributed to the energy efficiency measures implemented, amounting to an additional overall 23% reduction.
Key Performance Indicators listed in Table ES-2 guided the project’s design, implementation and evaluation. The favorable financial results obtained for the distribution company were driven by several factors:
Substantially improved revenues due to improved collections that went from virtually no payment to 68% paying (non-payment dropped from 98% to 32%, a reduction of 67%),
A reduction in electricity consumption within the pilot area of about 40% and a corresponding reduction in costs to the company for their supply of electricity that was not paid for prior to regularization, and
The conversion of consumers to metered and paying customers which enabled the utility to collect the low-income subsidy component of the tariff from the Government. The low-income customers’ consumption became eligible for reimbursement by the Government for the difference between the low income tariff for which they were eligible and the cost-recovery tariff that normally applies to non-low income residential customers.
The company’s financial success greatly depended on new customer satisfaction that their upgraded electricity service was worth taking on the new financial burden of their electricity bill. Regularization was seen by the vast majority of those polled to be inevitable and essentially fairer than the prior system. Overall satisfaction with the project was very high, with the mean of 62% in the level of ‘very great satisfaction’.
Transforming Electricity Consumers into Customers: 2 Case Study of a Slum Electrification and Loss Reduction Project in São Paulo, Brazil

Their ability to participate depended on the waiving of connection fees and the provision of a free service drop so that consumers would not have to come up with large up-front connection costs. They were assisted in their ability to pay by energy efficiency measures. According to the post-project survey, customer satisfaction centered on the improved reliability and safety of the upgraded service and their improved ability as formal customers with an address and the start of a payment history to obtain credit. Those that received the additional benefits of a refrigerator replacement and/or internal rewiring were the most appreciative. Community satisfaction mirrored that of the residents. Particularly important to the community was the drop in electricity-related emergency incidences from 57 in the 6 months prior to the pilot to only 2 in the same period post-pilot.
LESSONS LEARNED REGARDING SUSTAINABILITY AND REPLICATION
Overall, the regularization process was relatively efficient and effective. In addition, all of the components of the project that the partners included were found to be necessary for the success achieved. There were a number of ‘process’ lessons that can be readily applied in replicating the approach in other slums or countries having to do with locating consumers, getting them registered and helping them to prepare for and adapt to being regularized and paying for their electricity consumption.
During the entire regularization process it was very important to have involved the community leadership and other active stakeholders such as the municipality and powerful NGOs early (prior to any intervention in the community) and then continuously throughout the time period. Another such general lesson was that residents needed to be contacted in a variety of ways. Community events were more memorable to them than the door to door visits but both were essential to reaching as many consumers as possible.
Lessons specific to the pre-regularization stage included careful location and registration of the consumers to be converted to customers. This step took longer than it would for ‘conventional’ customers because of unfamiliarity with the chaotic layout of the community and adjusting to the varying and irregular schedules of the inhabitants. Being patient but rigorous in this phase would have paid off in fewer corrective measures later.
During the regularization stage it was important to make sure that the new customers knew and understood their responsibilities during this stage and that they followed through on them. For example, customers were required to do their own connection from their structure to the new meter. Many failed to comply for many months, and others connected to the wrong meter, causing complaints and requiring checks by the company which in turn caused delays.
Lessons for the post-regularization stage included paying attention to timing, sequencing and streamlining of the delivery of efficiency and safety measures while using creative approaches to deliver these benefits to difficult to reach residents. Finding responsible residents at home was a continuing problem. Alternative ways to reach ‘elusive’ residents need to be devised. The costs of making multiple efforts to reach these customers need to be weighed against the benefits. Some flexibility in the delivery mode of benefits could be provided to increase coverage.
Transforming Electricity Consumers into Customers: 3 Case Study of a Slum Electrification and Loss Reduction Project in São Paulo, Brazil

Efforts to help commercial customers adapt to paying their bills through energy efficiency recommendations were somewhat thwarted by the large variability of the types of high electricity consuming refrigeration devices being used (e.g., many were provided by drinks suppliers and were relatively new). So, it was difficult to develop generalized recommendations or a larger scale replacement initiative; recommendations were mostly confined to changes in usage habits and change-out of inefficient light bulbs.
The evaluation stage provided a number of additional insights. Knowing the effect on financial viability for the company and how efficiency measures affected bill payment helped to guide further efforts to improve payment. While savings were high, especially if a customer received a refrigerator replacement, many still had trouble paying on time, a clear sign that recidivism is a threat. Further, there was a significant rise in late payments when the 150 kWh cap came off. While at least half were making the effort and had no unpaid bills or were never more than one month in arrears, many of the new customers were still either unable or unwilling to pay their bills on time. The most significant correlation was between the size of the bill and the number of bills in arrears, indicating the urgency of assisting new customers to bring their consumption down to affordable amounts. Additional cost-effective energy efficiency (demand reduction) assistance might be justified to improve customers’ ability to pay. The company is therefore trying a number of additional activities to keep up the momentum gained during the pilot such as a solar water heating trial to reduce consumption related to electric water heating for showers and is replicating the approach in other slums.
There is some possibility that the highly favorable regulatory support that the project enjoyed in Brazil, such as the requirement to spend a portion of net revenues on energy efficiency measures in slums or the subsidy that makes up the low income tariff, might not be present in other countries. Maintaining the principles of financial viability for the company, affordability and controllability of consumption by the consumer and acceptability for society at large will remain the necessary foundation for application of the SELR approach to other countries and their different contexts.
Table ES-1 Main Project Outputs
Measure # installed or completed Primary distribution system upgraded (km) 2.98 Secondary distribution system upgraded (km) 5.4 Transformers replaced (conventional/efficient) 6/12 Conventional meters and posts installed 3,890 Electronic remote-controlled meters installed 475 Pre- or post regularization door-to-door visits by community agents 8,594 Community and school events 27 Replacement of inefficient light bulbs with compact fluorescents (CFLs) 9,588 Refrigerator assessments completed 2,598 Inefficient refrigerators replaced with PROCEL A-rated ones 496 Wiring safety assessments completed 2,433 Household rewiring and replacement of electric shower 497 Replacement of individual outside lights with public lighting (472 in alleys and 33 in main streets) 505 Commercial audits and recommendations made 70
Transforming Electricity Consumers into Customers: 4 Case Study of a Slum Electrification and Loss Reduction Project in São Paulo, Brazil

Table ES-2 Comparison of Key Performance Indicators to Results
KPI Category or KPI Results of Pilot KPI Category 1: Financial Viability of the Business Model for the Company
Investment Requirements $1.8 M or $421 per customer Change in revenue (in terms of losses or debt reduction) 67% reduction in debt Payback <1.4 years KPI Category 2: Affordability and Acceptability for the Customer
Change in affordability of electricity service Bills dropped from $354 to $213 per customer per year (but the 32% and growing rate of non-payment indicates this may still be insufficient).
Reduction in inefficient consumption achieved Consumption reduced by 99 kWh or 40% per customer Improvement in the reliability of electricity service One of the top cited benefits of the project by those polled Improved legal and institutional status within society One of the top cited benefits of the project by those polled Improvement in personal safety and physical environment One of the top cited benefits of the project by those polled Satisfaction with customer service including Community Agents
75% satisfied with the new service although some complained of problems during start-up
KPI Category 3: Society and Community Acceptance of the Project
Community and Other Stakeholder Acceptance Public lighting, lower incidence of fires and electrocutions were appreciated although some complained of problems during start-up. Concerns about continued ability to pay remain. More dialogue with the community was desired.
Regulator and Ratepayer Acceptance ANEEL remains highly supportive of the approach Improved Area-wide Security and Safety Incidences of electricity related accidents dropped from 67 in previous year
to 2 in comparable period.
Transforming Electricity Consumers into Customers: 5 Case Study of a Slum Electrification and Loss Reduction Project in São Paulo, Brazil

The SELR Brazil Pilot Site: Paraisópolis Favela
The Paraisópolis favela (slum in Portuguese) shown in the photo is the second largest in São Paulo (and the fourth largest in Latin America) and occupies an area of 84 hectares. Located in a large ravine, it has a physically challenging geography and is surrounded by middle- and upper-income residential areas. Like most other favelas, Paraisópolis is an informal community which has lacked many municipal services until recent efforts to upgrade the slum’s infrastructure.
Being surrounded by more affluent neighborhoods provides a source of some employment for favela residents. Paraisópolis has a significantly lower crime rate than other favelas in São Paulo or in Rio de Janeiro.
The slum is home to families that migrated from rural areas in Brazil over the years and occupied land that was originally settled by Japanese immigrants in 1921 when a large “ranch” was divided. The population of the slum is still growing, e.g., a 20% increase from 2000 to 2005. The population is very poor compared to other areas of São Paulo, with around 70 to 75% of the sample earning more than 1 minimum salary (MS, approximately $350 per month) but less than 3 MS.
Paraisópolis has a vibrant commercial sector with numerous individually owned stores. Prior to the present electricity regularization project, efforts to upgrade the electricity grid within the favela had little success. As a consequence, fires and accidents often occurred because of the risky condition of the electricity distribution system, poor wiring in residences and businesses, and the use of alternatives such as kerosene or candles. Wires strung to make illegal connections abounded, many of which were far too easily accidentally touched. When the SELR Pilot started working in its two targeted Paraísopolis neighborhoods (Antônico and Centro) in 2007, 4,365 households and businesses were included in the pilot area. The vast majority of them were consumers either illegally connected to AES’ grid or connected but not paying for the service provided.
Transforming Electricity Consumers into Customers: 6 Case Study of a Slum Electrification and Loss Reduction Project in São Paulo, Brazil

Transforming Electricity Consumers into Customers: 7 Case Study of a Slum Electrification and Loss Reduction Project in São Paulo, Brazil
Section 1 Introduction and Background
1.1 INTRODUCTION
In October 2005, the United States Agency for International Development (USAID) launched the Slum1 Electrification and Loss Reduction (SELR) program with its Global Development Alliance2 partner - the International Copper Association (ICA). Through SELR, USAID and ICA aim to develop customized approaches for providing sustainable electricity services in poor urban areas. With increasing rural to urban migration and expanding slum populations, utilities are struggling to expand the necessary infrastructure to these areas, ‘regularize’ the many slum consumers that rely on illegal electricity connections for meeting their electricity needs, and reduce their technical and non-technical losses.3 SELR activities encompass testing, evaluating and disseminating the results of replicable and sustainable approaches to slum electrification.
SELR selected Brazil and India as the first countries to undertake SELR activities as both countries had mega-cities with large slum settlements.4 Five Brazilian electricity distribution companies with the largest slum-related losses submitted preliminary concept notes for pilot projects in January 2006. After reviewing all five concept notes and meeting with the companies during a scoping trip in February 2006, the SELR Brazil team selected the pilot concept prepared by AES Eletropaulo (AES EP) for the Brazil pilot.5 AES Eletropaulo was found to have the highest potential for a successful pilot given their comprehensive approach that included development of ‘social infrastructure;’ a focus on the affordability, safety and reliability of electricity use, a strong anti-theft technology component, and its scalability (AES EP has almost half a million ‘irregular’ slum consumers in its service territory). Given the potential offered by the proposed pilot, ICA recruited two additional partners to the project, Nexans Brasil S.A., a leading global cable manufacturer, and ITAIPU Transformadores, a Brazilian manufacturer of transformers. The next subsection describes the mission, goals and activities of the primary partners in the pilot project.
The remaining subsections in this section discuss some of the challenges to slum electrification, describe the Brazilian electricity sector, and give an overview of the slum (favela in Portuguese) that was selected to be regularized in São Paulo. Section 2 describes the pilot design, its components and their implementation. Section 3 provides an analysis of the sustainability of the approach from the different perspectives of the distribution company, commercial and residential consumers, and the community and society at large. Section 4 concludes with key lessons learned and recommendations for replicable solutions and next steps.
1 For the purposes of this report, the term “slum” is used to describe a low-income, informal urban settlement. 2 The $5 million partnership is a Global Development Alliance (GDA) private-public partnership and was signed by USAID and ICA in October 2005. The GDA will promote
energy efficiency and access to modern energy services worldwide. 3 Technical losses for distribution companies are considered those related to physical inefficiencies in the delivery of electricity to customers and could include such items as
line losses and overloaded transformers. Non-technical losses are also referred to as commercial losses and are considered to be those financial losses from a number of causes, such as theft of electricity, failure of the company to collect for electricity delivered, and billing errors, as well as graft and corruption within the company.
4 USAID appointed Nexant, Inc., a consulting firm, to develop and manage the SELR Programs in Brazil and India. 5 In parallel USAID and ICA developed a pilot project with similar objectives with Reliance, Inc. the distribution company for Mumbai, India. About 33,000 slum dwellers
living in the target area would benefit from the project activities. The World Bank’s Output Based Aid program will support this pilot and, after recently conducting comprehensive economic, environmental and technical assessments, will launch project activities in late 2008.

1.2 THE SELR BRAZIL PARTNERS
1.2.1 United States Agency for International Development
USAID is an independent agency of the United States Government that has the two-fold purpose of furthering America's foreign policy interests in expanding democracy and free markets while improving the lives of the citizens of the developing world. It supports world-wide programs in economic growth, agriculture and trade, global health, and democracy, conflict prevention and humanitarian assistance. In the energy sector, USAID works to improve access to safe, affordable and reliable electricity and other modern energy services. Electricity supply is an essential requirement for economic growth and poverty reduction; it can provide key inputs to stimulate new businesses, improve the quality of life, allow for increased social services (health, education), and reduce the need for dirtier and less safe energy forms such as kerosene and charcoal.
Given expanding slum populations as a result of continued rural to urban migration, USAID launched the SELR program to assist governments, utilities and other stakeholders with extending legal, reliable and affordable electricity service to these consumers. USAID’s program objectives include:
Testing, evaluating, and disseminating the results of replicable and sustainable approaches to slum electrification;
Improving the safety and affordability of electricity service for slum customers through efficiency interventions and education on the management of electricity consumption;
In partnership with public and private sector organizations, implementing pilot projects that try innovative ideas and have strong potential for replication, scale-up, and economic and social impact; and
Supporting the exchange of knowledge and sharing of international experiences in slum electrification and loss reduction.
1.2.2 AES Eletropaulo
AES Eletropaulo distributes electricity to 24 cities in the metropolitan region of São Paulo including the capital which together comprise a population of 16.5 million inhabitants. The concession area of the company covers 4,526 km2 which includes the most important socioeconomic region of the country with around 5.5 million consumers (customers). In terms of billing, AES Eletropaulo is the largest distributor of electricity in Latin America. While its primary focus is to reduce theft from the electricity grid, Eletropaulo’s Program for Regularizing Electrical Installations also provides a strong incentive for the consumer that could be described as a ‘passport to citizenship.’ With a legal address and an electricity bill in hand, people from the low-income communities have sufficient proof to get access to credit. Prior to the SELR Brazil pilot, AES had already regularized over 150,000 low income customers with 1.6 million bills delivered to the new customers, learning by doing and seeking a comprehensive and effective solution for the approximately 400,000 households remaining to be regularized.
Transforming Electricity Consumers into Customers: 8 Case Study of a Slum Electrification and Loss Reduction Project in São Paulo, Brazil

Transforming Electricity Consumers into Customers: 9 Case Study of a Slum Electrification and Loss Reduction Project in São Paulo, Brazil
1.2.3 ICA – International Copper Association
Formed in 1989, the International Copper Association, Ltd. (ICA) promotes the use of copper worldwide by guiding policy and strategy, and by funding international initiatives and promotional activities and by communicating the unique attributes that make this sustainable element an essential contributor to the formation of life, to advances in science and technology, and to a higher standard of living worldwide. Drawing on its extensive research and development as well as working with the scientific community, ICA advises government bodies throughout the world on regulatory and legislative issues on application areas from building construction, electric and electronic, and industrial to environment. ICA’s role in slum electrification stems directly from its global mandate. Copper plays an important role in providing economic growth and a better quality of life for the world’s population. Global challenges, such as the growth occurring in developing countries and environmental concerns – particularly global climate change – require solutions, of which a major one is improving energy efficiency. Gains in efficiency give multiple benefits: energy and economic savings and environmental and other socio-economic improvements. A range of actions, such as setting efficiency standards, can dramatically improve efficiency of new appliances, motors and other electrical equipment.
ICA’s Sustainable Electrical Efficiency Program aims to improve the efficiency of air conditioning, refrigeration, motors, and transformers. Its objective in slum electrification is modernization and reduction of energy losses in the supply and use of electricity, improving the safety and quality of electricity supply, leading to a better quality of life for slum communities. The main actions that it supports in slum electrification are:
Rewiring of homes to code to improve safety,
Energy efficient refrigerators and transformers, and
Anti-theft coaxial cable, sized for energy efficiency, to be used in service drops and secondary distribution.
1.3 BACKGROUND ON THE CHALLENGES AND OPPORTUNITIES OF SLUM ELECTRIFICATION6
In a global trend, people are moving from rural areas into cities and towns hoping for better jobs and futures. In 2000, about 2.9 billion people – nearly half of the global population – lived in urban areas. This figure is expected to increase to about two-thirds of the population by 2025, most of them taking up residence in or creating new slums. The most rapid change will occur in the developing world, where urban populations are growing at about 3.5 percent per year.7 This urban growth poses an enormous challenge for the economic and social sustainability of urban areas, for the creation of incomes and employment, and for the provision of social and administrative services and infrastructure – e.g., health, education, security, electricity and water.
6 This section is based on the USAID 2004 publication, “Innovative Approaches to Slum Electrification” and the Proceedings of the December 2007 workshop: “Improving
the Electricity Service for the Urban Poor” held in São Paulo Brazil and sponsored by USAID, International Copper Association and AES Eletropaulo. 7 United Nations Habitat, Human Settlements Programme, The Challenge of Slums, Global Report on Human Settlements, 2003, Chapter 1.

Transforming Electricity Consumers into Customers: 10 Case Study of a Slum Electrification and Loss Reduction Project in São Paulo, Brazil
Businesses such as electric utilities have begun to the ‘base of the (market) pyramid’ (of consumers) or BOP as a significant and growing purchasing power. There are both opportunities and challenges in successfully serving this market. BOP households represent about 4 billion people and constitute a $5 trillion global consumer market of which energy’s portion is $220 B and growing. In Africa, Eastern Europe, and Latin America, energy ranks third in BOP household expenditures, following food and housing. In Asia, energy ranks second, surpassing housing.8 There is a direct correlation between lower BOP income segments and lack of access to modern energy sources. Yet, high reported access rates in Brazil and other countries mask the fact that many connections in poor urban areas are illegal, consumers don’t pay, or service is of very poor quality and that residents of illegally settled areas may not be counted in the official statistics.
The challenges for utilities are to find a way to tap into this market. Historically they expect low or negative returns from poor people. In part this reflects a lack of experience with surmounting the problems associated with serving slum consumers effectively: e.g., their lack of tenure, their high degree of transience, and their expectation of being excluded and having to ‘take matters into their own hands,’ such as tapping into electricity lines illegally. Often government or regulatory incentives to serve poor communities are lacking, and yet universal service requirements may be imposed that do not recognize the problems and extra costs of providing service to these informal areas. These challenges are compounded by poor legal recourse through law enforcement, lack of rights of way to bring infrastructure into the areas, and the unique technical and administrative solutions needed to confront fraud and adapt to geography or housing conditions and to find ways to mitigate the high risk to employees of entering the slum areas.
These problems lead to high technical and commercial (revenue) losses for the distribution companies, which can threaten their viability or raise the cost of power for other consumers. New electricity service models for serving the urban poor are being developed and tested to cope with these problems.
1.3.1 USAID’s Slum Electrification and Loss Reduction Program
Recognizing the importance of meeting these challenges, USAID began its SELR program in 2003 with a multi-country study of slum electrification programs leading to the publication of the USAID report entitled ‘Innovative Solutions to Slum Electrification’ in 2004.9 Subsequently, USAID in collaboration with several partners10 held a workshop in September 2005 in Salvador, Brazil called “Meeting the Energy Needs of the Urban Poor: The Case of Electrification.” At this multi-country, stock-taking workshop, delegations of 3-5 practitioners attended from 12 cities in Latin America, Africa and Asia (including all the programs studied in the 2004 report) to discuss their experiences with expanding access to electricity service in poor urban neighborhoods. Proceedings entitled “Meeting the Needs of the Urban Poor: Lessons from Electrification Practitioners,” were produced in June 2007 by ESMAP.11
8 World Resources Institute, “The Next 4 Billion: Market Size and Business Strategy at the Base of the Pyramid.” (Washington, D.C. 2007) 9 The report is available for download at http://pdf.usaid.gov/pdf docs/PNADB219.pdf 10 Co-sponsored with Energy Sector Management Assistance Program (ESMAP), Cities Alliance, EdF, InterAmerican Development Bank, and COELBA. 11 The report is available at http://esmap.org/filez/pubs/1252007111830 ESMAPMeetingTheEnergyNeeds.pdf

Transforming Electricity Consumers into Customers: 11 Case Study of a Slum Electrification and Loss Reduction Project in São Paulo, Brazil
With this basis, the next step was to put concepts and lessons learned into practice. The USAID/ICA/AES partnership launched the SELR Brazil pilot in July 2006 that is the subject of this case study. A final activity of the pilot was a workshop to disseminate the results of the pilot and to share experiences and explore sustainable solutions to the many technical, economic and social issues associated with SELR-type programs, focusing on best practices, techniques, tools, and technologies. This workshop, entitled “Improving Electricity Service for the Urban Poor,” was held in São Paulo, Brazil from December 4-7, 2007 and attended by over 100 experts, practitioners and development officials from 23 countries drawn from Asia, Africa, Latin America, Europe and North America.12
1.4 BACKGROUND ON THE BRAZILIAN ELECTRICITY SECTOR
After decades of government ownership and operation of the electricity sector, privatization of electric companies in Brazil began in 1996 after approval of the sector’s new design for an operational model and adjustment of existing legislation to permit foreign ownership of utilities. Just prior to privatization in 1995, Eletropaulo was owned by the State of São Paulo. During privatization it was broken up into 4 separate distribution companies, one of which was Eletropaulo Metropolitana. After one interim owner, AES Corporation took control of Eletropaulo Metropolitana in 2001. Today, AES Eletropaulo is part of a holding company called Compania Brasiliana de Energia jointly owned by AES Corp (50.1%) and BNDES, the government owned development bank of Brazil, (49.9%). The holding company also owns several other energy enterprises in Brazil such as two the generation companies AES Tietê and AES Uruguaiana.
The Brazilian Electric Power Agency (Agência Nacional de Energia Elétrica or ANEEL), the regulatory agency with direct oversight of electricity distribution, was created in 1996, by law, but only established at the end of 1998. Its responsibilities include, inter alia, establishing and providing oversight of regulated tariffs, overseeing and managing the concession contracts for electricity distribution, and controlling return on investment. ANEEL instituted a cap on losses (i.e., a limit on recovery of losses through ratepayers) of 90.7 % of actual distribution losses, which has spurred the electric utilities to intensify their efforts to reduce technical and non-technical or commercial (theft) losses.
Furthermore, the approval in April 2002 of electricity sector Law No. 10.438 clearly signalled to distribution companies the government’s intent to meet the service needs of lower income citizens and those with poor access to electricity service. The Law formally mandates that companies must achieve 100% electricity coverage in their respective service areas by dates established for each separately. As a result, the companies faced increased service obligations for a segment of customers considered to have little or no return value on investment in the near to mid-term, primarily because most were already informally (illegally) connected to the electricity system but were not paying for their usage.
1.4.1 Low Income Tariffs
Brazil has adopted performance-based regulation to ensure that fair and reasonable tariffs are paid by the so-called ‘captive’ electricity customers. A performance-based, price-capped and
12 The Proceedings can be found at: http://www.usaid.gov/our work/economic growth and trade/energy/publications/EGAT0001.PDF

Transforming Electricity Consumers into Customers: 12 Case Study of a Slum Electrification and Loss Reduction Project in São Paulo, Brazil
multi-year tariff is used to achieve quality, reliability and universal service. Tariffs in general are relatively high compared to many other countries, especially those such as Canada with a comparable proportion of hydroelectric generation in its mix. However, it should be noted that the Brazilian tariff on average is more than 30% tax, a significantly larger percentage than imposed in most other countries.
Low-income residential customers come under ‘Group B’ and are designated as B1 for tariff purposes. This low income tariff (LIT) or ‘social’ tariff scheme for the B1 group provides those qualifying with a large discount on the order of two-thirds for the first 30 kWh, 40% for above 30 but less than 100 kWh, and 13% for consumption between 100 and 200 kWh. Fixed charges are also discounted on a similar scale and for the lowest consumption block are around $1.50 per month.
During the late 1990s, the government used the RGR, a general sector fund financed by a fee on all electricity customers, for subsidizing rural electrification and tariffs for very low-income consumers. More recently the CDE (Conta de Desenvolvimento Energético or Fund for Energy Development)13 that is also customer-fee-based replaced RGR for subsidizing the LITs. The resources of the CDE fund are being aggressively funneled for urban and rural electrification purposes, as well as for low-income consumer subsidies. According to ANEEL, R$1,408 B (approximately US$ 647 B) went to the distributors in 2006 from the CDE fund.
Approximately 17 M customers presently receive the LIT. This represents 36% of the 50.2 M electricity customers in Brazil. Of these, 14 M (or 82%) automatically receive the lowest tariff because they consume less than 80 kWh per month.14 In 2007 ANEEL began to tighten the eligibility procedures for the LIT by requiring that consumers be registered in government low income programs such as Bolsa Família15 (BF) as proof of their low income status. As part of this drive, ANEEL has been trying to eliminate the low-income self-declaration process for eligibility now used for electricity consumers in the 80 to 200 kWh per month consumption range by requiring that instead they register in the government’s ‘unified registry’ (or single registry called Cadúnico) and get certified as low income under Bolsa Família to receive the benefit. Using Bolsa Família and the Cadúnico is eliminating some non-poor from the LIT rolls (e.g., those with vacation homes and single occupancies). At the same time, inclusion would improve for very large low income families that use more than 220kWh that are now excluded from the LIT.16
13 The Energy Development Account (Conta de Desenvolvimento Energético – “CDE”) was created by Law No. 10.438 in 2002 as a fund aimed at fostering the energy
development of the Brazilian States and the competitiveness of alternative energy projects, natural gas fueled power stations and Brazilian coal fueled power stations in the locations served by the Brazilian Electric Interconnected System, and making the energy services generally available to all people throughout the Brazilian territory (the so-called universalization of the services). The CDE is regulated by the Brazilian government and administered by Eletrobras, and will exist for 25 years.
14 For administrative simplicity the lowest block in the tariff (up to 80 kWh per month), any customer using less than that amount automatically receives the lowest tariff without any income verification. The assumption has been that any household using such a small amount of electricity would virtually guarantee that they were low income. In 2007 and 2008, the government has been discussing eliminating non-low-income uses that got the benefit through errors of inclusion (e.g., vacation homes).
15 Bolsa Família is roughly translated as “family purse.” It is an umbrella social income transfer program for qualified low income families started in 2003 by the government of Brazil that consolidated a number of separate social programs that operated prior to 2003.
16 Source: CanalEnergia.com, August 2007

Transforming Electricity Consumers into Customers: 13 Case Study of a Slum Electrification and Loss Reduction Project in São Paulo, Brazil
1.4.2 ANEEL’s Program to Reduce Non-technical Losses in Low Income Areas
In the late 1990s, ANEEL created an ‘electricity-industry-wide’ fund to be split evenly for Research and Development (R&D) and Energy Efficiency (EE) improvements. Utilities’ concessionaire contracts contain provisions to access this fund, which amounts to 1% of the utility’s gross revenue for use in their own territory (½% for R&D and ½% for EE). Recently, ANEEL has added the requirement that one-half of the set-aside for EE (i.e., ¼%) be used for low income households. Annual cycles of planning, application, and approval by ANEEL govern each year’s allowable activities and expenditures. Recently, slum electrification initiatives (e.g., reconnection and metering) became eligible for EE activities as they enabled customers to understand and monitor their own energy consumption. In addition, expenditures on energy saving appliances within slum households were also eligible if they achieved at least an 80% cost-benefit ratio.17
1.5 DESCRIPTION, HISTORY AND ORGANIZATION OF THE PARAISÓPOLIS COMMUNITY
1.5.1 Slums in Brazil and in São Paulo
The most recent United Nations report on cities18 stated that the number of inhabitants in Brazilian slums should reach around 55 million in the year 2020, equivalent to around 25% of the country’s population. Nevertheless, despite the absolute growth in numbers in the slums, the proportion that this represents of the national population will be stable or could even decline as a result of various programs underway in Brazil. That being stated, the report notes that the life of those who live in slums is generally getting worse (i.e., there are more going hungry, fewer educational opportunities and chances of employment in the formal sector and slum residents are sicker than the rest of the population in general). The UN Habitat report cited research done in Rio de Janeiro that showed that living in a slum is considered a greater barrier to obtaining employment than racial or gender barriers. “Slums are not only an indication of a low class area with a lack of basic services and human rights; they are also symptomatic of dysfunctional urban societies in which inequalities are not only tolerated but freely proliferate.”
São Paulo is the most prosperous state in Brazil and yet presently has more than 2018 slums of which three-quarters are within the limits of São Paulo city with a population of around 10.5 million. About 23% of the total Brazilian population living in slums occupies slums in São Paulo proper.
1.5.2 Paraisópolis Today
The Paraisópolis favela which encompasses Antônico and Centro, the two targeted neighborhoods of the USAID/ICA/AES pilot program, is the second largest in São Paulo (and the fourth largest in Latin America) and occupies an area of 84 hectares. Located in a large ravine, Paraísopolis has a physically challenging geography and is surrounded by middle- and 17 According to the ANEEL Manual for Elaboration of Energy Efficiency Programs, the cost-benefit (CB) ratio of 0.80 (from the societal perspective) is derived by calculating
the CB ratio of each end use and weighted according to the amount of electricity saved in each final use. The manual provides a specific methodology for evaluating energy efficient investments, such as public lighting and refrigerators, in low income neighborhoods that takes into account the age, condition and other factors for the equipment being replaced and the replacement equipment and, in relevant cases, the coincidence of usage with the system peak.
18 UN Habitat, “State of the World’s Cities 2006-2007”

Transforming Electricity Consumers into Customers: 14 Case Study of a Slum Electrification and Loss Reduction Project in São Paulo, Brazil
upper-income residential areas collectively called Morumbi. While Paraisópolis is surrounded by Morumbi, there is no organized transit between the two areas. In fact the architecture, layout of the streets, presence of numerous guards, and video surveillance all impede entry by Morumbi’s nearby lower class neighbors. It is said that Paraisópolis is considered the ‘danger zone’ while Morumbi is considered the ‘fear zone.’ In other words, there are both a social and a special distinction between the contiguous areas. Yet Paraisópolis has a significantly lower crime rate than other favelas in São Paulo or in Rio de Janeiro.
Like most other favelas, Paraisópolis is an informal community which has lacked many municipal services until recent efforts to upgrade the slum’s infrastructure. It is still considered to be somewhat ‘special’ since it is surrounded by more affluent neighborhoods that are a source of some employment for favela residents. The physical layout is simultaneously organized and chaotic. The center is formed along regularly laid out asphalt streets and is where the earlier arriving and generally better off inhabitants live while later development, accommodating the growth of families, is squeezed in between or piled on top of the more regular original structures and along alleys leading away from the main streets, some of which actually form tunnels as homes have crowded into every available space. The more recently arrived occupy the more precarious areas of the ravine, and many are subject to removal at some point as a result.
The slum is home to families that migrated from rural areas over the years. Paraisópolis was originally settled by Japanese immigrants in 1921 when the Morumbi ‘ranch’ was divided into 2,200 lots, but it was not until the 1970s that more temporary wood shacks began to appear there, partly as a result of efforts by the municipality to eradicate slums elsewhere in São Paulo. Numerous efforts by succeeding governments to eradicate the slum were unsuccessful for a variety of reasons. Paraisópolis began to grow faster than ever in the 1980s as a result of socio-economic problems that drove people from the North and North East of Brazil to São Paulo and public works within São Paulo that uprooted people in other slums who did not want to leave the area and therefore ended up moving into Paraisópolis. According to recent data from the São Paulo Secretariat of Habitation (SEHAB), the population of the slum is still growing. Just from 2000 to 2005, the number of inhabitants grew from 45,000 to 55,000, a 20% increase. The population is very poor compared to other areas of São Paulo, with around 70 to 75% of the sample earning more than 1 minimum salary (MS) but less than 3 MS.19
Paraisópolis has a vibrant commercial sector with numerous individually owned stores. The sector is mostly informal and 85% of its employees are from the community itself. Estimates by the municipality indicate that there are around 3,000 businesses in the entire favela. About 423 separate commercial establishments were identified in the pilot area. Grocery stores and restaurants represent about one-third of the businesses and retail services and stores comprise another third.20 The wide range of products offered include meat, poultry, groceries, CDs, building materials, medicine, tools, stationery, glasses, baked goods, and clothes. Services include beauty parlors, barbers, appliance, tire, bike and auto, and window repair services, dentists, video rentals, laundromats, leisure activities such as gym or video arcades and internet
19 One minimum salary was equivalent to R$ 350 (or US$140) per month in 2007. 20 There proportions are based on the information from a report prepared for the pilot by the University of São Paolo which in turn was based on a representative sample
of 70 out of the 423.

access. A large number of bars, luncheonettes, and a few restaurants are also interspersed in the commercial area. Many new store owners and service providers have been attracted to Paraisópolis because the demand for such commerce is still increasing as the favela grows. Some are said to have moved into the slum to take advantage of the ‘free’ electricity.
1.5.2.1 Socio-economic Profile of Paraisópolis Residents
A socio-economic profile of Paraisópolis was pieced together from different sources, including 2004 data from SEHAB, household door-to-door visits and a post-project poll conducted by IBOPE of a sample of 400 households. These sources have corroborated the difficult living conditions of the population covered by the Pilot project. The average income is roughly 2 Minimum Salaries, 31% are informally employed, and 36% live in homes with only 1 or 2 rooms. The door-to-door visits conducted during the pilot corroborated SEHAB that only 3% of the houses were constructed with wood while the rest were primarily concrete blocks (indicating a mature settlement).
Ownership of electrical appliances is high, mainly refrigerators, blenders, clothes irons, and televisions. As in most Brazilian favelas, virtually all households have refrigerators. Almost 80% of the households have an electric shower. Over half of those with refrigerators in good or better condition had the same one for 5 years or more, with only about one-third of them having bought theirs second-hand.
Almost all families in Paraisópolis have some outside funds coming in. In a 2004 poll, about 80% of the adults said that they were working and about 30% considered themselves to be unemployed. The most common types of work cited were in the category of low skill manual labor. Specifically, domestic services, cleaning and janitorial services, and construction and maintenance were commonly cited occupations in the area, often linked to the ‘rich’ surrounding areas. Very few had industrial jobs despite the fact that employment in general in São Paulo is around 20% industrial.
1.5.2.2 Governance Structure
The Paraisópolis community is known to be close-knit and well organized with various institutions that represent their interests. Initially, when a Neighborhood Association was founded in 1980 during a period of rapid growth, it was dominated by the owners of the lots in the favela. Its main objective was to eliminate the ‘invaders’ who were rapidly settling on the privately owned land and lowering surrounding property values. In 1983, the Union of Inhabitants of the Favela of Paraisópolis (or Union) was formed to represent the actual inhabitants of the slum. The Union is now actively promoting social improvements such as literacy programs and ‘care packages’ for the neediest and actively represents the interests of the inhabitants in such issues as urbanization and infrastructure. In 1994, the Multi-Stakeholder Forum was formed to better integrate social programs in the favela and, in 2004, the Steering Committee for Paraisópolis was created to oversee the upgrading of the slum, particularly the multi-year efforts of SEHAB.
Transforming Electricity Consumers into Customers: 15 Case Study of a Slum Electrification and Loss Reduction Project in São Paulo, Brazil

1.5.2.3 Slum Upgrading Efforts
In the late 1980s, as part of a larger effort to ameliorate conditions in the slums of São Paolo, the municipality gave up trying to eliminate Paraisópolis and took the new approach of working to improve sanitation and reduce risks posed by the geography of the area. Roads, stairways and sewage systems were the first public works to come to the area.
In 2000, a strategic plan was developed for the area under a new program, the “Legal Neighborhood Program,” with Paraisópolis as its first recipient of assistance. An extensive program of land reform is underway to determine land ownership as the vast majority of the inhabitants do not own the land that their house was built on. The program provided two options to the original land owners: either donation of the land to the municipality (and thus avoiding taxes owed on the property) or the owner could pay the taxes and receive a certificate of permission for construction. In the first case, the municipality would then give a certificate of ownership to the actual occupant of the property.
Numerous national, state and city programs are now planning or implementing slum upgrading projects to provide or improve the basic services needed by the population. At the national level, the Ministry of Cities in 2003 created an umbrella program called “Papel Passado” (or legal papers – literally ‘paper passed’ – referring to removing the obstacles met by favela residents in obtaining documentation proving citizenship, residency, etc). This program aimed to upgrade informal areas by removing barriers to ‘regularization’ of slum residents and to help them with upgrading projects undertaken by states, cities and the federal government.
The municipality’s extensive multi-year program of upgrading Paraisópolis began in 2005 with a $10 M program of improving roads, drainage, flood control, public lighting, sewer system and water supply (with SABESP, the water company) and moving those families that were located in areas too risky for them to remain there. The project was important because it is meant to develop a replicable approach to upgrading other favelas in the city. A second phase, starting in 2008, is investing another $127M for land stabilization and the construction of new housing complexes in the area. By the end of the first phase of the upgrade, about 50% of the population had water service, almost 17% were connected to a sewer and about 40% had garbage removal service.
Prior to the present electricity regularization project, efforts to upgrade the electricity grid within the favela had little success. As a consequence, fires and accidents often occurred because of the risky condition of the electricity distribution system and the use of alternatives such as kerosene or candles. Wires strung to make illegal connections abounded, many of which were far too easily accidentally touched. For example, on October 28, 1996, two children died and 39 families lost their homes in a fire caused by a short circuit. Incidences such as this continued throughout the next decade. In 2006, one child died and another was badly injured when they were electrocuted while trying to untangle a kite from the electrical lines and 68 other incidences of fires and accidents were reported in just the pilot area.
After a failed effort by the electricity utility to regularize the area in 1985, new efforts began in the 1990s, starting with a re-registration of all the inhabitants and numbering of the houses. Unfortunately, the majority of the houses already had numbers adopted by the actual
Transforming Electricity Consumers into Customers: 16 Case Study of a Slum Electrification and Loss Reduction Project in São Paulo, Brazil

inhabitants themselves in the opposite direction to that given by the distribution company, and as a result the program stopped the re-registration and the program was halted. A proposal in 2003 to put the grid underground failed because of the high cost involved. A survey in 2005 conducted by the municipality reported that around 7% of the residences had individual meters, another 11% had ‘collective’ meters, 59% had a connection directly to the distribution lines, and another 13% ‘borrowed’ electricity, while 1% did not have electricity (no information was available about the remainder).
When the SELR Pilot started working in its two targeted Paraísopolis neighborhoods (Antônico and Centro) in 2007, there were approximately 4,600 households and businesses, the vast majority of which were consumers either illegally connected to AES’ grid or connected but not paying for the service provided. As the Pilot area’s consumers were not paying for service, they did not efficiently manage their electricity consumption, and many appliances were old and poorly maintained. Consequently, electricity consumption was very high (around 250 kWh per consumer). It was clear at the outset that, even with the subsidized tariff for low-income households, residential consumers, once regularized, would find it very difficult to pay for such a high level of use. Likewise, commercial consumers that would not be eligible for the low-income tariff would be particularly hard hit by regularization. Experience in regularizing other favelas in São Paulo showed that, without assistance, approximately 50% of businesses closed after regularization.
Transforming Electricity Consumers into Customers: 17 Case Study of a Slum Electrification and Loss Reduction Project in São Paulo, Brazil

Section 2 Pilot Design and Implementation
2.1 OBJECTIVES, KEY PERFORMANCE INDICATORS AND PARTNER RESPONSIBILITIES
The aim of the SELR Brazil pilot project was to develop a sustainable service model for AES and other distribution companies that would meet the needs of consumers in low-income urban areas and could be widely replicated. Although AES had undertaken electricity ‘regularization’ programs in the past with varying degrees of success, they had not examined and conducted analysis on which program elements would be critical to achieving sustainability, which might be optional and which could be eliminated. In addition to developing a new approach, the pilot would serve as a controlled test of the pilot elements most likely to produce a sustainable service model. The partners recognized that the approach must be financially viable for the distribution company which depended on both the willingness and ability of the regularized consumers to pay for their consumption. It was also dependent on the regulatory environment under which the pilot would be carried out. For this reason, Brazil offered particularly fertile ground to conduct the pilot because of the progressive stance of ANEEL in promoting solutions to bringing legal electricity service to the urban poor.
As agreed on between the partners in a Memorandum of Understanding (MOU), the specific objectives for the pilot were:
To develop and test new approaches for regularization and improvement of electricity services to a target area in the São Paulo; and
To document and disseminate the lessons learned from the roll-out of the AES program in São Paulo for incorporation into a larger regional program.
As this was a pilot project that, if successful, would be scaled up by AES and disseminated to other distribution companies and stakeholders, the partners developed a holistic project design with technical and social components, created Key Performance Indicators (KPIs) to evaluate project results, and kept statistics that would be tracked throughout the project and used to determine which customers would receive additional available benefits as described later in this section.
The KPIs were organized into three categories:
KPI Category 1: Financial Viability for the Company
KPI Category 2: Affordability and Acceptability for the Customer
KPI Category 3: Societal and Community Acceptance
Each KPI Category has a number of KPIs associated with it. These are shown in Box 2-1.
The main project outputs are provided in Box 2-2.
A Matrix of Responsibilities was developed and agreed by the Partners. It contained all of the components of the project, who was responsible for each component, and the expected cost of
Transforming Electricity Consumers into Customers: 18 Case Study of a Slum Electrification and Loss Reduction Project in São Paulo, Brazil

each. It was conceived as a working document and a number of changes in responsibilities and costs were made over the life of the Pilot. The final matrix is provided in Table 2-1.
Box 2-1 Key Performance Indicators by KPI Category
KPI Category 1: Financial Viability of the Business Model for the Company Investment Requirements Change in revenue (in terms of losses or debt reduction) Payback KPI Category 2: Affordability and Acceptability for the Customer Change in affordability of electricity service Reduction in inefficient consumption achieved Improvement in the reliability of electricity service Improved legal and institutional status within society Improvement in personal safety and physical environment Satisfaction with customer service including Community Agents KPI Category 3: Society and Community Acceptance of the Project Community and Other Stakeholder Acceptance Regulator and Ratepayer Acceptance Improved Area-wide Security and Safety
Box 2-2 Main Project Outputs
Measure # installed or completed
Primary distribution system upgraded (km) 2.98 km Secondary distribution system upgraded (km) 5.4 km Transformers replaced (conventional/efficient) 6/12 Conventional meters and posts installed 3,890 Electronic remote-controlled meters installed 475 Pre- or post regularization door-to-door visits by community agents 8,594 Community and school events 27 events with
4906 attending Replacement of inefficient incandescent light bulbs with efficient compact fluorescent bulbs (CFLs)
9,588
Refrigerator assessments completed 2,598 Inefficient refrigerators replaced with PROCEL A-rated ones as needed 496 Wiring safety assessments completed 2,433 Rewiring of unsafe internal wiring and fixtures and replacement of electric shower
497
Replacement of individual outside lights with public lighting (472 in alleys and 33 in main streets)
505
Commercial audits and recommendations made 70
Transforming Electricity Consumers into Customers: 19 Case Study of a Slum Electrification and Loss Reduction Project in São Paulo, Brazil

Transforming Electricity Consumers into Customers: 20 Case Study of a Slum Electrification and Loss Reduction Project in São Paulo, Brazil
Table 2-1 Financial Responsibilities of the Partners for Pilot Components21
Total Cost (US$) Responsibility Action Description AES USAID ICA
Customer registration $8,417 X Project design
Primary and secondary network upgrades $7,748 X Community campaign Meetings with community leadership and people $2,632 X
Labor for network construction $278,680 X Secondary upgrade material $319,303 X Primary upgrade material $41,809 X
Equipment for remote metering (475 customers) $61,474 X
Primary and secondary network upgrades
Communication backbone $10,526 X Installation of coaxial cable and meters (included
in network construction) $0 X
Customer entrance box, circuit breakers + grounding (materials and labor)
$160,816 X Customer connection
Coaxial cable $206,763 X Efficient transformers (12 units) $55,737 X
Energy efficiency mini-audit in residential customers and lectures
$51,534 X
Efficient Refrigerators (497 units) $156,947 X X Lighting change to compact fluorescent lamps $41,801 X X
Residential customer rewiring $201,650 X Energy efficiency audits for commercial
customers $30,332 X
Energy efficiency improvements
Street lighting $67,241 X Evaluation of socio -
economic effects Customer opinion poll $35,263 X
Project Management/ Coordination
Project Manager and Local Coordinator $228,576 X
TOTAL $1,967,248 $1,075,514 $484,211 $407,524
2.2 PILOT COMPONENTS
As noted above, the pilot design and its components were based on the Partners’ ideas about what would make a sustainable approach to slum electrification. The components included:
Upgrades of the distribution system and service infrastructure to make it more difficult to steal electricity and to provide safer, better quality, more reliable and efficient electricity service within the area,
Energy efficiency measures and education to reduce consumption in households and commercial entities and therefore increase affordability of electricity service for the customer, and
In-home safety measures to reduce the risk of electricity related accidents and public lighting to improve the overall ambiance and personal security of the community.
21 All the costs quoted in this table are based on US$ 1.0 = R$ 1.9 which is the average exchange rate over the project implementation.

Transforming Electricity Consumers into Customers: 21 Case Study of a Slum Electrification and Loss Reduction Project in São Paulo, Brazil
To measure the success of these components in achieving the overall objectives and the KPIs, additional activities included:
Socio-economic surveys and consumer opinion polling,
Financial analysis of the viability of the approach, and
Dissemination activities such as the 2007 workshop and this case study.
Each of the above components or activities is described below, including the initial design and subsequent modifications.
2.2.1 Project Concept and Timeline
Due to the collaborative nature of the pilot and the complexity of the pilot plan, the partners needed tight control and monitoring of project implementation. In addition to the MOU and the Matrix of Responsibilities, a project timeline, and a master database (MDB) containing all the key data for each household regularized, was developed for use in evaluation and financial analysis. The timeline initially called for pilot initiation in mid-2006 and completion by mid-2007, but actual initiation was several months delayed and completion of the components of the pilot required up to the end of November 2007. Delays in the timing of different components are discussed below where the lessons learned from them would affect the planning for scale up or replication in another service territory.
2.2.2 Distribution System Efficiency Upgrades and Customer ‘Anti-Theft’ Technology
New technologies and techniques were introduced to reduce theft and improve the efficiency of the distribution network. The final set of technologies included the following:
Using twisted cable in the secondary network and bi-coaxial cable in the new service drop to each individual meter.22 This technology combination impedes line tapping and was expected to reduce bad debt from theft by approximately 30% in the overall area where it would be introduced.
Meter destroyed during attempt to tap into coaxial cable Illustration of construction of bi-concentric coaxial cable
22 The anti-theft cables used have a concentric construction consisting of one or two cross-linked polyethylene, insulated central conductors, concentrically wrapped by
helically applied copper wires (neutral conductor). The neutral conductor works like a shield to prevent illegal connections. A separator (longitudinal tape) is placed on the neutral conductor and covered by an overall black XLPE jacket which is weather and aging resistant. More information can be obtained from Nexans, Brasil.

Transforming Electricity Consumers into Customers: 22 Case Study of a Slum Electrification and Loss Reduction Project in São Paulo, Brazil
Introducing electronic metering for some commercial consumers to allow easy disconnection or ‘social cutting’23 in the case of non-payment. This technology was expected to reduce bad debts by 70% for those that received the meters and were subject to social cutting in the case of non-payment. Although the meters were installed, social cutting was never implemented during the pilot phase. The development of the electronic meter technology to enable social cutting took about six months longer than anticipated, making its use during the pilot period problematical because of the promised cap on billing for consumption over 150 kWh per month. Furthermore, ANEEL’s approval of the use of social cutting was necessary but was also delayed.
Conventional Meters enclosed in plastic to deter tampering Electronic meters for difficult to reach locations and commercial customers
Replacing twelve conventional overloaded transformers with efficient
transformers.24 This technology improvement was incorporated to reduce techlosses and improve the power quality of the areas served by the transformers. Network technical losses under the overloaded conditions encountered in slum areas are considerably higher than in other areas of
nical
the city.
Transformer being installed in pilot area
23 Social cutting is limiting the amount of kWhs that a customer can consume but not disconnecting the customer, in the case of non-payment. It is called social cutting
because the technique allows the customer to keep on receiving a minimum amount of power, even if in arrears, up to a preset limit. 24 More information on efficient transformer designs, their application and results obtained when utilized can be obtained from Procobre, Brasil.
In addition to these technological improvements to reduce bad debt and technical losses, it was necessary to replace much of the existing primary and secondary network within the pilot area (i.e., conventional cable, poles, and transformers). Public lighting was also installed primarily in the numerous alleyways where consumers had installed their own exterior lighting. This action reduced the consumption of individual consumers and provided far superior light (and security) in formerly poorly illuminated and unsafe areas.
2.2.3 Preparation of Consumers for Regularization, Affordability Measures, and Energy Efficiency and Safety Education
2.2.3.1 Contacting and Involving Community Leaders and Other Stakeholders
As a first step in the regularization program, AES-Eletropaulo contacted formal and informal community leaders, the municipality, other service providers, such as the water supply company, and NGOs, to inform them about the scope and scale of the planned project and to ensure that the work would be coordinated with the numerous other activities ongoing in the favela. An ad-hoc collaborative arrangement among all of the stakeholders was set up with periodic coordination meetings held to resolve problems as they arose. Several stakeholders became important informal partners, such as SEHAB and E. E. Prof. Homero dos Santos school where all the community events were held.
2.2.3.2 Customer Mapping, Registration, and Meter Setting
The first activity in the favela was to locate and register all of the potential customers of AES and have them sign the self-declaration of low income needed to make them eligible to receive the low-income tariff. This was accomplished by AES through a contract with an outside company. Detailed maps were created in order to lay out the new distribution system to adequately serve the densely populated and geographically complicated area.
Many of the subsequent delays were caused by difficulties encountered in this registration. Most of them were related to one or more of the following: not finding residents at home, difficulties in locating all of the houses without several attempts (e.g., quite a few were located behind locked gates opening onto yards with several houses), mistakes in identifying some structures as residences, or inconsistent numeration that needed to be corrected later. One result was that more meters were installed (by AES crews) than were needed for the number of households and commercial consumers that were actually in the pilot area. Additional cost was undoubtedly incurred by AES in installing and then removing the extra meters.
During the Pilot project, ANEEL decided to tighten the method used for identifying low income customers that would qualify for the low income tariff (LIT). A deadline was issued requiring that new customers must qualify for the LIT through registration with the government’s household registry, called the Cadúnico and administered by the municipality, in order to receive a determination from the municipality of eligibility for Bolsa Família. All of the distribution companies in the country were affected by this change, and it caused significant disruption to ongoing regularization projects. The companies appealed to ANEEL which then extended the deadline at least once and subsequently relaxed the requirement.
Transforming Electricity Consumers into Customers: 23 Case Study of a Slum Electrification and Loss Reduction Project in São Paulo, Brazil

Transforming Electricity Consumers into Customers: 24 Case Study of a Slum Electrification and Loss Reduction Project in São Paulo, Brazil
Some problems arose with commercial customer registration and metering. Commercial operations are only eligible for the commercial tariff if they are formally registered with the government as a business. As many have not done this, they were assigned the low income tariff based on their consumption levels. Their differing status as commercial customers and subsequent tariff designation caused confusion and had the appearance of inconsistency by AES. Clearly, the commercial customers who were classified as low income received a considerable reduction on their bills while those who paid full tariff felt discriminated against (the difference being on the order of 50% more for those charged the full commercial tariff).25
2.2.3.3 Community Campaigns
Door-to-door visits were conducted both pre- and post- regularization to first prepare consumers for regularization before project implementation (to explain the process and allay any fears) and later to assist them to resolve any problems that had occurred during or since regularization. During the visits socio-economic information was gathered. The initial visits preceded the energy audits described below. Community events were also held throughout the process of regularization and afterward, again with a focus on preparing the community for regularization and providing information in an accessible manner about the benefits of regularization, bill paying, controlling consumption by monitoring the meter, energy efficient practices, safety concerns and how to avoid electrical risks.
Community agents in the community Community agent doing home audit
The community-level events were quite useful for completing the registrations of consumers who were not located during the initial registration effort. While the door-to-door visits were indispensable for preparation of the community, the effort was similarly troubled by absences. Numerous extra efforts had to be made to reach as many households as were finally reached, but even then approximately one-quarter was not reached for a pre-regularization visit, and around one-third was not reached for the post- visit. Efforts to contact consumers were abandoned only after four attempts were unsuccessful. The hours and days of conducting door-to-door visits as well as the mini-audits (see below) had to be adjusted (i.e., mostly extended to weekends) to achieve the number of contacts that were made. Working longer
25 It should be noted that AES would have been almost indifferent financially to which classification these customers received because its low income tariff would be
subsidized by the government to almost the same income as if the customer were classified as commercial but society and/or other ratepayers would be worse off as a result.

Transforming Electricity Consumers into Customers: 25 Case Study of a Slum Electrification and Loss Reduction Project in São Paulo, Brazil
hours (into the evening) would have been preferable, but safety concerns for the community agents made this untenable.
Crowd forming to attend pre-regularization community event Community event: post regularization
The consumer poll indicated that some of the households having a door-to-door visit but not receiving a refrigerator or rewiring did not recall the visit. It is possible that some of these were among those who were absent during all attempts to contact them. Alternatively, a larger number of them recalled the community events and said that they attended them. It seems that door-to-door visits are very effective but not sufficient to reach all households and, at a minimum, community events should be held in parallel.
2.2.3.4 Affordability and Energy Efficiency Assistance
Given the high and unaffordable level of consumption by households and commercial consumers and the urgent need to reduce their usage and enhance the affordability of service, the project undertook a number of measures to reduce costs of becoming regularized and to increase household efficiency. These encompassed:
With the approval of the regulator, free meter, service drop and grounding (normally the consumer is required by law to pay for these).
Assistance to heads of household to prove eligibility to receive the low income tariff.
Capping of billed consumption at 150 kWh for a minimum of 3 months or until all consumers in the favela had been regularized, whichever was longer. This would help transition customers into paying for their service and, as the bills showed what their actual consumption was and what they would have paid for it, would educate them on the extent to which they would need to reduce their consumption once their bill was uncapped.
Mini-audits of households to identify energy efficiency opportunities, particularly assessing the need to replace inefficient refrigerators and unsafe internal wiring.
The replacement of up to three incandescent bulbs with efficient compact fluorescent bulbs in homes,26 originally estimated to require approximately 13,000 for the entire pilot area. A little over three-quarters of the households received light
26 The process used was a door-to-door delivery on several days. Inefficient bulbs retrieved were broken and taken to a landfill for disposal.

bulb replacements as many residents were not at home during the distribution. The absentee rate was around 10% and about 1% already had CFLs. The average number of lamps replaced per household that received them was 2.85.
Lighting upgrades
The replacement of refrigerators in bad condition for 496 residential customers with the least ability to pay their bills. Box 2-3 describes the process for selecting households and replacing refrigerators. Due to high rate of household absences, only 65% of the households received refrigerator diagnoses despite several attempts to contact them. There is no way to know if those missed would have qualified to receive the refrigerator replacement. The percentage needing a more efficient refrigerator was 28% of those diagnosed.
Inefficient individual lights installed on the exterior of houses for security purposes were eliminated and public lighting installed.
Old refrigerator Replacement refrigerator
Transforming Electricity Consumers into Customers: 26 Case Study of a Slum Electrification and Loss Reduction Project in São Paulo, Brazil

Box 2-3 Process for Identifying and Replacing Inefficient Refrigerators
The Refrigerator AES and Whirlpool developed a “social refrigerator” (designed to use only 28 kWh per month) that would meet the PROCEL efficiency “A” rating, which is the most efficient rating that a refrigerator can receive in Brazil, while reducing the cost of the refrigerator by reducing the size and eliminating some features (notably the egg tray and a reduced internal volume).
The Process 1. Prior to the replacement process, AES studied its consumption records and selected
the set of new customers that had consumption greater than 100 kWh per month (as this indicates the likely presence of a refrigerator in the house.)
2. A field visit was conducted for these houses to evaluate the condition of the old refrigerators which were classified as good, OK, bad, or very bad condition.
3. A contract containing household information and data on the old refrigerator was signed by the responsible person in the household and the data was then recorded at AES. Any households with greater than 3 months’ bad debt were eliminated.
4. A document indicating receipt of the new refrigerator was then drawn up (for signature by the responsible person and a witness) and a “fiscal note” was prepared.
5. This paperwork was delivered to the refrigerator manufacturer that contracted with AES to deliver the new refrigerator and take away the old one. The manufacturer then set up delivery dates with the recipients.
6. During delivery the manufacturer collected copies of two identification documents of the recipient (the national registry and the equivalent of a social security card). Only 1% of the potential recipients were unable to produce these documents.
7. The replaced inefficient refrigerators were recycled, including trapping and destroying the ozone-destroying refrigerant, according to standard accepted practice.
Approximately 10% of the households did not receive any ‘treatment’ at all (i.e., post-regularization visit, mini-audit, lamps, etc.) because they could never be found at home.
2.2.3.5 The Commercial Sector of Paraísopolis
The pilot’s activities for commercial customers encompassed the following:
Identifying the commercial activities in the area, the condition of the internal wiring and electricity using appliances and equipment, their ability to pay their electricity bills after regularization and the actions that they might take to reduce their bills, primarily focusing on more energy efficient practices and equipment change-out to reduce consumption. Recommendations on improving the safety of internal wiring were also made to reduce the risks of accidents and fires.
Developing a ‘social cutting’ strategy that included the installation of electronic meters that could be controlled remotely, allowing the distribution company to limit
Transforming Electricity Consumers into Customers: 27 Case Study of a Slum Electrification and Loss Reduction Project in São Paulo, Brazil

Transforming Electricity Consumers into Customers: 28 Case Study of a Slum Electrification and Loss Reduction Project in São Paulo, Brazil
There was concern that businesses with employees that could not afford their bills (or which were subject to social cutting) might go out of business. So, the energy and cost saving analyses included examination of the number of employees in each establishment and questions to the proprietor to determine their likely future ability to pay the bills that they were receiving, particularly after the cap on consumption was lifted.
While all commercial customers were identified for the purposes of registering them as customers prior to regularization, funding constraints limited the energy cost saving and safety assessments to a sample of 70 customers. Resulting recommendations on the energy efficiency measures and safety that these sample customers could adopt to reduce their bills and improve safety will be used by AES to help them target their efforts in helping commercial customers reduce their consumption and stay in business. Most of the electronic remote-control meters were installed on commercial customers; a few were used in situations where residential units were so difficult to access that traditional meter reading would be burdensome.
2.2.4 Safety Measures
The information provided in the households visits and the community events and school lectures described above also included electrical safety recommendations. The mini-audits included assessment of the need for rewiring of homes, focusing on those with especially risky internal wiring. For those that needed rewiring and that were judged to be very low income and unlikely to be able to afford to pay their electricity bill, the pilot provided free rewiring (up to a limit of 500 households due to funding limitations). The typical job included the following items: new wire (mostly in conduit), electrical outlets and receptacles, circuit breaker box and breakers, and a replacement electric shower.27 Due to absences, only 61% of the pilot households received an electrical safety inspection; of those, 58% were judged to need rewiring for improved safety. In total, 1406 households’ wiring was found to be in bad and very bad condition, but funds were limited to 500 in the pilot (and actually 496 or slightly over 11% of the total households received the measure). Box 2-4 describes the process for identifying and replacing faulty wiring in pilot households.
Typical wiring prior to upgrade Example of upgraded wiring
27 The replacement electric showers were necessary to eliminate ground faults but also had a small electricity saving benefit over the old shower. The new shower was
somewhat more efficient (lower power rating) and contributed to the overall savings of kWh for the project.

Box 2-4 Process for Replacement of Inefficient and Unsafe Internal Electrical Wiring and Related Equipment
Rewiring In each household rewired three separate circuits were created: one for plugs, the second for lights and a dedicated circuit for the electric shower. All old electric showers were replaced. The Process 1. A diagnostic was done by a general technical contractor for each household that could
be contacted to determine whether it was a candidate for internal wiring replacement or not according to technical and income criteria developed by the partners.
2. A detailed plan and materials list for each house was developed and an appointment was made for conducting the replacement.
3. New electrical equipment was then installed and tested prior to removing any of the old wiring and related equipment.
4. All of the old equipment was recycled. 5. Instructions were provided to the residents on the proper and safe use of the new
equipment and the resident was required to sign for the installation.
2.2.5 Consumer Polling
A comprehensive post regularization consumer poll was conducted for a representative sample of 400 regularized households in four categories, i.e., segmented by those receiving:
Basic treatment (household visits and lamp replacements),
The basic treatment plus a refrigerator replacement,
The basic treatment plus rewiring, and
The basic treatment plus rewiring and refrigerator replacement.
The objective of the poll was to investigate:
Socio-demographic profile of households.
Observation of the households’ physical conditions.
Budget, expenses and relationship with electricity bills.
Receipt of new light bulbs, refrigerators, and rewiring.
Satisfaction with process for rewiring and substituting refrigerators.
Predisposition to buy a new refrigerator and to finance household appliances (if no refrigerator was received).
Perceptions about electricity safety and quality.
Effectiveness of the pilot’s communication efforts such as home visits and events.
Perception of social and economic changes after the Pilot Project.
Overall satisfaction with the Pilot Project.
Transforming Electricity Consumers into Customers: 29 Case Study of a Slum Electrification and Loss Reduction Project in São Paulo, Brazil

Observations on these topics are placed in appropriate sections throughout this report, particularly in Section 3: Evaluation of Results.
2.2.6 Financial Analysis and Case Study
An Excel- based financial analysis was done on the cost-effectiveness and financial viability of the Pilot for the distribution company for the overall approach and for the different technical measures. The analysis is based on data collected in the master database, including key socio-economic, consumption, billing and collections data for each customer. The results of the financial analysis are presented in Section 3.
2.3 SUMMARY OF THE CHANGES IN THE ORIGINAL PILOT PLAN
The following items considered in the original pilot plan had to be modified to complete the pilot:
Having two separate areas within the pilot area to test two distinct technological options (i.e., electronic metering in one and conventional meters in another) was physically too difficult and this was dropped. Instead, each consumer treatment was carefully tracked in order to be able to isolate the effects of technologies for the evaluation.
A cable innovation was planned for the secondary network but could not be developed in time for the pilot. The cable to be developed was a 35mm2 coaxial cable consisting of one or two cross-linked polyethylene insulated central conductors of copper. The main difficulty in producing this cable was its weight and the distribution infrastructure needed to hold it.
A pre-project baseline survey of the residents was not possible due to the time limitations set by ANEEL for installing the equipment funded through the 1% Energy Efficiency Fund. Instead, socio-economic information provided by SEHAB (which was later updated during the household visits) and the IBOPE post-regularization poll incorporated questions that sought to establish how things had changed.
Adding a refrigerator finance component and an optional commercial customer energy efficiency investment finance component was dropped because time and funds did not allow either of them,
Training people from the community (with appropriate backgrounds) to become the electricians to do the rewiring component was dropped because the time required to accomplish this meant that it could not be completed in time for the projected start of the rewiring component,
For both the rewiring and refrigerator replacements, it was necessary to scale back from the original estimate of 800 to a more affordable number of 500 each (and actual installations were slightly less than this goal).
The original plan did NOT include electric shower replacement, but this was found to be necessary for every household that received the rewiring. The funds for the new showers came through the AES ANEEL funds.
Transforming Electricity Consumers into Customers: 30 Case Study of a Slum Electrification and Loss Reduction Project in São Paulo, Brazil

Transforming Electricity Consumers into Customers: 31 Case Study of a Slum Electrification and Loss Reduction Project in São Paulo, Brazil
Finally, the Pilot did not have a formal ‘control’ group against which to measure the effects of the pilot. Instead, we used AES’s experiences with other areas for a rough comparison.

Transforming Electricity Consumers into Customers: 32 Case Study of a Slum Electrification and Loss Reduction Project in São Paulo, Brazil
Section 3 Evaluation of Results
3.1 INTRODUCTION
A main objective of the project evaluation is to assess the pilot results as they relate to the KPIs described earlier in Box 2-1. The second objective is to examine the likely sustainability of project results over the medium term (up to 10 years). This is particularly important as some behavioral changes, such as those induced by the economic impact (or ‘price signal’) that electricity consumers experience when they become regularized, will take longer than the pilot period for their full effect to be realized. Other effects, such as recidivism to bad debt or fall off in efficiency gains from light and refrigerator replacements, may also occur.
Sustainability depends primarily on three main factors:
the ability of the company to make a business case for serving low income customers,
the affordability of electricity service for consumers and their satisfaction with the service they are receiving28
the willingness of the regulator to consider and approve actions that the company proposes to find profitable ways to serve these customers while protecting other consumers from undue financial burden.
To determine whether the pilot project represented a sustainable business approach, a ‘case,’ called the Actual Case, was constructed to reflect the actual results of the pilot. Using this as a basis, the robustness of the results of the pilot was examined for different scenarios that may occur in the future (an optimistic case, a pessimistic case, and an efficiency/safety optimization case). Sensitivity analyses were conducted to determine which effects were driving the results. The overall results were then compared to the KPIs for the company, the consumer and the Brazilian society at large. As one of the pilot objectives is to disseminate results and consider how the results may apply in other situations around the world where non-technical losses associated with low income consumers are a major problem, a ‘project-perspective’ case was constructed that could reflect conditions in less favorable regulatory situations.
To determine sustainability from the perspective of the consumer, customer metered consumption, billing, and collections were examined for the effects of regularization and energy efficiency measures on electricity consumption, electricity bills, bill payment and bad debt. Then, the sustainability of the approach was examined from the societal perspective, primarily examining the effect on other ratepayers of subsidies received by the company for its loss reduction activities.
28 Although affordability and satisfaction are key to achieving sustainability, old habits and attitudes die hard. So, technological solutions for reducing theft are very
important, in combination with working on changing habits and improving efficiency. Furthermore, the transience of slum populations means that new residents may not have the same appreciation of the improvements that were achieved with regularization, and illegal service providers may provide persuasive “alternatives” to regular payment of electricity bills.
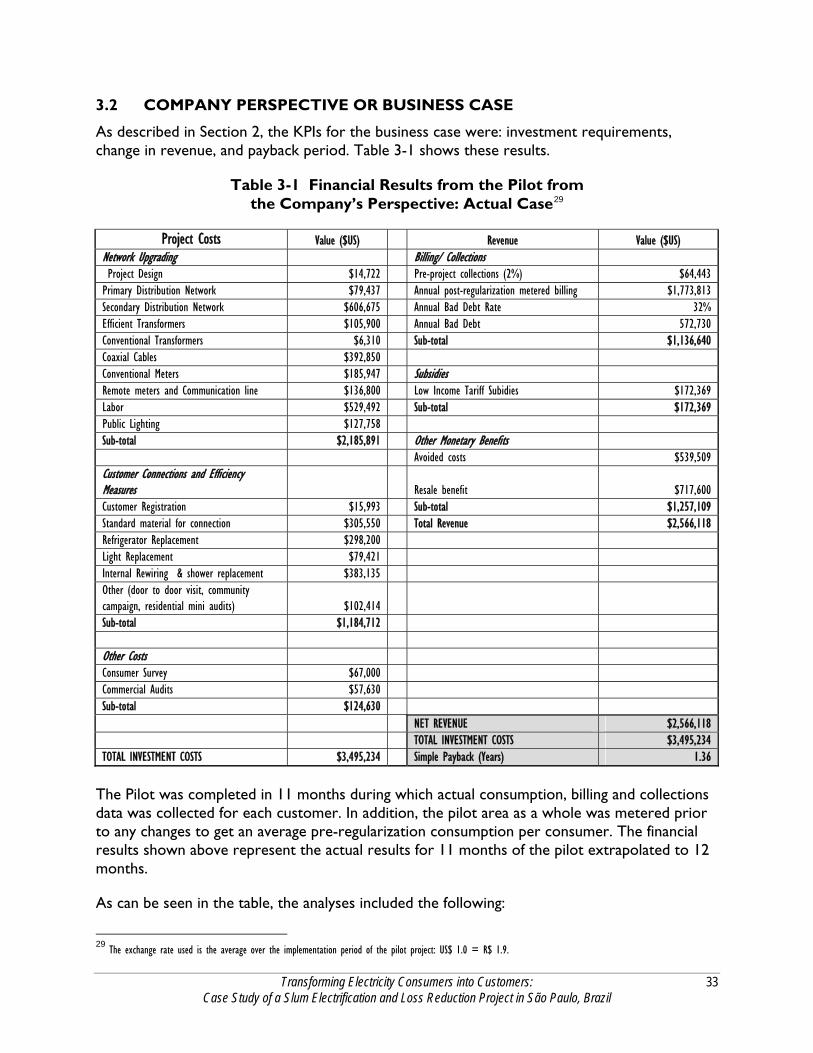
Transforming Electricity Consumers into Customers: 33 Case Study of a Slum Electrification and Loss Reduction Project in São Paulo, Brazil
3.2 COMPANY PERSPECTIVE OR BUSINESS CASE
As described in Section 2, the KPIs for the business case were: investment requirements, change in revenue, and payback period. Table 3-1 shows these results.
Table 3-1 Financial Results from the Pilot from the Company’s Perspective: Actual Case29
Project Costs Value ($US) Revenue Value ($US) Network Upgrading Billing/ Collections Project Design $14,722 Pre-project collections (2%) $64,443 Primary Distribution Network $79,437 Annual post-regularization metered billing $1,773,813 Secondary Distribution Network $606,675 Annual Bad Debt Rate 32% Efficient Transformers $105,900 Annual Bad Debt 572,730 Conventional Transformers $6,310 Sub-total $1,136,640 Coaxial Cables $392,850 Conventional Meters $185,947 Subsidies Remote meters and Communication line $136,800 Low Income Tariff Subidies $172,369 Labor $529,492 Sub-total $172,369 Public Lighting $127,758 Sub-total $2,185,891 Other Monetary Benefits Avoided costs $539,509 Customer Connections and Efficiency Measures Resale benefit $717,600 Customer Registration $15,993 Sub-total $1,257,109 Standard material for connection $305,550 Total Revenue $2,566,118 Refrigerator Replacement $298,200 Light Replacement $79,421 Internal Rewiring & shower replacement $383,135 Other (door to door visit, community campaign, residential mini audits) $102,414 Sub-total $1,184,712 Other Costs Consumer Survey $67,000 Commercial Audits $57,630 Sub-total $124,630 NET REVENUE $2,566,118 TOTAL INVESTMENT COSTS $3,495,234 TOTAL INVESTMENT COSTS $3,495,234 Simple Payback (Years) 1.36
The Pilot was completed in 11 months during which actual consumption, billing and collections data was collected for each customer. In addition, the pilot area as a whole was metered prior to any changes to get an average pre-regularization consumption per consumer. The financial results shown above represent the actual results for 11 months of the pilot extrapolated to 12 months.
As can be seen in the table, the analyses included the following:
29 The exchange rate used is the average over the implementation period of the pilot project: US$ 1.0 = R$ 1.9.

Transforming Electricity Consumers into Customers: 34 Case Study of a Slum Electrification and Loss Reduction Project in São Paulo, Brazil
Investments or Costs
Network Upgrading. These costs include the investments needed to establish a safe, reliable and more theft-proof primary and secondary distribution system for the area, including the purchase and installation of anti-theft cables (bi-coaxial copper service drop cable), efficient and conventional transformers, poles, and meters. The actual costs of all of the investments were used in the analysis. Roughly two-thirds of the total investment costs in the pilot were for distribution investments.
Customer Connection and Efficiency Measures and Other Costs. These costs include investments made on the consumer side, such as the energy efficiency measures (i.e., refrigerator, lights, and shower replacements) and safety measures (i.e., material and labor for internal rewiring30), and a variety of consumer-related activities, including door-to-door household visits both pre- and post-regularization, commercial and residential mini-audits to determine energy efficiency actions that could be taken, community events and lectures at schools and the post-regularization consumer poll. Other consumer investments include the standard materials for connection (e.g., box, grounding, and fuses). These consumer investments represent about one-third of the overall investment.
Efficient Transformers. The savings from efficient transformers are area wide. The estimated reduction in technical losses was 6,151 kWh per month. While the consumers in the area receive no direct benefit from the more efficient devices, the company recoups its investment on the transformers through the avoided cost of kWh it would have had to purchase. The efficient transformer design used in the pilot project resulted in a load loss reduction from transformers of 26%, representing an estimated cost savings on the order of R$ 461 per year for each unit replaced and a payback period of less than one year. The results indicated a total cost reduction of 12% and power savings of 1.96 MWh/year.
Revenues (and Avoided Costs)
Billing and Collections. These revenues are derived from the overall area metered consumption and actual collections. The annual bad debt rate of 32% used is based on the annualized percentage of billing that was not collected. During approximately the first six months of the pilot the consumption billed was capped at 150 kWh for any consumer using more than 150 kWh (approximately 57% of the new customers had consumption greater than 150 kWh). In these cases, the new customer was informed of his or her actual consumption in preparation for the eventual uncapping of the bill. For approximately the last 3 months of the pilot, bills were based on actual consumption for around half of the new customers.31 A graph in the next sub-section on the customer perspective shows this trend. Revenue associated with collections at the 32% debt rate account for approximately 44% of total revenue.
30 Internal rewiring also provided significant electricity savings on the order of 11 kWh per home rewired and these savings are reflected with the other efficiency measures
in the consumer analysis and in the avoided costs to the company for not having to provide those additional kWh with no remuneration as was the case before the pilot project.
31 New customers were added over a period of several months, so the capped period for each customer varied depending upon when the customer was first connected. Indeed some of the most difficult to reach consumers were not connected until nearly the end of the pilot period. In the subsequent consumer analysis, adjustments had to be made to incorporate these differences.

Transforming Electricity Consumers into Customers: 35 Case Study of a Slum Electrification and Loss Reduction Project in São Paulo, Brazil
Subsidies. These are the subsidies that the company will receive from the CDE fund for the kWh sold to registered low income customers (that were not received when previously not-registered customers were stealing or not paying for electricity). These tariff subsidies for low income households were computed based on average consumption per household. This tariff subsidy reimbursement accounts for around 7% of revenues.
Other Monetary Benefits
Avoided Costs. These costs include (1) those that the company can now avoid by not having to purchase electricity that would have been used but not paid for if the area had not been regularized and (2) the kilowatt hours that were saved by implementing consumer efficiency measures and installing efficient transformers in the area. These avoided costs are calculated based on the average purchase cost of power. Avoided costs make up around 21% of revenues.
Resale Benefit. This is the added revenue that the company can receive if it can sell the kWh saved (from the above avoided costs) to other paying customers.32 This is the case where demand for electricity service exceeds supply and all kWhs can be sold to consumers. The revenues are calculated as the difference between the retail tariff and the purchase cost of power. Resale benefits account for approximately 28% of revenues.
It should be noted that in the above described costs and benefits, the purchase cost of power to supply the pilot area and the O&M costs associated with serving the area were not included. The reason for this is that these costs are remunerated through the tariffs charged to the entire AES ratepayer base, not just those customers in the pilot area.33 While the additional O&M, electricity purchase costs and loss reductions associated with the pilot are too small to impact the tariff, rollout of the program to all of the areas needing regularization may indeed impact these costs and hence the tariff.
The results of the Pilot as measured by the KPIs for the company perspective are thus highly favorable. The total investment was approximately $421 per customer, with a simple payback on the investment of around 1.4 years. The actual bad debt rate in the pilot area (averaged over the entire 11 months) was 32%.34 Note that ‘Other Monetary Benefits’ are on the same order of magnitude as the net revenues from collections plus the subsidies that the company receives from the government to compensate it for the difference in the revenues received by applying the low income tariff instead of the regular residential tariff. Table 3-2 provides a number of pilot statistics on a per customer basis.
32 The rationale would be that electricity production is limited and kWh that are freed up allow other consumers to purchase additional electricity without additional
generation capacity being added. 33 Section I and Appendix A provide explanations of tariff treatment of investment and operating costs. 34 The bad debt rate here is the percent of total billing that is not collected (paid) and not the % of customers that did not pay their bills.

Transforming Electricity Consumers into Customers: 36 Case Study of a Slum Electrification and Loss Reduction Project in São Paulo, Brazil
Table 3-2 Average Per Customer Costs and Revenues
Average investment per customer regularized (US$) $421 Average annual collection per customer regularized (US$) $127 Average overall annual revenue plus other revenues per customer regularized (US$) $321 Average monthly EE saving per customer 41 kWh Average monthly regularization effect per customer 58 kWh
3.2.1 Discussion of the Cases and Sensitivities
The scenarios and sensitivity analyses help to illustrate how the results are affected if key parameters change. These are described below. Table 3-3 shows the results for all the cases and sensitivities, and Figure 3-1 graphically illustrates them.
Table 3-3 Comparison of Cases and Sensitivity Results
Actual Case Optimistic
Case Pessimistic
Case Sensitivity 1: No subsidies
Sensitivity 2: No resale
Max Efficiency Case
REVENUES Billing/ Collections Pre-project collections (2%) $33,917 $33,917 $33,917 $33,917 $33,917 $33,917 Annual post-regularization metered/ billing $933,586 $933,586 $933,586 $933,586 $933,586 $550,461 Annual Bad Debt Rate 32% 12% 50% 32% 32% 22% Annual Bad Debt $301,437 $112,030 $466,793 $301,437 $301,437 $121,101 Sub-total $598,231 $787,638 $432,875 $598,231 $598,231 $395,442 Subsidies Tariff subsidies $90,721 $90,721 $90,721 $0 $90,721 $75,765 Sub-total $90,721 $90,721 $90,721 $0 $90,721 $75,765 Other Monetary Benefits Avoided Costs $283,952 $283,952 $283,952 $283,952 $283,952 $415,308 Resale benefit $377,684 $377,684 $377,684 $377,684 $0 $552,401 Sub-total $661,636 $661,636 $661,636 $661,636 $283,952 $967,709 Total Revenue $1,350,588 $1,539,995 $1,185,232 $1,259,868 $972,904 $1,438,916 OPERATING COSTS ` Electricity Purchase (pilot consumption) $0 O&M Costs (0.022R$/kWh) for pilot consumption $0 $91,582 Subtotal Operating Costs $0 $91,582 $0 $0 $0 $0 NET REVENUE $1,350,588 $1,448,413 $1,185,232 $1,259,868 $972,904 $1,438,916 TOTAL INVESTMENT COSTS $1,839,597 $1,839,597 $1,839,597 $1,839,597 $1,839,597 $2,791,975 Simple Payback (Years) 1.36 1.27 1.55 1.46 1.89 1.94
3.2.1.1 Optimistic Case
In this case, the bad debt rate was decreased to 12%, which is the rate that AES has achieved in other areas that it recently regularized.35 To achieve the 12% rate would require additional investment to reduce consumption and sustained focus on the community to maintain these
35 Note, however, that these other areas do not have as many large consumers and do not have the level of community cohesion and political clout as does Paraisópolis.

positive results, including working far more intensively with customers on an individual basis, negotiating repayment of bad debts already run up, and providing additional assistance to them to control their consumption. This might be in the form of additional advice on how to save electricity and replacements of inefficient appliances, particularly the electric showers and refrigerators. Implementing a policy of disconnection or social cutting for commercial customers might achieve much better control of consumption. The extra expenses of these actions were reflected in the Optimistic case by adding O&M costs reflecting the intensive effort to work with customers to reduce their consumption to affordable levels, to pay their bills on time and to negotiate terms under which they might repay debts when they fall behind. In this case, the simple payback improves somewhat to around 1.3 years (from around 1.4 without the interventions if the company can get the bad debt rate under control).
Figure 3-1 Results of Cases and Sensitivities
$0
$200,000
$400,000
$600,000
$800,000
$1,000,000
$1,200,000
$1,400,000
$1,600,000
Actual Case Optimistic Case Pessimistic Case Sensitivity 1: Nosubsidies
Sensitivity 2: Noresale
Max EfficiencyCase
0.00
0.50
1.00
1.50
2.00
2.50Net Revenues (US$)Simple Payback (Years)
3.2.1.2 Pessimistic Case
In this case, the Actual Case was again used as the basis for the analysis and the bad debt rate was increased to 50% to simulate a full year’s fully uncapped billing for actual consumption and the extrapolation of the higher bad debt rate experienced in the last three months of the pilot when billing began to be based on uncapped consumption. This case would illustrate the situation that might occur if the company does not make additional efforts to reduce bad debt and those with now uncapped bills for consumption fell further and further behind. The payback rises to about 1.6 years.
Note that in both these cases, the re-sale benefits and avoided costs were held constant, whereas they would be impacted by changes in the bad debt rate. As the bad debt rate
Transforming Electricity Consumers into Customers: 37 Case Study of a Slum Electrification and Loss Reduction Project in São Paulo, Brazil

Transforming Electricity Consumers into Customers: 38 Case Study of a Slum Electrification and Loss Reduction Project in São Paulo, Brazil
increases, the associated avoided costs and re-sale benefits would disappear. Also the Pessimistic Case does not reflect the uncapping of bills and subsequent increase in revenues from customers that do pay their bills. A separate simulation using the results from the last three months of the pilot period when the 150 kWh cap had been removed for around 50% of the customers illustrates that billing for full consumption increased the bad debt rate to almost 50% but also raised revenues and improved the payback time (dropping by 25% from the results obtained by simulating the cap staying in place over the entire time period).
3.2.1.3 Maximum Energy Efficiency Case
Given that not all that needed energy efficiency measures received them, a Maximum Energy Efficiency Case was examined to see the effect on the company and consumer perspective if energy efficiency measures and rewiring were maximized. That is, instead of limiting the measures to those that the pilot sponsors could afford, replacing all of the inefficient refrigerators and lights and the safety measures that were identified as necessary and recipients deemed eligible in the mini-audits. Using the following table derived from the results of the mini-audits, the added cost of the additional measures and the resulting revenues from ‘optimizing’ the consumer measures was computed. The increase in investment costs for energy efficiency maximization would be on the order of $950,000 or an increase in the total investment of roughly 50%. The results are that the payback for the company is about the same while a larger number of customers can afford to pay their bills (the case analysis assumed that debt would fall to 22%). The payback calculated for the company remained about the same as the Actual Case because each kWh saved has an avoided cost associated with it and can be resold by the company.36 Section C examines the benefits to consumers of efficiency measures in more detail. Table 3-4 shows the additional savings that could be expected if the full complement of measures had been installed.
Table 3-4 Consumer Measure Optimization Sensitivity
Item % of HH
Needing Measure % of HH surveyed
# Replaced in the Pilot
# of units needed if extrapolated to total #
of HH
Incremental savings in kWh
from optimization
Refrigerators needed 28 67 496 1,086 340,700 Rewiring needed 58 63 497 2,243 606,510 Lamps 100 85 9,588 11,030 356,641
Sensitivity analyses were done to examine separately the effect of resale and subsidies on the investment payback period by systematically eliminating each source of revenue as follows:
If revenues from the low income subsidy make-up from the government are excluded, the payback rises to 1.5 years.
If resale benefits are excluded (but the avoided purchase costs of the kWh saved from regularization and energy efficiency measures are still included), the payback rises to slightly over 1.9 years.
36 For this sensitivity, a reduction in the bad debt rate of 10 percentage points was estimated.

Transforming Electricity Consumers into Customers: 39 Case Study of a Slum Electrification and Loss Reduction Project in São Paulo, Brazil
The above analysis shows that the KPIs from the utility’s perspective vary only slightly between the various cases and sensitivities. The return on investment is positive, even in the most pessimistic cases involving increased bad debt or elimination of the subsidies and the resale benefit which should be quite acceptable to the company compared to other investments that it might make.
3.3 CONSUMER CASE
As described in Section I, the Paraisópolis favela is very dynamic, and families regularly migrate in and out of the community. Approximately 4000 consumers (a mixture of households (HH), commercial and mixed uses) were originally estimated to live in the pilot target area, but it was later found that there were significantly more. The problems associated with numeration of houses and businesses described in Section II contributed to this uncertainty. Furthermore, the area itself was somewhat difficult to isolate because the physical area chosen (by blocks) did not necessarily coincide with the best and safest layout of the distribution system.37 For the purposes of this evaluation and reporting of pilot statistics, the number of customers was ‘frozen’ at 4365 consumers which was the number for whom we had reasonably complete data sets. For most of these, a metered consumption record was available and billing had been instituted.
Table 3-5 shows a breakdown of the type of consumer (i.e., three main classes – households, commercial establishments, and mixed use residential/commercial).
Table 3-5 Composition of Types of Consumers in Pilot Area
Types of Consumer # of customers % Residential 3,882 87 Mixed Residential/commercial 60 2 Commercial 423 11 Total in Pilot 4,365
Figure 3-2 shows the proportions of the consumption attributable to the three classes of customers in the pilot area. Residential customers dominate consumption at 87% of the total.38
Figure 3-2 Proportion of Post-Regularization Consumption by Customer Type
Residential, 87%
Mixed, 2%
Commercial, 11%
37 In fact, it will always be inconclusive since consumers are moving in and out and adding new structures or to exiting structures on a daily basis. 38 In formal areas, commercial customers would tend to have significantly higher proportion of the consumption than their proportion of number of customers. For the
most part the commercial activities in Paraisopolis are very small “mom-and-pop” type stores.

Transforming Electricity Consumers into Customers: 40 Case Study of a Slum Electrification and Loss Reduction Project in São Paulo, Brazil
Evaluation of Consumer KPIs. The evaluation of the results of the pilot from the customers’ perspective began with the KPIs for the consumer under KPI Category 2: Affordability and Acceptability for the Customer. They were:
Reduction in inefficient consumption achieved
Change in affordability of electricity service
Improvement in the reliability of electricity service
Improved legal and institutional status within society
Improvement in personal safety and physical environment
Satisfaction with customer service including Community Agents
The first two were the main focus of the analytical effort, but all of them are individually examined in the subsections below.
3.3.1 Reduction in Inefficient Consumption Achieved
The results of the pilot vis-à-vis the first KPI were directly measured. The average pre-regularization consumption per consumer calculated from area measurements was 250 kWh per month. This average included consumption for all residential, commercial and mixed residential/ commercial customers included in the pilot area. The average post-regularization consumption, again for all customers, but prior to installation of energy efficiency measures was 192 kWh per month.39 This drop in consumption can be considered the ‘regularization’ effect, that is, the effect on consumption of the new anti-theft measures, the ‘price signal’ sent by now billing for electricity service and changes in consumer behavior as a result of the community campaign. The regularization effect amounted to about a 23% reduction in overall consumption during the pilot period.
After the residential efficiency measures were taken, consumption fell to 151 kWh per month on average (calculated from actual metered consumption of each customer). This represents roughly an additional overall 23% reduction. Together the actions taken in the pilot achieved a 40% reduction in consumption with roughly half coming from the regularization effect and half from the efficiency measures as shown in Figure 3-3.
This is probably not the full effect of regularization and efficiency improvements because many consumers had their billing for consumption capped during much of the pilot period. The effect of receiving bills based on actual (and not capped) consumption could have several results: customers would most likely try to reduce consumption more than they did prior to being uncapped or they might fall into debt or a combination of the two. Since almost 50% of the new customers were still capped at the end of the pilot period, it could be expected that further drops in consumption and a greater amount of delayed or non-payment might occur.
39 This figure was derived by analyzing the consumption of those who were regularized and had not yet received any energy efficiency measure, not even CFLs. The average
consumption was 192 kWh.

Figure 3-3 Effect of Regularization and Energy Efficiency Measures on Consumption
250
192
151
0
50
100
150
200
250
300
Pre-regularization Post regularization Post EE measures
Stage of the Pilot
Ave
rage
Con
sum
ptio
n A
ll C
usto
mer
s (k
Wh)
3.3.1.1 Breakdown of Electricity Saving Results for Residential Consumers
As noted earlier, Paraisópolis has a relatively large concentration of commercial and mixed use consumers. So far, the results have been reported based on an aggregation of the entire group of 4365 customers. Yet, energy efficiency and safety measures were provided only to households. Also, many slums do not have the same large amount of commercial customers. It was therefore important to analyze separately the effect of the pilot’s activities on the residential group after extracting the two commercial groups (commercial and mixed-use) from the pilot database.
Average pre-pilot residential consumption was imputed to be roughly 245 kWh per month by eliminating the pre-pilot consumption of commercial consumers. Post pilot residential average consumption was found to be 154 kWh per month for an average reduction per household of 91 kWh per month. This average reduction reflects the combined effects of regularization and the energy efficiency measures.
The effect on consumption of the efficiency measures was isolated from the regularization effect by analyzing the drop in consumption for households receiving some or all of the efficiency measures and extrapolating to the entire residential sample. The results of the analysis are shown in Table 3-6 below. The largest individual savings were from refrigerator exchange at 576 kWh or $73 per year for those who got them, but the greatest overall impact on electricity savings in the pilot area was from light replacements (around 70% of the total household savings achieved). Even though less than 500 refrigerator replacements were made, they had the next largest overall effect at around 14% of total pilot household energy savings. As the refrigerators were targeted to those households in the lowest income tiers and with the most degraded refrigerators, it is likely that these recipients were more able to afford their monthly electricity bills after refrigerator replacement. The effect of the energy efficiency
Transforming Electricity Consumers into Customers: 41 Case Study of a Slum Electrification and Loss Reduction Project in São Paulo, Brazil

Transforming Electricity Consumers into Customers: 42 Case Study of a Slum Electrification and Loss Reduction Project in São Paulo, Brazil
assistance on reducing bad debts is discussed below. Savings from shower replacement and rewiring (always done together in the pilot) contributed the remaining 8%.
Savings of 19,258 kWh per month are estimated from removal of inefficient exterior light bulbs formerly installed by individual households and their replacement with more efficient public lighting. On average, one efficient light replaced 4 inefficient lights. The resulting illumination was brighter and better distributed and, as evidenced by the post-pilot survey, enhanced resident’s sense of security. Furthermore, those consumers who had outside lights replaced reaped additional energy savings. The total savings for the pilot area are shown in Tale III-F.40
Table 3-6 Effects on Consumption of Individual EE Measures
EE Measures # installed Total Pilot savings
(kWh/year)
Proportion of total pilot savings
Average Annual Savings per HH receiving
Annual Savings per HH in $
Compact Fluorescents 9588 1,630,440 70% 425 $54
Refrigerators 496 285,696 12% 576 $73
Rewiring 497 65,472 3% 132 $17
Shower 497 107,136 5% 216 $27
Public Lighting 231,091 10%
Total 2,319,836 100%
3.3.1.2 Results of Energy Audits of a Sample of Commercial Customers
The audit of a sample of 70 commercial customers in the target area identified efficiency interventions that could help lower their bills. The audits found that about 60% already had fluorescent lights of some sort (tubular or compact) while the rest had incandescent lights. There were a large number of refrigerated cases, refrigerators, and freezers of varying sizes, shapes and uses (horizontal, upright, glass-fronted drinks refrigerators, etc). Overall, most enterprises had relatively low consumption and electricity bills. Efficiency measures recommended by the audit included: reducing the number of hours that lights were left on, putting computers into energy saving mode or turning them off, and reducing the number of hours in the day that refrigeration devices were used.
Extrapolating to all the commercial enterprises in the pilot area, the auditors estimated that savings from the recommended measures and investments was over 30,000 kWh per month for an overall investment of around US$ 8,500 (in other words, a 2 month payback on average for a combination of investments and habit changes). Extrapolating further to the entire Paraisópolis favela (of around 3,000 businesses) would yield a savings of around 215,000 kWh per month or 2,580,000 kWh annually (which incidentally is of the same magnitude as all of the calculated savings for the residential measures taken by the pilot in the pilot area).
40 Note that AES must purchase the kWh for the public lighting until the municipality takes on this payment. The added kWh from the new public lighting amounts to
7,930 kWh monthly or 95,155 kWh annually. Once AES is paid by the municipality, additional revenues from the public lighting will be about $10,000/ year. As these were not being collected during the pilot period, the financial analysis in this case study does not account for these additional revenues.

Transforming Electricity Consumers into Customers: 43 Case Study of a Slum Electrification and Loss Reduction Project in São Paulo, Brazil
The estimated energy savings were derived primarily from changing out inefficient light bulbs. Despite the prevalence of refrigeration devices (averaging 2 per audited business), only 10% were assessed as being in bad condition. Paybacks for the refrigerator and freezer replacements could only be estimated from nameplate ratings of the equipment; these were very long (from 8 to 31 years for those with units in bad condition and where a replacement was available). Long payback periods were also due to:
Inability of informal businesses to get discount prices for appliances, making the cost of the new appliances relatively high and
The new item may only have a relatively low (although still better) efficiency rating.
3.3.2 Affordability of Billed Consumption
The second KPI, affordability, can be directly measured by the change in the bad debt (non-payment) rate as well as from what customers have said during the post-project survey about the impact of the electricity bill on their overall budget. As noted earlier, prior to regularization, virtually no consumers were paying for their electricity use. Table 3-7 shows that immediately post pilot, the non-payment rate dropped from 98% to 32% of billed but unpaid consumption.
Table 3-7 Effect of Project on Non-Payment Rate
Non-payment Rate Pre-project 98%
Non-payment Rate Post Regularization (over 12 months) 32%
Change in Payment Rate (% reduction) 67%
However, from the customers’ perspective affordability is still a major issue. At their level of consumption prior to regularization, customers on average would have paid $354 annually if they paid for their consumption at the average residential tariff.41 This amount could be considered the customer’s ‘avoided cost’ pre-regularization (analogous to the cost AES incurred pre-regularization and ‘avoided’ post regularization). Once connected but prior to receiving any EE measures, new customers would be billed on average, approximately $272 on an annual basis. Providing almost all residential customers with efficient light replacement and replacing inefficient refrigerators, unsafe wiring/showers, or both for those customers who were considered to be at risk of falling into debt lowered the average annual cost to $213. Nevertheless, this is still a major increase in the drawdown of their limited budgets.
Given that most of the pilot households have limited incomes and were not paying anything for their electricity use prior to the regularization, it can be expected that almost all would find the addition of a monthly expense to be a hardship. The question then is whether this annual reduction of $58 on average was sufficient to bring bills in general into an affordable range and the degree to which the reduction in cost reduces the non-payment rate in the area.
41 From Section II, the SEHAB 2004 data indicates that consumers may have been paying something to others for their electricity. The project was unable to get any
reliable information on how much, if anything, illegal consumers might have been paying someone (e.g., an illegal service provider) for their illegal connection. So, it is assumed here that there were no costs for consumption prior to regularization.

Figure 3-4 looks at the results from the standpoint of the number of customers that were in arrears at some point in the pilot period. It shows that about 46% of the new customers paid their bills on time or were only one month behind, even after the cap was lifted. It is considered ‘customary’ in Brazil to fall one month behind (but then make the payment) because the general perception is that the company will not take any action in the first month. A third was over three months past-due. Before pronouncing this group to be ‘dead-beats,’ it would be useful for the utility’s negotiation efforts to understand why they are not paying their electricity bills. The consumer poll provided some insights which are discussed below. When bad debt is categorized by customer type, roughly half of the residential customers have no outstanding debt. The results are not significantly different for mixed use or commercial customers.
Figure 3-4 General Bad Debt (# of Customers with Unpaid Bills)
0
200
400
600
800
1000
1200
1400
1600
0 1 2 3 > 3
Number of Unpaid bills
Num
ber o
f Cus
tom
ers
0%
5%
10%
15%
20%
25%
30%
35%
40%
# of customers with bills unpaid
% of customers with bills unpaid
Figure 3-5 clearly shows that removing the cap on billed consumption contributed to significant increases in the late or non-payment rate. Non-payment was relatively low (around 17% of billing was not collected) in the April to June period but rose dramatically to around 47% of billing in October to December 2007 (when the cap had been removed for around 50 % of the new customers). Comparing billing to collections in the period from April to June vs. October to December, Table 3-8 shows a marked reduction in collections (from 83% in the earlier period to only 53% in the later period). However, total collections for the company rose by one-third as most were paying on the higher uncapped bills. These findings imply that customers found it more difficult to pay their bills after the cap was removed and that more customers will pay their bills if they are a smaller proportion of their total monthly budget.
Figure 3-6 shows that more customers in all ranges of usage (lowest to highest) had unpaid bills later in the pilot period, implying that uncapping of billing was not the only cause of increased debts since the cap affected only those with consumption over 150 kWh. Nevertheless, Table 3-9 does show that the higher-consuming customers had a significantly greater increase in non-payment between the two periods with the greatest increase in the number of consumers with
Transforming Electricity Consumers into Customers: 44 Case Study of a Slum Electrification and Loss Reduction Project in São Paulo, Brazil
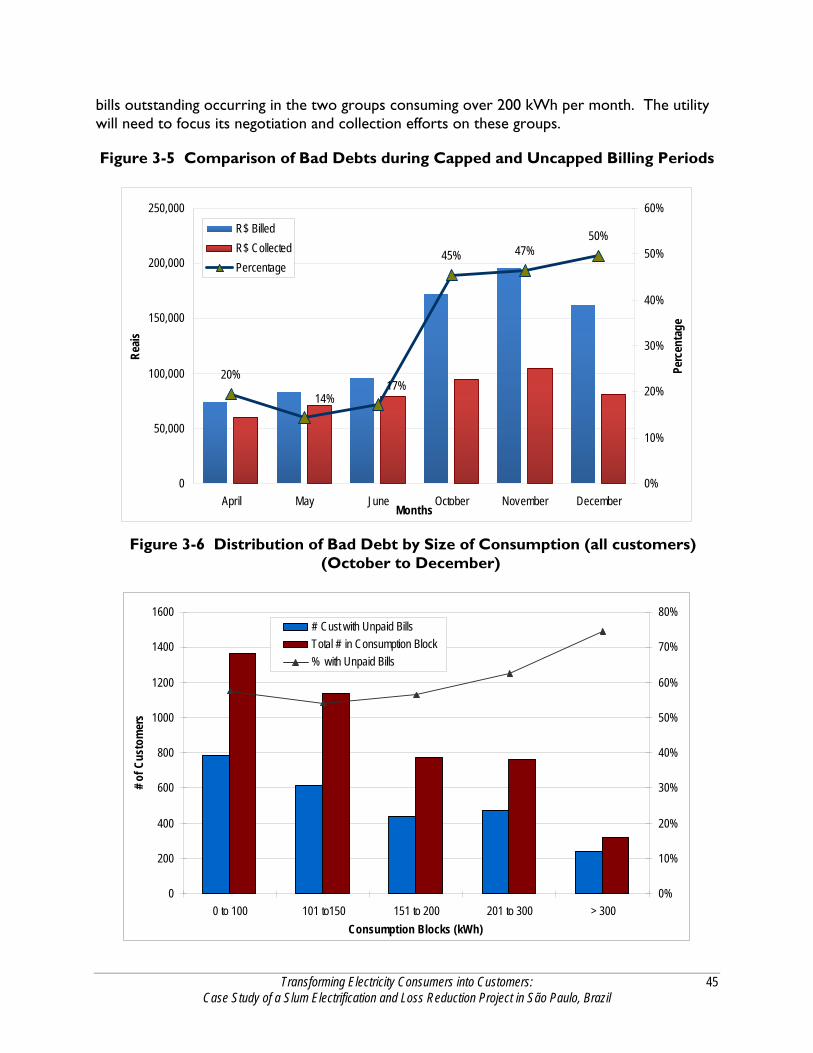
bills outstanding occurring in the two groups consuming over 200 kWh per month. The utility will need to focus its negotiation and collection efforts on these groups.
Figure 3-5 Comparison of Bad Debts during Capped and Uncapped Billing Periods
20%
45% 47%50%
17%14%
0
50,000
100,000
150,000
200,000
250,000
April May June October November DecemberMonths
Rea
is
0%
10%
20%
30%
40%
50%
60%
Perc
enta
ge
R$ Billed
R$ Collected
Percentage
Figure 3-6 Distribution of Bad Debt by Size of Consumption (all customers) (October to December)
0
200
400
600
800
1000
1200
1400
1600
0 to 100 101 to150 151 to 200 201 to 300 > 300
Consumption Blocks (kWh)
# of
Cus
tom
ers
0%
10%
20%
30%
40%
50%
60%
70%
80%# Cust with Unpaid Bills
Total # in Consumption Block
% with Unpaid Bills
Transforming Electricity Consumers into Customers: 45 Case Study of a Slum Electrification and Loss Reduction Project in São Paulo, Brazil

Transforming Electricity Consumers into Customers: 46 Case Study of a Slum Electrification and Loss Reduction Project in São Paulo, Brazil
Table 3-8 Total Collected (%) for Capped and Un-capped Billing Periods
Period Billing (US$) Collected (US$) % of Billing collected April to June 133,165 110,534 83% October to December 279,170 147,688 53%
Table 3-9 Distribution of Bad Debt by Size of Consumption Level and Change After Cap Lifted
Average consumption 0 to 100 101 to 150
151 to 200
201 to 300 > 300 Total
Number of clients in debt 785 615 438 478 239 2555 Total number of clients 1364 1139 775 766 321 4365 % of clients with debt 58% 54% 57% 62% 74% 59% Percent increase from April to June period 38% 48% 47% 61% 61% 45%
3.3.2.1 Correlation of the Effect of EE Measures with Income and Non-Payment
This subsection examines project results with respect to the effect of the efficiency measures on bad debt. The distribution of free energy saving measures was justified based on the hypothesis that new customers would be more likely to pay their bills if they could afford them. Research done elsewhere in AES’ service territory and in Brazil42 found that applying measures that would bring household’s monthly electricity bill below 5% of their monthly income would result in significantly improved bill payment by low income families. This link between increasing affordability and reducing losses is a key tenet of the pilot project. Separating groups by income class and examining bill payment with and without receipt of efficiency measures should show whether (or the degree to which) this hypothesis is valid.
Figure 3-7 shows that at least 55% of the customers in the pilot area had incomes equal to 2 or less minimum salaries (MS). This qualifies them to be classified as low income according to government criteria.
Figure 3-7 Breakdown of Residential Customers by Salary Range
15%
40%
45%1 Minimum Salary
2 Minimum Salaries
More than 2 Minimum Salaries
42 Most notably, COELBA in its slum electrification program in Salvador, Bahia.

Figure 3-8 shows that only two consumption blocks (0-100 kWh and 101-150 kWh) have average monthly electricity bills less than 5% of the average income in the pilot area. Savings from implementation of EE measures allows for a third consumption block (151-200 kWh) to fall under the 5% ‘affordability’ level.
Figure 3-8 Effect of EE Measures on the Average Bill by Consumption Class
0
10
20
30
40
50
60
70
80
90
0-100 101-150 151-200 201-300 >300Consumption Blocks (kWh)
Avg
Bill
ing
with
Tax
es
0%
5%
10%
15%
20%
25%
Perc
ent o
f Sal
ary
Total monthly bill
Bill after EE Savings
% of Salary
% of salary after EE
Figure 3-9 illustrates the effect that the reduction in the consumption that new refrigerators provided. A significant number of customers receiving the refrigerators were moved into the lower, more affordable tariff block (of less than 200 kWh) because of them. Almost 60% were in the lower consumption blocks allowing them to receive the low income tariff whereas with the old refrigerator only around 40% were in these blocks. The implication is that many more of those receiving the refrigerator and lights should be able to afford their monthly bill as a result. Of the almost 500 who received refrigerators, approximately 200 were already in the lower rate blocks with their old refrigerator and after replacement of old refrigerators, approximately 300 were in the lower rate blocks.
Figure 3-10 shows the correlation of average income with the number of debts for all of the residential customers as a group. There is at least a loose correlation between the number of unpaid bills and level of income. From no unpaid bills up to three, the average income is $400 per month or more, while for above three unpaid bills, the average income drops to as low as $380 income per month for the group with 5 bills unpaid. However, it should be noted that the average income of those in each group (from 0 unpaid bills to more than 6 in the pilot period) was in a relatively narrow band (approximately $35 per month). So, it could be that income levels in the favela are so low that more than half of the households found it very difficult to pay their bills despite the efficiency assistance that most received.
Transforming Electricity Consumers into Customers: 47 Case Study of a Slum Electrification and Loss Reduction Project in São Paulo, Brazil

Figure 3-9 Range of Consumption Before and After the Refrigerator Replacement
32%
26%
20%
17%
6%
13%
27%
24%23%
13%
0%
5%
10%
15%
20%
25%
30%
35%
0 to 100 101 to 150 151 to 200 201 to 300 > 300
Consumption Blocks (kWh)
Perc
ent i
n B
lock
NEW REFRIGERATOR
OLD REFRIGERATOR
Figure 3-10 Correlation of Average Income and Number of Debts
0
200
400
600
800
1000
1200
1400
1600
0 1 2 3 4 5 6 >6Number of Unpaid Bills
Num
ber o
f Cus
tom
ers
360
370
380
390
400
410
420
Mon
thly
Inco
me
in U
S$
Number of customers in Group
Average income in Group
Transforming Electricity Consumers into Customers: 48 Case Study of a Slum Electrification and Loss Reduction Project in São Paulo, Brazil
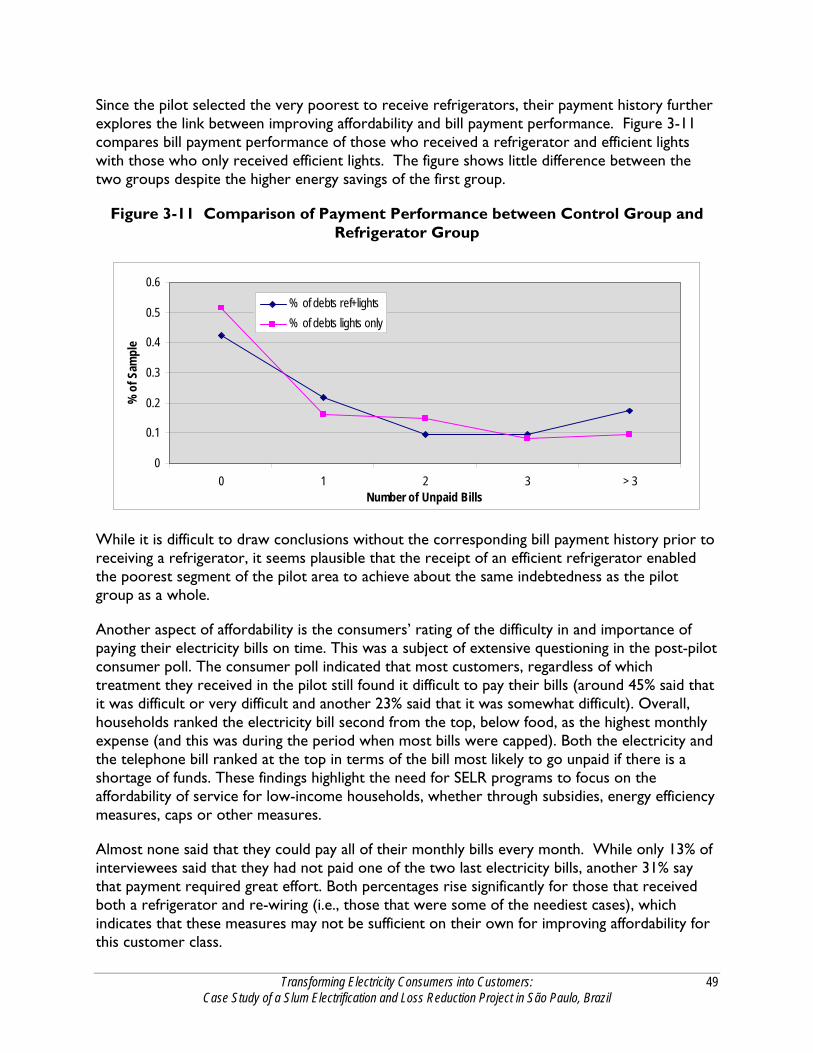
Since the pilot selected the very poorest to receive refrigerators, their payment history further explores the link between improving affordability and bill payment performance. Figure 3-11 compares bill payment performance of those who received a refrigerator and efficient lights with those who only received efficient lights. The figure shows little difference between the two groups despite the higher energy savings of the first group.
Figure 3-11 Comparison of Payment Performance between Control Group and Refrigerator Group
0
0.1
0.2
0.3
0.4
0.5
0.6
0 1 2 3 > 3Number of Unpaid Bills
% o
f Sam
ple
% of debts ref+lights
% of debts lights only
While it is difficult to draw conclusions without the corresponding bill payment history prior to receiving a refrigerator, it seems plausible that the receipt of an efficient refrigerator enabled the poorest segment of the pilot area to achieve about the same indebtedness as the pilot group as a whole.
Another aspect of affordability is the consumers’ rating of the difficulty in and importance of paying their electricity bills on time. This was a subject of extensive questioning in the post-pilot consumer poll. The consumer poll indicated that most customers, regardless of which treatment they received in the pilot still found it difficult to pay their bills (around 45% said that it was difficult or very difficult and another 23% said that it was somewhat difficult). Overall, households ranked the electricity bill second from the top, below food, as the highest monthly expense (and this was during the period when most bills were capped). Both the electricity and the telephone bill ranked at the top in terms of the bill most likely to go unpaid if there is a shortage of funds. These findings highlight the need for SELR programs to focus on the affordability of service for low-income households, whether through subsidies, energy efficiency measures, caps or other measures.
Almost none said that they could pay all of their monthly bills every month. While only 13% of interviewees said that they had not paid one of the two last electricity bills, another 31% say that payment required great effort. Both percentages rise significantly for those that received both a refrigerator and re-wiring (i.e., those that were some of the neediest cases), which indicates that these measures may not be sufficient on their own for improving affordability for this customer class.
Transforming Electricity Consumers into Customers: 49 Case Study of a Slum Electrification and Loss Reduction Project in São Paulo, Brazil

Transforming Electricity Consumers into Customers: 50 Case Study of a Slum Electrification and Loss Reduction Project in São Paulo, Brazil
Yet, knowing that old refrigerators use more energy (as over 85% said they knew), those polled who had not received a refrigerator replacement were strongly predisposed to finance the replacement of their refrigerator or other high-consumption household appliances. They indicated a very high probability of financing the replacement (from 33% among those with ‘General Treatment’ and rising to 48% among those who had benefited from re-wiring).
3.3.2.2 Commercial Customers and Bad Debt
After conducting audits of a sample of the commercial enterprises in the pilot area, insights were gained on the affordability of electricity service for commercial customers. As only 40% of the 70 audited were able to provide the size of their electricity bills in value or amount of consumption43, the audit team estimated the likely bills and asked all of those in the sample whether they would be likely to be able to pay that amount in the future. Almost 60% of the large consumers reported that they would be unlikely to pay their electricity bills in the future. Most of the medium and small businesses thought that they would be able to pay their bills. The large consumers who were least likely to be able to pay were also relatively large employers. It was determined that if the 14 large consumers closed their doors, 41 jobs would also be lost within the community.
3.3.3 Improvement in the Reliability of Electricity Service
This KPI includes not only the reliability of service which refers to power being available continuously but also power quality which covers problems with voltage fluctuation that might affect the operation of appliances. The consumer poll surveyed opinions on the perceived changes in the reliability of electricity service that resulted from the pilot project. The top six spontaneous citations of why those polled would recommend regularization to their neighbors and the top advantages of the pilot project included the reduction in the number of appliances burning out, the ‘improved potency’ of the appliances, reduced variation in the power received and not having power outages anymore. The proportion of those polled who cited these advantages was well over 80%.
3.3.4 Improvement in Personal Safety and Physical Environment
This KPI refers to improved safety within the home as well as perceptions about improvements in respondents’ safety outside the home as a result of better public lighting. The top six spontaneous citations of why those polled would recommend regularization to their neighbors and the top advantages of the pilot project included the elimination of the risk of fires due to short circuits and accidents with electrical shocks or electrocution. The proportion of those polled who cited these advantages was around 90%. When asked directly about how safety in the home might have changed in the last 6 months, 85% of those polled stated that it had improved a lot (and virtually all of the group that got the internal re-wiring benefit felt this was true).
43 Inability to provide this data was primarily either because they had not yet received their first bills or because they did not have the bill available for the auditors to
review at the time of the audit.

3.3.5 Improved legal and Institutional Status within Society
The consumer poll recorded that nearly 90% of regularized consumers saw benefits from regularization such as having proof of residency and easier access to credit and being able to register for assistance programs for low income people.
3.3.6 Awareness of Changes and Satisfaction with Service
Only 87% of those surveyed were aware of the project despite the numerous outreach events and door-to-door visits. Even among households receiving re-wiring and/or a new refrigerator, awareness about the “Paraisópolis Electrification Project” did not reach 100%. Seemingly, it is not just a matter of not recognizing the ‘logo’ or ‘brand’ of the project, because these results were obtained after a brief explanation of the project. Awareness about the distribution of new refrigerators to some households is much higher than about re-wiring among those not receiving either of the additional treatments (90% to 52% respectively).
Regularization was seen by the vast majority of those polled to be inevitable and essentially fairer than the prior system. Overall satisfaction with the project was very high, with the mean of 62% in the level of ‘very great satisfaction’ (sum of the two highest scores, 9+10). If the score of 8 is included, the overall satisfaction rises to a mean of 75%. The most often cited reason for satisfaction was the perception of the end of accidents with illegal connections. The improvement of electric power quality after the project was cited, ranging from 83% in the segment that only received efficient replacement light bulbs to 98% of those receiving refrigerators and re-wiring. Also, among the households receiving re-wiring, problems with electric power, previously more serious, have virtually disappeared. The additional treatments of refrigerator replacement and electrical re-wiring increased Paraisópolis residents’ satisfaction with the project, compared with those with the general treatment only. It should be noted, however, that when asked about who benefits from the regularization, many mentioned that it is the electricity company that benefits the most. This perception could indicate an attitude that might have come to the fore when consumers were pressed to pay their bills.
3.4 SOCIETY AND COMMUNITY CASE
Society in this case is the community and surrounding neighborhoods on the one hand and the citizens of Brazil and the ratepayers of AES (all electricity customers) on the other. KPIs for society and the community included:
Community and Other Stakeholder Acceptance
Regulator and Ratepayer Acceptance
Improved Security and Safety
3.4.1 Community and Other Stakeholder Acceptance
Feedback on the community’s perception of the pilot was inseparable from the larger effort that AES was making to finish regularizing the entire Paraisópolis favela (over 14,000 households in total). Although the consumer poll found that the community felt that their neighborhoods were safer and more attractive without the mess of wires strung throughout the streets, there were numerous complaints about billing that occurred in the transition from
Transforming Electricity Consumers into Customers: 51 Case Study of a Slum Electrification and Loss Reduction Project in São Paulo, Brazil

Transforming Electricity Consumers into Customers: 52 Case Study of a Slum Electrification and Loss Reduction Project in São Paulo, Brazil
illegal to legal connections. Some bills were received even though the meter had not registered any consumption. The company retracted any bills sent erroneously as a result. There were more serious concerns in Colombo, an area in Paraisópolis favela but not in the pilot area, and the community association decided not to ‘allow the changeover’44. Some claimed to have received bills of around $100 (a bit surprising since billing was supposedly capped at 150 kWh for households.) One owner of a small store had to unplug two of three refrigerators as a result of their high bill.
In January 2008, a community leader and the municipality met with AES to dispute the value of the bills delivered in the favela. They also claimed that the public lighting was insufficient and asked for changes in its design. As a result of community complaints, AES began an additional pilot project in the favela to test the efficacy of 100 solar water heaters to reduce the consumption of the electric showers.
Conclusions drawn from a series of articles in O Globo, the website of the community leader, and O Estado do São Paulo were that there had not been enough dialogue between AES and the municipal government about the changes that had been wrought, that the Steering Committee, in charge of community oversight of slum upgrading efforts, had not been given enough legitimacy and that without such engagement with the community the desired support of the community would be lacking.
The impact of regularization on the commercial sector has implications for the community as a whole. By the end of the pilot, 94 commercial customers were not paying their bills (i.e., had 6 or more monthly bills unpaid). This implies that about a quarter of all such customers will not be able to remain in business if they are disconnected for non-payment, which will potentially result in fewer jobs for people from the community. Impacts on the services available and employment can lead to residents being less satisfied with the results of the regularization project. This effect may not be felt for some time.
3.4.2 Improved Security and Safety
In the consumer poll, 89% of those surveyed felt that security in the area had improved a lot. Indeed, safety records indicate that emergency incidences responded to, which were related to electricity, fell from 57 from the first 6 months of 2006 to 2 in the same period for 2007. Although external wiring and some re-wiring inside households were replaced under the project, further safety improvements could be made through additional re-wiring. For example, audits of the 70 commercial enterprises found that a third had bad or very bad wiring, which mostly occurred in large commercial customers. Recommendations were made to upgrade the wiring in the worst cases.
3.4.3 Regulator and Ratepayer Acceptance
As protector of the ratepayer, ANEEL works to ensure that government funds for subsidies are effectively used. Tariff subsidies given to one group raises the tariffs (or taxes) for all depending on the source of the funding. As described in Section I, the subsidy embedded in Brazil’s Low
44 This was reported in the local press. The effect on regularizing the area eventually was not reported.
Income Tariff is funded by a cross-subsidy from other ratepayers. An additional subsidy comes in the form of the efficiency measures provided free to low income households.
As discussed earlier, ANEEL started putting pressure on the distribution companies during the pilot period to tighten the criteria for household eligibility for the LIT. While ANEEL relented temporarily, it is very likely that they will return to this issue again as the Government continues to seek ways to streamline the Brazilian social safety net and reduce subsidies that are poorly targeted or ineffective. Many more households may lose eligibility for the LIT and could fall into bad debt.
It is also uncertain how long ANEEL will allow the free distribution of refrigerators, CFLs, and other efficiency measures in conjunction with SELR type projects since its priorities are set on an annual basis. However, given that the energy efficiency measures meet its present criteria for cost-benefit, it can be assumed that regularization programs will remain a major ANEEL focus until most low income areas are regularized.
Transforming Electricity Consumers into Customers: 53 Case Study of a Slum Electrification and Loss Reduction Project in São Paulo, Brazil

Section 4 Lessons Learned, Replication and Sustainability Issues
4.1 LESSONS LEARNED
This section briefly describes some of the lessons learned from the Paraisópolis pilot that should be taken into account when designing future SELR pilots in Brazil or other countries. These lessons are primarily about streamlining and improving the process used to prepare for and carry out a regularization program.
4.1.1 Customer Registration and Area Mapping
The difficulties and challenges of reaching low income consumers in informal areas during the customer registration and area mapping process must be considered when estimating the time and resources required to undertake these activities. More flexibility on the hours during which the registration workers can work in the area and more assistance from the community or SEHAB might have prevented the delays and added cost of this component. Registration personnel should also be trained on the requirements for properly classifying and registering customers as commercial customers when eligible.
4.1.2 Connecting New Customers
Confusion amongst the households was caused by not marking each meter with the number of the designated household or commercial customer. In Brazil and most other countries, it is the customer’s responsibility to make the connection from the structure to the meter. The unmarked meters caused households to connect to the wrong meter (there was often a row of meters on one wall, for example), resulting in some consternation when the first bills were delivered to the wrong address. This had to be addressed during the post-project customer assistance activities, which diverted time away from engaging with customers on electricity efficiency and safety issues. A solution would be to have the crews installing the meters and recording the meter number to simultaneously label the meter with the household number.
4.1.3 Communication with Customers and Preparing Them for Regularization and Controlling Their Consumption
A pre-regularization consumer poll would make it easier to judge change in attitudes as a result of the pilot and would help in the planning for the roll out of the project. The project used numerous door-to-door visits and community events in tandem to communicate with residents. From the consumer poll, it is clear that doing both was necessary to reach all households. Other methods of reaching households could also have been considered such as making appointments, providing a central location to exchange light bulbs, and so forth, while reducing the number of household visits required. Paying greater attention to timing and sequencing issues could have improved the efficiency with which some of the project components were implemented. For example, having one specialized team to conduct the pre-regularization visits and the mini-audits simultaneously for any household residents found at home might have helped the project reach more consumers.
The process for installing CFLs and refrigerators was somewhat cumbersome, requiring multiple contacts with possible recipients and numerous forms to be filled out. The process of
Transforming Electricity Consumers into Customers: 54 Case Study of a Slum Electrification and Loss Reduction Project in São Paulo, Brazil

identifying recipients and getting refrigerators to them took over 9 months. While the information collection and tracking was necessary, a more streamlined process could be instituted in the future.
Although 727 refrigerators were found to need replacement, only 532 households signed agreements to replace their refrigerators. Many households were either consistently absent or refused the refrigerator. For those that rejected the refrigerator model, a range of other models could have been offered with the difference in cost paid by the consumer on the utility bill over time or through a ‘rebate’ (equal to the cost of the refrigerator offered in the program) for the purchase of an efficient refrigerator through an appliance dealer (with proof that old refrigerator was removed and recycled). Given the utility’s limited resources for purchasing new refrigerators, some Brazilian utilities are considering charging the customer through their bill for the entire cost of the new refrigerator.
4.1.4 Delivering and Installing Safety Measures
There was some overlap in the diagnosis of the condition of household wiring done by the contractor conducting the mini-audit and the more detailed diagnosis and materials list later developed by the electrician before installing the new wiring. The first visit could be limited to just identifying those households where new wiring was needed, stopping prior to assessment of materials required and leaving that job to the electrical contractor. Furthermore, separation of the purchase and storage of the materials from the installation of the equipment done for control purposes caused numerous delays. Combining these functions with adequate controls might have helped streamline the process.
4.2 REPLICATION IN OTHER COUNTRIES
In considering replication of the SELR approach in other countries, close attention must be paid to the factors that could change the financial viability for either the distribution company or the consumer. The analysis presented and discussed in Section 3 was based on conditions in Brazil that may not be the same elsewhere. For example, while theft may be on the same scale as experienced in Brazil, the amount of electricity stolen may be significantly lower than in Brazil where appliance ownership is comparatively high. In cases with very limited appliance ownership, theft would be less prior to regularization but revenues from sales of electricity would also be much lower post regularization.
In other countries that might consider applying the SELR approach, the regulatory treatment of investment costs, subsidies, and tariffs could differ significantly from the rules and practices established in the Brazilian electricity sector. A concern that should be investigated is the financial impact on other ratepayers or taxpayers who ‘contribute’ to (subsidize) such regularization via higher taxes and/or electricity tariffs. In the Brazilian case, the rate and tax bases over which the subsidies are spread are relatively large; so that the societal cost on a per capita basis is quite small while the long term benefits to society (as determined by government policy) are deemed to be sufficient to offset any impacts.
The best way to judge the merits of replicating the SELR approach in another situation would be to perform a similar financial analysis to the one presented in this case study with estimates of likely costs and benefits taken from the context where the replication might be attempted.
Transforming Electricity Consumers into Customers: 55 Case Study of a Slum Electrification and Loss Reduction Project in São Paulo, Brazil

Transforming Electricity Consumers into Customers: 56 Case Study of a Slum Electrification and Loss Reduction Project in São Paulo, Brazil
Looking at the investment strictly from a project view (i.e., without including the benefits to the company from subsidies and attributing all investment and operating costs to the ‘project’) would help to clarify whether such a project could stand on its own merits.
To illustrate such a ‘project case’ analysis, the Actual Case presented in Section 3 was again used as the basis for an analysis of financial viability as if there were no resale or subsidy benefits and the costs of purchased power and O&M were attributed to the customer base receiving regularization (rather than being spread over the rate base as is the case in Brazil and many countries).45 With an unfavorable non-payment rate post regularization of 50%, the payback rises to almost 10 years. This illustrates the caution with which the results of this case study should be applied. Nevertheless, while these results are less favorable, they still would provide a positive return and could help solve a major, growing loss reduction problem for a company.
4.3 SUSTAINABILITY ISSUES FOR THE SELR BRAZIL PROJECT
The financial sustainability of slum electrification efforts to the utility depends on the continued collection of several different post-pilot revenue sources. They included collections from customers, subsidies received from the government to make up for the loss to the company from the low-income tariff, cost savings from the regularization effect and energy efficiency measures, and gains from the sale of electricity that is no longer being stolen. All of these sources are subject to some variability and/or risk and are discussed separately below.
4.3.1 Collection Rates
Collection rates are highly dependent on affordability, attitudes of customers about the importance of paying their bills, and the degree to which the company can control theft and disconnect for non-payment. The results of the pilot indicate that theft seems to have been reduced dramatically but that affordability and customer attitudes are still a key concern and a source of potential gains if the company can continue to improve both. Over time customers may become accustomed to being metered and billed but sense that they will not be disconnected when they fall behind, leading to a rise in the bad debt rate. In addition to continued negotiation with individual households on their debt, the utility will need to implement a disconnection policy or risk a possible return to the downward spiral that had been experienced in previous attempts to regularize slums.
4.3.2 Possible Regulatory Changes
The regulator, ANEEL, has been scrutinizing the low-income tariff subsidies as part of a larger effort by government to improve the effectiveness of its targeting of subsidies for low-income people. Fewer customers within the pilot area (and in favelas in general as they are regularized) may qualify for the subsidy sometime in the future. This in turn would reduce some of the revenue to the utility associated with the regularization effort at the same time as more customers might find it increasingly difficult to pay their bills.
45 These include the cost of purchased power and O&M. O&M was estimated as 0.022R$/kWh which is the system-wide average cost per kWh for AES. O&M costs in
newly regularized areas would most likely be higher than system average.

Transforming Electricity Consumers into Customers: 57 Case Study of a Slum Electrification and Loss Reduction Project in São Paulo, Brazil
Furthermore, replication prospects might be affected by government actions. At present, ANEEL requires that distributors use a large proportion of funds earmarked for energy efficiency for low income consumers in informal areas with a high rate of theft of power. In this pilot, approximately 67% of the funds for efficiency measures came from the ANEEL energy efficiency fund. While the payback to the company appears to warrant investment without the ANEEL funds, the investment would be subject to more internal review and the vicissitudes of the company’s overall investment climate.
4.3.3 Degradation of Efficiency Gains and Bill Payment Performance
The efficiency of new appliances will fall over time. For the first 5 years, the refrigerator’s performance is relatively stable, but after 5 years door seals and insulation start to degrade and after 10 years the thermostat and compressor begin to degrade.46 CFLs may burn out and not be replaced with equally efficient new ones. The degree to which the company can successfully anticipate and deal with these ‘degradation’ effects will be crucial to maintaining and improving on pilot results. The activities that may be needed could include more direct contact, e.g., door to door collection, more ‘moral suasion’ and threats (e.g., report to credit rating agency on those with sustained bad debts), and more energy efficiency assistance to customers.
4.4 NEXT STEPS FOR AES AND INTERNATIONAL PARTNERS
As the pilot period ended, AES was installing an office in the local residents association and its ‘community agents’ were working closely with households to save energy, control their consumption and to arrange debt repayment for those that had fallen behind. The company’s permanent presence in the community will substantially improve its image, create a favorable impression for the community and make it easier for new customers to solve their problems locally. The company was also expanding its regularization effort, based on the results of the pilot and its experience in other areas already regularized, to aggressively reach all of its low income neighborhoods requiring regularization within the next several years.
The company is actively attempting to get regulatory approval to implement ‘social cutting’ for hard-core non-paying commercial customers first in the pilot area and if successful, in other areas. The investment for the necessary meters has already been made; so this would be a no cost option and would help customers stay within their limit of affordability without jeopardizing jobs.
The distribution company will analyze the return on investment of paying for the capital costs of efficiency upgrades for commercial customers using ANEEL funds.47 This might complement social cutting as it could help these customers better manage their consumption levels and bills and avoid social cutting.
Not only is AES replicating the successful components tested in the pilot to other areas of its service territory, the partners in the pilot project have also embarked on a number of dissemination activities more globally, starting with the December 2007 workshop in São Paulo
46 Jannuzzi, Gilberto, “Cost-benefit Analysis of a Refrigerator Replacement Program for Low-income Households in Brazil,” report produced for review by the United States
Agency for International Development, January 2007. 47 However, note that AES will have to gain permission from ANEEL to do so. Presently ANEEL does not allow these funds to be used for commercial customers.

described in Section 1. Presentations of the pilot results and findings are being made in a number of forums, including in 2008 country workshops such as the ones held in Mexico in early 2008 by Procobre, the Latin American branch of ICA; a workshop sponsored by University of San Diego called “Utilities at the Base-of-the-Pyramid” in May 2008; a ‘brown bag’ presentation at the World Bank in June 2008; ACEEE Summer Study in August 2008; and the International Energy Agency in September 2008. Furthermore, lessons learned from the pilot will be applied to future SELR activities being planned for in countries such as India and Liberia.
Transforming Electricity Consumers into Customers: 58 Case Study of a Slum Electrification and Loss Reduction Project in São Paulo, Brazil

Transforming Electricity Consumers into Customers: 59 Case Study of a Slum Electrification and Loss Reduction Project in São Paulo, Brazil
Appendix A Additional Information on Brazilian Tariff Reviews
The three main items reviewed in a Brazilian electricity tariff review include: capital remuneration, operational costs and a component that measures improvements in productivity, called the ‘productivity X factor.’ The regulation stipulates how capital is remunerated and the rate of return that can be obtained. Capital remuneration is based on the regulatory asset base, starting with the base price at the time of privatization and considering additional investments based on new replacement value as a cap on the gross asset value. The rate of return is based on the weighted average cost of capital in real terms in the local currency and is presently set at 11.26% for all distribution companies. Depreciation is determined by the straight line method based on the economic life of the asset being depreciated.
New capital investments needed to regularize slums, the cost of O&M for newly electrified areas, changes in wholesale power costs, inter alia, are included in the periodic reviews to determine retail distribution tariffs.
Return on operating costs is allowed according to comparison with a technical benchmark (called the Reference Utility). The RU is considered to be an efficient utility economically adapted to the local environment where electricity distribution services are provided. The performance goal of the annual X factor differs by distribution company and can range from 1% to 3% improvement per year.48 The use of the reference utility and X factor approach (along with the fixed period for the tariff to remain at the level fixed at the beginning of the period) provides incentive for companies to beat the incentive level and keep the related profit for the entire next tariff period.
48 This description of Brazil’s regulation of return is based on PPT presentation by Pedro Antmann at CIRED, Vienna 21-24 May 2007.