THE COMPUTER AIDED LEARNING STUDY IN THE STATE ...
160
1 THE COMPUTER AIDED LEARNING STUDY IN THE STATE OF ORISSA Joint Initiative of Government of Orissa and AZIM PREMJI FOUNDATION JUNE 2010
-
Upload
khangminh22 -
Category
Documents
-
view
7 -
download
0
Transcript of THE COMPUTER AIDED LEARNING STUDY IN THE STATE ...

1
THE COMPUTER AIDED LEARNING STUDY IN THE STATE OF ORISSA Joint Initiative of Government of Orissa and AZIM PREMJI FOUNDATION
JUNE 2010

2
Table of Contents
Abbreviations Used ........................................................................................................................ 3
List of tables ............................................................................................................................................. 4
Summary ......................................................................................................................................... 5
Aim of the Study ............................................................................................................................ 9
Need for such a study ................................................................................................................... 9
Computer aided learning: the International Scene ................................................................ 10
Background of the Study ............................................................................................................ 12
Scope of the Study:..................................................................................................................... 13
Design of the Study..................................................................................................................... 13
Indicators for studying the Impact of Technology: ............................................................... 14
Components of the Study .......................................................................................................... 14
A diagrammatic representation of the Study .......................................................................... 16
Nomenclature of various parties to the Study ........................................................................ 16
Approach to Technology............................................................................................................. 16
CAL Study in Orissa ..................................................................................................................... 17
District & Sample Size ................................................................................................................. 18
Educational Profile of the District .............................................................................................. 19
Why was Nayagarh district chosen? ......................................................................................... 19
Sample Selection ......................................................................................................................... 20
Number of students at the time of sample selection ............................................................. 20
Profile of the Teachers................................................................................................................ 20
Timeline of Events ....................................................................................................................... 21
Baseline ......................................................................................................................................... 22
Tools used for Baseline: ............................................................................................................... 23
(a) Reading Ability Test (RAT): ............................................................................................... 23
(b) Competency–Based Achievement Test in Math and EVS .............................................. 27
Workflow of the tool development .............................................................................................. 27
Chalking out Assessable Curricular Competencies: .................................................................. 28
Development of a Common Assessment Framework: ............................................................. 28
EVS & Math assessment framework ........................................................................................... 28
EVS CONTENT DOMAIN ................................................................................................................ 28
EVS COGNITIVE DOMAINS .......................................................................................................... 30
MATHEMATICS CONTENT DOMAINS.......................................................................................... 32
MATHEMATICS COGNITIVE DOMAINS....................................................................................... 32
Blueprint Design: ........................................................................................................................... 34
Developing the Blueprint for EVS. ............................................................................................... 34
Question Distribution in EVS cognitive domains ....................................................................... 35
Developing the Blueprint for Math .............................................................................................. 37
Question Distribution in Math cognitive domains ..................................................................... 38
Item Development & Scoring Guides: ........................................................................................ 39
ITEM DEVELOPMENT IN EVS ....................................................................................................... 40
ITEM DEVELOPMENT IN MATH ................................................................................................... 45
Panel Review of tools:................................................................................................................... 46
Validation of the Competency-based Achievement Test in Math and EVS: ......................... 47
Field Testing of tools: ................................................................................................................... 48
(c) Teacher‘s attitude & self-efficacy ...................................................................................... 50
(d) ICT Tool ................................................................................................................................ 52
Administration of the Tests: Baseline Survey ......................................................................... 52

3
Deployment of tools .................................................................................................................... 53
Results & Discussion ................................................................................................................... 54
Reading Ability Test ....................................................................................................................... 54
Competency Achievement Test in Math ..................................................................................... 57
Competency Achievement Test in EVS ....................................................................................... 59
TEACHER RESULTS AND ANALYSIS ......................................................................................... 62
Results of Teachers‘ Survey and ICT ....................................................................................... 65
Teacher Development Interaction (TDI) and On-Site Support ............................................ 66
First Teacher Development Interaction (TDI 1) ..................................................................... 67
Second, Third and Fourth Teacher Development Interactions (TDI 2, 3 & 4) .................. 72
Impact of Language support ..................................................................................................... 75
TDI 5 on Math and On-site support ......................................................................................... 76
Teacher Network Meetings ........................................................................................................ 82
Technology support..................................................................................................................... 86
Revision Games ........................................................................................................................... 87
Impact of the Study on Teachers ............................................................................................. 90
Reasons for pulling out of Orissa .............................................................................................. 91
Conclusions ................................................................................................................................... 91
References .................................................................................................................................... 93
Annexure 1 – Charts displaying RAT and CAT Results .......................................................... 95
Annexure 2 - Tabulated RAT & CAT data ................................................................................ 97
Annexure 3 – Teacher Tools .................................................................................................... 110
ICT TOOL ...................................................................................................................................... 110
Teacher Information & Perceptions .......................................................................................... 113
Teacher‘s Sense of Self Efficacy & Attitude ............................................................................. 116
Approach to Pedagogy: Classroom Scenarios ........................................................................ 118
Annexure 4: Reading Ability TEST: RAT ................................................................................ 125
Sample page of a Running RecordAnnexure 5 – CAT Tools ................................................. 136
Annexure 5 – CAT Tools ............................................................................................................. 137
Mathematics ................................................................................................................................. 137
Class 2 ........................................................................................................................................... 137
Mathematics ................................................................................................................................. 141
Class 3 ........................................................................................................................................... 141
Mathematics ................................................................................................................................. 145
Class 4 ........................................................................................................................................... 145
Annexure 6 – Classroom Observation themes and format ................................................. 150
SECTION I - Overall school observations at start of school ................................................ 150
SECTION II - Classroom Observation Themes ........................................................................ 151
Annexure 7 Curricular Competencies in Math and EVS ....................................................... 157
Abbreviations Used CAL: Computer Aided Learning CAT: Competency Achievement Test CRO: Class Room Observations E1: Experimental Group 1 (with technology) E2: Experimental Group 2 (without technology) EVS: Environmental Studies HT: Head Teacher MCQ: Multiple Choice Question RAT: Reading Ability Test TDI: Teacher Development Interaction TNM: Teacher Network Meeting

4
List of tables Table 1: Summary of Meta-Analysis
Table 2: Educational Profile of Nayagarh District
Table 3: Number of students in the three classes
Table 4a: Question Distribution across content domains for EVS
Table 4b: Question Distribution across cognitive domains for EVS
Table 5a: Question Distribution in Math (Classes 3-5)
Table 5b: Mathematics Cognitive Domains expressed as a percentage as per baseline tools.
Table 6: Average of expressed sense of efficacy of teachers
Table 7: Conviction with which self-efficacy was expressed in E1, E2 and Control Schools
All the following tables appear in ANNEXURES:
Table 8: RAT & CAT data of all classes
Table 9: Reading Results Disaggregation
Table 10: Percentage of students who are able to read at different levels of accuracy and their
comprehension levels in classes 3, 4 and 5 separately
Table 11: In E1 Schools, percentage of children who are able to read and their accuracy levels
Table 12: In E2 Schools, percentage of children who are able to read and their accuracy levels
Table 13: No. of students tested on Competency Achievement in Math
Table 14: Overall achievement in Mathematics
Table 15: Performance in the content domain: number sense
Table 16: Performance in the Content domain: Patterns
Table 17: Performance in the Content domain: Measurement
Table 18: Performance in Cognitive Domains (Analysis confined to students who have given correct
answers)
Table 19: Number of students tested in EVS
Table 20: Overall achievement in EVS
Table 21: Performance in the Content domain: Social Science
Table 22: Performance in the Content domain: Life Science
Table 23: Performance in the Content domain: Physical Science
Table 24: Performance in the Content domain: Earth Science
Table 25: School wise achievement level in Math and EVS of E1 schools
Table 26: School wise achievement level in Math and EVS of E2 schools
Table 27: Teacher Attitude Analysis
Table 28: Number of teachers and their knowledge of computers
The Computer Aided Learning Project in Orissa
5
Summary The Computer Aided Learning (CAL) Research project is a joint initiative of Government of Orissa and Azim Premji Foundation (a not-for-profit organization working towards improvement of quality of education in
government schools). The study emerged from the Foundation‘s experience of working with different states for the development and deployment of digital learning resources across 16 States in the country during the period
of 2002-2006. The study is being conducted in three States, Chhattisgarh, Orissa and Puducherry.
This is a report of the Computer Aided Learning Study conducted in the state of Orissa.
The study aimed to explore if computer-aided learning can meaningfully impact classroom processes and
learning when deployed by enabled and empowered teachers. To test this, two experimental groups of 20 schools each (E1 and E2) were formed: in E1 schools, teachers would receive inputs in pedagogy as well as
technology, and in E2 schools, teachers would receive inputs in pedagogy alone. In addition, there was a
control group of 20 schools where no inputs at all were provided.
The study aims to systematically and scientifically explore the strength of technology in creating positive influences in the education process; more specifically, to enable the teacher to provide a multiplicity of learning
experiences. Hence, this research study encompasses a robust process of teacher preparation and support to the
teacher at the school and cluster level, with the help of a team of resource persons. Its components include Teacher Development Interactions, School Visits and Teacher Network Meetings.
A significant amount of data on the learning levels of students was obtained from the baseline survey. Its
objective was to gather data on the prevailing levels of competence of the students in areas like reading, comprehension, Mathematics and EVS. Questionnaires to gauge teacher attitudes and perceptions on the goals
and means of education also formed part of the survey. The baseline survey, in conjunction with the midline and
endline surveys, was intended to serve as a means of measuring the change instrumented by the CAL project in the experimental schools. The baseline data were used for three purposes.
a) To document the prevailing status b) To provide the backdrop and inputs to the Teacher Development Interactions.
c) To become the basis for providing need-based on-site support.
The study looked at: (a) Reading abilities of students, (Reading Ability Test, RAT)
(b) Competency in Math and EVS, (Competency Achievement Test, CAT) (c) Beliefs and attitudes of teachers.
(d) ICT Tool The Baseline Survey revealed that of the nearly 4000 students tested, approximately 70% were able to read
with different levels of accuracy and comprehension, while 30% were wholly unable to read. In the areas of
Mathematics and EVS, around 50% of the answers given by children were entirely correct, while 30% and an alarming 44% of the answers respectively were entirely wrong.
Given below are the broad results of the reading abilities of students in the three groups of schools:
There are slightly fewer students who are unable to read in E1 schools (29.71%) compared to students
in E2 and control schools (36% in E2 schools and 35% in control schools).
Students who are able to read with fewer errors (that is accuracy above 80%) show a slightly higher
comprehension level than students who show low accuracy levels in the E1, E2 and Control schools.
Students have a low comprehension level, irrespective of levels of accuracy, in all the three groups of
schools.
These results show that students by and large read with very little understanding. They basically decode the letters and words. Our classroom observation also shows that the emphasis is on decoding rather than
teaching for understanding. There is very little difference between E1, E2 and the control group of schools
both in the ability to read and comprehension levels.
Students who are able to read at higher levels of accuracy show more comprehension compared to
students who read at lower levels of accuracy. This trend is visible across all classes.
As students go from class 3 to class 5, their ability to read increases and correspondingly the number of
students who are able to read at higher levels of accuracy also increases.
The result throws up a very interesting relationship between ability to read with accuracy and the
comprehension. As students progress in class, they show increased ability to read, but there is a marked
and gradual decrease in comprehension.

6
The focus of the CAL Study in Year One was therefore on supporting teachers to develop reading and writing
abilities of children. By the end of Year One, a large majority of teachers had developed competency in the following areas:
Identification and analysis of common reading errors
Grouping as a pedagogical strategy to address students with reading difficulties
By now, they were focussing less on grammar, i.e., form, and more on comprehension, i.e., substance.
The first year of the Study yielded several learnings for the Foundation that were to later influence both the processes of interactions with the teachers and the areas of focus in the Study. Firstly, a much clearer picture of
the levels of competency and receptiveness of the teachers emerged, and this knowledge was incorporated into the design of later interactions. Secondly, school visits attained a greater importance than planned, since they
were found to be the most influential in altering classroom practices. Thirdly, the technology component was
more seamlessly integrated into the design of the later interactions, which focused on Mathematics. The Study team has endeavoured to equip teachers with software tools that are highly pliable to adaptation. Conceptual
areas in which most teachers created resources were reading, memorisation of numbers and their multiples and common operations like addition and division. Teachers had to be supported very intensively in order to gain
proficiency in the use of these tools and operational procedures had to be repeatedly demonstrated by the study
team for the benefit of the teachers.
As part of the baseline survey, Competency Achievement Tests were also conducted in Math and EVS and the findings here were as follows:
Math - A comparison of the 3 groups shows that achievement in Math content domain is more or less similar
across all experimental groups (E1, E2 and C).
As students go from class 3 to 5, their achievement in patterns and measurement drops. The overall
achievement in Math reflects this decrease.
As students go from class 3 to 5, the percentage of wrong answers increases in class 5 in number,
patterns and measurement but not on operations.
When we look at the cognitive domain, one can see a drop in performance in questions relating to
knowledge of facts and procedures in class 4, whereas in questions requiring conceptual understanding
and reasoning, there is an increase.
In class 5, students have found questions requiring conceptual understanding and reasoning difficult.
EVS –
The maximum overall achievement in EVS has increased marginally from class 3 to 5.
The 3 groups of the Study do not differ in their achievement levels in any of the classes: 3, 4 or 5.
This pattern is uniform in all the content domains.
The achievement level in EVS centres around 42 to 51% – which is an average performance.
In all the 3 classes, students can broadly be divided into two groups, on the basis of their response
categories – the right and the wrong.
In the 3 classes, and in the 3 types of school, students achieve more in questions dealing with factual
knowledge than in questions that require reasoning and analysis.
All these together suggest that the pedagogy in these schools does not focus on non-rote learning. In reading, the emphasis is on decoding skills. As students go to higher classes, they master the decoding skills
but are not taught comprehension strategies. This explains the decrease in their comprehension levels. In Math and EVS, the achievement level suggests that there is ample scope for increasing the achievement
level. More importantly, here too, the focus of teaching is on solving routine problems and knowing facts and
procedures. So students answer without understanding. But when questions demand reasoning and analytical skills, students perform poorly.
From these results the inferences are: There is almost no difference in reading ability, Math and EVS achievement between E1, E2 and
Control schools.
In 95% schools, more than 50% students are able to read.

7
In 83% schools, more than 50% students are able to read - at 80% and above accuracy levels.
In 100% schools, the total average comprehension level is within 50%.
As students go from class 3 to 5, their reading ability increases, but their comprehension level
decreases.
The average total achievement level in Math and EVS does not cross 60%.
In math, as students go from class 3 to 5, they have difficulties in patterns and measurement and in
the cognitive domain of conceptual understanding and reasoning.
In EVS, they do not seem to have any problem in any of the content domains; but performance in
reasoning questions is poor.
The teacher survey resulted in the following findings:
Teachers displayed an overall positive attitude towards teaching, learning and discipline.
They also indicated a curtailed view of knowledge as a finished good, certified by authority and closed to
investigation and interpretation.
Teachers have a limited conception of knowledge and do not believe that all children are capable of
absorbing such knowledge. The two are, in fact, related - the many different ways of knowing what children are capable of remains unrecognised, due to the belief that knowledge is only valid if it is
encoded in language that is sourced from a textbook.
By way of impact on teachers, the study reports that:
Nearly half the teachers are comfortable with using technology to supplement their classroom teaching.
They are devising new teaching tools utilising common computer applications such as Microsoft Word,
Excel and PowerPoint. A large majority of teachers have slightly altered their perception of language learning. They have picked
up the skill of analysing common reading errors and have become more sensitive to the needs of
learners, particularly those with reading and learning difficulties.
As regards, ICT tool, this was administered only to E1 school teachers, and the findings were as follows: The results show that knowledge of word processing is the maximum, followed by knowledge of basic operations
and spread sheets. In general, very few teachers have knowledge of technology.
In the Western context, where teachers are learner focused in their pedagogy technology is an add-on for enhancement of learning. In the Indian context, technology can be seen from another perspective. Here
pedagogy is teacher led. In such a situation, technology is compelling teachers to be more learner-centred because their ‗old ways do not work with technology‘.
Teachers have begun to have a deeper understanding of phrases like learner engagement, teaching for meaning, using technology as a pedagogical tool, grouping as a pedagogy, use of games/ stories/ songs for the purpose of
learning, building on existing knowledge of learners, learners constructing their own knowledge etc.,
Some teachers of Orissa have begun their journey of becoming creators of curriculum instead of its consumers. Currently this is a small number.
Even though it has been the objective of this study to gather data on several indicators related to classroom practices, the premature termination of the Study in Orissa has prevented us from doing so. As a result, we are
left only with anecdotal accounts and individual perceptions as measures of change. It was a further finding in this study that technology is best introduced to teachers in the context of teaching and not as a stand-alone
article of investigation in a training centre. It was observed that teachers enlisted technology as a teaching aid as
naturally as they would any other resource in their environment. While they certainly had to be supported in their efforts, integration of technology into their curriculum proved to be easier when compared to similar such
experiments documented in international research literature. Teachers were found to be more pliant to influence if their body of knowledge is inducted into the process of capacity building. When completely novel concepts
were introduced to them without inviting their inputs, absorption levels were low. It was only after intensive
interactions with individual teachers in which their teaching practices were understood by the researching team - and built upon - that a positive change in classroom practices was evidenced.
The study had to be prematurely terminated in the State because of non-fulfilment of two conditions critical to
ensuring effectiveness of computer aided learning. The study rested on the following conditions: a) One computer shared by three students.
b) A UPS that provides a back-up power of at least 3 hrs

8
In addition to these, the study itself was based on a randomization – where the teacher profile was matched
across the three experimental conditions. Frequent teacher transfers, combined with the non-fulfilment of the critical conditions, vitiated the researc rendering it ineffective.

9
Aim of the Study
The Computer Aided Learning (CAL) Research project aims to explore whether computer-aided learning can
meaningfully impact classroom processes and learning, when deployed by enabled and empowered teachers.
Need for such a study
The need for such a study comes from two sources: (a) the Foundation‘s experience in developing and deploying
digital learning resources and (b) computer aided learning across the International Scene.
Computer-aided learning (CAL) refers to the use of computers as a key component of the educational
environment. While this can refer to the use of computers in a classroom, the term more broadly refers to a
structured environment in which computers are used for teaching purposes. CAL can be used in a variety of
contexts - from conveying the foundational principles of mathematics to primary school children, to illuminating
the highly complex workings of the human body for the benefit of medical students. A CAL experience can either
be completely independent or it can be instructor/peer-supported. CAL tools can be static and non-collaborative
like CD-ROMs, or dynamic and interactive - like Instant Messenger clients and multi-player educational games.
The advent of the internet enabled both content and learning
processes to accommodate the needs, interests, proclivities, current
knowledge, and learning styles of the students.
Since 2002, the Foundation has developed about 124 digital learning
resources in curricular subjects and deployed it across 16 States. The
primary aim of developing these digital learning resources was to
make learning a joyful experience for children and thereby ensure
that they come to schools regularly. Teachers were given two days‘
training in the use of digital learning resources. This training dealt
with turning the computer on and off, inserting CDs, navigation, etc.
In 2006, an attempt was made to measure the impact of computer
aided learning (CAL). While the CAL programme of Azim Premji
Foundation has been running in several states and schools, attempts
to study the impact of technology on the learning of students did not
go through, because of certain issues which surfaced. Two such
important issues were: (a) Hardware and (b) Usage.
Hard ware Problems:
Many schools were not using computers because of issues
like inadequate power supply, delayed payment of bills, etc.
Some schools were not using computers because of hard
ware problems.
In some schools there were inadequate numbers of
computers. The child-computer ratio was highly imbalanced. [Many children sit at a single terminal.]
Usage problems:
Children see CD‘s but there is no integration of technology with the lesson.
The one-day training given to the teacher does not equip her to handle computers as a pedagogical tool.
The first virtual classroom
PLATO (Programmed Logic for Automated Teaching Operations) was the first (ca. 1960) generalized computer assisted instruction system, and, by the early 1970s, comprised some 1,000 terminals worldwide. Originally, PLATO was built by the University of Illinois and functioned for four decades, offering coursework (elementary–university) to UIUC students, local schools, and other universities. The PLATO project was assumed by the Control Data Corporation (CDC), who built the machines with
which PLATO operated at the University. CDC President William Norris planned to make PLATO a force in the computer world; the last production PLATO system was shut down in 2006, yet it established key on-line concepts: forums, message boards, online testing, e-mail, chat rooms, picture languages, instant messaging, remote screen sharing, and multi-player games.
10
Because of infrequent usage, there was no data on the impact of technology on learning outcomes per
se.
An imbalanced Pupil-Teacher ratio (PTR) resulted in teachers having to send a few children at one time,
to view the CDs, without their knowing how to engage the remaining children who were not seeing the
CD.
The key learnings from this experience were that it was necessary to ensure certain factors, if computer aided
learning has to be effective. These are:
a) Technology should not be seen as divorced from pedagogy and learning.
b) The maximum number of children sharing one computer should not exceed 3.
c) There is a need for uninterrupted power supply for using computers.
d) The Teacher is the key person for use of technology.
e) Teachers must be trained in integrating technology with pedagogy.
These key learnings created a need for exploring the impact of Computer Aided Learning by putting the critical
conditions in place.
Computer aided learning: the International Scene
There is a general belief that computer technology allows educators many options for communicating,
facilitating, and enhancing teaching and learning. Despite the rapid development of computer technologies and
the increasing use of computer technologies to deliver instruction, the debate about whether or not media
enhance learning has continued unabated for the last 15 to 20 years. The central debate is around the
(un)importance of delivery systems and instructional methods. Proponents claim that computer technology
makes learning easier, more efficient, and more motivating (Schacter & Fagnano, 1999). They draw support
from research reports and reviews that show a positive learning advantage for computer-assisted instruction
when compared with traditional instruction (Fletcher-Flinn & Gravatt, 1995). Sceptics argue that if media studies
were conducted under rigorous controls, the ‗instruction method‘ and not the ‗media for instruction‘ would prove
consequential (e.g., Clark, 1983, 1994; Neal, 1998).
Findings from Twelve Meta-Analyses on Computer-Based Instruction
Instead of a thorough literature survey on the subject, we present a flavour of the status of research in the field,
using what is known as ‗meta-analysis‘. Meta-analysis, as a technique, is an integrative statistical analysis (or
reanalysis) of previous research as a means to answer new questions using old data (Glass et al., 1981). It
combines results from multiple similar individual research studies to generate a single effect size that illustrates
the treatment effect across all studies, so as to make studies comparable.
An issue in consulting a large body of literature is the varying ways in which the research reports the outcomes
of computer-assisted learning. In order to attempt to make sense from a diversity of types of statistics contained
in different reports, a measure is often used by researchers, that allows different types of information about
effects to be converted into a common measure of effectiveness, namely, an effect size. The use of effect
size allows us to combine results from multiple similar individual research studies (in this case concerning the
use of computer-assisted learning) to generate a single effect size that illustrates the treatment effect across all
studies. It provides a common expression of the magnitude of study outcomes for all types of outcome variables

11
that, in this case, are achievement outcomes. It also allows a comparison of quite different types of innovations
in learning, like the use of reinforcement; parent involvement in the school and the use of peers in learning.
Effect size employs a continuum – where:
o zero means that there is no effect from introducing some innovation,
o while a negative effect indicates that the innovation has a decreased effect on achievement and
o a positive effect shows that an innovation has an increased effect on achievement.
It is calculated to determine the presence of a statistical difference in mean standard deviation units. There are
many possible ways to estimate effect sizes (for a review see Cooper & Hedges, 1994; Glass, McGaw, & Smith,
1981; Hedges & Olkin, 1985). There is the question of what is a reasonable effect size in terms of classroom
significance. This is a difficult one. Cohen (1977) provided the following ranges for mean effect size
interpretation:
o effect size (ES) .2 to .49 = small effect;
o ES .5 to .79 = medium effect, and
o ES .80 and above = large effect.
Tallmadge (1977) suggests that an effect size of .25 or more is educationally significant.
A percentile (or centile) is the value of a variable below which a certain percent of observations fall. So the
20th percentile is the value (or score) below which 20 percent of the observations may be found. Here, the last
column in the table below gives the percentile gain over the control group, thus showing the increase in the test
of achievement in the group that received computer aided instruction, over the control group.
Table 1: Summary of Meta-Analysis
Authors of Meta-
Analysis
Instructional Level Number of
Studies
Analysed
Average
Effect
Size
Percentile Gain
over Control
Group
Bangert-Drowns, J.
Kulik, & C. Kulik (1985)
Secondary 51 .25 10
Burns & Bozeman
(1981)
Elementary &
Secondary School
44 .36 14
Cohen & Dacanay
(1991)
Health Professions
Education
38 .46 18
Fletcher (1990) Higher Education &
Adult Training
28 .50 19
Hartley (1978) Elementary &
Secondary Math
33 .41 16
C. Kulik & J. Kulik
(1986)
College 119 .29 11
C. Kulik & J. Kulik, &
Shwalb (1986)
Adult Education 30 .38 15
J. Kulik, C. Kulik, &
Bangert-Drowns (1985)
Elementary 44 .40 16
Niemiec & Walbert
(1985)
Elementary 48 .37 14

12
Roblyer (1988) Elementary to Adult
Education
82 .31 12
Schmidt, Weinstein,
Niemiec, & Walberg
(1985)
Special Education 18 .57 22
Willett, Yamashita, &
Anderson (1983)
Pre-College Science 11 .22 9
Note: Table excerpted from Kulik, James A. (1994)
Kulik (1994) conducted a meta-analysis of 12 Computer Based Instruction (CBI) meta-analytic studies
based on 546 individual studies. He reported average effect sizes ranging from .25 to .57, or between 10 and 22
percentile gain over a control group who performed at the 50th percentile. In addition, Kulik reports that
students learned more in less time when they received computer-based instruction, and that students liked their
classes more and developed more positive attitudes when their classes include computer-based instruction.
These findings suggest that students who engaged in CBI performed significantly better than students who did
not. However, CBI did not have positive effects in every area in which they were studied. As can be seen in the
above Table, achievement differed with educational level. At elementary level, effect sizes were greater, .37 to
.40, or between 14 and 16 percentile gain, whereas at secondary and college level, effect sizes were smaller, .25
and .29, respectively.
The implementation of CBI in special education seemed to be most effective, with effect size .57, or 22
percentile gain. This may be due to the effect of individualisation of the learning process to accommodate
students‘ learning needs. Similar to the findings of Niemiec and Walberg (1987), Kulik‘s findings suggest that
Computer Aided Instruction is more effective in improving achievement of younger students and students with
special learning needs.
The challenge for educators is that studying the relationship between computer technology assisted instruction
and learning outcomes has been complicated by changing emphases, resulting from the development of learning
theories, teaching methods, and technologies, as well as their differential impact on individual students.
However, to produce meaningful learning, it is necessary to have a clear understanding of which technologies
under what conditions are best suited to enhance learning and achievement of which group of students (Parr,
2000).
All the studies quoted above were conducted in learning contexts in the Western and/or developed world. The
impact of computer technologies in Indian classrooms is an area of much speculation and assumption, in lieu of
actual research. Very few studies have thrown up conclusive results on the subject, focussing merely on
technologies used and infrastructural deficiencies rather than learning outcomes (Pal, Pawar, Brewer, Toyoma,
2006).
This CAL study was conceptualised to fill this void of evidence.
Background of the Study
The Computer Aided Learning (CAL) Research Study was conceptualized in 2007 by Azim Premji Foundation (a
not-for-profit organization working towards improvement of quality of education in government schools) in

13
collaboration with the Governments of Chhattisgarh, Orissa and Puducherry. The study emerged from the
Foundation‘s experience of working with different states for the development and deployment of multimedia
educational software during the period of 2002-2006. This experience of five years brought to the Foundation‘s
notice several parameters as critical success factors in the meaningful deployment of educational software - like
the integration of technology with classroom process and teachers‘ pedagogy, teacher development and
leadership. This is a report of the study in the state of Orissa only.
Scope of the Study:
The study is limited to classes 3, 4 and 5, and is designed to explore the following questions when technology is
used by enabled and empowered teachers:
How does technology influence student academic performance?
How has technology been used to improve basic reading skills?
How has technology been used to improve mathematics and problem solving skills?
How did technology develop higher order thinking and problem solving?
How did technology address the needs of low performing, at-risk, and students with learning disabilities?
How was technology infused into the curriculum and instruction effectively?
What strategies resulted in effective instructional applications of technology?
Design of the Study
There are three study groups comprising:
1. 20 of the schools forming a control group, where teachers do not receive any inputs whatsoever,
2. 20 schools forming an experimental group (E1) where teachers receive inputs in pedagogy as well as
technology, and
3. 20 schools forming an experimental group (E2) where teachers receive inputs in pedagogy alone.
Research Design
Experimental Schools (1) N= 20
Teacher development with pedagogical and technology inputs
Experimental Schools (2) N= 20
Teacher Development with pedagogical inputs only
Control Schools N= 20
No Inputs

14
Indicators for studying the Impact of Technology:
Impact On Ways of measuring this impact
For Learners Learning Outcomes Achievement Tests –
overall achievement, as well as
achievement on specific thinking-based
questions and on concepts for which
we will use technology, as well as
questions asked by students – their
number and type
Attendance Head count
Attendance register - taken for one day
in every month
Overall increase in attendance
Impact On Ways of measuring this impact
For
Teachers
Reduced absenteeism Attendance registers
Increased punctuality School Visits
Sense of self efficacy and promoting
reflective practices
Teacher attitude surveys
Impact On Ways of measuring this impact
Classroom
Processes
Primacy to students‘ experiences
and expressions in teaching as well
as in the physical layout of the
classroom (that is, a learner-centred
classroom)
Classroom Observation
Encouraging questioning by children
Teachers connecting to child‘s
experiences, and designing &
integrating learning experiences
(with the teacher as a facilitator),
prompting and emphasizing
equitable distribution of resources
and treatment of students.
Components of the Study
The study aims to systematically and scientifically explore the strength of technology in creating positive
influences in the education process; more specifically, to enable the teacher to provide a multiplicity of learning

15
experiences. Hence, this research study encompasses a robust process of teacher preparation and support to the
teacher at the school and cluster level, with the help of a team of resource persons. Its components are:
TDIs: The component of teacher development and academic perspective building is termed Teacher
Development Interaction (TDI). The reason is, by the very design of the study, teachers come together
periodically and engage in evolving a constructivist outlook for reforming their own academic constructs and
enriching classroom processes. TDIs were designed for better teaching of the subject areas of language,
mathematics and EVS, in that order. Since meaning is encoded in the form of language, it was decided to
concentrate on improving reading levels first, before proceeding to the other subjects. Mathematics was handled
before EVS, since teachers expressed more concern about its teaching than about the illumination of any other
subject area.
On-site support: An important component of the CAL Study is the continuous provision of support to the
teachers who attended the TDIs. On-site support includes providing resources - both digital and non-digital -
contributing ideas for new classroom activities and hand-holding teachers during trials of new concepts/
methodologies in the classroom. Continuous and ongoing classroom observations (CROs) track the changes in
classroom practices resulting from these efforts.
Teacher Network Meetings: Teacher Network Meetings (TNMs) aim to create a forum for teachers for the
purposes of self-expression and development. Through the TNMs, teachers will – it was envisioned – begin to
perceive themselves as members of a community, united by common goals and operational difficulties, instead
of as disparate units working in isolation - as is commonly the case now. It is further envisioned that, once a
sense of community has been developed, shared ideas, reflections, learnings and difficulties will inevitably
become focal points of discussion and action. Additionally, such a forum, it is hoped, will incite in teachers a
larger sense of purpose about their chosen vocation and provide a much-needed boost to their collective
confidence.

16
A diagrammatic representation of the Study
Nomenclature of various parties to the Study
Teacher: A primary level government school teacher.
Student: A primary level government school student.
Volunteer: A college student who has been inducted into the study for a temporary period to support the study
process.
Facilitator/resource person: A member of the study team who is equipped to provide pedagogical inputs - in
a particular field of study - as well as technological inputs.
Research Team: The Study team comprising of resource persons/facilitators, field level co-ordinators and
documenters.
Approach to Technology
Most interventions [UNESCO. (2005) Information and Communication Technologies in Schools: A Handbook for
Teachers or How ICT can create new, open learning environments] in this area of education - i.e., integrating
technology into the classroom - endeavour to acquaint teachers with the theory and tools of technology first,
before attempting to introduce the same into classrooms. Elaborate training workshops are conducted for
teachers to orient them in the use of common operating systems, office tools, and special instructional software
packages. They are then supported to use these tools to elucidate concepts and theories in different subject
areas. The underlying assumption is that acquiring knowledge of technology is a necessary requirement before
the teacher can think of integration – i.e., using technology as a tool for learning.
17
In the CAL study, technology is viewed as a pedagogical tool similar to other Teaching Learning Materials, like
textbooks or blackboards, and so, teachers learn the use of technology in the context of their teaching. They are
not trained separately in tools but are compelled to familiarise themselves in the components or aspects of them
required to teach a particular topic or concept. Hence, teachers, begin to acquire technology as embedded in the
concept of integration, although the notion of integration is largely unconscious. This approach to technology
evolved in the course of the study but has now become integral to the way teachers are encouraged to interact
with technology.
CAL Study in Orissa
The Education Department of the Government of Orissa exhibited considerable interest in the proposal, due to its
growing inclination towards deploying technology in educational institutions. The Biju Patnaik Computer
Aided Education Project (BiCEP) is one such government initiative which aims to set up computer labs in
government schools and to provide the Multimedia Based Content CDs in Science, Mathematics, Computer
Literacy and English in Oriya. The state government and the Foundation signed a Memorandum of
Understanding (MoU) in January 2008, outlining the role and responsibilities of each in the implementation of
the Study.
Excerpted from the MoU between the Foundation and the Government of Orissa, signed 29 January 2008
The Government agrees among other actions, the following specific actions:
1. Support a focused implementation of the programme for a period of 2 academic years in mutually
identified schools in the state and to provide administrative and other required support as further
detailed in this MoU for the smooth implementation of the programme.
2. Jointly with the Foundation identify 60 schools – 20 schools for the purposes of experiment
1(technology plus Teacher development) and 20 schools for experiment 2 (only teacher
development) and 20 schools as Control Group
3. Provide and maintain the teacher pupil ratio at 1:30 throughout the period of experiment of two
years and to mandate that the identified class/standards/section would not have more than 30
children.
4. Agree that given the density of multimedia content available (which are mapped to competencies
of various classes) the implementation will be more specific to classes 3, 4 and 5. and hence, only
the said classes are selected for the research project. However, this does not preclude the initiative
covering the other classes.
5. Nominate a person representing the Government who would be a single contact point for the
Foundation on all issues related to the proposed research project.
6. Depute one person, who brings pedagogical skills on a full time basis, to the Foundation, for the
purpose of the project. He / she would join the Foundation team (of three other members) in
supporting schools and teacher.
7. Equip the school with the following hardware/furniture:
Adequate number of multimedia enabled computers per school to facilitate engagement with
content in one period to a complete class/standard/section of 30 children @ 3 children per

18
terminal. All the systems to be locally networked and one system to be supported by
modem/wireless devices/CDMA or GSM based Modems with internet connection.
UPS of adequate capacity having low voltage and quicker battery recharging capabilities, which can
provide back up of at least 3 hours.
Adequate furniture of specified design to support the deployment in computer room.
To ensure that the Hardware including batteries to have (at the least) three years onsite warranty
and the response time by vendors to maintenance issues to be specified and tracked. The
Foundation should be suitably authorised to represent and follow up maintenance related issues
with all the vendors.
8. Issue appropriate administrative orders to ensure attendance of teachers in trainings and refresher
courses during the academic year.
9. Pay TA/DA for the teachers and other functionaries who are required to attend development
programs or participate in the meetings.
10. Bear the printing expenses of large scale training or communication material.
The Foundation agrees to undertake the following actions:
Depute resource persons to facilitate teacher interaction and development for use of technology as
well as digital learning material.
Bear the cost of salary of the member deputed full time to the project by the Government.
Provide adequate copies of the digital learning material. Research gaps that exist in the
requirements and availability of digital learning material and develop suitable content or finalise
suitable pedagogic approaches to cater to the identified gaps.
Monitor the project through appropriate methods for such monitoring.
Bear the costs incurred to train the teachers of the identified schools over and above the TA/DA
paid by the Government.
Conduct research at their cost but with the support of Government.
Evolve methods of regular report generation and review by both the Government and the
Foundation.
Document the entire process and provide a comprehensive document at the end of the experiment
to enable initiation of suitable actions on the scaling up of the programme or otherwise.
Suitably redesign the multimedia content depending on the feedback and experience.
Both parties also agree that there will not be any limitations to share / use the knowledge created from this
experiment for further applications.
District & Sample Size
The Nayagarh district in the east of Orissa was chosen as the site of operation.

19
The Study is being implemented in the Nayagarh district
of Orissa, in three blocks, namely, Nayagarh, Odogaon
and Ranpur. The study reaches approximately 2900
children and 269 teachers spread over 40 schools.
Impactable group of students (E1+E2): 2838
Student Sample size (E1+E2+C): 4250
Impactable group of teachers (E1+E2): 269
Teacher Sample size: 408
(see table on following page)
Educational Profile of the District
The Nayagarh District is located towards the west of Puri district surrounded by Cuttack district in the North,
Phulbani district in the West, Ganjam district in the South and Khurda district in the East. It has a literacy rate of
70.5%, above both the state average of 63.08% as well as the national average of 64.84%. The gender literacy
gap of Nayagarh, standing at 25.1 percentage points, is, however, higher than the national average of 21.69
percentage points.
Table 2: Educational Profile of Nayagarh District
Indicators Level Percentage
Repetition Rate Primary 7.3
Upper Primary 3.1
Drop-out Rate Primary 2.45
Upper Primary 10.37
Gross Enrolment Rate Primary 99.7
Upper Primary 116.0
Net Enrolment Rate Primary 81.6
Upper Primary 69.0
Transition Rate Primary 79.26
Source: Website of the District of Nayagarh, http://nayagarh.nic.in/govtsection/ssa/ssa.html
Why was Nayagarh district chosen?
The following factors were responsible for the selection of Nayagarh as the district of operation:
1. Interest shown by the district

20
2. Non - BiCEP1 district
3. Representative sample of Orissa in terms of socio-economic groups
4. Less political interference than in other districts
5. Fewer education-related initiatives undertaken by Government than in other districts
6. Active district project functionaries
Sample Selection
After selecting the district, about 70 schools were chosen on the basis of:
infrastructure,
availability of a spacious room for computers,
class size,
number of teachers in school, etc.
This matched sample was then subjected to randomization and schools were allotted to the three types, namely:
1. E1,
2. E2 and
3. Control.
A total of 60 schools were thus sub-selected.
Number of students at the time of sample selection
Table 3: Number of students in the three classes
Type of Schools Class 3 Class 4 Class 5 Total
No: of
Students
No: of
Teachers
E1 424 467 641 1532
137
E2 326 333 647 1306
132
Control 329 338 745 1412
139
Total 1079 1138 2033 4250
408
Profile of the Teachers
The baseline survey sought to collect data on:
o teachers' educational qualifications,
o their beliefs about technology,
o their approach to pedagogy,
o their attitudes towards teaching and learning and
1 The Biju Patnaik Computer Aided Education Project (BiCEP) is a state government initiative to set up Computer labs in government
schools and to provide the Multimedia Based Content CDs in Science, Mathematics, Computer Literacy and English in Oriya.

21
o their perceptions of classroom discipline.
The following tools were enlisted in this effort (Please refer to Annexure 3 for these formats):
Teacher Basic Information and Perceptions Interview: Teachers were interviewed by volunteers to collect
information on their educational qualifications, years of experience, their views on the National Curriculum
Framework, their beliefs about technology and the aims of education. The interviews revealed the following:
1. On an average, the teachers in the Study have around 13 years of experience in teaching, of which
around half has been spent in the school in which they are presently teaching.
2. In terms of basic educational qualifications (not in the field of Education), 23% have passed the 12th
grade while 44% have a graduate's degree, either a Bachelors of Arts, a Bachelor of Commerce or a
Bachelor of Computer Science. Only 16% of teachers have a Post Graduate degree.
3. In terms of educational qualifications in the field of teaching, 26% of the teachers in the Study have a
Bachelor of Education while 55% have a TCH or a CT (TCH: Teacher's Certificate Higher Course; CT:
Certificate in Teaching).
4. 36% of teachers are aware of the National Curriculum Framework, of which only 15% have read the
document in full.
5. 81% of teachers claimed to prepare their own lesson plan in a written form but when asked for a copy
of the same, none were able to oblige.
6. Nearly half the teachers confirmed that they maintained a journal/diary but only 2 were able to display
the same to the interviewer.
7. Apart from the annual and mid-term examinations, most teachers administer their own tests throughout
the year to keep track of their students' progress. About 10% of the teachers testified to conducting
debates and encouraging essay-writing and music-making as components of students' assessments.
8. Nearly 80% of teachers have never used a computer. Of the remaining 20% who have, only 30% have
ever accessed the internet for either information gathering or for communication.
9. Even though 78% of teachers have never attended a training programme to use technology as
pedagogical tool, nearly all of them believe that technology can be used to facilitate the process of
teaching and learning better.
10. Asked about the aim of education, the largest percentage of teachers - 42%, considered the
development of a good/active citizen as being crucial while 9% of teachers averred the evolution of
critical/creative/inquisitive individuals as being most important.
11. When asked about their own role in society, 47% of the teachers considered themselves to be
facilitators while 6% considered themselves to be change agents.
Timeline of Events
Time Activities
January 2008 Memorandum of Understanding (MoU) Signed

22
March – June 08 Collecting profiles of teachers and schools, matching them, selecting about 70 schools and
assigning them to E1, E2 and Control group using randomization.
June 2008 Project office and Project team in place
July 2008 Induction Training for Project Team
August 2008 Training volunteers and Collection of baseline data – RAT and Teacher tools
September 2008 Training members into classroom observation and drawing inference
October 2008 Teacher Development Interaction – I
October to
November 2008
Deployment of computers to E1 school (5 each ) – by the government
Preparation of Competency Achievement Test and validation
Dec 2008 Training volunteers and collection of data on Math and EVS ; First State level Review Meeting
Jan-Feb 2009 TDI – Planned but had to be postponed at the request of the State. So this time was used to enhance Class room observation skills.
March – June 2009
Preparation for Training teachers on Technology; preparation of school dossier; analysis of school-wise baseline results. Began training teachers on technology (May 2009)
April 2009 Head Teacher Meeting for sharing information and results of base line and updating on the
study and seeking their support
July 2009 9 batches of teachers were trained for TDI 2, 3 and 4: Language; ICT baseline data collection in E1 schools.
August 2009 Training teachers on the use of computers – in on-site support
On July 18th and July 19th: Head Teachers‘ Meeting; Meeting with BRCs / CRCs for providing
information on project
August 2009 - March 2010
School Visits for computer training and pedagogy inputs. Teachers of E1 Teachers were motivated to see the CDs and map it to the curriculum.
Six members together have made 158 school visits.
Oct 13th District, block and cluster level meeting – for updating on project and getting inputs
5 Day workshop on preparation of Math module in collaboration with the State
Dec 2009 Math TDI; BRC Meeting for sharing information on the Study and seeking inputs
Jan 2009 Resource generation workshop – preparing games for Math and language in Oriya
Refining curriculum maps; Preparation of teacher dossiers
Feb 2010 Second State-Level Review Meeting
Feb – April 2010 Preparation of board games, distribution to school, demonstration of games and observation of games.
Prepared 6 Math modules and prepared for 10 days‘ residential programme. Even though
dates were fixed in consultation with the State, the TDI had to be cancelled because of census enumeration.
Baseline
The baseline survey was conducted in August 2008 in the Experimental Schools 1, Experimental Schools 2
and Control Schools, amounting to 60 schools in all. Its objective was to gather data on the prevailing levels
of competence of the students in areas like reading, comprehension, Mathematics and EVS. Questionnaires to
gauge teacher attitudes and perceptions on the goals and means of education also formed part of the survey.
The baseline survey, in conjunction with the midline and endline surveys, was intended to serve as a means of
measuring the change instrumented by the CAL project in the experimental schools. It was also intended to
guide proposed interventions in the Study.

23
Tools used for Baseline:
The study looked at: (a) Reading abilities of students, (Reading Ability Test, RAT)
(b) Competency in Math and EVS, (Competency Achievement Test, CAT)
(c) Beliefs and attitudes of teachers.
(d) ICT Tool
The tools used for each of the above (as well as the underlying principles for development of these tools) are
described in this section, in the above sequence.
(a) Reading Ability Test (RAT):
One of the objectives of CAL is to increase the reading abilities of students. Since the study involved students of
classes 3, 4 and 5, the reading ability tool had to be in consonance to the reading levels expected from these
students. The RAT tools were designed to assess the ability of the children to decode the text, retrieve data,
interpret information and reflect upon what was read. The primary emphasis was on assessing the child's skill in
using language as an aid to think and inquire and not merely as a means of recording and retrieving information.
Please refer to Annexure 2 for tabulated results of the RAT.
The objectives of the RAT are:
a) To measure the reading levels of students – identify those who are emergent readers, those who are
developing readers: and those who are proficient readers.
b) To help teachers identify the patterns in errors made by students so that they develop suitable remedial
materials.
Process of Preparing the RAT:
The process of preparing RAT consisted of the following steps:
a) Review of literature
b) Review of the reading assessment tools available in the Indian context and those that have been used
across the globe
c) Development of a framework for the view to be followed in CAL
d) Preparation of the criteria for the to-be-developed RAT
e) Development of a blueprint for RAT
f) Development adaptation of the reading passages and development of relevant comprehension
questions
g) Development of running records - to record the process of reading.
Each of these steps is discussed below, in the above sequence.
a) Review of literature: First a clear-cut view on the nature of reading, its development, and assessment
was defined. This view was based on a balanced approach that consisted of starting from whole
language and proceeding to mechanics of reading. (Refer to Annexure 4).

24
b) Review of the reading assessment tools available in the Indian context and those that have been used
across the globe: Reading assessment tools that have been used in the Indian context were examined.
These were the reading passages used :
i. in Pratham programmes,
and
ii. in the Accelerated Learning Programme in Madhya Pradesh.
These assessed the reading abilities of children and identified them at the alphabet level, word level,
sentence level and paragraph level. These passages also had comprehension questions.
c) Development of a framework for the view to be followed in CAL: But these tools could not be used in this
present study because of the following reasons:
I. These tools limit the view of comprehension to ―why‖ questions,
II. The evaluation criteria in these tools see reading abilities as being cumulative – progressing from
alphabet to word, to sentence to paragraph levels – and a cumulative approach to reading was
not taken in the present study. In the present study, the focus is on reading as a developmental
process.
These reasons triggered the need for using another set of tools for assessing reading abilities.
d) Preparation of the criteria for the to-be-developed RAT: Three reading passages were selected on the
basis of:
Complexity of ideas
Sentence length and structure
Complexity of comprehension questions
e) Development of a blueprint for RAT: The number of questions under each category, viz., retrieving,
interpretive and reflecting, was allocated for each of the classes 3, 4 and 5. A larger number of retrieving
questions was maintained in all three classes. This was done, firstly, to keep the level of confidence in
the students high. Secondly, first-level testing involves retrieval of information through slightly twisted
text appearing in the question, e.g. if the text refers to a character returning from the city, the retrieval
question will ask the child where the character went. This is the beginning of raising the level of the
learner to higher order thinking. (See Annexure 4 for sample blueprint.)
f) Development /adaptation of the reading passages and development of relevant comprehension
questions: Three types of comprehension questions were prepared – using ideas from the PISA
framework (Assessing Scientific, Reading and Mathematical Literacy: A framework for PISA 2006, OECD).
a. Retrieving questions: are those questions whose answers are in the text and the student has to
retrieve them.
b. Interpretive question: are those questions that require students to interpret or draw inference
c. Reflective questions: are those that solicit opinion of students or require them to adopt a
perspective.

25
The scholarly view is that one cannot translate any text from one language into another: in the very act of
translation, there is a recreation of the text into another language. Therefore, the term ‗trans-creation‘ is
preferred over ‗translation‘ in academic circles. Thus, the passages were trans-created (henceforth, the term
‗translation‘ will be used to refer to ‗trans-creation‘) into Oriya.
To validate the translation, the method of back translation was used. In this method, the translated version is
read out by one person and another person (who was not involved in the translation but with proficiency in
English) back translated the Oriya version into English. The original English passage and the English-translated
version of the passage were matched. The closeness of fit was the criteria for validating the translation. If both
the versions did not match, then the problematic areas were identified – word, phrase, sentence, etc., and
rectified to bring in the intended meaning.
In the course of checking the translation, a constant check was maintained to know whether the words used are:
o familiar to children,
o high frequency words,
o grade-appropriate, etc.
In the case of certain borrowed words, like ‗pant‘, ‗shirt‘, etc., it was decided not to consider such words as
errors.
Materials in a Reading Test
A Reading Passage in large font for classes 3, 4 and 5 separately
Reading passage – evaluator‘s copy – the same passage but in smaller font
A Running record – for recording the reading process and the errors and space for making observations.
(See Annexure 4)
A list of comprehension questions
Administering the Reading Ability Test
The reading ability test was administered to children with the help of volunteers.
Volunteer Training:
The volunteer training programme was for a period of 4 days: from 5th to 8th August 2008. Volunteers were
students of BA (education) in Nayagarh college. The four days of training were devoted to the following:
explaining the CAL study, their role in it and the background of reading; introducing them to the passages,
formats and recording; engaging them in a peer demo and providing feedback, taking them on a dry run in
schools, providing feedback and the logistic details of which school to go, how to go, what to do in schools, etc.
Instructions and explanation given to volunteers:
1) Error types: there are two types of errors -
a) Errors that are not self-corrected.
b) Errors that are self-corrected by the child. (Self-corrected errors are those errors which the child makes
and then corrects on his/her own. The evaluator DOES NOT prompt the child to correct the error.
Generally, self-correction is preceded by repetition. Allow this.) When the child makes a self-

26
correction, do not mark the substituted word as error. Merely indicate the error and mark it as
self-correction (e.g. The child has said youngest for younger and then corrected it. It is marked as
youngst/SC.)
2) Errors that are not self-corrected are called ERRORS. They are of the following types :
a) Substitution – where the child substitutes one word for another
b) Omission – where the child omits a word
c) Insertion – where the child inserts a word
d) Prompt – where the evaluator tell the word
3) Record the type of errors made by children as he/she reads.
Prompts are given when the child is stuck and unable to continue, the volunteer waits for 5 to 10 seconds and
tells the word and then tells the child to repeat the word and move further.
4) In this case mark T above the error and this is counted as an error.
5) Do not count repetitions as errors. They indicate extent of fluency in reading.
6) Ignore dialect pronunciation errors.
General Instructions to the Volunteers:
i. Sit beside the child and not in front of the child.
ii. Try to observe child‘s eye movement and finger movement as she/he reads.
iii. Intervene as little as possible when the child is reading.
iv. If the child is reading too fast for you to record, request the child to pause until you complete recording
the sentence. Make this request at the end of the sentence and not when the child is reading midway.
v. In the interest of safeguarding the child, if a child is getting stuck constantly, stop the reading if the
volunteer has provided four prompts in the first three sentences.
At the end of the Record: the volunteer is open to make any observation that he/she thinks might be important.
The volunteers went to schools to administer the reading ability tests.
After building rapport with the student, the volunteers gave the student his/her copy of the reading
passage. This test is an individual administration.
The student was given time to go through the passage as many times as he/she wanted. After the
student became familiarized with the passage, the actual testing began. The student was told to read
the passage loudly.
The volunteer followed the student‘s reading as the student read, making all the relevant markings.
The time taken for the student to complete reading was noted.
After the reading, comprehension questions were asked. The student was free to refer to the passage
while answering comprehension questions.
The answers given by the students were noted.
The student was thanked at the end of the reading session.

27
g) Developing running records to record the process of reading: These were tools used to record the
process of reading.
Description of the Running Record: The running record consists of 4 columns. Column 1 gives the
sentence number, column 2 the sentence, column 3 the total errors in a line and column 4 the number of
self corrections in the line. (See Annexure 4 for sample running record.)
Each word in the sentence is placed in a box.
Each line has a corresponding blank box over it. This is the space for recording student‘s reading.
Since we wanted to cover several students, the use of volunteers was a good option. But this option was full of
challenges.
Challenges faced in using volunteers for testing reading abilities:
Despite repeated instructions, volunteers tended to sit on a pedestal, higher than children.
Sometimes they tended to mark wrongly/miss out on marking the errors.
While the child was answering comprehension questions, volunteers sometimes took away the passage
from them.
Volunteers tended not to wait for the child before giving prompts.
Despite telling the volunteers to write legibly, they often scribbled the data.
(b) Competency–Based Achievement Test in Math and EVS
The Australian Council for Educational Research (ACER) Framework was used to develop the baseline tools for
achievement in Math and EVS. It was decided to test students of classes 3, 4 and 5 on competencies of class 2,
3 and 4.
Workflow of the tool development
In the assessment work being carried out by the Azim Premji Foundation, a streamlined process has been
developed. This was the procedure largely followed here, too. [Ref: CAT Coding and Transcription Report, Orissa
& Chhattisgarh, Jan-Feb, 2009, Aanchal Chomal, Azim Premji Foundation]. A diagrammatic representation of the
workflow is shown here:

28
Each of the stages shown in the above workflow is described below, in sequence, for EVS and Math:
Chalking out Assessable Curricular Competencies:
The textbooks were scrutinized for curricular competencies, after which these were listed alongside content and
cognitive domains which we wished to test as part of the Cal study. By correlating the listed competencies with
content and cognitive domains, a selected set of competencies was arrived at for baseline testing. (Refer
Annexure 7 for Curricular Competencies in Math & EVS.)
Development of a Common Assessment Framework:
The assessment framework for CAL baseline test broadly spelt out the following-
1. The cognitive processes to be tested in Math & EVS
2. The content areas that would be tested in both the subjects
3. Fixing the representation of the above two in the test, in terms of percentage
EVS & Math assessment framework
In consonance with mathematics, the EVS assessment framework for CAT baseline test was framed after
reviewing the state curricula and NCF curriculum for EVS. Having done that, the framework was constituted with
two main dimensions: a content dimension and a cognitive dimension.
EVS CONTENT DOMAIN
In EVS, the different content domains tested for were:
Social Science
Physical Science
Life Science
Earth Science

29
The content domains define the specific EVS subject matter covered by the assessment. Each content domain
has several topic areas (i.e. social sciences is further categorized by Family, Work and Play, Shelter, Places
around us and Transport & Communication). Each topic area is presented as a list of competencies outlined by
respective state curricula for grades 2, 3 and 4. One of the most challenging tasks in EVS was to organize the
vast curriculum in content domains. The domains finally developed house all the basic content that needs to be
imparted through EVS.
1. Social Sciences- this strand includes topics such as-
o Family
o Shelter
o Work and Play
o Places around us
o Transport and Communication
2. Life sciences- this content domain includes understanding of the nature, functions and uses of living
organisms, the relationships between them and their interactions with the environment. The specific
topics being-
o plants and their growth,
o animals,
o human body and food
3. Earth sciences- this domain incorporated the study of the earth and universe. Topics in this domain
address basic facts about the earth and other heavenly bodies.

30
4. Physical sciences- this domain includes concepts pertaining to physical phenomenon occurring in the
environment, specific to matter and energy. At the primary stages children have limited understanding of
physical states of matter, concepts of heat, light, energy, etc. hence most of the content is at the level of
general knowledge on certain basic facts. The topics included in this domain are-
o Seasons
o Air & Water
o Things around us
5. Map reading- this features as a separate domain in the EVS framework. This is because maps are
needed as tools to understand most of the strands of EVS and social sciences, especially at higher
grades. Hence a solid foundation in map reading and map interpretation is crucial. Specific emphasis has
been given to understanding directions, distance and symbols used in maps.
EVS COGNITIVE DOMAINS
The cognitive domains define the sets of skills and abilities that illustrates students‘ understanding of not just the
content knowledge, but also of their ability to apply and communicate their understanding of the concepts. Items
in EVS are developed for content domains eliciting specific cognitive skills from students. These skills have been
divided into 4 broad domains.
1. Factual Knowledge- the development of scientific understanding and reasoning depends on previous
knowledge, expanding and revising it as one progresses. Having a strong and broad base of scientific
knowledge enables the students to engage with complex concepts and phenomena as one goes to
higher grades. However, factual knowledge should not be restricted to rote, but contains elements of
EVS Cognitive Domains

31
recalling / recognizing, defining, describing and using tools and procedures. At a very basic level, items
could be very direct, such as-
e.g. Which of these days is celebrated as National Festival?
A) Diwali
b) Holi
c) Independence Day
d) Christmas
This could be more complex when the child has to not only recall but also identify and sort out objects in order
to answer correctly-
e.g. Which animal eats ONLY plants?
a) cat
b) dog
c) lion
d) rabbit
2. Understanding Concepts- this domain assesses the child‘s ability to display the understanding of
concepts through making comparisons, classifying, representing or modelling, relating scientific concepts
to observed phenomena, extracting and applying information, finding solutions and explaining. For
instance, if one wants to assess the child‘s ability to classify animals on the basis of their locomotion, the
question could be framed as follows-
Classify the animals according to their movements:
CAN FLY CAN CRAWL CAN SWIM
In answering the above question, the child not only recalls the movements of animals but also sorts them into
groups and tabulates them on the basis of their movements. Hence, the child goes one step ahead of mere
recall, wherein one could have asked the student to merely ‗name 2 animals that crawl/swim/etc.‘
Lizard, Crow, fish, earth-worm, butterfly, tadpole
32
Reasoning & Analysis- This is one of the most important aspects of science education as it prepares students to
engage in scientific reasoning to solve problems, develop explanations and draw conclusions. It has most skills
similar to the topmost ones in Bloom‘s taxonomy such as ‗analyze, interpret and solve problems‘, ‗Integrate and
synthesize‘, ‗Hypothesize‘, ‗Evaluate‘ and ‗Justify‘. Some items in this domain may require the child to draw upon
different concepts from different content domains and apply it to a new situation. In the baseline test papers,
map interpretation items have been used to assess reasoning, e.g. for an item as ‗what could be the possible
reasons for Jaunpur village having 2 wells (class 5, question 23) a student has to make several connections and
draw upon various concepts in order to answer it. The child not only has to ‗see‘ the map but also understand
the symbols and relate the different elements present in the map to reason out the reason for the existence of 2
wells in the village named Jaunpur.
MATHEMATICS CONTENT DOMAINS
The details of the content domains in Math are given below
1. Numbers, include basic number sense, as counting, number representation as naming and writing
numbers and relationships between numbers. The latter includes ability to order or sequence numbers in
‗before- after‘, ‗ascending-descending order‘, ‗even-odd numbers‘, etc.
2. Mathematical Operations include the 4 number operations, namely addition, subtraction,
multiplication and division. Besides computation, this domain also comprises relating an operation to a
situation and using it for problem-solving. Geometry this domain includes identification of basic shapes,
understanding their properties and using spatial visualization skills to explain the relationship between 2-
dimensional and 3-dimensional objects.
3. Measurement - the emphasis of this content domain is on understanding measurable attributes such as
length, weight, height, etc. and demonstrating familiarity with the units and processes used in measuring
these attributes.
4. Data handling - though not present in any state curriculum as a separate curricular area, has been
incorporated in the assessment framework. This domain should, ideally, incorporate strands on data
collection, data representation and data interpretation – however, for the purpose of the baseline test, it
has been restricted to reading data presented in simple tables and data interpretation, at a very basic
level.
5. Money features as a separate content domain. It includes identification of currencies and routine
problems based on money.
6. Pattern is included as a separate content domain incorporating skills of sequencing and logical
reasoning.
MATHEMATICS COGNITIVE DOMAINS
The cognitive domains define the sets of behaviours expected of students as they engage with the
mathematics content. Items in mathematics are developed for content domains, eliciting specific cognitive skills
from students. These mathematical skills have been organized into FOUR broad domains.

33
Knowing facts and procedures: Facts are the factual knowledge that provides the basic foundation for
mathematical thought. Procedures refer to the set of actions that are needed for solving problems. More
specifically the skills are:
Recall – definitions, units, number facts, properties of geometric figures, etc. e.g. a + a + a =
3a, a x b= ab.
Recognize / identify – areas of parts of figures to explain fractions, equivalent fractions, etc.
Compute – know algorithms/procedures for + - x and division or a combination of these.
Use tools – reading scales and other tools of measurement.
Using concepts: Knowledge of concepts enables students to make connections between pieces of knowledge,
which would otherwise be retained as isolated facts. It allows them to go beyond the existing knowledge, judge
the validity of mathematical methods and statements and create mathematical representation. The sub-domains
here are as follows:
Connections – allowing students to make connections between knowledge that has already been
gained (such as knowing that length, area and volume are conserved only under certain
conditions); mathematical relationships, e.g. decide whether the area of paper will be greater,
remain the same, or be smaller when it is cut in strips (when the accompanying diagram shows
complete sheet and separated strips).
Classification – to classify or group objects, numbers, expressions and ideas.
Representing – to represent numbers using tables, charts, and graphs; representing fractions
through shading, etc.
Formulate – to formulate problems or situations that could be modelled by given equations or
expressions.
Solving routine problems: problem-solving is the central aim of teaching mathematics and it aids in using
mathematical knowledge and reasoning in solving daily life problems. The specific skills are-
Applying – applying knowledge of facts, procedures and concepts for solving a problem, where there is a
known algorithm. e.g.
Math Cognitive Domains

34
Modelling – generate an appropriate/efficient strategy for solving a routine problem e.g. Rina
has 15 fruits. Of these 5 are mangoes, 6 are oranges and the rest are bananas. How many
bananas does Rina have?
A) 15+5+6
B) 15-5-6
C) 15-5+6
D) 15+5-6
Interpreting – interpret an equation or a diagram.
Verifying / Checking – check the correctness of solutions
Reasoning: This is a domain wherein the skill assessed is more complex than the earlier one. It refers to logical
systematic thinking for arriving at solutions to non-routine problems. This includes skills of interpreting,
hypothesizing, synthesizing, justifying, etc.
Blueprint Design:
The next stage in the tool development process is the blueprint design. A blueprint is a planning document
where all the relevant information of a test is listed in the form of a table. The information pertains to-
1. Which strand/aspects of the curriculum will be tested?
2. Which particular skills will be tested?
3. What will be the item format? [Multiple-choice, short written answers, fill in the blanks, etc.]
4. Length of the test? Item-wise time allocation?
5. Which cognitive processes would be assessed?
6. What percentage of the content areas will be assessed?
7. What kind of stimulus material will be used for the items? [Will it be pictures? Maps? Illustration?]
8. What will be the level of difficulty of the paper?
The blueprint is, in most cases, a working document which undergoes changes during the process of item
designing. It is not possible to entirely freeze a blueprint before starting item development, as one needs to go
back and forth on many occasions. For instance, if while preparing an item, the item developer feels that the
competency could be tested using a certain item format that differs from the blueprint, there should be scope for
changes in the blueprint.
Developing the Blueprint for EVS.
The format used for the EVS blueprint was similar to that used for math. The percentage division of items as per
the content and cognitive domains is shown in the tables below-

35
Table 4a: Question Distribution across content domains for EVS
Content Domain No of questions
Class 2 Class 3 Class 4
Social Sciences 40 % (8) 30 % (9) 30 % (9)
Life Sciences 40 % (8) 30%(9) 30%(9)
Physical Sciences 20 % (4) 20 % (6) 20 % (6)
Earth Sciences NA 10 % (3) 10 % (3)
Map reading NA 10 % (3) 10 % (3)
Total 20 30 30
In grade 2, social sciences and life sciences together constitute roughly 80% of the paper. This is because the
topics in these 2 domains are basic and fundamental to the subject. Also, in primary grades a lot of emphasis is
given to topics such as plants, animals, food, transport & communication, etc. which are incorporated in these
domains. Physical sciences constitute the remaining 20 % of the paper. Items from this domain are very basic,
restricted to seasons and clothing for grade 2. Earth sciences and map-reading are not introduced in any state
syllabus at the grade 2 level. At best, this is restricted to the observation of the sun, moon, stars, etc which does
not lend itself easily to formal assessment.
Grades 3 and 4 have assessments from all the five domains. Around 60% of the items are from the social and
life sciences topics and the other 40% from physical, earth sciences and map-reading. Of this, only 10 % of the
items are from the Earth sciences and map reading domains respectively since concepts in these domains are
too complex and are apt for assessments at higher grades.
Question Distribution in EVS cognitive domains
Table 4b: Question Distribution across cognitive domains for EVS
Cognitive Domain No of questions & ( %age)
Class 2 Class 3 Class 4
Factual Knowledge 60 % (12) 50 % (15) 40 % (12)
Conceptual
Understanding
30 % (6) 35 % (10) 40 % (12)
Reasoning &Analysis 10 % (2) 15 % (5) 20 % (6)
Total 20 30 30
As state earlier, factual knowledge forms the basis of understanding scientific phenomenon, hence a lot of
emphasis has been given to this domain. The % of items assessing understanding and reasoning of concepts
increases as one approaches higher grades.
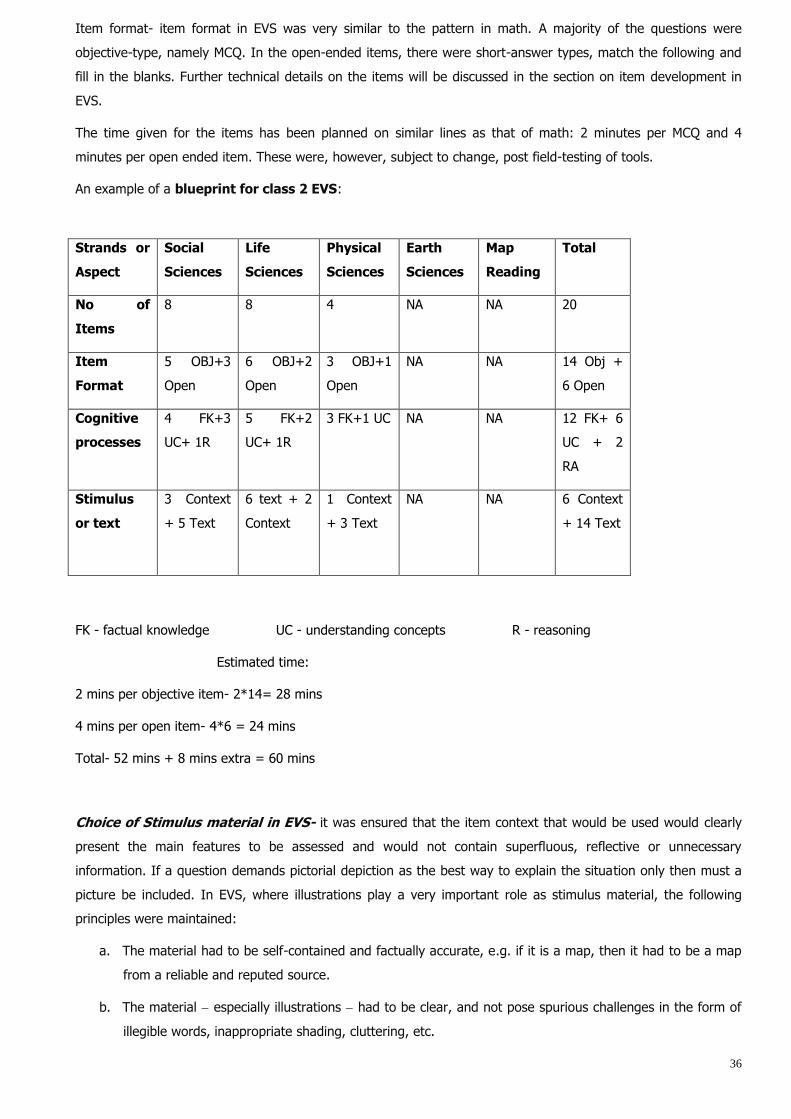
36
Item format- item format in EVS was very similar to the pattern in math. A majority of the questions were
objective-type, namely MCQ. In the open-ended items, there were short-answer types, match the following and
fill in the blanks. Further technical details on the items will be discussed in the section on item development in
EVS.
The time given for the items has been planned on similar lines as that of math: 2 minutes per MCQ and 4
minutes per open ended item. These were, however, subject to change, post field-testing of tools.
An example of a blueprint for class 2 EVS:
FK - factual knowledge UC - understanding concepts R - reasoning
Estimated time:
2 mins per objective item- 2*14= 28 mins
4 mins per open item- 4*6 = 24 mins
Total- 52 mins + 8 mins extra = 60 mins
Choice of Stimulus material in EVS- it was ensured that the item context that would be used would clearly
present the main features to be assessed and would not contain superfluous, reflective or unnecessary
information. If a question demands pictorial depiction as the best way to explain the situation only then must a
picture be included. In EVS, where illustrations play a very important role as stimulus material, the following
principles were maintained:
a. The material had to be self-contained and factually accurate, e.g. if it is a map, then it had to be a map
from a reliable and reputed source.
b. The material especially illustrations had to be clear, and not pose spurious challenges in the form of
illegible words, inappropriate shading, cluttering, etc.
Strands or
Aspect
Social
Sciences
Life
Sciences
Physical
Sciences
Earth
Sciences
Map
Reading
Total
No of
Items
8 8 4 NA NA 20
Item
Format
5 OBJ+3
Open
6 OBJ+2
Open
3 OBJ+1
Open
NA NA 14 Obj +
6 Open
Cognitive
processes
4 FK+3
UC+ 1R
5 FK+2
UC+ 1R
3 FK+1 UC NA NA 12 FK+ 6
UC + 2
RA
Stimulus
or text
3 Context
+ 5 Text
6 text + 2
Context
1 Context
+ 3 Text
NA NA 6 Context
+ 14 Text

37
c. In the case of maps and sketches, the symbols in the map and those in the legend had to be identical.
Places and objects should be clearly marked.
d. The material had to be intrinsic to the text, but at the same time it should not assist students to
understand the text (for instance, if the question is ‗match the animals to their homes‘, then a picture of
the animals in their respective homes should not be used as an illustration anywhere else.)
e. In many questions, where the text was getting to be too big, and the same could be explained through
an illustration, the latter was used as item context.
Developing the Blueprint for Math
The Format used for CAL baseline test blueprint is given below:
Strands or Aspect
(content domains)
No: of Items
Item Format
Cognitive processes
Stimulus or text
‗Strands/aspects‘ of the blueprint focus on skills/strands/competencies which must be assessed under the
identified content domain. The table below shows Math question distribution (across the 3 grades) for baseline.
Table 5a: Question Distribution in Math (Classes 3-5)
Content Domain No: of questions
Class 2 Class 3 Class 4
Number 7 6 6
Operations 5 8 7
Measurement 3 5 5
Money 1 1 1
Geometry 2 2 3
Data Handling - 1 1
Patterns 2 2 2
Total 20 25 25
Table 3 clearly shows that the number of items fixed for classes 2, 3 and 4 are 20 and 25 respectively. Of these,
over 50% of the questions in all the 3 grades are from ‗number‘ and ‗operations‘. This is because the early

38
stages of mathematics learning focus primarily on learning of numbers, writing numerals, number systems, basic
number operations, number representations, etc. Being of immense practical importance, about 20% of the tool
has items based on measurements. Patterns, data handling and geometry constitute the remaining 20% of the
paper.
Item format was of 2 broad types- objective-type and open-ended. Objective-type included multiple choice
questions (MCQs), match the following, etc. Open-ended items were those were students had to write out the
answers. A majority of the items in both Math and EVS were formatted in the multiple choice pattern, with 4
options for each question. The item format was such that it enabled the best possible assessment of a skill within
the estimated time. Making an item too difficult in representation not only increases the time of the test but also
adds to the complexity of the question.
The time allotment was such that for each MCQ, 2 minutes were allotted, while for each open question, 3
minutes were given. The purpose of this time allotment was to make an estimation of the approximate time that
should be given to answer the entire tool.
Question Distribution in Math cognitive domains
Table 5b: Mathematics Cognitive Domains expressed as a percentage as per baseline tools.
Cognitive Domain No of questions & ( %age)
Class 2 Class 3 Class 4
Knowing Facts and
Procedures
40% (8 items) 30% (7 items) 20% (5 items)
Using Concepts 20% (4 items) 25% (7 items) 20% (5 items)
Solving Routine
Problems
30% (6 items) 30% (7 items) 40% (10items)
Reasoning 10% (2 items) 15% (4 items) 20% (5 items)
Since a knowledge of facts and procedures forms the backbone of mathematical knowledge, close to 40% of the
items test the cognitive skills in this domain. The number of items on facts and procedures is considerably lower
in higher classes. The next predominant skills are problem-solving and nearly 30-40% of the items tested the
child‘s ability to solve routine problems. The remaining items tested reasoning.
A wide range of stimulus material was used in the Math paper. Stimuli used should ideally vary
according to the item and need to be logical, adding value to the item. In the Math tools, the stimuli used were
tables, calendars (for items on data handling), pictures of currencies (for items on money and solving routine
problems), geometric shapes and figures (for reasoning based questions as patterns). This will be shared in
greater details in the Math item development section.
Below is an example of a blueprint for grade three, Math paper of CAL baseline.
Strands or
Aspect
Social
Sciences
Life
Sciences
Physical
Sciences
Earth
Sciences
Map
Reading
Total

39
Leg
end
Key
Obj – Objective FK – Factual Knowledge UC – Understanding Concepts
RA – Reasoning and Analysis NA – Not Assessed
The total length of this test was estimated at 70 minutes.
2 mins per objective item- 2*26 = 52 mins
3 mins per open item- 3*4 = 12 mins
Total- 64 mins + 6 mins extra= 70 mins
This was, however, subject to change after field testing of tools.
Item Development & Scoring Guides:
Once the blueprint details are roughly spelt out, one enters the stage of item development, the next stage in
the tool development process. Each item caters to a specific strand of the curriculum and assesses a specific
skill/competency. These were outlined alongside the items. For each item, the item writer had to specify the
following-
1. What is its level of difficulty?
2. What is the content domain and competency?
3. Which specific cognitive skills are assessed?
4. Correct answer
5. Scoring guide
In principle, it is better to have a question bank - for instance, if the blueprint states that the tool will have 10
items on factual knowledge across 5 content areas, then it is preferable to have at least 15-20 such items. This
makes it easier to pick the best items for the final tool. Often, while one gets into item designing, some minor
modifications are made in the blueprint also. To a large extent, these changes occur in the item format – hence,
No of Items 9 9 6 3 3 30
Item
Format
8 Obj + 1
Open
8 Obj + 1
Open
4 Obj + 2
Open
3 Obj 3 Obj 26 Obj + 4 Open
Cognitive
processes
4 FK + 3
UC + 2 RA
5 FK + 2
UC + 2 RA
4 FK + 1
UC + 1 RA
2FK + 1
UC
3 UC 15 FK +10 UC + 5 RA
Stimulus or
text
5 Context
+ 4 Text
2 Context
+ 7 Text
4 Context
+ 2 Text
3 Text 3
Context
14 Context + 16 Text

40
instead of 5 multiple choice, one may have 10, but the number of items and percentage of cognitive processes
that are to assessed are not changed. For each item, an answer key and scoring guide is developed alongside.
ITEM DEVELOPMENT IN EVS
EVS in primary grades focus on the student‘s contextual knowledge of the natural and social environment. As a
subject, it strives to inculcate certain key skills in the students for them to lead an environmentally conscious and
socially responsible life. Assessment in EVS thus cannot be centralized with emphasis on one universally accepted
correct answer; the universe from which the child draws her response would vary depending on the child‘s
geography to that extent, assessment in EVS has to be sensitive to a child‘s context.
In the situation of a single tool of assessment for different states, as was the case for CAL baseline, one had to
be very cautious while framing items, because the children would be assessed across geographical locations. We
tried to address this diversity in several ways-
1. Firstly, the emphasis of assessment in EVS would be on the attainment of certain key skills rather than
on recall of mere content knowledge. As a subject, EVS is content heavy and as one approaches higher
grades, the content keeps getting denser with more and more facts being taught. The way we looked at
assessment was to breakthrough this over-dependence on content, and emphasize cognitive skills.
Hence even with a limited content we tried to frame a variety of assessment items targeting different
cognitive skills of the students.
2. Secondly, the issue of diverse responses from children residing in diverse geographical locations was
addressed through an answer key that was exhaustive and could encompass a variety of responses from
the child. Care was taken to involve locally available objects and uses in the key.
3. The tool did not incorporate too many questions on social science. Since EVS from grades 3 onwards
incorporates elements of social sciences also, the content gets skewed towards knowledge of all aspects
of one‘s district- its geography, climate, soil, vegetation, with no correlation between the different
aspects. As the baseline had to be conducted in 3 separate states and 3 separate districts, it was
difficult to frame questions keeping the state-specific requirements. Hence, questions pertaining directly
to districts were deliberately omitted. On the contrary, items that drew out the child‘s general perception
of the environment and specific scientific phenomena occurring in the environment largely formed the
basis of our assessment in EVS.
4. Unlike standard assessments in EVS, where a majority of the items can be answered by rote
memorization, the baseline papers targeted the child‘s understanding of concepts and capability to
reason scientifically.
Developing items for EVS was the most challenging part of tool development. To begin with, ours is a country of
rich cultural, natural and social diversity. Superimposed on it is the debate of whether EVS should limit itself only
to the child‘s immediate environment or it should extend beyond that. The other problem is that of language,
since EVS as a subject, is extremely language-intensive. Hence, a sound base of reading and writing is crucial to
EVS. The baseline tools were developed keeping the stated challenges in mind, and, at every stage, checks and
balances were imposed to overcome the hurdles.
Some of the principles that were followed in item development in EVS are as follows-

41
a. Importance of clarity in a question: The focus of an item is a critical aspect, especially in EVS wherein
the horizon from which the student draws inspiration to answer is as broad as the student‘s entire
environment. Hence, there has to be absolute clarity on why a certain question is asked and what the
responses that the assessor seeks to elicit from the examinee are.
For example, in a question such as ‗Which is your favourite fruit/animal/season?‘ it is not clear whether
the student is expected to write the name of the fruit/animal/season or is she also expected to reason
why she likes a particular fruit/animal/season. Also, if the question expects stating a reason as a scoring
criterion then will a reason such as ‗because the fruit is red in colour‘ or ‗because I like the fur on the
animal‘s body‘ or ‗because my birthday falls in this season‘, be accepted as a valid answer? These
questions have to be incessantly asked and answered in every item that is being developed.
b. Not limiting all questions to basic recall type: it was challenging to develop items testing understanding
and reasoning of concepts, since most state curricula define EVS competencies in a ‗to know‘ fashion.
However, the tool could not be restricted to basic recall questions. Even if it was a factual knowledge
question, it was restricted to mere recall. For instance, for the competency ‗to know the food habits of
domestic and wild animals‘, instead of having a straightforward question, such as name 2 animals that
eat flesh/grass/etc. the item was - which animal eats ONLY plants? A) cat b) dog c) lion d) rabbit
(Question , class 2, EVS baseline test, 08)
c. Content of reasoning questions - it is important to frame reasoning questions on content that a child is
exposed to. For instance for a grade 2 student it will be unfair to question ‗why do you think leaves are
green in colour‘ if the child is not exposed to the subject of plant morphology and presence of the
pigment chlorophyll, etc. This was taken care of while writing items for EVS, especially with a
heterogeneous geography.
d. Usefulness of tables: Tables are a good way of organizing information in science: hence, questions were
framed in this format. However, we were careful not to make the table too complicated in
representation, because it adds to the complexity of the question.
e. Scoring Guide: one of the most critical parts of EVS item development especially open-ended items is
the accuracy of the scoring guide. A scoring guide for EVS should be fairly exhaustive and provide scope
for incorporating dialectical and contextual differences. Hence, responses in the child‘s local language
must be considered correct. Details of the scoring guide will be discussed in subsequent paragraphs.
While designing items, some principles of writing good MCQ (multiple choice questions), were
adhered to. Some of these are discussed below-
{In a MCQ, the question is known as the ‗stem‘, the answer is known as the ‗key‘ and other options are known
as ‗distracters‘.}
‗Stem‘ related aspects:
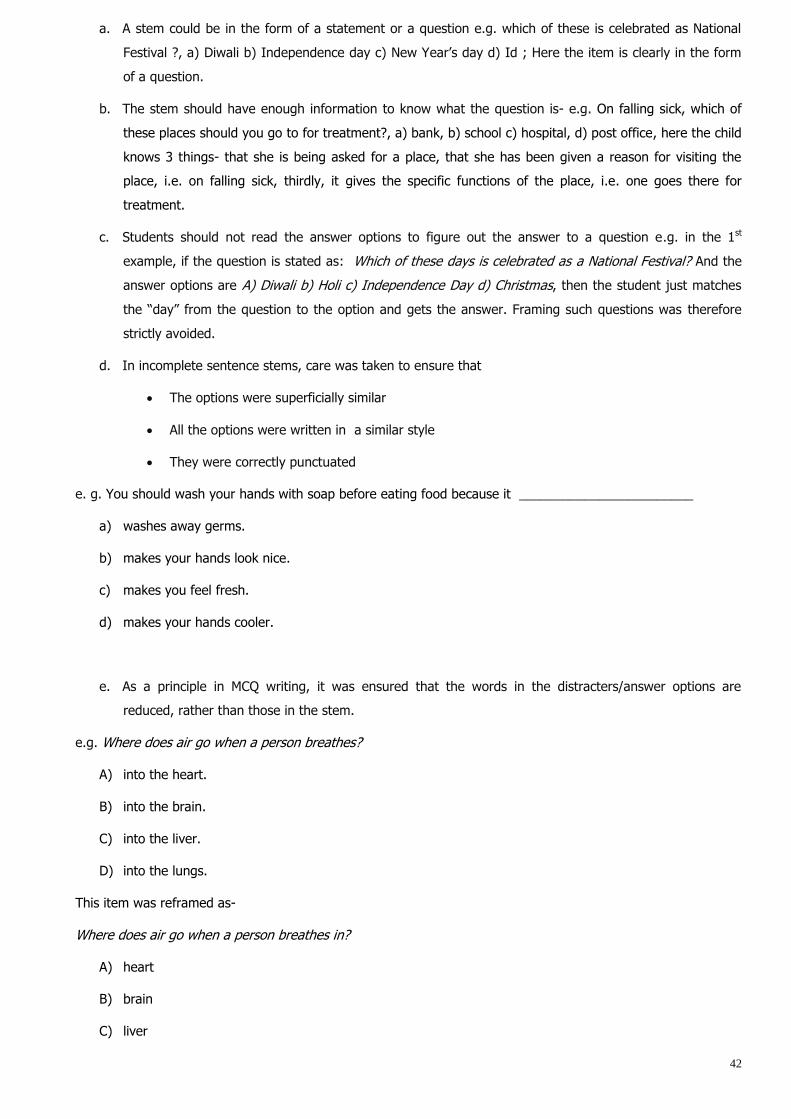
42
a. A stem could be in the form of a statement or a question e.g. which of these is celebrated as National
Festival ?, a) Diwali b) Independence day c) New Year‘s day d) Id ; Here the item is clearly in the form
of a question.
b. The stem should have enough information to know what the question is- e.g. On falling sick, which of
these places should you go to for treatment?, a) bank, b) school c) hospital, d) post office, here the child
knows 3 things- that she is being asked for a place, that she has been given a reason for visiting the
place, i.e. on falling sick, thirdly, it gives the specific functions of the place, i.e. one goes there for
treatment.
c. Students should not read the answer options to figure out the answer to a question e.g. in the 1st
example, if the question is stated as: Which of these days is celebrated as a National Festival? And the
answer options are A) Diwali b) Holi c) Independence Day d) Christmas, then the student just matches
the ―day‖ from the question to the option and gets the answer. Framing such questions was therefore
strictly avoided.
d. In incomplete sentence stems, care was taken to ensure that
The options were superficially similar
All the options were written in a similar style
They were correctly punctuated
e. g. You should wash your hands with soap before eating food because it ________________________
a) washes away germs.
b) makes your hands look nice.
c) makes you feel fresh.
d) makes your hands cooler.
e. As a principle in MCQ writing, it was ensured that the words in the distracters/answer options are
reduced, rather than those in the stem.
e.g. Where does air go when a person breathes?
A) into the heart.
B) into the brain.
C) into the liver.
D) into the lungs.
This item was reframed as-
Where does air go when a person breathes in?
A) heart
B) brain
C) liver

43
D) lungs
f. Negative stems should ideally be avoided; however, if used, they were in bold or italics – words as ‗not‘
or ‗cannot‘ or ‗only‘ are referred to as negative words in stem-
e.g. Which of these would be unavailable if all farmers stop working?
a) jewellery
b) shoes
c) utensils
d) food grains
Distracter related aspects:
a. The correct answer should not be very obvious.
b. Creating patterns of key answers (distracters) across the entire tool is important. It is important to vary
the key (i.e. correct answer) locations and also to avoid always using the longest or the shortest key as
the answer.
There should be no possibilities of identification of the correct answer on the basis of length of
the option or any such factor.
c. In a MCQ with four distracters, care needs to be taken that 3 or more distracters should be indisputably
incorrect, while being reasonable or plausible at the same time; also, absurdly wrong distracters reduce
real choice.
d. Avoid one distracter being a subset of other distracters; for instance, ‗Public transport, Bus, Walk and
Cycle‘ should not be the four distracters because bus is a sub-set of public transport
e. Not to have half correct answers as distracters
f. Using distracters that mean the same as multiple options should be avoided, because it reduces the
choice for the students.
For example, ‗weight is lost‘ and ‗body gets lighter‘ mean one and the same.
g. In the field trial the percentage of students who choose the various distracters should be analysed and
those distracters that no student chooses should be left out, because they are obviously poor distracters.
Short open-ended items: These items are those where the student has to write down the answer in her own
words, which could range from writing down one or 2 words to sentences and essays. These types of questions
were used more in EVS as compared to math. Such questions should be clearly focused and well articulated so
as to elicit the skills they intend to assess.
In such questions, the role of a well-articulated and descriptive scoring/marking guide becomes of paramount
importance. Such items should ensure the plausibility of incorrect answers.

44
Suppose the objective of an item is to assess the usefulness of trees for human existence. A question framed for
this purpose could be - ―Why should we have trees around our house?‖ A whole range of answers is possible for
the above question such as:
a. To get fresh air
b. To make our surroundings beautiful
c. So that we can play in their shade on hot afternoons
d. So that we can get fruits from them
Except for the first, all the other answers are not the answers expected by the developer. However they are all
valid and correct responses to the question that has been asked. It will be unfair to mark the first response as
correct and all the others as incorrect. In such a situation it becomes clear that the question is not pointed
enough and thereby is unable to test what it intends to test.
The above example illustrates how thinking of all possible correct answers helps validate the question as well.
Also it makes one understand that a question should not be so broad that any answer to it could be right
answer. In preparing the scoring guide for open questions, it is thus important to give some examples of correct
and incorrect answers. It is important to do this so that the inter-rater subjectivity in scoring is reasonably
reduced.
Thus preparation of a marking/scoring guide can take the following aspects into consideration:
a. A marking guide should be so exhaustive that once done, this should be applicable for all regions in a
country
modifications as per the local needs can be done to suit the requirement
b. Extensive training is a must to train markers
In the marking guide, the scoring criterion should be made as clear as possible, so as to render it
close to answers actually observed.
It should meet the criteria of feasibility. It should be possible to use it without getting confused.
If there are too many conditions for marking an answer right or wrong it could adversely affect
the reliability of the item.
Partial credit questions
In developing partial credit questions, one must ensure that there is a valid basis for partial credit in the item. A
partial credit question is one wherein responses can be categorized as fully correct and partially correct and
marked accordingly.
One easy possibility of a partial credit question is an item having more than one answer parts. For example,
‗write any 2 uses of water‘.
This can be a two-point question with one point for each use. If two uses are given, a student gets two points
and is considered fully correct and for one use there is a partial credit of one point awarded to the student. Such
items have been widely used in the baseline papers for EVS.

45
ITEM DEVELOPMENT IN MATH
A majority of the items in mathematics were of the multiple choice pattern with a couple of options for each. The
questions had been designed in such a way that selecting any of the answer options as correct would give some
hint of the error made by the student, e.g. an item on 2-digit-carry-over addition in class 2 paper was as follows:
Solve: 28 + 14 =?
A) 312
If the child ticks this answer it shows that the child knows single digit addition without carry over, adds 8+4=12
and 2+1=3
B) 321
If the child ticks this answer it shows that the child knows single digit addition without carry over, adds 8+4=12
and 2+1=3 but interchanges place value of 12 and writes it as 21.
C) 42 Correct answer
D) 96
If the child ticks this answer it shows that the child adds 8+1=9 and 4+2=6. Thus, this child does not
understand the relevance of place value in the addition of 2 digit numbers.
Though the multiple options are designed such that they may give some diagnostic feedback on the kind of the
error made by the student, it may, however, happen that the child ticks any one of the options through mere
guesswork. In such a case, it is not advisable to be conclusive of the child‘s error and only when one sees a
pattern in the child‘s errors should the assessor be conclusive of the child‘s learning need.
To ensure this, the Math items were designed in such a way that some of the common errors made in Math
(such as interchanging place values, omitting the carry over in addition, subtraction with 0, etc.) have been
incorporated as answer options in the MCQ type of questions.
In MCQs with four distracters, pairs of 2 have been formed, e.g. in the question below, the jars have been paired
on the basis of their height:-
Raju is fond of milk. He wants to choose the glass containing the maximum amount of milk. Which glass should
he choose? (Tick the correct glass)

46
(A) (B) (C) (D)
In most problems, the materials used in the items are those used by the child, such as pens, paper, fruits,
utensils, etc. Together with a familiar context, the language of the paper has been kept very simple.
Scoring guides have been detailed for open ended items. These are in the form of ‗fill in the blanks‘ and solving
number operations. The scoring guides have been detailed out such that they indicate the nature of errors.
Separate letter codes have been allotted for different errors, e.g.
Fill in the blank:
3 + 3 + 3 + 3 +3 = 3 x
Correct answer
Record as A when answer is 5
Incorrect Response (0 pt)
Record as C1 when answer is 15 (sum of the Right Hand Side 3‘s)
Record as C2 when answer is 18 (sum of all the 3‘s)
Record as C3 when answer is 6 (number of all the 3‘s)
Record as C4 for any other wrong/irrelevant answer
Record as D for unattempted/blank (NA)
Panel Review of tools:
Once the items are developed and the best ones are selected, they are organized as per content areas or
cognitive areas - or on some other agreed-upon principle. The tool is then presented to a panel for review.
Reviewing is based on the following parameters-
a. Is the right content being assessed?
b. Is the item format appropriate?
c. Is the item substantive?
d. Is the wording clear?
e. If it is a multiple-choice-question, is the correct answer clear?
f. Is the scoring guide exhaustive?
The feedback from the panel of reviewers is consolidated and suitable modifications are then made in the paper.
The tool is then finalized and ready to be translated into the respective state language.

47
Validation of the Competency-based Achievement Test in Math and EVS:
As part of an institutionalized process, once the 1st draft of tool was ready, the items for both Math and EVS
were presented to a panel for review and critique. The idea was to share them with members external to the
entire process and other item developers, who could establish the reliability of the item, by scrutinizing each item
on the basis of various parameters. The panel looked into aspects such as:
g. Is the right content being assessed?
h. Is the item format appropriate?
i. Is the item substantive?
j. Is the wording clear?
k. If it is an MCQ, is the correct answer clear?
l. Is the scoring guide exhaustive?
In the baseline test papers, the review panel consisted of members from-
1. Academics and Pedagogy Team
2. Members of LGP states, involved in tool development
3. Members of CAL states where the test would be administered.
4. Experts at ACER , Australia
The mechanism followed for review was as follows: the papers and other associated documents were sent to
members through email, and they were requested to:
a) review the frameworks and blueprints
b) Review the items and answer keys
c) Suggest plausible changes
Once all the members responded, the necessary changes were made and the tools were finalized for translation.
Principles of Tool Translation-
To ensure comparability of data across geography, it is imperative to have a standardized tool and a uniform
standardized process of test administration. Uniformity in test items, scoring guides, evaluators‘ training and test
execution are some of the processes that need to be streamlined and standardized.
For CAL baseline test, the tools were made in English, since the language is easily understood and later
translated to the respective regional language, namely Oriya. [Tool translations should preferably be done by
those who have some idea of school systems and classroom processes.]
Tool translation was a critical part of the tool development process. For baseline tools, a tool translation
workshop was organized in Bangalore where 1-2 members from each state team together with a resource
person (fluent in typing in the state language) came together to translate the tool. During tool translation, the
following principles were adhered to:
a) The tool should not be transliterated. It should not be a word-by-word translation. Translators had to
capture the spirit or essence of the question while translating it.

48
b) The language of the tool had to be kept simple, easily read and understood by children. Use of terse and
verbose textbook language was strictly avoided.
c) Text on all stimulus material, like maps, sketches, pictures, etc was also translated in the state language.
d) A thorough proof checking of the paper was done to ensure absence of grammatical and technical errors
in the paper.
e) Since the paper would be administered across all 3 states, all the items were translated uniformly. There
was absolutely no room for elaboration or reduction of text, change of illustrations, change of answer
options, key, etc. across states.
Tool translation and proof-reading marked the end of the 1st cycle of tool development.
This leads us to the next and very vital stage of tool development, i.e. field testing. The next section deals with
some basic principles of field testing, its implications and how it manifests in the baseline tool development
process.
Field Testing of tools:
Once the paper is translated into the state languages, the tool is field tested for further validation of the tool.
This is a very detailed process. The field test data is statistically analyzed and all necessary refinements are
made in the tool. The tool is then finalized and ready for printing.
1. Three schools that were not a part of the research schools - i.e. that were neither experimental nor
control schools - were selected for field testing.
2. These schools were informed in advance about the field test and its objectives.
3. Necessary arrangements were ensured: such as adequate photocopies of question papers, stationery
(pencils, erasers) were procured.

49
4. A manual of guidelines (on do‘s and don‘ts of evaluation and processes to be followed while conducting a
test) had been prepared and shared with the state teams. These processes had to be implemented
during the field test.
5. All members administering the field test had to go through the question papers thoroughly before the
field test.
The field test was designed to capture data in three ways-
a) Through a written test for students of grades 3, 4 and 5 in the chosen school: The tool was administered
by field members of respective states. All the processes that would be followed in the final testing were
also followed while field testing. This test gave us data to fine tune our processes of tool administration
and it also provided data in the form of student responses which was statistically analyzed for individual
item refining.
b) Through Child interviews- after the students completed the written test, the answer sheets were scanned
by the field members. Students who had 60% or more of their answers incorrect or not attempted were
selected from each class. About 4 students were picked from each class (namely the lowest rung
performers) and their feedback was sought on every item. The students were asked several questions
pertaining to the tool such as, ‗why have you answered this (ticked by the student in the paper)
particular option?‘ ‗What do you understand by the question?‘ ‗Is there a word in the paper that you are
unaware of?‘ ‗Are the pictures clear?‘ The purpose of these interviews was purely to gather data on the
qualitative aspects of the tool. By design, these interviews were informal in nature and the interviewer
was free to modify the sequence of the questions, or alter their wording and engage with the child in a
conversational style. The basic objective of this interview was to get qualitative feedback from children
on the questions given.
c) Through Teacher Feedback- the papers were shared with a group of teachers belonging to the school
where the test was being conducted. Their feedback focused more on content appropriateness of the
items for the respective grades and language/vocabulary of the paper. Mostly teachers commented on
the use of very simple language in the paper. They suggested that the language should be more terse
and written in the style of the text books.
In a workshop, the qualitative data was discussed and certain changes were made in the tests.
The correct key was shifted to option B, C, or D. This was done to minimize the effects of
guesswork since it was observed that most students ticked option A for all MCQ items. However,
in 1 or 2 items the correct key was the 1st one.
In math, some of the numbers in a few items were changed. E.g. the question
The number closest to 550 is The number closest to 500 is
A) 499 a) 449
B) 445 b) 445
C) 545 c) 499
D) 505 d) 505

50
The question was modified from ‗number closest to 550‘ to ‗500‘ because most students got confused with the
number 50; also, 500 would be easier for students to answer. However, to maintain the level of difficulty of the
item, the answer option 449 was introduced in place of 545. This was in order to introduce a strong distracter in
the item.
Hasan‘s mother gave Hasan 27 biscuits. Sudha, Hasan and Saniya shared them equally. How many did each get?
A) 30
B) 27
C) 9
D) 8
Here, ‗27 biscuits‘ was changed to ‗18 biscuits‘. While conducting the child interviews, many students said that
they got the correct answer i.e. 9, by adding the 2 digits 2+7=9. In order to avoid that, the digit 27 was
changed to 18. With ‗18 biscuits‘ the answer would be 6, but if children added 1+8=9, the sum would be
incorrect. Hence, 9 became a very strong distracter in this item.
Hasan‘s mother gave Hasan 18 biscuits. Sudha, Hasan and Saniya shared them equally. How many did each get?
A) 18
B) 9
C) 8
D) 6
Changes were made in the language of some questions too.
Then the test was ready for use.
This in a nutshell, is the process of tool designing that had been adopted for the CAL baseline test.
(c) Teacher’s attitude & self-efficacy
Perceived self-efficacy is defined as people's beliefs about their capabilities to produce designated levels of
performance that exercise influence over events that affect their lives. Self-efficacy beliefs determine how people
feel, think, motivate themselves and behave. Such beliefs produce these diverse effects through four major
processes. They include cognitive, motivational, affective and selection processes. (taken from V. S.
Ramachandran (Ed.), Encyclopedia of human behaviour (Vol. 4, pp. 71-81). New York: Academic Press.
(Reprinted in H. Friedman [Ed.], Encyclopedia of mental health. San Diego: Academic Press, 1998).
The sense of self-efficacy was a tool that was used in other studies of the Foundation. This was a 5-point rating
scale covering the following areas:
Beliefs about Ability to Learn

51
Only some children are capable of learning All Students are capable of Learning
( Score of 1) (Score of 5)
Beliefs about nature of knowledge
Is Uni-dimensional and simple Is multi-dimensional and complex
(Score of 1) (Score of 5)
Beliefs about Classroom discipline
Silence is a sign of discipline Silence is not a sign of Discipline
(Score of 1) (Score of 5)
Beliefs about teaching as a profession
Teaching is just a job Teaching is a profession
(Score of 1) (Score of 5)
a) (ranges from: teaching as a job (a score of 1) to teaching as a profession (score of 5)
Another dimension was added to this scale. This was the approach to pedagogy.
Beliefs about approach to pedagogy
Teacher-Led Approach child-focussed approach
(Score of 1) (Score of 5)

52
(d) ICT Tool
In addition to these, in E1 schools, a baseline on ICT skills of teachers was also administered. The tool was
adapted from those developed by Singapore International Foundation. The tool was translated into Oriya, and
used. It did not undergo any validation. The tool asks teachers to say whether they know basic operations of the
computer, word processing, spread sheets, multimedia presentations, internet, email, and data collection tools.
Each of these has several sub-items. This tool was administered only to E1 school teachers. [Refer Annexure 3
for ICT teacher tool.]
Administration of the Tests: Baseline Survey
The baseline survey was a co-ordinated effort led by the Foundation team in Orissa in collaboration with college
volunteers. It was a two-phase exercise consisting of:
i. the deployment of a Reading Ability Test (RAT) and that of
ii. a Competency Achievement Test (CAT).
The RAT tested reading and comprehension abilities of students and the CAT tested their learning levels in
Maths and EVS.
Volunteers (students of the BA (education) programme) were selected and trained in the use of the tool. The
training was for a period of two days. In the training, a lot of emphasis was given to familiarizing the evaluators
with the Foundation‘s idea of child-friendly evaluation. These were also coupled with mock evaluation sessions
and sessions on reading the questions.
It was decided to administer the Math test by having the volunteers read out the question.
The rationale for this was to emphasize Math / EVS achievement and so rule out (to the extent possible) the
influence of language on Math / EVS achievement.
The emphasis was on reading each question slowly, loudly and clearly.
No clue was to be given either through stress or intonation, about the right answer.
The answer key was then prepared.
The CAT was administered to children from 19th to 24th December, 2008.
Volunteers were then trained to score the answer sheets. Since the answers particularly for EVS were
qualitative, the training of volunteers to code the answers was rigorous.
Transcription sheets captured the following:
Basic details (name, caste code, gender, roll no:) of each student. [This information is available from the
answer scripts.]
answer option ticked by student for multiple choice questions
codes for open-ended items
answers for both subjects, Math and EVS were transcribed on the same sheet
Transcription was also conducted in 2 ways- one school was assigned to each volunteer at a time. Papers of
students were arranged as per their roll numbers. Each student‘s Math and EVS papers were transcribed at the

53
same time on the same sheet. This was followed for all students of the school. Once the volunteer transcribed all
the papers of a school, he/she moved on to the next school bundle.
The second way was as follows - the volunteers were divided into pairs: while one person read the answer
codes, the other person wrote the answers in the transcription sheet. This strategy was devised to save time and
ensure accuracy.
Several challenges were faced in coding the answers.
Challenges in Coding –
The entire CAT process was planned and co-ordinated well. However, due to the nature of the work, there were
several shortcomings in the work that led to unnecessary delay and hardships for team members. Some of the
problems faced are stated below-
1. Volunteers selected for CAT coding were mainly graduates, with no experience in education (in most
cases), hence they failed to understand the basic idea of the answer keys.
2. In most cases, glaring errors were made, like marking children with code A, when the answer is a wrong
one and vice versa
3. Despite repeated warnings, volunteers continued to make mistakes in coding
4. Instead of reading the entire descriptor for a particular code, volunteers simply matched words in the
answer keys with the answer written by the child. This led to erroneous coding on a large scale for
instance, for a question that demands an estimate, e.g. an answer that says ―too many/excess
houses/huts‖, even if the child merely wrote ―huts‖, the volunteers marked it as fully correct, giving the
argument that the child‘s answer has ‗huts‘ and hence, it is correct.
5. As the volunteers were not fully inducted into the process of tool development, they failed to understand
the spirit of the questions, and in most cases, got confused with the instructions, e.g. why should the
name of a vegetable be considered a ‗wrong answer‘ when the picture in the paper has vegetables, (the
question being name any 2 fruits that you see in the picture?), e.g. When a picture of vegetable is given
and the question asked is name any 2 fruits that you see in the picture?, the volunteers failed to see why
the naming of a vegetable was a ‗wrong answer‘.
6. Due to repeated errors being made by the volunteers, enormous time was spent in checking their
mistakes. This led to over-burdening of some members.
The CAT deployment followed a similar process as the RAT with the exception of the data collection activities
about teachers. The CAT tools tested children's competency levels in different domain areas of Mathematics
and EVS in order to isolate specific areas of deficiency for remedial action.
Please refer to Annexure 2 for tabulated results of the CAT.
Deployment of tools
The RAT was deployed in August 2008 after extensive field-testing. Volunteers were trained to conduct
interviews, administer questionnaires and assessment tools, collect and verify data. They were asked to adopt a
child-friendly demeanour at all times, the elements of such a demeanour being outlined in the training. A

54
detailed schedule, enrolment, attendance and teacher information forms, question papers and formats, teacher
perception questionnaires and interview formats were issued to them. The volunteers were meant to:
1. Collect student enrolment data of the school
2. Collect teacher data of the school
3. Take attendance of the students present
4. Conduct the interviews of teachers
5. Administer the self-filling teacher attitude questionnaire
6. Conduct child-friendly activities to lighten the atmosphere in the classroom
7. Administer the reading passages to test reading, inference and comprehension abilities of students
8. Collate and verify the data collected
Results & Discussion
Reading Ability Test
About 2531 students were tested for their reading ability. The data was analyzed for accuracy rate and levels of
comprehension.
Calculation of the Accuracy Rate: Accuracy rate is usually expressed as a percentage. The formula for
computing accuracy rate is:
(Total words read – Total errors) / Total words read x 100 = Accuracy rate
In many reading programs, (for instance, the A-Z reading program), the criterion for an acceptable accuracy
level of reading is 89%. The level is in correspondence to the difficulty level of the text. If children read at
accuracy levels below 89%, then the text is seen to be difficult for students. A perusal of data showed that the
number of students who are able to read at an accuracy level that is 89% or more are few. So the cut off point
was arbitrarily kept at 80%.
Calculation of comprehension level: Each correctly answered question was given a score of 1. The
percentage of the total number of correctly answered question was taken to be indicative of the comprehension
levels. Since the comprehension level for the three types of questions – retrieval, interpretive and reflective did
not differ much, the overall comprehension level has been taken up for discussion.

55
Results
Above 80% Below 80%
0
10
20
30
40
50
60
70
Reading abilities of Students in E1 Schools All Classes
Above 80% Below 80%
0
10
20
30
40
50
60
70
Reading abilities of Students in E2 Schools All Classes
% of students able to read
Comprehension level (in %age)
% of students able to read
Comprehension level (in %age)

56
A comparison of the three graphs shows the following:
There are slightly fewer students who are unable to read in E1 schools (29.71%) compared to students
in E2 and control schools (36% in E2 schools and 35% in control schools)
Students who are able to read with fewer errors (that is accuracy above 80%) show a slightly higher
comprehension level than students who show low accuracy levels in the E1, E2 and Control schools.
Students have a low comprehension level, irrespective of levels of accuracy, in all the three groups of
schools.
These results show that students by and large read with very little understanding. They basically decode the
letters and words. Our classroom observation also shows that the emphasis is on decoding rather than teaching
for understanding. Let us now turn our attention to each class separately. (Detailed results have been tabulated
in Tables 9 to 12 in Annexure 2.) Scrutiny of the detailed data shows the following:
There is very little difference between E1, E2 and the control group of schools both in the ability to read
and comprehension levels.
Students who are able to read at higher levels of accuracy show more comprehension compared to
students who read at lower levels of accuracy. This trend is visible across all classes.
As students go from class 3 to class 5, their ability to read increases and correspondingly the number of
students who are able to read at higher levels of accuracy also increases.
The result throws up a very interesting relationship between ability to read with accuracy and the
comprehension. As students progress in class, they show increased ability to read, but there is a marked
and gradual decrease in comprehension.
This finding underlines the fact that in schools the emphasis in language teaching is on the ability to read words.
There is almost no emphasis on comprehension. Consequently, students are able to read but without
comprehension.
Above 80% Below 80%
0
10
20
30
40
50
60
70
Reading abilities of Students in Control Schools All Classes
% of students able to read
Comprehension level (in %age)

57
In order to scrutinize the reading abilities of children school-wise, data has been tabulated in Tables 11 and 12 in
Annexure 2. This analysis is done only for E1 and E2 schools. The purpose of this analysis was to base
decisions on the type of inputs and extent of support to be given to schools.
The data (refer table 11 in Annexure 2) shows that more than 50% of students in 95% schools are
able to read. There is only one exception, i.e. Sarankul PUPS.
If we look at the accuracy levels, in 70% schools, more than 50% students are able to read with high
levels of accuracy. The 6 schools highlighted in the same table form the 30% where many students are
not able to read accurately.
Competency Achievement Test in Math
The answer sheets were first marked for the response categories of (a) correct, (b) partially correct, (c) wrong,
and (d) not attempted. Then the percentages were obtained by using the total for content and cognitive
domains.
The results so obtained have been presented and discussed here, across classes (3, 4 and 5) and types of
schools (E1, E2 and C).
For ease of reading, the graphs have been presented here, with tables 13 to 18 collated in Annexure 2.
Class 3 Class 4 Class 5
0
10
20
30
40
50
60
70
Math: Achievement in content domains
Percentage of correct answers
Classes
Pe
rce
nta
ge
Number Sense (Number & Opera-tions)
Patterns
Measurement

58
E1 E2 C
0
10
20
30
40
50
60
70
Math: Achievement in content domains
Percentage of correct answers
Type of School
Pe
rce
nta
ge
Number Sense (Number & Opera-tions)
Patterns
Measurement
Class 3 Class 4 Class 5
0
10
20
30
40
50
60
70
80
Math: Achievement in cognitive domains
Percentage of correct answers
Classes
Pe
rce
nta
ge
Knowledge of facts and procedures
Conceptual Un-derstanding
Solving routine Prob-lems
Reasoning

59
The Math graphs show the following:
A comparison of the 3 groups (E1, E2 and C) shows that achievement in Math content domain is more or
less similar across all groups.
As students go from class 3 to 5, their achievement in patterns and measurement drops. The overall
achievement in Math reflects this decrease.
As students go from class 3 to 5, the percentage of wrong answers increases in class 5 in number,
patterns and measurement but not in operations. (This is clear in the tabulated data in Tables 13 to 18
in Annexure 2.)
When we look at the cognitive domain, one can see a drop in performance in questions relating to
knowledge of facts and procedures in class 4, whereas in questions requiring conceptual understanding
and reasoning, there is an increase.
In class 5, students have found questions requiring conceptual understanding and reasoning difficult.
Competency Achievement Test in EVS
The achievement level of students in 4 content domains – Social science, Life Science, physical science (for the
three classes) and Geography/Earth Science (for class 4 and 5) is presented here. The tables show the
percentage of correct answers for each content domain under various response categories, namely, Correct,
Partially Correct, Wrong and Not Attempted. The performance of students in the three cognitive domains: factual
knowledge, conceptual understanding and reasoning is also given. This analysis considers only the percentage of
correct answers.
The total number of students tested on EVS was 4369. There were very few absentees in the three classes.
E1 E2 C
0
10
20
30
40
50
60
Math: Achievement in cognitive domains
Percentage of correct answers
Type of school
Pe
rce
nta
ge
Knowledge of facts and procedures
Conceptual Un-derstanding
Solving routine Prob-lems
Reasoning

60
Class 3 Class 4 Class 5
0
10
20
30
40
50
60
70
EVS: Achievement in content domains
Percentage of correct answers
Classes
Pe
rce
nta
ge
E1 E2 C
0
10
20
30
40
50
60
EVS: Achievement in content domains
Percentage of correct answers
Type of school
Pe
rce
nta
ge
Social Sciences
Life Sciences
Physical Sciences
Geography
Social Sciences
Life Sciences
Physical Sciences
Geography

61
The above graphs (and corresponding tables 19 to 24 in Annexure 2) show the following:
The maximum overall achievement in EVS has increased marginally from class 3 to 5.
The 3 groups of the Study do not differ in their achievement levels in any of the classes: 3, 4 or 5.
This pattern is uniform in all the content domains.
The achievement level in EVS centres around 42 to 51% – which is an average performance.
In all the 3 classes, students can broadly be divided into two groups, on the basis of their response
categories – the right and the wrong.
Class 3 Class 4 Class 5
0
10
20
30
40
50
60
70
EVS: Achievement in cognitive domains
Percentage of correct answers
Class
Pe
rce
nta
ge
Factual Knowledge
Conceptual Understanding
Reasoning
Factual Knowledge
Conceptual Understanding
Reasoning
E1 E2 C
0
10
20
30
40
50
60
70
EVS: Achievement in cognitive domains
Percentage of correct answers
Type of school
Pe
rce
nta
ge

62
In the 3 classes, and in the 3 types of schools, students achieve more in questions dealing with factual
knowledge than in questions that require reasoning and analysis.
Tables 14 and 20 in Annexure 2 show that in no school does the average achievement in either Math or
EVS cross 60%. In fact, in 75% schools (highlighted in the table) the average achievement level in Math as
well as in EVS is below 50%.
The achievement level in E2 schools reflects the same picture (see tables 14 and 20 in Annexure 2). The
difference is only in detail.
In Math, in 80% schools the average achievement is below 50% while in EVS, 65% schools achieve below
50%.
From these results the inferences are:
There is almost no difference in reading ability, Math and EVS achievement between E1, E2 and
Control schools.
In 95% schools, more than 50% students are able to read.
In 83% schools, more than 50% students are able to read - at 80% and above accuracy levels.
In 100% schools, the total average comprehension level is within 50%.
As students go from class 3 to 5, their reading ability increases, but their comprehension level
decreases.
The average total achievement level in Math and EVS does not cross 60%.
In math, as students go from class 3 to 5, they have difficulties in patterns and measurement and in
the cognitive domain of conceptual understanding and reasoning.
In EVS, they do not seem to have any problem in any of the content domains; but performance in
reasoning questions is poor.
All these together suggest that the pedagogy in these schools does not focus on non-rote learning. In reading,
the emphasis is on decoding skills. As students go to higher classes, they master the decoding skills but are not
taught comprehension strategies. This explains the decrease in their comprehension levels.
In Math and EVS, the achievement level suggests that there is ample scope for increasing the achievement level.
More importantly, here too, the focus of teaching is on solving routine problems and knowing facts and
procedures. So students answer without understanding. But when questions demand reasoning and analytical
skills, students perform poorly.
TEACHER RESULTS AND ANALYSIS
Sense of Self-efficacy in Teachers: The self-efficacy scale is five point rating scales ranging from strongly
disagree to strongly agree. The items were bunched according to their dimensions. Then the data were
subjected to two kinds of analysis:

63
a) The ratings for each dimension were averaged to see whether the E1, E2 and Control groups differ in
their attitude.
b) The general tendency is to give politically correct answers. To address this issue, at least in an indirect
way, the conviction with which teachers expressed their beliefs were also computed. The number of
times teacher gives a score of 5 to a dimension was taken for this purpose.
The results of teacher‘s sense of self- efficacy are presented in the table below:
Table 6: Average of expressed sense of efficacy of teachers
Types of
Schools
Approach to
pedagogy
Nature of
knowledge
Ability to
learn
Silence as
discipline
Teaching as a
profession
E1 3.58 2.53 3.21 3.68 3.68
E2 3.68 2.73 3.25 3.56 3.71
Control 3.43 2.63 3.26 3.70 3.63
Table 6 above shows that there is almost no difference in the sense of self-efficacy felt by teachers in the E1, E2
and control schools.
On 4 dimensions, (except nature of knowledge) most teachers are sitting at a midrange.
On the nature of knowledge, most teachers believe that knowledge is simple and unidimensional. In fact, this
view is reflected in their classroom teaching also – where they do not give multiple learning experiences to
students, believe that giving the right answer means that the child has understood the problem, etc.,
Do teachers in E1, E2 and Control school differ in their conviction in the expression of self-efficacy? In order to
answer this question, the second analysis was done.
The findings have been presented in the table below:
Table 7: Conviction with which self-efficacy was expressed in E1, E2 and Control Schools
Type of
school
Number of
Teachers
Approach to
pedagogy
Nature of
learning
Ability to
learn
Class room
Discipline
Teaching as a
profession
E1 110
Teachers
100% teachers on 54.42%
statements
80% teachers
- 20.33%
86% teachers on 29.80%
statements
66% teachers on 52.32%
statements
90% teachers on 39%
statements
E2
123 Teachers
100% teachers
on 56.45% statements
82% teachers
on 22% statements
82% teachers
on 34.34% statements
69.92% teachers on
70.15% statements
90% teachers
on 39.30% statements
Control
81 teachers
96.30%
teachers on 49.82%
statements
79% teachers on 22.75%
statements
86.42%
teachers on 33.12%
statements
71.60%
teachers on 55.17%
statements
94% teachers on 39.14%
statements
Table 7 underlines the finding that teachers in E1, E2 and Control schools do not differ in the extent of conviction
expressed by them.
Most teachers strongly believe in child-focused approach to pedagogy. They also strongly believe that silence is
not a sign of discipline.
Most teachers believe - to some extent - that teaching is a profession that has its own body of knowledge, taking
responsibility of learning of students, peer mentoring of younger teachers, etc.
Most teachers believe - to a small extent - that all children are capable of learning and that the nature of
learning is complex. For School-Wise Results refer Table 28 in Annexure 3.

64
The results of the analysis on teachers' attitudes revealed the following (Please refer to Table 27 in Annexure 3
for tools):
Teachers gave an average rating of 3.5 on all the above sections of questions, indicating a trend of
agreement with the statements listed. This displays an overall positive attitude towards teaching,
learning and discipline.
In the section about nature of knowledge, the rating was consistently lower, hovering at around 2.5.
This indicates a curtailed view of knowledge as a finished good, certified by authority and closed to
investigation and interpretation.
In terms of conviction, the ratings on statements about classroom discipline have a very high conviction
while the ratings on statements about the nature of knowledge and ability to learn have the lowest
conviction rates. This indicates that teachers have a limited conception of knowledge and do not believe
that all children are capable of absorbing such knowledge. The two are, in fact, related - the many
different ways of knowing what children are capable of remains unrecognised, due to the belief that
knowledge is only valid if it is encoded in language that is sourced from a textbook.
The school-wise result is in line with the overall results for self-efficacy.

65
Results of Teachers’ Survey and ICT
The results show that knowledge of word processing is the maximum, followed by knowledge of basic operations
and spread sheets. In general, very few teachers have knowledge of technology.
Let us take a look at the school-wise data (see table 26 in Annexure 3). School-wise, the results show that 100%
teachers in 40% schools have some knowledge of computers. Teachers in 20% schools have no knowledge of
computers. (Sanapandusar, Gopinathpur Sahi PUP School, Kandhanayagarh, Model Primary School,)
1 teacher has a very good knowledge of technology (100%) and 1 teacher 50% knowledge of technology.
It must be pointed out that the baseline data was collected in June-July 2009 – when the training on computers
had already begun.
The baseline data were used for three purposes.
a) To document the prevailing status
b) To provide the backdrop and inputs to the Teacher Development Interactions.
c) To become the basis for providing need-based on-site support.
For instance, the finding on reading abilities and Math was used to build vision of teachers in TDI. The finding
that students read without comprehension was focussed and the Teacher development interaction discussed
with teachers the different ways in which comprehension can be explicitly taught. In on-site support, teachers
were facilitated to develop interpretive and reflective questions, plan for teaching for comprehension etc., In
Math also a similar approach was followed. The finding that the average achievement in Math is low was flashed
and discussion centred on the reasons for this. The emphasis on teaching algorithms, the non-use of different
learning experiences etc., were brought out. In on-site support, teachers were engaged in a discussion and
facilitated to develop learning experiences designed to provide different learning experiences to students.
Basic Operations
Word Processing
Spreadsheet
Multimedia presentations
Internet
Use of Data collection tools
0 2 4 6 8 10 12 14
Knowledge of IT
Percentage of Teachers
Percentage
Te
ch
no
log
y s
kills

66
Teacher Development Interaction (TDI) and On-Site Support
Computer aided learning sees teacher as central to technology. A teacher has to be empowered and enabled
both technologically and pedagogically if she/he has to use technology effectively. So ―training‖ of teachers is
key. The training of teachers takes on these two forms: in a centralized location – called the Teacher
Development Interaction. Here teachers are introduced to the pedagogy.
‗At-school points‘ – called ‗on-site support‘ – where teachers are given need-based support that deepen their
understanding of technology and pedagogy enabling them to take their learnings forward.
As pointed out earlier, the results of the baseline provided the starting point as well as the direction for the on-
site support and the TDIs.
The framework for TDI has been drawn from the works of Mishra and Koehler (2006) called the technological
pedagogical content knowledge (TPCK). In very simplistic terms, this framework says that teachers should not
be trained on content or pedagogy or technology in isolation. Instead, it is essential to integrate content,
pedagogy and technology. A diagram of such a view is given below:
Diagram taken from http://tpack.org
As per this framework, in the TDIs, teachers of E1 schools were trained on content, pedagogy and technology
together and teachers of E2 schools were trained on content and pedagogy together. So the approach in TDI
was not to look at content alone and enhance teacher‘s knowledge. Content knowledge was enhanced in relation
to how the content had to be taught. The language TDI integrated content and pedagogy and the Math TDI
integrated content, pedagogy and technology. We could not use technology for language because computers
had not been installed in all E1 schools.
A total of 5 TDIs have been so far conducted. The details of these TDI have been presented in this section.

67
First Teacher Development Interaction (TDI 1)
Objective: To introduce the Computer Aided Learning Programme (CALP) research study to the teachers of the 40 government primary experimental schools.
Design:
Focus area Objective Method
Introduction to the Study To enable the teachers to understand the basic premise and
various components of the Study
Teachers are divided into
groups Each group is given
reading material on the
CAL Study and the MoU signed between the
Foundation and the State
Government. Each group, after a
discussion, makes a
presentation on the Study
Responsibilities of the various participants in the Study
To ensure that the teachers know what to expect from various
parties during the implementation
of the Study
Teachers are divided into
groups Each group discusses the
expectations of teachers
from the Foundation, the
SSA and the school in the implementation of this
project Each group presents the
points of their discussion.
Reflections:
While teachers possessed a positive outlook on the potential of technology in facilitating learning, they
tended to struggle with situating technology in the framework of their teaching.
Teachers expressed progressive views on child development and learning. They were familiar with the
concepts and mouthed them with ease.
The second, third and fourth Teacher Development Interactions were on language. The TDI on language
focused on building a perspective on language teaching that was based on the principles of relevance to the
learner and teaching in context. The ―balanced language approach‖ was used for this purpose. This approach
starts with the whole language going to the syllabic structure of language.

68
Such an approach was also in line with the National Curriculum Framework (NCF) 2005 of the NCERT,
Government of India.
Whole language describes a literacy philosophy which emphasizes that children should focus on meaning and strategy instruction. It is often contrasted with phonics-based methods of teaching reading and writing which emphasize instruction for decoding and spelling. Whole language is an educational philosophy that is complex to describe, particularly because it is informed by multiple research fields including but not limited to education, linguistics, psychology, sociology, and anthropology. Several strands run through most descriptions of whole language:
focus on making meaning in reading and expressing meaning in writing; constructivist approaches to knowledge creation, emphasizing students' interpretations of text
and free expression of ideas in writing (often through daily journal entries). emphasis on high-quality and culturally-diverse literature;
integrating literacy into other areas of the curriculum, especially math, science, and social studies;
frequent reading with students in small "guided reading" groups to students with "read alouds" by students independently;
reading and writing for real purposes; focus on motivational aspects of literacy, emphasizing the love of books and engaging reading
materials;
meaning-centred whole to part to whole instruction where phonics are taught contextually in "embedded" phonics (different from synthetic or analytic phonics); and
emphasis on using and understanding the meaning making role of phonics, grammar, spelling, capitalization and punctuation in diverse social contexts.

69
Excerpted from the Position Paper on teaching of Indian Languages by the NCERT Objectives of language teaching: (a) The competence to understand what she hears: A learner must be able to employ various non-verbal cues coming from the speaker for understanding what has been said. She should also be skilled at listening and understanding in a non-linear fashion by making connections and drawing inferences. (b) Ability to read with comprehension, and not merely decode: She should develop the habit of reading in a non-linear manner using various syntactic, semantic, and grapho-phonemic cues. She must be able to construct meaning by drawing inferences and relating the text with her previous knowledge. She must also develop the confidence of reading the text with a critical eye and posing questions while reading. (c) Effortless expression: She should be able to employ her communicative skills in a variety of situations. Her repertoire must have a range of styles to choose from. She must be able to engage in a discussion in a logical, analytical, and creative manner. (d) Coherent writing: Writing is not a mechanical skill; it involves a rich control of grammar, vocabulary, content, and punctuation as well as the ability to organise thoughts coherently often using a variety of cohesive devices such as linkers and lexical repetitions through synonymy, etc. A learner should develop the confidence to express her thoughts effortlessly and in an organised manner. The student must be encouraged and trained to choose her own topic, organise her ideas, and write with a sense of audience. This is possible only if her writings are seen as a process and not as a product. She should be able to use writing for a variety of purposes and in a variety of situations, ranging from informal to very formal. (e) Control over different registers: Language is never used in a uniform fashion. It has innumerable varieties, shades, and colours, which surface in different domains and in different situations. These variations, known as registers, should form a part of a student‘s repertoire. Besides the register of school subjects, a student must be able to understand and use the variety of language being used in other domains such as music, sports, films, gardening, construction work, cookery, etc. (f) Scientific study of language: In a language class, the teaching approaches adopted and the tasks undertaken should be such that they lead a child to go through the whole scientific process of collecting data, observing the data, classifying it according to its similarities and differences, making hypotheses, etc. Thus, linguistic tools can and must play a significant role in developing a child‘s cognitive abilities. This would be much better than teaching normative rules of grammar. Moreover, this approach is particularly effective in multilingual classrooms. (g) Creativity: In a language classroom, a student should get ample space to develop her imagination and creativity. Classroom ethos and the teacher–student relationship build confidence in the latter to use her creativity in text transaction and activities uninhibitedly. (h) Sensitivity: Language classrooms can be an excellent reference point for familiarising students with our
rich culture and heritage as well as aspects of our contemporary life. Language classroom and texts have a
lot of scope to make students sensitive towards their surroundings, their neighbours, and their nation.
Overall Objective of the language modules were to develop
A perspective on reading that emphasizes on making meaning.
A perspective of writing that emphasizes on relevance and expression.
This consists of the following sub-objectives:
1. To be able to list the developmental stages in reading and writing
2. To assess reading that is in consonance with the meaning-making approach
a) Identify and mark errors made by children
b) Identify the developmental stage in reading on the basis of the errors
3. To be able to support students to move in the developmental ladder through the use of appropriate
strategies and reading-level appropriated books.
4. To describe the process of learning to read and the role of teachers.
5. To articulate the approaches and strategies for teaching reading.

70
6. To develop writing in ways that are meaningful to children.
7. To develop activities that will help students to develop their writing abilities
The principles underlying the approach used in the modules are:
Children learn to read and write only when they are interested in reading and writing. Interest is not the result of
learning to read and write.
‗Teaching‘ of reading and writing is effective when the process-product emphasis is taken to foster reading/
writing rather than a product-alone emphasis.
The development of reading and writing abilities are not cumulative with alphabets acquired first, followed by
words, sentences, paragraphs and so on. Rather, the components of reading and writing develop together. So it
is essential for teacher to pitch teaching of reading at these components simultaneously and not wait till
reading/writing abilities are developed.
Comprehension consists of various layers and reading and writing must explicitly target these layers.
The approach to error should be from a developmental perspective and not a diagnostic perspective.
Reading and writing develops simultaneously by mutually reinforcing one another along with listening and
speaking.
As stated earlier, the baseline result on reading was used to feed into TDI. The baseline results clearly showed
that students decode without comprehension. So the TDIs attempted to differentiate between decoding and
comprehension and dealt with the issue of teaching language for comprehension. In this sense, language
teaching is teaching of reading and writing.
Design:
Focus Area Objective Method
Difference between
script and language
To differentiate between
decoding and comprehending.
Two passages were prepared – one in
Marathi language but written in
Devanagari script and second, in Tamil language but written in Devanagari
script. Teachers were asked to read the
passages and then share their feelings
on reading without comprehension.
Passage reading: Coding
versus meaning making
To drive home the fact that we
make meaning by reading a
piece of writing in its contextual entirety, not word for word or
sentence by sentence. It is possible to derive multiple
meanings from the text and this
was an important skill to develop.
Two similar paragraphs were prepared.
The first was different from the other
only by five words which were omitted
in the second one. For passage reading, four participants
volunteered and they were sent
outside, two each were given one passage and they had to read and state
individually what they understood from
the passage. The resource person pasted the
passages on board, audience read the
passage, and then volunteers were called one by one to relate what they
had understood from passage. Then both the passages were pasted in
front for all to see the difference and
understand why meanings changed and
where meaning was hidden.
Importance of
questioning
To convey that asking questions
to children with reference to a given text is a powerful tool of
Teachers were divided into four groups.
They were given a passage of class
3/4/5 and asked to make 5-6 questions

71
understanding the many shades
of meaning being drawn by the child from/about the text.
which they would like to ask children
Teachers came out with questions-
mainly direct and factual questions, only a few questions were such that
they invoked analysis, application, and emotions of the child.
Definition of reading
To concretise the concept of reading by synthesising
learnings from the previous
sessions of the workshop.
Participants were divided into four
groups. A written note on Reading was distributed to all. (Refer Annexure 4.)
All the participants read individually and
discussed in a group
Each group prepared 8-10 questions
based on the note on the parts that they understood and the parts that they
did not understand 30-40 minutes were given for above
preparation
Then quizzes were organized among
groups- the first group would ask questions to the second, the second to
the third and so on.
Clarification, if required, was given after
every question.
Understanding
assessment
To understand the different
kinds of reading errors generally committed by children
A discussion on the different kinds of errors in
reading, which are as following: 1. Addition error: Where a child adds
words/alphabets e.g. Aa+pana for apana, pasandaa+ for pasand
2. Deletion error: Where a child misses
certain words/alphabets 3. Substitution: Where a child replaces a
word or alphabet with another word or alphabet
Hands-on RAT scoring
To enable the teachers to gain an understanding of the
common reading errors through
actual testing of children.
The first hands-on experience on
reading assessment was organized with one of the resource persons. Facilitators
observed participants while marking
errors. Then the errors and their marking were discussed. Wrong
markings were corrected. The second hands-on experience was
organized with children. Participants
were grouped into three groups. 2 children, each of class 3, 4 and 5 from
a nearby school were assembled.
Questions were asked to the children after they finished their reading.
The responses were recorded by the
participants. Participants reflected on the process
and there was a vivid discussion on the
process, errors, how to deal with
borrowed words, where to issue prompts, what should be the time given
for self correction, types of questions, types of responses etc.
Reflections:
Teachers were sceptical about the 'whole language' methodology of reading. A reversal of the methodology that
was fundamental to their beliefs about language learning proved too difficult to pull off during the session.

72
Second, Third and Fourth Teacher Development Interactions (TDI 2, 3 & 4) Objective:
Reading Assessment Data analysis and interpretation
Demonstration of an array of reading and writing activities to improve classroom practices of the
teaching of the same.
Design:
Focus area Objective Method
Sharing of the RAT data of 40 schools with the participants
Number of children who
completed the reading of the text (Class wise)
The reading speed of the
children
The accuracy rate of the
children (Class wise) The correlation between speed
and accurate rate of the
children (Class wise) The overall comprehension
level of children
The general trends in children‘s
reading ability.
The complete reading ability
taking into account all the indicators i.e. speed, accuracy
and comprehension
To make the group
aware of the status of reading in their schools.
To set a context to the
teacher development interaction.
To urge them to focus
on the results and reflect
upon the status/level of children in their
schools/classes To provide teachers with
evidence on the number
of students who are
unable to read and hence are at risk –
potential drop outs or those who will not be
able to get much from education
To provide data on
students who are able to
read but with little comprehension – and so
the necessity of teaching for comprehension
Presentation
Discussion on the results
Understanding the Errors analysis of
RAT (the entire process has been
elaborated below this table) 12. Analyzing the results of their
individual schools in the light of overall RAT results.
13. Understanding the kind of errors made by children.
14. Looking at the speed and
accuracy of children in their schools
To enable teachers to
understand the method
of assessing the reading
of children To help teachers
understand the
kind/nature of errors made by children.
To enable teachers to
understand the reading status of their
schools/classes.
To identify error patterns
made by children
Teachers are divided
into group according to
their school, and asked
to analyse question papers.
They are given error
analysis sheets to assist them in the exercise.
Reflecting upon the methods/practices
of teaching reading of the teachers Understanding the balanced
approach to reading.
Understanding the various
class appropriate strategies for comprehension.
The method of teaching
reading to children, beginning
from text
To help teachers reflect
upon their teaching
practices. To demonstrate to
teachers the method of
teaching reading to children beginning from
the text.
A teacher is selected
and given a chapter to
prepare a lesson plan around.
The teacher is asked to
demonstrate it to the classroom
After the teacher has
finished, the facilitator
demonstrates a more learner-focussed lesson

73
plan on the same
chapter Discussion on the two
demonstrations follow.
The documentary film 'A
Teacher's Journey' is
screened.
A list of pointers is
handed out to the teachers and they
discuss the film in groups.
This is shared with the
rest of the group.
A handout on
'Developmental stages
of reading' is given to each teacher and they
discuss this in groups. They present the
learnings from the
handout in the form of a
poster.
Activities on reading and writing
Making Venn diagram –
Writing Becoming Authors – Writing
Timeline - Writing
Blindfold - reading
Alphabet Grid - Reading
To demonstrate
resources/activities to teachers that can be used in the
classroom
Teachers divide into groups to
do various activities designed to help children read and write.
Preparing action plans for children
Making groups of children on
the basis of their speed, accuracy, number of errors
(Mechanics & Violation) and comprehension
Understanding the pedagogic
strategies to be employed with every level of children
Enable teachers to
prepare an action plan
for supporting reading development of their
students To enable participants to
refine the nature of
grouping by inferring from error and self-
correction data.
To enable participants to
place each group on the reading development
continuum. To enable teachers to
develop the action plan
consisting of strategies
for each group of children, materials, and
time management.
The handout of this is
given to the teachers
and the facilitator demonstrates to the
group how to make the action plan by taking an
example. The teachers then divide
into groups and make
similar action plans.
Teacher participants in the TDI were capacitated to do a qualitative analysis of the error data. The purpose of
this analysis was twofold:
a) To enable teachers to assess the areas of difficulties and provide need-based instruction
b) To instil a ray of hope and confidence in teachers towards the reading abilities of students.

74
Process of looking at the Qualitative Data
Make a list of errors made by each child. Examine them to see if there is a pattern of sight words and
pattern of other words (whether they have problems with maatra – if so what maatra, whether they
have problems with specific letters, etc.).
Examine each error made by each child. Decide how many errors make sense – i.e., do they violate the
syntactic and semantic contexts and how many errors do – most or a few.
Children who make errors that do not fit the context show that they require a different kind of support
compared to children who do not make such errors.
Look at the self-correction rate of children and see if there is scope for refining grouping. Children who
make errors that violate the sense and show no self-correction require a different kind of support
compared to children who make such sense violating errors but with self-correction.
Group children on the basis of the analysis of the errors and to provide need-based inputs.
Such an analysis was done by teachers. The results showed that
Errors occur frequently in words with three or more syllables.
Errors occur in the middle or third position but not in the first position of a word.
Most of the errors that students have made are of the mechanical type and do not violate the syntax.
Some students show awareness of errors – but this degree is low.

75
Activities to help children read and write
Venn Diagram activity Objective: To compare two objects/people/situations. Process:
Teachers were split into groups of two.
Each member of a group was asked to write down on a piece of paper his/her good/admired qualities.
Once this was done, the groups were instructed to draw a Venn Diagram to portray the qualities that the two members shared in common
Timeline activity
Objective: To encourage logical/sequential thought and expression Process: Each teacher was given sheets of paper They were asked to describe, through writing or drawing, the prominent milestones of their lives. They then stick these milestones on chart paper in the form of a timeline.
Reflections:
1. Construction of knowledge during the workshop was more pliant to the expressed needs and participation levels of the teachers. In comparison to the previous TDIs, wherein full-bodied concepts
were introduced - irrespective of their reception by teachers, this worked as a better strategy of
influencing teaching practices.
2. More concrete demonstrations and activities formed part of the methodology as compared to the
previous TDIs, wherein it was felt that teachers were not able to grasp (or appreciate) solely theoretical inputs.
3. Teachers expressed their appreciation of the quality of the assessment tool used for the RAT, especially
the number and variety of parameters used to evaluate children's level of reading.
4. Teachers showed awareness of students reading without comprehension and were seeking ways to
overcome this problem. They felt that the TDI was useful in answering this question. But had reservations in following this because they had to complete portions. They saw these strategies as
extremely time consuming.
The TDI was followed by on-site support. AS a part of on-site support, team members went to schools and
demonstrated to teachers the principles of teaching lessons. Discussions were initiated on different types of groupings. It was stressed that such a method of teaching needed lot of planning and preparation. After inputs
and demonstrations, members sat through classes for observation to see the impact of their inputs.
Impact of Language support By the end of Year One, a large majority of teachers had developed competency in the following areas:
Assessing reading abilities of students
Identification and analysis of common reading errors
Grouping as a pedagogical strategy to address students with reading difficulties

76
Focusing less on grammar, i.e., form, and more on comprehension, i.e., substance.
But most of them continued to use only retrieving questions. They could not develop interpretive or
reflective questions.
They could not devise remedial measures to develop better reading and writing abilities among children
with reading difficulties.
They could not develop resource to suit the needs of students
They did not plan for handling different levels of groups and so difficulties handling them.
The reasons for this partial failure were:
The attitude of some teachers who believed that a large proportion of children they were teaching
belonged to disadvantaged communities, and so were incapable of learning well, either because of their
inherent cognitive deficiencies or because of insufficient parental support.
Teachers claimed that there wasn't sufficient time for such remedial teaching.
Non-availability of readymade levelled reading materials.
TDI 5 on Math and On-site support
The second year of the Study had yielded several learnings for the Foundation that were to later influence both
the processes of interactions with the teachers and the areas of focus in the Study. Firstly, a much clearer
picture of the levels of competency and receptiveness of the teachers had emerged, and this knowledge was
incorporated into the design of later interactions. Secondly, school visits attained a greater importance than
planned, since they were found to be the most influential in altering classroom practices. Thirdly, the technology
component was more seamlessly integrated into the design of the later interactions, particularly in Year Three.
Fourthly, the use of grouping as a pedagogy became well defined in the process of assigning specific roles to
each participant in the group and using different learning strategies, like, Pair-Share; Solo-Share; Group-pair-solo
etc.,
As with language teaching, the Study's approach to Mathematics teaching is derived from the NCF.

77
Objective:
This TDI on Math was intended to introduce participants to the following principles of teaching Math. This was
done using the topic of Division. Its purpose was to enable teachers to:
Apply principles of Math pedagogy to teaching Math topics / concepts
Use grouping as a pedagogical practice – with emphasis on instructional strategies
Use visualization as a strategy
Use estimation / prediction as a strategy
Apply knowledge of interrelationship between concepts and sub-concepts in Math
Apply knowledge of relevance of Math content to daily life
Enhance their knowledge of content on Division (selected on suggestion of teachers)
Use strategies that integrate the technology with the curriculum
Develop resources using technology
Teach children technology through division
The TDI on Math was designed as a three-step progression – referred to as the EAR Model – meaning
Experience, Apply and Reflect. The module was designed keeping in mind the results of students in Math
achievement. Emphasis was laid on giving participants multiple learning experiences on division, taking them
from concrete to abstract – sharing with games/ story and objects / and then numbers, different orientations,
visualization, and writing questions for a given answer. Teachers experienced the Math pedagogy on grouping
Excerpted from the Position Paper on the 'Teaching of Mathematics' by the NCERT
• Children learn to enjoy mathematics: this is an important goal, based on the premise that mathematics can be both used and enjoyed life-long, and hence that school is best placed to create such a taste for mathematics. On the other hand, creating (or not removing) a fear of mathematics can deprive children of an important faculty for life. • Children learn important mathematics: Equating mathematics with formulas and mechanical procedures does great harm. Understanding when and how a mathematical technique is to be used is always more important than recalling the technique from memory (which may easily be done using a book), and the school needs to create such understanding. • Children see mathematics as something to talk about, to communicate, to discuss among themselves, to work together on. Making mathematics a part of children’s life experience is the best mathematics education possible. • Children pose and solve meaningful problems: In school, mathematics is the domain which formally addresses problem solving as a skill. Considering that this is an ability of use in all of one’s life, techniques and approaches learnt in school have great value. Mathematics also provides an opportunity to make up interesting problems, and create new dialogues thereby. • Children use abstractions to perceive relationships, to see structure, to reason about things, to argue the truth or falsity of statements. Logical thinking is a great gift mathematics can offer us, and inculcating such habits of thought and communication in children is a principal goal of teaching mathematics. • Children understand the basic structure of mathematics: Arithmetic, algebra, geometry and trigonometry, the basic content areas of school mathematics, all offer a methodology for abstraction, structuring and generalization. Appreciating the scope and power of mathematics refines our instincts in a unique manner. • Teachers expect to engage every child in class: Settling for anything less can only act towards systematic exclusion, in the long run. Adequately challenging the talented even while ensuring the participation of all children is a challenge, and offering teachers means and resources to do this is essential for the health of the system.

78
and sharing. Then they had to apply the principles on another sub-concept. Finally the groups had to reflect on
their application.
Design:
Focus area Objective Method
How do we teach division? To enable teachers to express
their division teaching practices
Teachers are divided into groups
Each group answers questions
about how they teach division in
the classroom. These responses are written down
and displayed in the training hall
What is division? To enable teachers to demonstrate their content
knowledge of division
Teachers are divided into groups
Each group draws a content map
on division. These maps are shared with the
rest of the groups
Defining division as being either equal distribution or
grouping
To enable participants to be able to define division as equal
distribution by engaging in a game.
Teachers and students are divided
into mixed groups of equal number
The teachers draw circles on the
ground and number them. The circles are much fewer in number
than the students in the group.
They assign numbers to the
students corresponding to the number of each circle, repeating
numbers to cover all the students Teachers call out a number and
ask the student to go and stand in
their corresponding circle By the end of the activity, there
would be equal number of
students in each circle with either
a few children remaining or none remaining at all
The teachers then query the
children about their views and feelings about the activity
Through this discussion, the
principle of division as equal
distribution is derived
To enable understanding of
division as equal distribution/sharing by looking at
unequal and equal sharing through a game
Teachers and students are divided
into mixed groups of equal
number Students are given answering
sheets.
A story is read out by a teacher to
the students The story demonstrates the
difference between equal and
unequal sharing and the teacher discusses this with the students.
The teacher asks questions at
many points in the story and
pauses to let students write their answers
To enable understanding of division as sharing through object
distribution
Teachers and students are divided
into mixed groups of equal number

79
Each group is given a fixed
number of buttons and containers
The teachers ask the students to
place an equal number of buttons in each container
After all the buttons are placed,
the teachers ask the students to count the number of buttons in
the first container, then the
second and so on The students are then asked to
reflect in the activity and the
principle of division as sharing is derived
To enable the understanding of grouping as division through a
game.
The number of the students
present is written down on a board by the facilitator
A song is sung by the facilitator
during which time the students move around in a circle
The facilitator, at points, calls out
a number after which the students
have to arrange themselves in groups of that number
The number of groups and the
size of the groups is written on the board by the facilitator
After a few rounds of this, A
discussion ensues during which
the facilitator derives the principle of division as grouping
To enable the understanding of grouping as division by grouping
objects
Each student is given a fixed
number of soybeans Each student is asked to pick up a
folded chit of paper, on which a
number from 1-10 is written The students are then asked to
divide the soybeans into as many
groups as the number on the chit indicated
They then write down information
related to the number of groups
and the remaining soybeans, if any
From this exercise, the principle of
division as grouping is derived.

80
Objective: To enable the understanding of grouping as division through a game.
Process: The number of the students present is written down on a board by the facilitator
A song is sung by the facilitator during which time the students move around in a circle
The facilitator, at points, calls out a number after which the students have to arrange themselves in
groups of that number
The number of groups and the size of the groups is written on the board by the facilitator
After a few rounds of this, A discussion ensues during which the facilitator derives the principle of
division as grouping.

81
Worksheet used during the interaction
Technology component:
The E1 batch of schools, for which the Study design mandated a substantial serving of technology inputs, were
invited to use word processing, spreadsheet and presentation tools during the sessions described above.
Whenever a group conclusion or resolution had to be documented, it was done using a word processor instead
of writing on chart paper. Print outs were taken to advance the teachers' familiarity with hardware. Graphs and
charts displayed data. Presentations were compiled out of group discussions.
Reflections:
The TDI on Math was designed after ingesting learnings from the experiences and failures of Year One. The
following elements were consciously incorporated into the design:
1. Activities to elicit teacher input and participation were more numerous and rigorous. This was done to
enable the facilitators to mould the session according to the receptiveness, subject competency and
comfort levels of the teachers.

82
2. For the E1 schools, technology was more seamlessly integrated into the sessions. Teachers were
assisted to use digital tools to interact with the students and convey concepts and ideas.
3. The above detailed changes did positively impact the teachers' levels of enthusiasm and absorption.
4. Teachers participated enthusiastically in creating resources for teaching division. They even recorded
their voice explaining with animation the idea of sharing and grouping.
5. They were delighted to see Oriya words on the computer – it was a language they could easily relate to.
6. They could relate and get a real understanding and a feeling of being empowered in the process of using
technology for Math.
7. Teachers began to look at songs and games as medium for creation of atmosphere of learning or
motivation. They began to see value in games as a medium of learning and not as a means for
motivating the learners. This is evident in the TNMs.
8. Although we had been telling for long that we were interested in using technology for learning curricular
subjects, in the TDI, they understood the implication of this statement. An impact of this realization was
that earlier they would have 8 to 10 children crowded around a computer. Now, they started
implementing the guideline of 1computer for 3 children to enable each child to operate the computer for
learning purposes.
Teacher Network Meetings
Teacher Network Meetings (TNMs) aim to create a forum for teachers for the purposes of self-expression and
development. Through the TNMs, teachers will begin to perceive themselves as members of community united
by common goals and operational difficulties instead of disparate units working in isolation as is commonly the
case now. Once a sense of community has developed, shared ideas, reflections, learnings and difficulties will
inevitably become focal points of discussion and action. Additionally, such a forum, it is hoped, will incite in
teachers a larger sense of purpose about their chosen vocation and provide a much-needed boost to their
collective confidence. TNM is a forum of teachers for teachers and by teachers. The responsibility of the team
members was limited to background work.

83
So far, 7 TNMs have been held in
Nayagarh and these have fostered feelings of unity and camaraderie
amongst the teachers.
Venue: Balugaon UGME Date: 20 March, 2010 Participating schools: Kridaspur UGME and Balugaon UGME
Teacher name: Gayatree Champatray
Ms. Champatray shared the new classroom strategies she evolved to teach science to Class 5 students. She sang a song about the
various uses of water as an introduction to the topic. To conduct the lesson in a more interesting manner she has devised a time line
displaying the various use of water from morning to night and a
Venn diagram to show the uses of water inside the home and outside the home.
Venue: BRCC building, Nayagarh
Date: 6 February, 2010 Participating schools: Ghadual PUPS,
Nabaghanapur UGME, Solapata Nodal
UPS
Narotama Nayak from Nabaghanapur UGME shared his
teaching strategies for mathematics.
He explained how he teaches the topic of fractions for class IV students. He
begins the class by handing out circular pieces of paper to each child
and helps them to identify different fractions by colouring into sections of
the circle. After that, he displays a
potato to the class and demonstrates fractions by slicing it into different
parts. Then he introduces the concepts of numerator and
denominator.
Venue: Barapalli UGME School, Nayagarh
Date: 13 February, 2010 Participating schools: Barapalli UGME, Kanchanbelli
PUPS, Kodei Kahania PS, Bodapada PS
Santi lata Devi, Barapalli UGME shared her happiness
on being able to use computers, a technology she was unfamiliar with in the past. Now, with support from Study
members and after attending TDIs she is able to use computers for classroom transaction. She shared one of
the resources she developed on EVS for teaching Class V
the skills of map reading and identifying and understanding different landforms of India. She also
shared a worksheet she developed for children to draw a map and colour different land forms using a paint
program.

84
Name of the organizer school
School participated Date of TNM No of Participants
Barapalli UGME Bodapada, Kanchanbelli, K.Kahania, Barapalli 13.2.10 16
Nabaghanapur Solapata, Nabaghanapur, Ghadual 6.2.10 19
C.S Nodal Machipada C.S.Nodal,Machipada, Sinduria ,Sanapandusar, Mardarajpur
13.3.10 22
Balugaon UPME Balugaon, Kirdaspur 20.3.10 19
Ranganipatna Ranganipatana, Kurala 19.3.10 14
Ranpur Girls Ranpur Girls, Bodhipatna, Mayurjhalia,
Harijanbasti, Sarangadharpur
13.3.10 21
Nilakantha P.S Nilakantha, Badakutuni, P. Manpur 6.4.10 10
Some of the significant innovations and experience shared by teachers are listed below.
Ravindranath Sahu displayed a game he had devised for teaching children the concept of division as
repeated subtraction
Manorama Devi had developed flash cards on different means of transportation and demonstrated the
process of transaction by grouping children and promoting collaborative learning. She also prepared a
song for introducing the topic.
Gayatree Champatray made a song on water for introducing uses of water. She then used to
timeline to show use of water throughout a day and Venn diagram for comparing the use of
water inside and outside home. She discussed the process of using these strategies.
Prasanna Pradhan demonstrated the process of teaching British rule in India. He told a story on
British rule and asked students to make sequential maps. On different chits, he wrote the acts
done by British and placed them in the centre of the room. Each student had to pick up a chit,
read it out aloud, say whether it is a good or an evil deed and stand in the respective columns.
Gangadhar used the concept of sight words and discussed games that can be played with this.

85
Gangadhar showing the chart of Oriya Sight Words
Ahalya Devi from Solapata Nodal shared her experience of using learnings from TDI. She
made three groups-fast reader, slow reader and unable to read. She then concentrated on
students who are unable to read. Out of 6 unable to read children, 4 children are now able to
read. She still has to work with 2 more children.
Prafula Kumar Patanaik from Solapata Nodal shared his experiences that in language teaching he
follows principle of shared reading with children. At the time of shared reading he monitors
comprehension continuously.
Narotama Nayak from Nabaghanapur used shading and vegetable cutting activities for
teaching fractions.
Manjubala Dei from Nabaghanpur shared her experience in teaching of writing. She helped students
to develop picture dictionary, become authors and develop a timeline in the classroom. According to her,
these kinds of activities many children are able to frame sentences and write with correct spelling.
Manjubala Dei sharing the picture dictionary and stories developed by children with all teachers
Pradip of Machipada used technology to make word puzzles,
Namita of Machipada used technology for exercises like identifying odd and even numbers, two
and three digit additions.
Pratima of Sindhuria Nodal used Power point to show ½ as a fraction.
Nishamani and Gita of Sindhuria Nodal used power point to show solar system
Surendra of Sanpondusar UPS downloaded pictures of parts of plants and body parts from internet,
inserted it into power point and gave questions on identifying parts of plants and parts of body.
Niranjan had developed a power point to show the concept of sharing.

86
Many teachers expressed the view that this is the first time they were participating in a forum where the
discussion was not on administrative issues.
One of the objectives of TNM was to enable teachers to solve one another‘s problem. This objective was not
achieved in the TNM. When teachers came out with any issue – like lack of time, class room management,
inadequacy of teachers, this was not even discussed. These issues were made more as statements rather than
issues for discussion.
Technology support The Study team has endeavoured to equip teachers with software tools that are highly pliable to adaptation.
Common office tools like Microsoft Word, Excel and PowerPoint and open source2 educational software suites
enabled teachers to replace more inflexible and limited teaching aids such as textbooks and blackboards with
digital applications that allowed for animation, audio, video and interactivity. Conceptual areas in which most
teachers created resources were reading, memorisation of numbers and their multiples and common operations
like addition, division. Teachers had to be supported very intensively in order to gain proficiency in the use of
these tools and operational procedures had to be repeatedly demonstrated by the study team for the benefit of
the teachers.
Open source tools used by teachers in Orissa
Place the items in the best way to count them Category: Numeration
Instructions: First, properly organize the items so that you can count them. Then, select the item you want to answer in the bottom right area. Enter the answer with the keyboard and press the OK button or the 'Enter' key.
Missing Letter Category: English Reading
Instructions: An object is displayed in the main area, and an incomplete word is printed under the picture. Select the missing letter to complete the word.
The above games form part of an open source software package called GCompris. GCompris is a high
quality educational software suite comprising of numerous activities for children aged 2 to 10. Some of the
activities are game orientated, but nonetheless still educational. Below is a list of categories with some of
the activities available in that category.
computer discovery: keyboard, mouse, different mouse gesture, ...
algebra: table memory, enumeration, double entry table, mirror image, ...
2 Open source refers to any program whose source code is made available for use or modification as users or other developers see fit.
Open source software is usually developed as a public collaboration and made freely available.

87
science: the canal lock, the water cycle, the submarine, electric simulation ...
geography: place the country on the map
games: chess, memory, connect 4, oware, Sudoku ...
reading: reading practice
other: learn to tell time, puzzle of famous paintings, vector drawing, cartoon making, ...
Technology Resource created by a teacher Category: Numeration
Created using: Microsoft Word
AÇs sõMèÇ QÈtÈïgÇ
* 1 HL
** 2 cÊB
*** 3 aÈeÈ
**** 4 QÇlÈ
***** 5 fLj
****** 6 R A
******* 7 sÇa
******** 8 AÇW
********* 9 e A
********** 10 cq
Revision Games Background:
In all schools, the period spanning February and March is revision time for students. The process of revision is to
write the text book questions on the board, and students write the answers. A few bright students finish their
answers and get them corrected. Towards the end of the period, teacher writes the correct answers and asks
other students to copy them. So students are hardly engaged in the process of revision. They do not write
because they do not know what to write. It was our aim to draw attention of teachers to this point and
question (through demonstration) their view that students do not write in their exams because their writing skills
are inadequately developed. To demonstrate this to teachers, a need for a revision game was felt. The games
were played by students of classes 3,4 and 5. Each class got 2 sets of each game (totally 4 game sets per class).
Objectives:

88
Apart from the fun element, learning without fear or anxiety, and building confidence, the specific objectives of
the games were:
11. To facilitate players to engage themselves with their lessons in the process of revision
12. To enhance search skills in players
13. To foster questioning skills
14. To enable them to relate the answers to questions in the process of revision
Materials
A board with parachutes and downward arrows.
A pair of dice
One Counter for each player
Process of Playing:
The game simulates an open book examination except that the questions are from text book.
Played by 4 children (or children can play in groups - so 8 children play a board).
Throw dice, pick a card and read aloud the question written on it.
The player will search the text books for an answer in case he/she does not know it.
Say aloud the answer and move their counters in accordance to the number on the dice.
In case of difference of opinion, they can refer to the answer cards which will be with the teacher.
The questioning skill game also follows the same process. But the player draws the card, reads aloud the
key words and asks a question related to it.
Each player gets ―3 life lines‖ – searching in books becomes one lifeline, asking friends becomes another,
and getting clues through key words becomes the third lifeline.
Some teachers brought in changes in the process of playing. If students did not answer any question,
the next child could answer but the first child makes just one move with her counters.
Some teachers added writing (answers to the questions) after playing the game.

89
Impact:
1. Children enjoyed the game and were engaged in the process of revision.
2. Children who were unable to read, were learning to read the questions.
3. Children also searched enthusiastically for answers and discussed the answers among themselves.
4. Teachers saw value in the game – because it is based on the text books.
5. Teachers have appreciated the meaning of the term ‗engaging all children in the process of learning‘.
6. Some teachers have started creating their own revision games for EVS.
7. Some teachers complained that there was high noise level in the classroom.
8. In some schools, the grouping of students for playing the game was heterogeneous. In such cases, the
―intelligent‖ students tended to dominate the ―slow learners‖
In the process of learning technology, teachers raised certain issues:
o The head teacher tended to limit teachers and students access to computers
o Teachers voiced concerns about completion of syllabus
We, too, felt the need to engage the officials for seeking their support and inputs.
This led us to working on enabling conditions. As a part of this effort, three meetings were held with the Head
Teacher and the District Inspector of Schools, along with Block Resource Coordinators and Cluster Resource
Coordinators.
The objectives of these meetings were:
a) Share the activities that were done as a part of computer aided learning
b) Seek support and input from them.
A Head Teacher meeting was held on 18-19th August 2009. The objective was to make HT aware of the
difference between a leader and a manager and administrator and to make them experience leadership
through several activities. These activities were used to build on the role of Head teacher in the research
study.

90
District, block, and cluster functionaries meeting on 13th October, 2009.
Sharing the activities of TDI and seeking support
In this meeting one of the teachers from an E1 school shared the research study and the updates.
The impact of such continuous interactions was:
The computer room was kept open throughout the
school working hours.
The CRCs expressed the view that so far they were merely monitoring schools and teachers. Hence forth
they will begin to support them
The BRCs, CRCs began to attend TNMs and acquainted themselves with the resources developed by
teachers
Impact of the Study on Teachers
Nearly half the teachers are comfortable with using technology to supplement their classroom teaching.
They are devising new teaching tools utilising common computer applications such as Microsoft Word,
Excel and PowerPoint.
Access to computer lab: the Head Teacher was not opening the Computer Lab – now he keeps it open.
Teachers did not know to use computer – now they use it to create resources.
Teachers used to see learning of computers a burden- now they no longer hold this view.
Teachers / Head Teacher writing question papers and answers on papers, preparing salary bills, entering
attendance data and teacher data – now they enter and store records on the computer. (Himanshu of
Barapalli; Kabita Behera and Pradipta Ku Sahu of Kanchanbelli UPS; teachers of Kural school; Pradip of
Machipada; teachers in Sinduria Nodal, to cite a few names)
All teachers of E1 school enjoyed learning Baraha Oriya. They were delighted to see Oriya language on
the screen.
Students depended on teachers for seeing computers. Now they see it on their own . They also use
Tuxpaint and Tux Math on their own. According to reports, in Machipada, students stayed after school
and attended school after exams to use computers.
Teachers extended the idea of board game to EVS.

91
A large majority of teachers have altered their perception of language learning to varying degrees. They
have picked up the skill of analysing common reading errors and have become more sensitive to the
needs of learners, particularly those with reading and learning difficulties.
The Teacher Network Meetings (TNMs) have given teachers a common platform to express themselves
and learn from each other. Every teacher has attended at least one TNM and has expressed great
pleasure in feeling a sense of belonging to a community that is attuned to his/her needs and sensibilities.
Teachers have begun to understand the meaning of the phrase ‖active engagement of students in the
learning process‖.
They have begun to feel empowered – because they create resources and use them.
Reasons for pulling out of Orissa The Computer Aided Learning project is a research study. The study is based on Foundation‘s earlier experiences
for effective utilization of computers. These were translated into certain critical conditions necessary for the use
of computers:
A computer child ratio of 1:3. But in schools, the computer student ratio exceed 1:6
UPS supporting a back-up of at least 3 hours. But in schools, the UPS supports only 10 minutes back-up.
In fact, frequent and long duration power-cuts have often disrupted on-site support for technology.
Pupil –teacher ratio of 1:30. But in several schools and in several classes this condition is not met.
Apart from these essential conditions, the study was based on having the profile of teachers similar
across E1, E2 and Control schools. Because of teacher transfers we are not sure to what extent do the
three types of schools share similar teacher profiles.
The non-fulfilment of these critical conditions has vitiated the research.
Despite numerous requests and reminders, the Government has not succeeded in equipping the selected schools
(E1 schools) with the requisite technology set-up. This inordinate delay is hampering our work in the schools and
tampering with the design of the study. Currently, only 18 out of 20 schools are fitted with 5 computers each.
After completing 2 years of the study - constrained by this lacuna - it was felt that further continuation in the
state would not serve any purpose and hence, the decision was made to pull-out.
Conclusions Technology is best introduced to teachers in the context of teaching and not as a stand-alone article of
investigation in a training centre. It was observed that teachers enlisted technology as a teaching aid as naturally
as they would any other resource in their environment. While they certainly had to be supported in their efforts,
integration of technology into their curriculum proved to be easier when compared to similar such experiments
documented in international research literature.
Teachers are more pliant to influence if their body of knowledge is inducted into the process of capacity building.
When we introduced completely novel concepts to them without inviting their inputs, absorption levels were low.
It was only after intensive interactions with individual teachers in which we understood their teaching practices
and built upon them that we evidenced a positive change in classroom practices.

92
In the Western context, where teachers are learner focused in their pedagogy technology is an add-on for
enhancement of learning. In the Indian context, technology can be seen from another perspective. Here
pedagogy is teacher led. In such a situation, technology is compelling teachers to be more learner-centred
because their ‗old ways do not work with technology‘.
Teachers have begun to have a deeper understanding of phrases like learner engagement, teaching for meaning,
using technology as a pedagogical tool, grouping as a pedagogy, use of games/ stories/ songs for the purpose of
learning, building on existing knowledge of learners, learners constructing their own knowledge etc.,
Some teachers of Orissa have begun their journey of becoming creators of curriculum instead of its consumers.
Currently this is a small number.
Even though it has been the objective of this study to gather data on several indicators related to classroom
practices, the premature termination of the Study in Orissa has prevented us from doing so. As a result, we are
left only with anecdotal accounts and individual perceptions as measures of change. These have indicated to us
that a large majority of teachers have altered their perception of language learning to varying degrees. They
have picked up the skill of analyzing common reading errors and have become more sensitive to the needs of
learners, particularly those with reading and learning difficulties.

93
References
Bangert-Drowns, R. L. (1993). The word-processor as an instructional tool: A meta-analysis of word processing in writing instruction. Review of Educational Research, 12(3), 59-68.
Burns, P. K., & Bozeman, W. C. (1981, October). Computer-assisted instruction and mathematics achievement: Is there a relationship? Educational Technology, 21, 32-39.
Clark, R. E. (1983). Reconsidering research on learning from media. Review of Educational Research, 53,
4445-4460.
Clark, R. E. (1994). Media will never influence learning. Educational Technology Research & Development,
42(2), 21-19.
Cohen, P. A., & Dacanay, L. S. (1992). Computer-based instruction and health professions education: A meta-analysis of outcomes. Evaluation and the Health Professions, 15(3), 259–281.
Cooper, H., & Hedges, L. V. (Eds.). (1994). The handbook of research synthesis. New York: Russell Sage Foundation.
Fletcher, J. D., Hawley, D. E., & Piele, P. K. (1990a). Costs, effects, and utility of microcomputer assisted
instruction in the classroom. American Educational Research Journal, 27(4), 783-806.
Fletcher-Flinn, C. M., & Gravatt, B. (1995). The efficacy of computer assisted instruction (CAI): A meta-
analysis. Journal of Educational Computing Research, 12(3), 219–242.
Glass, G., McGaw, B., & Smith, M. L. (1981). Meta-analysis in social research. Beverly Hills, CA: Sage.
Hartley, K., & Bendixen, L.D. (2001, December). Educational research in the Internet age: Examining the
role of individual characteristics. Educational Researcher, 22-26.
Hedges, L. V., & Olkin, I. (1985). Statistical methods for meta-analysis. Orlando, FL: Academic Press.
Kulik, J. A. (1981, April 1981). Integrating findings from different levels of instruction. Paper presented at
the American Educational Research Association, Los Angeles.
Kulik, C.-L. C., & Kulik, J. A. (1991). Effectiveness of computer-based instruction: An updated analysis. Computers in Human Behavior, 7, 75-94.
Kulik, J. (1994). Meta-analytic studies of findings on computer-based instruction. In Baker, E.L. and O'Neil, H.F. Jr. (Eds.), Technology Assessment in Education and Training. Hillsdale, NJ: Lawrence Erlbaum.
Mishra, P & Koehler, M.J. (2006). Technological Pedagogical Content Knowledge: A Framework for Teacher
Knowledge http://punya.educ.msu.edu/publications/journal_articles/mishra-koehler-tcr2006.pdf)
National Curriculum Framework (2005), New Delhi, NCERT.
Neal, E. (1998). Does using technology in instruction enhance learning? Or the artless state of comparative
research.
Niemiec, R. P., & Walberg, H. J. (1987). Comparative effects of computer-assisted instruction: A synthesis
of reviews. The Journal of Educational Computing Research, 3(1).
Pal J., Pawar U.S., Brewer E., Toyama K. (2006). The case for multi-user design for computer aided learning in developing regions, presented at the International World Wide Web Conference, Scotland.
Parr, J. (2000). A review of the literature on computer-assisted learning, particularly integrated learning
systems, and outcomes with respect to literacy and numeracy. Wellington, New Zealand: Ministry of
Education.
Roblyer, M. D., & Bennett, E. K. (2001). The fifth literacy: Research to support a mandate for technology-based visual literacy in pre-service teacher education. Journal of Computing in Teacher Education, 17(2), 8-
15.

94
Samson, G. E., Niemiec, R., Weinstein, T., & Walberg, H. J. (1986, Summer). Effects of computer-based instruction on secondary school achievement: A quantitative synthesis. AEDS Journal, 312-326.
Schacter, J., & Fagnano, C. (1999). Does computer technology improve student learning and achievement? How, when, and under what conditions? Journal of Educational Computing Research,20(4), 329–34.
Shwalb, B. J. et al. (1986). Educational technology in the Japanese schools: A meta-analysis of findings.
Educational Technology Research, 9(1-2), 13–30.
Willett, John B., and Yamashita, J.M. and Anderson, R.D. (1983). "A Meta-Analysis of Instructional Systems
Applied in Science Teaching." Journal of Research in Science Teaching, 20(5), 405-417.

95
Annexure 1 – Charts displaying RAT and CAT Results

96
Class 3 Class 4 Class 5
0
10
20
30
40
50
60
70
80
90
100
Reading Levels
Class-wise Disaggregation
Cannot Read
Read very slow
Read slow
Read moderate
Read fast
Class
Pe
rce
nta
ge
of
Stu
de
nts
Class 3 Class 4 Class 5
0
10
20
30
40
50
60
70
80
90
100
Learning Levels in EVS
Class-wise Disaggregation
Not attempted
Wrong
Partially Wrong
Correct
Class
Pe
rce
nta
ge
of
an
sw
ers
Class 3 Class 4 Class 5
0
10
20
30
40
50
60
70
80
90
100
Learning Levels in Mathematics
Class-wise Disaggregation
Not attempted
Wrong
Partially Wrong
Correct
Class
Pe
ce
nta
ge
of
an
sw
ers

97
Annexure 2 - Tabulated RAT & CAT data Table 8: RAT & CAT data of all classes
Reading Levels
All classes
Reading Levels
Read fast 37.55
Read Moderate 16.94
Read Slow 10.38
Read very slow 4.32
Cannot read 30.81
Percentage of Students
Learning Levels in Mathematics
All classes
Learning Levels in EVS
All classes
Reading Levels
Class-wise Disaggregation
Learning Levels in Mathematics
Class-wise Disaggregation
Learning Levels in EVS
Class-wise Disaggregation
Correct 48.33
Partially Wrong 18
Wrong 29.67
Not attempted 4
Evaluation of answer
Percentage of Answers
Correct 48.33
Partially Wrong 2
Wrong 44
Not attempted 5.67
Evaluation of answer
Percentage of Answers
Correct Wrong
Class 3 52 25 17 6
Class 4 51 15 30 3Class 5 42 14 42 2
Class/ Evaluation of answer
Partially Wrong
Not attempted Correct Wrong
Class 3 44 3 45 8
Class 4 51 1 43 5Class 5 50 2 44 4
Class/ Evaluation of answer
Partially Wrong
Not attempted
Class 3 30.02 15.71 12.52 4.43 37.33
Class 4 39.77 14.45 8.83 4.22 32.73
Class 5 42.72 20.53 9.81 4.30 22.64
Class/ Reading Level
Read fast
Read m odera te
Read slow
Read very slow
Cannot Read

98
Table 9: Reading Results Disaggregation Percentage of students
Class Type of
School Read Fast
Read Moderate
Read Slow
Read Very Slow
Cannot Read
Class 3 E1 20.79 18.56 17.33 4.95 38.37
E2 32.71 16.94 12.24 4.00 34.12
Control 35.67 12.04 8.53 4.38 39.39
Class 4 E1 41.98 12.30 12.03 5.08 28.61
E2 33.41 19.60 11.14 5.35 30.51
Control 44.20 11.16 3.94 2.41 38.29
Class 5 E1 28.92 26.75 13.98 8.19 22.17
E2 46.53 25.23 9.03 2.08 17.13
Control 51.26 10.88 6.90 2.93 28.03
Table 10: Percentage of students who are able to read at different levels of accuracy and their comprehension levels in classes 3, 4 and 5 separately
Table 11: In E1 Schools, percentage of children who are able to read and their accuracy levels
School name
Total No: of students tested
Percentage of students able to read School name
Percentage of readers with 80% accuracy
Balugan UGME-E1 44 95 Balugan UGME-E1 95
Barapalii UGME -E1 43 95 Model boys PS- E1 82
Class Schools Above 80% Accuracy Comprehension Level Below 80% Accuracy Comprehension Level
Class 3 E1 54% 48% 8% 39%
E2 61% 49.6% 4% 44.26%
Control 57% 53% 4% 49%
Class 4 E1 67% 37% 4% 23%
E2 68% 41% 1% 37%
Control 60% 42% 2% 19%
Class 5 E1 68% 19.5% 10% 17.5%
E2 75% 21% 8% 16%
Control 68% 20% 4% 17%
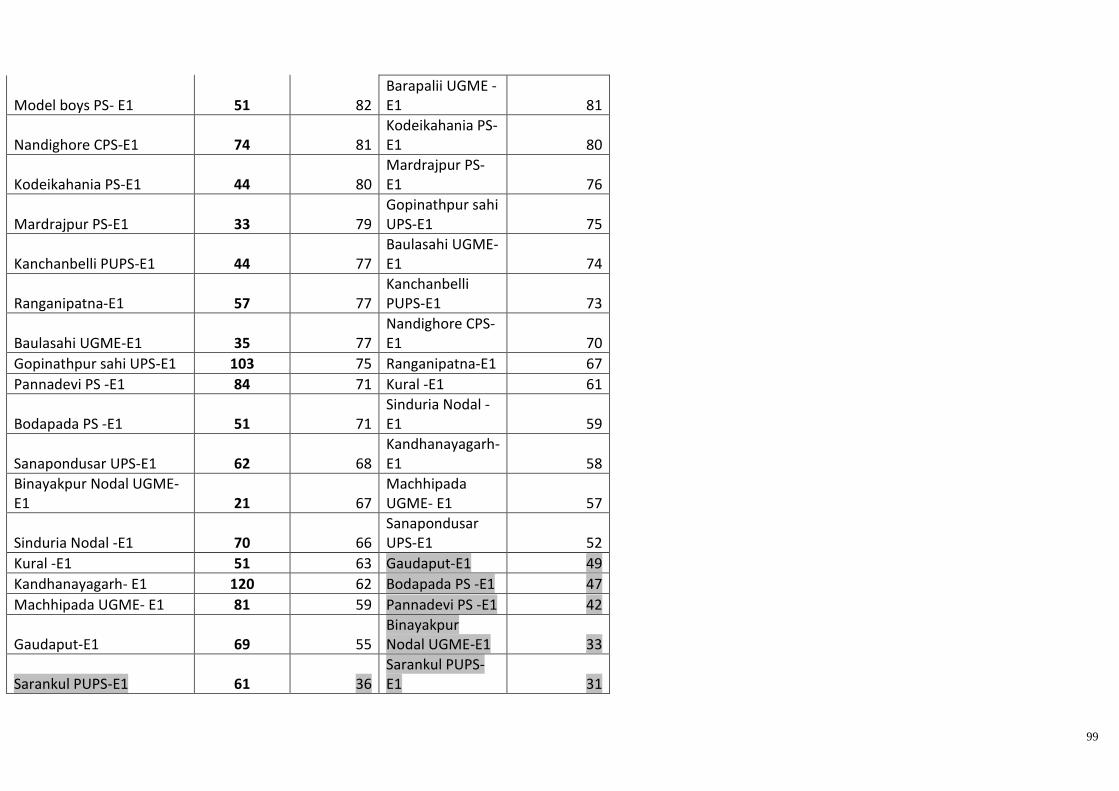
99
Model boys PS- E1 51 82 Barapalii UGME -E1 81
Nandighore CPS-E1 74 81 Kodeikahania PS-E1 80
Kodeikahania PS-E1 44 80 Mardrajpur PS-E1 76
Mardrajpur PS-E1 33 79 Gopinathpur sahi UPS-E1 75
Kanchanbelli PUPS-E1 44 77 Baulasahi UGME-E1 74
Ranganipatna-E1 57 77 Kanchanbelli PUPS-E1 73
Baulasahi UGME-E1 35 77 Nandighore CPS-E1 70
Gopinathpur sahi UPS-E1 103 75 Ranganipatna-E1 67
Pannadevi PS -E1 84 71 Kural -E1 61
Bodapada PS -E1 51 71 Sinduria Nodal -E1 59
Sanapondusar UPS-E1 62 68 Kandhanayagarh- E1 58
Binayakpur Nodal UGME-E1 21 67
Machhipada UGME- E1 57
Sinduria Nodal -E1 70 66 Sanapondusar UPS-E1 52
Kural -E1 51 63 Gaudaput-E1 49
Kandhanayagarh- E1 120 62 Bodapada PS -E1 47
Machhipada UGME- E1 81 59 Pannadevi PS -E1 42
Gaudaput-E1 69 55 Binayakpur Nodal UGME-E1 33
Sarankul PUPS-E1 61 36 Sarankul PUPS-E1 31

100
Table 12: In E2 Schools, percentage of children who are able to read and their accuracy levels
School name
Total No: of students tested
Percentage of students able to read School name
Percentage of readers with 80% accuracy
Ghadual PUPS-E2 56 89 Ghadual PUPS-E2 83.93
Bodhipatna UPS-E2 43 88 Bodhipatna UPS-E2 83.72
Mayurjhalia PS-E2 68 87 Nilakantha PS-E2 81.25
Krishnaprasad UPS-E2 60 87 Model girlsUPS-E2 78.13
R.N .Nodal UPS, Badapandusar-E2 88 83
Sarangadharpur UPS -E2 76.19
Nilakantha PS-E2 80 81
R.N .Nodal UPS, Badapandusar-E2 76.14
Model girlsUPS-E2 64 78 Solapata UPS- E2 73.53
M.G. Nodal UPS,Biruda-E2 90 77 Krishnaprasad UPS-E2 73.33
Solapata UPS- E2 68 76 Mayurjhalia PS-E2 70.59
Sarangadharpur UPS -E2 21 76 M.G. Nodal UPS,Biruda-E2 66.67
Lathipada Nodal UPS-E2 94 73 Badakutuni PUPS -E2 65.63
Badakutuni PUPS -E2 32 72 Ikiri PS-E2 64.15
Ikiri PS-E2 53 72 Lathipada Nodal UPS-E2 62.77

101
Itamati Nodal -E2 84 71 Harekrushnapur UGME-E2 60.23
Harekrushnapur UGME-E2 88 66 Itamati Nodal -E2 59.52
Harijanbasti UPS-E2 53 60
A.C.Nodal UPS,P-Manpur-E2 58.75
Komando UPS -E2 87 60 Komando UPS -E2 58.62
A.C.Nodal UPS,P-Manpur-E2 80 59 Harijanbasti UPS-E2 58.49
Kirdaspur ME-E2 61 57 Kirdaspur ME-E2 57.38
Nabaghanapur UGME- E2 63 49 Nabaghanapur UGME- E2 47.62
In 95% E2 schools, more than 50% students are able to read at high levels of accuracy, the exception being Nabaghanapur UGME. =============================================================
Mathematics Results Disaggregation Percentage of answers
Table 13: No. of students tested on Competency Achievement in Math
Classes Types of Schools Tested Absent
Class 3 E1 488 3
E2 470 5
Control 450 0
Class 4 E1 485 0
E2 470 1
Control 492 0
Class 5 E1 471 7
E2 539 0
Control 493 1
Total 4358 17

102
C:Correct PW: Partially Wrong W: Wrong NA: Not Attempted
Table 14: Overall achievement in Mathematics
Class Type of School Correct Partially Wrong Wrong Not Attempted
3 E1 51 25 17 7
E2 51 24 18 6
Control 52 25 16 6
Average 52 25 17 6
4 E1 52 14 30 4
E2 47 17 33 3
Control 55 14 28 3
Average 51 15 30 3
5 E1 41 13 43 3
E2 41 14 43 2
Control 43 14 41 3
Average 42 14 42 2
Table 15: Performance in the content domain: number sense
Number Operations Number Sense
Class Type of School C PW W NA C PW W NA C PW W NA
Class 3 E1 48 27 18 7 50 24 18 8 49 26 18 7
E2 49 27 19 6 50 23 20 6 49 25 20 6
Control 49 28 17 6 52 24 18 6 50 26 18 6
Average 49 27 18 6 51 24 19 7 49 26 18 6
Class 4 E1 55 21 20 4 43 17 36 3 50 19 28 4
E2 50 25 22 3 41 20 37 2 46 22 29 3
Control 56 22 19 3 48 15 34 3 52 19 26 3
Average 54 23 21 3 44 17 36 3 49 20 28 3
Class 5 E1 37 19 42 2 55 17 26 2 45 18 35 2
E2 38 20 41 1 55 18 25 2 46 19 34 1
Control 39 18 40 2 57 18 23 3 47 18 32 2
Average 38 19 41 2 55 18 25 2 46 18 34 2

103
Table 16: Performance in the Content domain: Patterns
Class Type of School C PW W NA
Class 3 E1 43 5 38 13
E2 41 4 39 15
Control 43 4 38 15
Average 43 5 38 14
Class 4 E1 66 4 28 2
E2 53 2 41 3
Control 64 4 29 3
Average 61 3 33 3
Class 5 E1 45 9 42 4
E2 37 8 50 5
Control 33 10 52 5
Average 39 9 48 5
Table 17: Performance in the Content domain: Measurement
Class Type of School C PW W NA
Class 3 E1 46 ---- 51 3
E2 49 ---- 49 3
Control 50 ---- 48 1
Average 48 ---- 49 2
Class 4 E1 57 5 37 1
E2 51 5 42 1
Control 56 5 38 1
Average 55 5 39 1
Class 5
E1 34 9 57 1
E2 34 8 57 1
Control 34 8 57 1
Average 34 8 57 1
Table 18: Performance in Cognitive Domains (Analysis confined to students who have given correct answers)

104
Class Type of
School Knowing Facts & Procedures
Solving Routine Problems
Using Concepts
Reasoning
Class 3 E1 64 53 25 56
E2 68 53 24 50
Control 71 53 23 52
Average 68 53 24 53
Class 4 E1 35 51 50 70
E2 33 47 44 63
Control 36 57 52 71
Average 35 52 49 68
Class 5 E1 55 43 28 37
E2 53 40 30 39
Control 58 44 28 39
Average 55 42 29 38

105
EVS Results Disaggregation
Table 19: Number of students tested in EVS
Classes Types of Schools Tested Absent
Class 3 E1 489 2
E2 474 1
Control 450 0
Class 4 E1 484 1
E2 471 0
Control 492 0
Class 5 E1 477 1
E2 538 1
Control 494 1
Grand Total 4,369 7
Percentage of answers
C: Correct PW: Partially Wrong W: Wrong NA: Not Attempted Table 20: Overall achievement in EVS
Class Type of School Correct Partially Wrong Wrong Not Attempted
3 E1 42 3 46 9
E2 46 3 44 6
Control 45 3 45 8
Average 42 3 46 9
4 E1 52 1 42 5
E2 49 1 45 5
Control 52 1 42 5
Average 51 1 43 5
5 E1 50 3 42 5
E2 49 2 46 3
Control 50 2 43 4
Average 50 2 44 4

106
Table 21: Performance in the Content domain: Social Science
Class Type of School C PW W NA
Class 3 E1 42 5 44 9
E2 46 6 42 6
Control 47 5 40 8
Average 45 5 42 8
Class 4 E1 52 1 42 5
E2 49 1 45 5
Control 52 1 42 5
Average 51 1 43 5
Class 5 E1 52 3 42 4
E2 50 2 45 2
Control 50 3 44 3
Average 51 3 44 3
Table 22: Performance in the Content domain: Life Science
Class Type of School C PW W NA
Class 3 E1 40 2 50 9
E2 46 1 47 6
Control 42 2 49 7
Average 43 2 49 7
Class 4 E1 52 1 37 9
E2 49 1 40 9
Control 53 1 38 9
Average 51 1 38 9
Class 5 E1 44 4 46 6
E2 42 3 51 4
Control 45 4 46 6
Average 44 3 48 5
Table 23: Performance in the Content domain: Physical Science
Class Type of School C PW W NA
Class 3 E1 44 1 45 10
E2 48 1 44 7

107
Control 44 1 45 9
Average 46 1 45 8
Class 4 E1 37 1 55 7
E2 36 1 56 6
Control 39 1 55 6
Average 37 1 55 6
Class 5 E1 56 0 39 5
E2 56 1 40 3
Control 58 0 38 4
Average 57 0 39 4
Table 24: Performance in the Content domain: Earth Science
Class Type of School C PW W NA
Class 3 E1 -- -- -- --
E2 -- -- -- --
Control -- -- -- --
Average -- -- -- --
Class 4 E1 59 -- 39 2
E2 53 -- 44 2
Control 58 -- 39 2
Average 57 -- 41 2
Class 5 E1 50 3 41 6
E2 48 3 46 4
Control 51 2 42 6
Average 50 2 43 5
Table 25: School wise achievement level in Math and EVS of E1 schools
School Name Total
Average Percentage
in Math
School Name Total
Average Percentage
in EVS
Gopinathpur UPS 53.25
Gopinathpur UPS 56.5
Nandighar CPS 51.75
Model Boys,
Ranpur 56.25
Sanapandusar 51.25 Balugaon UGME 55
CS Nodal, 51.25 Gaoudaput CPS 54

108
Table 26: School wise achievement level in Math and EVS of E2 schools
Machipada
BarapalliUGME 50
JN Nodal, UPS,
Kural 53.25
Baulasahi P.S 49.5 Nandighar CPS 51
Balugaon UGME 47.75 CS Nodal, Machipada 49
Model Boys, Ranpur 47.25 Sinduria Nodal 48.25
Kanchhanbelli 46.75 Baulasahi P.S 47.5
Pannadevi P.S 46.75 Kodie kahania 46.5
Bodapada P.S 46.5 Pannadevi P.S 46.5
Sinduria Nodal 46.25 BarapalliUGME 46
Kodie kahania 46
Ranganipatna
CPS 45.75
Sarankul PUPS 43.75 Sanapandusar 45.5
Mardarajpur
UGME 42.5
Mardarajpur
UGME 45.25
Binayakpur Nodal UPS 41 Sarankul PUPS 44.25
Gaoudaput CPS 40.5 Kanchhanbelli 43.25
JN Nodal, UPS, Kural 39.75
Kandhanayagarh PS 42.5
Ranganipatna
CPS 39.75
Binayakpur
Nodal UPS 42
Kandhanayagarh
PS 35.5 Bodapada P.S 40.5
School Name Total Average Percentage in Math School Name Total Average Percentage in EVS
Solapata UPS 60 Nilakantha PS, Sarankul 56.75
Nilakantha PS, Sarankur 57.25 Solapata UPS 55.25
Ghadual PUS 56.25 Ghadual PUS 52.5
Lathipada UPS 50 Nabaghanapur UGME 51.25
Nabaghanapur UGME 49.75 KrishnaprasadUPS 50.75
Ikiri UGME 48.5 Bodhipatna 50.5
Sarangadharpur 48.25 Harekrushanapur UPS 50
Komanda Nodal UPS 46.5 Lathipada UPS 48.75

109
Harekrushanapur UPS 46 P Manpur AC Nodal UPS 48.75
P Manpur AC Nodal UPS 45.75 Mayurjhalia PS 48.25
Biruda UPS 45.25 Sarangadharpur 47.75
Badapandusar Nodal 44.75 Biruda UPS 47.5
Bodhipatna 44.75 Badapandusar Nodal 47
Itamati UPS 44 Ikiri UGME 47
Mayurjhalia PS 41.75 Itamati UPS 45.75
KrishnaprasadUPS 40.25 Komanda Nodal UPS 44.5
Kirdaspur 39.75 Model Girls, Ranpur 43.75
Badkutni PUPS 39.75 Badkutni PUPS 43.25
Harijanabasti 35 Kirdaspur 41.25
Model Girls, Ranpur 32 Harijanabasti 40.75

110
Annexure 3 – Teacher Tools
ICT TOOL
School code:
Teacher’s name:
Computer Aided Learning Study
1. Do you own a computer? A. Yes B. No
2. Have you ever used a computer A. Yes B. No
a. If Yes, how often have used the computer
i. Daily
ii. Once a week
iii. Once a month
iv. Very rarely
PLEASE ANSWER THE QUESTIONNAIRE BELOW ONLY IF YOU HAVE REPLIED ‗YES‘ TO Q.2
Technology Learning Need Analysis
This section is intended to gather information on your present skills in using computers and to help us
identify your learning needs
1 Basic Operations I know how to
use this
I have to
learn this
A Log into the computer system
Shutdown the computer system properly
Drag and move icons/objects on the computer desktop
Save file in a given location (e.g. Specific folders, pen drive etc.,)
Retrieve files from a given location (e.g. Specific folders, pen drive etc.,)
Rename a file or save an existing file with a new filename
Create folders and organise files
Start and close application software
Switch between application windows
Print files
Print Specific Page(s) of a document
Change page orientation - Portrait to Landscape and vice-versa
Identify the key parts of the computer and its peripherals (e.g.
System unit, mouse, keyboard, USB port)
2 Word Processing I Know how to
use this
I have to learn this
Change the style of text: Bold, italic, underline, colour
Change font and font size of text

111
Use Edit operations - Copy, cut and paste text
Add/Remove numbering or bullets
Set alignment to paragraphs of text (e.g. full justification)
Insert symbols
Use spelling checker feature
Change normal text to super/sub-script (e.g. x2)
Insert/Remove page breaks
Create a table
Insert/Delete rows/columns of table
Insert/Delete pictures/shapes
Insert header/footer
Insert page number (auto-page numbering)
3 Spreadsheet/excel I Know
how to use this
I have to
learn this
Enter text and numbers
Insert/delete columns and rows
Select and resize columns and rows
Know the layout of a spreadsheet and terms used (e.g. cells, rows,
columns, cell address, formula bar)
Edit cell entries
Insert/Delete worksheets within a spreadsheet
Rename worksheets within a spreadsheet
Print selected area of spreadsheet
Format data according to data types (e.g. decimal, date)
Format the look of the cell (border, colour)
Enter formulas with basic operations ( + - * / )
Insert mathematical functions in formulas
Create charts/graphs using chart wizard
Edit chart objects (e.g. title, colour)
Sort text and numbers in ascending/descending order
4. Multimedia Presentations I Know how to
use this
I have to learn this
Create a presentation
Save a presentation in different formats (e.g. slideshow, image)
Create/Delete objects (e.g. textbox, word art auto shapes) in a slide
Print the presentation in several modes (e.g. handouts, notes page)
Print selected slides
Animate text/objects in a slide

112
Format text in textbox and word art (e.g. colour, size)
Format auto shapes (e.g. colour, thickness of line)
Insert/Delete images
Resize images
Crop images
Insert sound and video files
Insert hyperlink to websites and other files
Insert action buttons as navigation aids
Organize slides in the desired order (e.g. hyper linking within the same presentation)
5 Internet I Know how to use this
I have to learn this
Enter web address
Return to previously viewed pages
Store website address under Favourites
Play media (e.g. play audio/video clips) embedded in a
webpage
Download files (e.g. presentation slides, pdf)
Copy images
Search the world wide web for information
Search for specific resources (e.g. images, audio files)
Search using more than one search engine
Search using keywords
6 Email I Know how to use this I have to learn this
Compose/Delete email messages
Send/Reply email message
Send attachment with emails
Download attachments
Organize mail folders
Create address book
7 Use of data collection tools I Know how to use this I have to learn this
Connecting the digital camera, microphone to
computer
Take still images/short video clips using digital camera
Download images/video clips from digital
camera to computer
Activate the Sound Record (from Windows) to
record sound using microphone
Use Windows Movie Maker to do simple editing of clips (e.g. shortening the clip)

113
Teacher Information & Perceptions
State: Cluster name:
School code: Name of school:
As a part of the research study, we are collecting some information on the school and processes in the school, your familiarity with technology etc. We request you to provide answers to a few questions. Please
remember that there are no right or wrong answers. We are only interested in your opinions and
preferences. The data we collect will be used only for research purposes and confidentiality of the data will be maintained
Name of teacher: Gender: F / M
Designation: Head Teacher / Asst Teacher / Teacher on deputation / Para teacher
Section A – Background
1. Which classes do you teach? What subjects do you teach?
Class 1 Class 2 Class 3 Class 4 Class 5
Teach Y/N
Subjects
2a. For how many years have you been teaching?:
2b. For how many years have you been teaching in this school? :
3. What are your educational qualifications? a. Basic qualifications: Class 12 / BA, BSc, BCom / Others
b. Specialised / Educational qualifications: TCH, D Ed, Diploma / BEd / MEd / Others
Section B – NCF
4a Are you aware of the National Curricular Framework (2005) document prepared and
released by MHRD? No: 1 Yes: 2 (If response is No, go to Q5a)
4b. Have you read either that document or its summary?
Just glanced through the summary: 1 Read the summary in detail: 2 Read the main document: 3
4c. In your opinion, is it a useful document? No: 1 Can‘t say: 2 Yes: 3
4d. Do you think the recommendations in that document can be implemented?
No: 1 (go to Q 5a) Not sure: 2 (go to q 5a)
Yes: 3
4e. Mention any one recommendation that you think should be necessarily implemented:

114
Preparation and Lesson Plan
5a. Do you have a written lesson plan for your class? No, I do not have a written lesson plan: 1 (go to Q 6)
No, I do not have a written lesson plan. I have a rough idea before I start everyday: 2 Yes, I have a formal plan. This is given to us by our Head Teacher/others: 3
Yes, I have a lesson plan. This is prepared by me: 4
(Please collect a copy of a lesson plan used by the teacher)
5b. Are you able to follow the lesson plan prepared / used by you?
Only once in a while: 1 Yes, very often: 2 Yes, regularly: 3
6. Do you make preparations in advance for your class? No: 1 Yes: 2
Section D – Daily Report /Journal
7a. Do you maintain a diary or a journal of the your daily school‘s activities?
No: 1 (go to question 9) Yes: 2
(Please collect a copy of the Journal / Diary)
7b. How often do you maintain / fill up / write in the journal?
Once at the end of the term: 1 Every week: 2 Every day: 3
8. Do you think maintaining a journal is useful? In what way?
No, it is not very useful: 1
Yes, it is useful because: …………………………………………………………………………………
Section E – Home Work and Assessment
9. Do you give home work to children in class? How often?
No, I do not believe in giving home work to children: 1 Yes, but rarely: 2 As and when needed: 3 Once a week: 4 Daily: 5
10. Do you check the home work and make corrections to give feedback to the children?
Whenever I get time: 1 Very Often/ many times: 2 All the homework: 3
11. Besides the annual exam and the terminal (mid-year) exam, do you carry out any other assessments to
measure learning achievement in class? Yes: 1 No: 2 (If response is No, go to Q 13)
12. Can you provide details of other assessments?
_______________________________________________________________________________
_______________________________________________________________________________
_______________________________________________________________________________
(Please collect sample assessment papers other than annual/terminal papers)
Section F – Computer Usage
13. Have you used a computer at all so far? No: 1 (go to Q 17) Yes: 2
14. How often have you used a computer so far?

115
Just 1 – 2 times: 1 about 10 – 12 times: 2 Several times: 3
15. How comfortable are you with using a computer? Not very comfortable. I need a lot of help: 1
I need some help once in a while: 2 I am fairly comfortable using computers: 3
I am very comfortable using computers: 4
16. Do you use Internet? for what purpose do you generally use (Check all that apply)
No, I do not use it: 1 To gather information from a variety of sources: 2
To communicate with others outside of the school (e-mail etc): 3
other (please specify ___________________________________) 4
17. Have you attended any training/development programs in the use of technology during
the past two years ?
No, none: 1 Yes, a few: 2 Yes, several training programs: 3
18. Have you attended any training/development programs in the use of technology for
teaching specific subjects during the past few years?
No, none: 1 Yes, a few: 2 Yes, several training programs: 3
19. Do you think Computers could be useful in teaching concepts to children in a better way? No, I do not think so: 1 (go to Q 21)
Not sure: 2 (go to Q 21) Yes, it will be useful: 3
20. In what way will computers be useful for teaching concepts to children?
___________________________________________________________________________
___________________________________________________________________________
21. Do you think computers can be useful for teachers?
No, I do not think so : 1 (go to Q 23)
Not Sure: 1 (Go to Q 23)
Yes, it will be useful: 2
22. In what way will computers be useful for teachers?
___________________________________________________________________________
___________________________________________________________________________
23. Is there a Computer at your home? No: 1 Yes: 2
24. What is the aim of education?
25. What is the role of a teacher?
Thank you

116
Teacher’s Sense of Self Efficacy & Attitude
Name of Teacher: School code: School name: Cluster name: Dear Teacher: Here are a few statements about learning and class rooms. Please go through these and for each, please mark the extent to which you agree or disagree with it. Please put a tick ( √ ) in the appropriate column. Please remember that there are no right or wrong answers. We are only interested in your opinion for research purposes. Thank You.
(1= totally disagree, 2=disagree, 3=Neither agree nor disagree 4=agree, 5=totally agree)
S No Statements
Strongly disagree
Disagree Neither agree nor
disagree
Agree Strongly agree
1 Giving correct answer in Maths or Science means the child has understood the concept
2 Rote learning ‗tables‘ is critical to learn Math
3 Children should not question teachers‘ answers in class
4 Good children memorize a lot of information
5 In any good class room, children maintain silence
6 Boys do better in Maths than girls
7 If most children do badly in class, it means that the children have not put in the needed effort
8 Good students understand things quickly
9 Guide books are necessary for children to learn
10 If children need to learn language well, they must first master the grammar
11 Most words have one clear meaning
12 A good teacher makes sure that the children are very disciplined
13 It is enough if questions at the end of the lesson in the text are solved by the children
14 Boys and girls learn at different pace
15 Younger teachers are smarter than older teachers
16 Some children just cannot be disciplined without the use of ‗caning‘
17 It is better for a teacher to focus attention on the brighter children
18 It is not necessary to go outside the prescribed text book
19 Making sure that children learn is as much the responsibility of the parents as the teachers

117
20 Learning does not mean knowing the correct answer but knowing
how to find the right answer
21 For a teacher, completing the allotted portion in the year is the most important thing
22 Documenting what happens in class every day by the teacher is a waste of time for the teacher
23 Children need not be given any home work because they do not do it in any case
24 Disciplining the child is the responsibility of the parents
25 Use of technology and computers is only suited for 'big' private schools
26 Use of computers diminishes the role of teachers/ decreases importance of teachers.
27 Students should not handle computers without teachers help.
28 Computers are mainly useful for the bright students
29 CD usage enhances subject matter learning in children
30 CDs help teachers in preparing teaching materials
31 It is better to provide facilities of toilets and drinking water in schools instead of providing computers?
32 Computers can provide joyful learning
33 All children are not capable of learning from CDs
34 Computers are meant more for big private schools
THANK YOU
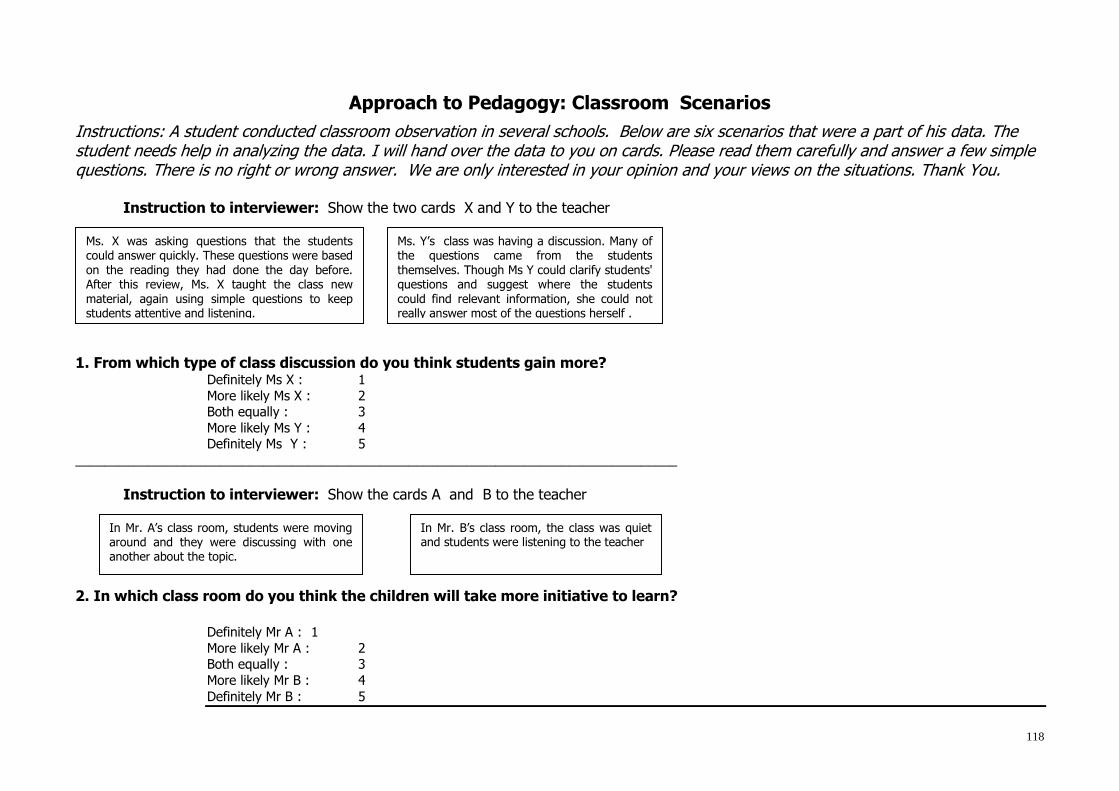
118
Approach to Pedagogy: Classroom Scenarios
Instructions: A student conducted classroom observation in several schools. Below are six scenarios that were a part of his data. The student needs help in analyzing the data. I will hand over the data to you on cards. Please read them carefully and answer a few simple questions. There is no right or wrong answer. We are only interested in your opinion and your views on the situations. Thank You.
Instruction to interviewer: Show the two cards X and Y to the teacher
1. From which type of class discussion do you think students gain more?
Definitely Ms X : 1
More likely Ms X : 2 Both equally : 3
More likely Ms Y : 4 Definitely Ms Y : 5
___________________________________________________________________________________
Instruction to interviewer: Show the cards A and B to the teacher
2. In which class room do you think the children will take more initiative to learn?
Definitely Mr A : 1
More likely Mr A : 2 Both equally : 3
More likely Mr B : 4
Definitely Mr B : 5
In Mr. A‘s class room, students were moving around and they were discussing with one another about the topic.
In Mr. B‘s class room, the class was quiet and students were listening to the teacher
Ms. X was asking questions that the students could answer quickly. These questions were based on the reading they had done the day before. After this review, Ms. X taught the class new material, again using simple questions to keep students attentive and listening.
Ms. Y‘s class was having a discussion. Many of the questions came from the students themselves. Though Ms Y could clarify students' questions and suggest where the students could find relevant information, she could not really answer most of the questions herself .

119
Instruction to the interviewer: Show cards P and Q to the teacher
3. In which class room do you think will the children learn more?
Definitely Mr P : 1 More likely Mr P : 2
Both equally : 3
More likely Mr Q : 4 Definitely Mr Q : 5
_____________________________________________________________________________________
Instruction to the interviewer: Show cards K and L
4. From which teaching do you think the students will benefit the most?
Definitely Ms K : 1
More likely Ms K : 2 Both equally : 3
More likely Ms L: 4 Definitely Ms L : 5
_____________________________________________________________________________________
Instruction to the interviewer: Show cards M and N to the teacher
Ms. K refers to different books, internet resources and the text books, collects and organizes information and then teaches students. According to her, textbook is just one source for teaching
Ms. L keeps text book as the main source of information and refers to other books only when necessary. According to her, textbooks are to be used as the main source for teaching in the class room.
Mr. P has given the whole class the same exercise. He says that when activities have clear directions, and one that can be done in short intervals that match students' attention spans and the daily class schedule, learning is effective.
Mr. Q has given different assignments to different groups of students. He says that students have different ways of learning and different interests. So learning to be effective has to cater to the needs of students

120
5. In which class do you think the students will have more opportunity to construct knowledge?
Definitely Ms M : 1
More likely Ms M : 2 Both equally : 3
More likely Ms N: 4 Definitely Ms N : 5
-------------------------------------------------------------------------------------------------------------------------------------------------------------------------------------
Instruction to the interviewer: Show cards S and T to the teacher
6a. In which class do you think the students will show more reading ability?
Definitely Ms S : 1
More likely Ms S : 2
Both equally : 3 More likely Ms T: 4
Definitely Ms T : 5
6b. In which class do you think the students will be happier?
Definitely Ms S : 1
More likely Ms S : 2
Both equally : 3 More likely Ms T: 4
Definitely Ms T : 5
THANK YOU
Many children in the language class read ----- for --- ; or ---
--for ---. Ms. S corrects them immediately. She believes that if such mistakes are allowed to continue children will not develop good reading ability
Many children n the language class read ----- for --- ; or
-----for ---. Ms. T allows them to continue their reading. She believes that if such mistakes are corrected children will become hesitant to read and so their reading ability will not develop
Ms. M plans to teach EVS to class V students. She has brought many pictures on different kinds of dresses and food items to show to the children.
Ms. N plans to teach EVS to Class V students. She has told students the previous day to talk to the elders in the family and aged community embers to find out about life during their time – including dresses and food habits.

121
Table 27: Teacher Attitude Analysis
Name of the School Approach to Pedagogy
Beliefs on
Classroom Discipline
Beliefs about
Teaching as a profession
Beliefs about ability to learn
Beliefs on the
nature of Knowledge
Average of the school
E1 Group
Gopinathpur UPS 3.21 3.3 3.56 3.03 2.25 3.07
Nandighar CPS -- -- -- -- -- --
Machipada CS Nodal 3.96 4.1 3.84 3.35 2.74 3.6
Sanapandusar PUPS 3.51 4.13 3.45 2.98 2.62 3.34
Barapalli UGME 4.2 3.73 3.6 3.04 2.16 3.35
Baulasahi PS 3.29 3.67 3.69 2.95 2.83 3.29
Balugaon UGME 3.63 3.37 3.45 3 2.34 3.16
Ranapur Model Boys PS 3.68 3.14 3.67 3.68 2.25 3.28
Kanchhanbelli PUPS 3.64 3.17 3.53 3.09 2.75 3.24
Pannadevi PS 3.57 4.33 3.75 3.27 2.17 3.42
Bodapada P.S 3.26 3.22 4.08 3.53 2.56 3.33
Sinduria Nodal PUPS 3.29 3.86 3.59 3.19 2.57 3.3
Kodie Kahania PS 3.29 4.33 3.79 3.58 2.3 3.46
Sarankul PUPS -- -- -- -- -- --
Mardarajpur PS 3.14 4.33 3.75 3.23 2.39 3.37
Binayakpur Nodal UPS -- -- -- -- -- --
Gaoudaput CPS -- -- -- -- -- --
Kural JN Nodal UPS -- -- -- -- -- --
Ranganipatna CPS -- -- -- -- -- --
Kandhanayagarh PS 3.83 3.94 3.68 3.67 2.71 3.57
Average 3.54 3.76 3.67 3.26 2.47 3.34
E2 group

122
Ghadual PUS 3.68 3.58 3.81 3.43 2.39 3.38
Krishnaprasad UPS 3.86 3 3.56 3.32 3.11 3.37
Badapandusar Nodal 4.43 4 4 3.45 2.89 3.75
Nilakantha PS -- -- -- -- -- --
Solapata UPS 4.04 3.83 3.59 3.47 3.01 3.59
Biruda UPS 3.86 3.67 3.69 3.32 2.83 3.47
Sarangadharpur 3.63 4.27 3.5 3.69 2.69 3.56
Bodhipatna 3.86 4.33 3.88 3.23 2.67 3.59
Lathipada UPS 3.07 2.83 4 3.09 2.61 3.12
Mayurjhalia PS 3.24 3.94 3.04 3.78 3.15 3.43
Badkutni PUPS -- -- -- -- -- --
Ikiri UGME 3.21 3.83 3.44 3.91 2.94 3.47
Itamati UPS 3.94 3.13 3.7 3.09 2.78 3.33
Harekrushanapur UPS 3.69 4.22 3.98 3.23 2.94 3.61
Harijanabasti 3.48 3.38 3.88 4 2.76 3.5
Komanda Nodal UPS -- -- -- -- -- --
P Manpur -- -- -- -- -- --
Kirdaspur 3.78 2.9 3.48 3 2.37 3.11
Nabaghanapur UGME 3.69 3.48 3.82 3.1 2.52 3.32
Ranapur Model Girls 3.89 2.96 3.78 3.93 2.67 3.45
Average 3.71 3.58 3.7 3.44 2.77 3.44

123
Table 28: Number of teachers and their knowledge of computers
Name of the School Percentage of teachers who know computers Total average percentage of knowing
Balugaon Govt. MES School
9 25%
Barapalli 71.43
1 teacher – 100%
4 teachers – 2%
Baulashi PS Ugme
50 4.05%
Bodapada PS 60 1 teacher – 50%
2 teachers – 1.6%
Kanchanbelli PUP School
100 5 teachers – 3.29%
Kodie Kahania
33 1.27%
Mardarajpur PS
100 3.16%
Panadevi PS
83 4%
Sinduria Nodal UP (ME) School
91 8.29%
Binayakpur Nodak UPS
80 2.78%
J.C.Nodal UP (ME)
100 15%
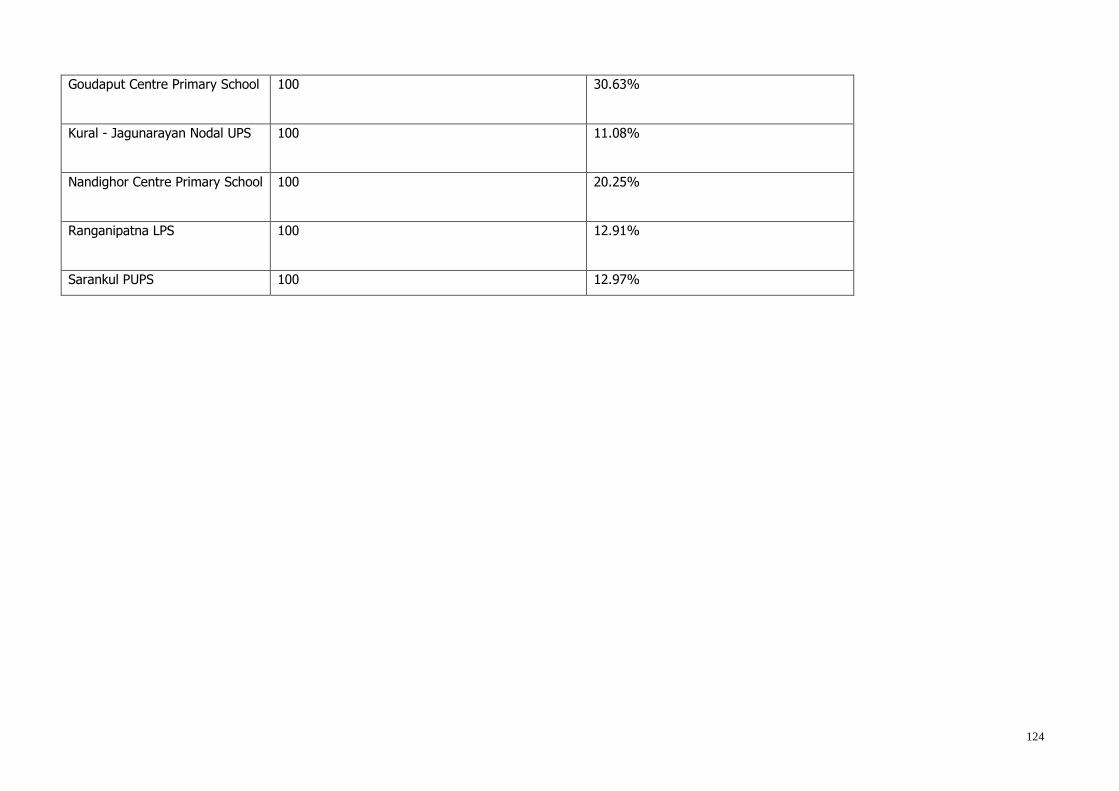
124
Goudaput Centre Primary School
100 30.63%
Kural - Jagunarayan Nodal UPS
100 11.08%
Nandighor Centre Primary School
100 20.25%
Ranganipatna LPS
100 12.91%
Sarankul PUPS 100 12.97%

125
Annexure 4: Reading Ability TEST: RAT
The test consists of reading passages and will assess of two components, namely decoding
reading comprehension.
The Decoding ability will be assessed by the actual reading of the student. A Running Record Form will be
used for this purpose. This form is for recording the errors in reading made by students. A detailed description of the form and the recording and scoring procedures will be dealt with separately.
Reading comprehension will be assessed through a set of questions. (You can give the passage to the
student 5 minutes before so that he/she can become familiar with the text). The student can refer to the passage while answering the questions.
Below are three reading passages for classes III, IV and V separately. The passages are graded according to the following criteria, namely:
1. Length 2. Complexity of sentence structure
3. Complexity of vocabulary
4. Complexity of Idea 5. The first and the second differ in Inter Textuality – (that is text within a text) The third passage
has a descriptive-cum-narrative structure.
Framework (Using the PISA Framework)
Text Type: Narrative
No. of Retrieving
Questions
Interpretive
Questions
Reflective
Questions
Total Comp
questions
Class 3
5 2 1 8
Class
4
3 3 1 7
Have a large font for the first passage and reduce it in the second passage and reduce it further in the third
passage. The group to discuss and take a common decision.
Print each of these passages on three different cards. (Don‘t have any instructions in this card) The child keeps the card and reads from it.
The child continues to have the reading card in his/her hand and is free to refer to it while answering
questions.
=============================================

126
Reading Passages
Passage 1 (for Class III)
Instructions to the Student: Read the Passage aloud. I will ask you some questions based on it. You have to answer them. So read carefully.
A Clown goes Shopping
One day, a clown went to a town to buy new clothes. First he tried on some pants. He didn't like them, so
he gave them back to the shopkeeper. Then he tried on a shirt which had the same price as the pants. He was pleased with the shirt, and he left the shop. As he climbed on his donkey to ride home, the shopkeeper
and the shop-assistant ran out.
"You didn't pay for the shirt!" said the shopkeeper.
"But I gave you the pants in exchange for the shirt, didn't I?" replied the clown.
"Yes, but you didn't pay for the pants, either!" said the shopkeeper.
"But I didn't buy the pants," replied the clown. "I am not so stupid as to pay for something which I never
bought." So saying, the clown returned home.
I will ask you some questions. Please answer them
Passage 2 (for Class IV)
Instructions to the Student: Read the Passage aloud. I will ask you some questions based on it. You have to answer them. So read carefully (Members please note – the last two lines in the announcement have to be in small font – try to make the announcement rhyming – example - in Tamil Vango Vango – Word for free food - saapDungo)
The Clown on his Birthday
It was the Clown‘s birthday that day. But his pockets were empty. He was walking dejectedly near a hotel.
Suddenly he saw an announcement:
FREE FOOD Eat As Much as You Want
Without bending your elbow Contest open till 30th June, 2008
The clown read the first two sentences and was delighted. Just then he glanced at the next line and his face
fell. He thought, ―how can I eat without bending my elbows?‖ Suddenly he was struck by an idea. He ran
to his friend Ali‘s house and said, ―Äli, today is my birthday. Come, I will give you a feast.‖
Both of them went to the hotel. The clown ordered varieties of food and sweet dishes. The clown and Ali sat opposite one another. The clown said, ―Äli, let me feed you with my own hands. In return, you can feed
me‖. Both of them ate to their heart‘s content. Ali was in a hurry and so left the hotel.
As the clown walked out of the hotel, the waiter came with the bill. The clown pointed to the announcement and said, ―I did not bend my elbow‖. ―Sir, the last date is over‖ said the waiter.
Now, I will ask you some questions. Please answer them.
II) Comprehension Questions , Answer and Scoring Sheet

127
Passage 1: A Clown goes Shopping
Comprehension Questions (Whatever is given in red indicates the type of comprehension questions)
Retrieving questions:
1) How did the clown go to the town?
On foot
by camel
by donkey
the story does not say
2) What did the clown do first in the shop
He tried on some pants
He tried on a shirt
He tried on a hat
He spoke to the assistant
3) What did the clown try on next?
A shirt
a pant
a hat
4) Which item did the clown like best
15. the shirt
16. the hat 17. the pants
5) From where did the clown return?
9. the City
10. the town 11. the Village
Interpretive Questions
6) Why was the shopkeeper angry when the clown left?
he did not take the pants
he didn‘t pay for the shirt
he did not say goodbye.
Reflective Question 7) According to you, What did the clown actually pay? Explain your answer.
See Scoring guide Correct answer: Nothing. Because he did not pay for the pant or the shirt
Wrong answer: Any other answer (e.g. Shirt, pant, money etc.,)
Scoring for passage 1: The Clown goes Shopping:
1- b; 2- a;
3-a; 4-a;
5-b;
6-b; 7:-
7- Score 2 – Correct answer with explanation – Nothing. Because he did not pay for the pant or the shirt / he did not pay for the pant / he did not pay for the shirt
Score 1 - Giving the correct answer without explanation. Nothing (without giving any
explanation) Score 0 - Wrong answer
Passage 2: A clown on his birthday

128
Retrieving questions:
1) Where did the clown give a feast to Ali? In the clown‘s house
In the hotel
In Ali‘s House
2) Why did the clown‘s face fall? Because he saw the third line of the announcement
Because he saw the first two lines of the announcement
Because he had to take his friend Ali to the hotel
3) Why did the clown and Ali sit opposite one another?
2. So that they could see one another 3. So that they could eat without bending their elbows
4. So that they could talk to one another
Interpretive Questions
4) What is the meaning of ―his pockets were empty‖ a) he did not have any money
b) his pockets did not have anything c) his pockets had something called empty
5) The phrase ―eating to the heart‘s content‖ means 5. Eating till one‘s stomach is full
6. Eating till one‘s stomach is full and the food reaches the heart 7. Eating till one is satisfied
6) Why is the last sentence in the announcement written in small size? So that people will eat a lot
So that people will not see it
So that people will go away without eating
7) Did the clown‘s have to pay the bill? Yes
No
Can‘t Say
Reflective Question
8) On which date does the clown‘s birthday falls? How were you able to identify the date?
See Scoring Guide.
Scoring 1= b
2= a
3= a 4=c
5=b 6=b
7=a
8 - Scoring Guide: 2 pt = Correct answer with reasons drawn from the announcement (1st July because the last date
of the contest is 30th June) 1 pt = Partially correct answer (1st July – without any reasons)
0 Pt = any other answer

129
Reading Passage 3 (for class V)
Hastin and Sandos had been were together for five years. Sandos was one of the strongest elephant living in
Madumalai Wildlife Sanctuary. One day, they were watching Hastin‘s father clear roads with other mahouts. The mahouts with their elephants were removing some trees that had been knocked into the road by wild
elephants.
As they watched, Hastin thought about becoming a mahout one day. To become a mahout Hastin had to prove to the head mahout that he could control an elephant. Just then, Hastin heard several yells
from the mahouts. "Hastin! Come quickly! I need you!" his father shouted to him. Hastin, immediately
climbed on the elephant, rode toward his father and saw that a jeep was fallen and was blocking the road.
Hastin commanded Sandos to push the jeep. Sandos pushed and pushed. At last, the jeep moved away from the road. All the mahouts congratulated Hastin. The head Mahout told, ―Hastin, from tomorrow
you will work as a mahout.‖
Questions knocked off: Question No:s 2,4,6,8
Now answer the following questions.
Retrieving questions:
1) From the story we know that wild elephants —
are very easy to control
can cause a great amount of damage
are much larger than trained elephants
cannot move heavy things
2) From what the reader learns about Hastin, which statement does not make sense?
Hastin and Sandos continue working together in the park,
Hastin decides not to be a mahout at the wildlife sanctuary.
Hastin becomes a great mahout at the wildlife sanctuary.
Hastin works every day to be a good mahout.
Interpretive Questions:
3) Paragraph 2 is mainly about -
how hard it is to become a mahout how elephants move trees
how the mahouts control the elephants
how mahouts protect the sanctuary

130
4) Why does Hastin have to prove his skills to the head mahout?
Hastin's father wants to show how well he has trained Hastin
The head mahout decides who becomes a mahout at the sanctuary
The head mahout says that Hastin is not yet fully trained.
Hastin wants the head mahout to stop giving him orders.
Reflective Questions:
5) Do you think Hastin was worried about being a Mahout? Why do you think so.? See Scoring Guide
6) How do you think Hastin felt after he and Sandos push the jeep back onto its four wheels? See Scoring Guide:
b
b
a
b
5- Point 2 = correct answer -Yes. Because very few people are made mahouts, it is difficult to become a mahout, Hastin has to control the elephant to become a mahout etc.,
No. Because Hastin has a good control over elephant, Hastin‘s father was also a mahout etc.,
Point 1: = partially correct = Yes or NO. (Without giving any reason)
Point 0 = wrong answer No. because Hastin loved his elephant, Hastin was used to taming elephants
Yes. Because Hastin was not capable of being a mahout, he was too young to be a mahout,
6) 1 point: correct answer – happy, proud, etc.,
0 point: any other answer not related to the story (e.g. disappointed, surprised)

131
Write up on What is Reading
As teachers, we often wonder why children are not able to read despite their best efforts. The root of the problem lies in the fact that many of us have very little conceptual understanding of reading.
Teachers often do not know why their students' reading abilities are low or high. .
For years, it was assumed that reading is a natural ability and develops on its own. This assumption is without any basis. Let us look at the concept of reading and its assessment more closely.
What is Reading: Reading is the process of making meaning from print.
Making meaning from print consists of two major components, namely, Mechanic and comprehension.
I. Mechanics consists of a) Knowledge of sounds - Called phonological awareness
b) Sound – letter correspondence – called decoding
c) Word analysis: Connection between individual sounds and the letters used to represent them – this includes not only awareness of the phonics aspect but also sight word recognition and
knowledge of parts of words like its roots, suffixes and prefixes
d) Fluency
II. Comprehension - It is called constructing meaning because it involves not only getting meaning of individual words but also combining ideas in the whole text with what we have in our own
memory. Comprehension itself consists of Vocabulary, background knowledge and the
knowledge of structure of text.
All these processes are like different strands of a rope and develop by intertwining with one another.
But in teaching of reading, there has been a tendency to focus only on aspect of the definition of reading.
This is predominantly the decoding approach. In the decoding approach, letters are taught either in the barakhaDi way or on the basis of the shape similarity that letter share. But mere decoding does not indicate
reading. A fluent reader makes meaning from print without being able to identify all the words. Remember the last time you got a note in messy handwriting? You may have understood it, even though you couldn't
decipher all the scribbles. (example of scrambled text)
A reader identifies words without being able to construct meaning from them. Most of us are able to read a
text that is in old Hindi/Tamil/Oriya without being able to understand it. We can also read a highly technical text (for example, an article on making of rocket written by a rocket scientist) and not understand it. A non-
fluent reader often identifies letters and words but is not able to make meaning from the text. So decoding by itself should not be taken as a measure of reading. Further even in teaching decoding, the emphasis is on
meaning.
In the first three years, language learning consists of learning reading and writing. There is a difference between language and script. Both are closely related. But script is just a medium for language. A language
can be written using any script. Many scripts can be used to write a language (e.g. Konkani – written in
Roman, Devanagari, Kannada and Malayalam scripts.). There are languages without any script. Most of our tribal languages fall in this class. When a community has stayed in a different state for several generations,

132
they begin to use the Script of the State language in their written interactions (e.g. Church services in
Karnataka where the Service is in Tamil but the script is Kannada; wedding invitations of Iyengar
community in Karnataka- were the content is in Tamil with the Kannada script). This divide between language and script has to be kept in mind when one is teaching reading. In teaching language using
alphabets, one has to think about whether we are teaching language or teaching script.
Let us now look at the view that Reading has to be deliberately learnt:
Reading is not a natural ability like speaking. It has to be consciously learnt and needs a great deal of time and effort on the part of students as well as teachers. When we talk of reading we make a difference
between learning to read and reading to learn. In learning to read, the content is just a ground for teaching reading but in reading to learn, it is the content that has to be learnt by reading. In learning to read
multileveled books are used by the teacher and the approach to teaching reading is to help children make
meaning from print. For this the teacher uses sight words, develops vocabulary through various activities, and helps children see the relation between print and sound. Instead of a single type of text, various types
of texts are used (e.g. Reading a dictionary, an advertisement, a word map, a set of instruction etc.,) In reading to learn, a main text book is used, and the focus is on acquiring the content of the lesson. In
schools, the focus is on reading to learn, and very little attention is paid to learning to read.
The approach to reading also holds the view that reading and writing abilities are not discrete abilities but are interconnected and develop in collaboration with one another. So teaching of reading and writing has to
be done together and each must be related to the other. Reading will reinforce writing and writing will be
reinforced by reading.
Reading (and writing) is not a natural ability like spoken language which is a natural ability. It has to be taught through systematic, organized instruction. Reading is a skill which is built upon through stages and is
a continuous process. The teacher has a very important role in helping students move from one stage to the other.
Write-up on Assessment of Reading
Teachers have to focus on learning to read. To achieve this focus, teachers have to ask themselves the question " What reading skills have my students learned?" Depending on the answer, a teacher can
determine whether to move ahead or go back and teach again, perhaps, in a different way, based on individual student needs.
Because children's backgrounds, learning needs, and skills vary, effective reading instruction depends on two main components.
(a) assess children's reading skills in an on-going manner and
(b) use assessment information to customize instruction to individual student needs..
Assessment is of two types. These are:
a) Assessment of learning: Helps to answer – What students knows – usually done during the end of the year exam
b) Assessment for learning:
Helps to identify areas where teachers need to modify their teaching
Helps to identify areas where students need help
This type of assessment is done every month or periodically

133
In assessing reading abilities of students it is essential to maintain separate record for each student.
This will help you to know at which stage the student is and where the student has problems. This knowledge will help to provide a direction for need –based inputs.
This will also help you to group students according to their reading levels – and will help you to simultaneously deal with different levels of reading problems.
This will help you to keep track of the dates of assessment. If students have not been able to demonstrate awareness of sound, redo the assessment after a few days.
Do not formalize any assessment procedure. Do it as a game. The below given is a list of measures
to assess students on their reading abilities.
So what is the type of assessment we are talking about? Discuss amongst yourselves.
Assessment of Reading:
The way reading is assessed assumes three models of what is wrong in reading and how to address it. The three models are
The Deficit Model
The Contextual Model
The Developmental Stage Model
The Deficit Model:
Assessments that use a deficit model see Students as patients having some problems with reading. The role of teacher is like a doctor. It is to identify the problems that students have and address them. So if a student is unable to read, the problem lies with the students inability. Reading failures are because of a
single cause and a single medicine (approach) can be used to set right the problem. In such a model,
reading is assessed through specific tests like phonological awareness and remediation consists of identifying the problem and giving more practice in the problem area.
The Contextual Model: This model holds the view that there is a mismatch between students‘ approach to
reading and the teaching of reading. Students coming from the disadvantaged background are not used to literacy and so find it difficult to read. In remediation, this approach emphasizes on the use of relevant
materials – appropriate to the socio-cultural context of the students, their levels etc.,
The Developmental Stage Model: This model sees reading as developing through stages. The student has to assimilate one stage before progressing towards the next stage. In this model of assessment, the stage at
which students are is first identified. Students are then provided inputs that help them to move to the next
stage. We will be working with the Developmental stage model of reading assessment.
Current Reading Assessment Test
There are several ways to assess reading. Some use a set of words, while some give a story and test for comprehension. We use a running record method. This method allows assessment of reading in process –
that is as the student is reading. Hence it allows for capturing the nuances of the student‘s reading.
The Reading is assessed using an informal method. Such a method consists of giving a passage to students and scoring each word read by them.
The teacher prepares a reading passage, and a running record to record each students‘ reading. (See Sample).
She prepares a set of questions to test comprehension. These are retrieving, interpretive and reflective questions.

134
+++++++++++++++++++++++++++++++++++++++++++++++++++++++++++++++++
Write-up on Developmental Stages in Reading and Writing
Stages Reading Writing Knowledge of alphabets
Spelling
Stage
1:
Identifies letters according to their
sound
Is able to sketch
how the story goes
Unaware of
alphabets and how they
combine
Sound-letter
correspondence is partial and for the
beginning of word
Comprehension: (a) Can Retell familiar stories with a few details
and (b) Can use pictures as clues to
read names of objects they
see/use every day (e.g. name of tooth powder/ soap/traffic signal
etc.,)
Can express two thoughts with a
beginning and an ending
Develops partial
awareness of alphabets
Sees Words as a whole. Does not
pay attention to letters in the words. Does not differentiate
between word and false/ pseudoword,
Recognize Basic sight words. e.g.
I, you, he, she, it, etc.,
Stage 2 Blends Syllables: (example: nal - /na/ /l/ (tap). This process
is called decoding
Express three to four thoughts with
a beginning and an
ending. Adds one or two details –
representing elaboration of an
idea.
Knows all letters and
sounds and
uses chunks – full awareness
of alphabets
Uses temporary spellings and sight
words
Reading: Begins to read connected texts and reads
common sight words
Speed: Reads one word in 2-3 sec and gradually the number
of words read increases to become one word per second
Develops ability to self-correct
Comprehension: As they read
connected texts they begin to use chunking. In the process,
they begin to understand the significance of space between
letters and recognize punctuation and how it affects meaning and
expression
Word: Attend to the first and last
syllable of a word.
Able to recognize new words but are not able to say what the
words mean

135
Stage 3 Reads multi syllabic words (e.g. kamal) The way of reading connected text also undergoes change with
children paying attention to
phrasings and expressions. Read 90-100 words per minute
Can distinguish between rhyming and non rhyming words
Writes stories with beginning, middle
and end and writes with some correct
spellings.
------------ Has a large bank of sight words, uses
structural elements in words (inflections like
plural endings, tense
markers, syllable structure) for spelling
As they read connected texts, they
show the ability to use grammatical information as aid to
comprehension. They begin to use word meanings and order in the
sentence to confirm decoding.
Retell stories emphasizing on sequence of events. Can identify
main idea, characters and settings. - they begin moving
towards reading to learn
They are also able to retell stories
emphasizing on the sequencing of events. They can identify main
idea, identify main characters and
the identify settings in the story
Words: Analyze individual letters
and use this knowledge to read
new words. Also give particularized meaning to new
words - so the meaning is restricted to context in which it is
given.
uses chunks of known words to read new words (kitaab – en :
Books). Is able to give meaning that is applicable to several
particular contexts
Stage 4 a) Retell stories emphasizing on
sequence of events. Can identify main idea, characters and
settings. - they begin moving
towards reading to learn b)Identify plot of story, discuss
problems and solutions in the story, summarize main events in
the story, evaluate characters, behaviours and actions
Writes two to three
paragraphs with an organizational
pattern, uses
variety of sentences and
punctuation
Is able to spell words
according to rules

136
Sample page of a Running Record

137
Annexure 5 – CAT Tools
Mathematics
Class 2
No. of items: 20 Time duration: 60 minutes
1. How many pencils are there in the box given below?
13
6
7
8
2. Radha had 12 mangoes. Her father gave her these many more-
How many mangoes does she now have?
a. 9 b. 12
c. 21 d. 19
3. Sixty Three is the same as
a. 36 b. 63
c. 96
d. 69
4. 5 ones + 8 tens =
a. 13
b. 31
c. 58 d. 85
5. Which number has 8 in its ones place?
a. 81
b. 18 c. 44
d. 80

138
6. 28 + 14 =
o 312 o 321
o 42
o 96
7. 48 – 23 =
◦ 25 ◦ 611
◦ 61 ◦ 65
8. Raji bought 13 mangoes and 12 bananas. How many fruits did she buy?
o 12 o 13
o 25
o 52
9. Mani‘s father gave Mani 20 chocolates. He gave 13 of them to his friends. How many chocolates does Mani now have?
7
33
13
17
10. Soha went to her Grandma‘s place on Sunday and returned the next day. She returned on
◦ Saturday
◦ Monday ◦ Friday
◦ Sunday
11. The weight of watermelon on the balance is
◦ Less than 1 Kg.
◦ More than 1 Kg

139
◦ Equal to 1 Kg
12. Neha has some coins as shown below. How many rupees does she have?
e. 8 f. 16
g. 40 h. 19
13. Which of the following has only three sides?
Square
Triangle
Circle
Rectangle
14. What will be the next shape in the pattern given below?
A) B) C) D)
15. Starting from the ball, tick the object that is in the fourth place.
(A) (B) (C) (D) (E)
16. Raju is fond of milk. He wants to choose the glass containing the maximum amount of milk. Which glass
should he choose? (Tick the correct glass)
(A) (B) (C) (D)

140
17. Which of the following is a square? Tick the right shape.
(A) (B) (C) (D)
18.Write the missing numbers in the blank spaces
34, 35, ………, 37, ………
19. Fill in the blank:
3 + 3 + 3 + 3 + 3 = 3 ×
20. Write the missing number in the blank space
2 3 4 2 3 4 2 ___ 4

141
Mathematics
Class 3
No. of items: 25 Time duration: 60 minutes
1. Which number has 8 ones ?
a. 81
b. 80
c. 44 d. 18
2. The number closest to 550 is
◦ 499 ◦ 445
◦ 545 ◦ 505
3. 5 ones + 8 tens =
a. 13 b. 31
c. 58 d. 85
4. Which number statement is true?
968 < 689
968 < 689
968 > 689
689 = 968
5. 203 + 149 =
◦ 3412 ◦ 352
◦ 342 ◦ 3421
6. 48 – 23=
◦ 25 ◦ 611
◦ 61
◦ 65
7. Rashi bought 50 cups and 60 glasses. How many utensils did Rashi buy?
50
60
101
110

142
8. In a school of 150 children, 45 are boys. How many girls study in that school?
o 195
o 100
o 105 o 150
9. Hasan‘s mother gave Hasan 27 biscuits. Sudha, Hasan and Saniya shared them equally. How many did each get?
9. 30
10. 27 11. 8
12. 9
10. Samir bought 5 packets of toffees. There were 12 toffees in each packet. How many toffees were there
in all? ◦ 60
◦ 7 ◦ 17
◦ 50
11. 1000 centimetres =
o 1000 meters
o 100 meters o 10 meters
o 1 meters
12. Renu wanted to buy lace for her mother‘s saree. She measured the length of the saree using her scale
and it came to 600 centimetres. How many meters of lace should she buy?
60000 meters
6000 meters
60 meters
6 meters
13. Given below is the calendar of July 2006. July 10 is a (Answer options can come alongside the
calendar)
A. Sunday
B. Saturday
C. Monday D. Tuesday
14. Sony wants to draw a circle. Which of these should she use?

143
Ball
Bangle
Scale
Book
15. The length of the pencil in the picture shown below is
A) 10 cm B) 6 cm
C) 7 cm D) 8 cm
16. The table given below shows the weight of 5 children.
Name Weight (kgs)
Asif 24
Kamal 29
Raju 35
Mahesh 36
Mandeep 20
Who weighs the most?
1. Kamal
2. Raju 3. Mahesh
4. Mandeep
17. Madhu had a twenty rupee note. Her father gave have her some coins as shown below.
How many rupees does she now have?
24
28
26
25
18. What will be the next shape in the pattern?
A) B) C) D)

144
19. Which of the following shows 3/4 of a circle shaded ?
(A) (B) (C) (D)
20.Which of these boxes is the heaviest?
(A) (B) (C) (D)
21.Which of these has the largest surface area?
(A) (B) (C) (D)
22. Write the missing numbers in the blank spaces
34, 35, ………, 37, ………
23. Fill in the blank:
3+ 3 + 3 + 3 + 3 = 3 ×
24. Fill in the blank
1. + = 35
25. Fill in the blank with the missing number in the pattern
2, 4, 6, …….., 10, 12
700 gm 450 gm 250 gm 200 gm

145
Mathematics
Class 4
No. of items: 25 Time duration: 60 minutes
Read carefully the questions that follow and answer them.
1. The number closest to 550 is
o 499 o 445
o 545 o 505
2. one thousand and forty eight is the name of
o 148 o 1048
o 10048 o 100048
3. 3 ones + 2 thousands + 4 tens is equal to
324
423
2043
3240
4. Which among the following is the biggest even number?
◦ 621
◦ 128
◦ 216 ◦ 412
5. Given below are two squares with some parts shaded. The shaded portion is
equal in (1) and (2)
smaller in 1
smaller in 2
6. Mani and Ratna shared a packet of biscuits. Mani ate half the biscuits in the packet and Ratna ate the remaining 4. How many biscuits were there in the packet?
4

146
5
8
10
7. Reema bought goods worth 250 Rupees and had 150 Rupees left on returning. How much money did she go to the market with?
100
400
250
150
8. In a school of 410 children, 230 are boys. How many girls study in that school?
640
280
180
220
9. Samir bought 5 packets of toffees. There were 12 toffees in each packet. How many toffees
were there in all?
17
7
50
60
10. Amu‘s uncle got him some biscuits. He and his 3 friends shared them equally. Each one got
8 biscuits. How many biscuits were there?
▪ 24
▪ 12 ▪ 32
▪ 16
11. Teji asked the shopkeeper to give her 40 pencils. He gave her 4 packets of pencils. How many pencils does each packet contain?
▪ 40
▪ 4 ▪ 160
▪ 10
12. Hari goes to a shop to buy shoes that cost Rs. 100. Hari has 2 twenty rupee and 1 Fifty
rupee note. How much more money (rupees) does he need to buy the shoes? ▪ 30
▪ 10 ▪ 90
▪ 50
13. Renu wanted to buy lace for her mother‘s saree. She measured the length of the saree using
her scale and it came to 600 centimetres. How many meters of lace should she buy?
60000 meters
6000 meters
60 meters
6 meters

147
14. Abeer wanted 2 litres of milk and the shopkeeper gave him 4 packets of milk. How much
milk does each packet contain?
2000 millilitres
4000 millilitres
500 millilitres
250 millilitres
15. The weight of sugar shown in the picture below is
2 kg
1500 grams
2.5 kg
500 grams
16. Ravi‘s school starts at 8:30 in the morning. Today he was late to school by 10 minutes. At what time in the morning did he reach school?
8:10 AM
8:20 PM
8:30 AM
8:40 PM
17. What is the number of tiles of size 1 cm2 that will be needed to cover this rectangle fully?
8 cm
6 cm
14
48

148
28
86
68
18. Sony wants to draw a circle. Which of these should she use?
o Ball
o Bangle o Scale
o Book
19. This chart shows temperatures at different times on four days
Temperatures
Morning Noon Night
Monday 15° 20° 19°
Tuesday 12° 18° 13°
Wednesday 17° 21° 15°
Thursday 10° 15° 9°
Which was the hottest time in these four days?
Monday Noon
Wednesday morning
Monday Night
Wednesday Noon
20. What will the next shape in the pattern be?
A) B) C) D)
21. Which number is inside the circle but outside the triangle?
(A) 1 (B) 2 (C) 3 (D) 4 (E) 5
3
1
2
4
5

149
22. Which of the following is an acute angle?
(A) (B) (C) (D)
23. Add:
2 4 8 0 + 1 5 2 5
-----------
-----------
24. Subtract:
4 3 2 - 1 0 3
---------
---------
25. What is the next number in the pattern?
49, 42, 35, 28, ……

150
Annexure 6 – Classroom Observation themes and format Name: School code: Name of Observer: Date:
SECTION I - Overall school observations at start of school
5. What are the school timings (specify)
6. The teacher (and the HT) come to school in time / before time
7. The children come to school in time / before time
8. There is orderly assembly at the start of school (Specify what happens in the assembly)
9. The children move into the class in an orderly manner
10. The school environment is clean and welcoming (Who does the cleaning of the school /
rooms etc?)
11. The class rooms are well kept / clean / well ventilated
12. The notice board is updated (who updates, what is the content of the board)
13. The time table is put up / is available with the teacher / Head Teacher
14. The kitchen space is clean and hygienic
15. Teachers also eat the maid day meal along with children
16. What is the general comfort level of children and teachers to strangers

151
SECTION II - Classroom Observation Themes
Class being observed: Name of teacher: Sex:
Date: Name of observer:
_______________________________________________________________________
o Planning and time management: Planning entails all the preparation made by the teacher prior to actual classroom transaction. This would include readings, plan for lesson
transaction, preparation and inclusion of activities that relate to the lesson and the like.
Time management would include aspects that indicate actual implementation of the plans as also the timings maintained in the classroom in lessons, activities, punctuality, effective time
to task management etc. The indicators for this could be: a. The teacher has come prepared to the class with all required material
b. The teacher explains the plan for the period to the children in advance
c. The teacher has appropriate plan to handle different classes in case of Multi Grade situation
d. The teacher comes to the class in time or before time e. Children are in class in time / before time
f. The time allocation (including break time) during the day is managed well g. Teacher ends the class with a summary of the period
h. Others …
o Interaction in the class room: Observation of interaction in the classroom gives important insights into the overall school and classroom culture. This interaction would be in way of teacher- pupil
interaction as well as child-child interaction. It also gives an understanding of the overall classroom
environment in terms of the extent of participatory approach and democracy. Some important indicators of this construct would be-
The teacher interacts with the children in a non threatening / pleasant manner
The teacher encourages children to carry out a dialogue and discuss the subject
The teacher encourages free expression and exchange between children
Teacher uses local language appropriate for the class
The children also initiate discussion or interaction or ask questions
The teacher does not indulge in physical or verbal punishment / hurt
The seating of the children is appropriate (in rows, circle, semi-circle etc) for the content
The seating of teacher is appropriate (like the children or as required)
The children are not fighting / quarrelling with each other
Others…..
o Resource Management: This addresses the handling and care of all the material in class including both the common school material as well as children‘s material
There are adequate resources such as books available with children
The teacher has access to adequate material / teaching aides like chalk, charts, TLM etc
(besides text books) in the class
The teacher encourages children to access material freely / as appropriate
The TLM usage is appropriate for the topic / context in class
There is adequate playing material available for children
There is adequate space / facility for proper storage of all the resource material after use
The children are encouraged to care for the school (and also their personal) material (like
books, note books, pencil etc) Others…
o Assessment: The idea of this theme is to determine the assessment literacy of the teacher in
terms of how she uses assessment for learning in the classroom (not just as a test but even through

152
asking questions through the lesson, through class work exercises, homework, correction and feedback
of the work done etc.
7. The teacher uses assessment as a part of teaching learning process 8. The teacher asks questions to determine the previous learning of the child
9. The teacher corrects the responses where needed in a positive manner 10. The teacher uses the exercises at the end of the lesson
11. The teacher innovates on the exercises at the end of the lesson
12. The teacher uses responses to questions to build further discussion / content of the class
13. Others…
o Homework This theme is important in continuation to the assessment theme and also links up to the approaches to teaching/teaching strategies. It will help understand the seriousness of the
teacher in terms of regularity of homework and its correction (homework to reinforce what is taught in class as also to reflect how much is understood by the child). The homework review will make
clear to the teacher what else or what new needs to be done to teach a concept. The children are given appropriate homework (not ‗memorise the page and come
tomorrow‘ etc. Specify the nature of home work)
There is follow up on the homework in the class (just checking with ticks and crosses,
using it to discuss, feedback on home work is given, …)
Home work of previous day is checked and given back (observer to check note books of
children) with comments or feed back Work / project done by children is encouraged to be taken home to show to family
Is there any overload of homework / excessive home work given?
Others….
o Approach to Teaching: The approach to teaching used by a teacher is drawn from the theory of
learning followed. Different teachers use different approaches to teaching in the classroom. The majority of teachers follow the traditional approach which relates to the behaviourist learning
paradigm where the child is considered to be empty of knowledge and knowledge is provided through a one way interaction by the teacher. The constructivist approach on the other hand views
children as knowledge constructors. The following could be ways in which this could be measured. The teacher encourages participation of children in deciding period content
How is a topic introduced? (question, discussion, examples, activities, textbook,
blackboard, TLM etc)
The teacher encourage group work (peer learning)
The children are given project work / activity work in class
The teacher uses outdoor facilities / activities also in learning
The teacher uses multiple teaching methods in class (reading, singing, activity, dancing,
etc)
The teacher is conscious of the attention / retention span of the children (takes
corrective action when she/he observes attention drifting) The teacher brings in the child‘s environment into the classroom
Teacher uses different methods to motivate the children
Others…
o Questioning The role of questions is of critical importance as a questioning mind and
encouragement to questions indicates a more democratic, reflective classroom. Yet questions are of different types and the nature of question, as well as to whom they are asked is also important.
a. The teacher asks different types of questions to children (repetition questions, questions
that encourage thinking, questions to consolidate learning etc) b. The teacher ask questions only to specific child/children or asks different children or
asks the class in general c. Children ask questions to the teacher (frequency, type of question, inquisitive, factual,
critical questions etc)
d. Children ask questions to other children in class

153
e. The teacher responds to the questions appropriately (patient reply, does it satisfy
children, encourage children to ask more questions etc)
f. Children give answers to the questions asked (some children, all children, children keep silent, what kind of questions are answered etc)
g. Others…

154
o Equity The classroom is a heterogeneous mix of social classes and categories. There are minorities,
ethnicities, gender and other groups. The attitude of teachers towards such groups is reflected in the
ways in which children are addressed and seated, punished, rewarded etc. Observing the following shows how stratification in the classroom is maintained and what are the favoured and or marginalized
groups. There is equity in the seating arrangement? (segregation by sex, by height, appearance
etc)
What is the type of attention time given by the teacher to different children?
Help is given (extra help) to some needy children where required
Children are addressed by name (not in a demeaning way)
There is equity in reward and punishment
The Mid day meal seating and eating arrangement also has similar equity
Others….
o Multiple Learning Methods: The interest of children and excitement is kept alive by use of
different types of learning methods The teacher actively uses textbook and also other material like charts, drawing, natural
materials like leaves etc
The teacher uses black board well (visible / readable by all, well organised)
The children are also encouraged to use the blackboard / running board
The children are encouraged to create their own learning material
The teacher also creates learning material with children
Games (both outdoor and indoor) form part of learning process
Other activities, art/craft work, sharing stories/songs by children are used as part of
learning in class Others…
o Empathy / concern for children: This theme relates to the warmth and love of teacher towards children. This could be indicated by:
The children go close to teacher, touch her/him freely
The teacher is demonstrative of her/his affection towards children
The teacher listens to children when they tell their events / problems from home
The teacher consoles crying children / children hurt by fall etc
Late coming of children / other similar issues is managed with compassion
Children are not sent out to do teachers‘ work or errands
Others….

155
FORMAT FOR DRAWING INFERENCES FROM CLASSROOM OBSERVATION DATA
Subject
taught
Name of teacher Class taught
S No: Parameter Observation S No: Parameter Observation
1 Punctuality of teacher Excellent/Fair/Poor 11 Attentiveness of children High/Partial/Poor
2 Duration of class Full/Partial/Barely held 12 Eagerness of children to leave the class High/Partial/Poor
3 Atmosphere Friendly/Threatening/Neutral
13 Eagerness of Teacher to hear the bell ring
High/Partial/Poor
4 Introduction of topic by teacher Planned or
thoughtful/Abrupt/indifferent
14 Types of questions asked by teacher Kindling curiosity/Assessing/Rhetorical
5 Use of Blackboard by teacher Extensive/Partial/Not at
all
15 Frequency of teacher-student-
interaction
High/Partial/Poor
6 Use of TLMs by teacher Extensive/Partial/Not at
all
16 Encouragement given by teacher High/Partial/Poor
7 Rote learning in class Not at all/Partial/Extensive
17 Ridiculing of students by teacher High/Partial/Poor
8 Connections made by teacher
to everyday life
Extensive/Partial/Not at
all
18 Involvement of students in planning or
sustaining the class
High/Partial/Poor
9 Questions asked by children Extensive/Partial/Not at
all
19 Ambience of classroom Lively/Moderate/Dull
10 Intimidation by teacher Extensive/Partial/Not at all
20 Discipline in class Excellent/Fair/Chaotic
S No: Parameter Observation S No: Parameter Observation
21 Paraphrasing by teacher to explain to those who have not
understood
Patient and thorough/Moderate/Not
done at all
26 Discriminatory practices adopted by teacher
Not at all/Partial/Frequent
22 Feedback provided by teacher to students on HW/assignments
Patient and thorough/Moderate/Not
done at all
27 How Teacher catches attention of students
Affectionately/Neutrally/Intimidatingly
23 Punishment given by teacher to students
Not at all/Partial/Frequent 28 Children demonstrate that they feel close to the teacher
Frequently/sometimes/Not at all
24 Boredom amongst students Not at all/Partial/Frequent 29 Teacher‘s approach to the subject Mostly process based /content as well as process based/Only content-based
25 Boredom in teacher Not at all/Partial/Frequent 30 Mistakes made by children are Supported and
explained/Ignored/Rebuked by the
156
teacher

157
Annexure 7 Curricular Competencies in Math and EVS EVS Competencies
Class 2 Class 3 Class 4
Our home and food habits Rules of safety and orderly behaviour Learn the advantages of taking a nutritious diet and categorize the food items into Vitamins, Proteins, Carbohydrates and Minerals.
Understand the importance of food for our health Appreciates the need for orderly behaviour
in home, school and public places
Learn through various small experiments to purify water.
Learn the after effects of taking contaminated food and water.
Interprets important road symbols ( as applicable )
Living things and their usefulness to man
Understand the prime importance of the home. Observes important rules of road ( as applicable )
Learn the importance of organisms over human being, use of animals and plants for different work.
Learn to keep home and the surrounding neat and clean.
Map drawing Identify the harmful insects and weeds.
Our neighbours. Draws a sketch of the classroom and a freehand sketch map of school and locality
The earth and the sky
Identify and understand the importance of the various public places like Hospitals, Primary Health Centres, Markets, Worshipping places etc.
Identifies direction on a map Observe the Moon.
Understand the importance of going to school regularly and on time.
Functions and care of different parts of body
Soils
Occupations Understands important functions of human body, such as digestion, respiration, blood circulation, etc.,
Learn the uses of soil.
Observe the livelihood practices in your own locality and list them.
Knows how to take proper care of such parts of the body as eyes, hair and teeth
SOCIAL SCIENCE:
Living World- Nature Living things their characteristics and classification
Study the relationship between climate and season, season and human beings, animals and birds, and the flora and fauna.
Observes local surrounding and classifies things into living and non living, natural and man-made
My country/state
Identify the local flora and fauna, birds etc./their homes
Identifies main parts of a plant Learn about the production of different cereals in different parts of the State depending on the weather and soil condition.
National Festivals Classifies common plants on the basis of size, life span ad seasonality
Using indicators, prepare distribution Atlas (Agri products, Forest and Mineral resource)
Understand the importance of National Festivals. Observes food habits of different animals and birds
Progress of man from Early times to present

158
Study about the National Flag. Common materials and their properties
Observe the different tools and their uses by human beings.
Sing the National Anthem. Identifies common materials on the basis of some easily observable properties. e.g colour, texture and hardness
Nutrition, pollution and cleanliness
Classifies given materials according to these properties (in text book)
Classifies food stuffs according to nutritive functions and understands the need of balanced diet
The earth and the sun Conducts simple experiments to purity drinking water
Study how mankind uses the different kinds of soil.
Earth – sun relation and consequences Living things and their usefulness to man
Participate in the National Festivals and understand the difference between them.
Describes the shape of the earth ( evidence of photograph )
Identifies some important ways of using plants and animals
Water Identifies some harmful insects and weeds
Describes different uses of water Materials ( matter ) and their properties
Knows about different sources of water Knows the three states of matter-solid, liquid and gaseous
Locates various sources of water in the locality
Observes the three states of matter in respect of water
The earth and the sky
Observes phases of the moon
Weather phenomena
Knows how air and weather are related ( certain weather phenomena )
Knows about different forms of water affecting weather, e.g. humidity, fog, cloud, hail and snow
Observes various weather phenomena and records them with photographs
Classifies soils of the locality according to sizes of its particles and fertility
Finds out how soil is kept fertile
Realises the need of protecting soils from erosion
SOCIAL SCIENCE:
Precautions against common accidents
159
Identifies common situations leading to accident in his environment
Sees relationships between accidents and lack of precautions
Knows some basic measures to be taken following an accident
our civic bodies
Finds out how the panchayat / municipality is useful for us
Enquires how the panchayat / municipality is run
Explains why the panchayat and municipality are called local-self governments
Manufacturing , Food producing articles
Recognises the importance of manufacturing articles
Identifies some occupations related to them
Gathers information about the activities and life of a few such workers ( selected examples )
Compares the work of a farmer with that of a crafts
My country/state
Understands distribution of main crops ( in the context of climate and terrain ) important occupations and location of industries
Undertakes necessary map-work using symbols for showing distributions
Progress of man from Early times to present
Notices the gradual improvement of tools and techniques of man
National Unity
Appreciates the need of national unity for protecting our freedom and making progress
Understands how variety in resources, environment and life of the people in our country enriches our unity
Knows important facts about Indian culture and contribution of different regions to its richness

160