
An Empirical Analysis of User Participation on Crowdsourcing ...
Upload
khangminh22Category
view
1download
0
General rights Copyright and moral rights for the publications made accessible in the public portal are retained by the authors and/or other copyright owners and it is a condition of accessing publications that users recognise and abide by the legal requirements associated with these rights.
Users may download and print one copy of any publication from the public portal for the purpose of private study or research.
You may not further distribute the material or use it for any profit-making activity or commercial gain
You may freely distribute the URL identifying the publication in the public portal If you believe that this document breaches copyright please contact us providing details, and we will remove access to the work immediately and investigate your claim.
Downloaded from orbit.dtu.dk on: Sep 30, 2022
Computer-aided mind map generation via crowdsourcing and machine learning
Camburn, Bradley; Arlitt, Ryan ; Anderson, David; Sanaei, Roozbeh; Raviselam, Sujithra; Jensen, Daniel;Wood, Kristin L.
Published in:Research in Engineering Design
Link to article, DOI:10.1007/s00163-020-00341-w
Publication date:2020
Document VersionPeer reviewed version
Link back to DTU Orbit
Citation (APA):Camburn, B., Arlitt, R., Anderson, D., Sanaei, R., Raviselam, S., Jensen, D., & Wood, K. L. (2020). Computer-aided mind map generation via crowdsourcing and machine learning. Research in Engineering Design, 31, 383-409. https://doi.org/10.1007/s00163-020-00341-w
1
Computer Aided Mind Map Generation via Crowd Sourcing and Machine Learning
Bradley Camburn1,2,*, Ryan Arlitt4,*, David Anderson5,*, Roozbeh Sanaei3, Sujithra Raviselam3, Daniel Jensen3, and Kristin L. Wood3
Abstract Early-stage ideation is a critical step in the design process. Mind maps are a popular tool for generating design concepts and in general for hierarchically organizing design insights. We explore an application for high-level concept synthesis in early stage design, which is typically difficult due to the broad space of options in early stages (e.g. as compared to parametric automation tools which are typically applicable in concept refinement stages or detail design). However, developing a useful mind map often demands a considerable time investment from a diverse design team. To facilitate the process of creating mind maps, we present an approach to crowd sourcing both concepts and binning of said concepts, using a mix of human evaluators and machine learning. The resulting computer-aided mind map has a significantly higher average concept novelty, and no significant difference in average feasibility (quantity can be set independently) as manually-generated mind maps, includes distinct concepts, and reduces cost in terms of the designers’ time. This approach has the potential to make early-stage ideation faster, scalable and parallelizable, while creating alternative approaches to searching for a breadth and diversity of ideas. Emerging research explores the use of machine learning and other advanced computational techniques to amplify the mind mapping process. This work demonstrates the use of the both the EM-SVD, and HDBSCAN algorithms in an inferential clustering approach to reduce the number of one-to-one comparisons required in forming clusters of concepts. Crowdsourced human effort assists the process for both concept generation and clustering in the mind map. This process provides a viable approach to augment ideation methods, reduces the workload on a design team, and thus provides an efficient and useful machine learning based clustering approach.
Keywords Mind map, ideation, concept generation, machine learning, crowdsourcing
*, co-lead authors with equal contribution
1, corresponding author, email: [email protected]; hp: +1 (541) 745-8477
2, affiliation, Oregon State University, 2000 SW Monroe Ave, 214 Rogers Hall, Corvallis, OR 97331
3, affiliation, Singapore University of Technology and Design, 8 Somapah Road, Singapore 487372
3, affiliation, Denmark Technical University, Denmark
4, affiliation, Founder, Angora Incorporated, USA

2
1.1 Introduction Early stage ideation is a critical step in the design process. Mind maps are a popular tool for generating and organizing high level concepts early in that process [1–10]. A mind map generally consists of a hierarchical series of nodes containing categories and concepts, often either expressed as words, short phrases or sketches [2]. These conceptually connected nodes are visually linked with lines drawn between them, as shown in Figure 1 (structural template). The central node is often at the highest level of abstraction with each branch, or ‘level’, becoming more specific, eventually down to the level of describing a specific solution embodiment. As part of the ideation process, mind maps provide a representation and structural approach to generate concepts using cognitive processes of categorization and utilizing categories, as high-level concepts, to amplify the generation of further concepts through analogy, experience, and long-term memory. Two examples of simplified mind maps manually generated by design teams are shown in Figure 2 and 3. We also provide four tables in the appendices of this paper which correspond to the full data set of their associated mind maps. For a practical mind map application, the 2D layout is important as it demonstrates the relative density of categories, depth, and may include cross-links. These are usually printed on larger print forms such as A3 or larger. In order to provide the full data set, and yet maintain readability, we condense the original, graphical, full mind maps into a tabulated form in the Appendices of this paper for reference. The full, printed, graphical forms were used in an industry case study, described herein.
Three common performance targets (or ‘metrics’) in ideation are the creation of a large quantity, quality, and diversity (or breadth) of concepts [11]. Achieving these targets can be time consuming, leading to several attempts to augment the creation of mind maps to distribute the workload across a design team. Likewise, there is a need to populate concepts in a mind mapping effort with ideas outside the experience set of the individual, team or organization exploring concept generation. As such, we seek to demonstrate the ability of our design automation process to support ideation in early concept development phases of design, by accelerating and simplifying the creation of mind maps.
The steps of mindmapping are [12]:
1. Concept generation (a set of ideas), 2. Concept clustering (into subgroups of common themes), 3. Hierarchical categorization according to an emergent naming scheme, 4. Iteration of concept generation as categories emerge, and 5. Exploitation of categories via further iteration.
There are several well-known technologies that support mindmapping. The CMaps [13] tool enables collaborative mind mapping over the internet, allowing large, geographically diverse design teams to generate concepts together. Other web-based systems such as GroupMap [14] allow similar group mind map construction and also allow the group to work on the down-select process or the evaluation of the concepts. Mind mapping tools have been developed which use webpages as concepts, seeding the mind map automatically and enabling users to explore the web via concept linkages [15]. Additional tools attempt to seed concepts scraped from the internet during the creation process [8-11]. WordViz [16] provides a mind map interface to the WordNet [17] database, allowing human designers to construct designs by analogy, such as through the WordTree Method, and mind maps comprised of conceptually linked words (such as synonyms and antonyms) given a seed word. Additional research has developed methods of evaluating the distance between concepts in a design database [18,19]. These mind mapping tools and approaches have shown great success. Applications are to either facilitate real-time ideation (e.g. CMaps) or support faster search of existing data (e.g. WordTree). However, these solutions are agnostic to the time-effort required to gather a team of designers to generate ideas.
At the same time, there has been considerable research in human computation, using crowd sourced responses to augment or evaluate computationally difficult problems [20,21]. Perhaps the best known example is ReCAPTCHA [22], which uses failed optical character recognition examples as CAPTCHAs for websites. As these failed examples are known to be difficult for computers to evaluate, humans are asked to solve a pair of such examples, one with a known answer and one with an unknown answer, to gain access to websites. By aggregating the human responses, these images of text can be translated into actual text. Amazon’s Mechanical Turk is a popular platform for distributing such simple tasks to a large number of human evaluators, who are paid on a per-task basis.

3
Design methods have been developed for crowd sourced responses for a wide variety of difficult tasks [23]. Crowd sourcing has been used as a data source for deriving design principles [24]. By asking humans to identify partially masked images of products, the key aesthetic features for brand recognition can be quantified and identified [25]. Experiments have used crowdsourcing to generate detailed designs of complex components [26] and to solve control optimization problems [27], or even to identify design principles from case studies [28].
Based on the past successes which involve the integration of automation and crowd sourcing to address computationally challenging problems reviewed above, our goal is to develop a semi-automated system to generate and group concepts into mind maps, for early-stage ideation. While mind maps are popular, powerful tools for early-stage conceptual design, they demand a significant number of hours for a design team to collaboratively construct the mind map. Coupled with the need to iterate frequently and generate a wide range of diverse solutions, this resource investment can become a bottleneck in design projects. Our prior research has developed a design process for design automation, with the goal of easing the development of computational design tools to accelerate the design process [29]. Additionally, we operate many design innovation workshops with outside enterprise partners / clients, themed around particular subject areas and industry-societal domains [30,31]. To facilitate these workshops, we prepare materials in advance, including mind maps. Given the increasing availability of human computation and crowd sourcing, our goal is to develop, using our design process for design automation, a partially automated system to produce mind maps via crowd sourcing. A specific example that will be considered is producing a mind map on approaches to “workforce reduction” or “maintaining overall productivity in light of a shrinking workforce.” In summary, this research is driven by the following research questions:
I. How do design practitioners perceive the utility of a computer aided mind map as compared to a traditional, fully manual mind map
II. How much of an impact does the automation process have in terms of reduced person hours for the design team?
III. How does diversity in the solution set compare between the two mind maps?
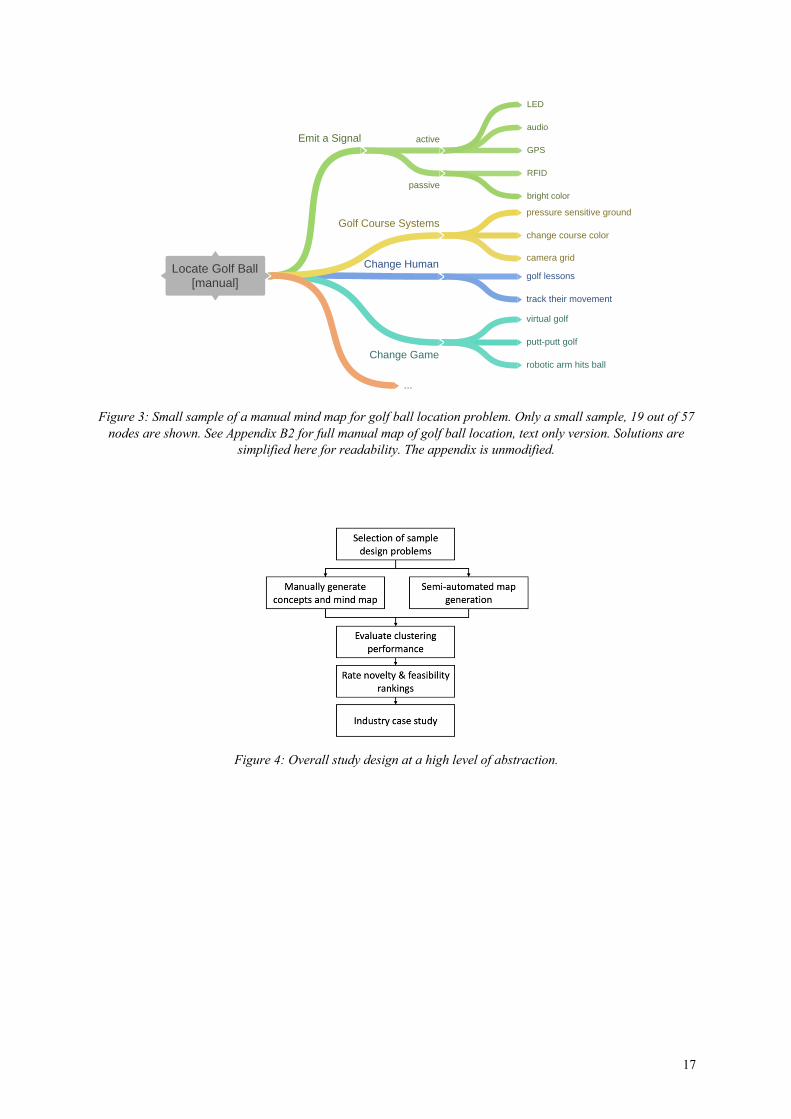
1.2 Approach – Research Methodology Our approach involved using our design process [31], with a range of industry partners, and strategies for design automation [29] to inspire construction of a tool for computer-aided mind mapping. The study continued with evaluating the performance of the computer-aided task against manual generation of a mind map. Our overall research approach is shown in Figure 4.
For our strategy of computer aided mind mapping, we begin with human contributions through crowd sourcing. We emphasize the value of synthesizing crowd sourcing to reduce effort for the design team in ideation. The computer aided contribution is in the clustering of the ideas to form the mind map. The objective of this approach is to leverage the intuition and flexibility of human intelligence in ideation with the benefits of machine learning to reduce cost by automating repetitive tasks in the overall process. The overall process begins by generating a set of “How might we…” (design opportunity) questions. These questions are directly provided to Amazon Mechanical Turk users who are asked to provide multiple potential solutions. The background of MTurk workers has been shown to vary significantly [32,33]. We performed two iterations of this process, the first with a single high-level question, and the second with more detailed, specific questions. As this case was driven by a problem / opportunity from a number of our industrial and enterprise partners, the objective was to attain high variety and specificity in the results by providing more targeted prompts.
1st iteration problem statement generation: • How might we maintain productivity while reducing the workforce?
2nd iteration problem statement generation: • How, specifically, can we use health monitoring technologies to increase productivity in a large organization? • How, specifically, can we use wearable health monitoring to improve productivity in a large organization? • Where, specifically, can we deploy robots in a large organization to improve productivity? • Where, specifically, can we utilize autonomous vehicles and drones in a large organization to improve productivity? • How, specifically, can we use Internet of Things and small, cheap sensors to improve the productivity of a large
organization?

4
• How can we use data science to improve the productivity of a large organization? • How can we use machine learning to improve the productivity of a large organization? • How can we use artificial intelligence to improve the productivity of a large organization? • How should a large organization adapt to handle rapid market changes? • What does industry 4.0 mean to you? • How can a large organization use big data to minimize waste? • What actions would you like to see large organizations take to minimize wasted labor?
The first question was the initial prompt provided to the traditional design team by external partners. The design team consisted of several early career design engineers working as consultants. The second set of questions were generated via ideation within the design team. The second set of questions are subsets of the initial question in that they specify a category or class of potential solutions to the initial question. The questions were generated for the design problem / opportunity of how to maintain productivity in light of a shrinking workforce (workforce reduction), an issue facing several southeast Asian nations. One of the issues driving this problem is the aging population and lowering birth rates in many nations, including Singapore. In response to this challenge, certain organizations are pursuing the development of creative solutions to maintain or even increase capabilities to support social well-being in light of a shrinking workforce. The basis of these questions, as well as the overall design project, was part of an ongoing design engagement wherein the enterprise partner desired insightful solutions in order to resolve the issue of workforce reduction. These questions were co-created by the design team and the enterprise partners to seed the creation of the computer aided mind map. The same questions were used to support the generation of a manual mind map. This list of questions is provided to give a broader context of the industrial case problem and to demonstrate a typical design activity that directly precedes both manual and computer aided mind map generation.
2 Clustering Methodology
In mind mapping, one of the key steps is to form clusters, groups often do this through iterative discussion and by forming emergent categories (see Mind mapping steps listed above). However, in order for a computational approach to mind mapping to be effective, similarity of concepts must be evaluated in another way. We applied two strategies in our computer aided design automation design process, crowd sourced ideation (concept generation), and crowd sourced similarity evaluation or comparisons (clustering). Similarity is the measure of how closely related two sequences of word or ‘strings’ are in machine learning. Clustering in machine learning is similar to clustering as described for manual mind-mapping, it is the process of grouping two or more ideas under a common hierarchical label. The individual idea responses were in the form of sentences, they are fed into a second round of Mechanical Turk for similarity assessment. Then we use a two-stage automation procedure to construct the actual mind maps from the comparisons. Each of these processes is discussed in detail below. For this work, computational steps were performed using Python libraries via Jupyter. This process is further detailed, technically, below.
2.1 Crowdsourcing: Concept Generation and Similarity Assessment In the first phases of crowdsourcing, participants (crowd) are simply asked to generate ideas given a prompt (See Figure 5.a). In the second phase, users are asked to rate how closely related each of five design concepts (given as a text string or sentence) are related to a sixth concept, used as a prompt (See Figure 5.b). The survey consisted of the design challenge prompt, an example solution (to rate each of the subsequent four solution’s similarity to), four other design concepts, and a control sentence. The control sentence is not in fact a design concept but a randomly selected sentence from the novel Moby Dick, to provide a means of evaluating user competence (it should have the minimal similarity). We reject results from users who gave our control sentence a relevance greater than one out of five. The control filter is injected to remove users that provide bogus answers. We collect
5
responses until each item has been scored by at least two different evaluators. It is important to note that only a small percentage of one-to-one comparisons are made – thus we compute a ‘sparse’ similarity matrix. Each idea is compared to at least four other ideas (but not all, e.g. 100 to 4 instead of 100 to 100 comparisons). In a dense comparison matrix, every idea would be compared to every other idea. A dense comparison would also be of an order of magnitude greater cost to execute, with regards to crowdsourcing expense. Our approach produces a sparse similarity matrix, where each concept has been scored by its similarity to at least four other concepts via a random permutation of the matrix. While the dense matrix would produce a greater level of detail in the data, we postulate that the increase in detail is not worth the added cost.
Two example design concepts that were later clustered together (from a problem on workforce reduction, detailed in a previous section) are:
“Monitor when people are fatigued or not feeling well, and offer healthy choices to those employees”
“Cheap sensors can be used to help monitor by keeping track of individuals throughout the organization”
An example control sentence is:
“’Seven hundred and seventy-seventh,’ again said Bildad, without lifting his eyes; and then went on mumbling—'for where your treasure is, there will your heart be also’”
2.2 Clustering: EM-SVD, Expected Value Prediction
Before applying the clustering algorithm, we convert the sparse full-rank similarity matrix (of dimension 𝑚 × 𝑚) to a dense approximate low-dimensional similarity matrix (e.g. 100𝑐𝑜𝑛𝑐𝑒𝑝𝑡𝑠 × 100𝑐𝑜𝑛𝑐𝑒𝑝𝑡𝑠 →100𝑐𝑜𝑛𝑐𝑒𝑝𝑡𝑠 × 4𝑑𝑖𝑚𝑒𝑛𝑠𝑖𝑜𝑛𝑠) using expectation-maximization singular value decomposition (EM-SVD) [34]. A four vector space is used as it was found through trial and error to reduce computational cost while retaining sufficient resolution. This approach first estimates missing values, then reduces the matrix dimensionality. Lower dimensional matrices are less computationally intensive to cluster.
It should be noted that in the reduced dimensionality matrix, each row is a concept, and each column represents an abstract ‘reduced dimension’. However, in the initial matrix, each row is a concept, and each column is also a concept. We chose this approach as similar techniques have been used successfully to assign a prediction of similarities for a sparse matrix in the past [35]. EM-SVD is an iterative process, in which singular value decomposition (SVD) is used to repeatedly compute the missing data, until the trace of the computed matrix converges to a given tolerance threshold value (convergence criteria). Given an input matrix of sparse similarity assessments, the algorithmic approach to estimate the missing values and transform the matrix (to a reduced dimensionality) is as follows:
1. Compute 𝑊, where element 𝑊!" = 1 if the entry 𝑌!" exists, else 𝑊!" = 0 2. Compute �̂� = 𝑎𝑣𝑔(𝑌) 3. Compute 𝑌; = 𝑊 ⋅ 𝑌 + (1 −𝑊) ⋅ �̂�, which fills the empty values of Y with the overall average value 4. 𝑈, 𝛴, 𝑉 = 𝑠𝑣𝑑(𝑌; − �̂�), which decomposes the given matrix 5. Compute 𝑌; = 𝑊 ⋅ 𝑌 + (1 −𝑊) ⋅ (𝑈𝛴𝑉 + �̂�), our updated estimate of the missing data from Y based on
the singular value decomposition of the previous step, as the algorithm iterates, this value should converge
6. Compute �̂� = 𝑎𝑣𝑔(𝑌;) 7. delta = [((𝛴) − 𝑠𝑢𝑚(𝛴(𝑝𝑟𝑒𝑣𝑠𝑡𝑒𝑝))/𝑠𝑢𝑚(𝛴(𝑝𝑟𝑒𝑣𝑠𝑡𝑒𝑝)] 8. Repeat steps 3-7, until the relative change in the trace of YI between iterations, (delta) step 7, is below
some tolerance threshold, in our case tol = 0.001; and similarities ranged from 1 to 5 9. Compute X, where X is the reduced dimensionality matrix 10. Repeat steps 1-8 wherein svd() is replaced with svds(), a variant which returns singular values of a pre-
specified reduced dimensionality
Where 𝑌 is an 𝑚 × 𝑚 matrix that contains missing elements; W is an 𝑚 × 𝑚 matrix, it is the working solution for best estimate of the densely populated full-rank similarity matrix (expanded from sparse input 𝑌); 𝑈
6
is an 𝑚 × 𝑚 real or complex unitary matrix ; 𝛴 is an 𝑚 × 𝑛 rectangular diagonal matrix; and 𝑉 is an 𝑛 × 𝑛 real or complex unitary matrix,𝑉∗is its complex conjugate. 𝑋 is the reduced dimensionality
𝑚 × 𝑛transformed, dense, matrix; 𝑈, 𝛴, &𝑉 can be computed via any selected approach for matrix decomposition from the following observations:
i. The left singular vectors of 𝑀 are a set of orthonormal eigenvectors of 𝑀𝑀∗ ii. The right singular vectors of 𝑀 are a set of orthonormal eigenvectors of 𝑀∗𝑀
iii. The non-zero singular values of 𝑀 (found on the diagonal entries of Σ) are the square roots of the non-zero eigenvalues of both 𝑀∗𝑀 and 𝑀𝑀∗
Where 𝑀 is a matrix from which 𝑈, 𝛴, &𝑉 are calculated.
We apply this algorithm to reduce the initial sparse full similarity matrix (output of mechanical Turk similarity assessments) into a reduced space, m-by-four. Where m is the initial number of design concepts. A simplified visual depiction of the input to, and result from, the EM-SVD process is shown in Figure 6.
2.3 Clustering: HDBSCAN, Cluster Formation Our next objective is to take the similarity ratings and form solution clusters that constitute the actual mind map. From the EM-SVD process, each concept is associated with a length-four vector, indicating its location in the reduced-dimensionality space. The vectors are fed into Hierarchical Density-Based Spectral Clustering for Applications (HDBSCAN) [36]. HDBSCAN is an extension of DBSCAN, which sets key tuning parameters automatically. To understand DBSCAN, first imagine several scattered points in a multi-dimensional space separated by a parametric distance. We choose a distance, 𝑑 , and we draw a connection between points within distance 𝑑 of each other. We retain any point that is connected to at least k points, and where the maximum distance to the kth point (farthest point in this set) is less than some threshold value (thus, k and d form a noise filtering parameter). A minimum spanning tree is formed to connect these points. A minimum spanning tree (in this case, K-D tree) is built based on the following observation, if I know that a point A1 is distance to point A2 and point A3 is very near to A2 then we can infer that A2 is also distant from A1. A spanning tree is a network with at least one connection to each node, and the minimum integral edge length of such a network. Once the minimum spanning tree is determined, distances along each branch are computed and recorded make future comparisons simpler. This approach requires fewer calculations than determining every point to point-to-point distance at each step. The minimum spanning tree is built by sequentially determining a nearest neighbors until there is no unconnected node remaining on the map, using a bottom up approach.
Finally, we densify, or collapse those clusters that branch within less than some threshold distance using the parameter, l. l is effectively a control parameter to dictate how ‘closely connected’ pairs in a cluster are. If two pairs are within distance lambda of each other (along the minimum spanning tree) then they are condensed into a grouping, if they are further than this value, they remain as separate clusters. This process is executed from the top (most central node) down. These steps are outlined in below via a high-level pseudocode and supported with graphical depictions of key steps in Figure 7. Given an n-dimensional (in this case 4) network matrix with geometric distance or similarity rating the high-level steps of the HDBSCAN algorithm are as follows [36]:
1. Import a matrix of 𝑚 × 𝑛 dimensions (in this case, X, from the EM-SVD output), it will be treated as scatterplot in an 𝑛 dimensional space (Figure 7.a)
2. Calculate the mutual geometric distance between each kth nearest neighbor, for each point 3. Remove outliers, using an input threshold, d. For any point where the kth nearest neighbor is further
than d, it is treated as an outlier and filtered from the dataset 4. Build the minimum spanning tree (Figure 7.b) 5. Calculate the granular hierarchy (Figure 7.c) 6. Condense the cluster tree, using another input threshold (Figure 7.d), this is executed using the value l 7. Extract the clusters (Figure 7.e)
Where d is the Euclidean distance between two points as measured using the reduced dimensional space (e.g. distance by n-dimensional extension of the Pythagorean theorem; l is a measure of how much path
length traversal between two pairs, along the minimum spanning tree, is allowed for them to be merged into a single cluster

7
While DBSCAN is an elegant approach, it requires the user to select a distance and the number of connections for a core point. HDBSCAN automates this process, by exploring several distances. The core idea is to discover "long-lived" clusters, that is, clusters that persist across a wide range of distances. We can construct a dendrogram, showing when individual points merge together into a cluster as we increase the distance (Figure 7.c).
We can refine the dendrogram. Firstly, we set it to plot only clusters with more than two points. We then condense the clusters based on a threshold distance between branches (Figure 7.d). We plot this against 𝜆, the reciprocal of distance. We then select the clusters for each point with the longest persistence, given that the cluster contains at least two points. In essence, when two branching events occur nearby to each other (lower than threshold setting for 𝜆) they are ‘condensed’ into a single cluster. Finally, the points are assigned to clusters based on the condensed dendrogram (See Figure 7.e) In our case, we also retain the dendrogram structure for constructing the mind map branches, this is a variation unique to our application and may not be typically applied in the standard algorithm).
After the automated similarity prediction and clustering is complete, a manual pass is performed to determine whether any sentences should be removed or recategorized. Titles are provided to the hierarchical branching nodes in the mind map (dendrogram output of HDBSCAN), this final pass enables sense-making of generated clustering and concept terms, while providing users, such as designers and design teams, of the mind map to probe the content and ideas and explore further ideation.
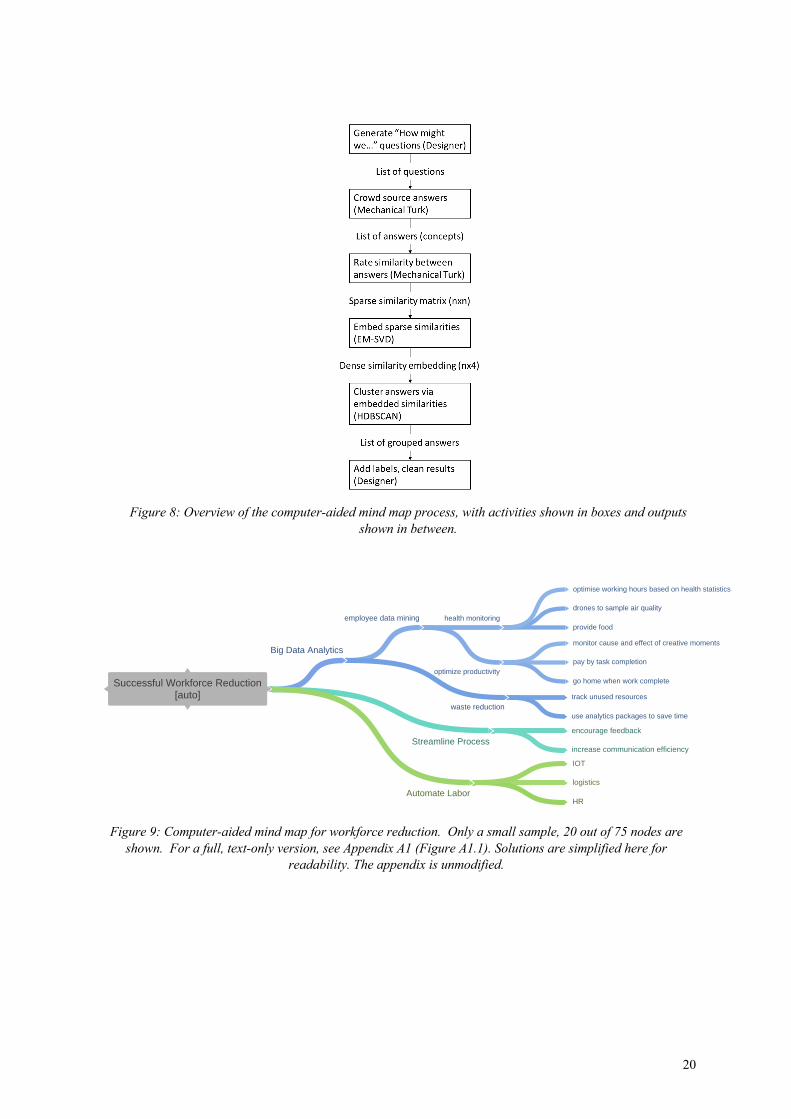
2.4 Process Summary In summary, the overall procedure for the entire workflow in constructing the computer aided mind map, shown in Figure 8, is:
1. Generate “How might we…” questions using the original input from the enterprise partner 2. Crowd source design a set of design solution concepts (in our case using Amazon Mechanical Turk)
(Figure 5.a) 3. For each concept from step 2., select four other concepts, as well as one control sentence from a
control/random source (in our case, the novel Moby Dick) a. Via crowdsourcing (e.g. Mechanical Turk), ask two raters to rate the similarity between the
selected concepts on a Likert scale (Figure 5.b) b. If the control sentence is not rated as 1 (maximally dissimilar), reject the response c. Average the rater responses for each concept pair
4. Run expectation-maximization singular value decomposition, EM-SVD, on the sparse similarity matrix from step 3 (first estimate missing values, then reduce to four dimensions) (Figure 6)
5. Run HDBSCAN with a cluster size of two on the output from step 4., which clusters each concept 6. Manually review, revise and label the clusters generated from step 5 (Figure 7) as needed
3 Results: Computer Aided Mind Map
For the workforce reduction opportunity, the concept generation phase use of Mechanical Turk produced 103 unique sentences in four and a half hours, with 120 responses (for 11 hours 45 minutes of total labor), at a total cost of $42. The use of Mechanical Turk for the evaluation phase produced 824 comparisons, with two replications of each pair tested, providing 7.8% coverage of the full similarity matrix. Phase two had 215 responses and took one hour 43 minutes (for 38 total hours of labor), at a total cost of $129. In the manual recategorization phase, the team-lead designer reorganized approximately 30% of the clustered sentences. This is a step which can be considered human supervision. Not all of the clustering was perfect and in order to develop professionally acceptable results (for use by the client) some refinement was required. The designer committed time for posting the prompts and recategorizing ideas was approximately 4 hours in total. While some effort was
8
still required by the lead designer, significant time was saved overall and novelty scores were higher than the manual map.
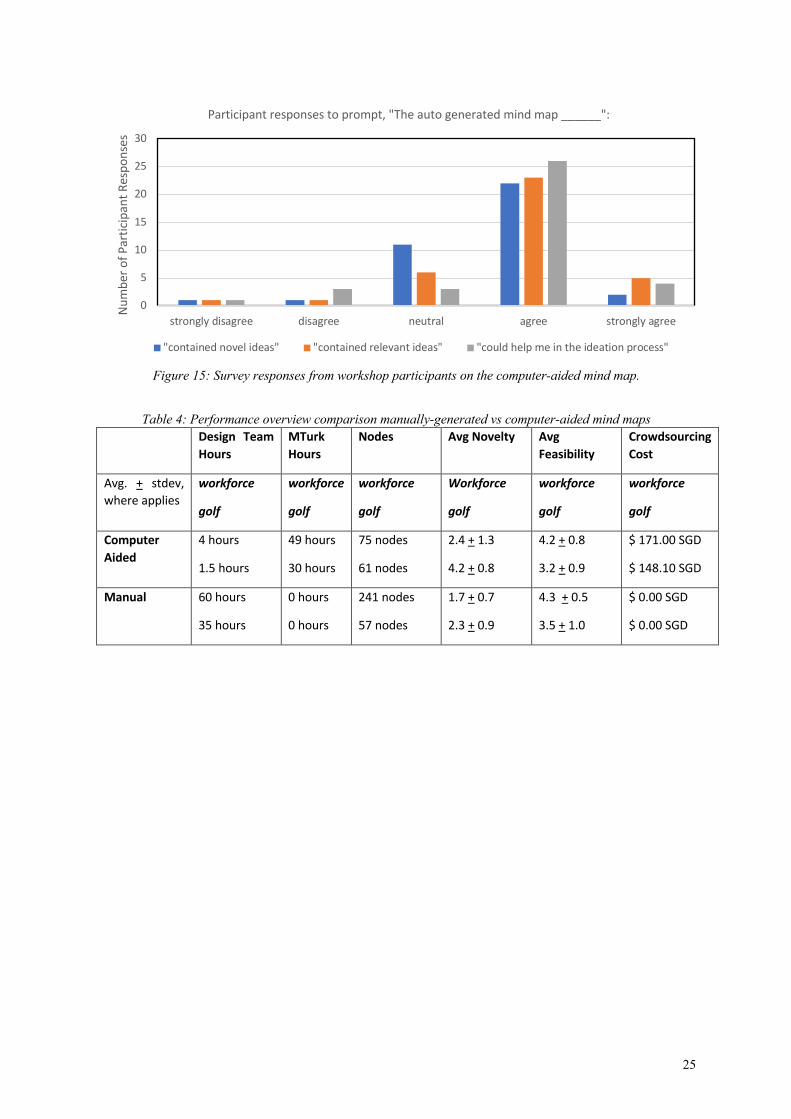
In addition to the computer-aided mind map, a manual mind map was created by members of the design team with the same starting question. The design team both generated concepts and clustered the ideas for the manual mind map (fully manual process). We can compare the computer-aided mind map generation with the manually generated mind map (Appendix A1, and Appendix A2). The manually generated mind map contains 241 nodes, of which 147 are leaf nodes (a leaf node is any terminal node on the dendrogram, it has no children), at a maximum depth of six. In comparison, the computer-aided mind map contains 75 nodes, of which 57 are leaf nodes, at a maximum depth of four. The manual mind map took approximately 60 person-hours to develop, while the designers committed roughly 4 person-hours to prepare the computer-aided mind map, including manually moving the computed results into existing mind mapping software for easy layout and printing. The final version was prepared for poster printing and use during subsequent Develop phases of design innovation and ideation by enterprise partners [30,31], a simplified subsection is shown in Figure 9. A complete, text-only version is shown in Appendix A1.
3.1 Evaluation: Repeatability To conduct a basic evaluation of repeatability, the same automated mind map generation process was repeated for a second “How might we?” statement stemming from an entirely different problem-opportunity in this case, “How might we locate a golf ball down the fairway in a golf game?” Having developed this approach, we applied the entire workflow to a second exemplar design problem-opportunity, ‘tracking and locating golf balls’, to evaluate the performance of our approach with regards to repeatability. This problem-opportunity was chosen as we have previously generated mind maps for this problem with hundreds of enterprise participants and design teams in design workshops and enterprise partnerships. We provided the following “How might we…” questions to Mechanical Turk users. We provided both a single high-level question, as well as more specific questions, based on our learnings from the first iteration.
• How might we locate or track a golf ball? • How might we locate a golf ball after it has landed? • How might we locate a golf ball after it has landed, without modifying the golf ball? • How might we locate a golf ball after it has landed, by modifying the golf ball? • How might we locate or track a golf ball in flight after it has been hit? • How might we locate or track a golf ball in flight after it has been hit, without modifying the golf ball? • How might we locate or track a golf ball in flight after it has been hit, by modifying the golf ball?
For our golf ball example of automated mind map generation, there were 84 participants in the concept generation phase, with an average task time of 17 minutes 46 seconds, for a total time of 24 hours of labor and 94 unique ideas. This task was completed in 6 hours, by wall time, at a total cost of $24.50. The subsequent evaluation phase involved 206 respondents with an average response time of 10 minutes 43 seconds, for a total work time of 30 hours of labor and a total cost of $123.60. The evaluation phase created 212 evaluations, for a total coverage of 4.8% of the similarity matrix. The manual phase took approximately 1.5 person-hours. The final mind map contained 61 nodes, of which 42 are leaf nodes. A simplified sample of the computer aided mind map is shown in Figure 10 (full map is shown in Aix B2).
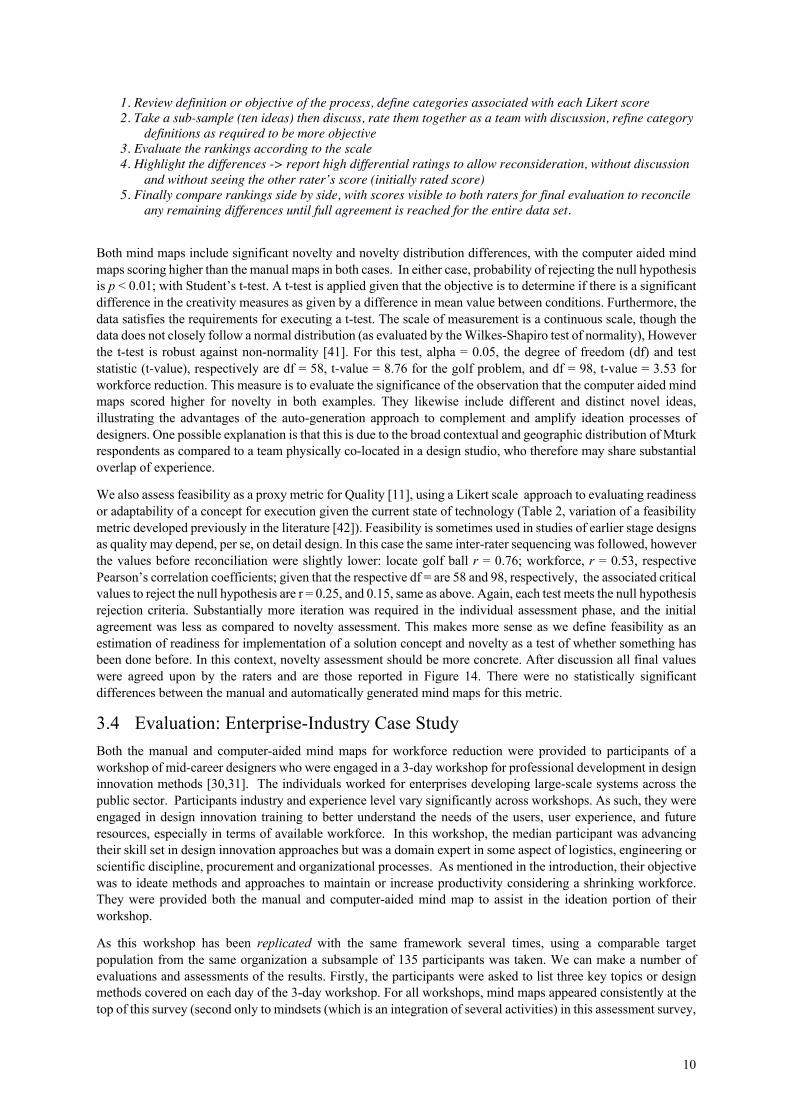
Figure 3 (section 1) shows a simplified sample of the results of a manually generated mind map for the locating golf ball opportunity (Full map is shown in Appendix B2). The mind map is an exemplar result, was co-created with enterprise-industry partners over multiple ideation sessions, and represented iterations between generating end-point ideas, categories, and additional ideas. The manually developed mind map includes 57 unique ideas (leaf nodes) in 15 clusters-categories and was developed over 35 person-hours.
Qualitative assessment of the results shows that the auto-generate mind map is well-formed and provides similar level of clustering quality as the workforce reduction example. Secondly, we can see that the time required, by the design team, was of a comparable minimal amount of person hours required. By comparison the manual process for a golf-problem-opportunity typically ranges from 30 to 40 person-hours. Quantitative assessment of the mind map’s performance follows.

9
3.2 Evaluation: Clustering Performance We began by evaluating the performance of our semi-automated mind map generation with respect to the similarity within clusters. A key feature of mind maps is that clusters should represent a set of related or common ideas, i.e., categories with labels as meta-ideas or classes of ideas. In order to evaluate whether our process results in a satisfactory quality, we evaluate this via cluster-similarity. To do so, we had a team of professional designers generate concepts and cluster them into a mind map for the workforce reduction problem. These results are used as to evaluate the baseline quality performance. We compare these results to the auto-generated mind map.
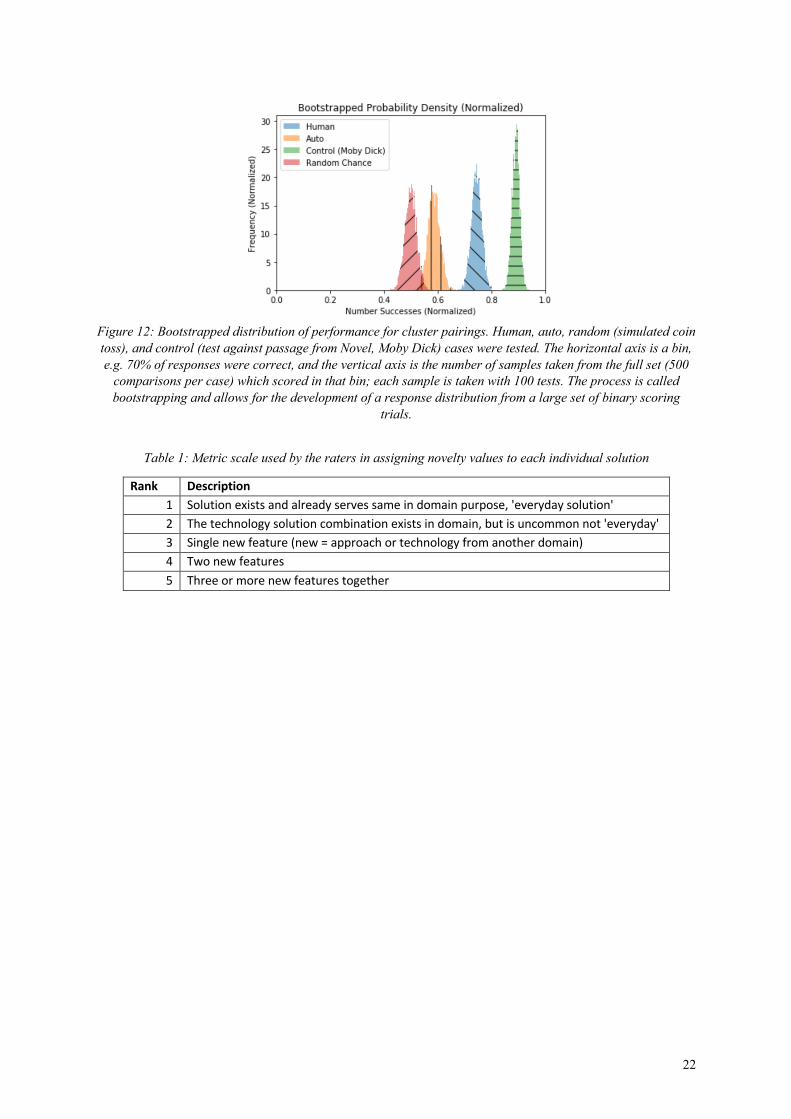
For both maps, we evaluated the rates at which human raters on Mechanical Turk agreed with the clustering produced by the manual process and the computer aided process. The evaluation was conducted using a pairwise comparison strategy with Mechanical Turk, as shown in Figure 11. Each page in the Mechanical Turk assessment contained a question for each of the manual or computer aided mind maps, and a control question grouping. The control questions give the rater a choice between an idea from the data set and a passage from the novel Moby Dick. These control questions establish an upper bound for interpreting the results accounting for rater trustworthiness, shown as the “control” distribution in Figure 12. Additionally, a “random” group sets a lower bound for randomly guessing between two options. For this group the success rate is artificially set to 50%.
Each of these four data sets is a series of Bernoulli trials, represented as a sequence of successes and failures. Each series can also be represented as a single percentage of successes. We used bootstrapping over these data to generate the distributions of success percentages [37], shown in Figure 12. This is one way of testing how confident we are that the clusters are related on a common-sense level. The Mechanical Turk assisted automated pairings (note that this is after the expansion via HDBSCAN into the full map) scored less well compared with human results, but better than the random coin toss. However, there are differences in the content these two maps that may have contributed to this difference in performance. For example, in the manual mind map, one category consisted only of single words. While another consisted of direct quotes, with quotation marks, from a management textbook. This is a result of the fact that design teams may break implicit rules and not all ideas will be at the same level of abstraction of use the same type of description. All entries in the autogenerated mind map were single sentence descriptions of similar length. This phenomenological difference is a likely contributor to the high clustering performance of the manual mind map as per this experimental design. It may have also served to make category pairings more obvious to assessors when evaluating the manual map pairings. None-the-less, the clustering results from both mind maps provide well-clustered sets as measured by quantitative assessment. This comparison is significant with automated mind maps > random/coin toss at p = 0.002 for transformed Z-test comparison of defectives count.
3.3 Evaluation: Novelty and Feasibility Assessment To evaluate the performance of the computer-aided mind map in terms of generating novel concepts, two expert designers were asked to score the novelty of the concepts from both mind maps on a Likert scale. For the golf ball problem, a double-blind inter-rater agreement is executed using Pearson’s correlation test. Pearson’s correlation is often applied in assessing the similarity of two human raters [38]. coefficient was r = 0.85; for workforce reduction the double-blind rater agreement was r = 0.79. The degrees of freedom (df) are df = 58 for the golf ball problem and df = 98 for the workforce reduction task. In order to reject the null hypothesis, the 95% critical values should be r = 0.25 and r = 0.15, respectively [39]. Both tests thus satisfy the criteria to reject the null hypothesis. The slightly lower score for workforce reduction problem is intuitive due to the more ambiguous and complex nature of automation and the vast array of case studies or solution avenues that are relevant. The remaining differences were reconciled so that a final score was agreed upon by both raters for every data point. We report the final novelty scores in Figure 13. Results show that novelty for the crowdsourced and automatically clustered mind maps was higher in both cases, though more significantly so for the golf ball problem. The ranking used for assessment of Novelty is seen in Table 1. We apply a scalar measure of Novelty, which is assessed qualitatively by domain experts (in a manner procedural similar to the consensual assessment or CAT technique [40]) in this case we compare or benchmark against industry practice based on the designer’s experience, as opposed to metrics of novelty which measure variation within the data set itself [11]. This approach is relevant in this particular context because the ultimate requirement is to provide an industrial client with novel results. In other words, providing them a set with many variants of existing technology would be of little use to them if all solutions were commonplace in industry. In summary the process was as follows:
10
1. Review definition or objective of the process, define categories associated with each Likert score 2. Take a sub-sample (ten ideas) then discuss, rate them together as a team with discussion, refine category
definitions as required to be more objective 3. Evaluate the rankings according to the scale 4. Highlight the differences -> report high differential ratings to allow reconsideration, without discussion
and without seeing the other rater’s score (initially rated score) 5. Finally compare rankings side by side, with scores visible to both raters for final evaluation to reconcile
any remaining differences until full agreement is reached for the entire data set.
Both mind maps include significant novelty and novelty distribution differences, with the computer aided mind maps scoring higher than the manual maps in both cases. In either case, probability of rejecting the null hypothesis is p < 0.01; with Student’s t-test. A t-test is applied given that the objective is to determine if there is a significant difference in the creativity measures as given by a difference in mean value between conditions. Furthermore, the data satisfies the requirements for executing a t-test. The scale of measurement is a continuous scale, though the data does not closely follow a normal distribution (as evaluated by the Wilkes-Shapiro test of normality), However the t-test is robust against non-normality [41]. For this test, alpha = 0.05, the degree of freedom (df) and test statistic (t-value), respectively are df = 58, t-value = 8.76 for the golf problem, and df = 98, t-value = 3.53 for workforce reduction. This measure is to evaluate the significance of the observation that the computer aided mind maps scored higher for novelty in both examples. They likewise include different and distinct novel ideas, illustrating the advantages of the auto-generation approach to complement and amplify ideation processes of designers. One possible explanation is that this is due to the broad contextual and geographic distribution of Mturk respondents as compared to a team physically co-located in a design studio, who therefore may share substantial overlap of experience.
We also assess feasibility as a proxy metric for Quality [11], using a Likert scale approach to evaluating readiness or adaptability of a concept for execution given the current state of technology (Table 2, variation of a feasibility metric developed previously in the literature [42]). Feasibility is sometimes used in studies of earlier stage designs as quality may depend, per se, on detail design. In this case the same inter-rater sequencing was followed, however the values before reconciliation were slightly lower: locate golf ball r = 0.76; workforce, r = 0.53, respective Pearson’s correlation coefficients; given that the respective df = are 58 and 98, respectively, the associated critical values to reject the null hypothesis are r = 0.25, and 0.15, same as above. Again, each test meets the null hypothesis rejection criteria. Substantially more iteration was required in the individual assessment phase, and the initial agreement was less as compared to novelty assessment. This makes more sense as we define feasibility as an estimation of readiness for implementation of a solution concept and novelty as a test of whether something has been done before. In this context, novelty assessment should be more concrete. After discussion all final values were agreed upon by the raters and are those reported in Figure 14. There were no statistically significant differences between the manual and automatically generated mind maps for this metric.
3.4 Evaluation: Enterprise-Industry Case Study Both the manual and computer-aided mind maps for workforce reduction were provided to participants of a workshop of mid-career designers who were engaged in a 3-day workshop for professional development in design innovation methods [30,31]. The individuals worked for enterprises developing large-scale systems across the public sector. Participants industry and experience level vary significantly across workshops. As such, they were engaged in design innovation training to better understand the needs of the users, user experience, and future resources, especially in terms of available workforce. In this workshop, the median participant was advancing their skill set in design innovation approaches but was a domain expert in some aspect of logistics, engineering or scientific discipline, procurement and organizational processes. As mentioned in the introduction, their objective was to ideate methods and approaches to maintain or increase productivity considering a shrinking workforce. They were provided both the manual and computer-aided mind map to assist in the ideation portion of their workshop.
As this workshop has been replicated with the same framework several times, using a comparable target population from the same organization a subsample of 135 participants was taken. We can make a number of evaluations and assessments of the results. Firstly, the participants were asked to list three key topics or design methods covered on each day of the 3-day workshop. For all workshops, mind maps appeared consistently at the top of this survey (second only to mindsets (which is an integration of several activities) in this assessment survey,

11
see Table 3. The comparison shows results of a survey question in which participants are asked to list the three most useful take-aways from the workshop. By comparing the count of instances where users reported mind maps in each case, as compared to other responses, since all other methods are introduced in the same basic modular structure, we have a proxy metric of perceived utility. A simple interpretation of this result is that the majority of participants find the technique useful. Furthermore, participants who were asked, in one of three otherwise identical replicates of the course, to evaluate the computer aided mind maps, in addition to, ranking the most useful methods, we found that participants also found this automation approach useful via a second survey (Figure 15). The computer-aided mind map was positively received, as shown in the response frequencies reported in Table 3, and Figure 15. Some participants, unprompted, identified the computer-aided mind map as a feature of the workshop which they particularly enjoyed. For this study, we evaluated three workshops which are identical except that one involved introduction of the computer aided mind map to support ideation. There were 45 participants in the experimental workshop, and 49 and 41 in the two control workshops respectively.
We can summarize these evaluations, based on self-reported responses, with the following insights. First, participants across several courses reported mind mapping as useful. Secondly, they reported that the automated mind mapping process is useful in addition to the standard, manual process. If either of these were not true, we would not be confident to state that the users perceive a utility of the approach (see Table 3, and Figure 15). Therefore, we have an indicator to say that the automated mind mapping procedure can reduce design team person-hours cost significantly, and it was positively received alongside the standard mind mapping process in an enterprise-industrial design innovation context.
4 Discussion and Conclusions
From the above results, we can see the computer aided workforce reduction mind map was received positively by outside designers, while saving significant cost and time over the team generated mind map, scored well in clustering trials, and resulted in significantly greater average novelty in solutions. A summary of performance across the metrics is provided in Table 4. We did not consider quantity, as the quantity of ideas is a dependent variable and is manually set in an Mturk study- the study is kept open until the required quantity is fulfilled.
Both computer aided and manually-generated mind maps include significant novel and distinct concepts to be explored, refined, and combined by design teams. The manual mind maps had a greater number of nodes; however, this can be simply adjusted by extending the crowdsourced ideation and is an artificial difference. The manual version has a greater average depth or ‘number of branches.’ Again, this is an artificial difference as the cluster threshold is a tunable parameter in HDBSCAN. One notable phenomenal difference is that individual concepts in the manual mind map tended to be single words or short phrases, the reason for this is not clear. One possible explanation is that, in manual processes, concepts are represented by single words as a placeholder and supplemented with discussion or other documentation practices. Conversely however, less detail might be perceived as ambiguous and more difficult to interpret or apply. It is supportive of the trend or emergence of distributed workforce solutions. As such, while the manual and computer aided mind maps touch on similar concepts, the computer aided version had significant benefits (reduced time to develop, higher novelty). This result is shown in Table 5, which contains a comparison of similar concepts in both the manual and computer aided mind maps.
From the histograms in Figure 15, we can see that the computer-aided mind map has much greater average novelty of the ideas. While the scores were substantially higher for the auto generated mind maps novelty ranking, there is value in both approaches. Firstly, the manual process fosters group discussion, and in some cases the succinct descriptions may be valuable as short hand annotation rather than complete descriptions of the designs. Note that this study is limited by the experience of crowdsourced workers (i.e. “Is this approach still relevant in challenging domain specific problems?”) The automated process, as a workflow does not necessarily need to be applied by crowdsourced workers, it is possible to use the same approach with domain experts. Though crowdsourcing is

12
one implementation that also reduces workload on the design team. In any case, the EMSVD similarity estimations reduces the complexity of clustering, and the HDBSCAN approach helps to make the clustering process consistent across an objective measure (results in a mind map that is supported by a quantitative measure for grouping). Neither of these approaches is meant to directly compete with the other, each has benefits. Future research could explore mixed or adaptive approaches.
This research opens the doorway to explore the relationship between traditional design teams, crowdsourcing, and machine learning approaches to reduce effort and enhance outcomes in design. While machine learning approaches are emerging as a next generation of foundational toolsets to support simulation and geometric design stages, we see little in the appearance and exploration of how these capabilities can support the early phases of design. The earlier a decision is made in a design process the greater the impact on final outcome [43]. Therefore, we believe that integrating the intuition of human insight with the massive data processing capabilities of computational machine learning and natural language processing approaches will offer significant benefits in the emerging field of computer aided ideation. There are many unanswered questions as to how the designer, crowd, and machine learning tools may be stacked and integrated in new workflows with better performance than existing design methods. We also identified that there are many plausible clustering schemes within a single data set of design concepts (in early trials of this project). This ambiguity may also be a strength; there is a possibility to develop adaptive solution space representations that could feature or highlight adaptive clustering given a specific topic of interest. Finally, the raw clustering similarity performance of the computer aided mind map for workforce reduction was better than random but scored lower compared to manual maps. We see an emerging field of data driven ideation in the earliest phases of concept description as a potentially large and relatively untapped field in the design science literature.
In summary, in this project, we develop and utilize a pseudo-automatically generated or ‘computer aided’ mind mapping technique. It is based on the process for developing automation strategies developed by Anderson, et. al [29]. By following this process, and utilizing crowdsourcing and partial data, we developed a broad and high-frequency mind map in a fraction of the design team’s time for a fully manual mind map. The resulting mind map includes solutions that appeared in the manual mind map, as well as several novel solutions. This approach has the potential to significantly advance early stage conceptual design, and in turn demonstrates the potential of our design automation design process to support the Discover and Define phases of the 4-D design innovation process [30,31]. Our computer aided mind map technique has demonstrated the capability to generate mind maps with novel concepts quickly and cost-effectively. We believe the democratization of early-stage ideation enabled by this technique will allow many more companies and individuals to develop novel, successful designs, and to apply design to more challenges. Further, the clustering approach developed in this technique may find applications in many more fields. Exploring these alternative applications is an opportunity for future work, as is improving the thoroughness of the clustering approach.
4.1 Limitations Multiple iterations of the process were required, to refine the “how might we…” questions for the manual mind map. While this increased the time required to generate the final mind map, the responses did help guide the creation of more refined “how might we…” questions and could be seen as a meta-cognitive interaction with the map. Additionally, the clustering algorithm resulted in some items being filtered out (i.e. left unclustered). This was seen in some related efforts by the authors to use vector space modelling approaches in clustering. It is also not uncommon, however, for human raters to report the same issue. This may be due to a difficulty in capturing certain ideas. However, this may alternately simply be due to the sparsity of the distance matrix; by running the evaluation phase longer (at a higher cost), this issue may be ameliorated. Further, the existing clusters produced by the algorithm simplified the effort required for the human designer to cluster the remainder. Finally, the use of crowdsourcing requires an investment of time and resources in gathering the sparse similarity rankings, which is likely to scale as the square of the number of ideas to be evaluated. Future work may explore the use of other machine learning or crowd sourced approaches to also automatically label clusters.
4.2 Acknowledgments This work is supported by the Singapore University of Technology and Design (SUTD, sutd.edu.sg), and the SUTD-MIT International Design Centre (IDC, https://idc.sutd.edu.sg/). Any opinions, findings or conclusions in this paper are those of the authors and do not necessarily reflect the view of the sponsors. This
13
work extends largely from the Doctoral Thesis Dissertation of David S. Anderson, and a previous publication by several of the other authors on using network analysis to evaluate design concept spaces [44].
4.3 References [1] Buzan, T., and Buzan, B., 1996, The Mind Map Book: How to Use Radiant Thinking to Maximize Your
Brain’s Untapped Potential, Plume New York.
[2] Marshall, K. S., Crawford, R., and Jensen, D., 2016, “Analogy Seeded Mind-Maps: A Comparison of Verbal and Pictorial Representation of Analogies in the Concept Generation Process,” Volume 7: 28th International Conference on Design Theory and Methodology, ASME, p. V007T06A010.
[3] Otto, K., and Wood, K., 2001, Product Design: Techniques in Reverse Engineering and New Product Development, Prentice Hall.
[4] Anderson, M., Onvechi, J., Yamazaki, T., Wood, K., and Jensen, D., 2017, “Mind Map for Biologically Inspired Covert Visual Systems: A Pilot Study,” ASEE Rocky Mountain Section Conference.
[5] Jensen, D., Bauer, A., Doria, M., Perez, K. B., Anderson, D., and Wood, K. L., 2018, “A Bio-Inspired Mind Map to Assist in Concept Generation for Wall Climbing Systems: Development, Assessment and Resulting Prototypes,” ASEE Annual Conference and Exposition.
[6] Zahedi, M., and Heaton, L., 2016, “Mind Mapping as a Tool, as a Process, As a Problem/Solution Space,” DS 83: Proceedings of the 18th International Conference on Engineering and Product Design Education (E&PDE16), Design Education: Collaboration and Cross-Disciplinarity, Aalborg, Denmark, 8th-9th September 2016, pp. 166–171.
[7] Iyer, L. R., Doboli, S., Minai, A. A., Brown, V. R., Levine, D. S., and Paulus, P. B., 2009, “Neural Dynamics of Idea Generation and the Effects of Priming,” Neural Networks, 22(5), pp. 674–686.
[8] Davies, M., 2011, “Concept Mapping, Mind Mapping and Argument Mapping: What Are the Differences and Do They Matter?,” High. Educ., 62(3), pp. 279–301.
[9] Anderson, M., Onyechi, J., Yamazaki, T., Wood, K., and Jensen, D., “2017 ASEE Rocky Mountain Section Conference Mind Map for Biologically Inspired Covert Visual Systems: A Pilot Study.”
[10] Jensen, D., Bauer, A., Doria, M., Perez, K. B., Anderson, D., and Wood, K. L., 2018, “A Bio-Inspired Mind Map to Assist in Concept Generation for Wall Climbing Systems: Development, Assessment and Resulting Prototypes,” 2018 ASEE Annu. Conf. Expo.
[11] Shah, J. J., Smith, S. M., and Vargas-Hernandez, N., 2003, “Metrics for Measuring Ideation Effectiveness,” Des. Stud., 24(2), pp. 111–134.
[12] Buzan, T., 2006, Mind Map: The Ultimate Thinking Tool, HarperCollins Publishers Limited.
[13] Novak, J. D., and Cañas, A. J., 2006, “The Origins of the Concept Mapping Tool and the Continuing Evolution of the Tool,” Inf. Vis., 5(3), pp. 175–184.
[14] GroupMap Technology Pty Ltd, “GroupMap” [Online]. Available: https://www.groupmap.com/. [Accessed: 09-Jun-2019].
[15] Cañas, A. J., Carvalho, M., Arguedas, M., Leake, D. B., Maguitman, A., and Reichherzer, T., 2004, “Mining the Web to Suggest Concepts During Concept Map Construction,” Proc. of the First Int. Conference on Concept Mapping.
[16] “WordVis, the Visual Dictionary” [Online]. Available: http://wordvis.com/. [Accessed: 13-Nov-2018].
[17] Miller, G. A., and A., G., 1995, “WordNet: A Lexical Database for English,” Commun. ACM, 38(11), pp. 39–41.
[18] Fu, K., Chan, J., Cagan, J., Kotovsky, K., Schunn, C., and Wood, K., 2013, “The Meaning of ‘near’ and ‘Far’: The Impact of Structuring Design Databases and the Effect of Distance of Analogy on Design Output,” J. Mech. Des., 135(2), p. 21007.
[19] Fu, K., Cagan, J., Kotovsky, K., and Wood, K., 2013, “Discovering Structure in Design Databases through

14
Functional and Surface Based Mapping,” J. Mech. Des., 135(3), p. 31006.
[20] Eiben, C. B., Siegel, J. B., Bale, J. B., Cooper, S., Khatib, F., Shen, B. W., Players, F., Stoddard, B. L., Popovic, Z., and Baker, D., 2012, “Increased Diels-Alderase Activity through Backbone Remodeling Guided by Foldit Players,” Nat. Biotechnol., 30(2), pp. 190–192.
[21] Korpela, E., Werthimer, D., Anderson, D., Cobb, J., and Lebofsky, M., 2001, “SETI@ HOME—Massively Distributed Computing for SETI,” Comput. Sci. Eng., 3(1), pp. 78–83.
[22] von Ahn, L., Maurer, B., McMillen, C., Abraham, D., and Blum, M., 2008, “ReCAPTCHA: Human-Based Character Recognition via Web Security Measures.,” Science, 321(5895), pp. 1465–8.
[23] Grace, K., Maher, M. Lou, Preece, J., Yeh, T., Stangle, A., and Boston, C., 2015, “A Process Model for Crowdsourcing Design: A Case Study in Citizen Science,” Design Computing and Cognition’14, Springer, pp. 245–262.
[24] Perez, K. B., Anderson, D., and Wood, K. L., 2015, “Crowdsourced Design Principles for Leveraging the Capabilities of Additive Manufacturing,” Proc. 20th Int. Conf. Int. Conf. Eng. Des.
[25] Yao, H. (Hope), and Ren, M. Y., 2016, “Impressionist: A 3D Peekaboo Game for Crowdsourcing Shape Saliency,” Volume 7: 28th International Conference on Design Theory and Methodology, ASME, p. V007T06A025.
[26] Carter, W. T., Erno, D. J., Abbott, D. H., Bruck, C. E., Wilson, G. H., Wolfe, J. B., Finkhousen, D. M., Tepper, A., and Stevens, R. G., 2014, “The GE Aircraft Engine Bracket Challenge: An Experiment in Crowdsourcing for Mechanical Design Concepts,” 25th Solid Freeform Fabrication Symposium (SFF 2014), pp. 1402–1411.
[27] Ren, Y., Bayrak, A. E., and Papalambros, P. Y., 2016, “EcoRacer: Game-Based Optimal Electric Vehicle Design and Driver Control Using Human Players,” J. Mech. Des., 138(6), p. 061407.
[28] Camburn, B., and Wood, K., 2018, “Principles of Maker and DIY Fabrication: Enabling Design Prototypes at Low Cost,” Des. Stud.
[29] Anderson, D., Perez, K. B., Xuereb, Z., Otto, K., and Wood, K., 2018, “Design Processes of Design Automation Practitioners,” ASME 2018 International Design Engineering Technical Conferences and Computers and Information in Engineering Conference, American Society of Mechanical Engineers, p. V007T06A024-V007T06A024.
[30] Sng, K., Raviselvam, S., Anderson, D., Blessing, L., Camburn, B., and Wood, K. L., 2017, “A Design Case Study: Transferring Design Processes and Prototyping Principles into Industry for Rapid Response and User Impact,” Proc. 21st Int. Conf. Eng. Des. – ICED 2017.
[31] Camburn, B. A., Auernhammer, J. M., Sng, K. H. E., Mignone, P. J., Arlitt, R. M., Perez, K. B., Huang, Z., Basnet, S., Blessing, L. T., and Wood, K. L., 2017, “Design Innovation: A Study of Integrated Practice,” ASME 2017 International Design Engineering Technical Conferences and Computers and Information in Engineering Conference, American Society of Mechanical Engineers, p. V007T06A031-V007T06A031.
[32] Ross, J., Irani, L., Silberman, M., Zaldivar, A., and Tomlinson, B., 2010, “Who Are the Crowdworkers?: Shifting Demographics in Mechanical Turk,” CHI’10 Extended Abstracts on Human Factors in Computing Systems, ACM, pp. 2863–2872.
[33] Ipeirotis, P. G., 2010, “Demographics of Mechanical Turk.”
[34] Sheng Zhang, Weihong Wang, Ford, J., Makedon, F., and Pearlman, J., “Using Singular Value Decomposition Approximation for Collaborative Filtering,” Seventh IEEE International Conference on E-Commerce Technology (CEC’05), IEEE, pp. 257–264.
[35] Koren, Y., 2009, “The BellKor Solution to the Netflix Grand Prize.”
[36] Campello, R. J. G. B., Moulavi, D., and Sander, J., 2013, “Density-Based Clustering Based on Hierarchical Density Estimates,” Springer, Berlin, Heidelberg, pp. 160–172.
[37] Efron, B., and Tibshirani, R. J., 1994, An Introduction to the Bootstrap, CRC press.
15
[38] Puth, M.-T., Neuhäuser, M., and Ruxton, G. D., 2014, “Effective Use of Pearson’s Product–Moment Correlation Coefficient,” Anim. Behav., 93, pp. 183–189.
[39] Illowsky, B., and Dean, S. L., 2008, Collaborative Statistics, Rice University.
[40] Baer, J., and McKool, S. S., 2009, “Assessing Creativity Using the Consensual Assessment Technique,” Handbook of Research on Assessment Technologies, Methods, and Applications in Higher Education, IGI Global, pp. 65–77.
[41] Sawilowsky, S. S., and Blair, R. C., 1992, “A More Realistic Look at the Robustness and Type II Error Properties of the t Test to Departures from Population Normality.,” Psychol. Bull., 111(2), p. 352.
[42] Oman, S. K., Tumer, I. Y., Wood, K., and Seepersad, C., 2013, “A Comparison of Creativity and Innovation Metrics and Sample Validation through In-Class Design Projects,” Res. Eng. Des., 24(1), pp. 65–92.
[43] Tan, J. J. Y., Otto, K. N., and Wood, K. L., 2017, “Relative Impact of Early versus Late Design Decisions in Systems Development,” Des. Sci., 3.
[44] Lim, S. Y. C., Camburn, B. A., Moreno, D., Huang, Z., and Wood, K., 2016, “Design Concept Structures in Massive Group Ideation,” ASME 2016 International Design Engineering Technical Conferences and Computers and Information in Engineering Conference, American Society of Mechanical Engineers, p. V007T06A006-V007T06A006.

16
Figure 1: A template definition the structure of a mind map as used for the purpose of this research. The core is a central topic node with hierarchical solution categories branching out. The solutions are
typically more specific after more levels of branching.
Figure 2: Small sample of a manual mind map for workforce reduction problem. Only a small sample, 19 out of 241 nodes are shown. In this case ‘manual’ means it was generated by a design team using a
traditional mind mapping process. See Appendix B1 for full map of workforce reduction, text only. Solutions are simplified here for readability. The appendix is unmodified.
Problem Statement
Solution Category 1Concept 1_b
Concept 1_c
Concept 1_a
...
Solution Category 2 Concept 2_b
Concept 2_c
Concept 2_a
Concept 2_a Variant i
Concept 2_a Variant ii
...
...
...
Successful Workforce Reduction
[manual]
Automation
command and control
smart office 'Alexa' analogy
health monitoring
wearables
cloud feed
machine learning prediction
robotics
Increased Staff Engagement hard signals
visual graphic feedback
soft signals
appraisal
personal development
Process Redesign ...
Behavioural heuristics
Organisational hueristics
Consumer heuristics
Information heuristics
...
17
Figure 3: Small sample of a manual mind map for golf ball location problem. Only a small sample, 19 out of 57 nodes are shown. See Appendix B2 for full manual map of golf ball location, text only version. Solutions are
simplified here for readability. The appendix is unmodified.
Figure 4: Overall study design at a high level of abstraction.
Locate Golf Ball
[manual]
Change Humangolf lessons
track their movement
Change Game
putt-putt golf
robotic arm hits ball
virtual golf
Emit a Signal active
GPS
audio
LED
passive
RFID
bright color
Golf Course Systemschange course color
camera grid
pressure sensitive ground
...

18
(a)
(b)
Figure 5: Templates provided to Mechanical Turk users in the Concept generation (a) and Interpolation (b) phases.

19
Figure 6: Input and results of the EM-SVD process. (left) sparse similarity ratings, this image corresponds to 𝑌 in the algorithm description. It is a symmetric matrix where rows/columns correspond to the list of concepts
initially generated. The color indicates similarity between two concepts. White indicates no similarity data was collected. (right) dense model, where each row is a concept and each column is a dimension that EM-SVD
projects the data into. This corresponds to 𝑋 in the algorithm description.
(a) (b)
(c)
(d) (e)
Figure 7: Graphical representation of data output at key stages in the HDBSCAN algorithm. (a) graphical representation of an example (random) data set in a 2D space; (b) minimum spanning tree formation and outlier filtering; (c) dendrogram generated from the minimum spanning tree; (d) condensed dendrogram
clusters determined from the clustering threshold; (e) extracted clusters shown by color in original data set sample
20
Figure 8: Overview of the computer-aided mind map process, with activities shown in boxes and outputs shown in between.
Figure 9: Computer-aided mind map for workforce reduction. Only a small sample, 20 out of 75 nodes are shown. For a full, text-only version, see Appendix A1 (Figure A1.1). Solutions are simplified here for
readability. The appendix is unmodified.
Successful Workforce Reduction
[auto]
Big Data Analytics
employee data mining health monitoring
provide food
drones to sample air quality
optimise working hours based on health statistics
optimize productivity
pay by task completion
go home when work complete
monitor cause and effect of creative moments
waste reduction
track unused resources
use analytics packages to save time
Streamline Process
encourage feedback
increase communication efficiency
Automate Labor
logistics
HR
IOT
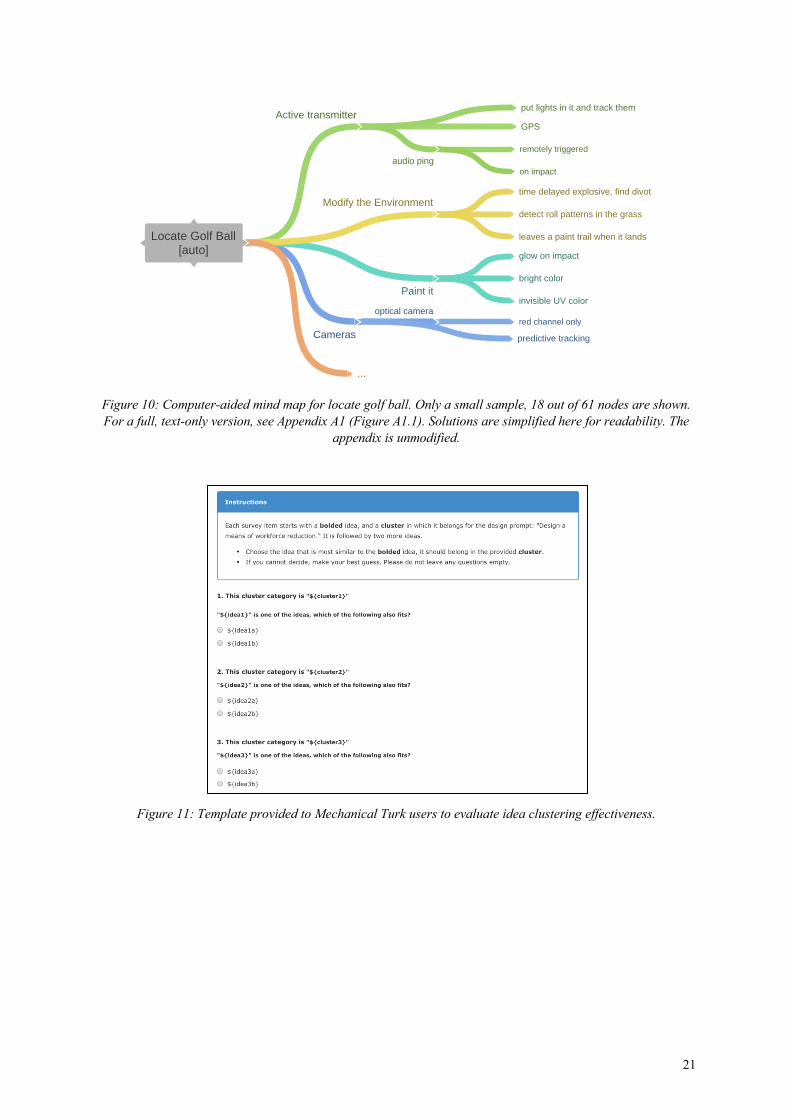
21
Figure 10: Computer-aided mind map for locate golf ball. Only a small sample, 18 out of 61 nodes are shown. For a full, text-only version, see Appendix A1 (Figure A1.1). Solutions are simplified here for readability. The
appendix is unmodified.
Figure 11: Template provided to Mechanical Turk users to evaluate idea clustering effectiveness.
Locate Golf Ball
[auto]
Cameras
optical camera
red channel only
predictive tracking
Paint it
bright color
invisible UV color
glow on impact
Active transmitterGPS
audio ping
remotely triggered
on impact
put lights in it and track them
Modify the Environmentdetect roll patterns in the grass
leaves a paint trail when it lands
time delayed explosive, find divot
...
22
Figure 12: Bootstrapped distribution of performance for cluster pairings. Human, auto, random (simulated coin toss), and control (test against passage from Novel, Moby Dick) cases were tested. The horizontal axis is a bin, e.g. 70% of responses were correct, and the vertical axis is the number of samples taken from the full set (500
comparisons per case) which scored in that bin; each sample is taken with 100 tests. The process is called bootstrapping and allows for the development of a response distribution from a large set of binary scoring
trials.
Table 1: Metric scale used by the raters in assigning novelty values to each individual solution
Rank Description 1 Solution exists and already serves same in domain purpose, 'everyday solution' 2 The technology solution combination exists in domain, but is uncommon not 'everyday' 3 Single new feature (new = approach or technology from another domain) 4 Two new features 5 Three or more new features together

23
Figure 13: Distribution of concept novelty for (top-left) workforce reduction manual mind map; (top-right) workforce reduction computer aided mind map; (bottom-left) locate golf ball manual mind map; (bottom-right)
locate golf ball computer aided mind map.
Table 2: Metric scale used by the raters in assigning feasibility values to each individual solution
Rank Description
1 There is no current support for this technology, nor would an expert reasonably predict it would be available within ~10 years; or the answer is absurd
2 The technology has not been proven but could reasonably be implemented in <10 years, as per expert opinion
3 The technology may or may not exist but would be costly or cumbersome to implement, ‘possible but unrealistic’
4 The technology exists and would be implementable, but there are foreseeable design constraints that make it uncertain whether it would succeed
5 The technology is readily adaptable and implementable, common or low risk
0
10
20
30
1 2 3 4 5
Freq
uenc
y
Novelty
Workforce Manual (n=50)
0
5
10
15
20
1 2 3 4 5
Freq
uenc
y
Novelty
Workforce Auto (n=50)
0
5
10
15
20
1 2 3 4 5
Freq
uenc
y
Novelty
Locate Golfball Manual (n=30)
0
5
10
15
1 2 3 4 5Fr
equu
ency
Novelty
Locate Golfball Auto (n=30)

24
Figure 14: Distribution of concept Feasibility for (top-left) workforce reduction manual mind map; (top-right) workforce reduction computer aided mind map; (bottom-left) locate golf ball manual mind map; (bottom-right)
locate golf ball computer aided mind map.
Table 3: Rank of most memorable technique reported by participants from day 2 of a professional development workshop in which several methods are covered. Number of professional participants polled is 135.
Percent Response Method 19% mindsets 18% mind map 12% design innovation process 8% c-sketch
0
10
20
30
40
1 2 3 4 5
Freq
uenc
y
Feasibility
Workforce Manual (n=50)
0
10
20
30
1 2 3 4 5
Freq
uenc
y
Feasibility
Workforce Auto (n=50)
0
5
10
15
1 2 3 4 5
Freq
uenc
y
Feasibility
Locate Golfball Manual (n=30)
0
5
10
15
20
1 2 3 4 5Fr
equu
ency
Feasbility
Locate Golfball Auto (n=30)
25
Figure 15: Survey responses from workshop participants on the computer-aided mind map.
Table 4: Performance overview comparison manually-generated vs computer-aided mind maps Design Team
Hours MTurk Hours
Nodes Avg Novelty Avg Feasibility
Crowdsourcing Cost
Avg. + stdev, where applies
workforce
golf
workforce
golf
workforce
golf
Workforce
golf
workforce
golf
workforce
golf
Computer Aided
4 hours
1.5 hours
49 hours
30 hours
75 nodes
61 nodes
2.4 + 1.3
4.2 + 0.8
4.2 + 0.8
3.2 + 0.9
$ 171.00 SGD
$ 148.10 SGD
Manual 60 hours
35 hours
0 hours
0 hours
241 nodes
57 nodes
1.7 + 0.7
2.3 + 0.9
4.3 + 0.5
3.5 + 1.0
$ 0.00 SGD
$ 0.00 SGD
0
5
10
15
20
25
30
strongly disagree disagree neutral agree strongly agree
Num
ber o
f Par
ticip
ant R
espo
nses
Participant responses to prompt, "The auto generated mind map ______":
"contained novel ideas" "contained relevant ideas" "could help me in the ideation process"

26
Table 5: Comparison of manually-generated and computer-aided mind map contents, using the workforce reduction example.
Manual Version Auto-Generated Version
Health Monitoring -> Wearables -> Fitness Tracking
• Use apple watches to monitor heartrate. If heartrate becomes too high or erratic, offer a break.
• Detect if someone is sick and needs to go home and detect if individuals are tired and should call it a day.
• You can use data about the times people tend to slow down or do work that isn't as good as usual to signal the time to take a short break and stretch or socialize.
Track food consumption and calorie intake -> Promote healthy eating
• Monitor when people are fatigued or not feeling well, and offer healthy choices to those employees
• Detect fatigue and perform interventions, such as a strategically necessary break for the employee, or sugary drinks or B-12 shots and energy drinks
Robotics -> Transfer of documents/hardware
• Use robot arms to automate loading at loading docks • Using autonomous vehicles to move products that would normally take
a forklift to move, someone loads, it moves to its destination, and someone unloads
• Digitize all documents and use email for all communications • Develop trucks that can automatically onload or offload other vehicles
on site Have employee retention strategies -> Have recruitment and orientation programs
• Use automated testing to evaluate and train employees with new skills or languages

27
Appendix A1: Full Computer-Aided Mind Map – Workforce Reduction
In the below mind maps, indentation level indicated the relationship between concepts; an indented line is the child of the previous line, at one higher level of indentation.
WORKFORCE REDUCTION Big Data/Analytics
Optimize Products
Use AI to match supply and demand. Continuously analyze markets and demand, and alert stakeholders to changes Use deep learning or graphical models or structured prediction to jointly predict product features and suggest new combinations
Employee Data Mining
Health Monitoring
Drones could be used to take air pollution samples from various locations at a given facility where sensors cannot be easily deployed. Automate health insurance claims processing, and use the data to optimize health care benefits packages Provide Food/Resources to Alleviate Fatigue
Studies have shown that people who walk frequently (and specifically those who walk in nature) are able to clear their heads are more likely to make better life choices because the time walking serves as pseudo-meditative process. Encourage that for employees Monitor when people are fatigued or not feeling well, and offer healthy choices to those employees Detect fatigue and perform interventions, such as a strategically necessary break for the employee, or sugary drinks or B-12 shots and energy drinks Monitor basic stats like blood pressure and heart rate as well as oxygen level to determine what areas of the job are causing workers the most stress, discomfort, or strain, then make those portions of the job more comfortable to increase morale and boost productivity. Drones could be used to create excitement and increase moral. Health monitors could check in and verify employees are moving around enough so that their normally sedentary lives don't lead to DVT or muscle loss or many other issues. Automatically advise employees when they should move around or even visit a company gym
Cheap sensors can be used to help monitor by keeping track of individuals throughout the organization Directly incentive preventative care A little fitbit-like object can be used for individual people to achieve goals and stay fit, and be rewarded at work.
Optimize work hours and breaks based on employee health
Optimize health training based on employee behaviors and risk factors By keeping track of heart rate, blood pressure and insulin levels throughout the day, you could cross reference it with any given employee’s productivity and/or quality metrics perhaps scheduling meetings during the least productivity part of the day, when employees are at lowest blood- sugar levels or when they are tired, would re-energize the staff. Optimize medical leave based on the condition Increase the amount of leave Use apple watches to monitor heartrate. If heartrate becomes too high or erratic, offer a break. Detect if someone is sick and needs to go home and detect if individuals are tired and should call it a day. Use wireless health monitoring to keep employees safe in difficult work conditions (like underground) You can use data about the times people tend to slow down or do work that isn't as good as usual to signal the time to take a short break and stretch or socialize. Predict issues before the occur, and provide preventative health coverage
Optimize Productivity

28
Monitor moments of productivity, then study how those came about and if those strategies can be deployed more widely Pay for the completion of specific tasks, like mechanical Turk Optimize the number of daily employees Collect data on everything - employees, customers, CEOs, managers, to analyze the trends and see where money need to go or not. A policy in place where people can go home when they're done with their work.
Waste Reduction
Optimize purchases to minimize waste Track unused resources (like office supplies) and redistribute/recycle internally Digitize all documents and use email for all communications
Use packaged analytics solutions to save costs and time Streamline Processes
Encourage internal suggestions for improvements
Let management work in manufacturing etc. for them to see what it's like, and the employees to come up with ideas for improvement Encourage employees to test new ideas internally
Increase communication efficiency
Automate the production of reports from templates and data Replace every meeting with email or other asynchronous communication
Automate Labor
Use robots to clean floors Automated transport
Use drones to automate shipping Automate mail delivery Autonomous vehicles can be used to shuttle people from one location to another.
Identify & automate repetitive tasks
Automate small tasks such as locks, lights, chairs pushing themselves in, etc. Automate coffee or office food production Machine learning can be used to recognize patterns and ultimately used with JavaScript or Python to increase automation procedures and tasks.
Logistics
Use robot arms to automate loading at loading docks Using autonomous vehicles to move products that would normally take a forklift to move, someone loads, it moves to its destination, and someone unloads Use drones to deliver resources to those who are underserved by traditional infrastructure, especially during disasters Dynamically reallocate small robots to assist in production Develop trucks that can automatically onload or offload other vehicles on site Autonomous drones can be used to deliver prescription medications to shut ins and disabled people who are not able to travel to pharmacies to pick them up themselves.
HR
Use data to predict market changes and hire the right people to understand it. Replace people with machines for routine tasks - automate customer support - monitor and optimize performance - motivate people automatically
IOT Use Alexa or similar systems to automate/distribute ordering office supplies Welcome desks/basic help
Automatically welcome people and show them where to go AI can be used to automatically authenticate individuals when they call in on the phone
Use automated testing to evaluate and train employees with new skills or languages
Figure A1.1: Computer-aided mind map for workforce reduction, reformatted as indented, categorized list.
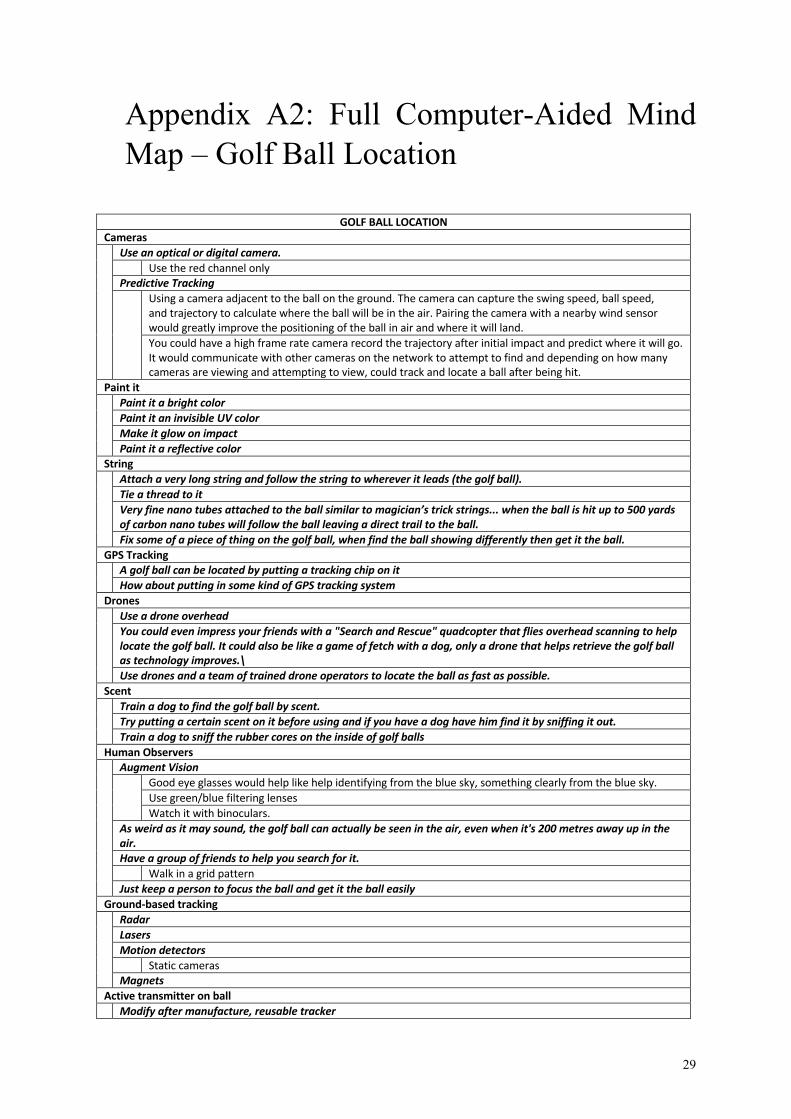
29
Appendix A2: Full Computer-Aided Mind Map – Golf Ball Location
GOLF BALL LOCATION Cameras
Use an optical or digital camera. Use the red channel only Predictive Tracking
Using a camera adjacent to the ball on the ground. The camera can capture the swing speed, ball speed, and trajectory to calculate where the ball will be in the air. Pairing the camera with a nearby wind sensor would greatly improve the positioning of the ball in air and where it will land. You could have a high frame rate camera record the trajectory after initial impact and predict where it will go. It would communicate with other cameras on the network to attempt to find and depending on how many cameras are viewing and attempting to view, could track and locate a ball after being hit.
Paint it
Paint it a bright color Paint it an invisible UV color Make it glow on impact Paint it a reflective color
String
Attach a very long string and follow the string to wherever it leads (the golf ball). Tie a thread to it Very fine nano tubes attached to the ball similar to magician’s trick strings... when the ball is hit up to 500 yards of carbon nano tubes will follow the ball leaving a direct trail to the ball. Fix some of a piece of thing on the golf ball, when find the ball showing differently then get it the ball.
GPS Tracking
A golf ball can be located by putting a tracking chip on it How about putting in some kind of GPS tracking system
Drones
Use a drone overhead You could even impress your friends with a "Search and Rescue" quadcopter that flies overhead scanning to help locate the golf ball. It could also be like a game of fetch with a dog, only a drone that helps retrieve the golf ball as technology improves.\ Use drones and a team of trained drone operators to locate the ball as fast as possible.
Scent
Train a dog to find the golf ball by scent. Try putting a certain scent on it before using and if you have a dog have him find it by sniffing it out. Train a dog to sniff the rubber cores on the inside of golf balls
Human Observers
Augment Vision
Good eye glasses would help like help identifying from the blue sky, something clearly from the blue sky. Use green/blue filtering lenses Watch it with binoculars.
As weird as it may sound, the golf ball can actually be seen in the air, even when it's 200 metres away up in the air. Have a group of friends to help you search for it. Walk in a grid pattern Just keep a person to focus the ball and get it the ball easily
Ground-based tracking
Radar Lasers Motion detectors Static cameras Magnets
Active transmitter on ball Modify after manufacture, reusable tracker

30
GPS Allow paid upgrades
Audio ping
On impact Triggered by remote Inaudible to humans, use special device
Remotely triggered colored smoke Put lights in it and track them. Sensors in the golf ball
Modify the environment
Find roll patterns in the grass with a template image and a live image overlaid in a computer program. Paint it and it leaves a trail when hit We can dip the ball in light coloured paint before its hit, so when it gets hit it will drip few drops on the paint till it lands which will give the location of it Place a time delayed explosive inside of it and look for a crater site.
Water Hazards If it gets stuck in the water, give it a little parachute that can set off when it somehow detects that it's in water.
Figure A2.1: Computer-aided mind map for golf ball location (detect golf ball) hit from a tee, formatted as indented, categorized list.
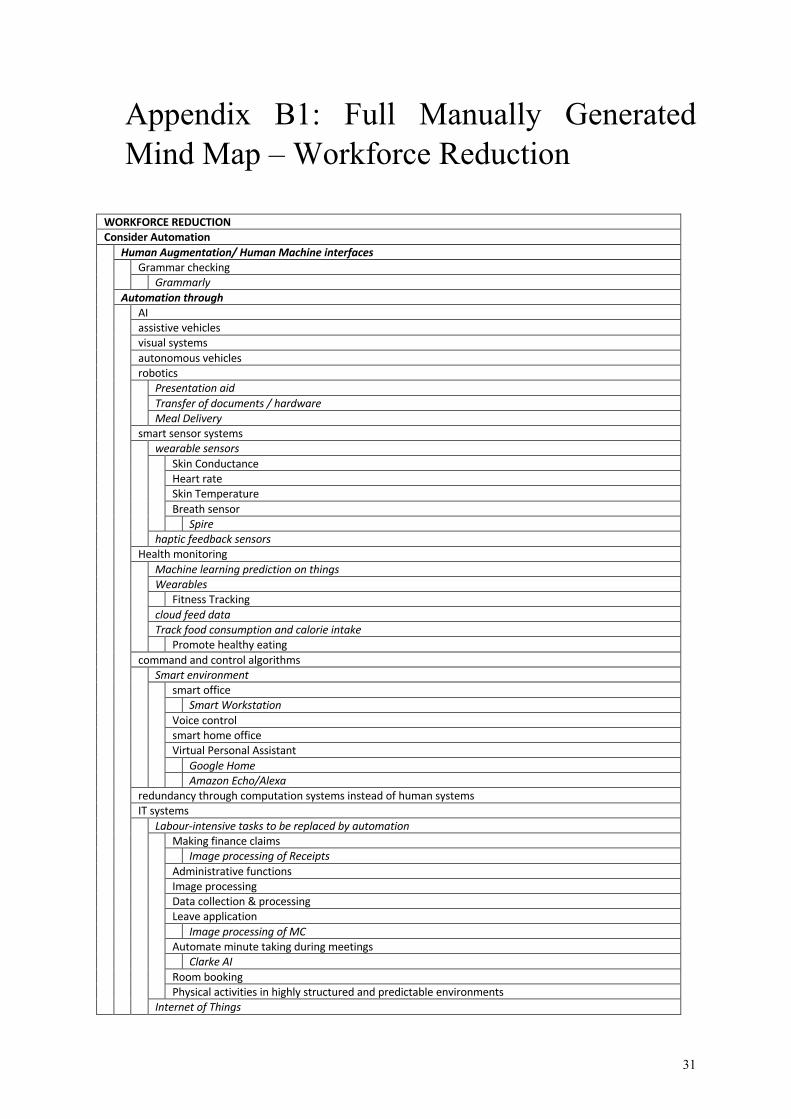
31
Appendix B1: Full Manually Generated Mind Map – Workforce Reduction
WORKFORCE REDUCTION Consider Automation
Human Augmentation/ Human Machine interfaces Grammar checking
Grammarly Automation through AI
assistive vehicles visual systems autonomous vehicles robotics Presentation aid
Transfer of documents / hardware Meal Delivery
smart sensor systems wearable sensors
Skin Conductance Heart rate Skin Temperature Breath sensor Spire
haptic feedback sensors Health monitoring Machine learning prediction on things
Wearables Fitness Tracking cloud feed data Track food consumption and calorie intake Promote healthy eating
command and control algorithms Smart environment
smart office Smart Workstation Voice control smart home office Virtual Personal Assistant Google Home Amazon Echo/Alexa
redundancy through computation systems instead of human systems IT systems Labour-intensive tasks to be replaced by automation
Making finance claims Image processing of Receipts Administrative functions Image processing Data collection & processing Leave application Image processing of MC Automate minute taking during meetings Clarke AI Room booking Physical activities in highly structured and predictable environments
Internet of Things
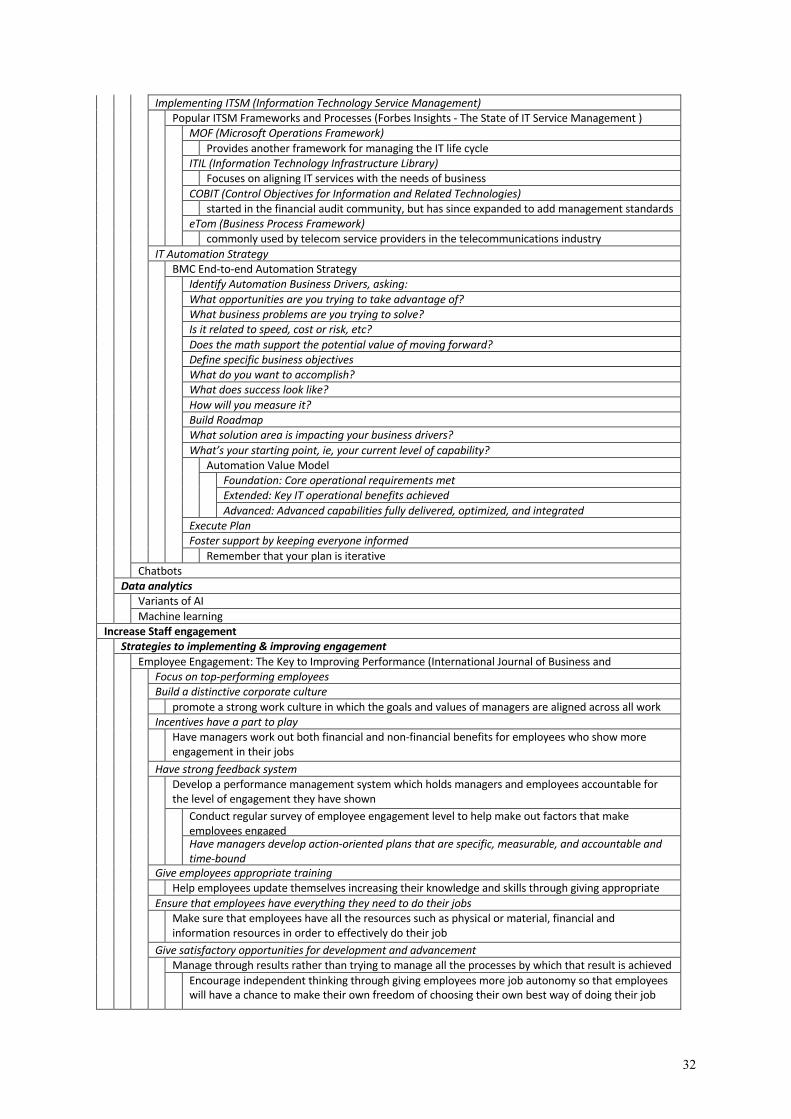
32
Implementing ITSM (Information Technology Service Management) Popular ITSM Frameworks and Processes (Forbes Insights - The State of IT Service Management )
MOF (Microsoft Operations Framework) Provides another framework for managing the IT life cycle ITIL (Information Technology Infrastructure Library) Focuses on aligning IT services with the needs of business COBIT (Control Objectives for Information and Related Technologies) started in the financial audit community, but has since expanded to add management standards eTom (Business Process Framework) commonly used by telecom service providers in the telecommunications industry
IT Automation Strategy BMC End-to-end Automation Strategy
Identify Automation Business Drivers, asking: What opportunities are you trying to take advantage of? What business problems are you trying to solve? Is it related to speed, cost or risk, etc? Does the math support the potential value of moving forward? Define specific business objectives What do you want to accomplish? What does success look like? How will you measure it? Build Roadmap What solution area is impacting your business drivers? What’s your starting point, ie, your current level of capability? Automation Value Model
Foundation: Core operational requirements met Extended: Key IT operational benefits achieved Advanced: Advanced capabilities fully delivered, optimized, and integrated
Execute Plan Foster support by keeping everyone informed Remember that your plan is iterative
Chatbots Data analytics Variants of AI
Machine learning Increase Staff engagement
Strategies to implementing & improving engagement Employee Engagement: The Key to Improving Performance (International Journal of Business and
Management) Focus on top-performing employees Build a distinctive corporate culture promote a strong work culture in which the goals and values of managers are aligned across all work
sections Incentives have a part to play Have managers work out both financial and non-financial benefits for employees who show more
engagement in their jobs Have strong feedback system Develop a performance management system which holds managers and employees accountable for
the level of engagement they have shown Conduct regular survey of employee engagement level to help make out factors that make
employees engaged Have managers develop action-oriented plans that are specific, measurable, and accountable and time-bound
Give employees appropriate training Help employees update themselves increasing their knowledge and skills through giving appropriate
trainings Ensure that employees have everything they need to do their jobs Make sure that employees have all the resources such as physical or material, financial and
information resources in order to effectively do their job Give satisfactory opportunities for development and advancement Manage through results rather than trying to manage all the processes by which that result is achieved
Encourage independent thinking through giving employees more job autonomy so that employees will have a chance to make their own freedom of choosing their own best way of doing their job
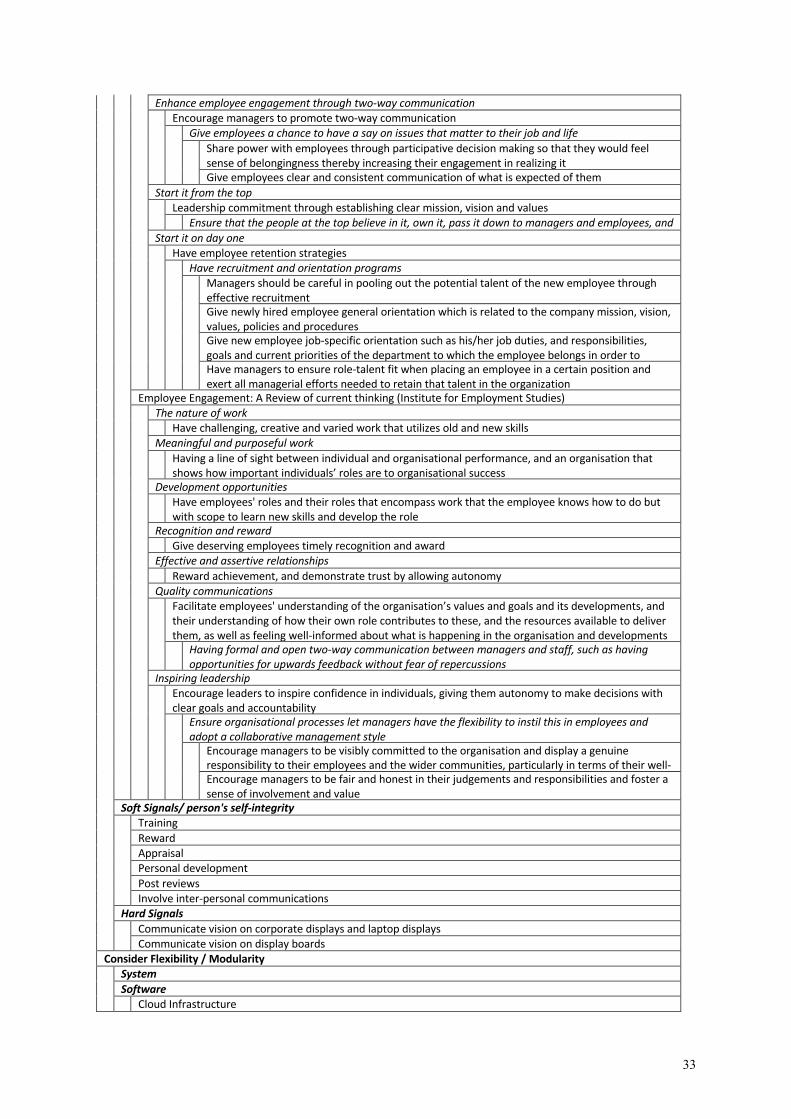
33
Enhance employee engagement through two-way communication Encourage managers to promote two-way communication
Give employees a chance to have a say on issues that matter to their job and life Share power with employees through participative decision making so that they would feel
sense of belongingness thereby increasing their engagement in realizing it Give employees clear and consistent communication of what is expected of them
Start it from the top Leadership commitment through establishing clear mission, vision and values
Ensure that the people at the top believe in it, own it, pass it down to managers and employees, and enhance their leadership Start it on day one
Have employee retention strategies Have recruitment and orientation programs
Managers should be careful in pooling out the potential talent of the new employee through effective recruitment Give newly hired employee general orientation which is related to the company mission, vision, values, policies and procedures Give new employee job-specific orientation such as his/her job duties, and responsibilities, goals and current priorities of the department to which the employee belongs in order to enable him/her to develop realistic job expectations and reduce role conflict that might arise in the future Have managers to ensure role-talent fit when placing an employee in a certain position and exert all managerial efforts needed to retain that talent in the organization
Employee Engagement: A Review of current thinking (Institute for Employment Studies) The nature of work
Have challenging, creative and varied work that utilizes old and new skills Meaningful and purposeful work Having a line of sight between individual and organisational performance, and an organisation that
shows how important individuals’ roles are to organisational success Development opportunities Have employees' roles and their roles that encompass work that the employee knows how to do but
with scope to learn new skills and develop the role Recognition and reward Give deserving employees timely recognition and award Effective and assertive relationships Reward achievement, and demonstrate trust by allowing autonomy Quality communications Facilitate employees' understanding of the organisation’s values and goals and its developments, and
their understanding of how their own role contributes to these, and the resources available to deliver them, as well as feeling well-informed about what is happening in the organisation and developments Having formal and open two-way communication between managers and staff, such as having
opportunities for upwards feedback without fear of repercussions Inspiring leadership Encourage leaders to inspire confidence in individuals, giving them autonomy to make decisions with
clear goals and accountability Ensure organisational processes let managers have the flexibility to instil this in employees and
adopt a collaborative management style Encourage managers to be visibly committed to the organisation and display a genuine
responsibility to their employees and the wider communities, particularly in terms of their well-being Encourage managers to be fair and honest in their judgements and responsibilities and foster a sense of involvement and value
Soft Signals/ person's self-integrity Training
Reward Appraisal Personal development Post reviews Involve inter-personal communications
Hard Signals Communicate vision on corporate displays and laptop displays
Communicate vision on display boards Consider Flexibility / Modularity
System Software Cloud Infrastructure
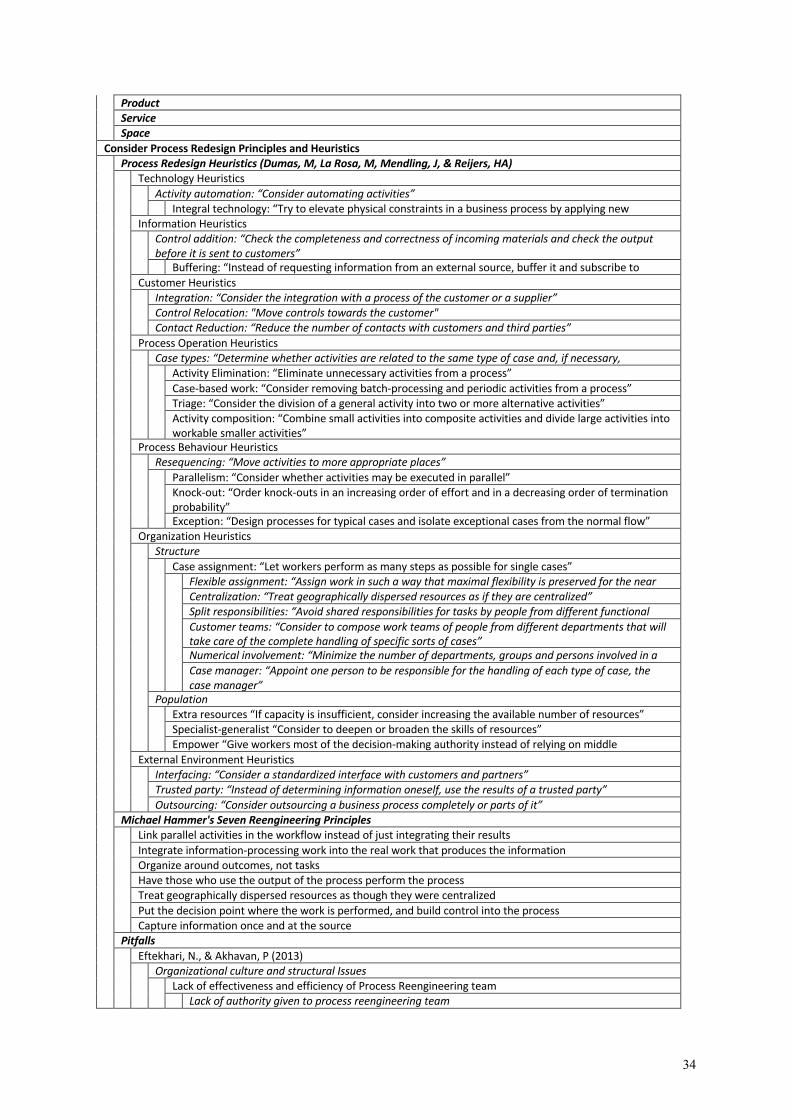
34
Product Service Space
Consider Process Redesign Principles and Heuristics
Process Redesign Heuristics (Dumas, M, La Rosa, M, Mendling, J, & Reijers, HA) Technology Heuristics
Activity automation: “Consider automating activities” Integral technology: “Try to elevate physical constraints in a business process by applying new
technology” Information Heuristics Control addition: “Check the completeness and correctness of incoming materials and check the output
before it is sent to customers” Buffering: “Instead of requesting information from an external source, buffer it and subscribe to
updates” Customer Heuristics Integration: “Consider the integration with a process of the customer or a supplier”
Control Relocation: "Move controls towards the customer" Contact Reduction: “Reduce the number of contacts with customers and third parties”
Process Operation Heuristics Case types: “Determine whether activities are related to the same type of case and, if necessary,
distinguish new processes” Activity Elimination: “Eliminate unnecessary activities from a process” Case-based work: “Consider removing batch-processing and periodic activities from a process” Triage: “Consider the division of a general activity into two or more alternative activities” Activity composition: “Combine small activities into composite activities and divide large activities into workable smaller activities”
Process Behaviour Heuristics Resequencing: “Move activities to more appropriate places”
Parallelism: “Consider whether activities may be executed in parallel” Knock-out: “Order knock-outs in an increasing order of effort and in a decreasing order of termination probability” Exception: “Design processes for typical cases and isolate exceptional cases from the normal flow”
Organization Heuristics Structure
Case assignment: “Let workers perform as many steps as possible for single cases” Flexible assignment: “Assign work in such a way that maximal flexibility is preserved for the near
future” Centralization: “Treat geographically dispersed resources as if they are centralized” Split responsibilities: “Avoid shared responsibilities for tasks by people from different functional units” Customer teams: “Consider to compose work teams of people from different departments that will take care of the complete handling of specific sorts of cases” Numerical involvement: “Minimize the number of departments, groups and persons involved in a process” Case manager: “Appoint one person to be responsible for the handling of each type of case, the case manager”
Population Extra resources “If capacity is insufficient, consider increasing the available number of resources”
Specialist-generalist “Consider to deepen or broaden the skills of resources” Empower “Give workers most of the decision-making authority instead of relying on middle management” External Environment Heuristics
Interfacing: “Consider a standardized interface with customers and partners” Trusted party: “Instead of determining information oneself, use the results of a trusted party” Outsourcing: “Consider outsourcing a business process completely or parts of it”
Michael Hammer's Seven Reengineering Principles Link parallel activities in the workflow instead of just integrating their results
Integrate information-processing work into the real work that produces the information Organize around outcomes, not tasks Have those who use the output of the process perform the process Treat geographically dispersed resources as though they were centralized Put the decision point where the work is performed, and build control into the process Capture information once and at the source
Pitfalls Eftekhari, N., & Akhavan, P (2013)
Organizational culture and structural Issues Lack of effectiveness and efficiency of Process Reengineering team
Lack of authority given to process reengineering team

35
Lack of training and related skills for process reengineering team Resistance to change Fear of changes
Lack of planning for changes Communication and organic structure Lack of motivation and award system
High hierarchical levels Organizational planning issues Applying incorrect strategies and methodologies
Applying incorrect strategies in implementing process redesign Incomplemetion of restructuring the organization Inadequate process identification
Project planning and management Lack of proper tools for assessing the effects of designed solutions before implementation
Inadequate and inefficient resources Supportive and leadership issues Management Commitment
Lack of management commitment Lack of top management support Lack of strategic viewpoint
Supportive and consultative issues Technical and functional issues Misusing IT Tools
Negative view about IT application Abusing IT and its tools Misdiagnosis of role of IT in Process Reengineering
Employee's education and creating innovation among them Lack of proper training to the employees involved in the project
Lack of innovation in process redesigning Habib, M.N. (2013) Lack of proper training
Focus on short-term objectives Cross-functional teams creating problem Management heterogeneity Vague methodology Employee commitment and job security
Figure B.1: Manually generated mind map for workforce reduction, reformatted as indented, categorized list.

36
Appendix B2: Full Manual Mind Map – Golf Ball Location
DETECT GOLFBALL Analogies
Hunting bird dog Torpedo Radar Artillery field obesrvers: spotters
Golf Course Systems
Radar System Light Beams Video Cameras Follow Ball (TV Display) Electronic Grid Camera Grid Course Characteristics
change course colors funnel shape to course add plexiglass or nets to sides of fairways mylar course
Pressure sensitive ground Change Ball
Ball Inflates String Attached to Ball Ball Becomes Bigger Jumping Ball
Detect Angle & Speed Calculate Trajectory
Accelerometer Radar Gun Strain Gauge Rate of Angle Change Handle Orientation Gyroscope Inclinometer
Ball Detects Human
Proximity Sensor when Close Hear Beeper w/ Ear Phones Shoot Laser Beam Back Mini Camera in Ball
Human
Golf Lessons Take Series of Pictures
Change Game
Shorter Golf Course Virtual/ Video Golf Play at Night glow in the dark Mylar Robotic Arm Hits Ball Putt-Putt Golf
In Flight
Beep Trail Smoke Trail
Change Human

37
Binoculars Emit a Signal
Passive Emitter
dog detects scent smell: human detects magnetic ball bright colors
Active Emitter
sound horn in ball GPS eject smoke exploding ball radio signal LED array in ball wave flag beep speaker in ball, use microphone to call yourself eject ink collar and antenna analogy: fish finder
Measure with Speed of Sound: Time to Hit Ground
Figure B2.1: Computer-aided mind map for golf ball location (detect golf ball) hit from a tee, formatted graphically
Copyright © 2022 FDOKUMEN