Attitude Scale for the Computer-Aided Geography Lesson
6
World Applied Sciences lownal 7 (6): 791-796,2009 ]SSN 1818-4952 © mOS] Publications, 2009 Attitude Scale for the Computer-Aided Geography Lesson Emine Teyfur Ege University Faculty of Education, izmir, Turkey Abstract: "Attitude scale for computer-aided geography lesson" was tried to be developed in this research. The research was performed in high school in Education year 0£2007-2008 within the borders of Izrnir. Total 200 high school students participated in the research. 175 persons were not included in the evaluation due to forms filled wrong. Research data were analyzed with the program of SPSS for Windows 16.0. According to the results, Cronbach alpha confidence coefficient of the scale was fOWld to be.94. The scale developed as 5 point likert type consists of total 38 items as 18 positive and 20 negative. Key words: Attitude scale' Computer-aided' Geography lesson' High school INTRODUCTION Computer has not been used widely for teaching geography in our COlUltry yet. The purpose of geography is to introduce natural and economical envirornnents and give them the thought and power of establishing a healthy harmony with their envirornnent. In order to achieve this main purpose, it is achieved that students acquire durable backgrOlmd information and efficient knowledge so they are enabled to benefit from scientific approach for establishing harmony with the envirornnent [1]. It has been stated by the media in recent years that information Technologies will improve teaching envirornnents in Education and increase learning skills of student. Many researchers expressed that information Technologies would increase the school efficiencies and reduce Education expenses and improve the learning envirornnent and students could learn better [2]. It became a requirement that ClUTent tools and equipment to increase the motivation of student are used to achieve the acquisition foreseen III lessons within changing clUTiculurn in our COlUltry. Existence of materials in learning envirornnents for geography are very important for the learners. Computer among these materials is an attractive learning material having many image and other storage possibilities. New geography teaching program supports the use of information-commlUlication Technologies in teaching geography subjects. In this regard, the most important innovation is about CBS (geographical information systems). CBS stated as a definition in course books prepared in accordance with previous programs was introduced to the new program as a direct efficiency development. In this case, efficiency recommended by the program for obtaining some acquisitions are seen in the examples. The program suggests CBS program as "the teacher can develop CBS applications depending on technical equipment and physical facilities in the schools and review the examples." Many geographers express that geography teachers have many problems in Turkey [24]. According to Allport [3], the tenu of attitude was used in art branch firstly as "preparation for the action mentally" relating to the skills. "Mental attitudes" and "motor attitudes" distinction was seen in modem psychology. Allport [3] identified 16 attitude definitions before him. Some of them are as follows: • "The attitude is the preparation for a series of action or attention"". • "The attitude is the mixture of emotions, desires, fairs, beliefs, prejudices or other tendencies in the form of preparation or installation of the person for an action due to various lives". • "The attitude is the tendency of taking action towards or against something in the envirornnent being of positive or negative value [4]". Allport [3] concluded from these defiintions that the attitude has three characteristics: 1) Being ready for appropriate or inappropriate response, 2) organization via experiences and 3) being activated in the presence of object or conditions relating to the attitude [5]. The definition of Allport for attitude is that "the mental or Corresponding Author: Dr. Emine Teyfur, Ege University Faculty of Education, izrnir, Turkey 791
-
Upload
independent -
Category
Documents
-
view
2 -
download
0
Transcript of Attitude Scale for the Computer-Aided Geography Lesson
World Applied Sciences lownal 7 (6): 791-796,2009]SSN 1818-4952© mOS] Publications, 2009
Attitude Scale for the Computer-Aided Geography Lesson
Emine Teyfur
Ege University Faculty of Education, izmir, Turkey
Abstract: "Attitude scale for computer-aided geography lesson" was tried to be developed in this research.The research was performed in high school in Education year 0£2007-2008 within the borders of Izrnir.Total 200 high school students participated in the research. 175 persons were not included in the evaluationdue to forms filled wrong. Research data were analyzed with the program of SPSS for Windows 16.0. Accordingto the results, Cronbach alpha confidence coefficient of the scale was fOWld to be.94. The scale developed as5 point likert type consists of total 38 items as 18 positive and 20 negative.
Key words: Attitude scale' Computer-aided' Geography lesson' High school
INTRODUCTION
Computer has not been used widely for teachinggeography in our COlUltry yet. The purpose of geographyis to introduce natural and economical envirornnentsand give them the thought and power of establishing ahealthy harmony with their envirornnent. In order toachieve this main purpose, it is achieved that studentsacquire durable backgrOlmd information and efficientknowledge so they are enabled to benefit fromscientific approach for establishing harmony with theenvirornnent [1].
It has been stated by the media in recent yearsthat information Technologies will improve teachingenvirornnents in Education and increase learning skills ofstudent. Many researchers expressed that informationTechnologies would increase the school efficiencies andreduce Education expenses and improve the learningenvirornnent and students could learn better [2]. It becamea requirement that ClUTent tools and equipment to increasethe motivation of student are used to achieve theacquisition foreseen III lessons within changingclUTiculurn in our COlUltry. Existence of materials inlearning envirornnents for geography are very importantfor the learners. Computer among these materials is anattractive learning material having many image andother storage possibilities. New geography teachingprogram supports the use of information-commlUlicationTechnologies in teaching geography subjects. In thisregard, the most important innovation is about CBS(geographical information systems). CBS stated as adefinition in course books prepared in accordance with
previous programs was introduced to the new program asa direct efficiency development. In this case, efficiencyrecommended by the program for obtaining someacquisitions are seen in the examples. The programsuggests CBS program as "the teacher can develop CBSapplications depending on technical equipment andphysical facilities in the schools and review theexamples." Many geographers express that geographyteachers have many problems in Turkey [24].
According to Allport [3], the tenu of attitude wasused in art branch firstly as "preparation for the actionmentally" relating to the skills. "Mental attitudes" and"motor attitudes" distinction was seen in modem
psychology. Allport [3] identified 16 attitude definitionsbefore him. Some of them are as follows:
• "The attitude is the preparation for a series of actionor attention"".
• "The attitude is the mixture of emotions, desires,fairs, beliefs, prejudices or other tendencies in theform of preparation or installation of the person foran action due to various lives".
• "The attitude is the tendency of taking actiontowards or against something in the envirornnentbeing of positive or negative value [4]".
Allport [3] concluded from these defiintions that theattitude has three characteristics: 1) Being ready forappropriate or inappropriate response, 2) organization viaexperiences and 3) being activated in the presence ofobject or conditions relating to the attitude [5]. Thedefinition of Allport for attitude is that "the mental or
Corresponding Author: Dr. Emine Teyfur, Ege University Faculty of Education, izrnir, Turkey791
beril
Text Box
25
WorldAppl. Sci. J, 7 (6): 791-796,2009
neural preparation status formed as experience and havinga directive or dynamic effect on the response of the
individual for relevant situation or objects [3]. The
attitude is "the implicit response mediating explicit
response pattern (as a result of previous learning),
stimulating various stimulant patterns, thought asmeaningful in social terms in the society where the
individual lives according to Doob (1947). Chein [6]
opposed to the characterization of attitude as aresponse by Doob. The attitude is a tendency for
response. Thurstone [7] defined the attitude as a singledimension (affective) in the form of "degree of positive ornegative feelings relating to a psychological object" in
accordance with the purposes of scaling although hedefended that the attitude is multi-dimension. The one
emphasizing that feelings are perception and thoughts
are cognition is Smith [8]. According to him, attitudes
have a sense/or direction, density or being organized,"time perspective" and "cognitive concept" cognitive
components, "political orientation" constitute the
behavioural element of the attitude. Fishbein and Ajzen
[9] express the three main characteristics of the attitude as"it is learnt, tendency to the action and these actions
conforming to attitude object directly consistent.According to Anderson [5], the attitude is only
emotion/excitation consistent or learnt and formed in
the experience is not enough to differentiate it from
other affective characteristics. For this reason, the last
three characteristics (target, direction and intensity) are
very important to differentiate it from other affectivecharacteristic and structures. Most of the psychological
variables are complex, composite variables [10].
Therefore, it is very difficult to measure such variables
than measuring physical variables, but it is not impossible
[11]. The attitude is defined as negative or positive
attitude towards other objects and things individually,impressions gained via experiences. In addition to these,
researchers discuss that attitudes are not enough only
to estimate the behaviours and there are important
inconsistencies between attitudes and behaviours [12].
The attitude is "the status of being ready emotionally or
tendency to behave for accepting or rejecting a certainobject, person, group, institution or an opinion as an
individual" according to Ozguven. The attitudes of
individuals arise from their beliefs in object being the
subject matter of the attitude. Attitudes and beliefs are
always together. The belief accompanying an attitude iscalled "an opinion". People tend to act in parallel with
their feelings and opinions. The belief side and opinion
side of an attitude affects each other. Attitudes can be
792
predicted from observable behaviours being outward
of the individuals.
Benefiting from computers successfully in Education
depends mostly on attitudes of students and teachers
[13]. In other words, it depends on using computer
efficiently in Education of the students.Beyerbach and his colleagues express that use of
many computer-aided concept maps enriching the
learning environment and making meaningful learning
easy will increase learning at the top level [14]. Guven and
Uzman [15] developed an attitude scale for the geography
taught at secondary school previously. The confidencecoefficient of the scale consisting of 39 items was fOWld
as 0.90 [15].
Study
Aim Of The Study: The aim of this study is to
develop an attitude scale for the computer-aidedgeography lesson. It was aimed to measure attitudes of
students towards both the computer and geography
with this scale developed.
Design Stage for the ScaleStage of Item Pool: "While attitude scale items as a tool fordata collection were created at the stage of collecting
related information, students attending to 10. class of
TED Aliaga College, Bomova Amtolian High School
and Private Bomova College within the provincial border
of Izrnir were asked to write a composition to learn their
opinions about computer-aided geography lesson relatingto the subject. It was aimed to get information about
attitudes of students towards computer-aided geography
in the composition. It was determined whether the
students had used computer or not before for this
information. All of the students indicated that geography
is mostly based on visuality. Item pool was createdaccording to data obtained from students and branch
teachers.
Stage of Learned Opinion: Validity is the degree of
measuring the aim of a measuring device prepared for
measurmg. In questionnaires, "scope validity", thecompliance of the questionnaire with the entire aim in
terms of targets to be measured and contents of questions
are important. Opinions of the one being specialist about
this subject must be learnt relating to the questionnaire
prepared. Amendments may be made in the questionnaire
after reviewing according to the ones criticized relating tothe structure of questionnaire. Questions of the
questionnaire must be clear and comprehensible, the

WorldAppl. Sci. J, 7 (6): 791-796,2009
persons should Wlderstand the same thing from thequestion. While item pool was created for the scale,supports of geography teachers were taken andopinions of specialists were taken for the items created.Total 40 items were created for the scale to be performedas the pre-practice study. It was paid attention thatpositive and negative expressions were equal. Opinionsof total 6 academicians as being 2 education programsfield, 2 computer and instructional Technologies, 1psychological cOWlSeling and guidance and 1 measureand evaluation field for the scope validity for learntopmlOllS.
Stage of Pretesting: The scale was applied to total 200persons being the student at 10. class at TED AliagaCollege, Bomova Anatolian High School and PrivateBomova College in 1zrnir. These students are the oneslearning computer-aided geography. Negative andpositive expressions in the scale were created with closenumbers. Since there was data loss for the empty itemsnot filled, results of 175 persons were not included in the
Table 1: Attitude Scale Barlett's Test Results
Kaiser-Meyer-Olkin Measure of Sampling Adequacy
y akla~ik ki kare puani
df
Sig.
assessment. Likert-type scale development processes aredone based on many premises about attitude scale to beprepared and nature of stimulants. Total of graduationdeveloped by Likert [16] many positive and negativeexpressions relating to the attitude to be measured withscaling approach are applied to the respondent.Respondents react as "I totally agree", "I agree", "I amindecisive," I don't agree", "I totally disagree". So each
respondent indicate the degree of agreeing/disagreeingfor the attitude item covered by each expression in thescale [17]. Expressions in the scale were scored as 1-5.Negative and positive expressIOns were formedconsecutively.
Stage of Factor Analysis: Scale practice results weresubject to Barlett's test in the research and value of KMOwas fOWld as.871.
As it can be lUlderstood from the table thatapproximate chi-square point is 6417, 421 and sincesignificance level is lower than.05, data were significantfor factor analysis.
0.871
6417.421
703
0.000
Table 2: Factor Analysis Result Of Attitude Scale For Computer-Aided Geography Lesson
item M,,," Std. Deviation Component CorrectedItem-TotaiCarelation
I think that computer-aided geography lesson will increase my success. 4.0971 1.02090 0.715 0.684
I forget subjects learning in computer-aided geography quickly 3.6571 0.88223 0.688 0.657
I wish that all lessons will be taught as computer-aided geography 4.0114 1.29094 0.764 0.733
I lose my attention in computer-aided geography lesson 3.7714 1.01951 0.734 0.702
It is entertaining to learn lessons in computer-aided geography 4.4171 0.86619 0.761 0.729
Computer-aided geography makes me sad 4.2457 0.78942 0.492 0.475
My wish to participate in group work increase in computer-aided geography 4.0800 1.10610 0.737 0.701
I prefer learning geography by books than computer 3.8400 1.18302 0.626 0.595
My wish to research increases in computer-aided geography 3.8800 1.11024 0.626 0.591
My learning is prevented in computer-aided geography since many things are
peIfonned in short time 3.8114 0.97314 0.771 0.744
I try to attend to computer-aided geography lessons as much as possible 3.9371 1.10980 0.468 0.434
I cannot get answers to my questions in computer-aided geography 3.8800 1.02967 0.677 0.654
Computer-aided geography lesson increases my creativity 3.8914 1.19611 0.522 0.493
I prefer my teacher teaching the lesson than computer-aided geography lesson 3.0971 1.28954 0.767 0.736
I learn via movable figures in computer-aided geography more easily 4.2571 0.98093 0.739 0.714
Use of computer in geography lesson is time-consuming activity 3.9371 0.99513 0.737 0.724
Computer-aided geography contributes to improving myself 3.9657 1.03888 0.753 0.727
I don't think computer-aided geography is interesting 3.4400 1.32855 0.515 0.499
I will be more active in computer-aided geography 3.6629 1.34572 0.486 0.458
The real images in computer-aided geography make me lll1derstand easier 4.1543 1.03622 0.573 0.553
793
beril
Cross-Out
approximately chi-square
beril
Cross-Out
beril
Cross-Out
beril
Text Box
approximately chi-square
beril
Text Box
25
WorldAppl. Sci. J, 7 (6): 791-796,2009
Table 2: Continued
Computer-aided geography makes me passive
My motivation increases in computer-aided geography
I think I am more interested in computer-aided geography lesson
I think computer-aided geography is not necessary
Computer-aided geography is difficult for me
My ability of problem solution improves in computer-aided geography
I have to memorize the subjects in computer-aided geography.
I learn more easily in computer-aided geography since there are many
colorful figures
I think my interest for geography lesson decreases with use of computer
I repeat the learnt things in computer-aided geography lesson
Use of computer in geography lessons makes me lazy
I am happy in computer-aided geography
I think computer-aided geography decreases social relations in the class
Computer-aided geography is productive for me
Use of computer in geography makes the lesson boring
The things I have learnt in computer-aided geography are pennanent
I prefer use of another teaching method in geography than
computer-aided teaching
I am not successful at computer-aided geography lesson
20-
1S-
10-
5-
3.4514 1.18743 0.336
3.9257 1.16962 0.772
3.7029 1.30108 0.728
3.4571 1.41305 0.458
3.8229 1.09205 0.528
3.5314 1.26758 0.701
3.4971 1.24971 0.481
3.8686 1.18413 0.619
3.6457 1.32186 0.535
3.4000 1.18419 0.612
3.56000 1.191734 0.617
4.0114 1.08802 0.758
3.7143 1.12371 0.630
3.9886 1.13961 0.760
3.7486 0.95574 0.657
3.8457 1.09028 0.782
3.5200 1.36390 0.715
3.7771 1.10980 0.752
0.320
0.742
0.705
0.446
0.519
0.683
0.458
0.599
0.512
0.579
0.596
0.740
0.612
0.735
0.642
0.756
0.692
0.741
I I I I I I I I I \ I I I I I I I I I I I I I I \ I I I I I I I I I I I I I1234567 8 91011121314151617181920212223242526272829303132333435363738
Component Number
Fig. 1: Scree Plot of Scale
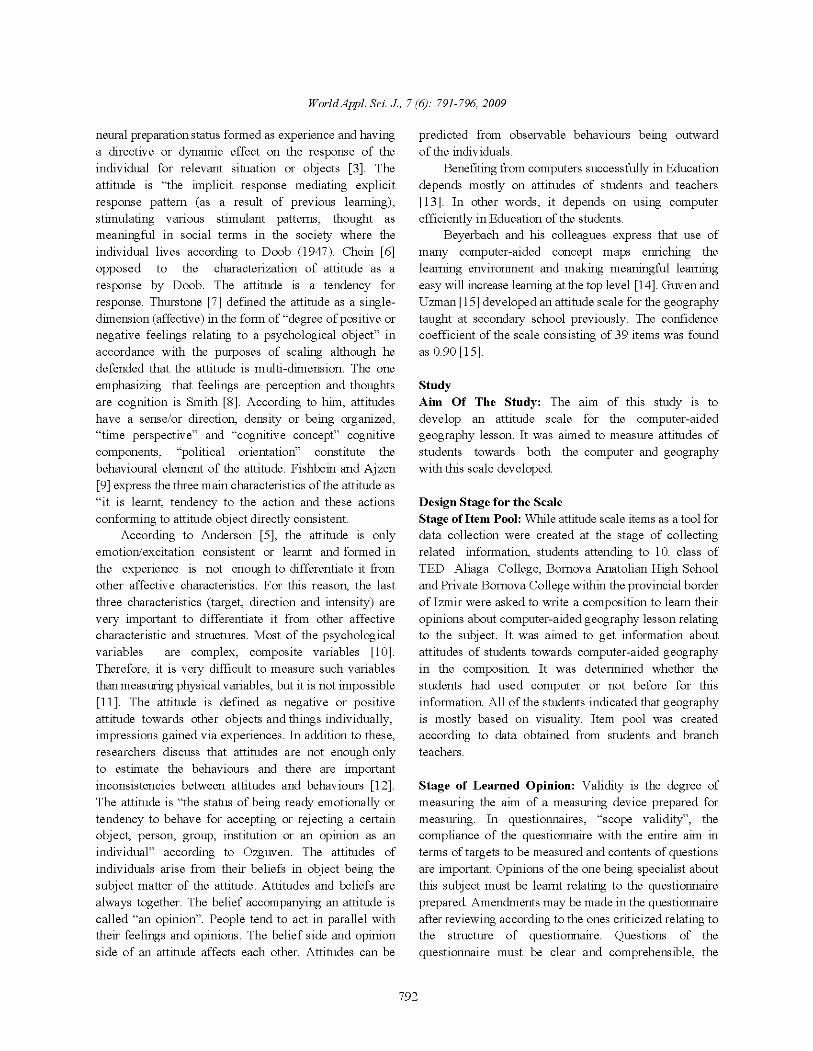
It was decided that the scale was single-dimensionsince total factor of item 1 was 16 in values in the totalvariance explanations in essential values and totalvariance percentage value is 43%. This dimension isrelating to learning. The number of positive and negativeexpressions is very close to each other in the scale. Thereare total 18 positive and 20 negative items in the scale.
As it can be seen from the table above (Table 2),factor loads of attitude items of scale are higher than. 30 in
794
total. The factor load, standard deviation and correcteditem correlation values are shown in 40-item table. Thistable was created by deleting item 20 and 26 from thetable. The factor load of item 22 among attitude items wasnot deleted from the scale not to deteriorate the integritysince it was close to.30. According to screen test of scale,as it can be seen in the figure above (Figure 1) items beingbased on right, values concentrating on 4 and 5 are theindicators that the scale is one-factor. The parallel
WorldAppl. Sci. J, 7 (6): 791-796,2009
30
20
10
~
'---~
~
~ V =F::I
1/V ~ -
L - "-n I'-,
"Mean =118,80
Std Dev. =9,956
90,00 100,00 110,00 120,00 130,00 140,00
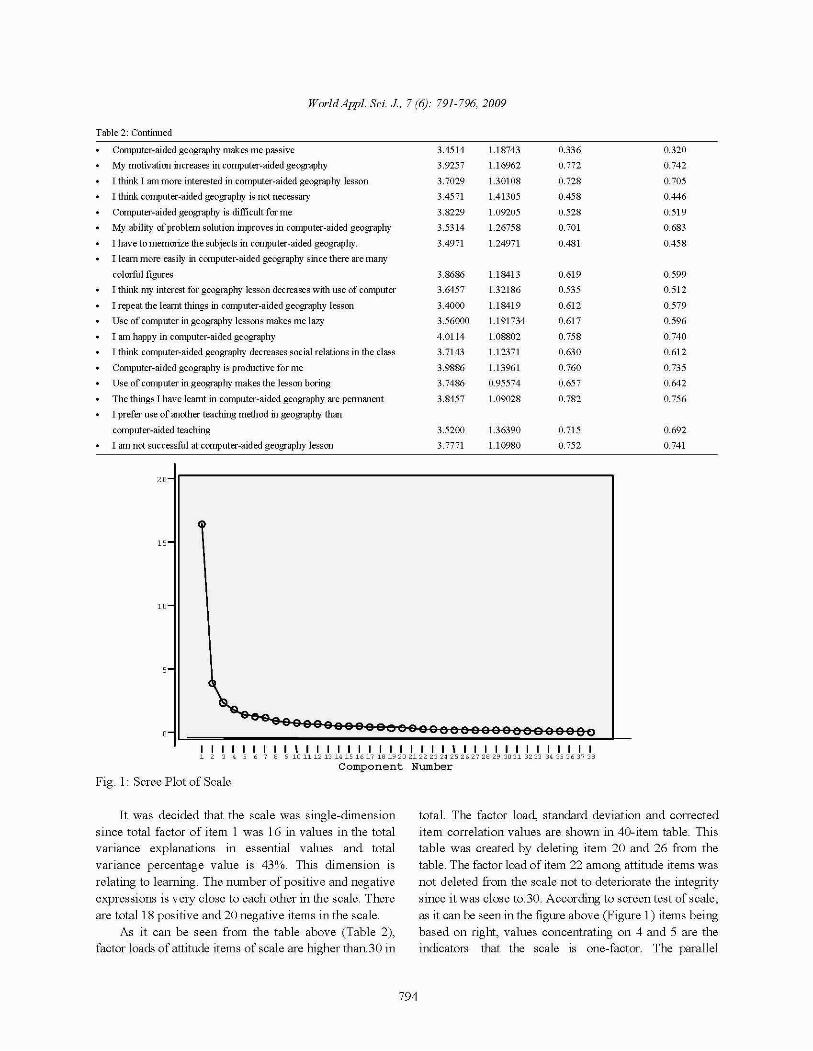
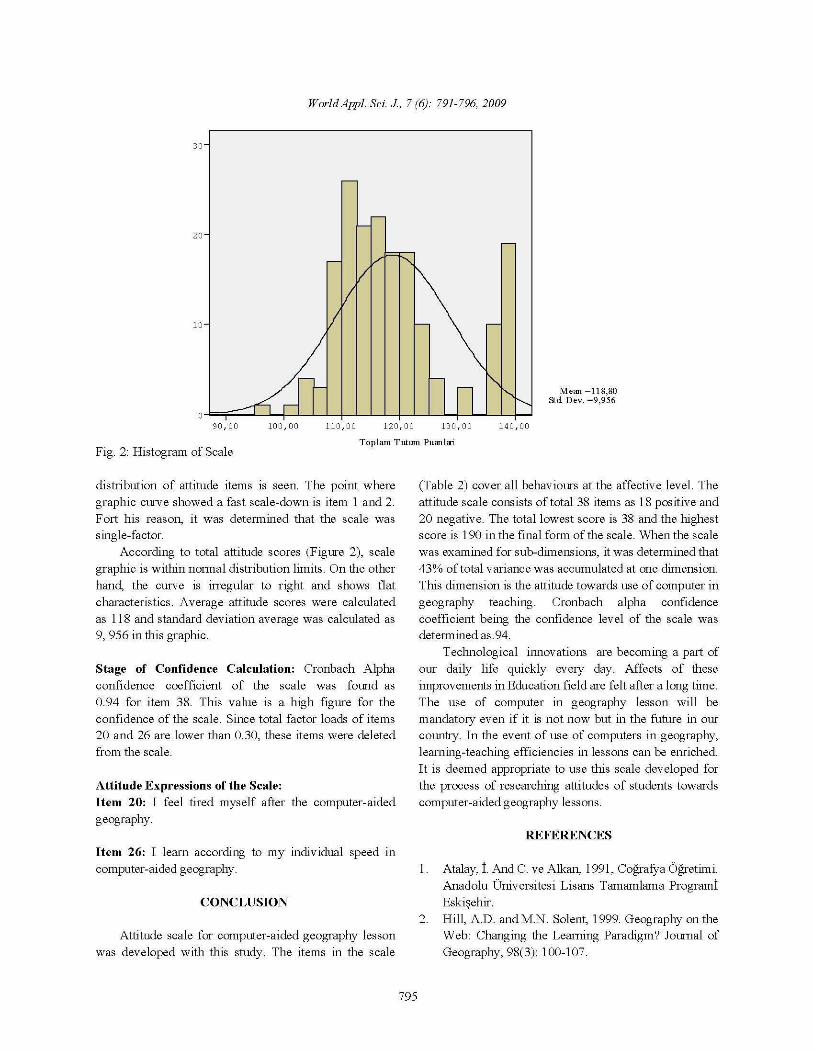
Fig. 2: Histogram of ScaleToplam Tutum Puanlm
distribution of attitude items is seen. The point wheregraphic curve showed a fast scale-down is item 1 and 2.Fort his reason, it was determined that the scale wassingle-factor.
According to total attitude scores (Figure 2), scalegraphic is within normal distribution limits. On the otherhand, the curve is irregular to right and shows flatcharacteristics. Average attitude scores were calculated
as 118 and standard deviation average was calculated as9,956 in this graphic.
Stage of Confidence Calculation: Cronbach Alphaconfidence coefficient of the scale was found as
0.94 for item 38. This value is a high figure for theconfidence of the scale. Since total factor loads of items20 and 26 are lower than 0.30, these items were deletedfrom the scale.
Attitude Expressions of the Scale:Item 20: I feel tired myself after the computer-aidedgeography.
Item 26: I learn according to my individual speed incomputer-aided geography.
CONCLUSION
Attitude scale for computer-aided geography lessonwas developed with this study. The items in the scale
795
(Table 2) cover all behaviours at the affective level. Theattitude scale consists of total 38 items as 18 positive and20 negative. The total lowest score is 38 and the highestscore is 190 in the final form of the scale. When the scalewas examined for sub-dimensions, it was determined that
43% oftotal variance was accumulated at one dimension.This dimension is the attitude towards use of computer ingeography teaching. Cronbach alpha confidencecoefficient being the confidence level of the scale wasdetermined as. 94.
Technological innovations are becoming a part ofour daily life quickly every day. Affects of theseimprovements in Education field are felt after a long time.The use of computer in geography lesson will bemandatory even if it is not now but in the future in ourCOlUltry. In the event of use of computers in geography,learning-teaching efficiencies in lessons can be enriched.It is deemed appropriate to use this scale developed forthe process of researching attitudes of students towardscomputer-aided geography lessons.
REFERENCES
1. Atalay, i. And C. ve Alkan, 1991, CografYa bgretirni.Anadolu Universitesi Lisans Tamamlama ProgramiEski~ehir.
2. Hill, AD. andM.N. Solen~ 1999. Geography on theWeb: Changing the Learning Paradigm? Journal ofGeography, 98(3): 100-107.
WorldAppl. Sci. J, 7 (6): 791-796,2009
3. Allport, G.W., 1935. Attitudes. In MurchisionCAred) a Handbook of Social Psychology ClarkDniversitey Pres Woreester, M.A.
4. Bogardus, B.S., 1967. Measuring Social Distances.In Fishbein, M., (Ed);: Attitude Theory andMeasurement. New York: John Wiley and SOllS, Inc.
5. Anderson, L.W., 1988. Attitude Measurement:Attitudes and their Measurement. In Keeves, IP.(Ed);: Educational Research Methodology andMeasurement An International Handbook. NewYark: Pergamon Press.
6. Chein, I, 1948. Behavior Theory and the Behavior ofAttitudes: Some Critical Comments. In Fishbein, M.(Ed); 1967: Attitude Theory and MeasurementNew York: John Wiley and Sons, Inc.
7. Thurstone, L.L., 1931. The Measurement of SocialAttitudes. In Fishbein, M. (Ed); Attitude Theory andMeasurement. New York: John Wiley and Sons, Inc.
8. Smith, M.B., 1947. The Persoml Setting of PublicOpinions: A Study of Attitudes Taward Russia.
9. Keeves, J.P., (ed);: Educational ResearchMethodology and Measurement An InternationalHandbook. New York: Pergamon Press.
10. Lord, M.F. and M.R Novick, 1968. StatisticalTheories afMental Test Scores. New Jersey:Addison-Wesley Pub. Co.
11. Guilford, J.P., 1954. Psychometrics Methods (2nd ed).New York: McGraw-Hill Book:
12. G.E. Palaigeorgiou, P.D. Siozos, NT Konstantakis andLA Tsoukalas, 2005. Computer Assisted Learning 21:330-342 Blackwell Publishing Ltd.Published Online:May 31 2009 9:35PM DOL 10.1111/j.13652729.2009.00318.x
13. Selwyn, N., 1999. Students' Attitudes TowardsComputers in Sixteen To Nineteen Education.Education And Infonnation Technologies 4: 129-141.1360-2357 (Print) 1573-7608 (Online).
14. Erdogan, Y, 2009. Paper Based and Computer BasedConcept Mappings The Effects On ComputerAchievement, Computer Anxiety and ComputerAttitude. British J. Edu. Techno!., 40(5): 821-836.
15. Gtrvemu B. And E. Uzman, 2006. OrtabgretirnCografYa Dersi Tutum Olyegi Geli~tinue <;;ali~masi
Ekirn 06 Cilt 14 N 0:2 Kastarnonu Egitirn Dergisi16. Likert, R, 1932. The Method of Constructing an
Attitude Scale. In Fishbein, M. (ed); 1967: AttitudeTheory and Measurement. New York: John Wileyand Sons, Inc.
17. Tezb~aran, A, 1997. Likert Tipi Olyek Gel~tinue
Klavuzu. Ankara TUrk Psikologlar Demegi Yayinlari18. Algina, J. and I.. Crocker, 1986. Introduction to
Classical and Modern Test Theory. New York: Holt,Rinehart and Winston.
796
19. Fishbein, M.(Ed), 1967: Attitude Theory andMeasurement. New York: John Wiley and Sons, Inc.British J. Edu. Techno!., 40(5): 821--J;36.
20. Andrich, D., 1988. Thurstone Scales. In Keeves, J.P.(Ed); 1988: Educational Research Methodology andMeasurement An International Handbook. NewYork: Pergamon Press.
21: Bagozzi, RP. and RE. Bunikrant, 1985. AttitudeOrganization and the Attitude-Behavior Relation: AReply to Dillon and Kumar. J. Personality and SocialPsycho!., 49(1): 47-57.
22. Bloom, B., 1967. Taxonomy of EducationalObjectives. HandbookI-II-III: The CogintiveAffective-Psychomotor Domain. New York: McKay.
23. Breckler, ST, 1984. Empirical Validation of Affect,Behavior and Cognition as Distinct Components ofAttitude. J. Personality and Social Psycho!.,47(6) 1191-1205.
24. Demirci, A., 2004. Cografi Bilgi Sistemlerinin ilk veOrtabgretim Cografya Derslerinde KullanihnasininOnemi ve Ybntemi Fiziki Cografya; Deprem VeVolkanlar Konusu ile ilgili CBS Tabanli Omek BirDers Uygulamasi. Cografi Bilgi Sistemleri Bili~im
Gtrnleri 6-9 Ekim 2004 istanbu!.25. Dillon, WR and A Kumar, 1985. Attitude
Organization and Attitude-Behavior Relation: ACritique of Bagozzi and Burnk:rant's Reanalysis ofFishbein and Ajzen. J. Personality and SocialPsycho!., 49(1): 33-46.
26. Edwards, LA, 1957. Techniques of Attitude ScaleConstruction. New York: Appleton-Century-Crofts.
27. Edwards, LA and KG Kenney, 1946. A Comparisonof the Thurstone and Likert Techniques of AttitudeScale Construction.
28. Guttman, 1.., 1944. A Basis for Scaling QualitativeData. In Fishbein, M (Ed); 1967: Attitude Theory andMeasurement. New York: John Wiley and Sons, Inc.
29. March, HW., 1988. Multitrait-Multirnethod Amlysis.In Keeves, J.P. (ed);: Educational ResearchMethodology and Measurement: An InternationalHandbook. New York: Pergamon Press.
30. Tezb~aran, A, 1995. Tipik Perfonnansin-Du~sal
Davrani~larin-Olytrhnesi. Basilmarni~ Ders Notlari.Ankara: HD. Egitirn Faktrltesi.
31: Turgut, M.F. and Y ve Baykul, 1992. OlyeklemeTekinkleri. Ankara: OSYM Yayinlari.
32. Winter, S., K Chudoba and B. Gutek, 1998. AttitudesToward Computers: "When Do They Predict ComputerUse? Information Management 34: 275-284.