The 1888 shoreline landslide and tsunami in Trondheimsfjorden, central Norway
17
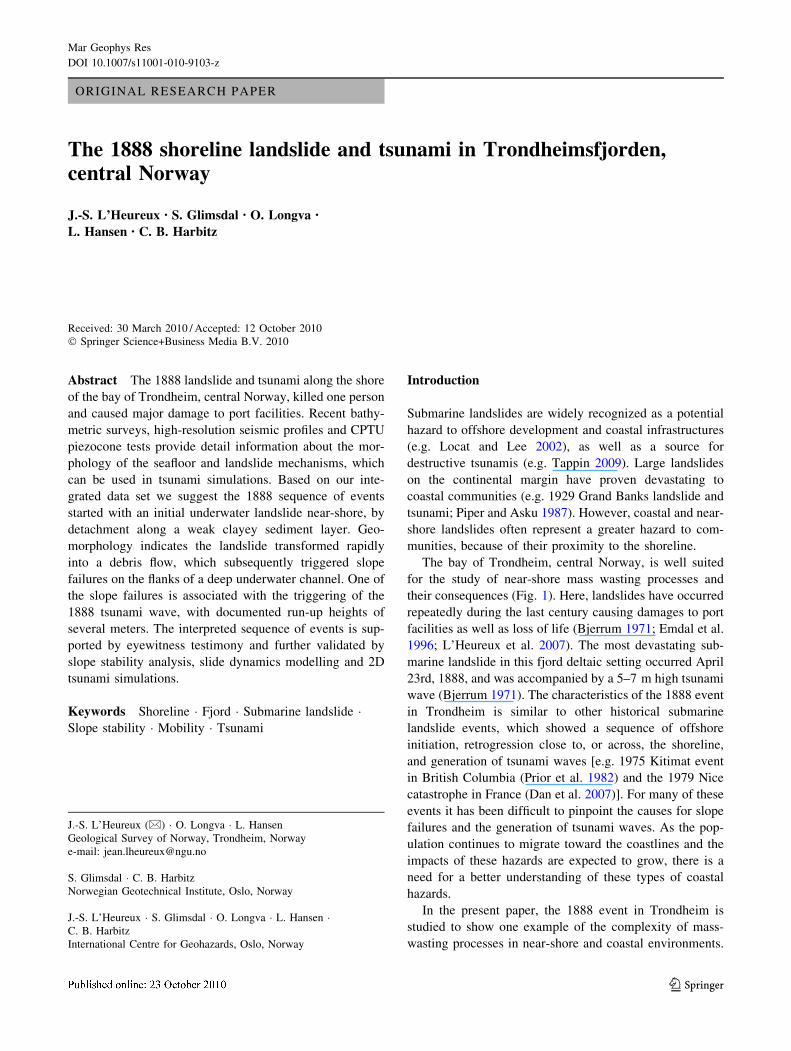
ORIGINAL RESEARCH PAPER The 1888 shoreline landslide and tsunami in Trondheimsfjorden, central Norway J.-S. L’Heureux • S. Glimsdal • O. Longva • L. Hansen • C. B. Harbitz Received: 30 March 2010 / Accepted: 12 October 2010 Ó Springer Science+Business Media B.V. 2010 Abstract The 1888 landslide and tsunami along the shore of the bay of Trondheim, central Norway, killed one person and caused major damage to port facilities. Recent bathy- metric surveys, high-resolution seismic profiles and CPTU piezocone tests provide detail information about the mor- phology of the seafloor and landslide mechanisms, which can be used in tsunami simulations. Based on our inte- grated data set we suggest the 1888 sequence of events started with an initial underwater landslide near-shore, by detachment along a weak clayey sediment layer. Geo- morphology indicates the landslide transformed rapidly into a debris flow, which subsequently triggered slope failures on the flanks of a deep underwater channel. One of the slope failures is associated with the triggering of the 1888 tsunami wave, with documented run-up heights of several meters. The interpreted sequence of events is sup- ported by eyewitness testimony and further validated by slope stability analysis, slide dynamics modelling and 2D tsunami simulations. Keywords Shoreline Fjord Submarine landslide Slope stability Mobility Tsunami Introduction Submarine landslides are widely recognized as a potential hazard to offshore development and coastal infrastructures (e.g. Locat and Lee 2002), as well as a source for destructive tsunamis (e.g. Tappin 2009). Large landslides on the continental margin have proven devastating to coastal communities (e.g. 1929 Grand Banks landslide and tsunami; Piper and Asku 1987). However, coastal and near- shore landslides often represent a greater hazard to com- munities, because of their proximity to the shoreline. The bay of Trondheim, central Norway, is well suited for the study of near-shore mass wasting processes and their consequences (Fig. 1). Here, landslides have occurred repeatedly during the last century causing damages to port facilities as well as loss of life (Bjerrum 1971; Emdal et al. 1996; L’Heureux et al. 2007). The most devastating sub- marine landslide in this fjord deltaic setting occurred April 23rd, 1888, and was accompanied by a 5–7 m high tsunami wave (Bjerrum 1971). The characteristics of the 1888 event in Trondheim is similar to other historical submarine landslide events, which showed a sequence of offshore initiation, retrogression close to, or across, the shoreline, and generation of tsunami waves [e.g. 1975 Kitimat event in British Columbia (Prior et al. 1982) and the 1979 Nice catastrophe in France (Dan et al. 2007)]. For many of these events it has been difficult to pinpoint the causes for slope failures and the generation of tsunami waves. As the pop- ulation continues to migrate toward the coastlines and the impacts of these hazards are expected to grow, there is a need for a better understanding of these types of coastal hazards. In the present paper, the 1888 event in Trondheim is studied to show one example of the complexity of mass- wasting processes in near-shore and coastal environments. J.-S. L’Heureux (&) O. Longva L. Hansen Geological Survey of Norway, Trondheim, Norway e-mail: [email protected] S. Glimsdal C. B. Harbitz Norwegian Geotechnical Institute, Oslo, Norway J.-S. L’Heureux S. Glimsdal O. Longva L. Hansen C. B. Harbitz International Centre for Geohazards, Oslo, Norway 123 Mar Geophys Res DOI 10.1007/s11001-010-9103-z
Transcript of The 1888 shoreline landslide and tsunami in Trondheimsfjorden, central Norway
ORIGINAL RESEARCH PAPER
The 1888 shoreline landslide and tsunami in Trondheimsfjorden,central Norway
J.-S. L’Heureux • S. Glimsdal • O. Longva •
L. Hansen • C. B. Harbitz
Received: 30 March 2010 / Accepted: 12 October 2010
� Springer Science+Business Media B.V. 2010
Abstract The 1888 landslide and tsunami along the shore
of the bay of Trondheim, central Norway, killed one person
and caused major damage to port facilities. Recent bathy-
metric surveys, high-resolution seismic profiles and CPTU
piezocone tests provide detail information about the mor-
phology of the seafloor and landslide mechanisms, which
can be used in tsunami simulations. Based on our inte-
grated data set we suggest the 1888 sequence of events
started with an initial underwater landslide near-shore, by
detachment along a weak clayey sediment layer. Geo-
morphology indicates the landslide transformed rapidly
into a debris flow, which subsequently triggered slope
failures on the flanks of a deep underwater channel. One of
the slope failures is associated with the triggering of the
1888 tsunami wave, with documented run-up heights of
several meters. The interpreted sequence of events is sup-
ported by eyewitness testimony and further validated by
slope stability analysis, slide dynamics modelling and 2D
tsunami simulations.
Keywords Shoreline � Fjord � Submarine landslide �Slope stability � Mobility � Tsunami
Introduction
Submarine landslides are widely recognized as a potential
hazard to offshore development and coastal infrastructures
(e.g. Locat and Lee 2002), as well as a source for
destructive tsunamis (e.g. Tappin 2009). Large landslides
on the continental margin have proven devastating to
coastal communities (e.g. 1929 Grand Banks landslide and
tsunami; Piper and Asku 1987). However, coastal and near-
shore landslides often represent a greater hazard to com-
munities, because of their proximity to the shoreline.
The bay of Trondheim, central Norway, is well suited
for the study of near-shore mass wasting processes and
their consequences (Fig. 1). Here, landslides have occurred
repeatedly during the last century causing damages to port
facilities as well as loss of life (Bjerrum 1971; Emdal et al.
1996; L’Heureux et al. 2007). The most devastating sub-
marine landslide in this fjord deltaic setting occurred April
23rd, 1888, and was accompanied by a 5–7 m high tsunami
wave (Bjerrum 1971). The characteristics of the 1888 event
in Trondheim is similar to other historical submarine
landslide events, which showed a sequence of offshore
initiation, retrogression close to, or across, the shoreline,
and generation of tsunami waves [e.g. 1975 Kitimat event
in British Columbia (Prior et al. 1982) and the 1979 Nice
catastrophe in France (Dan et al. 2007)]. For many of these
events it has been difficult to pinpoint the causes for slope
failures and the generation of tsunami waves. As the pop-
ulation continues to migrate toward the coastlines and the
impacts of these hazards are expected to grow, there is a
need for a better understanding of these types of coastal
hazards.
In the present paper, the 1888 event in Trondheim is
studied to show one example of the complexity of mass-
wasting processes in near-shore and coastal environments.
J.-S. L’Heureux (&) � O. Longva � L. Hansen
Geological Survey of Norway, Trondheim, Norway
e-mail: [email protected]
S. Glimsdal � C. B. Harbitz
Norwegian Geotechnical Institute, Oslo, Norway
J.-S. L’Heureux � S. Glimsdal � O. Longva � L. Hansen �C. B. Harbitz
International Centre for Geohazards, Oslo, Norway
123
Mar Geophys Res
DOI 10.1007/s11001-010-9103-z

The study is based on a set of multibeam bathymetric data,
high-resolution seismic data, cores and in situ piezocone
tests. The aim of this study is to reconstruct and discuss the
sequence of events which led to the 1888 landslide and
tsunami in Trondheim. The evaluation includes a review of
data, analysis of the seafloor morphology, slope stability
analyses and tsunami modelling.
Setting
Bedrock around Trondheim is dominated by Precambrian-
Silurian westward dipping low-grade metamorphic, vol-
canic rocks, especially green schist and tuff (Wolff 1976).
During repeated glaciations, bedrock was eroded along
weakness zones and shaped the present landscape of val-
leys and fjords, including the present valley at Trondheim.
Bedrock is exposed locally on land and at sea bed in the
study area (L’Heureux et al. 2009a). Along the shoreline of
Trondheim, bedrock is covered by a 125-m thick succes-
sion consisting of glacio-marine deposits, prodelta sedi-
ments, steeply dipping delta foresets, and gravel beach
(L’Heureux et al. 2010; Fig. 2). The glacio-marine and
marine sediments were deposited during the end of the last
glacial period prior to *10,000 14C BP and the early
Holocene period, respectively (Reite 1995; Lysa et al.
2007). The area was thereafter subjected to glacio-isostatic
rebound, which caused rapid fall of relative sea-level and a
Fig. 1 Location of the study area with bathymetric data from the embayment of Trondheim, central Norway (UTM zone 32N)
Mar Geophys Res
123

continuous, northwards progradation of the river mouth
delta during the Holocene (Reite et al. 1999). Delta-derived
and failure-generated sediment gravity flows were espe-
cially active outside the river mouth during the Mid- to
Late-Holocene, and this promoted the incision of the
Nidelva channel as shown in Fig. 1 (L’Heureux et al.
2009a). Since 3,000–2,000 cal. years. BP, the submarine
channel has not been linked to any major fluvial source
(L’Heureux et al. 2009a).
Harbour development and land reclamation along the
Nidelva river delta started in 1875 through filling of large
near-shore areas. Since then at least three major landslide
events have taken place along the shoreline of Trondheim
bay (Skaven-Haug 1955; Emdal et al. 1996; L’Heureux
et al. 2007). The 1888 landslide occurred in the central part
of the bay at Brattøra, whereas the landslides in 1950 and
1990 occurred in the west at Ilsvika and in the east of the
bay at Lade, respectively (Fig. 1). Earlier work by Bjerrum
(1971) and Emdal et al. (1996) suggested that landslides
along the shoreline of the bay were the result of a collapse
and liquefaction of loose sandy material. A recent study by
L’Heureux et al. (2010) showed, however, that landslides
in the bay tend to occur along distinct planes associated
with weak, laminated, clay-rich beds in the delta front and
prodelta sequences.
Even though it has been difficult to pinpoint the causes
for landslide in the near-shore area of Trondheim, it is
generally agreed that these result from a combination of
human activities (e.g. placement of fill along the shore and
blasting) and natural factors (e.g. erosion, high sedimen-
tation rates and unfavourable groundwater conditions)
(Bjerrum 1971; Emdal et al. 1996; L’Heureux et al. 2007,
2010). In the present study area, no historical earthquakes
have been registered and the area is regarded as having one
of Scandinavia’s lowest seismicity (Dehls et al. 2000). The
seismicity of Norway is low to intermediate in intensity
and is related to both tectonics and post-glacial rebound
(Golke et al. 1996; Pascal and Gabrielsen 2001).
The 1888 catastrophe in the bay of Trondheim
From the testimony of 20 eye witnesses, Skaven-Haug
(1955) concluded the 1888 event started with the appear-
ance of a flood wave in the fjord approximately halfway
between the island of Munkholmen and Ilsvika (Fig. 1).
Records indicate that the wave propagated towards the
shoreline and first struck land at Ilsvika. Some minutes
later another wave climbed over a 5–7 m high embankment
fill at Brattøra and, just as it receded, a 170 m long portion
of the railway station slumped into the fjord (Fig. 3). Three
railway tracks were washed away and one man perished in
the event. In the following hours minor slope failures took
place east of the main scar. The incident occurred during a
spring low tide and no construction activity had taken place
at Brattøra since 1880 (Skaven-Haug 1955; Bjerrum 1971).
Initial work by Skaven-Haug (1955) and Bjerrum (1971)
suggested that the 1888 landslide at Brattøra was initiated
by a landslide at a great depth in the fjord. However, no
thorough explanation could be given for the occurrence of
such a landslide. During the winter of 1888 snow accu-
mulation twice above the normal values were recorded in
Trondheim (data from the Norwegian Meteorological
Institute 2009). These data have previously not been con-
sidered during evaluation of the 1888 event.
Data
Bathymetric and geophysical investigations
A set of bathymetric data from the bay of Trondheim was
acquired in 2009 by means of 250 kHz interferometric
sonar system (GeoAcoustics) mounted onboard of the R/V
Seisma. A stabilizer system (TSS DM) was used to com-
pensate and adjust for the pitch and roll of the vessel. This
also allowed heel and trim adjustment of the ship in real-
time. Sound velocity in the water adjacent to the
Fig. 2 Schematic geological
cross-section of the Nidelva
delta, from L’Heureux et al.
(2010)
Mar Geophys Res
123

transmitters/receivers was measured with help of a Valport
650 Sound Velocity Profiler (SVP). These measurements
were performed systematically to obtain optimal velocity
profiles for calculation of water depths. During the cruise,
positioning was performed by means of differential GPS
positioning system with an accuracy of ± 1 meter. Tidal
variations were measured during surveying and the tidal
correction was merged into the survey file during pro-
cessing. In this study the bathymetric data are presented at
a grid spacing of 1 m.
In the period 2003–2009, a dense network of high-fre-
quency (3.5 kHz) seismic data was acquired using a para-
metric sub-bottom profiler (TOPAS system). Processing of
the data included the application of a band-pass filter and
corrections for sea-level variations. The range of resolution
for the parametric sub-bottom profiler is typically of 10 cm
or better (Kongsberg Defense and Aerospace 2004). Two-
way travel time was converted to water depth and sediment
thickness using a constant velocity of 1,450 ms-1.
Core data and insitu geotechnical testing
Thirty gravity cores, 47 niemestoe cores and one Calypso
core (14.5 m) have been collected from the seafloor of the
embayment since 2003. The location of the cores used in
this study is shown in Fig. 4. In the laboratory the cores
were X-rayed and split to describe lithology and sedi-
mentary structures. A wide range of geotechnical tests were
performed, including: grain size analysis, water content,
liquid and plastic limits, undrained shear strength (su) using
the Swedish Fall cone, and three undrained triaxial tests
(CIU tests). Other results from these cores are presented in
L’Heureux et al. (2009a, 2010) and Hansen et al. (2010).
A Remotely Operated Vehicle (ROV) was also used in
2008 for precise sampling and observation of the seafloor
at a few places in the study area.
Data in this study is complemented by in situ piezocone
tests (CPTU) carried out by consulting geo-technicians
between 2003 and 2008, in relation with construction
works along the shore of Trondheim. The CPTU tests allow
for continuous measurement of tip resistance (qc), sleeve
friction (fs) and pore pressure behind the cone (u2) during
penetration. This information can be used for lithological
description and for determination of shear strength and soil
stiffness (Lunne et al. 1997). Moreover, as the pore-water
pressure around a penetrating cone influences the measured
tip resistance and the sleeve friction, it is generally rec-
ommended for qc values to be reported as total resistance qt
whenever possible (Campanella et al. 1983). This correc-
tion, as shown in Eq. 1, is especially important in soft clays
and silts where qc is generally low and the excess pore
pressure is high:
qt ¼ qc þ u2ð1� aÞ ð1Þ
where a is the cone area ratio (Robertson 1990). In this
study we make use of CPTU data to estimate the undrained
shear strength of soft and normally consolidated sediments.
Reliable shear strength parameters can be derived from the
in situ CPTU tests using an empirical relationship of the
form:
su ¼ðqc � rv0Þ
Nkð2Þ
where Nk is an empirical cone factor (assumed to be equal
to 15 for normally consolidated clay) and rv0 is the total in
situ vertical stress (Lunne et al. 1997). In the case where
coarser sediments are present (e.g. silt, sand and gravel)
CPTU data can also be used to derive effective strength
parameters, such as the angle of friction (u0) and the
cohesion intercept (c0), by using charts proposed by
Senneset et al. (1988).
Morphology
Water depth in the central part of the bay of Trondheim is
40–50 m and acts as a saddle, dividing the bay into an
eastern and western part (Fig. 1). The present-day mouth of
the Nidelva River is located in the eastern part of the
embayment. To the west, the Nidelva submarine channel
can be followed from near the shoreline north of Brattøra
and down to a depth of 450 m in the central part of the
fjord basin (Fig. 1). The width of the channel varies from
100 to 200 m and the slope of the channel floor is between
4 and 6�. The shallowest reach of the channel is charac-
terized by a 500-m long linear segment followed by an
abrupt change in direction (*90� bend) towards the west.
The outer bend is bordered by a bedrock high at the
Munkholmen Island. Bedrock outcrops are also observed in
Fig. 3 Scene at Brattøra, Trondheim, following the 1888 landslide
and tsunami. (Photo: Courtesy of Hifling Rasmussen)
Mar Geophys Res
123

the submarine channel (Fig. 4). Observation by means of
an ROV showed rectangular shaped, rock blocks ([1 m in
diameter) at different emplacement in the submarine
channel (see ‘‘B’’, Fig. 4).
Detailed swath bathymetry imaging shows numerous
slide scars in the western part of the bay (Fig. 4). Some of
the observed scars are distinct whereas others are more
vague and draped by sediments. The highest density of
scars is observed on the steeper sides of the channel (i.e.
northern/eastern flank), especially in the *90� bend. Larger
scars are also observed on the southern/western flank
(e.g. W landslide, Fig. 4), at the head of the channel (i.e.
Brattøra landslide) and along the shore outside the channel
(e.g. Pir-landslide).
Brattøra landslide
The seafloor at the head of the Nidelva channel, north of
Brattøra, exhibits complex morphology with several scars
with back walls ranging from 3 to 10 m in height (see 1, 2
and 3, Fig. 4). Two distinct seafloor morphologies, one
smooth and one rough, are seen within the various scars.
The smooth seafloor corresponds to evacuated landslide
scar devoid of debris (e.g. scar 1, Fig. 4). In contrast, the
rougher seafloor represents a cover of landslide debris up to
a few meters thick (e.g. scars 2, 3, Fig. 4) and displays
undulations interpreted as sediment waves with some
debris (Fig. 4). Between the shore-parallel escarpments 2
and 3 at Brattøra, is an unfailed slope segment slightly
Fig. 4 a Identification of the main morphological signatures from the
seafloor outside Brattøra and along the Nidelva channel. The position
of cores and CPTU tests used in this study are shown. b Close up view
of the seafloor morphology showing evacuated slide scars at different
stratigraphic levels, pockmarks upslope of the escarpments and a deep
scour feature. c Topographic profile across the W-landslide showing
the 8-m high head scarp and the steep slope section (erosion) at the
channel flank. (R: ridge of un-failed slope)
Mar Geophys Res
123

eroded at the surface and which dips at an angle of 5–6�(see ‘‘R’’ in Figs. 4 and 5a). A high resolution seismic
profile through the un-failed ridge shows parallel-bedded
reflections, one of which corresponds to the level of the
evacuated slide scar 2 (Fig. 5b). Pockmarks are also pres-
ent at some locations upslope of the scars whereas an
erosive element, interpreted as a scour, is observed north of
scar 2 (Fig. 4b).
The smooth planar surfaces inside the evacuated slide
scars outside Brattøra, combined with the presence paral-
lel-bedded sediments, suggests the influence of weaker
beds on the mechanism of failure and on the location of
sliding. Internal scars and evacuated surfaces at different
levels indicate the presence of weak layers at different
stratigraphic levels (Fig. 4b). The seafloor morphology is
also indicative of retrogressive landslide behaviour since
the sediments that originated upslope near the shoreline
cover the base of the scars downslope. The sediment waves
and scouring observed in front of the near-shore escarp-
ments are indicative of high energy sediment flow fun-
nelled into the Nidelva channel following failure.
Pir-landslide
Seaward of the pier at the outer harbor basin, bathymetric
data displays a 1- to 3-m high landslide escarpment which
gradually disappears in the steeper upslope section at the
shoreline (Fig. 4). The seafloor slope angle near the
shoreline reaches values of 25�, but rapidly decreases to
about 7–10� at less than 75 m to the north. Blocks and slide
debris occur in front and at the sides of the slide scar, with
the largest block having a diameter of 35 m and a height of
1.5 m (Fig. 4). Some of the blocks originating upslope have
travelled over the lowermost section of the scar downslope.
Fig. 5 a 3D shaded relief image of the Brattøra landslide with view angle towards the shoreline (south). b High resolution seismic profile
through the intact sediment ridge (R) shown in (a). Results from CPTU-1 and CPTU-2 are shown in (c) and (d), respectively
Mar Geophys Res
123

Most of the debris and blocks have however been trans-
ported into deeper water into the Nidelva channel where an
erosional track is observed (Fig. 4). Such erosion by the
sediment gravity flow following the Pir-landslide most
likely affected the stability of slopes downstream.
The retrogressive process during the Pir-landslide
gradually ceased as it reached coarser and stronger material
close to the shoreline (c.f. landfills, coarse sand and grav-
els, Fig. 2). Because of this, and because it did not cause
any damage to coastal infrastructure, the Pir-landslide
never was noticed by the harbor authorities. It can be
considered that this landslide is at least 8 years old since it
is present on bathymetric data collected in 2001 (Bjerkli,
personal communication). The triggering of this landslide
could also be attributed to fillings and/or to the driving of
piles during the construction of the pier outside the outer
harbor basin in 1994. This is because the main slide scar
passes through the piling area (Fig. 4).
W-landslide
The largest slide scar along the flanks of the Nidelva
channel is situated 2 km off-shore at a water depth of
80–160 m and is named the W-landslide (Fig. 4). The
head scarp varies between 5 and 10 m in height and
border a smooth planar surface dipping at 5 and 6�. At
one location, landslide debris that originated upslope in
proximity of the head scarp drapes the sliding surface
downslope, indicating retrogressive landslide mechanism
(Fig. 4). At the base of the W-landslide, along the flank
of the Nidelva channel, steep slope gradients are
observed (25–35�) (Fig. 4). This indicates that toe erosion
and undercutting of the slope may have been important
for triggering the landslide. Data from high-resolution
seismic profiles show several, parallel reflections, upslope
of the W-landslide escarpment (Fig. 6a). Some of these
marked reflections correlate well to the smooth and
Fig. 6 a Part of a high-resolution seismic line through the
W-landslide which shows a distinct high amplitude reflection (weak
layer) correlating to the landslide failure surface. The location of the
seismic line corresponds nearly to profile C–C’ in Fig. 4. b Lithology,
undrained shear strength and water content from piston core GS08
(see location in Fig. 4a). c Results from three triaxial tests on
laminated clay-rich beds from core GS08
Mar Geophys Res
123
planar slide surface and testify to weaker layers involved
in the sliding process.
The total volume of the W-landslide can be estimated to
*1.45 9 106 m3 based on the surface affected by the
landslide (18,125 m2) and using an average height of
removed material (8 m). The location of the W-landslide
corresponds well with the location of the initial flood wave
that was witnessed in the fjord in 1888 (Skaven-Haug 1955).
Geological and geotechnical properties
Brattøra site
Two in situ piezocone tests (CPTU-1 and CPTU-2) were
performed on the seabed off Brattøra, on the delta foreslope,
through the intact sediment ridge (Fig. 5). The results show
loose to medium dense sand and silty sand layers interbed-
ded with softer, clayey beds at a depth of 6–8 m in CPTU-1
and at a depth of 12–15 m in CPTU-2. The integration of
high-resolution seismic data and CPTU data shows that the
coarser deltaic sediments are thinning northwards towards
the fjord (Fig. 5b). The depth of the softer clayey beds
(c. 6 m) correlates to a specific seismic unit on the same
figure. This zone corresponds to the level of the sliding plane
of scar 2 at Brattøra and is interpreted as a weak layer
(Fig. 5b). Shear strength parameters derived from the in situ
CPTU tests, and using Eqs. 1 and 2, show that su is lowest in
the clayey layer found at a depth of 6 m in CPTU-1
(Fig. 5c). The undrained shear strength ratio (su/r0v0) at this
depth is close to 0.3 and is representative of soft normally
consolidated material. Results from CPTU-2 show a higher
su for a similar clayey layer, likely because of an increase
in confining stresses (burial depth) (see CPTU-2, Fig. 5d). In
general, the sensitivity of the thin clayey layers
varies from 5 to 7 onshore at Brattøra (Statens Vegvesen
2004a, b).
Four wells were drilled onshore at Brattøra (4–5 m.a.s.l.)
in 2008 for monitoring the groundwater levels prior to road
construction (Statens Vegvesen 2008). These levels were
recorded for a period of two months between the end of
February 2008 and the end of April 2008. Readings were
taken two times a day in the deltaic sand deposits immedi-
ately below and above a 4 meter-thick soft clayey bed. The
groundwater level measured above the clayey layer was
hydrostatic and varied from 1.10 to 1.80 m.a.s.l. Records
below the clayey layer at a depth of 10 m indicated a higher
groundwater level, varying between 2.30 and 2.54 m.a.s.l.
This corresponds to an excess pore-pressure ratio (ru)
varying from 0.35 to 0.40 below the clayey layer. Such high
excess pore-pressures indicate that the groundwater condi-
tions and seepage from land to fjord may affect the stability
of near-shore slopes at Brattøra.
W-landslide site
Core GS08, collected upslope of the W-landslide, displays
2 m of silty sand covering brownish silts and laminated,
light-grey, clay-rich beds (Fig. 6b). Similar clay-rich beds
were collected from cores N-03 and B-13, inside the W-
landslide scar (Fig. 6a). The centimetre to meter thick
clayey beds are clearly marked by an increase in water
content (equivalent to or higher than the liquid limit) and a
lowering in undrained shear strength (su). For these beds,
su/r0v0 varies between 0.1 and 0.3 with an average of 0.2,
being representative for soft normally consolidated mate-
rial. L’Heureux et al. (2010) showed that the sensitivity of
these soft, clayey beds varies between 3 and 17 in the fjord.
Three triaxial tests (i.e. T1, T2 and T3) were performed
on clay-rich samples from GS08 and the results are pre-
sented in Fig. 6c. The samples were consolidated close to
their assumed in situ effective stresses (T1 = 50 kPa,
T2 = 60 kPa and T3 = 80 kPa). The tests provide a failure
envelope indicating an effective friction angle (u0) of 33�and a cohesion intercept (c0) around 6 kPa.
Several cores have been collected from the W-landslide
area (Fig. 4a). These cores have previously been used to
show that the failure plane of the W-landslide corresponds
to a clay-rich bed similar to that collected in core GS08 at a
depth interval of 5.0–7.3 m (L’Heureux et al. 2009a, 2010).
The cores show 3–13 cm of bioturbated sediments on top
of the slide plane and/or other sediments interpreted as
debris. Bioturbated sediments in cores nearby show an
accumulation rate of 1.7–2.0 mm/year (L’Heureux et al.
2009a; Hansen et al. 2010). Applying this accumulation
rate for the top sediments inside the slide scar does not give
an accurate age estimate but confirms that the W-landslide
is relatively recent and could fit well with the 1888 land-
slide and tsunami event.
Stability analysis
Inputs and considerations
Slope stability analyses of the Brattøra and W- landslides
are presented in this section in order to discuss the potential
failure scenarios and to constrain the sequence of events
which led to the 1888 catastrophe in the bay of Trondheim.
The commercially available slope stability package Slope/
W was used to perform the 2D limit equilibrium back-
analyses (GEO-SLOPE 2008). Since no earthquake or
vibrations were recorded prior to the 1888 event, the slopes
are modelled under the effect of gravitational stresses only
(i.e. static forces). The output factor of safety (FoS; i.e. the
ratio between the average resisting shear strength of the
soil and the average shear stress mobilized along a
Mar Geophys Res
123

potential failure surface) is calculated using the General
Limit Equilibrium (GLE) method (Morgenstern and Price
1965; Fredlund and Krahn 1977).
The analysis of both landslides requires morpho-strati-
graphic models (i.e. pre-landslide geometry) and estimates
of geotechnical properties of the sediments. For the Brat-
tøra site, a four-unit geological-geotechnical model is used
to evaluate the stability of slopes prior to 1888 (Fig. 7a). A
series of models with different slope angles (i.e. 7�, 10�,
12� and 15�) were created in order to evaluate the effect of
slope geometry. These gradients are comparable to the
present shoreline slopes and also similar to pre-landslide
bathymetrical observations (Skaven-Haug 1955). The sed-
iment is subjected to both drained and undrained loading
conditions. This allows for the evaluation of different
triggering mechanisms (e.g. placement of fill, rapid change
in slope geometry, and/or tidal drawdown). In the
undrained analysis, the weaker clayey bed (unit 3) is sub-
jected to undrained loading with the su profile taken
directly from CPTU-1 (Table 1). Long term strength
reduction in the weak clayey bed (unit 3) is also considered
as this layer has shown to be sensitive in core nearby
(sensitivity ranging from 5 to 7). This was performed by
dividing the undrained shear strength directly by the
Fig. 7 Simplified model used for slope stability analysis with SLOPE/W for a the Brattøra landslide and b the W-landslide
Mar Geophys Res
123

sensitivity (St) of the clayey beds. In all analyses (i.e.
drained and undrained analysis), the coarser and more
permeable units 1, 2 and 4 are given drained strength
parameters derived from CPTU-1 and CPTU-2 (Table 1).
Moreover, data from groundwater monitoring on-shore
near Brattøra shows that the excess pore pressure condi-
tions may be significant within and immediately below the
weaker clayey beds. This is considered in the drained
stability analyses of the Brattøra slope. The role of pore
pressure (u) is evaluated here using the pore pressure ratio
(ru) calculated using the unit weight of the sediments (c):
ru ¼ u=ch ð3Þ
where h is the thickness of the material above the potential
failure plane.
For the back-analysis of the W-landslide, sedimento-
logical and geotechnical data obtained from core GS08 are
assumed to be representative of the mobilized sediments
during the W-landslide (Table 1). The resulting geological-
geotechnical model uses 3 units as shown in Fig. 7b. As
seen from seafloor morphology (Fig. 4a), rapid erosion
along the channel flank may have triggered the W-land-
slide. Therefore, the pre-failure geometry varies the lower
slope section near the channel flank from 20� to 35�, in
order to study the effect of toe erosion on the stability of
the slope (Fig. 7b). In the landslide scar area, the slope
gradient is assumed to be constant and parallel to layers in
the stratigraphy, at an angle of 6� (Fig. 7b). This assump-
tion is justified by seismic data that show nearly uniform
sediment thicknesses in undisturbed sections draping the
Table 1 Physical and strength parameters used during the stability analyses at the W- and Brattøra sites
Thickness (m) c (kN/m3) u0 (�) c0 (kPa) Su at the top
of layer (kPa)
DSu (kPa/m) Data from
Brattøra
Unit 1: Coarse sand and gravel 10 22.0 37 – – – CPTU-1 and CPTU-2
Unit 2: Loose silty sand 6–15 20 35 0 – –
Unit 3: Weak clayey bed 2 19 33a 6a 13,5 3
Unit 4: Loose silty sand [10 20 35 0 – –
W-landslide
Unit 1: Silty sand 5 20 35 0 – – Core GS08
Unit 2: Weak clayey bed 2 19 33a 6a 8,0 2
Unit 3: Clayey silt [10 19 35 2 21,0 4
a Mohr-Coulomb drained strength parameters obtained from triaxial tests on clayey samples from core GS08 (see Fig. 6c)
Fig. 8 Results from slope
stability analysis for the
Brattøra and W- slopes. Results
from undrained analyses are
presented with circles while the
results from drained analyses
are shown with squares. For the
Brattøra site, the effect of
changing the pore pressure ratio
(ru) on the factor of safety is
shown. Similarly, the effect of
long-term strength reduction
(due to sensitivity; St) in the
weak layer is shown. The
location of slip surfaces for the
Brattøra and W- slopes is shown
in Fig. 7
Mar Geophys Res
123

slope adjacent and upslope of the landslide (Fig. 6a).
Hydrostatic groundwater conditions are assumed in the
analysis of the W-landslide.
Results
For undrained loading conditions, the Brattøra slope is
modelled to be stable until a gradient of 15� is reached
(Fig. 8). For all undrained simulations the most critical
failure surface passes through the top of the weak clayey
bed (Fig. 7a). For the case where we consider a strength
reduction of 2 (i.e. St = 2), the slope is modelled to be
metastable (i.e. the factor of safety is below unity) if
steeper than 9� (Fig. 8). In addition, when using a sensi-
tivity of 5 (similar to that measured in cores nearby), all the
modelled slopes present factor of safety below unity
(Fig. 8). Alternatively, results from drained analysis show
that the shoreline slope is unstable when using slope
gradient greater than 12� and a pore pressure ratio similar
to that measured onshore at Brattøra (ru = 0.4) (Fig. 8).
The most critical failure surface in the drained analyses is
located at the interface between unit 3 and 4 (Fig. 7a), due
to high pore pressure at this location.
The W-slope is modelled for both drained and undrained
conditions. For the drained case (i.e. long-term situation
along the Nidelva channel), results show that the W-slope
is stable (FoS [ 1.2) for the range of modelled slope
geometries (Fig. 8). The most critical failure surface is
shallow and situated along the channel flank (Fig. 7b).
Such a failure mechanism does not agree with the observed
morphology of the W-landslide scar and is therefore
unlikely (Fig. 4a). On the other hand, the undrained slope
stability analysis simulates the short-term situation of a
slope. This may represent, for example, a sudden under-
cutting at the base of the slope along the submarine
channel. Results from the undrained analysis show that
Fig. 9 Conceptual sequence of
events in 4 stages. 1- Initial
shoreline landslide outside
Brattøra, 2- Undercutting of the
channel flank (at the blue star)
and triggering of the
W-landslide also causing the
tsunami wave, 3- Failure of the
railway station and embankment
fill along the shoreline of
Brattøra as the flood wave
receded from the shore, and
4- Slope failure to the east of
the main landslide some hours
following the event. Pictures
from ROV observations show
that during stages 3 and 4 large
rock blocks from the breakwater
structure located at Brattøra
were transported at least 2 km
offshore through the Nidelva
channel
Mar Geophys Res
123

failure occurs for channel flank slopes steeper than 30�(Fig. 8). Initial failure develops at the top of the weak clay-
rich bed where the undrained shear strength is lowest
(Fig. 7b). The geometry of this undrained failure surface
agrees well with the morphology of the W-landslide
(Fig. 4).
Discussion: the 1888 sequence of events
The results and observations presented above, combined
with witness testimonies, are used to decipher the causes
and mechanisms which led to the 1888 landslide and tsu-
nami. The sequence of events, as discussed below, is also
illustrated through 4 stages in Fig. 9.
At first, stability analysis performed on the near-shore
slopes seaward of Brattøra testify for metastable conditions
prior to 1888. A combination of steep slope angle and
unfavourable groundwater conditions, due to intense spring
snow melting and large tidal drawdown, may have been
sufficient to trigger an initial near-shore underwater land-
slide (Stage 1—Fig. 9). The failure-prone clayey beds play
an important role in this mechanism as their great lateral
extent, combined with their inherent low-permeability,
allows for the formation of artesian groundwater pressure
at different stratigraphic levels (due to the general land-
fjord groundwater flow). This is supported by measurement
of artesian pore pressure on-shore at Brattøra and further
evidenced by the presence of pockmarks on the seafloor.
Such pockmarks features are often associated to fluid
seepage processes (Hovland et al. 2002). In addition to the
groundwater forces, high deviatoric loads (from the harbor
extension and railway station constructed in 1880) may
have enhanced strain accumulation in the sensitive clayey
layers over time. Such a mechanism may have gradually
reduced the soil’s strength and the stability of the near-
shore slopes. As seen from the results of the stability back-
analyses presented in Fig. 8, only a small decrease in su in
the weaker clayey beds has a large effect on the stability of
the slope off Brattøra. A similar strength reduction mech-
anism has also recently been proposed for the 1979 Nice
airport slope failure (Dan et al. 2007).
As the underwater sediments started moving downslope,
unloading of the headwall and sidewalls subsequently
caused a retrogressive landslide mechanism seaward of
Brattøra. Retrogression continued upslope as long as
favourable soil conditions and layer orientation existed,
and as long as the morphology of the landslide area
allowed for the evacuation of debris. The retrogressive
process may have gradually ceased along the shore due to
higher undrained shear strength in the clayey beds (due to
greater burial depth) and to the presence of coarse littoral
deposits and man-fills (cf. Fig. 2). The mobility of these
materials is low and will tend to support the sidewalls. As
shown from the more recent Pir-landslide event, an initial
near-shore underwater landslide may have occurred outside
Brattøra in 1888 without being registered. This is also
similar to the 1990 landslide event which took place in the
western part of the bay (Fig. 1). In this event, an initial
underwater landslide ruptured cables on the fjord bed and
sections of the shoreline slumped into the fjord only several
hours following the initial landslide (Emdal et al. 1996,
L’Heureux et al. 2007). Contrary to Skaven-Haug (1955)
and Bjerrum (1971), we thus suggest that the 1888 event
sequence in Trondheim started underwater, near-shore,
following a detachment in the vicinity of a weak clayey
bed (Stage 1—Fig. 9).
The morphology of slide scars outside Brattøra indicates
that parts of the foreslope disintegrated following the
failure and that the sediments were funnelled into the
submarine channel (Fig. 4). Given the sea bed morphology
and position of bedrock exposures, the resulting mass flow
diverted towards the flanks of the Nidelva channel. This
produced enhanced erosion and undercutting, in particular
at the base of the ‘‘W’’-landslide (Fig. 4, see also blue star
in Fig. 9). As the Nidelva channel has not been linked to a
major fluvial source since 3000–2000 cal. years BP
(L’Heureux et al. 2009a), the area may have stabilized as
erosion ceased. An external event, such as mass flow from
an initial landslide seaward of Brattøra, may have been
necessary to ultimately trigger the ‘‘W’’- landslide (Stage
2—Fig. 9). This is supported by results from slope stability
analysis presented above.
Compared to the near-shore area, the succession above
the weak layer in the vicinity of the ‘‘W’’-landslide is finer
grained due to its distal deltaic location. Therefore, the
rapid unloading of the ‘‘W’’-slope likely triggered a
translational landslide evacuating into the Nidelva as a
compact debris flow with visco-plastic properties (see e.g.
Elverhøi et al. 2010). The clean surface exposed in the
W-landslide suggests the failure developed rapidly, much
like what has been modelled for the Storegga slide
(Kvalstad et al. 2005) and the Currituck slide (Locat et al.
2009). A combination of large failed sediment volumes,
relatively steep slopes, restricted evacuation path and
acceleration potential may have caused a large water dis-
placement and the tsunami wave.
Tsunami simulations
The interpretation of the W-landslide as the cause for the
1888 tsunami in the bay of Trondheim is here further tested
by making use of tsunami simulations. First, the volume
and the runout of the ‘‘W’’-landslide are prescribed inputs
Mar Geophys Res
123

from the observations. There are of course no observations
of the acceleration, the velocity, or the general landslide
behaviour. Hence, the failed mass is modelled as a
deformable visco-plastic Bingham fluid applying the two-
dimensional BING model (Imran et al. 2001). In other
words, the landslide moves as a plug flow riding on top of a
shear layer with a thickness determined by flow height and
yield stress of the material. The two-dimensional (2D)
model assumes that the sediments disintegrated and liq-
uefied instantly upon failure. The landslide is initially
given a depth of 8 m and a length of 320 m based on the
morphological data. The yield strength is set to 50 Pa
(L’Heureux et al. 2009b). In Fig. 10 the frontal flow
velocity of the landslide is shown. The applied rheological
parameter (i.e. yield strength of 50 Pa) might be too low
(the value is enforced to get the slide started in the BING
model), and as a result the velocities might be too high.
However, the volume and the initial acceleration are more
important than the velocity for the resulting tsunami
(Løvholt et al. 2005).
Most tsunami simulations are accomplished in two
horizontal dimensions (2HD) for sea-surface elevation and
depth-averaged horizontal wave current speed, by solving
the linear and non-dispersive (hydrostatic) shallow-water
(LSW) equations for conservation of mass and momentum
(Mei 1989). In these equations, it is assumed that charac-
teristic sea-surface elevation of the waves (i.e., deviation
from equilibrium water level), is much less than typical
water depth. In addition, it is assumed that the character-
istic wavelength is much longer than typical water depth.
However, for the cases where the waves are shorter (as in
the present case) the pressure is no longer hydrostatic and
the waves will be influenced by dispersive effects implying
that the speed of wave propagation depends on the wave
length; longer waves travel faster than shorter ones. Fur-
thermore, if the characteristic amplitudes are higher than in
the LSW regime above, the waves may be influenced by
non-linearity. This effect can be seen, e.g., as steepening of
waves propagating towards the shore, followed by possible
wave breaking. To include these two higher order effects
(dispersion and non-linearity) we apply so-called Bous-
sinesq models (Mei 1989). In the present work, we applied
the Boussinesq model called GloBouss (Pedersen and
Løvholt 2008; Løvholt et al. 2008; 2010).
In the tsunami model, the landslide is simplified as a
flexible box with a prescribed velocity progression deduced
from the BING model landslide simulations (cf. Fig. 10).
The maximum velocity (about 30 m/s) is reached after 1400
m, and the slide has come to rest after a distance of about
3200 m. The ‘‘box-slide’’ is rounded to avoid numerical
noise caused by sharp edges, with physical dimensions of
1.32 9 width (430 m) 9 height (8 m) 9 length (320 m) or
approximately 1.45 9 106 m3. A factor of 1.32 comes from
the applied rounding of the landslide. In the tsunami model,
landslide propagation follows a straight line (L’Heureux
et al. 2009b) and the tide is not taken into account. In light of
the overall uncertainty (landslide parameters, etc.), these
models give reasonable results for tsunami propagation. For
further details on landslide representation we refer to Har-
bitz (1992) and Løvholt et al. (2005).
In Fig. 11a, b, the surface elevation of the tsunami
generated by the ‘‘W’’-landslide is shown after 2 and
5 min, respectively. The maximum surface elevation dur-
ing the simulation period is shown in Fig. 11c. Inside and
close to the area of the sliding masses the surface eleva-
tions are more than 10 m, and attenuate down to below 1 m
in the central part of Trondhjemsfjorden. Close to the
shoreline on the northern side of the fjord, the waves
amplify from less than 1 m up to about 2 m. The amplifi-
cation here is due to shoaling.
To reveal the effects of dispersion and non-linearity, we
compared time series of the surface elevation at synthetic
gauges at different locations in the fjord (see Fig. 11 for the
locations). Figure 12 reveals the results for gauges located
outside Brattøra (gauge 1) and Rørvika (gauge 3). At
Brattøra the first wave is a depression formed by the sed-
iment removal (the tail of the landslide) prior to the arrival
of the wave peak formed above the front of the landslide.
However, outside Rørvika, the first wave is a positive peak
created by the landslide front. The effect of dispersion is
clearly seen when comparing the results of the different
mathematical descriptions (see Fig. 12 where lower and
smoother waves for the dispersive solutions are shown).
For the leading waves we may conclude that the dispersive
effect is more pronounced for waves propagating over
longer distances, giving a slightly different (and smoother)
solution and reduced surface elevations. At Brattøra close
to the landslide area, the effect of dispersion is more or less
absent for the leading waves due to short time of influence
of dispersion (and shallower water). In addition, there is no
significant effect of non-linearity. However, as we will see
below, non-linear effects are important during inundation.
Fig. 10 2D bathymetric profile of the Nidelva Channel (from the
location of the ‘‘W’’-landslide to the deep fjord basin) and frontal flow
velocity from the 2D-BING model (from L’Heureux et al. 2009b)
Mar Geophys Res
123

The tsunami inundation is calculated using the standard
model ComMIT/MOST (ComMIT 2010; Løvholt et al.
2010). The surface elevation and velocity components from
the tsunami propagation (linear dispersive description)
above are given as input to the model. The maximum
surface elevations (offshore) and inundation heights (on
Fig. 11 Results from tsunami simulation showing a surface elevation after 2 min, b after 5 min and c maximum surface elevation during the
total simulation time. The locations of the gauges 1–4 are shown
Fig. 12 Time history results of surface elevations outside Brattøra
(gauge 1; Fig. 11) and Rørvika (gauge 3; Fig. 11) for different
mathematical descriptions as explained in the text. The legends
‘‘LSW’’, ‘‘disp’’, and ‘‘Bouss’’ reflect the linear hydrostatic, the linear
dispersive, and the full Boussinesq descriptions (including both
dispersion and non-linearity), respectively
Mar Geophys Res
123
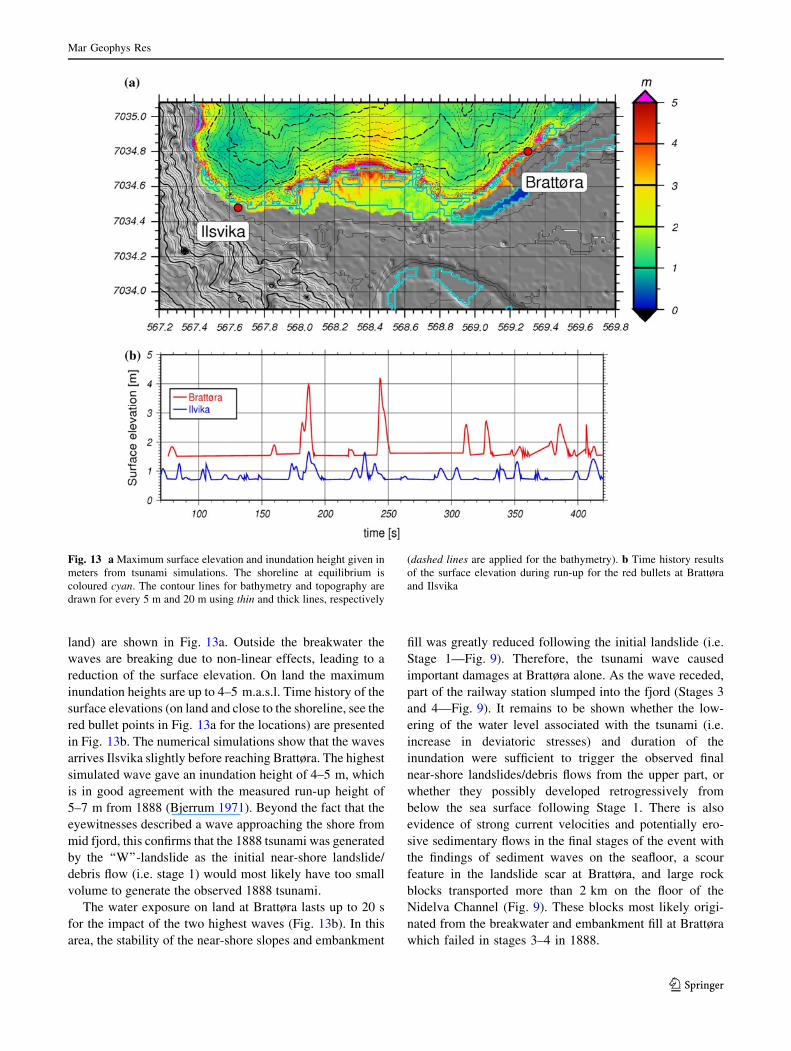
land) are shown in Fig. 13a. Outside the breakwater the
waves are breaking due to non-linear effects, leading to a
reduction of the surface elevation. On land the maximum
inundation heights are up to 4–5 m.a.s.l. Time history of the
surface elevations (on land and close to the shoreline, see the
red bullet points in Fig. 13a for the locations) are presented
in Fig. 13b. The numerical simulations show that the waves
arrives Ilsvika slightly before reaching Brattøra. The highest
simulated wave gave an inundation height of 4–5 m, which
is in good agreement with the measured run-up height of
5–7 m from 1888 (Bjerrum 1971). Beyond the fact that the
eyewitnesses described a wave approaching the shore from
mid fjord, this confirms that the 1888 tsunami was generated
by the ‘‘W’’-landslide as the initial near-shore landslide/
debris flow (i.e. stage 1) would most likely have too small
volume to generate the observed 1888 tsunami.
The water exposure on land at Brattøra lasts up to 20 s
for the impact of the two highest waves (Fig. 13b). In this
area, the stability of the near-shore slopes and embankment
fill was greatly reduced following the initial landslide (i.e.
Stage 1—Fig. 9). Therefore, the tsunami wave caused
important damages at Brattøra alone. As the wave receded,
part of the railway station slumped into the fjord (Stages 3
and 4—Fig. 9). It remains to be shown whether the low-
ering of the water level associated with the tsunami (i.e.
increase in deviatoric stresses) and duration of the
inundation were sufficient to trigger the observed final
near-shore landslides/debris flows from the upper part, or
whether they possibly developed retrogressively from
below the sea surface following Stage 1. There is also
evidence of strong current velocities and potentially ero-
sive sedimentary flows in the final stages of the event with
the findings of sediment waves on the seafloor, a scour
feature in the landslide scar at Brattøra, and large rock
blocks transported more than 2 km on the floor of the
Nidelva Channel (Fig. 9). These blocks most likely origi-
nated from the breakwater and embankment fill at Brattøra
which failed in stages 3–4 in 1888.
Fig. 13 a Maximum surface elevation and inundation height given in
meters from tsunami simulations. The shoreline at equilibrium is
coloured cyan. The contour lines for bathymetry and topography are
drawn for every 5 m and 20 m using thin and thick lines, respectively
(dashed lines are applied for the bathymetry). b Time history results
of the surface elevation during run-up for the red bullets at Brattøra
and Ilsvika
Mar Geophys Res
123

Implications for hazard assessment in near-shore
environments
When assessing the hazard potential from near-shore
landslides, not only the process leading to failure of the soil
mass is of concern, but also the post-failure behaviour of
the displaced mass. As shown from the present study of the
landslides in the bay of Trondheim, a single slope failure
can develop into an erosive gravity flow and affect large
areas of the seafloor downstream. However, out of three
large historical slope failures in the Trondheim harbour,
only the 1888 event caused a tsunami wave. The reason for
this may be associated to the fact that the initial landslide
was located immediately at the head of a large submarine
channel. The initial sedimentary flow was directly fun-
nelled into the channel and it had the opportunity to affect
several slope sections downstream by axial incision. Slope
failure along steep channel walls may furthermore have a
larger tsunamigenic potential due to acceleration potential
and the restricted evacuation path of the landslide masses.
The potential hazard posed by mass movement processes
must therefore be assessed regionally when planning con-
struction activity in near-shore and coastal environments.
Conclusions
The 1888 shoreline landslide and tsunami in the bay of
Trondheim is a good illustration of submarine, multiphase
land-sliding in near-shore environments that can generate
tsunamis. The integration of seafloor morphology with a
dataset of cores, CPTU tests and slope stability analysis
shows that the near-shore slopes had a relatively low sta-
bility prior to 1888 owing to the presence of a soft clayey
layer in the steep delta foreslope. Initial land-sliding most
likely occurred as a detachment along or close to a weak
clayey bed due to unfavourable groundwater conditions (i.e.
low tide, high groundwater seepage forces from intense
snow melting) and possible strain accumulation in the sen-
sitive clayey layers over time. The landslide rapidly trans-
formed into a debris flow which facilitated additional slope
failures, in particular the W-landslide on the flanks of the
Nidelva submarine channel. Modelling of landslide
dynamics and tsunami simulations indicate that the volume
and acceleration of the ‘‘W’’-landslide caused the 5–7 m
high flood wave which struck the shores of Trondheim on
April 23rd 1888.
Acknowledgments Svein Hove and the Norwegian road authorities
are thanked for access to CPTU data. Oddbjørn Totland is thanked for
acquisition and processing of the geophysical data. We are also
thankful to the crews of R/V Seisma, R/V Gunnerus and R/V G.O. Sars
for invaluable assistance during data acquisition. We acknowledge
financial contributions to this project from the Trondheim Harbor, the
Norwegian road authorities, the International Centre for Geohazards
(ICG), the Norwegian Geotechnical Institute (NGI), the Geological
Survey of Norway (NGU), the Norwegian University of Science and
Technology, and the Research Council of Norway (NFR). The authors
are grateful to R. Urgeles and two anonymous reviewers for their
helpful suggestions and constructive comments. This is contribution
no. 307 of the International Centre for Geohazards.
References
Bjerrum L (1971) Subaqueous slope failures in Norwegian fjords.
Norwegian Geotechnical Institute, Publ. No. 88
Campanella RG, Robertson PK, Gillespie D (1983) Cone penetration
testing in deltaic soils. Can Geotech J 20:23–35
ComMIT (2010) Software and documentation. URL: http://nctr.pmel.
noaa.gov/ComMIT/index.html
Dan G, Sultan N, Savoye B (2007) The 1979 Nice harbour
catastrophe revisited: trigger mechanism inferred from geotech-
nical measurements and numerical modeling. Mar Geol 245:
40–64
Elverhøi A, Breien H, De Blasio FV, Harbitz CB, Pagliardi M (2010)
Submarine landslides and the importance of the initial sediment
composition for run-out length and final deposit. In: 70th
anniversary of Prof. B.N. Gjevik ocean dynamics special issue.
doi:10.1007/s10236-010-0317-z
Emdal A, Janbu N, Sand K (1996) The shoreline slide at Lade. In:
Senneset K (ed) Landslides. Proceedings of the 7th international
symposium on landslides, Trondheim, Norway, vol 1, pp 533–538
Fredlund DG, Krahn J (1977) Comparison of slope stability methods
of analysis. Can Geotech J 14:429–439
GEO-SLOPE (2008) Stability modeling with Slope/W 2007: an
engineering methodology, 4th edn. GEOSLOPE International
Ltd, Calgary, 355 pp
Golke M, Cloetingh S, Coblentz D (1996) Finite-element modeling of
stress patterns along the Mid-Norwegian continental margin, 628
to 688N. Tectonophysics 266:33–53
Hansen L, L’Heureux J-S, Longva O (2010) Turbiditic, clay-rich
event beds in fjord-marine deposits caused by landslides in
emerging clay deposits – palaeoenvironmental interpretation and
role for submarine mass-wasting. Sedimentology. doi:10.1111/
j.1365-3091.2010.01188.x
Harbitz CB (1992) Model simulations of tsunamis generated by the
Storegga Slide. Mar Geol 105:1–21
Hovland M, Gardner JV, Judd AG (2002) The significance of
pockmarks to understanding fluid flow processes and geo-
hazards. Geofluids 2:127–136
Imran J, Harff P, Parker G (2001) A numerical model of submarine
debris flow with graphical user interface. Comput Geosci
27:717–729
Kongsberg Defense & Aerospace (2004) TOPAS PS 40, System
specifications, Parametric sub-bottom profiler. Brochure PS 40.
www.kongsberg.com
Kvalstad TJ, Andresen L, Forsberg CF, Berg K, Bryn P, Wangen M
(2005) The Storegga slide: evaluation of triggering sources and
slide mechanics. Mar Petrol Geol 22:245–256
L’Heureux J-S, Longva O, Hansen L, Vingerhagen G (2007) The
1990 submarine slide outside the Nidelva River mouth, Trond-
heim, Norway. In: Lykousis V, Sakellariou D, Locat J (eds)
Submarine mass movements and their consequences. Kluwer
Series on Advances in Natural and Technological Hazards
Research, vol 27, pp 259–267
L’Heureux J-S, Hansen L, Longva O (2009a) Development of the
submarine channel at the mouth of the Nidelva River,
Mar Geophys Res
123

Trondheimsfjorden, Norway. Mar Geol 260:30–44. doi:
10.1016/j.margeo.2009.01.005
L’Heureux JS, Longva O, Sylfest G, Hansen L, Harbitz CB, Gauer P
(2009b) Causes for the 1888 shoreline landslide and tsunami in
Trondheimsfjorden, Mid-Norway. In: Proceedings of the 1st
international conference on seafloor mapping for geohazard
assessment, 11–13 May 2009, Ischia Island, Italy
L’Heureux J-S, Hansen L, Longva O, Emdal A, Grande L (2010) A
multidisciplinary study of submarine landslides at the Nidelva
fjord delta, Central Norway–Implications for geohazards assess-
ments. Norw J Geol 90:1–20
Dehls JF, Olesen O, Bungum H, Hicks E, Lindholm, CD, Riis F
(2000) Neotectonic map, Norway and adjacent areas, 1:3
million. Geological Survey of Norway, Trondheim. URL: http://
www.ngu.no/sokkelkart/Neotectonic_map.pdf
Locat J, Lee HJ (2002) Submarine landslides: advances and
challenges. Can Geotech J 39:193–212
Locat J, Lee HJ, ten Brink US, Twichell D, Geist E, Sansoucy M
(2009) Geomorphology, stability, and mobility of the Currituck
slide. Mar Geol 264:28–40
Løvholt F, Harbitz CB, Haugen KB (2005) A parametric study of
tsunamis generated by submarine slides in the Ormen Lange/
Storegga area off western Norway. Mar Petrol Geol 22:219–231
Løvholt F, Pedersen G, Gisler G (2008) Oceanic propagation of a
potential tsunami from the La Palma Island. J Geophys Res
113:C09026, doi:10.1029/2007JC004603
Løvholt F, Pedersen G, Glimsdal S (2010) Coupling of dispersive
tsunami propagation and shallow water coastal response.
Accepted for publication in Zahibo N, Pelinovsky E, Yalciner
A, Titov V (eds) Proceedings of the ‘‘Caribbean Waves 2008’’
workshop in Guadeloupe, Dec. 2008. Open Oceanogr J 4:71–82
Lunne T, Robertson PK, Powell JJM (1997) Cone penetration testing
in geotechnical practice. Spon Press (Taylor and Francis Group),
312 pp
Lysa A, Hansen L, Christensen O, L’Heureux J-S, Longva O, Olsen
H, Sveian H (2007) Landscape evolution and slide processes in a
glacioisotatic rebound area: a combined marine and terrestrial
approach. Mar Geol 248:53–73
Mei CC (1989) The applied dynamics of ocean surface waves:
advanced series on ocean engineering. World Scientific Publi-
cations, Singapore 760 p
Morgenstern NR, Price VE (1965) Analysis of stability of general slip
surfaces. Geotechnique 15:79–93
Pascal C, Gabrielsen RH (2001) Numerical modelling of cenozoic
stress patterns in the Mid Norwegian Margin and the northern
North Sea. Tectonics 20:585–599
Pedersen G, Løvholt F (2008) Documentation of a global Boussinesq
solver. Department of Mathematics, University of Oslo, Norway.
URL: http://www.math.uio.no/eprint/appl_math/2008/01-08.html
Piper DJW, Asku AE (1987) The source and origin of the 1929 Grand
Banks turbidity current inferred from sediment budgets. Geo
Mar Lett 7:177–182
Prior DB, JM Coleman, Bornhold BD (1982) Results of a known
instability event. Geo Mar Lett 2:117–122
Reite A (1995) Deglaciation of the Trondheimsfjord area, Central
Norway. Geol Surv Norway Bull 427:19–21
Reite AJ, Sveian H, Erichsen E (1999) Trondheim fra istid til natid—
landskapshistorie og løsmasser, Geological Survey of Norway.
Grasteinen 5, 40 pp
Robertson PK (1990) Soil classification using the cone penetration
test. Can Geotech J 27:151–158
Senneset K, Sandven R, Lunne T, By T, Amundsen T (1988)
Piezocone tests in silty soils. In: Proceedings of the international
symposium on penetration testing, ISOPT-1, Orlando, vol 2.
Balkema, Rotterdam, pp 955–966
Skaven-Haug S (1955) Undervannsskred i Trondheim havneomraade.
Teknisk Ukeblad 102(7):(also in publ. 7, Norwegian Geotech-
nical Institute, Oslo, Norway, pp 133–144)
Statens Vegvesen (2004a) Ground investigations and revised data
report: Ud-359B – E6 Nordre Avlastningsveg over Brattøra (in
Norwegian)
Statens Vegvesen (2004b) Ground investigation and data report: Ud-
359C - E6 Nordre Avlastningsveg Kulvert Under Skansenløpet
(in Norwegian)
Statens Vegvesen (2008) Evaluation of groundwater and uplift
pressure in Pit 5 – Skansenløpet tunnel. Unpublished internal
report, 11 pp
Tappin DR (2009) Mass transport events and their tsunami hazard. In:
Mosher DC, Shipp RC, Moscardelli L, Chaytor JD, Baxter CDP,
Lee HL, Urgeles R (eds) Submarine mass movements and their
consequences, advances in natural and technological hazards
research, vol 28. Springer, Dordrecht, pp 667–684
Wolff CF (1976) Geologisk kart over Norge, berggrunnskart Trond-
heim 1:250.000. Geological Survey of Norway
Mar Geophys Res
123