landcover and Shoreline Changes in the Coastal zone of ...
76
Norwegian College of Fisheries Science Faculty of Biosciences, Fisheries and Economics An Assessment of Land use/ landcover and Shoreline Changes in the Coastal zone of Greater Accra region, Ghana. Joshua Nyarko Boampong Master’s thesis in International Fisheries Management (FSK – 3910). May 2020
-
Upload
khangminh22 -
Category
Documents
-
view
1 -
download
0
Transcript of landcover and Shoreline Changes in the Coastal zone of ...

Norwegian College of Fisheries Science
Faculty of Biosciences, Fisheries and Economics
An Assessment of Land use/ landcover and Shoreline Changes in the Coastal
zone of Greater Accra region, Ghana.
Joshua Nyarko Boampong
Master’s thesis in International Fisheries Management (FSK – 3910).
May 2020

i
Acknowledgements
I would like to thank my supervisors Keshav Prasad Paudel and Kari Elida Eriksen for their
patience and guidance from the start to the end of this thesis. I also want to thank the co-
ordinators and the entire teaching staff of the College of Fisheries Science who contributed to
my knowledge. To my classmates, thank you for being part of the new family.
I would also want to thank my family and to my late mother, the Asamoah-Gyawu family and
Oduro families for their support and encouragement. Also, to my friends, Josephine, Adwoa,
Kelvin, Remy, Adrianna, Richmond and the rest who made my stay in Tromsø a memorable
one.
Finally, I would like to dedicate this thesis to my wife, Florence Akomaah Boampong for her
love and support.
Tromsø 15. 05. 2020
Joshua Nyarko Boampong
Cover image: Tema Port, Greater Accra. Source: Google Earth (2020)
ii
Contents
1 Introduction ........................................................................................................................ 1
1.1 Objectives of study ....................................................................................................... 5
2 Study area ........................................................................................................................... 6
2.1 Coastal changes in Ghana ............................................................................................. 7
3 Literature Review and Conceptual Framework .................................................................. 11
3.1 Coastal zones/areas..................................................................................................... 11
3.1.1 Social and Ecological System (SES) analysis ...................................................... 12
3.2 Coastal dynamics........................................................................................................ 14
3.3 Shoreline changes ....................................................................................................... 14
3.4 Land use and landcover in coastal areas ...................................................................... 16
3.4.1 Vegetation and mangroves .................................................................................. 16
3.4.2 Urbanization/ built-up ......................................................................................... 18
3.5 Methodologies in coastal change studies ..................................................................... 19
4 Research Methodology ..................................................................................................... 21
4.1 Data sources and preprocessing .................................................................................. 21
4.2 Shoreline change analysis ........................................................................................... 24
4.3 Land use/landcover change ......................................................................................... 25
4.3.1 Vegetation cover changes .................................................................................... 25
4.3.1.1 Mangrove mapping ...................................................................................... 26
4.3.1.2 Computation of NDVI .................................................................................. 26
4.3.2 Land use (urbanization and built environment) .................................................... 26
4.4 Change detection ........................................................................................................ 27
5 Results .............................................................................................................................. 29
5.1 Shoreline Change ....................................................................................................... 29
5.2 Land use/landcover changes ............................................................................................ 32
5.2.1 Vegetation/NDVI change ......................................................................................... 32

iii
5.2.2 Mangrove change ..................................................................................................... 35
5.2 NDBI change detection .............................................................................................. 38
6 Discussion ........................................................................................................................ 43
6.1 Shoreline Changes ...................................................................................................... 43
6.2 Land use/landcover changes ....................................................................................... 47
6.2.1 Vegetation and mangrove change ........................................................................ 48
6.2.2 Urbanization/ built-up ......................................................................................... 50
6.3 Management implication; towards an Integrated Coastal Zone Management (ICZM) . 51
6.4 Methodologies in coastal change assessment .............................................................. 53
6.5 Limitations ................................................................................................................. 54
7 Conclusion ........................................................................................................................ 55
Works cited .............................................................................................................................. 57
Appendices ............................................................................................................................... 67
Appendix 1: False Color Composite (FCC) images ............................................................... 67
Appendix 2: Vegetation extent between 1996 and 2017 ........................................................ 68

iv
List of Tables
Table 1. Image source and spatial resolution of satellite images from Landsat used…..23
Table 2. Changes in vegetation based on NDVI from 1996-2017……………………...35
Table 3. Mangrove changes in Ada between 1996 and 2017………………………….. 38
Table 4. Mangrove changes in Densu delta between 1996 and 2017…………………..38
Table 3. Changes in built-up area (based on NDBI) from 1996 to 2017……………….41

v
List of Figures
Figure 1. Map of Study Area……………………………………………………………………7
Figure. 2 Longshore drift and division of Ghana’s coastline…………………………………...9
Figure 3. Google Earth image (2020) of the study area………………………………………..22
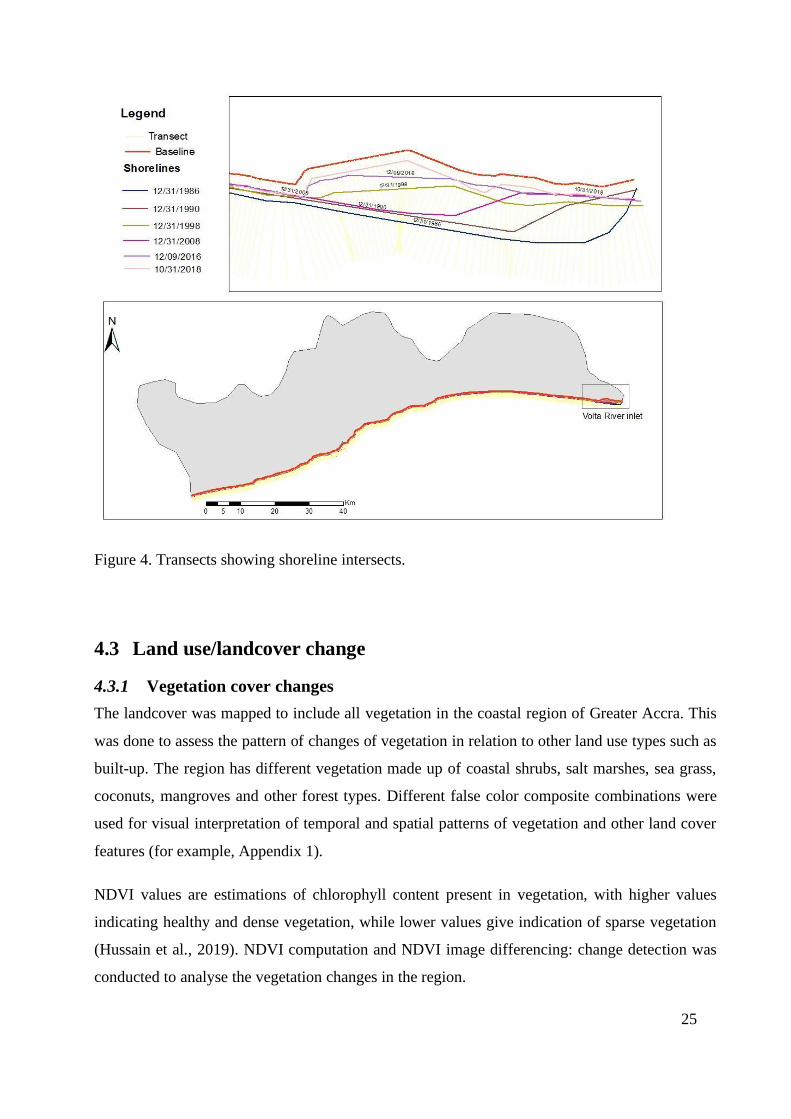
Figure 4. Transects showing shoreline intersects………………………………………………25
Figure 5. Result of shorelines and baseline along the coast……………………………………29
Figure 6. End Point Rate (EPR) showing accretion and erosion levels along the coast…….....30
Figure 7. Graphs showing comparison of erosion and accretion along the coast……………....32
Figure 8. NDVI image differencing showing changes in vegetation cover from 1996 to 2017..33
Figure 9. Threshold NDVI difference maps a) 1996-2002, b) 2002-2017, c) 1996-2017……..34
Figure 10. land use/landcover changes in Ada area mangroves between 1996 and 2017……..36
Figure 11. Land use/land cover changes in Densu delta mangrove area between 1996 and
2017…………………………………………………………………………………………….37
Figure 12. Change in built-up areas in Accra: a) 1996, b) 2002 and c) 2017………………….39
Figure 13. NDBI change post-classification: 1996-2002, 2002-2017 and 1996-2017…………40
Figure 14. Examples of digitized built-up developmen based on visual interpretation from Google
Earth…………………………………………………………………………………………….42
Figure 15. Example of sea defense structures constructed across the direction of sediment transport
…………………………………………………………………………………………………..44
Figure 16. Example of rock headlands found on the western coast of Greater Accra………….45
Figure 17. Example of sea defense structure across the direction of sediment transport……....46

vi
Abstract
Social-ecological systems found in coastal zones make it one of the complex environments
globally. The result of this social-ecological interaction is often unsustainable use of coastal
resources. Integrated Coastal Zone Management (ICZM) has been recommended and used to
manage the complexities that exist in coastal areas. ICZM involves a holistic approach to coastal
resource management. However, for effective ICZM and planning, it is vital to obtain necessary
information of changes that have occurred in the coastal zone. The study assesses land
use/landcover and shoreline changes in the coastal zone of Greater Accra, Ghana, using simple
GIS methods. Higher erosion rates were observed in the eastern part of the region, in the Volta
estuary than on the western side, in Accra. Results from landcover changes showed significant
decrease of vegetation within Greater Accra, with the highest decreases found closer to the coast
from 1996 to 2017. However, there were considerable increases in mangroves found within the
Densu Delta and Ada, Volta River estuary. Land use/urbanization was high near the coast between
1996 and 2002, it started expanding into the peri-urban areas of Greater Accra between 2002 and
2017. Integration of Google Earth and Landsat satellites images proved to be useful in determining
changes in shoreline and land use/landcover in the region. The availability of these satellite images
can be useful to minimize the challenge of data accessibility in data poor regions like Greater
Accra. The results obtained in this study can be useful to inform management decisions on ICZM
in the region.
Keywords: Coastal zones, DSAS, GIS, ICZM, Erosion, Accretion, Land use, Landcover,
Urbanization, Mangroves
1
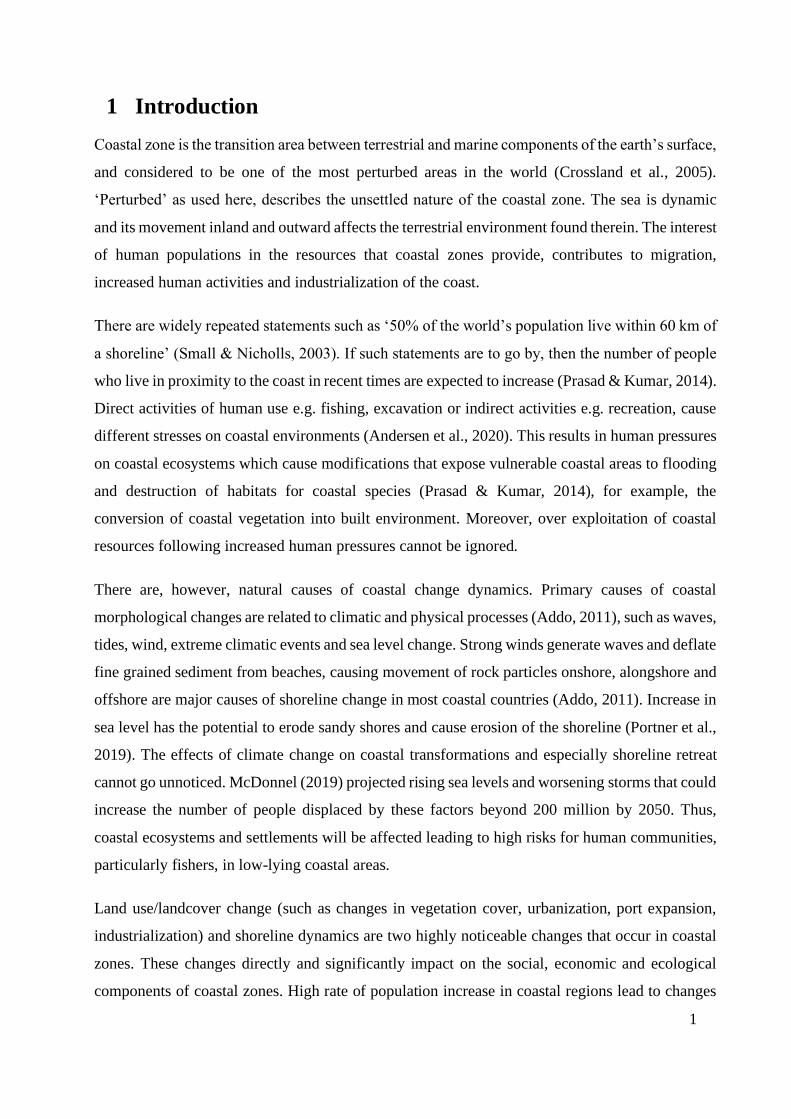
1 Introduction
Coastal zone is the transition area between terrestrial and marine components of the earth’s surface,
and considered to be one of the most perturbed areas in the world (Crossland et al., 2005).
‘Perturbed’ as used here, describes the unsettled nature of the coastal zone. The sea is dynamic
and its movement inland and outward affects the terrestrial environment found therein. The interest
of human populations in the resources that coastal zones provide, contributes to migration,
increased human activities and industrialization of the coast.
There are widely repeated statements such as ‘50% of the world’s population live within 60 km of
a shoreline’ (Small & Nicholls, 2003). If such statements are to go by, then the number of people
who live in proximity to the coast in recent times are expected to increase (Prasad & Kumar, 2014).
Direct activities of human use e.g. fishing, excavation or indirect activities e.g. recreation, cause
different stresses on coastal environments (Andersen et al., 2020). This results in human pressures
on coastal ecosystems which cause modifications that expose vulnerable coastal areas to flooding
and destruction of habitats for coastal species (Prasad & Kumar, 2014), for example, the
conversion of coastal vegetation into built environment. Moreover, over exploitation of coastal
resources following increased human pressures cannot be ignored.
There are, however, natural causes of coastal change dynamics. Primary causes of coastal
morphological changes are related to climatic and physical processes (Addo, 2011), such as waves,
tides, wind, extreme climatic events and sea level change. Strong winds generate waves and deflate
fine grained sediment from beaches, causing movement of rock particles onshore, alongshore and
offshore are major causes of shoreline change in most coastal countries (Addo, 2011). Increase in
sea level has the potential to erode sandy shores and cause erosion of the shoreline (Portner et al.,
2019). The effects of climate change on coastal transformations and especially shoreline retreat
cannot go unnoticed. McDonnel (2019) projected rising sea levels and worsening storms that could
increase the number of people displaced by these factors beyond 200 million by 2050. Thus,
coastal ecosystems and settlements will be affected leading to high risks for human communities,
particularly fishers, in low-lying coastal areas.
Land use/landcover change (such as changes in vegetation cover, urbanization, port expansion,
industrialization) and shoreline dynamics are two highly noticeable changes that occur in coastal
zones. These changes directly and significantly impact on the social, economic and ecological
components of coastal zones. High rate of population increase in coastal regions lead to changes
2
in land use and landcover of coastal areas. It is estimated that over 3 billion of the world population
live in coastal cities in the world (Creel, 2003). To achieve socio economic gains, coastal regions
go through a series of land use conversions. Migration toward the coast, and often urbanization
and industrialization of the coast result in clearing down arable land and vegetation to be converted
to build environment (Stow et al., 2013). Synergistic effects of both increased human pressure,
activities and climatic as well as natural processes lead to significant transformation of coastal
vegetation.
One major vegetation type found in coastal areas are mangroves, which are often used as biological
indicators of coastal dynamics (Blasco et al., 1996). Mangroves are dominant along many tropical
and subtropical coastlines and one of the most productive ecosystems on earth, providing food,
medicine, timber, and carbon storage, serving as nursery grounds for fish and other organisms, and
protecting coastlines from disturbances (Kirui et al., 2013). Despite the benefits mangroves
provides, their existence is threatened by human factors (Twumasi et al., 2017) and natural
processes like storms, changes in rainfall, sea level and tidal regimes (Thinh & Hens, 2017).
Mangroves may often be affected by the socioeconomic benefits that communities derive from its
use.
Other land use related phenomena such as urbanization, industrialization and port expansion,
significantly affect coastal environment. Landcover in coastal areas are susceptible to frequent
changes as a result of these anthropogenic factors. Economic and social benefits such as
employment, trade etc. may often be prioritized than ecological benefits during these
transformations. Thus, knowledge about the rate of changes taking place in land use and land cover
in coastal zones is critical to successful sustainable management. Kudale (2010) found negative
impacts of port development on littoral drift and changes in seabed geomorphology leading to
erosion on the littoral down drift side of such construction activities. This means that, seaward
reclamation of land can cause changes in shoreline movement along the coast. Increasing
population along the coast also impacts negatively on ecosystems. Mangrove depletion,
destruction of watershed, fisheries habitats and unsustainable management of waste among others
result in changes of the coast (Creel, 2003).
One major problem in coastal regions is erosion of the coastline. Shorelines are important to
protecting coastal communities. They also serve as a protection to coastal ecosystems and the
socioeconomic activities of coastal cities. Shoreline changes have become a major concern in the
3
face of global environmental changes especially for coastal communities and countries (Prasad &
Kumar, 2014). Shoreline retreats lead to destruction of coastal communities submerged in water
(McDonnel, 2019). This affects the economical and habitability of coastal regions (Gill, 2014 cited
in Hassan & Rahmat, 2016). According to recent IPCC reports, coastal areas will experience
adverse impacts such as submergence, coastal flooding and coastal erosion in the near future due
to sea level rise as a result of climate change (Portner et al., 2019; Wong et al., 2013). Thus, it
demands protection of shorelines in the world to sustain the social, ecological and economic
benefits coastal zones provide. One vital way to achieve this is by mapping and monitoring
shoreline dynamics and understanding the dynamics.
Effective coastal planning and management are prerequisite for sustainable coastal development.
Holistic and integrated approaches which encompass the various components of the coastal zone
have recently been developed, such as Integrated Coastal Zone Management (ICZM) and
Ecosystem Based Management (EBM) (Forst, 2009). These approaches consider the coastal zone
as a social-ecological system and connect marine and terrestrial elements of coastal zones. For
successful implementation of such an approach, mapping, monitoring and understanding
spatiotemporal changes of the coastal environment is critical. This study seeks to understand the
spatiotemporal changes of three important components of the coastal zone i.e. shoreline change,
land use and landcover changes of Greater Accra.
Changes that occur in coastal systems are often geographic and related to space, because ‘almost
everything that happens, happens somewhere and knowing where something happens can be
critically important’ (Longley et al., 2015). Geographical Information Systems (GIS) provides a
key tool/platform to integrate social, natural and physical science approaches to understand the
time and space variability of dynamics underlying the social ecological system. A GIS is a set of
computer tools designed to efficiently capture, store, update, manipulate, analyze, and display all
forms of geographically referenced information (Fedra & Feoli, 1998). GIS has proven to be a
useful tool in assessing land use/landcover changes and monitoring shoreline movement patterns
and change (Boateng, 2012; Misra & Balaji, 2015; Muttitanon & Tripathi, 2005). The abilities of
GIS make it a fundamental part in the planning process and management of integrated coastal
ecosystems.
This study aims to assess the coastal transformation in the coast of the Greater Accra region of
Ghana, exploring land use/landcover and shoreline changes. The Coastal zone of Ghana faces

4
similar challenges to coastal zones globally. Ghana aims towards and integrated coastal zone
management as seen from several International conventions like the UN Convention on Biological
Diversity, 1992. Ghana has also introduced legislations and policies such as The National
Environment Policy (Amlalo, 2006) to help in effective management of its coastal zone. A vital
contribution to achieve this aim is to investigate the transformations or changes that have occurred
in the coastal area. The economic activity of Ghana’s coast such as agriculture, salt production, oil
and gas exploration, sand and stone winning, recreational and industrial developments are the key
drivers of the coastal transformations (Amlalo, 2006). These economic activities on the coast result
in the migration of many people from the inland of Ghana to the coast resulting in densely
populated parts along the coast (Stow et al., 2013). This explains why although Ghana’s coastal
zone represents about 6.5% of the land area of the country yet houses 25% of its population with
the small strip of the coast hosting about 80% of the industrial establishments in the country,
according to Amlalo (2006).
Several researches on the coast of Ghana and the Greater Accra region attribute coastline erosion
to natural and physical processes like; rising sea level, wind and wave action and the morphology
of rock make-up of the coast (Addo, 2009; Addo et al.,2012; Jonah et al., 2016). However,
anthropogenic factors like destruction of coconut trees that fringe the coastline and serve as wind
breaker, and sand and pebble extraction from the coast as major contributors to the problem
(Awosika & Folorunsho, 2005). Not only does erosion of the coastline affect the morphology of
the coast, but affect the socioeconomic activities like tourism and cultural heritage sites along the
coast (Addo, 2011).
There has however been limited research on the entire coast of the Greater Accra region, with the
few mostly focusing on parts of the coast (Addo, 2011; Addo et al., 2012; Addo et.al., 2008). Also,
there is limited research in changes in land use/landcover (urbanization or built environment and
vegetation) on the coast of Greater Accra (e.g. Twumasi et al., 2017). To achieve objectives of a
holistic coastal management, knowledge about coastal changes becomes a necessity, this is lacking
as seen from previous research. This study, however, brings together the three components
(shoreline, urbanization or built environment and coastal vegetation; mangroves) and assess the
spatiotemporal changes that have occurred with them. These components were chosen due to their
importance and ability to change the socioecological and economic functions of the coastal area.

5
One of the major challenges in most of the developing countries like Ghana is the lack of reliable
datasets (both shoreline position and land use/landcover) to assess these changes (Addo et al.,
2008). In this study an attempt will be made to address this challenge and add to previous
knowledge, by using simple, freely available and easily accessible remotely sensed images e.g.
Landsat and Google Earth, to come up with a methodology that can be useful to coastal managers
with limited data availability.
1.1 Objectives of study
The social, economic and ecological importance of the coastal area of the Greater Accra region
demands attention by coastal managers. There is a need for holistic assessment of the shoreline
and land use/landcover changes in coastal zones in space and time to inform management
decisions. Thus, the overarching objective of this study is: to assess the transformation or changes
that have occurred on the coast of Greater Accra region using Geographical Information System
(GIS) and remote sensing as a tool. To achieve this, three specific objectives are proposed:
1. To assess shoreline dynamics (erosion and accretion) in the Greater Accra region between
1986 and 2018
2. To assess landcover/land use on the coast of the Greater Accra region between 1986 and
2017.
3. To develop simple methods using freely and openly available GIS data (Landsat and
Google Earth) to assess coastal transformation in a data-poor region.
This thesis is organized to achieve these specific objectives. Chapter 2 introduces the study area
and the coastal zone of Greater Accra region. Chapter 3 discusses the literature context of coastal
dynamics and methods to study them. In chapter 4, detailed methods are explained to answer each
research objective. Chapter 5 presents the results and follows the research objectives. Chapter 6
discusses the findings of the various methods employed and whether the objectives of the study
are accomplished and make remarks about the study. And Chapter 7 concludes the study with a
summary of major findings.

6
2 Study area
This chapter introduces the coastal zone of the Greater Accra region, and the physical and social
ecological components in the region.
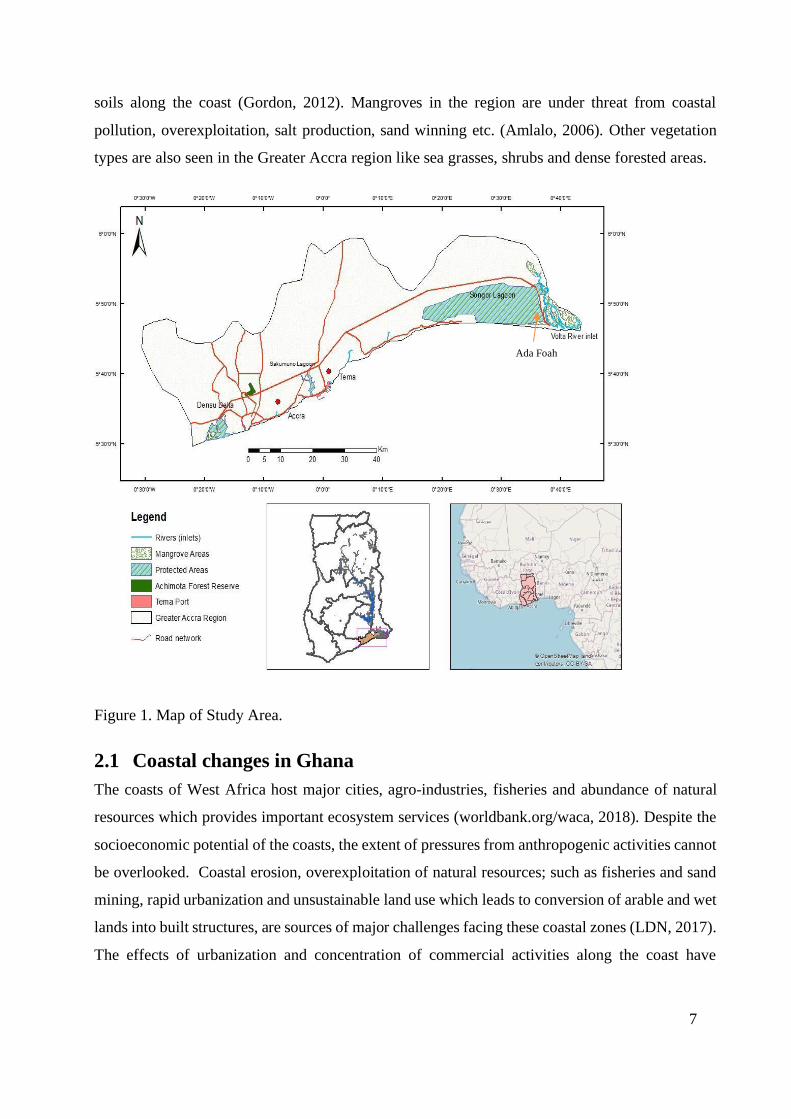
Greater Accra (Figure 1), the region that houses the capital city of the Republic of Ghana is chosen
as the area of interest for this study due to the booming socio economic activities found on its
coast. It is the point of entry into Ghana and its location on the coast of Ghana makes the region
an ideal place for recreation and other hospitality firms e.g. hotels and restaurants, to take
advantage of the economic boom. The population in the region rose to 4,943,075 at the end of
2019, from 4,010,054 in the 2010 census (GSS, 2019). Economic activities in the coastal area in
the region include; manufacturing companies, ports and harbors, fishing, agricultural activities and
recreation (Awosika and Folorunsho, 2005). Despite the economic benefits gained in the coastal
area, it faces numerous problems including pollution, erosion, impact of fisheries, habitat and
biodiversity loss (Awosika and Folorunsho, 2005).
Temperatures in the region are quite high with monthly average of about 30oC in the warmest
month and about 26oC in the coldest month, and average wave height in the area of about 1.39m
and average period is about 10.91seconds (Awo et. al., 2013). The make-up: with various natural
ecosystems (lagoons and estuaries) and the natural processes that cause changes in the morphology
of the coast make it an interesting area of study.
The coast of Greater Accra lies between the Eastern and Central coast of the entire coast of Ghana
(Boateng, 2012). Thus, it shares both the characteristics of the geomorphology of Eastern and
Central coasts with a mixture of sandy and shorelines and/between rocky headlands (Boateng,
2012). The direction of littoral drift along the coast from the central to the Eastern part, allows for
sediment transfer of the unconsolidated and poorly consolidated rocks on the coast of Accra (Addo,
2011) to other parts of the coast. The high and medium energy that characterize the coast of Greater
Accra, coupled with its sandy beaches, watershed inlets and unconsolidated nature of its rock
formations, make it susceptible to coastal erosion.
Towards the extremities of the coastline of Greater Accra, on the West and East coasts are
mangrove forests. Ghana has six mangrove species, but two common ones are the red (Rhizophora)
and black (Avicennia) mangroves, which are able to stand daily flooding and high salinity of the
7
soils along the coast (Gordon, 2012). Mangroves in the region are under threat from coastal
pollution, overexploitation, salt production, sand winning etc. (Amlalo, 2006). Other vegetation
types are also seen in the Greater Accra region like sea grasses, shrubs and dense forested areas.
Figure 1. Map of Study Area.
2.1 Coastal changes in Ghana
The coasts of West Africa host major cities, agro-industries, fisheries and abundance of natural
resources which provides important ecosystem services (worldbank.org/waca, 2018). Despite the
socioeconomic potential of the coasts, the extent of pressures from anthropogenic activities cannot
be overlooked. Coastal erosion, overexploitation of natural resources; such as fisheries and sand
mining, rapid urbanization and unsustainable land use which leads to conversion of arable and wet
lands into built structures, are sources of major challenges facing these coastal zones (LDN, 2017).
The effects of urbanization and concentration of commercial activities along the coast have
Ada Foah
8
resulted in over exploitation of coastal resources like mangrove forests, estuaries, leading to coastal
erosion, forest losses and human made pollutants (Mensah, 1997).
Ghana, a coastal country on the coast of West Africa with an approximated shoreline of 550 km,
is not exempted from the challenges and transformations of coastal areas around the world. The
coastal zone of Ghana hosts more than a quarter of the country’s population and contributes to
about 80% of the country’s annual marine catch, with a coastline classified as mainly high-energy
type coast (World Bank, 2018). The coastlines of Ghana are threatened by both anthropogenic and
natural factors that cause changes in shoreline movements. There is a complex interplay between
geographical and geological conditions, and natural hydrodynamic and infrastructure and
existence of sand mining activities, that impact negatively on the coastal zone of Ghana (LDN,
2017).
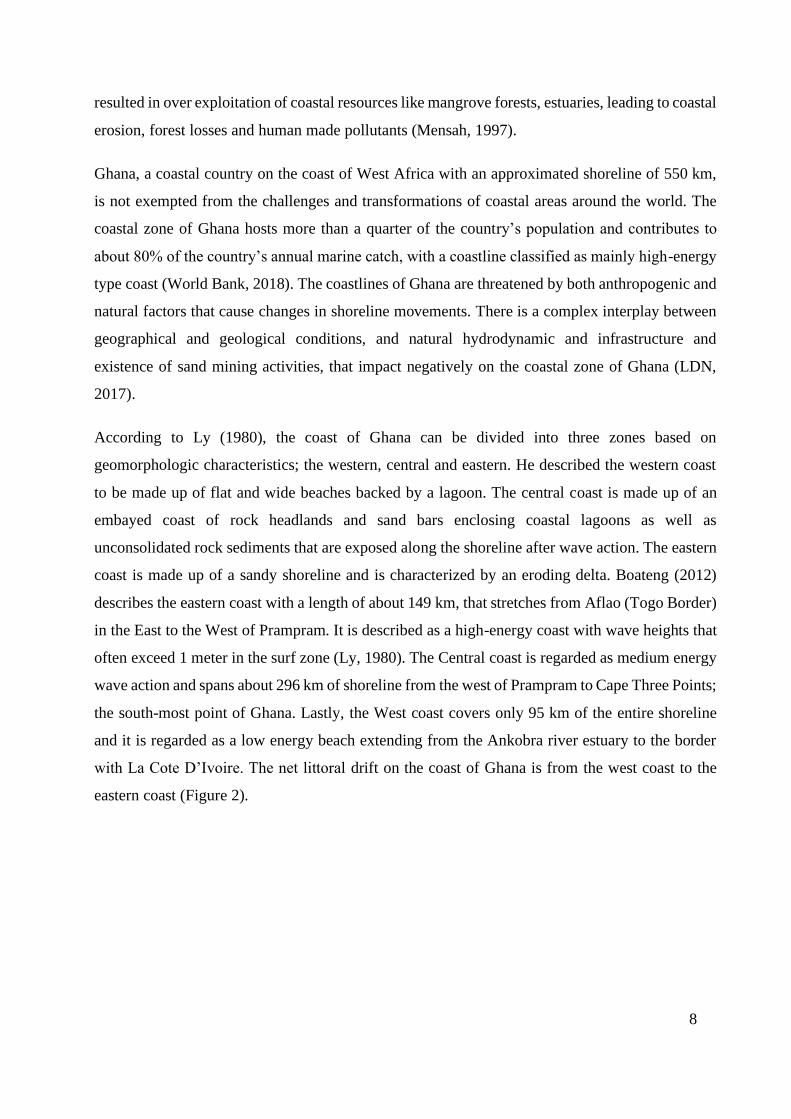
According to Ly (1980), the coast of Ghana can be divided into three zones based on
geomorphologic characteristics; the western, central and eastern. He described the western coast
to be made up of flat and wide beaches backed by a lagoon. The central coast is made up of an
embayed coast of rock headlands and sand bars enclosing coastal lagoons as well as
unconsolidated rock sediments that are exposed along the shoreline after wave action. The eastern
coast is made up of a sandy shoreline and is characterized by an eroding delta. Boateng (2012)
describes the eastern coast with a length of about 149 km, that stretches from Aflao (Togo Border)
in the East to the West of Prampram. It is described as a high-energy coast with wave heights that
often exceed 1 meter in the surf zone (Ly, 1980). The Central coast is regarded as medium energy
wave action and spans about 296 km of shoreline from the west of Prampram to Cape Three Points;
the south-most point of Ghana. Lastly, the West coast covers only 95 km of the entire shoreline
and it is regarded as a low energy beach extending from the Ankobra river estuary to the border
with La Cote D’Ivoire. The net littoral drift on the coast of Ghana is from the west coast to the
eastern coast (Figure 2).
9
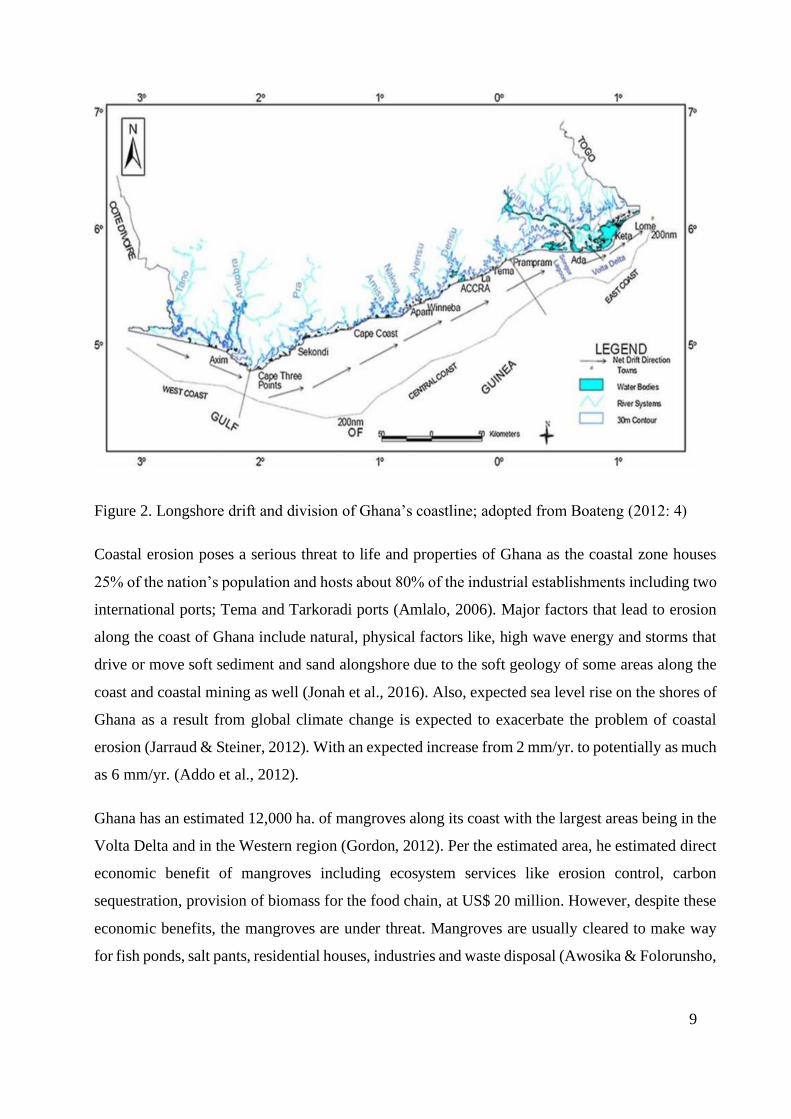
Figure 2. Longshore drift and division of Ghana’s coastline; adopted from Boateng (2012: 4)
Coastal erosion poses a serious threat to life and properties of Ghana as the coastal zone houses
25% of the nation’s population and hosts about 80% of the industrial establishments including two
international ports; Tema and Tarkoradi ports (Amlalo, 2006). Major factors that lead to erosion
along the coast of Ghana include natural, physical factors like, high wave energy and storms that
drive or move soft sediment and sand alongshore due to the soft geology of some areas along the
coast and coastal mining as well (Jonah et al., 2016). Also, expected sea level rise on the shores of
Ghana as a result from global climate change is expected to exacerbate the problem of coastal
erosion (Jarraud & Steiner, 2012). With an expected increase from 2 mm/yr. to potentially as much
as 6 mm/yr. (Addo et al., 2012).
Ghana has an estimated 12,000 ha. of mangroves along its coast with the largest areas being in the
Volta Delta and in the Western region (Gordon, 2012). Per the estimated area, he estimated direct
economic benefit of mangroves including ecosystem services like erosion control, carbon
sequestration, provision of biomass for the food chain, at US$ 20 million. However, despite these
economic benefits, the mangroves are under threat. Mangroves are usually cleared to make way
for fish ponds, salt pants, residential houses, industries and waste disposal (Awosika & Folorunsho,
10
2005). It has been reported that overexploitation of mangroves for domestic and commercial
purposes have aggravated the soil erosion problem (Addo et al., 2012).
Despite these challenges facing the coast of Ghana, the country does not have a holistic policy or
integrated plan for the management of coastal erosion, even with the current 2014 National
Environmental Policy in place (Jonah et al., 2016). It is even perceived that protection measures
on the coast of Ghana are proposed based on urgency (LDN, 2017). Thus, management continues
to be traditional, reactive and dominated by hard engineering approaches, which comes along with
their own peculiar problems to the coastal environment (Jonah et al., 2016).
Previous studies on coastal transformation in Ghana have been limited to shoreline erosion (Addo
et al., 2008; Boateng, 2012; Jonah et al., 2016; Ly, 1980), with most of them focusing on different
parts of the coast. However, not much is done on the Greater Accra regional coast, the region that
hosts the capital of the Republic of Ghana. The coast of the region is of importance, because it lies
between the eastern and central coast of Ghana (Ly, 1980), thus, affected by both affected by high
and medium wave energy on the coast. It also has higher migration to the coast due to the fact that
it is the most developed part of Ghana coastlines (Boateng, 2012), containing many industrial and
recreational establishments in Ghana.
Also, as almost all the studies fall in the area of shoreline changes, there is limited knowledge and
research on the temporal changes of vegetation and mangrove as well as urbanization changes on
the coast of Greater Accra. This research seeks to build on former studies and bridge this gap by
attempting to combine shoreline change, urbanization and mangrove/coastal vegetation changes
to highlight the spatiotemporal changes that have occurred on the coast of the Greater Accra region.

11
3 Literature Review and Conceptual Framework
This chapter reviews related literature and provides the conceptual and theoretical frameworks for
the study. It follows the theme and research objectives of this study.
3.1 Coastal zones/areas
Coastal zones are described as ever-changing, an environment of mystery, a timeless, eternal place
where at the same moment the rhythms of nature are so incredibly visceral and immediate
(Lawrence, 1996). They are considered as one of the most attractive places of the world due to
their aesthetic beauty and the resources that they provide. The economic, social and environmental
services that are provided by coastal zones make them worthy of research. But to understand the
dynamism and complexities of the coast, a clear definitive criterion of what comprises a coastal
zone should be emphasized. There have been different contentious approaches and practices to
define coastal zones (Burke et al., 2001). An approach to define the coastal zone needs to vary
according to the type of problem or the issue being addressed and the objective of management
(Crossland et al., 2005). Therefore, the definition chosen for what constitutes a coastal zone could
be argued to be subjective; depending on the objectives of research and management.
Lawrence (1996) gives a broader definition of coastal zones as dynamic interface zones where
land, water, and atmosphere interact in a fragile balance that is being altered by natural and human
influence constantly. This definition encompasses everything from land to the sea and gives room
to make subjective and objective oriented sub definitions of coastal zones. He argues for this by
emphasizing the flexibility of what the coastal zone contains. He argues that the coastal zone is
significantly affected by anthropogenic factors and some of these activities occur at great distances
from the coast. Thus, a definition of coastal zone should stretch to the extent of influences that
affect the zone, including the entire watershed or river basins, which drain into coastal waters.
However, Hinrichsen (1998 as cited in Burke et al., 2001) defines coastal zone in specific terms
as ‘that part of the land most affected by its proximity to the sea and that part of the ocean most
affected by its proximity to the land’. The proximities used in this definition excludes farther
distances that may not contribute the ‘most’ effect on land and sea within the zone. This definition
also allows for consideration of marine fisheries since nearly two-thirds of all fish harvested
depend upon coastal wetlands, seagrasses, and coral reefs for various stages in their life cycles
(Burke et al., 2001). For the purposes of this study, these two definitions were chosen as they best
describe and include the vital components this thesis seeks to investigate. The overall vegetation

12
and mangrove areas of the study area is considered in this thesis. Mangroves are examined in this
study due to their productivity and importance to fisheries. In Ghana, the coastal zone is defined
as the area below the 30m elevation which represents about 7% of its land area (Boateng, 2006) as
seen in Figure 1. That means, everything that falls within this area is included as part of the coastal
zone. That includes 20,900 km2 continental shelf and 218,100 km2 of its Exclusive Economic
Zone (EEZ) (Boateng, 2006). This area houses most of the industries and businesses and habitat
to coastal organisms. However, this definition was not considered for the purposes of this study.
This study does not focus on ocean use, but the terrestrial part of the coastal zone and encompasses
all terrestrial and inland aquatic areas that have most effect on the coast. This includes river inlets,
lagoons and settlements close to the coastline.
3.1.1 Social and Ecological System (SES) analysis
The complexities of the coastal zone require a comprehensive management system. Social contexts
of multiple use, different forms of ownerships, and conflicts in resource use demands
interdisciplinary methods for SES (Forst, 2009; Glaeser et al., 2009). Consideration of the coastal
zone as a common property of which stakeholders have equal rights and access, has led to
unsustainable use and conflicts between users. To resolve such conflicts and preserve the coastal
resource, a new management approach that integrates managing human and bio-geo-physical
coastal environments is needed. It is also seen that the social and ecological systems in the coastal
zone cannot be studied and managed in isolation (Redman et al., 2004). They form a social-
ecological system that needs a holistic and integrated approach to study. Thus, a holistic
management model in the late 1960s and early 1970s in the United States (Forst, 2009) was
established to manage this social-ecological system.
That marked the dawn of Integrated Coastal Zone Management (ICZM). Integrated Coastal Zone
Management (ICZM) is a broad concept that aims toward ‘an integrated approach to planning and
management of the coastal zone, in which all policies, sectors and to the highest possible extent,
individual interests are properly taken into account, with proper consideration given to the full
range of temporal and spatial scales, involving all stakeholders in a participative way’ (Hassanali,
2014). Based on the general system theory, ICZM is a continuous, iterative and multidisciplinary
process that brings together government and community, science and planning, public interest by
promoting and implementing an integrated plan for sustainable development of coastal ecosystems
(Banica et al., 2017). ICZM delivered a platform that showed the realities of open access and
13
common property that exists in coastal areas and insisted on vestment of community interest (Forst,
2009).
Later, Ecosystem based management (EBM) became a household name for sustainable use of
marine resources (Forst, 2009). Introduction of EBM in coastal resource management requires an
integrated approach to decision-making across human uses of ecosystem services to prevent
unsustainable use (Cowan et al., 2012). Since the mid-1990s, management objectives have focused
on ecosystems and the view that humans are integral to ecosystems in the EBM approach (Forst,
2009). The development of EBM has become the core of the ICZM process and implementation.
The ability of ICZM to comprehensively integrate both natural and social science research makes
it a potential to become a pilot concept for social-ecological systems (SES) analysis (Glaeser et
al., 2009). According to Glaeser et al. (2009), SES relies on interdisciplinary knowledge of the
social ecological system that needs incorporation of human behavior in its analysis. However,
although ICZM possesses the capabilities to pilot SES analysis, historical review of its
implementation shows a lack of appreciation of context-based information (ibid). This deficit
implies that important information is often forgone in ICZM implementation. For a balanced SES
analysis, the combined social ecological systems need to be understood, this means understanding
the source and role of changes in the system (Glaeser et al., 2009).
Integration of spatial and temporal dimensions of coastal resource systems (physical changes of
environment, resource-use patterns and socioeconomic setting), ensures an address to its issues
adequately (Thia-Eng, 1993). This means that implementation of ICZM requires knowing and
integrating changes that have occurred in the coastal zone in management and planning. The first
stage of the ICZM process defines the context with which the program will unfold and requires
accumulation of all vital information needed for planning (Forst, 2009). This may require extensive
research on all social ecological components and changes that might have occurred spatially and
temporally. This study focuses on three elements of change in the social ecological system of the
coastal zone i.e. shoreline, urbanization and vegetation. Understanding these changes can help
inform management decision for effective ICZM implementation.
14
3.2 Coastal dynamics
Coastal dynamics are the changes that occur within the coastal zone. These changes are attributed
to anthropogenic and natural factors. This dynamism and constant change are usually caused by
natural processes like waves, wind, storms, hurricanes, that cause variations in the make up of the
coast on spatial and temporal scale (Lawrence, 1996). It is expected that coastal environments
show resilience after these natural processes. However, human impact changes the routines of
natural processes on coastal zones and can have synergistic impacts on these regions through
coastal transport, physical restructuring of the environment, chemical contamination and
harvesting living and nonliving resources, among others (Crossland et al., 2005).
Two effects of change in coastal zones that are of importance due to their impact on the
socioeconomic system and the coastal environment are shoreline change and land/ocean use in
these regions. They are both affected by natural and anthropogenic drivers. Communities live in
proximity to the coast, thus any change in shoreline i.e. accretion or erosion, affect the
socioeconomic lives of these communities. On the other hand, humans exploit coastal resources
and restructure the coastal environment through land use. Exploitation of coastal vegetation and
mangroves is expected to have an effect on the natural ecosystem of coastal zones. Also, the more
people migrate to the coast because of the resources and services it provides, the more natural
environments are converted to settlement and built environments to accommodate humans. Thus,
shoreline changes and land use in coastal zones are important to be examined. The subsequent
subsections discussed these two aspects.
3.3 Shoreline changes
Shorelines or coastlines? Murray (2001) defines coastline as the edge of the land which is at the
limit of normal high tides often marked by the seaward boundary of terrestrial vegetation. While,
the shoreline is the water’s edge, ‘it moves to and fro depending on the rise and fall of tides’, so
that there is ‘a low-tide shoreline, a mid-tide shoreline and a high-tide shoreline’. However, this
distinction is lost when the coastline and shoreline are regarded synonyms. In this thesis, the
coastline and shoreline is used as synonyms and interchangeably as this is often used as such by
researchers (for example Prasad & Kumar, 2014).
The expressions used by Murray (2001); ‘moves to and fro depending on rise and fall of tides’ and
ranging from ‘low-tide shoreline, a mid-tide shoreline and a high-tide shoreline’, show the
shoreline as a dynamic environment that can change from a few minutes to years of change. The

15
state of the shoreline can be classified as Eroding i.e. landward retreat, Equilibrium i.e. generally
stable, and Accreting i.e. seaward extension (Salghuna & Bharathvaj, 2015), and may occur
interchangeably along an entire coastline. Despite its dynamism, Lawrence (1996) described these
areas as dynamic yet adaptable, explaining this based on the resilience and ability of these areas to
recuperate when allowed to continue its evolutionary process. Thus, there is a creation and
destruction of coastline during an entire evolutionary process that could be caused by natural
processes like wave action and wind direction. Yet, Caldwell (1949) argues that, there is a delicate
balance between the forces that erode the beach by carrying away the sand and the forces that tend
to deposit sand onto the beach from other areas; accretion (Kotinas et al, n.d.). Thus, one cannot
only rely on the natural resilience and the ability of the coastline to recuperate to deal with the
challenges that result from unsustainable use of coastal resources.
The shoreline is important to sustenance of fringe communities and protection of the ecosystems
found on the coast. Humans have bounds with the coast, this is seen as many communities are built
near the coast. Proximity of human communities to the coasts and the resources it provides make
the coastline an important area of research because of its dynamism and to be able to plan
management strategies. The changes in shoreline are mostly attributed to wave actions, tides,
winds, periodic storms, sea-level change and geomorphic processes of erosion and accretion and
human activities (Salghuna & Bharathvaj, 2015). Wind processes move fine sand as a result of
wave actions and deposit them along the coasts in different areas (Lawrence, 1996).
Changes in shoreline movements in the last decades are often attributed to climatic conditions due
to sea level rise (Kotinas et al., n.d.). Douglas (1997) and Peltier & Jiang (1997) estimated an
increase of Sea Level up to 1 meter until 2100 and as a result, will have a large impact on coastal
evolution in future (Kotinas et al., n.d.). However, Lawrence (1996) projected future sea level rise
to a level of 2 meters by the year 2100. The point is, if these estimates are to go by, then it should
be expected that more people and communities are to be displaced as a result of sea level rise. One
cause of rising sea levels is global warming and climate change. There has been an observed
warming of the world at an average temperature of 0.85oC between 1880 and 2012 which is
dominantly influenced by anthropogenic factors (Allen et al., 2018). The effect of an averaged
1.5oC of warming experienced global will have profound alterations to human and natural systems
leading to sea level rise, floods, loss of biodiversity and risk to vulnerable persons and populations
(Allen et al., 2018). Coastlines are first to experience the effect of sea level rise as they are in close
proximity to the ocean or sea and low lying and small Islands are bound to be affected as well from

16
eroding and submergent coastlines (Kotinas et al., n.d.). The importance of coastline changes can
never be over emphasized, due to its importance to humans and the flora and fauna and the
ecosystems it supports. A devastating change in coastlines can result in damaging economic
consequences and destruction of a disproportionate number of rare and endangered species found
only in a narrow band along the coast, especially in coastal wetlands habitats (Lawrence, 1996).
Changes in shoreline movements cannot be spoken of without a mention of human factors that
exacerbate these changes through land use. The natural land cover (vegetation: mangroves,
seagrass and salt marshes) not only serve as habitats for many coastal organisms but help to protect
coastlines from erosion. A review of their importance and human effects on coastal changes is
discussed in the next subheading.
3.4 Land use and landcover in coastal areas
3.4.1 Vegetation and mangroves
Resources of the coastal zone provide job opportunities and serve as a source of recreation for
people. The more people migrate to the coast, there is an increase in stresses placed on coastal
zones by the use of limited resources and exceeding its carrying capacity (Lawrence, 1996). There
of found different vegetation cover such as mangroves, sea grass, shrubs and salt marshes in coastal
areas. One of the most important resources found in most tropics and subtropics is mangrove forest.
They are found in sheltered estuaries and along riverbanks and lagoons, the shade and lights they
provide shelter fish and crabs and a source of spawning grounds for most fisheries (FAO, 2007).
Mangroves’ importance in coastal ecosystems range from protection of coastlines, creating habitat
to a variety of coastal flora and fauna to providing socio economic services to the communities in
coastal regions and carbon sequestration. They are also found to be one of the most carbon rich
forests in the world. Donato et al. (2011) found 25 mangrove forests across a broad area of Indo-
Pacific region; where mangrove area and diversity are greatest, to contain an average of 1,023 Mg
carbon per hectare, making mangroves one of the most carbon rich forests types. From this, one
can only imagine how much carbon dioxide, a greenhouse gas, will escape into the atmosphere
owing to deforestation and other anthropogenic activities on mangrove forest.
Carbon sequestration is not the only importance of mangrove forest in the ecosystem, mangroves
are known to protect coastlines from eroding. Thampanya et al. (2006), in their research to find
the factors of propagation of mangroves using Landsat imagery, found a relationship between

17
coastal accretion and mangrove density in specific areas. This may be due to the ability of
mangroves to trap suspended particulate matter from land and sea. The protective ability of
mangrove forest is witnessed by communities closer to them. Badola et al. (2012) explored the
attitude of people towards mangrove forest. They found a higher number of people living close to
mangrove forest were more appreciative of the land erosion prevention function of mangroves.
There is also a relationship between density of mangrove forest and its ability to protect coastlines.
Spalding et al. (2014) found that it may take several kilometers of mangrove forest to have a major
impact to stop any large storm, however one cannot overlook the reality of mangroves’ ability to
offer significant protection to coastlines.
Mangroves are also known to support conservation of biological biodiversity of the coast by
providing habitats and spawning grounds, nursery and nutrients to several animals (FAO, 2007).
One important area is the fisheries mangroves support. They are known to support a wide range of
commercial and non-commercial fish and shellfish. According to FAO (2007), destruction of
mangrove forests has a linear relationship with decrease in fish catch, that, it is estimated that, for
every hectare of forest cleared, nearby coastal fisheries lose some 480 kg of fish per year.
Despite the importance of mangroves to protecting coastlines, conserving biodiversity and
combating global warming through carbon sequestration, their abundance is under threat. This is
mainly due to anthropogenic activities (damming, construction, deforestation etc.) and human
exploitation of services that it provides (firewood, medicine, etc.). Conversion of mangroves to
aquaculture and development of the coastal area into a built environment contribute to the
destruction of mangroves and other coastal vegetation. This has been attributed to the attitude of
policy makers’ and users’ perceptions of the direct use benefits provided by mangroves, gained
from their exploitation, versus the indirect benefits, or ecosystem services, resulting from the
conservation of this system (Badola et al., 2012).
It is estimated that, the extent of mangrove forests has declined by 30-50% over the past half
century as a result of coastal development, aquaculture expansion and over-harvesting (Donato et
al., 2011) and it is argued that mangroves are currently disappearing at the rate of 1-2% annually
(Barbier, 2017). However, not much is said about the state and rate of change of mangroves in
countries with small quantities, sometimes not even included in data on the state of global
mangroves (FAO, 2007). This thesis will highlight on mangroves alongside the overall vegetation
18
cover in the study area and, assess the spatiotemporal changes that have occurred over the years
as a knowledge contribution to this field of study and a basis for further study.
3.4.2 Urbanization/ built-up
There are other anthropogenic driven land use activities that cause changes in the coast. Recreation
and tourism activities on the coast cannot be underestimated for its socioeconomic importance.
Not only that, tourism has its own environmental benefits, by making people appreciate the value
of conservation (Creel, 2003). However, tourism/recreational activities have the potential to effect
changes along the coast. These changes (both in terrestrial and sea ward) may degrade coastal
ecosystems or transform to more developed resilient systems. Creel (2003) also mentions the
effects of urbanization on coastal ecosystems. Often, economic benefits of the coast
(industrialization, settlements) are prioritized compared to its ecological importance. This leads to
conversion of the natural landscape and vegetation, which offer protection to the coastline, into
the built environment.
A typical example of built structures (infrastructures) that occur in most coastal regions, is port
construction. The creation and expansion of ports have economic importance to coastal countries.
Increase ship traffic and increase industrialization around port areas for easy access to raw
materials as well as provision of employment cannot be overlooked. Despite these benefits, the
challenges that result from the vertical and perpendicular expansion of built structures along the
coast need not be overlooked either. Port development causes undesirable erosion and accretion of
the coastline by altering the natural process of littoral drift (Kudale, 2010). Such structures do not
only alter the natural processes of the coast but affect coastal ecosystems as well. An example of
such ecosystems is the coral reef. Coral reefs provide support for coastal fisheries and
economically through tourism and recreation. However, Valadez-Rocha & Ortiz-Lozano (2013)
found adverse effects of port activities on coral reefs. They found direct loss of reefs as a result of
land-filling and perpendicular coastal construction, fragmentation and formation of patches due to
construction activities and long-term modification of coastal dynamics as a result of such activities.
This thesis aims to assess the spatial and temporal changes in urbanization, infrastructure
development and port expansion in the study area. Furthermore, it aims to explore a relationship
between coastal construction and shoreline changes along the longshore drift. Usually, coastal
constructions such as dams, sand barriers, are built with the aim of protecting shoreline movement.

19
However, emphasis may not be given on the effects they may have on sediment transfer and the
natural processes that occur along the coast.
3.5 Methodologies in coastal change studies
The importance of coastal changes to coastal ecosystems and communities have resulted in several
developments in methods to assess these changes. Yu et al. (2011) documented the development
of methodologies for shoreline assessment which began in 1807 by the establishment of the Survey
of the Coast to improve the bathymetry and shoreline maps by President Thomas Jefferson. In
order to avoid navigation problems, topographic maps were created and used by the US Geological
Survey (USGS). Later in 1927 came aerial photography as the primary source of data for shoreline
assessment. Landsat images from USGS have been the recent source of data for shoreline and land
cover change assessments which have been available since the 1970s (Kim et al., 2011;
www.usgs.gov) . These Landsat scenes have been made freely available from the USGS since
2009, allowing easy and free access to historical archived images at 30 m pixel resolution making
it possible to conduct repeated assessment of changes in shoreline movement (Yu et al. 2011;
www.usgs.gov).
Combinations of these data sources have been used to determine shoreline and land cover changes
in previous research (Addo, 2011; Addo et al., 2012; Boateng, 2012; Yu et al., 2011). Ground
truthing and ground control points are often needed to improve the accuracy of the topographic
maps using Global Positioning Systems (GPS) in shoreline change assessments ( Addo, 2009).
Instead of using Ground Control Points (GCP) from GPS observation, remote sensing derived
information, such as percent impervious surface (Xian & Crane, 2005) have also been used to
detect changes in Landcover and Land-use (LCLU). They defined anthropogenic impervious
surfaces as impermeable features like roads, parking lots, rooftops to identify the spatial extent
and intensity of urbanization. The common error to this method is to detect conversion of
vegetation/forest cover to agricultural land, and/or seasonal changes in cultivated land (e.g. fallow
season). However, NDVI image differencing techniques can be used to minimize errors (Masek et
al., 2000). Thus, Normalized Difference Vegetation Index (NDVI) differencing can be applied to
assess urban growth when filtered through landcover classification to remove effects of
agricultural variability (Masek et al., 2000).
Remotely sensed data have proven to be most part reliable, accurate in assessing changes
mangroves (Kovacs et al., 2005). The benefits of using remotely sensed data to assess changes in
20
mangrove are that it protects the health of the plants since the data is not collected in a destructive
manner (Kumar et al. 2012). The use of NDVI differencing has also been used to assess changes
in vegetation cover (Masek et al., 2000). This method could also be applicable in assessing changes
in mangrove if the location of the mangrove forest is known. Simple methodologies like use of
False Color Composite (FCC) images have been used to assess mangrove changes using the Red
Green Blue (RGB) in Landsat TM sensor (Kumar et al. 2012; Twumasi et al. 2017). In such
instances, what is vital is to be able to classify appropriately what constitutes a true mangrove from
a false one (Kirui et al., 2013). I will use and explore the use of such simple methods which can
easily be used and replicated by a GIS technician in a data poor region like Ghana.
Despite the importance of remote sensing data for assessing the changes in the coastal zone, some
high resolution satellite images and aerial photos are expensive to purchase and use for many
countries, especially in developing countries (Addo, 2009; Kirui et al., 2013; Stow et al., 2013).
They can also be time consuming when covering a large area of ground making repeatability
difficult (Warnasuriya et al, 2018). Medium resolution Landsat images have thus been used to
bridge these challenges since they are free and easily accessible and have relatively high temporal
resolution.
This study attempts to address the difficulty that is faced by many developing countries including
Ghana, in terms of data sourcing and availability to assess changes in coastal areas. To achieve
this, freely available medium resolution Landsat images are used. In addition, open data sources
like Google Earth images are also used to assess coastal changes within three areas. Very few
studies have utilized the use of Google Earth satellite images in mapping temporal and spatial
changes in coastal ecosystems. One of the reasons could be that Google Earth images are different
from other remote sensing images as they do not store the reflectance in the form of pixel values
(Warnasuriya et al., 2018). However, this can be achieved by following similar methods used by
Duhl et al. (2012) and Warnasuriya et al. (2018).

21
4 Research Methodology
This chapter explains the detailed description of the methods used in assessing shoreline and land
use/landcover changes of Greater Accra as well as data used.
4.1 Data sources and preprocessing
Combinations of Google Earth and Landsat imagery were used to assess coastal changes that have
occurred in the Greater Accra region of Ghana,
Google Earth and digitizations: Google Earth provides and interactive digital map of the earth (for
example see Figure 3). They are produced from mosaiced satellite images, aerial photographs and
have varying high resolution (i.e. <1 m2) images in most regions (Duhl et al., 2012). Shorelines
from 1986, 1990, 1998, 2008, 2016 and 2018 were digitized in Google Earth. Port areas, lagoons
(Densu delta, Songor Lagoon, Sakumuno lagoon), the Achimota forest, mangrove areas, river
inlets and major roads were all digitized using Google Earth (Figure 1). Also, other infrastructure
developments such as sea defense walls, slum areas, hospitality and major hotels, port expansion
and rocky beaches were digitized using Google Earth. Familiarity of the region and built structures
like ports and lagoons served as ground control points (GCPs) during the digitization. I also relied
on published literature and reports about the geomorphology of the shoreline and news articles of
shoreline change effects of the region to get an overall idea about the geography and morphology
of the coast in the region. This information was useful in accuracy assessment of the digitization
process and expected results.
Shorelines mark the boundary between the aquatic and terrestrial environment, but this boundary
can be fuzzy in nature. Therefore, to assess shoreline changes, one must establish at which line the
boundary falls. The common proxy to define shoreline position in shoreline data is the high water
line (HWL) and describes the highest run-up of the last high tide, identifiable on the beach by the
visually discernible wet/dry line (Jonah et al., 2016). HWL has its own limitations of short-term
variability, however, it is generally deemed as a valid indicator of shoreline position and in some
cases, it may be the only indicator available (Del Río & Gracia, 2013). The high-water line proxy
was chosen as the method to digitize shoreline position in this paper because it was the only
available indicator.
Shorelines were extracted by digitizing the wet/dry line indicating shoreline position along the
coast. The satellite images were adjusted to remove distortions that may be caused by the zoom

22
level of the Google Earth software but at a level that makes it clear and easy to distinguish the
HWL. Dates and years with much cloud cover along the coast were exempted from the analysis
due to the distortions that may affect the digitizing process of the shoreline. All digitized shorelines
were then stored as KML (Keyhole Markup Language) file formats and exported to ArcGIS 10.7.1
software.
The digitized shoreline layers were projected to Universal Transverse Mercator (UTM) projection
(Zone 30N). The layers were then managed in a personal geodatabase in the ArcGIS software.
Figure 3. Google Earth image (2020) of the study area; Greater Accra region
Landsat images: Landsat data was used to study land use/landcover changes in the coastal zone of
Greater Accra because of its availability and accessibility. It has continuously been available since
1972 featuring the first of its sensor (Multispectral scanner), the thematic mapper since 1982, the
enhanced thematic mapper since 1999, and Landsat 8 since 2013, with resolutions that are able to
incorporate specific features for land use and landcover studies (Taubenböck et.al., 2009,
www.usgs.gov). Five Landsat image datasets were used to assess changes in land cover/land use
in the study area, from 1986 to 2017. Landsat 4-5 TM, 7 ETM and 8 OLI-TIRS images were
23
acquired using U.S. Geological Survey (USGS) data acquisition platforms, Glovis and Earth
Explorer (Table 1).
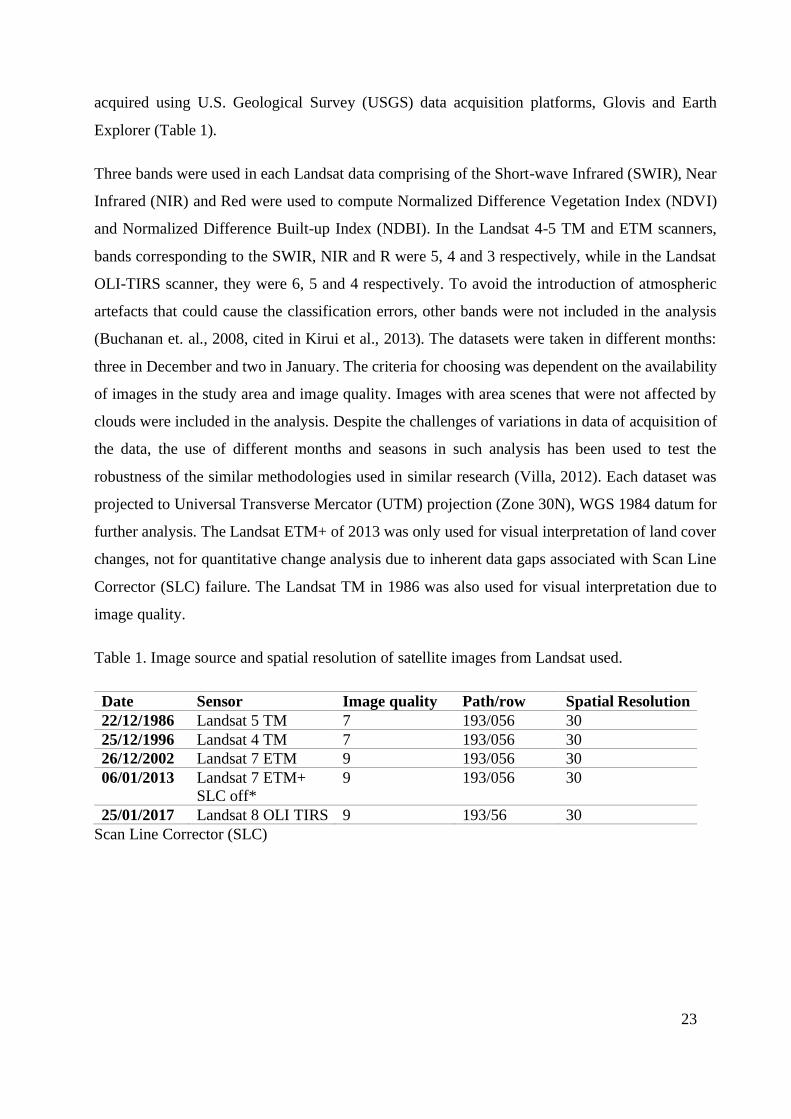
Three bands were used in each Landsat data comprising of the Short-wave Infrared (SWIR), Near
Infrared (NIR) and Red were used to compute Normalized Difference Vegetation Index (NDVI)
and Normalized Difference Built-up Index (NDBI). In the Landsat 4-5 TM and ETM scanners,
bands corresponding to the SWIR, NIR and R were 5, 4 and 3 respectively, while in the Landsat
OLI-TIRS scanner, they were 6, 5 and 4 respectively. To avoid the introduction of atmospheric
artefacts that could cause the classification errors, other bands were not included in the analysis
(Buchanan et. al., 2008, cited in Kirui et al., 2013). The datasets were taken in different months:
three in December and two in January. The criteria for choosing was dependent on the availability
of images in the study area and image quality. Images with area scenes that were not affected by
clouds were included in the analysis. Despite the challenges of variations in data of acquisition of
the data, the use of different months and seasons in such analysis has been used to test the
robustness of the similar methodologies used in similar research (Villa, 2012). Each dataset was
projected to Universal Transverse Mercator (UTM) projection (Zone 30N), WGS 1984 datum for
further analysis. The Landsat ETM+ of 2013 was only used for visual interpretation of land cover
changes, not for quantitative change analysis due to inherent data gaps associated with Scan Line
Corrector (SLC) failure. The Landsat TM in 1986 was also used for visual interpretation due to
image quality.
Table 1. Image source and spatial resolution of satellite images from Landsat used.
Date Sensor Image quality Path/row Spatial Resolution
22/12/1986 Landsat 5 TM 7 193/056 30
25/12/1996 Landsat 4 TM 7 193/056 30
26/12/2002 Landsat 7 ETM 9 193/056 30
06/01/2013 Landsat 7 ETM+
SLC off*
9 193/056 30
25/01/2017 Landsat 8 OLI TIRS 9 193/56 30
Scan Line Corrector (SLC)
24
4.2 Shoreline change analysis
Analysis of shoreline change along the coast of Greater Accra was conducted using the Digital
Shoreline Analysis System (DSAS), a GIS-based software produced by USGS (Thinh & Hens,
2017). DSAS measures the differences between two or more shoreline positions within a time
period and thus forms the basis for calculating shoreline changes (ibid). DSAS provides several
statistical methods that can be useful in assessing shoreline changes, including the End Point Rate
(EPR), Net Shoreline Movement (NSM), Linear Rate of Regression (LRR), Shoreline Change
Envelope (SCE), and Weighted Linear Regression.
NSM reports distance between the oldest and the youngest shorelines for each transect while the
EPR which calculates rates, is produced by dividing the distance of shoreline movement by the
time elapsed between the oldest and the most recent shoreline. The Linear Regression statistic is
determined by fitting a regression line to all shoreline points for a transect. One advantage of LRR
is that all the data are used in its computation, regardless of changes in trend or accuracy (Thieler
et al., 2017).
Three layers were created using DSAS 4.4 tool: shoreline layers which were made into a single
shapefile, a baseline layer created landward to serve as reference to all the shorelines and a transect
layer produced by casting a total of 1364 transects from the baseline at 100 m interval and lengths
of 1000 m (Figure 4). This ensured that all transects crossed the shorelines used in the study. The
Net Shoreline Movement, End Point Rate and Linear Rate of Regression were used to assess the
changes in shoreline position along the coast.
25
Figure 4. Transects showing shoreline intersects.
4.3 Land use/landcover change
4.3.1 Vegetation cover changes
The landcover was mapped to include all vegetation in the coastal region of Greater Accra. This
was done to assess the pattern of changes of vegetation in relation to other land use types such as
built-up. The region has different vegetation made up of coastal shrubs, salt marshes, sea grass,
coconuts, mangroves and other forest types. Different false color composite combinations were
used for visual interpretation of temporal and spatial patterns of vegetation and other land cover
features (for example, Appendix 1).
NDVI values are estimations of chlorophyll content present in vegetation, with higher values
indicating healthy and dense vegetation, while lower values give indication of sparse vegetation
(Hussain et al., 2019). NDVI computation and NDVI image differencing: change detection was
conducted to analyse the vegetation changes in the region.
26
4.3.1.1 Mangrove mapping
For the detailed analysis, I focused on changing mangrove vegetation within built-up areas and
mangrove areas. To detect mangrove areas in the coastal region, mangrove forests were digitized
from Global Forest Watch (GFW) globalforestwatch.org). GFW uses approximately 15,000
Landsat scenes and 1,500 ALOS PALSAR (1×1 degree) mosaic tiles to create image composites
of coastlines where mangroves are expected to exist (globalforestwatch.org). The digitized
mangrove areas were merged to form two mangrove areas i.e. Ada mangroves and Densu delta
mangrove areas (Figure 1). They were then further analysed using NDVI image differencing
techniques (see section 4.4).
4.3.1.2 Computation of NDVI
Landsat scenes were clipped to the study area to assess changes in landcover/vegetattion along the
coast. To measure these changes, the Normalized Difference Vegetation Index (NDVI) was
computed for three separate datasets (1996, 2002, and 2017). NDVI has normally been used to
assess changes in vegetation (Tucker, 1979). To derive NDVI, the following equation was used:
NDVI= (NIR - R)/(NIR + R)
Where in Landsat TM and ETM, near infrared (NIR) is Band 4 and Red (R) is Band 3
And for Landsat 8 OLI-TIRS, NIR is Band 5 and R is Band 4.
4.3.2 Land use (urbanization and built environment)
I used the Normalized Difference Built-up Index (NDBI) to map the built-areas in Greater Accra.
Urbanization in non-arid regions like in Accra, is known to replace vegetation (High NDVI) with
built environment (Low NDVI), with sudden decreases in NDVI implying urban development
(Masek et al., 2000). Thus, there is a relationship between vegetation changes and built-up
environment. However, to derive changes in built up, different equations and band combinations
were used. The Short-Wave Infrared (SWIR) and Near Infrared (NIR) bands in each Landsat image
were used to calculate their relative Normalized Difference Built-in Index (NDBI). Following
Hussain et al. (2019), NDBI was calculated using the equation:
NDBI = (SWIR – NIR)/ (SWIR + NIR)
Where SWIR and NIR represent Band 5 and 4 in the TM and ETM+ sensors and Band 6 and Band
5 in the Landsat 8 sensor respectively.

27
Using several threshold values and visual interpretation of the Landsat color composite images
and Google Earth images, NDBI values greater or equal to 0.2 were found best and used to classify
and identify built-up areas. NDBI changes were then calculated by subtracting the first date image
from the second date image to assess temporal changes in urban development. High NDBI values
meant increase in built-up and lower values meant decrease in built-up.
Three images of built-up areas were produced using 1996, 2002 and 2017 (Figure 12). The output
images were used in image differencing and change detection techniques to produce final change
maps.
4.4 Change detection
The NDVI for 1996, 2002 and 2017 were reclassified using a threshold value of 0.1 to highlight
only vegetation areas within the study area. A combined image showing the extent of vegetation
between 1996 to 2017 was produced (Appendix 2). Subsequent images derived from NDVI
calculations were subjected to NDVI differences by subtraction to derive a map of NDVI change
in which positive value represents ‘greening’ (increased vegetation) and negative value represent
‘browning’ (decreased vegetation) and values near zero represent no change (Masek et al., 2000).
Three images were produced: 1996-2002, 2002-2017 and 1996-2017. The resulting images from
image differencing technique was subjected to visual interpretation (Muttitanon & Tripathi, 2005).
To enhance the changes within the classified vegetation areas, a post-classification technique was
employed using standard deviation threshold. Three images were produced: 1996-2002, 2002-
2017 and 1996-2017. The post-classification technique was conducted based on widely used
standard deviation (σ) threshold value following methodology similar to Mancino et al. (2014). In
this classification method, threshold value for different classes were defined as μ ± n·σ: where μ
represents the change NDVI pixels digital number mean, and σ the standard deviation. The n factor
defines the range of dispersion around the mean (Mancino et al., 2014). n factor of 2 was used to
compute threshold values in this study. 2 σ has been used to determine anthropogenic land use
changes (Jomaa and Keir, 2003) and reported as the optimal threshold value for two sites in
Lebanon.
The images produced were similar to images produced using NDVI differencing, however, this
technique highlighted detailed spatiotemporal changes within the vegetation along the coast. The
changes were then reported as percentages, graphs, areas and mean NDVI change values. Same
methodology was followed to compute NDVI differences in mangrove areas. The three images

28
produced i.e. 1996-2002, 2002-2017 and 1996-2017 were then subjected to change detection
techniques using the standard deviation (σ) to quantify the changes.
29
5 Results
5.1 Shoreline Change
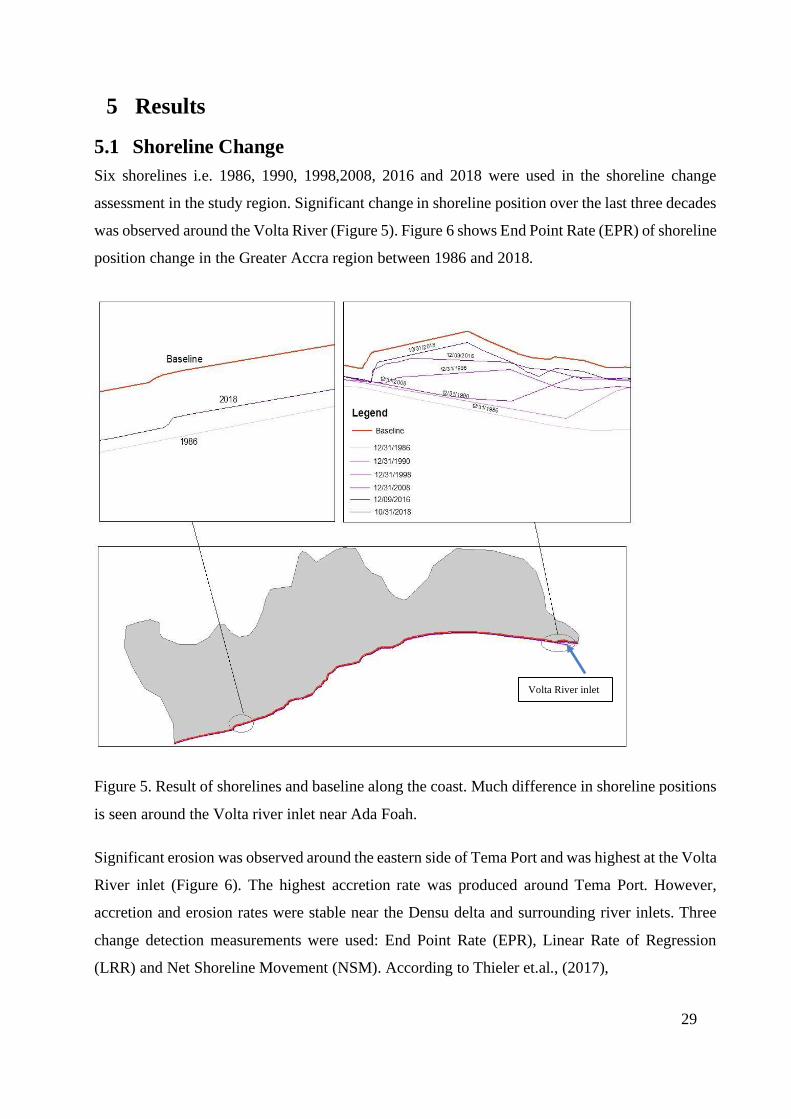
Six shorelines i.e. 1986, 1990, 1998,2008, 2016 and 2018 were used in the shoreline change
assessment in the study region. Significant change in shoreline position over the last three decades
was observed around the Volta River (Figure 5). Figure 6 shows End Point Rate (EPR) of shoreline
position change in the Greater Accra region between 1986 and 2018.
Figure 5. Result of shorelines and baseline along the coast. Much difference in shoreline positions
is seen around the Volta river inlet near Ada Foah.
Significant erosion was observed around the eastern side of Tema Port and was highest at the Volta
River inlet (Figure 6). The highest accretion rate was produced around Tema Port. However,
accretion and erosion rates were stable near the Densu delta and surrounding river inlets. Three
change detection measurements were used: End Point Rate (EPR), Linear Rate of Regression
(LRR) and Net Shoreline Movement (NSM). According to Thieler et.al., (2017),
Volta River inlet
30
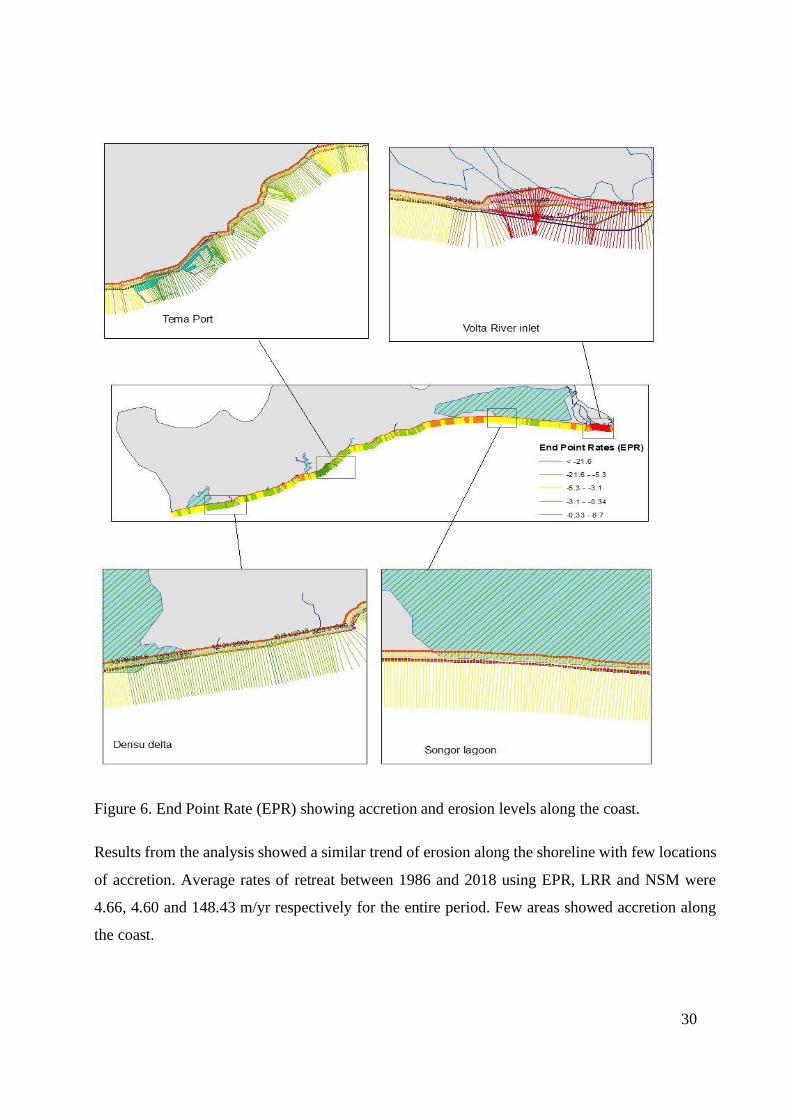
Figure 6. End Point Rate (EPR) showing accretion and erosion levels along the coast.
Results from the analysis showed a similar trend of erosion along the shoreline with few locations
of accretion. Average rates of retreat between 1986 and 2018 using EPR, LRR and NSM were
4.66, 4.60 and 148.43 m/yr respectively for the entire period. Few areas showed accretion along
the coast.
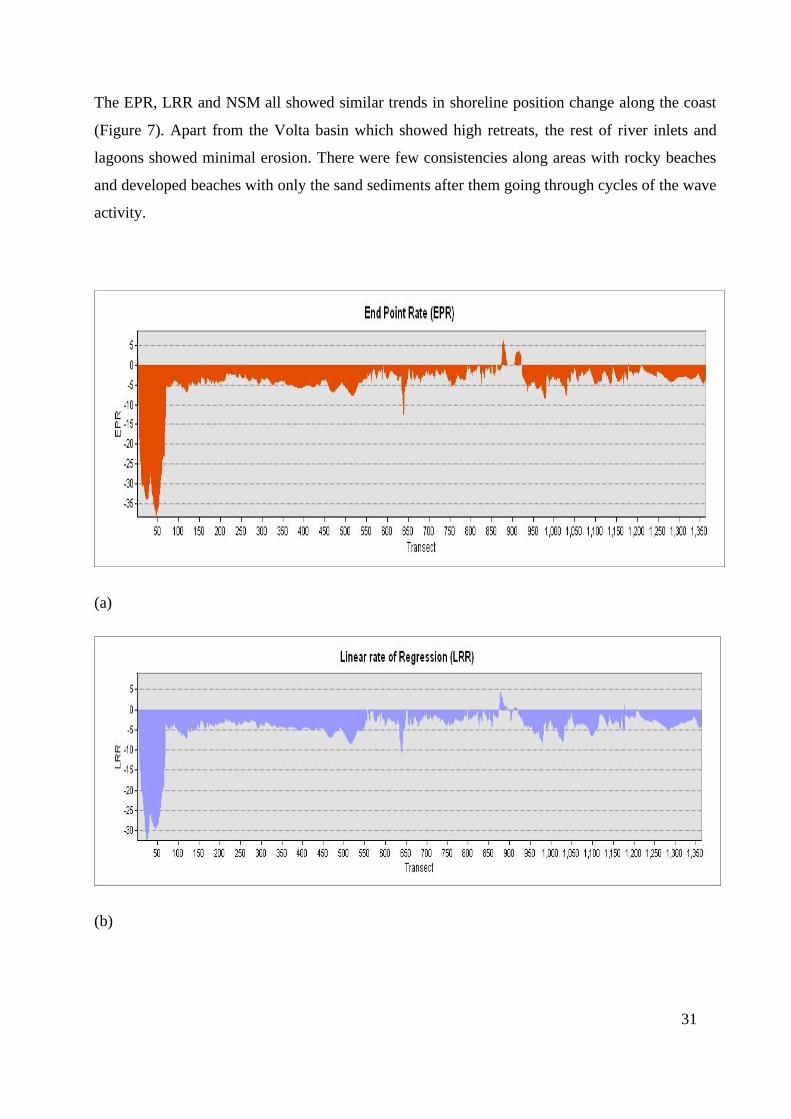
31
The EPR, LRR and NSM all showed similar trends in shoreline position change along the coast
(Figure 7). Apart from the Volta basin which showed high retreats, the rest of river inlets and
lagoons showed minimal erosion. There were few consistencies along areas with rocky beaches
and developed beaches with only the sand sediments after them going through cycles of the wave
activity.
(a)
(b)

32
(c)
Figure 7. Graphs showing comparison of erosion and accretion along the coast: a) EPR b) LRR
and c) NSM.
5.2 Land use/landcover changes
5.2.1 Vegetation/NDVI change
Significant changes in vegetation were observed in image differencing between 1996 and 2017.
The results after NDVI image differencing show a decrease in vegetation cover in areas closer to
the coast between 1996 and 2002. However, decreases in vegetation can be observed in farther
distances away from the coast between 2002 and 2017. General changes in vegetation pattern are
seen between 1996 and 2017, with major decreases close to the coast of Greater Accra. Three
images were produced: between 1991 and 2017, between 1996 and 2002 and between 2002 and
2017, were derived in the study area (Figure 8).
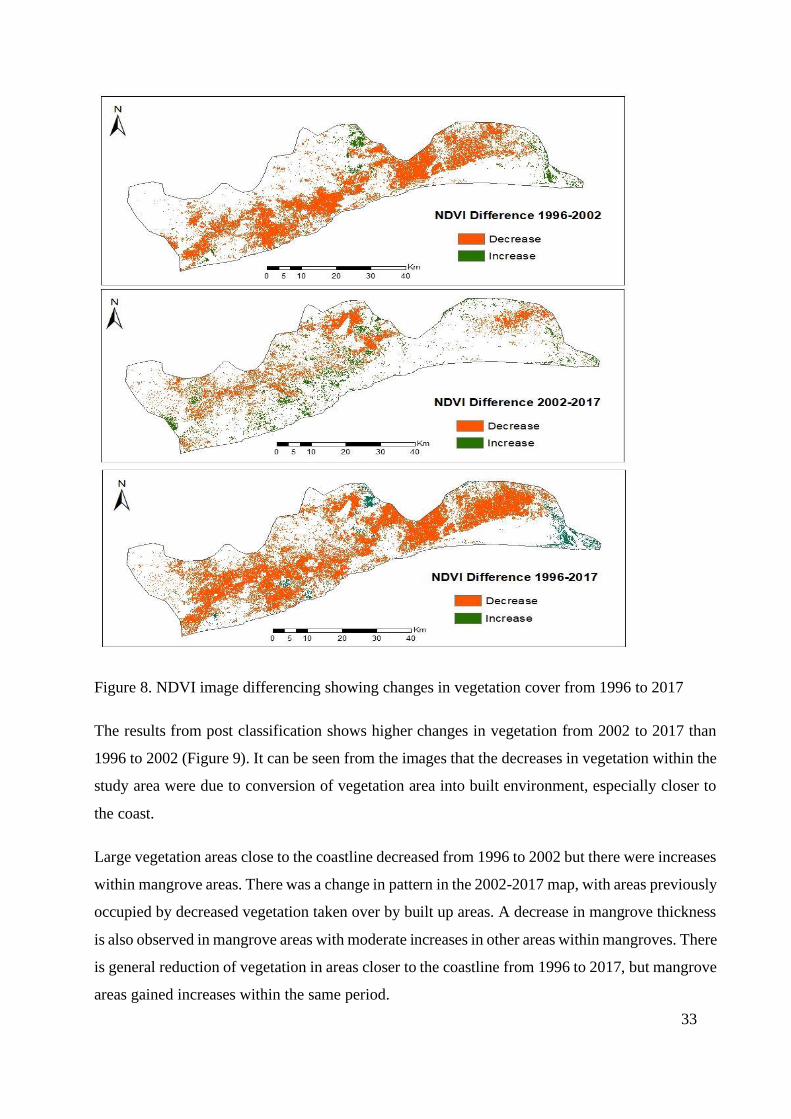
33
Figure 8. NDVI image differencing showing changes in vegetation cover from 1996 to 2017
The results from post classification shows higher changes in vegetation from 2002 to 2017 than
1996 to 2002 (Figure 9). It can be seen from the images that the decreases in vegetation within the
study area were due to conversion of vegetation area into built environment, especially closer to
the coast.
Large vegetation areas close to the coastline decreased from 1996 to 2002 but there were increases
within mangrove areas. There was a change in pattern in the 2002-2017 map, with areas previously
occupied by decreased vegetation taken over by built up areas. A decrease in mangrove thickness
is also observed in mangrove areas with moderate increases in other areas within mangroves. There
is general reduction of vegetation in areas closer to the coastline from 1996 to 2017, but mangrove
areas gained increases within the same period.

34
Figure 9. Threshold NDVI difference maps a) 1996-2002, b) 2002-2017, c) 1996-2017
a b
c
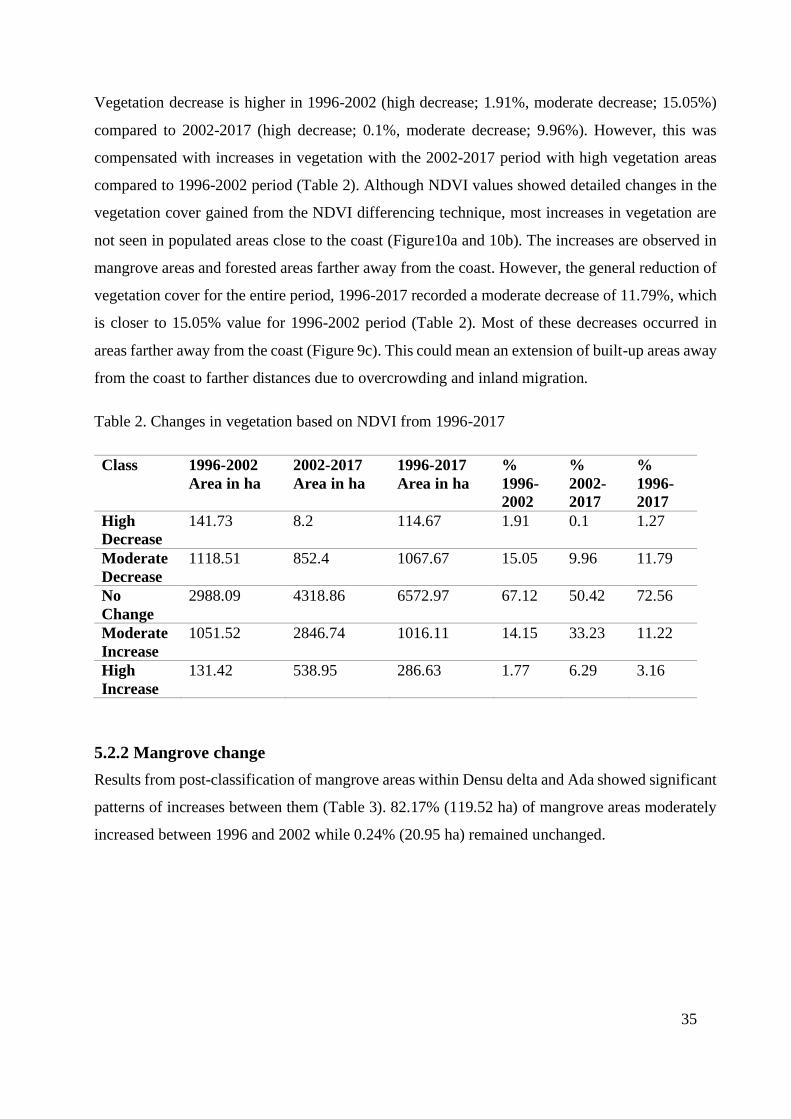
35
Vegetation decrease is higher in 1996-2002 (high decrease; 1.91%, moderate decrease; 15.05%)
compared to 2002-2017 (high decrease; 0.1%, moderate decrease; 9.96%). However, this was
compensated with increases in vegetation with the 2002-2017 period with high vegetation areas
compared to 1996-2002 period (Table 2). Although NDVI values showed detailed changes in the
vegetation cover gained from the NDVI differencing technique, most increases in vegetation are
not seen in populated areas close to the coast (Figure10a and 10b). The increases are observed in
mangrove areas and forested areas farther away from the coast. However, the general reduction of
vegetation cover for the entire period, 1996-2017 recorded a moderate decrease of 11.79%, which
is closer to 15.05% value for 1996-2002 period (Table 2). Most of these decreases occurred in
areas farther away from the coast (Figure 9c). This could mean an extension of built-up areas away
from the coast to farther distances due to overcrowding and inland migration.
Table 2. Changes in vegetation based on NDVI from 1996-2017
Class 1996-2002
Area in ha
2002-2017
Area in ha
1996-2017
Area in ha
%
1996-
2002
%
2002-
2017
%
1996-
2017
High
Decrease
141.73 8.2 114.67 1.91 0.1 1.27
Moderate
Decrease
1118.51 852.4 1067.67 15.05 9.96 11.79
No
Change
2988.09 4318.86 6572.97 67.12 50.42 72.56
Moderate
Increase
1051.52 2846.74 1016.11 14.15 33.23 11.22
High
Increase
131.42 538.95 286.63 1.77 6.29 3.16
5.2.2 Mangrove change
Results from post-classification of mangrove areas within Densu delta and Ada showed significant
patterns of increases between them (Table 3). 82.17% (119.52 ha) of mangrove areas moderately
increased between 1996 and 2002 while 0.24% (20.95 ha) remained unchanged.

36
Figure 10. land use/landcover changes in Ada area mangroves between 1996 and 2017
Most mangrove areas remained unchanged between 2002 and 2017 (92.63%), with very few
increases: moderate increase; 4.58% and high increase; 2.78% in Ada area. Significant increase of
96.74% was observed between 1996 and 2017 in the Ada mangrove area (Figure 10).
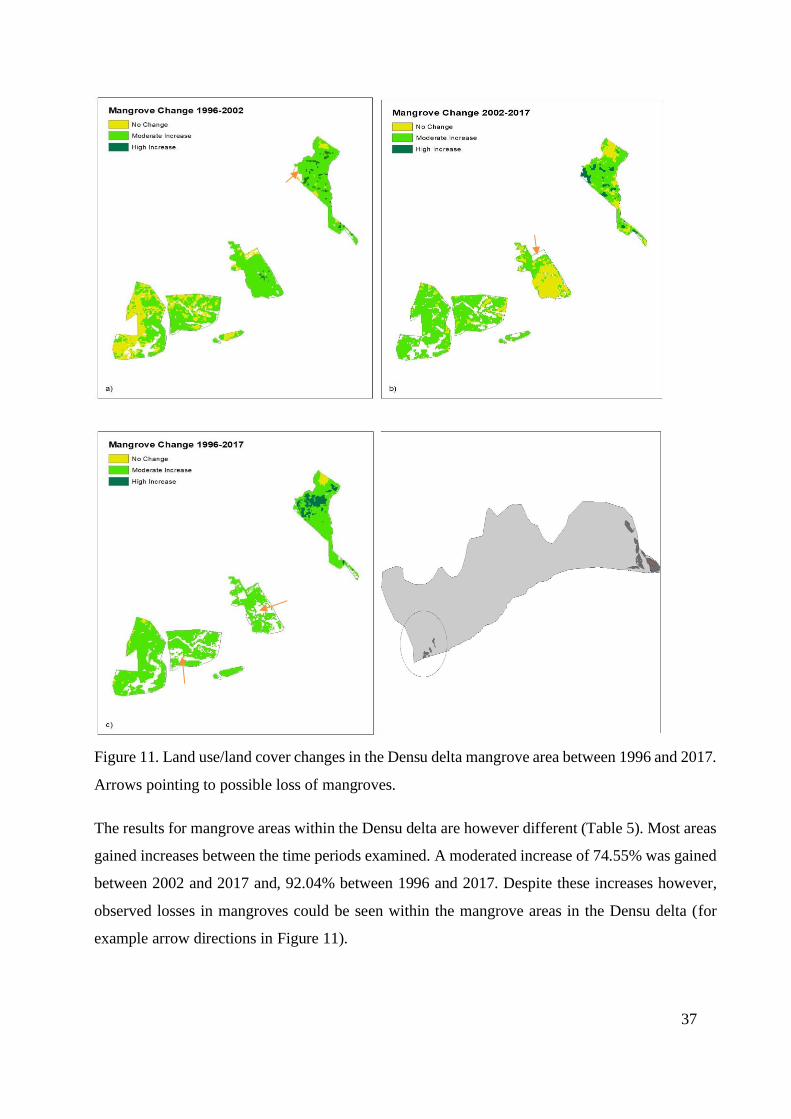
37
Figure 11. Land use/land cover changes in the Densu delta mangrove area between 1996 and 2017.
Arrows pointing to possible loss of mangroves.
The results for mangrove areas within the Densu delta are however different (Table 5). Most areas
gained increases between the time periods examined. A moderated increase of 74.55% was gained
between 2002 and 2017 and, 92.04% between 1996 and 2017. Despite these increases however,
observed losses in mangroves could be seen within the mangrove areas in the Densu delta (for
example arrow directions in Figure 11).

38
Class Area in ha
1996-2002
Area in ha
2002-2017
Area in ha
1996-2017
%
1996-
2002
%
2002-
2017
%
1996-
2017
No change 20.95 129.00 0.24 14.40 92.63 0.19
Moderate
increase
119.52 6.38 125.51 82.17 4.58 96.74
High
increase
4.99 3.88 3.99 3.43 2.78 3.08
Table 3. Mangrove changes in Ada between 1996 and 2017
Class Area in ha
1996-2002
Area in ha
2002-2017
Area in ha
1996-2017
%
1996-
2002
%
2002-
2017
%
1996-
2017
No change 4.70 4.02 0.40 24.84 22.57 2.43
Moderate
increase
13.79 13.29 15.13 72.92 74.55 92.04
High
increase
0.42 0.51 0.91 2.24 2.88 5.53
Table 4. Mangrove changes in Densu delta between 1996 and 2017
5.2 NDBI change detection
Spatiotemporal changes in built-up were observed from the results produced from NDBI
calculation. NDBI was high at the coast in 1996, started increasing and moving outwards in 2002
and had increased into the peri-urban centers and villages in the region that are not close to the
coast in 2017 (Figure 12). The total area of built-up base on NDBI for 1996, 2002 and 2017 were
111.30km2, 110.13km2 and 618.34km2 respectively.

39
Figure 12. Change in built-up areas in Accra: a) 1996, b) 2002 and c) 2017. Built-up areas are
represented with brown color in the maps.
Detailed changes in built-up in the area from the post-classification of NDBI differencing produced
three images: 1996-2002, 2002-2017 and 1996-2017 (Figure 13). They were classified into three
classes: No Change, Moderate Increase and High Increase. Increases in built-up areas were
significant from 1996 to 2017. Increases were seen in the period of 1996-2002, however most areas
remained the same in 2002-2017. But new areas were converted to built-up especially in Accra in
the same period (Figure 13). Large areas that remained unchanged were bare soils and farmlands.
a
b
c
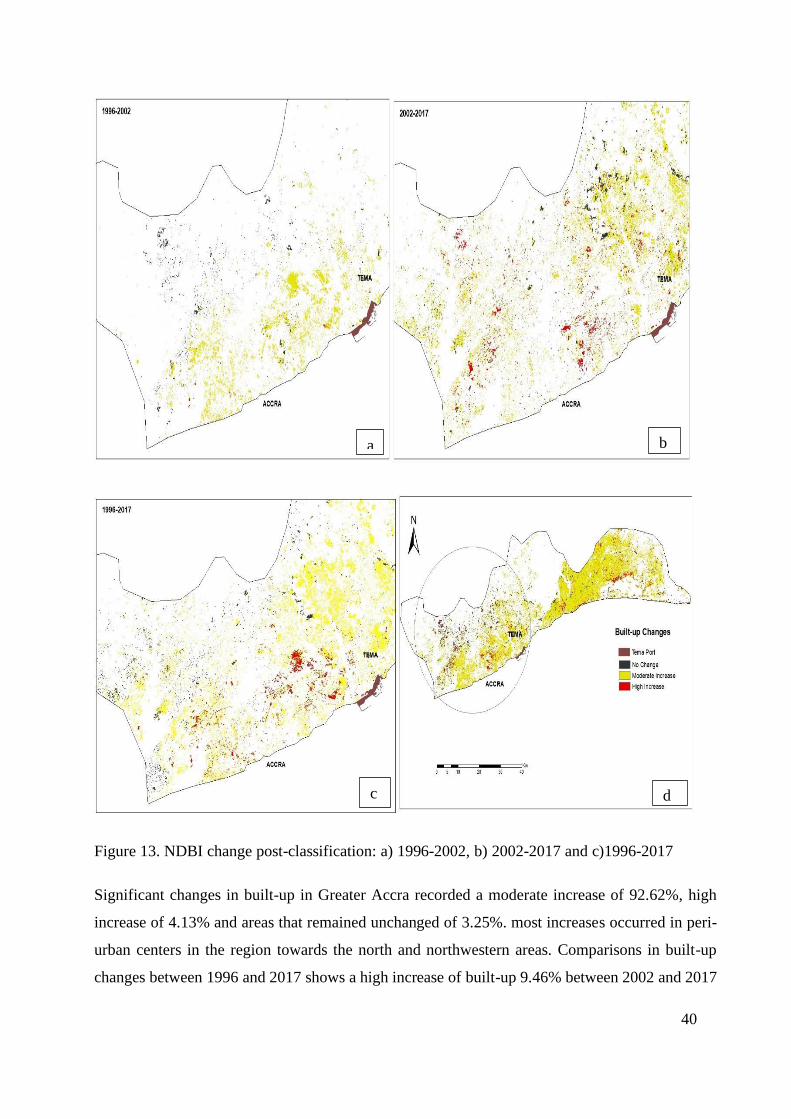
40
Figure 13. NDBI change post-classification: a) 1996-2002, b) 2002-2017 and c)1996-2017
Significant changes in built-up in Greater Accra recorded a moderate increase of 92.62%, high
increase of 4.13% and areas that remained unchanged of 3.25%. most increases occurred in peri-
urban centers in the region towards the north and northwestern areas. Comparisons in built-up
changes between 1996 and 2017 shows a high increase of built-up 9.46% between 2002 and 2017
a b
c d
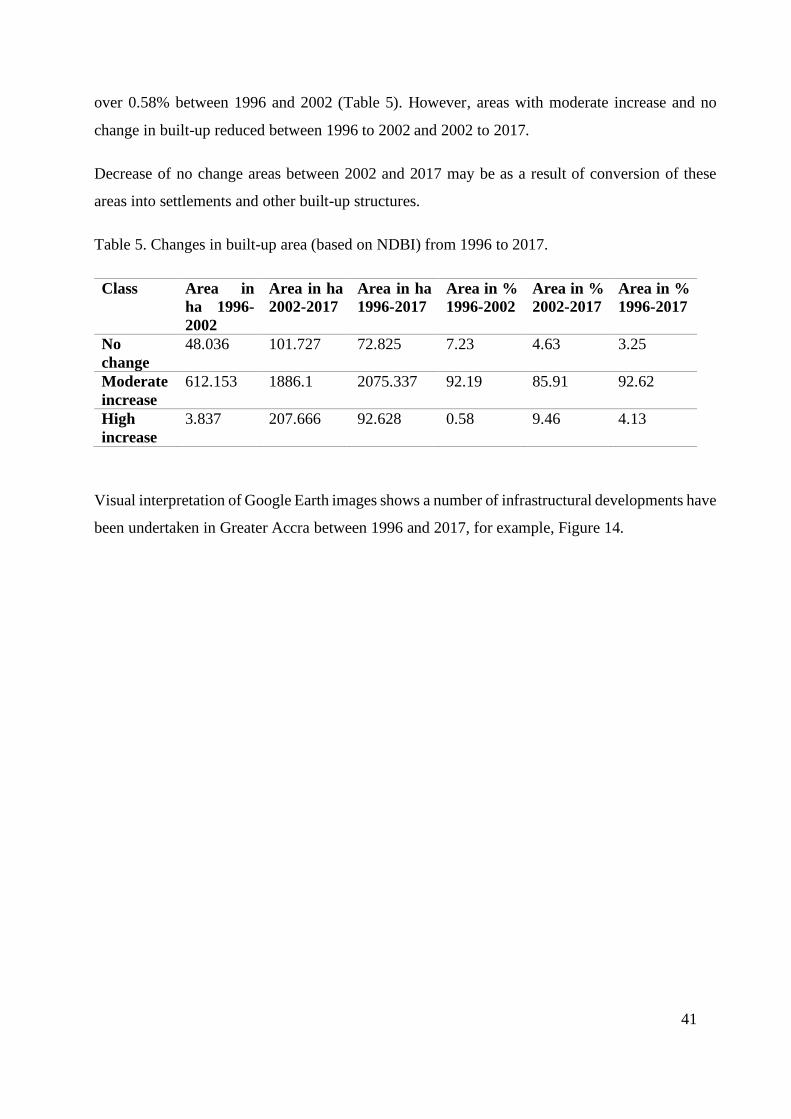
41
over 0.58% between 1996 and 2002 (Table 5). However, areas with moderate increase and no
change in built-up reduced between 1996 to 2002 and 2002 to 2017.
Decrease of no change areas between 2002 and 2017 may be as a result of conversion of these
areas into settlements and other built-up structures.
Table 5. Changes in built-up area (based on NDBI) from 1996 to 2017.
Class Area in
ha 1996-
2002
Area in ha
2002-2017
Area in ha
1996-2017
Area in %
1996-2002
Area in %
2002-2017
Area in %
1996-2017
No
change
48.036 101.727 72.825 7.23 4.63 3.25
Moderate
increase
612.153 1886.1 2075.337 92.19 85.91 92.62
High
increase
3.837 207.666 92.628 0.58 9.46 4.13
Visual interpretation of Google Earth images shows a number of infrastructural developments have
been undertaken in Greater Accra between 1996 and 2017, for example, Figure 14.
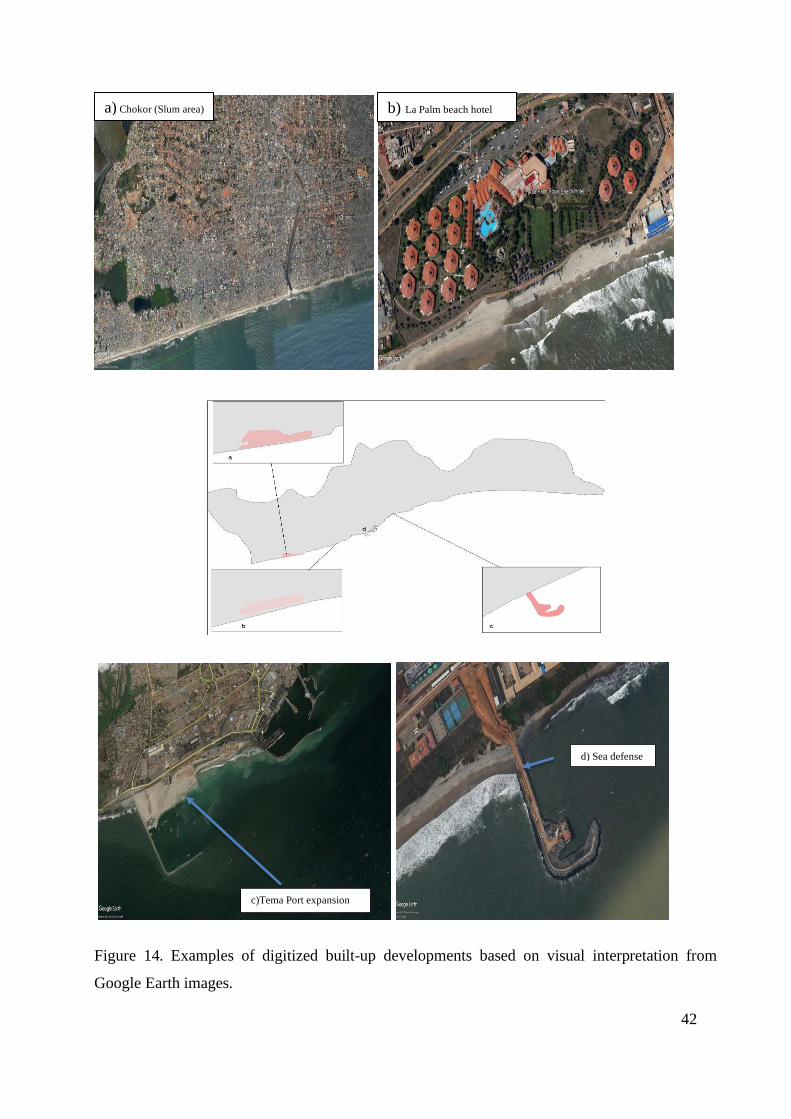
42
Figure 14. Examples of digitized built-up developments based on visual interpretation from
Google Earth images.
b) La Palm beach hotel a) Chokor (Slum area)
c)Tema Port expansion
d) Sea defense
43
6 Discussion
6.1 Shoreline Changes
The first objective of this study was to assess shoreline changes along the coast of Greater Accra
from 1986 to 2018. The aim was not only to gain knowledge about the changes that have occurred,
but also to assess the effectiveness of sea defense and impact construction projects in protecting
the shoreline from erosion. River inlets and lagoon inlets also served as key areas in their
contribution to shoreline changes. The results showed spatial differences between accretion and
erosion areas of the shoreline. Major findings showed significant amount of retreat on the eastern
side of Greater Accra coast, in areas after sea defense walls have been constructed, near Ada. The
erosion of the shoreline follows along the entire coastline. Boateng (2012) found a total land loss
of 46.5 ha per year along the eastern coast, a combined total of 18.3 ha of land lost within the
central coast and a slightly land gained of 0.23 ha within the western coast, mainly due to the
geological properties of the coast within this area. Even with that, a 0.23ha gained shows periods
of recession within the study period, confirming the recession rates by other research (Jonah &
Boateng et al., 2016; Mensah et al., 2016). These results seem quite consistent with the findings
of Boateng (2012) in which the rate of retreat was about 5 m/yr. However, the analysis consisted
of different areas within the study area studied. The results are similar to studies conducted in areas
near the Volta River estuary, with some parts recording between 3.5m/yr to 9m/yr of erosion (Addo
et al., 2012).
This may support the fact that, littoral movement along the Gulf is from the central to the eastern
part of the coast (Figure 2), and thus contributes to sediment transfer in the area. Most of the
defense walls were constructed across the direction of net longshore sediment transport. Erosion
was higher after these cross-defense constructions. This affirms the notion that longshore drift
transport sediments and dispose in other parts of the coast resulting in accretion in these areas
(Esteves et al., 2002; Ly, 1980). Thus, the construction of sea defense systems like ridges across
sediment transport will result in starving areas downstream with needed sediments to fill up its
coast (Addo et al., 2012) (Figure 15). Port construction along the coast has also been documented
to contribute to shoreline erosion. According to Valadez-Rocha & Ortiz-Lozano (2013), port
construction and growth throughout history has changed patterns of sediment transport and
modified shore currents. The expansion of Tema port resulted in landfills over a large area and
that could be key to blocking sediment transport along the coast (Ghana Ports & Harbours
Authority, n.d.) ( for example Figure 14c). High erosion rates at the Volta River estuary (Figure

44
6) could be attributed to starvation of sediment influx upstream due to the dam construction and
other human activities like irrigation and from longshore drift (Ly, 1980). This implies that coastal
constructions like sea defense structures and ports do not only have socio economic significance
on the coast but have geomorphological and natural consequences (for example Figure 14).
Figure 15. Example of sea defense structures constructed across the direction of sediment
transport. Source: Google Earth, 2020
Another factor that might have contributed to the high shoreline retreat approaching the eastern
coast is the wave activity in the area. The area near Ningo-Prampram towards the east of Ghana’s
coast is considered as High energy beach, however characterized by sandy beaches (Boateng,
2012; Ly, 1980). This makes it susceptible to erosion. Thus, any disruption in sediment inputs
from the lagoons and river inlets as well as longshore drift blockage, will result in erosion of the
sands and sediments from the coast.
This trend was however different on the western coast of Greater Accra, with significantly low
erosion rate compared to other parts of the coast. Possible reasons are due to the rock formation of
the coast and sea defense systems along its coast (Addo, 2011). It was observed that the sea defense
systems proved to be more effective in combating erosion in western coast than on the eastern
coast of Greater Accra. A possible explanation to this, is the wave activity and the geomorphology
of the coast in the area. The west coast is part of the Central coast of Ghana’s shoreline (Ly, 1980),
Sea defense
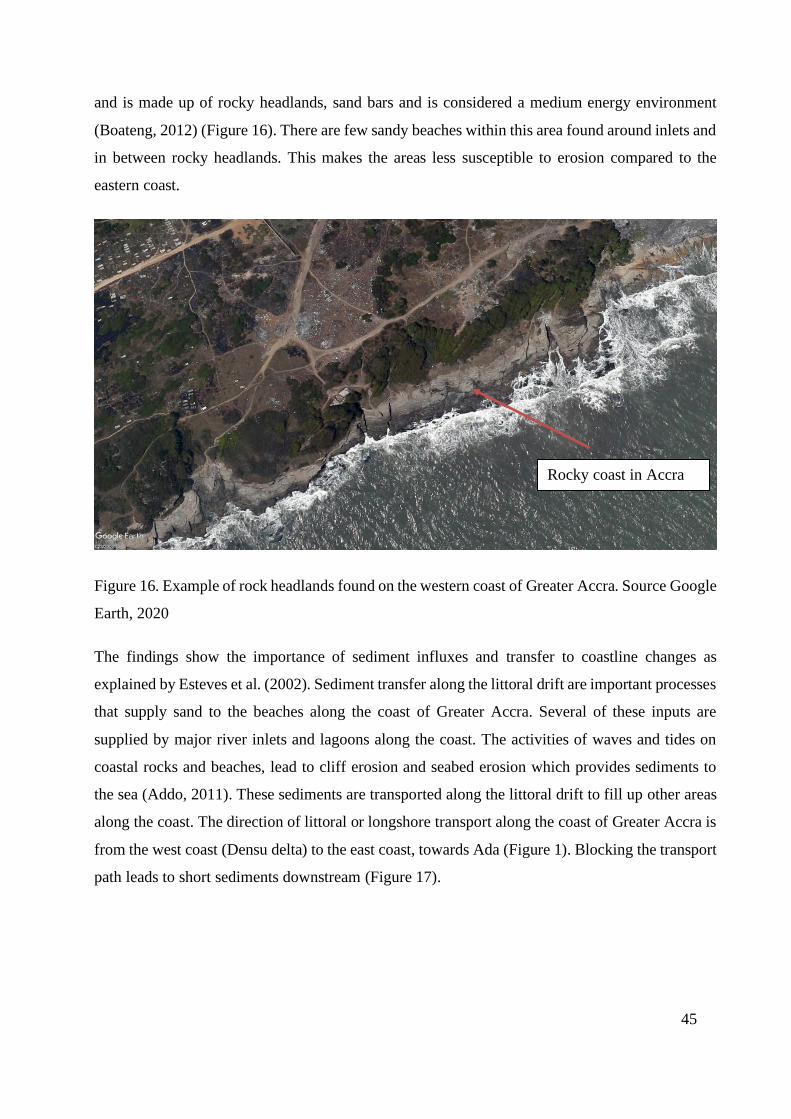
45
and is made up of rocky headlands, sand bars and is considered a medium energy environment
(Boateng, 2012) (Figure 16). There are few sandy beaches within this area found around inlets and
in between rocky headlands. This makes the areas less susceptible to erosion compared to the
eastern coast.
Figure 16. Example of rock headlands found on the western coast of Greater Accra. Source Google
Earth, 2020
The findings show the importance of sediment influxes and transfer to coastline changes as
explained by Esteves et al. (2002). Sediment transfer along the littoral drift are important processes
that supply sand to the beaches along the coast of Greater Accra. Several of these inputs are
supplied by major river inlets and lagoons along the coast. The activities of waves and tides on
coastal rocks and beaches, lead to cliff erosion and seabed erosion which provides sediments to
the sea (Addo, 2011). These sediments are transported along the littoral drift to fill up other areas
along the coast. The direction of littoral or longshore transport along the coast of Greater Accra is
from the west coast (Densu delta) to the east coast, towards Ada (Figure 1). Blocking the transport
path leads to short sediments downstream (Figure 17).
Rocky coast in Accra

46
Figure 17. Example of sea defense structure across the direction of sediment transport showing
erosion behind it. Direction is from left to right. Source: Google Earth, 2020
Many sediment inlets could be observed within the study area. The key ones are the Densu delta,
Sakumuno lagoon, Songor lagoon and the Volta river estuary near Ada. These inlets however face
different challenges in their sediment supply. Construction activities like dams across rivers
(Densu and Volta) and rechanneling rivers for irrigation purposes result in blocking sediment
transfer from upstream to the shores of the coast (Addo, 2011). Reduction in water volume in
lagoons and rivers also block the inlets from transporting sediments downstream (ibid). Thus,
sediment transfer along the coast is usually as a result of cliff erosion of soft rocks on the western
area of Greater Accra. These factors have contributed to shoreline retreat along the coast of Greater
Accra.
Aside from the physical factors contributing to coastal erosion of the coast of Ghana,
anthropogenic activities have had profound effects on shaping the coast. The central coast is the
most developed among the three subdivisions and hosts the capital of Ghana, Accra (Boateng,
2012). The development and expansion of the two international ports in Ghana; Tema and
Tarkoradi ports (Ghana Ports & Harbours Authority, 2020) has an effect on littoral drift which
results in moving sand particles from one place to fill another. Increase in population and industrial
erosion
Sea defense

47
projects along the coast has also contributed to destruction of coastal ecosystems that contribute
to protection of the coast.
Due to the severity of effects of shoreline retreat on coastal communities and economy, many
projects have been conducted to protect the coast (Campbell, 2006). Construction of sea defense
walls along and across the coasts are visible as one traverses the coast of Greater Accra. Most of
these sea defense projects are also found in erosion hotspots from the west of Ghana’s coast to the
east. There has recently begun construction of a sea defense wall on the shores of Ningo-
Prampram, a district within Greater Accra (constructionreviewonline.com.). Despite these
measures, the coast of Greater Accra continues to suffer from shoreline erosion. There are also
coastal buffers that lie between the sea and developed areas. According to Boateng (2012), these
buffers are about 100 to 300 m wide strip, which have been there for several years and have been
a protective shield against natural causes of shoreline retreat. However, recent developments on
these buffers by real estate and hospitality firms have made them susceptible to the effect of
shoreline retreat. Another problem contributing to erosion is sand mining of sandy beaches along
the shore for construction purposes (Addo, 2011). Unemployment within the area has resorted
many people into sand mining and selling to locals and companies for construction (Addo, 2011;
Boateng, 2012). The result is reduced sand to fill beaches where there could be possible erosion
from wave action.
The findings of this study show that anthropogenic and natural factors, such as waves, tides, run-
up, coastal constructions, sand mining etc., are the driving factors of shoreline change. The changes
in shoreline positions are time-dependent and fluctuate from short to long-term and thus the need
to factor time variables in the holistic coastline erosion management purposes (Jonah et al., 2016).
The interest in the coast of Greater Accra by real estate operators, hospitality firms and locals who
operate sand mining on the coast result in anthropogenic influences on it. To effectively manage
the social or human component and the natural components that support the coastline, requires an
integrated management approach. A holistic management approach can lead to a long-term
sustainability of Greater Accra shoreline.
6.2 Land use/landcover changes
The second objective of the study was to assess land use and land cover changes of the Greater
Accra region. There were significant spatial and temporal changes in land use and land cover in

48
the region. There were compelling reasons to believe a relationship between built-up and
vegetation cover in the coast zone.
6.2.1 Vegetation and mangrove change
To understand the vegetation cover pattern, a general vegetation and a separate mangrove area
assessment of changes were conducted in the region. Findings showed spatial and temporal
increases and decreases in vegetation cover in the study area. Vegetation cover significantly
declined in the last decade years compared to 1986 and 1996. The findings showed a reduction of
vegetation (high decrease 1.91%, moderate 15.05%, moderate increase 14.15, and high increase
1.77) cover between 1996 to 2002. Most of the vegetation reduction occurred closer to the coast
of Accra and Tema areas. This may be due to increasing population and non-residential built-up
developments, like industrial and commercial areas (Akubia & Bruns, 2019) and the rise of
hospitality firms such as Labadi Beach Hotel, La Palm Royal Beach Hotel (Boafo et al., 2014).
Industrialization and commercialization of the coast have led to migration of people along the
coast where they are more likely to find jobs. Most of the communities on the shore of Greater
Accra are traditional communities that hold the property rites of houses and lands to their families.
The effect of this type of traditional ownership coupled with migration is the rise of many slums
in those areas (Figure 14a). Stow et al. (2013) have also found a similar pattern of decreasing
vegetation cover within slum-like areas in the communities along the coast in Accra and
conversion of vegetation into small residential structures in later years.
The results show that, though most of the vegetation cover within Accra and Tema remained stable
between 2002 and 2017, decrease in vegetation continued in the peri-urban communities of the
region i.e. north and northwest (Figure 9). Areas like west of the region which were predominately
forests (Addae & Oppelt, 2019) had been converted to residential buildings and settlements. A
common reason could be attributed to over population and choking of the business centers in Accra
and Tema. Peri-urban growth results in the conversion of agricultural lands, pastures and forest
into urban areas (Akubia, 2016), a challenge currently facing the region.
Analysis of mangrove forested areas showed a general increase of mangrove forest between 1996
to 2017. However, there were considerable differences both spatially and temporally between
mangroves in the Densu delta and Volta River estuary. There were losses of mangrove within the
Densu delta. A possible explanation may be attributed to encroachment and built-up in the Densu
delta. It is important to note that the Densu delta is located within the busy and commercial area

49
in Accra. Studies have shown impacts communities have on mangroves through expansion and
exploitation for medicine, fire wood, and farming (Mensah & Track, 2013). However, to the best
of my knowledge, there has been limited research on mangroves in the Greater Accra region to
refer to.
Mangrove forests have been identified as important habitats for terrestrial and marine fauna,
breeding grounds for many marine fisheries (Nortey et al., 2016). The biological make-up of most
mangrove species increases sedimentation by taking advantage to colonize newly deposited
intertidal sediments (Blasco et al., 1996). Despite the benefits of mangroves to providing social,
economic and ecological returns to coastal communities, mangroves in the Greater Accra region
have undergone considerable changes. There have been reports on rainfall decreases as a result of
mangrove disappearance causing bushfires in certain mangrove communities in Ghana
(germanyinafrica.diplo.de., n.d.). Mangrove development should be an integral part of coastal
resource management in Greater Accra and Ghana as a whole.
The steady increment of mangroves in Ada on the eastern coast of the region (Figure 9) can be
attributed to awareness creation and empowering the communities about the importance of
mangroves. Education on the significance of mangrove forest to contribute to clean air and
alleviate certain diseases have resulted in many in communities, especially women, to partake in
mangrove replanting. According to a report cited in allAfrica.com (n.d.) on a project by Hen
Mpoano, one woman recounted, ‘as women, we take care of our husband and children when they
are ill so we thought we should seize this opportunity to engage in this as health insurance for our
families’. The communities experienced increases in catch of fish and shrimp and acknowledged
the positive results of replanting. Support from the Forestry Commission of Ghana to supply
mangrove seedlings to certain communities in the Volta River estuary has also aided in the
replanting of deforested mangrove areas (germanyinafrica.diplo.de., n.d.).
Mangroves in Ghana continue to face challenges of human exploitation. Spatial differences
between mangroves in the Densu delta and Ada estuary (Figure 10 and 11) indicated impact of
human activities on mangroves. Proximity of the Densu delta to urban Accra has resulted in built-
up expansion within this site than in Ada estuary. Mangrove reserves are prone to encroachment
because of increase in population, illegal hunting and unapproved resource extraction
(germanyinafrica.diplo.de., n.d.). Most mangrove areas are routes to farming areas of some
communities. The roots and branches are cut in the dry seasons to provide accessibility and

50
conversion for charcoal production (Mensah & Track, 2013). One factor contributing to
overexploitation of mangrove in Ghana is related to ownership rights of lands to village groups
such as families and Chiefs (Rubin et al., 1999). This private ownership system of land in Ghana
makes owners feel they have custody rights and determine what the land is to be used for without
regard to its implications. Construction of the Akosombo and Kpong dams have also been reported
to affect mangrove growth downstream due to reduction in flooding into mangrove areas (ibid). If
this report is to go by, then reductions in mangrove growth in the Densu delta could also be related
to Weija dam constructed on the Densu river on the west coast of Greater Accra.
The positive results from community participation in mangrove replanting shows that, creating
awareness and educating communities about the importance of mangrove can help improve
mangrove health. Including women in such programs and empowering them can improve the
situation as well. The findings however support the claim of anthropogenic impact on coastal
vegetations. A holistic approach to coastal zone management can improve on the negative effects
of the dams and other human factors on vegetation and mangroves downstream.
6.2.2 Urbanization/ built-up
It has been noted at this point that both natural and human factors are the main drivers of change
on the coast. However, human factors abound more because of the interest in the enormous benefits
the coastal zone affords. Assessment of urban change/ built-up in the region between 1996 and
2017 show significant increase over time. Spatial increases built up in the region between 1996 to
2002 were close to the coast, specifically in Accra and the industrial city of Tema. This result is
consistent with the findings of LDN (2017), who compared built-up areas in Greater Accra
between 1995 and 2014. A similar trend was also observed in Addae & Oppelt (2019), which
showed a concentration of built-up areas close to Tema and Accra between 1991 and 2015.
However, my finding shows considerable increases in built-up direction away from the coast into
peri-urban areas of the region between 2002 and 2017. The trends of spatial spread of built-up in
the region is similar to results reported by Akubia & Bruns (2019) who found an increase in urban
sprawl in the peri-urban areas of Accra. Peri-urbanization has been considered the most prominent
form of urban growth in Accra, and may be the dominant spatial planning challenge of the twenty-
first century (Akubia, 2016). The effects of this type of urbanization is conversion of agricultural,
grassland and forests into settlements. This assertion is true as Akubia & Bruns (2019), pointed
out that, increasing population in Greater Accra resulted in conversion of grassland and open areas
into settlements.

51
Often decrease in vegetation cover and extent is considered as the negative impact of urban
expansion. It was observed that, increases in urban expansion coincided with decreases in
vegetation cover in the area. Most patches of forested areas in the north-western part of the region
were converted to barren land/built-up in 2017. This observation is similar to the studies conducted
by Addae & Oppelt (2019). The inverse relationship between urban expansion and vegetation
cover requires a more holistic approach to management. Treating these cases in isolation may not
improve the situation but more likely to worsen it, because of lack of information flow between
both sectors of management.
Population of cities in the coast continue to increase and suffer from the effects of migration on
the coastal environment (Yeung, 2001). Greater Accra is not exempted from these challenges.
According to (LDN, 2017), 4.15 million out of 4.6 million population of the region resided in
urban areas in 2016; an urbanization level of 90 percent. This means that 90% of the population
of Greater Accra live in the urban centers of the region. The contiguous areas are those closer to
the coast and the industrial city of Tema. This overcrowding of urban areas in Greater Accra has
resulted in extension of settlements into its peri-urban areas and villages previously occupied by
grassland and forest.
Although increased population and migration to coastal regions could be the fundamental causes
to increasing urbanization in the coast, other causes could be identified. The economic boom that
the coastal zone provides has led growth in the housing sector. Several estates and gated
communities have emerged in the region and acquisition and ownership of land have become
competitive (Addae & Oppelt, 2019). Ownership of land in the region is predominantly private
(Addae & Oppelt, 2019; Rubin et al., 1999). Thus, owners often take advantage of the economic
benefits to sell their lands to estate developers rather than the traditional use of the land for
agricultural purposes. Tourism and related facilities development in the coastal region have also
increased demand for land along the coast (Boafo et al., 2014). A comprehensive and integrated
management of the coastal zone can help mitigate the negative effects of urban expansion and its
effects on the ecological ecosystem.
6.3 Management implication; towards an Integrated Coastal Zone
Management (ICZM)
The study provides evidence of changes in built-up and vegetation cover and shoreline position in
the coastal region of Greater Accra. It was observed that urbanization and peri-urbanization has
52
increased between 1996 and 2017 and it is expected to increase (Addae & Oppelt, 2019) in future.
Shoreline positions were also eroding and may continue to rise, given the various climatic and
natural conditions. Vegetation cover in the coastal region was also decreasing at the rate
urbanization is increasing. These observations show interaction between social and ecological
components of the coastal zone. For example, human activities in the coastal area have led to
erosion of shorelines especially around the inlets of rivers and lagoons. The building of dams on
the Densu and Volta River, diversion of rivers for irrigation and agriculture purposes, port
constructions, sea defense walls, etc. have led to deficiency of sediment transport downstream.
Another human activity causing problems to the shoreline changes is sand winning of beach sand
on the shores of Ghana (Boateng, 2012), however, there has not been any enforcement of law to
battle this.
Natural resources including coastal resources, are meant to be exploited by humans. It is therefore
understandable that for efficient management practices, the human component in this socio
ecological interaction needs to be managed. Complex management practices are utilized based on
the context and focus of management. Often proposals are made for new management strategies
that tackle challenges faced in certain contexts. Most policies are aimed towards sustainable
development and management of environmental resources (Boateng, 2006). Ghana adopted an
Integrated Coastal Zone Management (ICZM) approach, however, economic sustainability
remains the central focus in its management strategy (mamiwaterproject.org, n.d.). This study
shows the importance of use of a holistic approach to the implementation of ICZM in Ghana.
Studies have suggested new management strategies to manage urbanization and its growth on
vegetation using the green belt strategy e.g. in Germany (Addae & Oppelt, 2019) and UK shoreline
management plan (SMP) to manage shoreline change (Boateng, 2012). The green belt strategy
involves keeping peri-urban cities covered with vegetation and adopting plans to prevent urban
expansion into these areas. UK SMPs comprise a holistic approach to studying coastal dynamics
through improved geomorphological understanding and predict the performance of different
shoreline management policies (Cooper et al., 2001). The UK SMP moves away from the
traditional hard-engineered coastal defense works to a pro-active long-term assessment of
shoreline requirements (ibid) in shoreline management. This is lacking in Ghana’s approach in
managing its shoreline changes with hard-engineered defense works. There is a need to assess
coastal systems and provide a long-time impact assessment of defense systems on sediment influx
and transport along the coast.

53
Despite the importance and usefulness of these management proposals, land use/landcover and
shoreline changes in the coast are often treated in isolation. A management strategy that combines
the objectives of the green belt strategy (Germany) and UK shoreline management plan, can help
manage the social-ecological system of Greater Accra coastal zone. This is vital because of the
various interactions and impacts that the social and ecological components in the coastal zone have
on one another. ICZM should not concentrate on only the economic gains from the coastal zone
but balance all components of sustainability through a more holistic approach. The challenge of
integrating social, physical and ecological dimensions of the coastal zone is usually geographic
and related to space. One way to deal with this challenge is incorporation of Geographical
Information Systems (GIS) as an integral part of ICZM in Ghana.
6.4 Methodologies in coastal change assessment
Most coastal countries in Africa face challenges of implementing ICZM in terms of data
availability and the financial resources for its activities (Boateng, 2006). Ghana faces the challenge
of available and accessible spatial data for coastal transformation assessments such as shoreline
changes (Addo et al., 2008) and the need for cost effective analysis (Boateng, 2006) to manage
coastal activities.
The third objective of this study was to explore use of freely available spatial data sources, for
example: Landsat and Google earth images, in data poor regions like my study area. Google Earth
image was vital in identifying shorelines for change detection analysis. The ability to zoom in and
out on Google Earth helps to view areas at different resolutions for effective digitization. It also
proved vital as a reference image for land use and landcover identification in the study area.
Landsat data proved to be flexible and reliable in multi-temporal land use and landcover change
detection. The 30m resolution of Landsat images proved significant in viewing images in large
areas in the region. The methodology used in this study shows the effectiveness of integrating
Google Earth and Landsat image data for mapping shoreline and land use/landcover changes.
There were challenges associated with these data sources although free and available. For example,
the number of images that could be obtained from the study area were limited and confined to
certain months and dates in contrast to other parts of the globe. In some years, few images that
were captured were affected by land and scene cloud cover, sometimes difficult to work with.
Another challenge of the Landsat images used is their resolution, despite not being high, however,
they could provide a large area view and enough to work on. Google Earth images had similar
54
challenges of cloud cover and clarity. However, images from 1984 were available in the study area
to present. A combination of these images in land use/land cover and shoreline change analysis
helps to mitigate the challenges that come from using just one of them.
Integrated Coastal Zone Management (ICZM) involves incorporating the social and ecological
components in the coast. To achieve this, knowledge about changes in these components are
needed to inform management decisions. Changes that occur in the coastal zone have spatial and
temporal significance and require a robust method for its assessment. GIS has proven to be a useful
tool to analyse the changes that occur in the coastal zone (Carocci et al., 2009)
6.5 Limitations
Every research poses limitations as the research is developed along the line. A major issue was the
delimitation of the study. This study was confined to analysis of only terrestrial changes of the
coastal zone, and did not include its ocean or marine component. One considerable limitation to
this study was time constraints, because this study was conducted within a short period of time.
Traversing the coast to confirm changes observed in the analysis and ground truths could not be
done because of the limited duration. There was also lack of data on the human dimension of the
coastal region which could have been achieved through field work such as interviews and
participatory GIS (PGIS). However, these were compensated with the use of secondary materials
from the news outlets, government agencies websites, published papers and knowledge of the area.
Extensive work could be done on the spatial differences between mangroves in the Densu delta
and Ada estuary. This can be useful to improve data and research which is lacking in Greater Accra
mangroves. Further studies on the social dimension could be conducted using interviews and
participatory GIS (PGIS) in the region.
Another limitation was the difficulty of acquiring satellite data within the same time periods,
especially in 1986 to 2000. To deal with this however, I selected images that are farthest, a month
a part. This made sure that images were at least within the same season to limit seasonal errors. I
also observed that, using satellite images alone requires back and forth experiments with different
methods to observe significant variations in results. Using and spending time to do this helps to
improve the accuracy of results produced.

55
7 Conclusion
The goal of this study was to assess the spatial and temporal changes that have occurred on the
coast of Greater Accra using simple GIS techniques. The three specific objectives the study
showed that it is possible to assess coastal changes with simple GIS methods for data poor regions.
Significant accretion and erosion rates were observed on the coast of Greater Accra, with the
highest rate of erosion at Ada estuary. Stable and reduced erosion were seen at different river
inlets, but consistent erosion occurred on the eastern coast. Major accretion was observed at the
Tema Port. This may be due to reclamation of an extensive sea area for its expansion. Although
natural drivers were contributing to changes in shoreline positions in the area, human drivers were
seen to exacerbate erosion rates. The approach to sea defense constructions worked against the
natural processes on coastlines. This adds to the knowledge that sea defense systems and coastal
constructions contribute to beach erosion by blocking sediment transfer. Erosion rates at the Densu
delta and Volta estuary also shows that sediment influxes from river and lagoon inlets are not
stand-alone contributors of beach sediments.
Built-up and vegetation cover had changed significantly between 1996 and 2017, with increasing
built-up and decreasing vegetation. The spatial increase of built-up between 1996 and 2002 was
observed close to the coast. Between 2002 and 2017, built-up urban areas like Tema and Accra
spread to peri-urban areas of the region, towards the north and northwest.
This observation was different from vegetation cover changes in the coastal region. The period
between 1996 and 2002 showed decreased vegetation in areas closer to the coast. Decrease in
vegetation was observed in peri-urban areas and villages in the northwest and north of the region
between 2002 and 2017. An inverse relationship pattern between urban expansion and vegetation
was observed, an increase in urbanization and built-up meant decrease in vegetation in the same
areas. Mangrove areas showed significant increases between 1996 and 2017, with almost all
increases occurring in the Ada area. There were several areas within the Densu delta mangroves
that have been lost between 1996 and 2017 It was observed that mangrove areas, especially in the
Densu delta suffered from human encroachment. This may be attributed to the closeness of this
area to the capital, Accra.
These results from shoreline, vegetation cover and urban changes in Greater Accra shows the
interdependencies of the social-ecological system of the coastal zone. Major drivers of changes in

56
these three components were anthropogenic in nature. Therefore, for an effective approach to
management of the coastal zone, a holistic approach that integrates these social-ecological
components is vital. This study also stresses on the need to gain knowledge of the spatial and
temporal changes that have occurred in the coast for effective integration of coastal zone
management (ICZM).
Combination of Landsat and Google Earth images proved to be useful in shoreline digitization and
change assessment, digitization of reference points, and comparing images from each other for
consistency. The results show that medium resolution satellite imagery from Landsat, and Google
Earth images can be used to assess coastal changes to inform management decisions in the coastal
zone.
57
Works cited
Addae, B., & Oppelt, N. (2019). Land-Use/Land-Cover Change Analysis and Urban Growth
Modelling in the Greater Accra Metropolitan Area (GAMA), Ghana. Urban Science, 3(1),
26. https://doi.org/10.3390/urbansci3010026
Addo, K A. (2009). Coastal erosion hotspots in Accra. Journal of Sustainable Devlopment in
Africa, 11(11), 253–265. Retrieved from http://www.jsd-africa.com/
Addo, Kwasi Appeaning. (2011). Changing morphology of Ghana’s Accra coast. Journal of
Coastal Conservation, 15(4), 433–443. https://doi.org/10.1007/s11852-010-0134-z
Akubia, J. E. (2016). John Edem Akubia Coastal Urbanization and Urban Land-use Change. (10).
Akubia, J. E. K., & Bruns, A. (2019). Unravelling the frontiers of urban growth: Spatio-Temporal
dynamics of land-use change and urban expansion in greater Accra metropolitan area, Ghana.
Land, 8(9), 1–23. https://doi.org/10.3390/land8090131
Allen, M.R., O.P. Dube, W. Solecki, F. Aragón-Durand, W. Cramer, S. Humphreys, M. Kainuma,
J. Kala, N. Mahowald, Y. Mulugetta, R. Perez, M. Wairiu, and K. Z. (2018). Framing and
Context Coordinating. In Allen, M.R., O.P. Dube, W. Solecki, F. Aragón-Durand, W. Cramer,
S. Humphreys, M. Kainuma, J. Kala, N. Mahowald, Y. Mulugetta, R. Perez, M. Wairiu, and
K. Zickfeld, 2018: Framing and Context. In: Global Warming of 1.5°C. An IPCC Special
Report on the impa.
Andersen, J. H., Al-Hamdani, Z., Harvey, E. T., Kallenbach, E., Murray, C., & Stock, A. (2020).
Relative impacts of multiple human stressors in estuaries and coastal waters in the North Sea–
Baltic Sea transition zone. Science of the Total Environment.
https://doi.org/10.1016/j.scitotenv.2019.135316
Appeaning Addo, K., Jayson-Quashigah, P. N., & Kufogbe, K. S. (2012). Quantitative Analysis
of Shoreline Change Using Medium Resolution Satellite Imagery in Keta, Ghana. Marine
Science, 1(1), 1–9. https://doi.org/10.5923/j.ms.20110101.01
Appeaning Addo, K., Walkden, M., & Mills, J. P. (2008). Detection, measurement and prediction
of shoreline recession in Accra, Ghana. ISPRS Journal of Photogrammetry and Remote
Sensing, 63(5), 543–558. https://doi.org/10.1016/j.isprsjprs.2008.04.001
Awo, M., Boatemaa, A., Kwasi, A. A., & Mensah, A. (2013). Impacts of shoreline morphological

58
change and sea level rise on mangroves: the case of the keta coastal zone. E3 Journal of
Environmental Research and Management, 4(11), 359–367. Retrieved from
http://www.e3journals.org
Badola, R., Barthwal, S., & Hussain, S. A. (2012). Attitudes of local communities towards
conservation of mangrove forests: A case study from the east coast of India. Estuarine,
Coastal and Shelf Science. https://doi.org/10.1016/j.ecss.2011.11.016
Banica, A., Alexandru, U., & Cuza, I. (2017). Integrated Coastal Zone Management ( ICZM ): a
framework to tackle environmental issues ? Danish Approach Integrated Coastal Zone
Management ( ICZM ): a framework to tackle environmental issues ? Danish Approach
Alexandru Banica Julie Bastard Martyna Kosi.
Barbier, E. B. (2017). Marine ecosystem services. Current Biology.
https://doi.org/10.1016/j.cub.2017.03.020
Blasco, F., Saenger, P., & Janodet, E. (1996). Mangroves as indicators of coastal change. Catena,
27(3–4), 167–178. https://doi.org/10.1016/0341-8162(96)00013-6
Boafo, Y. A., Asiedu, A. B., Addo, K. A., & Antwi, E. (2014). Assessing Landcover Changes from
Coastal Tourism Development in Ghana : Evidence from the Kokrobite-Bortianor Coastline
, Accra Assessing Landcover Changes from Coastal Tourism Development in Ghana :
Evidence from the Kokrobite-Bortianor Coastline , Accra. (July).
Boateng, I. (2012). An application of GIS and coastal geomorphology for large scale assessment
of coastal erosion and management: A case study of Ghana. Journal of Coastal Conservation,
16(3), 383–397. https://doi.org/10.1007/s11852-012-0209-0
Boateng, I., & Kingdom, U. (2006a). Policy Process in Coastal and Marine Resource Management
in Ghana Policy Process in Coastal and Marine Resource Management in Ghana. (October
2006), 1–13.
Boateng, I., & Kingdom, U. (2006b). Policy Process in Coastal and Marine Resource
Management in Ghana Policy Process in Coastal and Marine Resource Management in
Ghana. (February), 1–13.
Buchanan, G.M., Butchart, SH.M., Dutson, G., Pilgrim, J.D., Steininger, M.K., Bishop, K.D.,
Mayaux, P., 2008. Using remote sensing to inform conservation status assessment: estimates
of recent deforestation rates on New Britain and the impacts upon endemic birds. Biological

59
Conservation 141, 56e66.
Burke, L., Kura, Y., Kassem, K., Revenga, C., Spalding, M., & McAllister, D. (2001). Coastal
Zone: Extent and Change. In Coastal Ecosystems.
Cantasano, N., & Pellicone, G. (2014). Marine and river environments: A pattern of integrated
coastal zone management (ICZM) in calabria (southern italy). Ocean and Coastal
Management, 89, 71–78. https://doi.org/10.1016/j.ocecoaman.2013.12.007
Cooper, N. J., Hooke, J. M., & Bray, M. J. (2001). Predicting coastal evolution using a sediment
budget approach: A case study from southern England. Ocean and Coastal Management,
44(11–12), 711–728. https://doi.org/10.1016/S0964-5691(01)00079-5
Cowan, J. H., Rice, J. C., Walters, C. J., Hilborn, R., Essington, T. E., Day, J. W., & Boswell, K.
M. (2012). Challenges for Implementing an Ecosystem Approach to Fisheries Management.
Marine and Coastal Fisheries, 4(1), 496–510.
https://doi.org/10.1080/19425120.2012.690825
Creel, L. (2003). Ripple effects: Population and coastal regions. Population Reference Bureau, 8.
Retrieved from
http://www.prb.org/pdf/RippleEffects_Eng.pdf%5Cnhttp://pdf.usaid.gov/pdf_docs/Pnadd16
9.pdf
Crossland, C. J., Baird, D., Ducrotoy, J.-P., Lindeboom, H., Buddemeier, R. W., Dennison, W. C.,
… Swaney, D. P. (2005). The Coastal Zone — a Domain of Global Interactions. (Oecd 2001),
1–37. https://doi.org/10.1007/3-540-27851-6_1
Daniel S. A (2006). The Protection, Management and Development of the Marine and Coastal
Environment of Ghana. In Sutherland, M., & Nichols, S. (2006). Administering Marine
Spaces : International Issues. In A publication of FIG Commissions 4 & 7 Working Group
4.3. International Federation of Surveyors.
Del Río, L., & Gracia, F. J. (2013). Error determination in the photogrammetric assessment of
shoreline changes. Natural Hazards, 65(3), 2385–2397. https://doi.org/10.1007/s11069-012-
0407-y
Donato, D. C., Kauffman, J. B., Murdiyarso, D., Kurnianto, S., Stidham, M., & Kanninen, M.
(2011). Mangroves among the most carbon-rich forests in the tropics. Nature Geoscience,
4(5), 293–297. https://doi.org/10.1038/ngeo1123
60
Duhl, T. R., Guenther, A., & Helmig, D. (2012). Estimating urban vegetation cover fraction using
Google Earth® images. Journal of Land Use Science, 7(3), 311–329.
https://doi.org/10.1080/1747423X.2011.587207
Enhancing Urban Resilience in the Greater Accra Metropolitan Area. (2017). Enhancing Urban
Resilience in the Greater Accra Metropolitan Area, (May). https://doi.org/10.1596/27516
Esteves, L. S., Toldo, E. E., Dillenburg, S. R., & Tomazelli, L. J. (2002). Long- and Short-Term
Coastal Erosion in Southern Brazil. Journal of Coastal Research, 36, 273–282.
https://doi.org/10.2112/1551-5036-36.sp1.273
Fedra, K., & Feoli, E. (1998). GIS technology and spatial analysis in coastal zone management.
EEZ Technology, 171–179.
Forst, M. F. (2009). The convergence of Integrated Coastal Zone Management and the ecosystems
approach. Ocean and Coastal Management, 52(6), 294–306.
https://doi.org/10.1016/j.ocecoaman.2009.03.007
Gill, J. Ainiee, A., M. Anwar, S., Omar, K., 2014. Towards the Implementation of Continuous
Coastal Vulnerability Index in Malaysia: A Review. Jurnal Teknologi. 71(4), 1-10.
Ghana: Restoring Ghana’s Mangroves and Depleted Fish Stock - allAfrica.com. (n.d.). Retrieved
May 1, 2020, from https://allafrica.com/stories/201812240606.html
Ghana commence construction of US $69m sea defense wall. (n.d.). Retrieved April 28, 2020,
from https://constructionreviewonline.com/2020/01/ghana-commence-construction-of-us-
69m-sea-defense-wall/
Ghana Pilot Project – Project description – The Mami Wata Project. (n.d.). Retrieved May 2, 2020,
from https://mamiwataproject.org/pilot-projects/pilot-projects-ghana-project-description/
Ghana Ports & Harbours Authority. (n.d.). Retrieved March 4, 2020, from
https://www.ghanaports.gov.gh/page/index/12/1S8QAWPW/Golden-Jubilee-Terminal
Glaeser, B., Bruckmeier, K., Glaser, M., & Krause, G. (2009). Social-Ecological Systems in
Coastal and Marine Areas: A Path toward Intregration of Interdisciplinary Knowledge. In
Morrison, K. D., & Singh, S. J. (2015). Adaptation and indigenous knowledge as a bridge to
sustainability. Current Trends in Human Ecology, 125–155.
https://doi.org/10.5848/csp.0441.00006
61
Gods and mangroves in Ghana’s Songor Biosphere Reserve - Federal Foreign Office. (n.d.).
Retrieved May 1, 2020, from https://germanyinafrica.diplo.de/zadz-en/-/2208702
Gordon, C. (2012). The Value of Mangroves to Ghana’s Coasts. (May).
GSS. (2019). Ghana Statistical Service. Retrieved February 13, 2020, from GSS website:
https://www.statsghana.gov.gh/regionalpopulation.php?population=MTM0NTk2MjQzOS4
yMDE1&&GreaterAccra®id=3
Hassan, M. I., & Rahmat, N. H. (2016). The effect of coastline changes to local community’s
socialeconomic. International Archives of the Photogrammetry, Remote Sensing and Spatial
Information Sciences - ISPRS Archives, 42(4W1), 25–36. https://doi.org/10.5194/isprs-
archives-XLII-4-W1-25-2016
Hassanali, K. (2014). Introducing Integrated Coastal Zone Management (ICZM) to Trinidad and
Tobago. 16.
Hinrichsen, D. 1998. Coastal Waters of the World : Trends, Threats, and Strategies. Washington,
DC: Island Press.
Hussain, S., Mubeen, M., Ahmad, A., Akram, W., Hammad, H. M., Ali, M., … Nasim, W. (2019).
Using GIS tools to detect the land use/land cover changes during forty years in Lodhran
District of Pakistan. Environmental Science and Pollution Research.
https://doi.org/10.1007/s11356-019-06072-3
Jarraud, M., & Steiner, A. (2012). Summary for policymakers. In Managing the Risks of Extreme
Events and Disasters to Advance Climate Change Adaptation: Special Report of the
Intergovernmental Panel on Climate Change (Vol. 9781107025).
https://doi.org/10.1017/CBO9781139177245.003
Jonah, F. E., Boateng, I., Osman, A., Shimba, M. J., Mensah, E. A., Adu-Boahen, K., … Effah, E.
(2016). Shoreline change analysis using end point rate and net shoreline movement statistics:
An application to Elmina, Cape Coast and Moree section of Ghana’s coast. Regional Studies
in Marine Science, 7, 19–31. https://doi.org/10.1016/j.rsma.2016.05.003
Jonah, Fredrick Ekow, Mensah, E. A., Edziyie, R. E., Agbo, N. W., & Adjei-Boateng, D. (2016).
Coastal Erosion in Ghana: Causes, Policies, and Management. Coastal Management, 44(2),
116–130. https://doi.org/10.1080/08920753.2016.1135273
62
Kim, D. H., Narashiman, R., Sexton, J. O., Huang, C., & Townshend, J. R. (2011). Methodology
to select phenologically suitable Landsat scenes for forest change detection. International
Geoscience and Remote Sensing Symposium (IGARSS), 2613–2616.
https://doi.org/10.1109/IGARSS.2011.6049738
Kirui, K. B., Kairo, J. G., Bosire, J., Viergever, K. M., Rudra, S., Huxham, M., & Briers, R. A.
(2013). Mapping of mangrove forest land cover change along the Kenya coastline using
Landsat imagery. Ocean and Coastal Management, 83, 19–24.
https://doi.org/10.1016/j.ocecoaman.2011.12.004
Kotinas, V., Evelpidou, N., Karkani, A., & Polidorou, M. (n.d.). Modelling Coastal Erosion. 42.
Retrieved from https://eclass.uoa.gr/modules/document/file.php/GEOL312/Coastal
erosion/Modelling coastal erosion_theory.pdf
Kovacs, J. M., Wang, J., & Flores-Verdugo, F. (2005). Mapping mangrove leaf area index at the
species level using IKONOS and LAI-2000 sensors for the Agua Brava Lagoon, Mexican
Pacific. Estuarine, Coastal and Shelf Science. https://doi.org/10.1016/j.ecss.2004.09.027
Kudale, M. D. (2010). Impact of port development on the coastline and the need for protection.
Indian Journal of Marine Sciences, 39(4), 597–604.
Landsat Missions. (n.d.). Retrieved May 4, 2020, from https://www.usgs.gov/land-
resources/nli/landsat
Larry Awosika and Regina Folorunsho. (2005). The Ocean Data and Information Network of
Africa. 127–132.
Lauretta, B., Yumiko, K., Ken, K., Carmen, R., Mark, S., and Don, M. (2001). Pilot Analysis of
Global Ecosystems: Coastal Ecosystems, World Resources Institute, Washington D.C. ISBN
1-56973-458-5
Lawrence, P. L. (1996). An introduction to coastal zone management. Ocean & Coastal
Management, 32(1), 67–68. https://doi.org/10.1016/s0964-5691(96)00034-8
LDN. (2017). The World Bank Cost of Coastal Environmental Degradation, Multi Hazard Risk
Assessment and Cost Benefit Analysis D6a: Identification and justification of DRM and ACC
measures for Ghana-Sector GH9-a New Ningo-Lekpoguno. Retrieved from www.imdc.be
Longley, P. A., Goodchild, M. F., Maguire, D. J., & Rhind, D. W. (2015). Geo Graphic
63
Information.
Ly, C. K. (1980). The role of the Akosombo Dam on the Volta river in causing coastal erosion in
central and eastern Ghana (West Africa). Marine Geology. https://doi.org/10.1016/0025-
3227(80)90108-5
Mancino, G., Nolè, A., Ripullone, F., & Ferrara, A. (2014). Landsat TM imagery and NDVI
differencing to detect vegetation change: Assessing natural forest expansion in Basilicata,
southern Italy. IForest, 7(2), 75–84. https://doi.org/10.3832/ifor0909-007
Masek, J. G., Lindsay, F. E., & Goward, S. N. (2000). Dynamics of urban growth in the
Washington DC metropolitan area, 1973-1996, from Landsat observations. International
Journal of Remote Sensing, 21(18), 3473–3486.
https://doi.org/10.1080/014311600750037507
McDonnel, T. (2019). Climate Migrants Face a Gap in International Law | Centre for International
Governance Innovation. Retrieved February 18, 2020, from
https://www.cigionline.org/articles/climate-migrants-face-gap-international-law
Mensah, J., & Track, M. (2013). Remote Sensing Application for Mangrove Mapping in the
Ellembelle District in Ghana. … Program for the Western Region of Ghana. …, 0–28.
Retrieved from http://fonghana.org/wp-content/uploads/2014/01/REMOTE-SENSING-
APPLICATION-FOR-MANGROVE-MAPPING-IN-THE-ELLEMBELLE-DISTRICT-IN-
GHANA.pdf
Mensah, J. V. (1997). Causes and effects of coastal sand mining in Ghana. Singapore Journal of
Tropical Geography, 18(1), 69–88. https://doi.org/10.1111/1467-9493.00005
Misra, A., & Balaji, R. (2015). A study on the shoreline changes and Land-use/land-cover along
the south Gujarat coastline. Procedia Engineering, 116(1), 381–389.
https://doi.org/10.1016/j.proeng.2015.08.311
Murray, A. B. (2001). Coastal Geomorphology: An Introduction. In Eos, Transactions American
Geophysical Union (Vol. 82). https://doi.org/10.1029/01eo00219
Muttitanon, W., & Tripathi, N. K. (2005). Land use/land cover changes in the coastal zone of Ban
Don Bay, Thailand using Landsat 5 TM data. International Journal of Remote Sensing,
26(11), 2311–2323. https://doi.org/10.1080/0143116051233132666
64
Nortey, D. D. N., Aheto, D. W., Blay, J., Jonah, F. E., & Asare, N. K. (2016). Comparative
Assessment of Mangrove Biomass and Fish Assemblages in an Urban and Rural Mangrove
Wetlands in Ghana. Wetlands, 36(4), 717–730. https://doi.org/10.1007/s13157-016-0783-2
Portner, H. O., Roberts, D. C., Masson-Delmotte, V., Zhai, P., Tignor, M., E., P., … Weyer, N.
(2019). IPCC, 2019: IPCC Special report on the Ocean and Cryoshphere in a Changing
Climate. (vii, 973), 7–22.
https://doi.org/http://www.ipcc.ch/publications_and_data/ar4/wg2/en/spm.html
Prasad, D. H., & Kumar, N. D. (2014). Coastal Erosion Studies—A Review. International Journal
of Geosciences, 05(03), 341–345. https://doi.org/10.4236/ijg.2014.53033
Redman, C. L., Grove, J. M., & Kuby, L. H. (2004). Integrating social science into the Long-Term
Ecological Research (LTER) Network: Social dimensions of ecological change and
ecological dimensions of social change. Ecosystems, 7(2), 161–171.
https://doi.org/10.1007/s10021-003-0215-z
Rubin, J. A., Gordon, C., & Amatekpor, J. K. (1999). Causes and consequences of mangrove
deforestation in the Volta estuary, Ghana: Some recommendations for ecosystem
rehabilitation. Marine Pollution Bulletin, 37(8–12), 441–449. https://doi.org/10.1016/S0025-
326X(99)00073-9
Salghuna, N. N., & Bharathvaj, S. A. (2015). Shoreline Change Analysis for Northern Part of the
Coromandel Coast. Aquatic Procedia, 4(Icwrcoe), 317–324.
https://doi.org/10.1016/j.aqpro.2015.02.043
Small, C., & Nicholls, R. J. (2003). A global analysis of human settlement in coastal zones. Journal
of Coastal Research, 19(3), 584–599.
Spalding, M. D., Ruffo, S., Lacambra, C., Meliane, I., Hale, L. Z., Shepard, C. C., & Beck, M. W.
(2014). The role of ecosystems in coastal protection: Adapting to climate change and coastal
hazards. Ocean and Coastal Management, 90, 50–57.
https://doi.org/10.1016/j.ocecoaman.2013.09.007
Srinivasa Kumar, T., Mahendra, R. S., Nayak, S., Radhakrishnan, K., & Sahu, K. C. (2012).
Identification of hot spots and well managed areas of Pichavaram mangrove using Landsat
TM and Resourcesat-1 LISS IV: An example of coastal resource conservation along Tamil
Nadu Coast, India. Journal of Coastal Conservation, 16(1), 1–12.
65
https://doi.org/10.1007/s11852-011-0162-3
Stow, D. A., Weeks, J. R., Toure, S., Coulter, L. L., Lippitt, C. D., & Ashcroft, E. (2013). Urban
Vegetation Cover and Vegetation Change in Accra, Ghana: Connection to Housing Quality.
Professional Geographer, 65(3), 451–465. https://doi.org/10.1080/00330124.2012.697856
Straub, C. L., Koontz, S. R., & Loomis, J. B. (2019). Economic Valuation of Landsat Imagery. 20.
Retrieved from https://doi.org/10.3133/ofr20191112
Taubenböck, H., Wegmann, M., Roth, A., Mehl, H., & Dech, S. (2009). Urbanization in India -
Spatiotemporal analysis using remote sensing data. Computers, Environment and Urban
Systems, 33(3), 179–188. https://doi.org/10.1016/j.compenvurbsys.2008.09.003
Thampanya, U., Vermaat, J. E., Sinsakul, S., & Panapitukkul, N. (2006). Coastal erosion and
mangrove progradation of Southern Thailand. 68. https://doi.org/10.1016/j.ecss.2006.01.011
Thia-Eng, C. (1993). Essential elements of integrated coastal zone management. Ocean and
Coastal Management, 21(1–3), 81–108. https://doi.org/10.1016/0964-5691(93)90021-P
Thieler, E. R., Himmelstoss, E. A., Zichichi, J. L., & Ergul, A. (2017). Digital Shoreline Analysis
System (DSAS) version 4.0 - An ArcGIS extension for calculating shoreline change (ver.4.4,
July 2017). 1–81. https://doi.org/10.3133/ofr20081278
Thinh, N. A., & Hens, L. (2017). A Digital Shoreline Analysis System (DSAS) applied on
mangrove shoreline changes along the Giao Thuy coastal area (Nam Dinh, Vietnam) during
2005-2014. Vietnam Journal of Earth Sciences, 39(1), 87–96. https://doi.org/10.15625/0866-
7187/39/1/9231
Twumasi, Y. A, Manu, A., and Coleman, T. . (2017). Remote Sensing and GI S Application in
Coastal Zone Management : A Case Study of Ghana. (October 2005).
Valadez-Rocha, V., & Ortiz-Lozano, L. (2013). Spatial and temporal effects of port facilities
expansion on the surface area of shallow coral reefs. Environmental Management, 52(1),
250–260. https://doi.org/10.1007/s00267-013-0098-5
Villa, P. (2012). Mapping urban growth using Soil and Vegetation Index and Landsat data: The
Milan (Italy) city area case study. Landscape and Urban Planning, 107(3), 245–254.
https://doi.org/10.1016/j.landurbplan.2012.06.014
Warnasuriya, T. W. S., Gunaalan, K., & Gunasekara, S. S. (2018). Google Earth: A New Resource
66
for Shoreline Change Estimation—Case Study from Jaffna Peninsula, Sri Lanka. Marine
Geodesy, 41(6), 546–580. https://doi.org/10.1080/01490419.2018.1509160
West Africa Coastal Areas Management Program (WACA) Launch. (n.d.). Retrieved May 10,
2020, from https://www.worldbank.org/en/events/2018/11/07/west-africa-coastal-areas-
management-program-waca-launch
Wong, P. P., Losada, I. J., Gattuso, J.-P., Hinkel, J., Khattabi, A., McInnes, K., … Sallenger, A.
(2013). Chapter 5: Coastal Systems and Low-Lying Areas. Ipcc Wgii Ar5, (October 2013),
1–85.
World Bank. (2018). Fighting Coastal Erosion in Keta Area. Retrieved from
http://documents.worldbank.org/curated/en/541981527661149414/Fighting-coastal-erosion-
in-Keta-area
Wynne, J. (2005). Cohen’s Kappa and Classification Table Metrics 2.0: An ArcView 3x Extension
for Accuracy Assessment of Spatially Explicit Models Southwest Biological Science Center
Open-File Report OF. (December). Retrieved from
https://www.fs.fed.us/rm/pubs_other/rmrs_2005_jenness_j001.pdf
Xian, G., & Crane, M. (2005). Assessments of urban growth in the Tampa Bay watershed using
remote sensing data. Remote Sensing of Environment, 97(2), 203–215.
https://doi.org/10.1016/j.rse.2005.04.017
Yeung, Y. M. (2001). Coastal mega-cities in Asia: Transformation, sustainability and
management. Ocean and Coastal Management, 44(5–6), 319–333.
https://doi.org/10.1016/S0964-5691(01)00053-9
Yu, K., Hu, C., Muller-Karger, F. E., Lu, D., & Soto, I. (2011). Shoreline changes in west-central
Florida between 1987 and 2008 from Landsat observations. International Journal of Remote
Sensing, 32(23), 8299–8313. https://doi.org/10.1080/01431161.2010.535045

67
Appendices
Appendix 1: False Color Composite (FCC) images
Spatial and temporal pattern of vegetation cover in the study area based on False color composite.
Two different band combinations were used for the three Landsat sensors (band 7, 5 and 3 for TM
and ETM (1986, 1996, 2002) and bands 7, 6 and 4 for OLI (2017)).

68
Appendix 2: Vegetation extent between 1996 and 2017
Temporal and spatial extent of vegetation cover in 1996, 2002 and 2017. Decrease of vegetation
could be observed in the coast from 1996 to 2017