Germanium as a tool to dissect boron toxicity effects in barley and wheat

arX
iv:1
103.
5393
v1 [
nucl
-ex]
28
Mar
201
1
The 14N(p,γ)15O reaction studied with a composite germanium detector
M. Marta,1, ∗ A. Formicola,2 D. Bemmerer,1 C. Broggini,3 A. Caciolli,3, 4 P. Corvisiero,5 H. Costantini,5
Z. Elekes,6 Zs. Fulop,6 G. Gervino,7 A. Guglielmetti,8 C. Gustavino,2 Gy. Gyurky,6 G. Imbriani,9
M. Junker,2 A. Lemut,5 B. Limata,9 C. Mazzocchi,8 R. Menegazzo,3 P. Prati,5 V. Roca,9 C. Rolfs,10
C. Rossi Alvarez,3 E. Somorjai,6 O. Straniero,11 F. Strieder,10 F. Terrasi,12 H.P. Trautvetter,10 and A. Vomiero13
(The LUNA Collaboration)1Helmholtz-Zentrum Dresden-Rossendorf, Bautzner Landstr. 400, 01328 Dresden, Germany†
2INFN, Laboratori Nazionali del Gran Sasso (LNGS), Assergi (AQ), Italy3Istituto Nazionale di Fisica Nucleare (INFN), Sezione di Padova, via Marzolo 8, 35131 Padova, Italy
4Dipartimento di Fisica, Universita degli studi di Siena, Italy5Universita di Genova and INFN Sezione di Genova, Genova, Italy
6Institute of Nuclear Research (ATOMKI), Debrecen, Hungary7Dipartimento di Fisica Sperimentale, Universita di Torino and INFN Sezione di Torino, Torino, Italy
8Universita degli Studi di Milano and INFN, Sezione di Milano, Italy9Dipartimento di Scienze Fisiche, Universita di Napoli ”Federico II”, and INFN Sezione di Napoli, Napoli, Italy
10Institut fur Experimentalphysik III, Ruhr-Universitat Bochum, Bochum, Germany11Osservatorio Astronomico di Collurania, Teramo, and INFN Sezione di Napoli, Napoli, Italy
12Seconda Universita di Napoli, Caserta, and INFN Sezione di Napoli, Napoli, Italy13Consiglio nazionale delle ricerche, CNR-IDASC Sensor Lab, Brescia, Italy
The rate of the carbon-nitrogen-oxygen (CNO) cycle of hydrogen burning is controlled by the14N(p,γ)15O reaction. The reaction proceeds by capture to the ground states and several excitedstates in 15O. In order to obtain a reliable extrapolation of the excitation curve to astrophysicalenergy, fits in the R-matrix framework are needed. In an energy range that sensitively tests suchfits, new cross section data are reported here for the four major transitions in the 14N(p,γ)15O reac-tion. The experiment has been performed at the Laboratory for Underground Nuclear Astrophysics(LUNA) 400 kV accelerator placed deep underground in the Gran Sasso facility in Italy. Using acomposite germanium detector, summing corrections have been considerably reduced with respectto previous studies. The cross sections for capture to the ground state and to the 5181, 6172, and6792 keV excited states in 15O have been determined at 359, 380, and 399 keV beam energy. Inaddition, the branching ratios for the decay of the 278 keV resonance have been remeasured.
PACS numbers: 25.40.Ep, 25.40.Lw, 26.20.Cd, 26.65.+t
I. INTRODUCTION
The stellar rate of the carbon-nitrogen-oxygen (CNO)cycle of hydrogen burning [1, 2] is controlled by theslowest process, the 14N(p,γ)15O reaction [3]. In theSun, hydrogen burning proceeds mainly by the compet-ing proton-proton chain, and the CNO cycle contributesonly 0.8% to the energy production [4]. However, solarCNO hydrogen burning gives rise to neutrino emissionlines from the β+ decay of 13N and 15O [4]. It has re-cently been suggested [5] to use the expected CNO neu-trino flux data from the Borexino detector [6] and theplanned SNO+ [7] detector to measure the abundance ofcarbon and nitrogen in the solar core. This would ad-dress the so-called solar metallicity problem [8, 9], whichis given by the fact that the new solar metallicities [10]lead to inconsistencies in the standard solar model. The
∗Present address: GSI Helmholtzzentrum fur Schwerionen-forschung, Darmstadt, Germany†As of 1 January 2011, Forschungszentrum Dresden-Rossendorf(FZD) has been renamed to Helmholtz-Zentrum Dresden-Rossendorf (HZDR).
correct interpretation of the expected CNO neutrino datarequires, however, that the nuclear reaction rate of theCNO cycle, which is determined by the 14N(p,γ)15O crosssection, be known with sufficient precision.The 14N(p,γ)15O cross section σ(E) can be parameter-
ized using the astrophysical S-factor
S(E) = σE exp[
212.4/√E]
, (1)
with E denoting the energy in the center of mass systemin keV.The excitation function has been studied previously
[11–13, e.g.], and these data determine the recommendedvalue in the current nuclear reaction rate compilations forastrophysics [14–16]. Subsequently, a number of new ex-perimental and theoretical results on this reaction havebeen reported [17–26], showing that the recommendedvalue of the reaction rate [14–16] has to be revised down-ward by a factor of two. In particular, capture to theground state in 15O (fig. 1) was shown to be stronglysuppressed [17–23]. This reduction is now adopted in avery recent compilation [27]. However, some open ques-tions remain.In particular, two groups have in recent years pre-
sented cross section data and performed R-matrix fits

2
!"#"$$"%&'
!&("$$!%&'
)"*&$$+%&,
)*-&$$+%&'
)#!-$$!%&'
*&*)$$*%&'
*!!)$$"%&'
.$$ $$"%&,
"(/$'$0$$$$$*&-*
FIG. 1: Level scheme of 15O, in keV [23, 28]. The mostimportant γ-transitions are denoted by arrows.
based on their new data: LUNA [21, 23] and TUNL[22]. These two works show excellent agreement whenit comes to the most important contribution to the to-tal S-factor, namely capture to the state at 6792keV:1.20±0.05 keVbarn [23] and 1.15±0.05 keVbarn [22],respectively. However, their results differ by muchmore than the quoted uncertainties when it comes tothe second most important contribution, capture tothe ground state: Whereas LUNA reported1 SGS(0) =0.25±0.06keVbarn [21], the TUNL value is double that,0.49±0.08keVbarn [22]. This discrepancy amounts toabout 15% of the total extrapolated Stot(0), dominatingthe uncertainty.The only significant methodical difference between the
two fits from LUNA [21, 23] and TUNL [22] is the treat-ment of high-energy data. The LUNA fit is a global fit,based on the LUNA data presented in the same paper,and on the Schroder et al. data [13] which had beencorrected for the summing-in effect. The TUNL fit, onthe other hand, is a partial fit based solely on the TUNLdata presented in the same paper, with the higher-energyR-matrix poles kept fixed based on a previous fit of theSchroder et al. data [13]. The starting values and generalprocedure for both fits are otherwise the same [18].The experimental data points by LUNA [21, 23] and
TUNL [22] are generally in agreement with each other,but they show some systematic uncertainty due to thefact that both groups had employed large germaniumdetectors in close geometry. This arrangement had beenchosen in order to obtain a high enough detection effi-ciency for the weak ground state capture line. However,
1 Si(0) denotes the S-factor, extrapolated to zero energy, for cap-ture to the state at i keV in 15O. SGS(0) and Stot(0) refer toground state capture and to the total S-factor, respectively.
in this way both groups also incurred true coincidencesumming-in corrections of more than 100% for the groundstate data. Such a large correction entails considerablesystematic uncertainty.The aim of the present work is to address the conflict-
ing extrapolations [21, 22] in two ways. The experimen-tal problem of the previous high summing-in correction issolved by using a Clover detector. The problem of the se-lection of the database is solved by providing the groundstate cross section relative to that for the well-known cap-ture to the state at 6792keV. The present relative datacan then be added to one particular data set without in-troducing additional scaling uncertainty. Alternatively,they can be rescaled to absolute data using an overall fitof 6792keV capture based on several independent works,strongly reducing the scaling uncertainty.For the present experiment, the energy range of E
= 317-353keV has been selected, far enough above the259keV resonance to limit resonant contributions, and atthe same time a region where a sensitive minimum [18]of R-matrix fits is observed. In principle, such a mea-surement would also have been possible at E ≈ 170keV,in a second sensitive minimum. However, the yield is afactor 100 lower there, so that the present energy rangewas chosen for practical purposes.The present relative cross section data have been pub-
lished previously in abbreviated form [25]. The presentwork provides full details of that experiment and analy-sis. In addition, new branching ratios for the decay of the259keV resonance obtained in even farther geometry arepresented here. The absolute off-resonance 14N(p,γ)15Ocross section for capture to the ground state and the 5181,6172, and 6792keV excited states is derived at Ep =359, 380, and 399 keV. In order to improve the reliabil-ity, this latter analysis is performed in two independentways, namely by the γ-line shape method [29] and by theclassical peak integral approach.
II. EXPERIMENT
The experiment was performed in the Laboratory forUnderground Nuclear Astrophysics (LUNA) at the GranSasso National Laboratory (Italy) [30, 31]. At the LUNAsite, the γ-ray laboratory background for Eγ > 3MeV isstrongly reduced due to the rock overburden equivalentto 3800 meters water [32, 33]. Also for Eγ ≤ 3MeV withproper shielding the γ-ray background has been foundto be much lower than in comparable laboratories at thesurface of the Earth [34]. The unique location of LUNAhas enabled the study of several nuclear reactions of as-trophysical importance [21, 35–40].
A. Setup
The LUNA2 400kV accelerator [29] provided a H+
beam of Ep = 359, 380, and 399 keV, with 0.25-0.45mA

3
!"#$%&'()*+%,-../
0)123%4)5
6)
71*()5
8*"5"'%9)14
!"##:415"*
6)
FIG. 2: (Color online) Schematic view of the experimentalsetup.
!"# $## $!# $%##&##
#&#'
#&(#
#&('
#&!#
!)*+,-./
0-123435-*67-89*+4:;7<:4:6*=37<1/
FIG. 3: (Color online) Scans of the Ep = 278 keV resonanceat the beginning of the experiment (black squares), one daywith 29C dose later (red triangles), and at the end of theexperiment after a total accumulated dose of 267C (blue cir-cles).
intensity. The ion beam passed a collimator of 5mm di-ameter, which absorbed a few percent of the full beam in-tensity, and a cold trap cooled by liquid nitrogen (fig. 2),before hitting the target. Secondary electrons emittedfrom the target surface were suppressed by applying -300V suppression voltage to the cold trap. The repro-ducibility of the current from run to run is estimated tobe 2%.
B. Target
A titanium nitride target produced by reactive sput-tering at Laboratori Nazionali di Legnaro was used forthe experiments. The target had 60 keV energetic widthat the Ep = 278 keV resonance (fig. 3), when irradiated
0.0005
0.001
0.002
0.004
0.008 (a)
(b)
500 1000 2000 4000 8000
Effi
cien
cy
Eγ [keV]
-2%
0%
2%
Res
idua
ls
FIG. 4: (Color online) (a) γ-ray detection efficiency for the de-tector at 9.5 cm distance from the target, as determined withradioactive sources and the two-line method at the 259 keVresonance. Solid (dashed) curve, efficiency for addback (sin-gles) mode. (b) Residuals. The data point at 7556 keV is notyet corrected for summing-in. It was excluded from the fit,and is shown here for illustration only. The pair of γ-raysat 5181 and 2375 keV was also not included in the fit but isplotted here as a check on the reliability of the curve.
under 55◦ angle. In order to obtain its stoichiometry,the stopping power at the resonance energy, the beamcurrent and the strength of the monitor resonance mustbe known. For the stopping of protons in titanium andnitrogen, the values from the SRIM software [41] havebeen used. For the strength of the resonance, ωγ =13.1±0.6meV was adopted, the recommended value fromRef. [27]. Based on this number, a stoichiometric ratioTi:N of 1:0.93 has been determined. The target stoi-chiometry gives rise to 6% systematic uncertainty in theabsolute cross section results, mainly from the referenceωγ value.
In order to properly correct for the change of the tar-get under intense proton bombardment, during the ex-periment the target profile was monitored every day byscanning the Ep = 278keV resonance (fig. 3). The sharplow-energy edge of the profile is given by the convolu-tion of the 0.1 keV energy spread of the beam [29] andthe 1.06 keV natural width of the resonance [42]. On theensuing constant plateau, the step height is proportionalto the inverse of the effective stopping power per 14Nnucleus in the compound.
A reduction of up to 7% in the integral of the targetprofile was observed from day to day, with a typical pro-ton dose of 24C (1.5 · 1020 H+ ions) deposited on thetarget per day. It is estimated that the target composi-tion is known with 5% precision for any given time duringthe experiment.

4
C. Detection of emitted γ-rays
The γ-rays emitted from the target were detected in aEurisys Clover-BGO detection system [43] placed at anangle of 55◦ with respect to the beam axis. The front endof the Clover detectors was at 9.5 cm distance from thetarget. For the branching-ratio measurement (sec. III D),the front end was placed at 19.5 cm distance from thetarget instead.The output signal from each of the four Clover crystals
was split into two branches called branch ’S’ and branch’A’. For branch ’S’, each of the four signals was amplifiedand digitized separately, and the four spectra were gain-matched and summed in the offline analysis, giving theso-called singles mode.For branch ’A’, the preamplifier output signals were
gain-matched and added in a homemade analog summingunit. The added signal was then amplified and digitized,giving the so-called addback mode spectra. Typical res-olutions for addback (singles) mode were 9 keV (3.3 keV)at 1.3MeV and 12 keV (6 keV) at 6.8MeV. For experi-ments off the 259keV resonance, the addback mode datawere recorded in anticoincidence with the BGO escape-suppression shield to reduce the Compton background.The γ-ray detection efficiency was measured using
137Cs and 60Co radioactive sources calibrated to 1.5%and 0.75% (1σ confidence range), respectively. The ef-ficiency curve (fig. 4, upper panel) was then extendedto high energy based on spectra recorded at the 259 keV1/2+ resonance, using the known 1:1 γ-ray cascades forthe excited states at 6172 and 6792keV [42]. The γ-rays from the decay of this 1/2+ resonance are isotropic[42]. The angular correlations of 8-10% between primaryand secondary γ-ray are experimentally well known [44].They result in up to 0.4% correction on the efficiencycurve, because they affect the summing-out correction.For the worst case, the 6792keV γ-ray, the calculatedsumming-out correction is 3.6% in addback mode (1.1%in singles mode), with an assumed relative uncertaintyof 20%. This result is consistent with a GEANT4 [45]simulation showing (4.5±1.8)% correction.As a check on the quality of the efficiency curve, the
experimental cascade ratio for the 5181keV excited state(not used in the fit) was found to be reproduced within1% statistics (fig. 4, lower panel), again assuming 1:1 γ-ray cascade ratio [42].
III. DATA ANALYSIS AND RESULTS
The first part of the analysis concentrated on the ratioof the cross sections for radiative proton capture to theground state and the fourth excited state at 6792keVin 15O, determined with the detector at 9.5 cm distancefrom the target. These relative data have been reportedpreviously in abbreviated form [25] and are discussed indetails in sec. III A. Subsequently, also absolute crosssection data for the four most important γ-transitions
are derived from the spectra. This analysis is performedboth by classical peak integrals for the addback modedata (sec. III B), and by γ-line shape analysis for thesingles mode data (sec. III C). Finally, by moving thedetector to 19.5 cm distance from the target, more precisebranching ratios for the decay of the 259 keV resonanceare presented (sec. III D).
A. Ratio of the cross sections for capture to the
ground state and the 6792 keV excited state in 15O
For the relative analysis, the number of counts in theground state capture peak at Eγ ≈ 7600keV is com-pared with the number of counts in the secondary γ-rayat 6792keV (fig. 5). In such an analysis, only the rela-tive uncertainty when extending the efficiency curve overthis limited energy range contributes to the uncertaintyof the ratio (0.8% effect).The 6792keV counting rate contains some on-resonant
contribution. This is due to the 60 keV (full width at halfmaximum) thick target. When the beam slows down tothe strong resonance at Ep = 278keV, it still finds someTiN in the tail of the target. In order to correct forthis effect, the primary γ-rays for capture to this levelare analyzed, as well, and the 6792keV counting rateis rescaled with the resonant/off-resonant ratio as ob-tained from the low-energy primaries (fig. 6). The reduc-tion in 6792keV counting rate by the escape-suppressionshield contributes 1.2% to the final uncertainty, and thesumming-out correction for this peak contributes 0.6%.Based on these data, the ratio
RGS/6792(E) =σGS(E)
σ6792(E)(2)
has been calculated (table I). The present data supersedethe data published previously in abbreviated form [25],due to an upgraded background determination (fig. 6,blue dashed lines), described in section III B. The ratiodepends only on the counting rates for the Eγ ≈ 7600keVground state capture γ-ray, for the Eγ = 6792keV γ-ray (corrected for resonant capture as described above),and on the ratio of the γ-detection efficiencies at Eγ ≈7600 and 6792keV. For the ground state capture γ-ray, asumming-in correction of up to 30% (4.3%) for addback(singles) mode was taken into account (table I, last col-umn).When computing RGS/6792(E), the current measure-
ment and the target stoichiometry and profile cancel out,eliminating the major sources of uncertainty. There-fore, the relative analysis method allows to derive datawith much better precision than for absolute data. Thepresent relative data can then be rescaled with averageddata for the well-studied cross section for capture to the6792keV state, and uniquely precise data for capture tothe ground state can be obtained.The effective interaction energies have been deter-
mined for each γ-line with two methods: First, the cen-

5
0.1(a) Ep = 399 keV1
10
100
1000
0.1(b) Ep = 380 keV1
10
100
1000
0.1(c) Ep = 359 keV1
10
100
1000
0.1(d) Ep = 278 keV1
10100
1000
5000 5500 6000 6500 7000 7500 8000
Cou
nts
/ keV
hou
r
Eγ [keV]
DC 0
7556 06792 06172 05181 0
FIG. 5: (Color online) High-energy part of the γ-ray spectra for addback mode (red full line) and singles mode (green dashedline). (a)-(c): Off-resonant spectra at Ep = 399, 380, and 359 keV, respectively, with the detector at 9.5 cm distance from thetarget. (d): On-resonance spectrum on the Ep = 278 keV resonance, with the detector at 19.5 cm distance from the target.The resonant contribution by the tail of the target is well visible also in the off-resonant spectra. The contaminant peaks stemfrom the 19F(p,αγ)16O reaction.
TABLE I: Cross section ratio RGS/6792(E) and relative un-certainty. The size of the summing-in correction is also given.The present data supersede Ref. [25], due to an improvedbackground determination.
E [keV] mode RGS/6792(E) stat. syst. Summing-in[10−2] uncertainty correction
315.3±1.3 addback 5.24 11% 5.4% 30%singles 5.22 15% 2.7% 4.3%
333.1±1.0 addback 5.33 4.8% 3.9% 21%singles 5.58 11% 2.5% 3.4%
353.3±1.0 addback 5.20 3.5% 3.5% 19%singles 5.43 8.0% 2.3% 3.2%
troid of the off-resonant primary γ-line has been used,taking into account the reaction Q-value and γ-level en-ergies. Second, the average energy, weighted with thepredicted counts from the known target profile and theexpected energy dependence of the cross section from the
R-matrix S-factor curve [23]. The two values were nevermore than 2.6 keV apart, and their average was adoptedfor each line. The results are slightly different for groundstate capture and capture to the 6792keV state, becausethe S-factor curve from previous R-matrix fits has a dif-ferent slope for these two transitions. Therefore, the av-erage of the two values is adopted as effective energy tobe connected with the cross section ratio RGS/6792(E),with the assigned 1σ error bar covering both effectiveenergy values.
For the relative data, the total systematic uncertaintyis 3.5 - 5.4% in addback mode (table II). For singlesmode, due to the lower summing corrections, it is 2.3 -2.7%.
For all three data points, the addback and singlesmode data are in good agreement. Due to the higherγ-efficiency of the addback mode data (which, in turn, isdue to the well-known addback factor of Clover-type de-tectors [46], which has been redetermined for the present

6
detector and geometry [33]) and due to the backgroundreduction achieved by the escape-suppression shield forthe addback mode data, the addback data have muchbetter statistics than the singles mode. Therefore, theaddback data are adopted for the further analysis despitetheir slightly higher systematic uncertainty.
B. Absolute cross sections based on the peak
integrals of the addback mode data
As a second step, the absolute cross section for captureto the excited states at 5181, 6172, and 6792keV and tothe ground state of 15O has been derived, accepting thatthe systematic uncertainty (table II) includes now alsothe contributions from current measurement, target sto-ichiometry and profile, and absolute detection efficiency.Only the addback mode data were considered.In order to obtain the net counting rate, a straight-line
background based on two flat regions to the left and rightof the region of interest (ROI) has been subtracted fromthe integral over the ROI. This procedure was appliedfor every secondary except for the decay of the 6172keVexcited state, where a different method was applied. Itwas repeated for each transition of the run at 399 keV,both for the primary (resonant and non-resonant) andsecondary γ-rays.However, in many cases it was not possible to apply
this method of background determination: At Ep = 359and 380keV, the off-resonant part of the primaries lieclose to the resonant peak (fig. 6, second and third row).The secondary at Eγ ≈ 6172keV was problematic, aswell, due to the 19F(p,αγ)16O background peak at Eγ ≈6130keV (fig. 5). For these spectra, a different methodwas instead used to estimate the background: The ra-tio between the difference in average counts per channelobserved to the left and right of the peak, and the netarea of the peak itself, was calculated. The ratios ob-served on the resonance, where no additional resonantcontribution exists and where beam-induced backgroundis negligible, have then been used to calculate the back-ground at the same γ-energy in the problematic spectra.For those problematic spectra, a minimum uncertainty of5% has been assumed for the quantity subtracted fromthe raw integral of the ROI. Finally, it was ensured thatthe 1σ uncertainty of the counts includes also results withdifferent choices of background regions.The net counting rate was then determined from the
secondary γ-ray, rescaled for its non-resonant/resonantcontributions determined by the primary γ-rays. Basedon the counting rate, the target stoichiometry and profile(sec. II B, fig. 3), the beam current measurement, andthe γ-detection efficiency (fig. 4), the cross section wascalculated for these transitions. The angular distributionwas assumed to exhibit negligible contributions from allLegendre polynomials except for zero and second order.The second order Legendre polynomial cancels out at thepresent detection angle of 55◦.
TABLE II: Systematic uncertainties affecting cross section ra-tios (”relative”, sec. III A) and absolute cross sections (”ab-solute”, secs. III B and IIIC) for addback mode.
Affecting data... Description AmountRelative Absolute Summing-in, ground state line 3-5%Relative Absolute Escape-suppression efficiency 1.2%Relative Absolute Slope of γ-efficiency curve 0.8%Relative Absolute Summing-out 0.6%
Absolute Target, original stoichiometry 6%Absolute Target, profile change 5%Absolute Assumption on S-factor slope 1-9%Absolute Beam current reproducibility 2%Absolute Normalization of γ-efficiency 1.8%
Relative Total, addback mode 3.5-5.4%Absolute Total, addback mode 9-12%
For the determination of the astrophysical S-factorfrom a single data point, it is necessary to make someassumption on the relative shape of the S-factor curve.For the present analysis, the S-factor was assumed to varyover the target thickness as given by the previous LUNAR-matrix curve [23]. In order to check the uncertaintyintroduced by this assumption, the present analysis wasrepeated assuming a flat S-factor, and the full difference(1-9%, depending on the transition and beam energy)was adopted as systematic uncertainty. The effective in-teraction energy [47] was calculated based on the knowntarget profile and the assumed S-factor behaviour. Theuncertainties are half of the difference obtained by usinga flat S-factor instead of the LUNA’s curve [23].
C. Absolute cross sections based on the γ-line
shape analysis of the singles mode data
Subsequently, the absolute cross section for capture tothe excited states at 5181, 6172, and 6792keV and tothe ground state of 15O has also been calculated basedon the γ-line shape analysis approach. To this end, onlythe singles mode data, which are essentially free fromsumming corrections, have been used. This approach isthus complementary to the one described in the previoussection, which calculated peak integrals and used onlythe addback mode data.The γ-line shape analysis method has been described
previously in details [21, 23, 29], so it will only be out-lined here. The analysis of the line shape of the primaryγ-ray is possible because the observed line shape of aprimary transition is determined by the cross section be-havior σ(E) in the proton energy interval spanned by theincident beam during the slowing-down process in thetarget. Each center-of-mass beam energy E (at whichthe reaction takes place) corresponds to a γ-ray energy
Eγ = E +Q − Ex +∆EDoppler −∆ERecoil, (3)
with Q the reaction Q-value, Ex the energy of the excitedstate, and ∆EDoppler/Recoil the appropriate Doppler and

7
10
100
Capture to the 6792 keV state
Ep = 399 keV
10
100
Capture to the 6172 keV state
Ep = 399 keV
10
Capture to the 5181 keV state
Ep = 399 keV
10
100Ep = 380 keV
10
100Ep = 380 keV
10
Ep = 380 keV
10
100
750 800 850 900
Cou
nts
/ keV
hou
r
Ep = 359 keV
10
100
1350 1400 1450 1500Eγ [keV]
Ep = 359 keV
10
2350 2400 2450 2500
Ep = 359 keV
FIG. 6: (Color online) Low-energy part of the γ-ray spectra for addback mode (red full line), after subtraction of the laboratorybackground. For completeness, the laboratory background is also included (black dotted line). Rows from top to bottom: Ep
= 399, 380, 359 keV. Columns from left to right: Primary γ-ray for capture to the excited state at 6792, 6172, 5181 keV. Thepeak from resonant capture (by the tail of the target) is clearly visible at the left of each panel. The non-resonant capturehas a shape reflecting the profile of the target, convoluted with the energy-dependent cross section. The analysis of the 6172primary (central column) is hampered by the strong 40K laboratory background line; this is reflected in higher uncertainty forthis transition. The regions of interest and the assumed background are shown by blue dashed lines.
recoil corrections. The γ-line shape is also influenced bythe energy loss of the protons in the target, because thestopping power of the protons in titanium nitride is afunction of proton energy [41].The number of counts Ni in channel i of the
γ-spectrum, corresponding to the energy bin[Eγi,Eγi+δEγ ], where δE is the dispersion in unitsof keV per channel, is given by the expression
Ni =σ(Ei)δEγηfe(Eγi)bk
ε(Ei)(4)
for Ei ≤ E. Here Ei is the center-of-mass proton en-ergy corresponding to channel i, E is the incident protonenergy in the center-of-mass, σ(Ei) is the cross sectionunder study, ηfe(Eγ,i) is the γ-ray detection efficiency,ε(Ei) is the stopping power and bk is the branching ofthe transition under study. The conversion from Eγ,i
to Ei includes the Doppler and recoil effects, as shown ineq. (3). The resulting count rate is folded with the known
energy resolution ∆Eγ of the γ-ray detector to obtain theexperimental line-shape.To facilitate the fit, the cross section σ(E) entering
into eq. (4) is then parameterized, in the limited energywindow defined by the target thickness ∆ETarget, as thesum of a resonant term described by the Breit-Wignerformula, and a non-resonant term, for which a constantastrophysical S-factor Snr is assumed:
σ(Ei) =λ2
πωγ
Γ
(Ei − ER)2 + (Γ/2)2)+
Snre−2πη
Ei(5)
Here, λ is the de Broglie wavelength, ωγ the strengthvalue of the 259 keV resonance (here, 12.9meV wasused [23], very close to the recently recommended valueof 13.1meV [27]), ER the energy of the resonance, Γthe energy-dependent total width of the resonance, ande−2πη is the Sommerfeld parameter. Since the branchingratios and the ωγ of the resonance are kept fixed, thefree parameters in this procedure are the non-resonant
8
0×10-8
1×10⁻⁸
2×10⁻⁸
3×10⁻⁸
4×10⁻⁸
5×10⁻⁸
6×10⁻⁸
7×10⁻⁸
8×10⁻⁸
9×10⁻⁸
780 800 820 840 860 880 900
σ(E
) [b
arn]
Eγ [keV]
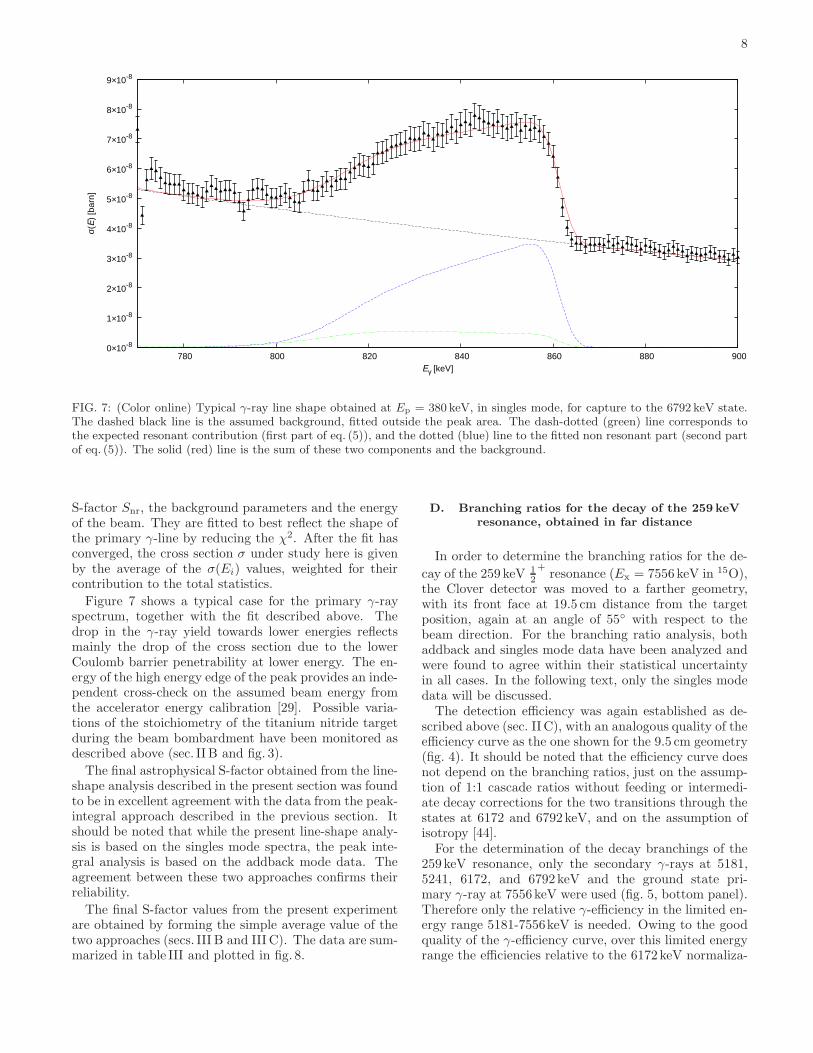
FIG. 7: (Color online) Typical γ-ray line shape obtained at Ep = 380 keV, in singles mode, for capture to the 6792 keV state.The dashed black line is the assumed background, fitted outside the peak area. The dash-dotted (green) line corresponds tothe expected resonant contribution (first part of eq. (5)), and the dotted (blue) line to the fitted non resonant part (second partof eq. (5)). The solid (red) line is the sum of these two components and the background.
S-factor Snr, the background parameters and the energyof the beam. They are fitted to best reflect the shape ofthe primary γ-line by reducing the χ2. After the fit hasconverged, the cross section σ under study here is givenby the average of the σ(Ei) values, weighted for theircontribution to the total statistics.
Figure 7 shows a typical case for the primary γ-rayspectrum, together with the fit described above. Thedrop in the γ-ray yield towards lower energies reflectsmainly the drop of the cross section due to the lowerCoulomb barrier penetrability at lower energy. The en-ergy of the high energy edge of the peak provides an inde-pendent cross-check on the assumed beam energy fromthe accelerator energy calibration [29]. Possible varia-tions of the stoichiometry of the titanium nitride targetduring the beam bombardment have been monitored asdescribed above (sec. II B and fig. 3).
The final astrophysical S-factor obtained from the line-shape analysis described in the present section was foundto be in excellent agreement with the data from the peak-integral approach described in the previous section. Itshould be noted that while the present line-shape analy-sis is based on the singles mode spectra, the peak inte-gral analysis is based on the addback mode data. Theagreement between these two approaches confirms theirreliability.
The final S-factor values from the present experimentare obtained by forming the simple average value of thetwo approaches (secs. III B and III C). The data are sum-marized in table III and plotted in fig. 8.
D. Branching ratios for the decay of the 259 keV
resonance, obtained in far distance
In order to determine the branching ratios for the de-
cay of the 259 keV 12
+resonance (Ex = 7556keV in 15O),
the Clover detector was moved to a farther geometry,with its front face at 19.5 cm distance from the targetposition, again at an angle of 55◦ with respect to thebeam direction. For the branching ratio analysis, bothaddback and singles mode data have been analyzed andwere found to agree within their statistical uncertaintyin all cases. In the following text, only the singles modedata will be discussed.The detection efficiency was again established as de-
scribed above (sec. II C), with an analogous quality of theefficiency curve as the one shown for the 9.5 cm geometry(fig. 4). It should be noted that the efficiency curve doesnot depend on the branching ratios, just on the assump-tion of 1:1 cascade ratios without feeding or intermedi-ate decay corrections for the two transitions through thestates at 6172 and 6792keV, and on the assumption ofisotropy [44].For the determination of the decay branchings of the
259keV resonance, only the secondary γ-rays at 5181,5241, 6172, and 6792keV and the ground state pri-mary γ-ray at 7556keV were used (fig. 5, bottom panel).Therefore only the relative γ-efficiency in the limited en-ergy range 5181-7556keV is needed. Owing to the goodquality of the γ-efficiency curve, over this limited energyrange the efficiencies relative to the 6172keV normaliza-

9
! "!! #!! $!! %!!
!&!"
!&"
"
!!"#$%&
"'()(#!$%"#$%!*+,-&
!.!/!'()(!#$%!01+1$
! "!! #!! $!! %!!
!&"
"
!!"#$%&
"'()*#!$%"#$%!+,-.&
!/!0!'()*!#$%!12,2$
! "!! #!! $!! %!!
!
"
#
$
!!"#$%&
"# '()*$!%!!"#$%!+,-.&
!/!0!'()*!#$%!12,2$
! "!! #!! $!! %!!
!&!"
!&"
!!"#$%&
"'(#!$%"#$%!)*+,&
'+-.,/!01*1$
FIG. 8: (Color online) S-factor for capture to the excited states at 5181, 6172, and 6792 keV and to the ground state in 15O.Data: Black diamonds [13], blue squares [21, 23], green circles [22], red full triangles (present work, average of secs. III B andIIIC). R-matrix fits: Black dotted curve [19], blue dash-dotted curve [21, 23], green dashed curve [22], black full curve [27], redlong-dashed curve [25]. — For ground state capture, the black inverted triangles represent the present relative data (sec. IIIA),rescaled with the averaged S-factor for capture to the 6792 keV state as described in the text. For capture to the 5181 keVstate, no R-matrix fits are given in Refs. [19, 22]. Error bars reflect the statistical uncertainty.
TABLE III: S-factor results for capture to the ground state and to the excited states at 5181, 6172, and 6792 keV. The effectiveenergy E is given in keV, the S-factor S in keV barn, and the relative uncertainties for S in percent.
Capture to ground state Capture to 5181 keV state Capture to 6172 keV state Capture to 6792 keV stateE SGS ∆stat ∆syst E S5181 ∆stat ∆syst E S6172 ∆stat ∆syst E S6792 ∆stat ∆syst
314.6±1.0 0.074 11% 12% 310.6±2.2 0.370 16% 11% 310.5±1.0 1.072 8% 12% 315.9±1.3 1.495 5.0% 9%333.6±1.0 0.061 5% 11% 327.6±1.6 0.218 12% 12% 326.6±1.0 0.406 18% 12% 332.6±1.0 1.245 3.0% 9%353.9±1.0 0.061 4% 10% 350.9±2.5 0.128 13% 10% 351.1±2.2 0.220 15% 10% 352.7±1.0 1.157 1.7% 9%
tion point are known on the level of ±0.5%, enabling aprecise determination of the branching ratios.
For the major transitions through the excited states at5181, 6172, and 6792keV, the present branching ratios(tab. IV) are in excellent agreement with the modernliterature [22, 23]. However, some minor discrepanciesarise when it comes to the minor transitions.
The ground state transition has been the subject ofdiscussion in recent years. It is now well-known thatthe previously accepted value of (3.5±0.5)% [12, 42, 48]was much too high, probably due to summing-in. The
two most recent previous branching ratio measurements[22, 23] were both performed at about 20 cm distance,where there is still more than 10% summing-in correc-tion. The present value of (1.49±0.04)% has been ob-tained at 19.5 cm distance, with just 2.0% summing-incorrection for the singles mode data, much less thanin previous works. Note that the value (1.53±0.06)%from an abbreviated version of the present work [25] hadbeen obtained in closer geometry, at 9.5 cm distance, with7.4% summing-in correction. The present (1.49±0.04)%ground state branching supersedes all previous LUNA

10
TABLE IV: Branching ratios for the decay of the 259 keVresonance (Ex = 7556 keV in 15O) obtained with the Cloverdetector in singles mode, at 19.5 cm distance from the target.The numbers are compared with previous data [22, 23, 42].
Branching [%]Ajzenberg- TUNL [22] LUNA [23] LUNA,Selove [42] present work
7556→ 0 3.5±0.5 1.70±0.07 1.6±0.1 1.49±0.04→5181 15.8±0.6 17.3±0.2 17.1±0.2 17.3±0.2→5241 0.6±0.3 0.15±0.03→6172 57.5±0.4 58.3±0.5 57.8±0.3 58.3±0.4→6792 23.2±0.6 22.7±0.3 22.9±0.3 22.6±0.3
branching ratio measurements of the 259keV resonance,i.e. [23, 25].For the transition to the 5241keV state, the previous
(0.6±0.3)% value [23] was possibly affected by feedingthrough higher-lying excited states. Based on the differ-ence between 5241 → 0 and 7556 → 5241 γ-rays, thisfeeding contribution amounts to (0.20±0.10)% of the to-tal decay branching. It is probably due to the 6859keVstate, which decays to 100% to the 5241keV state [42].However, such a weak feeding could possibly also arisethrough the 6172 or 6792keV states, so in absence ofconclusive evidence this (0.20±0.10)% is not assigned toany transition.For the transition to the 5181keV state, the present
data confirms the slightly higher modern values [22, 23]with respect to the compilation [42].
IV. R-MATRIX ANALYSIS OF GROUND
STATE CAPTURE
For the purpose of an R-matrix analysis, the presentrelative data (sec. III A, table I) have been renormal-ized using a weighted average S-factor for capture to the6792keV state. Based on these values and the correctedSchroder data [13, 21], a new R-matrix fit for groundstate capture has already been presented in the abbrevi-ated form of the present work [25]. The present updatedrelative data are close to the values published in abbrevi-ated form [25], so this update does not warrant a revisedfit.Also the present absolute data (sec. III B) do not sig-
nificantly deviate from the relative data, renormalized asstated above (fig. 8, bottom right panel). It should benoted that the present absolute data for capture to the6792keV state (fig. 8, bottom left panel) are in excellentagreement with previous data [22, 23] and R-matrix fits[22, 23], confirming that the renormalization procedurewas adequate. By design the absolute data have higheruncertainty than the relative data (table II) that havealready been included in the fit [25], so no new R-matrixfit is attempted here.The previous fit [25] is instead shown again here
(fig. 8, bottom right panel), leading to SGS(0) =
0.20±0.05keVbarn. That value is lower than the recentlyrecommended 0.27±0.05keVbarn [27], but still in agree-ment given the error bars. The difference is mainly dueto the fact that in the present work, only the present andthe Schroder [13] data (corrected for summing-in [21]) areincluded. The data from Refs. [22, 23] are excluded dueto concerns about the summing corrections. In Ref. [27],instead, the data from Refs. [22, 23] have also been in-cluded in the fit.
V. SUMMARY AND OUTLOOK
The 14N(p,γ)15O reaction has been studied with acomposite Clover-type detector at the LUNA under-ground facility at Ep = 359, 380, and 399keV, in an en-ergy range important for future R-matrix fits of captureto the ground state in 15O. Precise cross section ratios forground state capture relative to capture to the 6792keVstate have been presented, updating and extending theirprevious abbreviated publication [25].The present, precise relative cross section data (table I)
helped resolve the discrepancy between the previous, con-flicting extrapolations for ground state capture [21, 22],in favour of Ref. [21]. The present recommended value ofSGS(0) = 0.20±0.05keVbarn is based on a dataset wherethe summing-in correction is not larger than 50% [13] forthe high-energy data and not larger than 30% for thepresent, lower-energy data.The present absolute cross sections for capture to
the excited states at 5181, 6172, and 6792keV (fig. 8,table III) have been obtained with two independentanalysing methods (secs. III B and III C). They are gen-erally in good agreement with previous works [22, 23]and in some cases more precise. They are in overall goodagreement with the most recent R-matrix fit [27]. Be-cause of their limited energy span, the present data alonecannot form the basis of new extrapolations. However,they may serve as useful reference points in an energyrange that may be accessible not only at LUNA, but alsoat future underground accelerators.The new branching ratios for the decay of the 259keV
resonance that are shown here improve the precision ofthe database for this resonance. Since this resonance isoften used as normalization point for experimental workon the 14N(p,γ)15O reaction [21–23, 26, e.g.], this im-proved information again facilitates future precision stud-ies of this reaction.The present data are an important ingredient in up-
dates of the standard solar model [5, 8, 9]. When ex-perimental data for the flux of solar CNO neutrinos dueto the β-decay of 13N and 15O become available fromBorexino [6] or SNO+ [7], precise 14N(p,γ)15O cross sec-tions may contribute to a direct measurement of the solarmetallicity through a comparison of CNO and 8B neu-trino fluxes [5].Possible next steps in improving the precision for the
extrapolated S-factor of this reaction [27] are to re-study

11
the cross section at higher energies [26], in order to im-prove the extrapolation, and a remeasurement of thestrength of the 259keV resonance.
Acknowledgments
This work has been supported by INFN and in partby the EU (ILIAS-TA RII3-CT-2004-506222), OTKA
(K68801 and NN 83261), and DFG (BE4100/2-1 andRO439/41-1).
[1] H. Bethe, Phys. Rev. 55, 103 (1939).[2] C.-F. von Weizsacker, Phys. Z. 39, 633 (1938).[3] C. Iliadis, Nuclear Physics of Stars (Wiley-VCH, Wein-
heim, 2007).[4] J. N. Bahcall, A. M. Serenelli, and S. Basu, Astrophys. J.
621, L85 (2005).[5] W. C. Haxton and A. M. Serenelli, Astrophys. J. 687,
678 (2008).[6] C. Arpesella et al., Phys. Rev. Lett. 101, 091302 (2008).[7] M. C. Chen, Nucl. Phys. B (Proc. Suppl.) 145, 65 (2005).[8] C. Pena-Garay and A. Serenelli, ArXiv e-prints (2008),
0811.2424.[9] A. M. Serenelli, S. Basu, J. W. Ferguson, and M. As-
plund, Astrophys. J. Lett. 705, L123 (2009).[10] M. Asplund, N. Grevesse, A. J. Sauval, and P. Scott,
Ann. Rev. Astron. Astroph. 47, 481 (2009).[11] W. Lamb and R. Hester, Phys. Rev. 108, 1304 (1957).[12] D. F. Hebbard and G. M. Bailey, Nucl. Phys. 49, 666
(1963).[13] U. Schroder et al., Nucl. Phys. A 467, 240 (1987).[14] G. Caughlan and W. Fowler, At. Data Nucl. Data Tables
40, 283 (1988).[15] E. Adelberger et al., Rev. Mod. Phys. 70, 1265 (1998).[16] C. Angulo et al., Nucl. Phys. A 656, 3 (1999).[17] P. Bertone et al., Phys. Rev. Lett. 87, 152501 (2001).[18] C. Angulo and P. Descouvemont, Nucl. Phys. A 690, 755
(2001).[19] A. Mukhamedzhanov et al., Phys. Rev. C 67, 065804
(2003).[20] K. Yamada et al., Phys. Lett. B 579, 265 (2004).[21] A. Formicola et al., Phys. Lett. B 591, 61 (2004).[22] R. C. Runkle et al., Phys. Rev. Lett. 94, 082503 (2005).[23] G. Imbriani et al., Eur. Phys. J. A 25, 455 (2005).
[24] D. Schurmann, et al., Phys. Rev. C 77, 055803 (2008).[25] M. Marta et al., Phys. Rev. C 78, 022802(R) (2008).[26] M. Marta et al., Phys. Rev. C 81, 055807 (2010).[27] E. Adelberger et al., Rev. Mod. Phys., in press (2010),
1004.2318.[28] F. Ajzenberg-Selove, Nucl. Phys. A 523, 1 (1991).[29] A. Formicola et al., Nucl. Inst. Meth. A 507, 609 (2003).[30] H. Costantini et al., Rep. Prog. Phys. 72, 086301 (2009).[31] C. Broggini, D. Bemmerer, A. Guglielmetti, and
R. Menegazzo, Annu. Rev. Nucl. Part. Sci. 60, 53 (2010).[32] D. Bemmerer et al., Eur. Phys. J. A 24, 313 (2005).[33] T. Szucs et al., Eur. Phys. J. A 44, 513 (2010).[34] A. Caciolli et al., Eur. Phys. J. A 39, 179 (2009).[35] R. Bonetti et al., Phys. Rev. Lett. 82, 5205 (1999).[36] G. Imbriani et al., Astron. Astrophys. 420, 625 (2004).[37] A. Lemut, D. Bemmerer, et al., Phys. Lett. B 634, 483
(2006).[38] D. Bemmerer et al., Phys. Rev. Lett. 97, 122502 (2006).[39] D. Bemmerer et al., J. Phys. G 36, 045202 (2009).[40] B. Limata et al., Phys. Rev. C 82, 015801 (2010).[41] J. Ziegler (2008), Software SRIM, URL
http://www.srim.org.[42] F. Ajzenberg-Selove, Nucl. Phys. A 523, 1 (1991).[43] Z. Elekes et al., Nucl. Inst. Meth. A 503, 580 (2003).[44] B. Povh and D. F. Hebbard, Phys. Rev. 115, 608 (1959).[45] S. Agostinelli et al., Nucl. Inst. Meth. A 506, 250 (2003).[46] G. Duchene et al., Nucl. Inst. Meth. A 432, 90 (1999).[47] C. Rolfs and W. Rodney, Cauldrons in the Cosmos (Uni-
versity of Chicago Press, Chicago, 1988).[48] T. Tabata and K. Okano, J. Phys. Soc. Japan 15, 1552
(1960).
Copyright © 2022 FDOKUMEN