Tempo and mode of gene duplication in mammalian ribosomal protein evolution
15
Tempo and Mode of Gene Duplication in Mammalian Ribosomal Protein Evolution Asav P. Dharia . , Ajay Obla . , Matthew D. Gajdosik, Amanda Simon, Craig E. Nelson* University of Connecticut Department of Molecular and Cell Biology, Storrs, Connecticut, United States of America Abstract Gene duplication has been widely recognized as a major driver of evolutionary change and organismal complexity through the generation of multi-gene families. Therefore, understanding the forces that govern the evolution of gene families through the retention or loss of duplicated genes is fundamentally important in our efforts to study genome evolution. Previous work from our lab has shown that ribosomal protein (RP) genes constitute one of the largest classes of conserved duplicated genes in mammals. This result was surprising due to the fact that ribosomal protein genes evolve slowly and transcript levels are very tightly regulated. In our present study, we identified and characterized all RP duplicates in eight mammalian genomes in order to investigate the tempo and mode of ribosomal protein family evolution. We show that a sizable number of duplicates are transcriptionally active and are very highly conserved. Furthermore, we conclude that existing gene duplication models do not readily account for the preservation of a very large number of intact retroduplicated ribosomal protein (RT-RP) genes observed in mammalian genomes. We suggest that selection against dominant-negative mutations may underlie the unexpected retention and conservation of duplicated RP genes, and may shape the fate of newly duplicated genes, regardless of duplication mechanism. Citation: Dharia AP, Obla A, Gajdosik MD, Simon A, Nelson CE (2014) Tempo and Mode of Gene Duplication in Mammalian Ribosomal Protein Evolution. PLoS ONE 9(11): e111721. doi:10.1371/journal.pone.0111721 Editor: Marc Robinson-Rechavi, University of Lausanne, Switzerland Received May 20, 2014; Accepted October 6, 2014; Published November 4, 2014 Copyright: ß 2014 Dharia et al. This is an open-access article distributed under the terms of the Creative Commons Attribution License, which permits unrestricted use, distribution, and reproduction in any medium, provided the original author and source are credited. Data Availability: The authors confirm that all data underlying the findings are fully available without restriction. All relevant data are within the paper and its Supporting Information files. Funding: This work was supported by National Science Foundation (NSF) Grant Award Number: 1024803 (http://nsf.gov/awardsearch/showAward?AWD_ ID = 1024803&HistoricalAwards = false). Author CEN was the principal investigator on the NSF grant who received the funding. The funders had no role in study design, data collection and analysis, decision to publish, or preparation of the manuscript. Competing Interests: The authors have declared that no competing interests exist. * Email: [email protected] . These authors contributed equally to this work. Introduction Gene Duplication and Genome Evolution In 1970, Susumu Ohno hypothesized that gene duplication provided the raw material required for the diversification of gene function. It is now appreciated that gene duplication and loss is a dynamic process that has given rise to many large gene families critical to the evolution of complex organisms [1]. Recent data reveal that lineage-specific expansion and contraction of gene families is more rapid than previously appreciated, and is responsible for major differences in gene family size between closely related mammalian genomes [2]. These differences are likely to have made major contributions to the divergence of mammalian lineages and to human evolution [3,4]. For this reason, understanding the forces that lead to the retention or loss of duplicated genes in complex genomes is fundamental to understanding genome evolution, and particularly to the evolution of complex organisms. Scales, Mechanisms, and Outcomes of Gene Duplication Duplications occur at all genomic scales, from a single nucleotide to the entire genome, and vary greatly in frequency. Depending on the nature of the duplication, these events can have a positive, negative or neutral effect upon an organism. For example, duplications involving a single gene or set of genes can be associated with enrichment for essential functions, while large scale duplications can be associated with important evolutionary transitions, major leaps in development, and the adaptive radiation of species [5,6]. Many physical mechanisms can give rise to duplication events: (1) whole-genome duplication (WGD), (2) tandem duplication (i.e., unequal crossing-over), (3) duplicative transposition, and (4) retrotransposition. WGD, tandem duplica- tion, and duplicative transposition are DNA-mediated events, while retrotransposition is the Reverse Transcriptase (RT)- mediated insertion of a cDNA into the host genome. A WGD is believed to have occurred in yeast [7], and several have been inferred in the teleost lineage [8]; while the last WGD believed to have occurred in the mammalian lineage took place before the emergence of modern mammals [9,10]. Compared to these very large scale and rare events, duplicative transpositions and tandem duplications are likely to drive much of the duplication and loss giving rise to complex gene families. These are DNA-mediated processes that preserve varying amounts of the source gene’s intron-exon structure [4]. Often, depending on the scale of the duplication, varying amounts of the intergenic regulatory DNA flanking the duplicated gene is also transferred, increasing the likelihood of a functional duplicate being created [11]. In contrast, retrotransposition is a process whereby a spliced mRNA transcript PLOS ONE | www.plosone.org 1 November 2014 | Volume 9 | Issue 11 | e111721
-
Upload
independent -
Category
Documents
-
view
0 -
download
0
Transcript of Tempo and mode of gene duplication in mammalian ribosomal protein evolution

Tempo and Mode of Gene Duplication in MammalianRibosomal Protein EvolutionAsav P. Dharia., Ajay Obla., Matthew D. Gajdosik, Amanda Simon, Craig E. Nelson*
University of Connecticut Department of Molecular and Cell Biology, Storrs, Connecticut, United States of America
Abstract
Gene duplication has been widely recognized as a major driver of evolutionary change and organismal complexity throughthe generation of multi-gene families. Therefore, understanding the forces that govern the evolution of gene familiesthrough the retention or loss of duplicated genes is fundamentally important in our efforts to study genome evolution.Previous work from our lab has shown that ribosomal protein (RP) genes constitute one of the largest classes of conservedduplicated genes in mammals. This result was surprising due to the fact that ribosomal protein genes evolve slowly andtranscript levels are very tightly regulated. In our present study, we identified and characterized all RP duplicates in eightmammalian genomes in order to investigate the tempo and mode of ribosomal protein family evolution. We show that asizable number of duplicates are transcriptionally active and are very highly conserved. Furthermore, we conclude thatexisting gene duplication models do not readily account for the preservation of a very large number of intactretroduplicated ribosomal protein (RT-RP) genes observed in mammalian genomes. We suggest that selection againstdominant-negative mutations may underlie the unexpected retention and conservation of duplicated RP genes, and mayshape the fate of newly duplicated genes, regardless of duplication mechanism.
Citation: Dharia AP, Obla A, Gajdosik MD, Simon A, Nelson CE (2014) Tempo and Mode of Gene Duplication in Mammalian Ribosomal Protein Evolution. PLoSONE 9(11): e111721. doi:10.1371/journal.pone.0111721
Editor: Marc Robinson-Rechavi, University of Lausanne, Switzerland
Received May 20, 2014; Accepted October 6, 2014; Published November 4, 2014
Copyright: � 2014 Dharia et al. This is an open-access article distributed under the terms of the Creative Commons Attribution License, which permitsunrestricted use, distribution, and reproduction in any medium, provided the original author and source are credited.
Data Availability: The authors confirm that all data underlying the findings are fully available without restriction. All relevant data are within the paper and itsSupporting Information files.
Funding: This work was supported by National Science Foundation (NSF) Grant Award Number: 1024803 (http://nsf.gov/awardsearch/showAward?AWD_ID = 1024803&HistoricalAwards = false). Author CEN was the principal investigator on the NSF grant who received the funding. The funders had no role in studydesign, data collection and analysis, decision to publish, or preparation of the manuscript.
Competing Interests: The authors have declared that no competing interests exist.
* Email: [email protected]
. These authors contributed equally to this work.
Introduction
Gene Duplication and Genome EvolutionIn 1970, Susumu Ohno hypothesized that gene duplication
provided the raw material required for the diversification of gene
function. It is now appreciated that gene duplication and loss is a
dynamic process that has given rise to many large gene families
critical to the evolution of complex organisms [1]. Recent data
reveal that lineage-specific expansion and contraction of gene
families is more rapid than previously appreciated, and is
responsible for major differences in gene family size between
closely related mammalian genomes [2]. These differences are
likely to have made major contributions to the divergence of
mammalian lineages and to human evolution [3,4]. For this
reason, understanding the forces that lead to the retention or loss
of duplicated genes in complex genomes is fundamental to
understanding genome evolution, and particularly to the evolution
of complex organisms.
Scales, Mechanisms, and Outcomes of Gene DuplicationDuplications occur at all genomic scales, from a single
nucleotide to the entire genome, and vary greatly in frequency.
Depending on the nature of the duplication, these events can have
a positive, negative or neutral effect upon an organism. For
example, duplications involving a single gene or set of genes can be
associated with enrichment for essential functions, while large scale
duplications can be associated with important evolutionary
transitions, major leaps in development, and the adaptive
radiation of species [5,6]. Many physical mechanisms can give
rise to duplication events: (1) whole-genome duplication (WGD),
(2) tandem duplication (i.e., unequal crossing-over), (3) duplicative
transposition, and (4) retrotransposition. WGD, tandem duplica-
tion, and duplicative transposition are DNA-mediated events,
while retrotransposition is the Reverse Transcriptase (RT)-
mediated insertion of a cDNA into the host genome. A WGD is
believed to have occurred in yeast [7], and several have been
inferred in the teleost lineage [8]; while the last WGD believed to
have occurred in the mammalian lineage took place before the
emergence of modern mammals [9,10]. Compared to these very
large scale and rare events, duplicative transpositions and tandem
duplications are likely to drive much of the duplication and loss
giving rise to complex gene families. These are DNA-mediated
processes that preserve varying amounts of the source gene’s
intron-exon structure [4]. Often, depending on the scale of the
duplication, varying amounts of the intergenic regulatory DNA
flanking the duplicated gene is also transferred, increasing the
likelihood of a functional duplicate being created [11]. In contrast,
retrotransposition is a process whereby a spliced mRNA transcript
PLOS ONE | www.plosone.org 1 November 2014 | Volume 9 | Issue 11 | e111721
is reverse-transcribed into DNA and randomly re-integrated into
the genome, creating a copy lacking introns and the promoter and
enhancer elements of the source gene [12]. Such retrogenes have
traditionally been regarded as non-functional. However, recent
studies have shown that rampant retrotransposition can create
genes that function as protein-coding genes [13] and small RNA’s
[14], and which can have dramatic phenotypic consequences [15].
Recent interest in retrotransposition is highlighted by the
identification of several functional retrogenes, such as Fgf4 and
c1orf37-dup in mammals [16,17], and suggests that retroduplica-
ton may be a more important force in the evolution of complex
gene families than has been widely appreciated.
Retroduplication in the Mammalian GenomePreviously, we reported that conserved retroduplicates are
widespread in mammals, representing half of all gene duplicates
under purifying selective pressure [18,19]. In addition, we noted
that individual gene families have a strong tendency to evolve via
DNA-mediated or RNA-mediated duplication, but not both.
Developmentally important classes of genes, such as transcription
factors, which often require large amounts of regulatory informa-
tion to function properly, tend to evolve through DNA-mediated
events. However, gene families involved in metabolic processes,
such as protein synthesis, evolve primarily through RNA-mediated
duplication. In fact, we reported that ribosomal protein (RP) genes
are the largest class of conserved, retroduplicated genes in
mammals [18]. While it is not surprising that the highly abundant
ribosomal protein transcripts appear to be more frequently
captured by retroviral reverse transcriptase than less abundant
transcripts, it is intriguing that the slowly-evolving, highly-
conserved ribosomal proteins have hundreds of intact duplicates
in the genome.
Known Examples of Retrotransposed DuplicatesOne of the most prominent examples of a RNA-mediated
duplicate is Fgf4, a retrogene associated with the breed-defining
chondrodysplasia in domestic dogs [15]. A human-specific
example is the C1orf37-duplicate, derived through retrotranspo-
sition after divergence of human from chimp expressed selectively
in certain human tissues, such as brain. It is suggested to encode a
novel transmembrane protein [20]. Similar examples include
TRMT12 retrogene [21], IMP3 gene [22,23] and other such
retrogenes (see [24–28]). The majority of the aforementioned RT
genes follow the convention that most retrogenes are in a state of
‘‘relaxed’’ selection. The molecular evolution of retrogenes is
selectively neutral, allowing them to freely mutate, giving them a
chance to be inactivated or positively selected, while parental
genes remain subjected to purifying selection [29,30].
The Mammalian Ribosome and Ribosomal ProteinsThe ribosome is an ancient molecular machine that is
responsible for production of protein in all living cells. The
mammalian ribosome consists of 79 RPs and four rRNAs. RPs
play a central role in protein synthesis, are expressed at high levels,
and evolve very slowly [31] showing strong conservation across the
three domains of life [32]. Proper ribosomal biogenesis requires
equimolar production of all RPs and rRNAs [33,34]. These
transcriptional regulatory constraints have been extensively
elucidated in various studies [35,36], along with the evidence that
different ribosomal protein promoters exhibit equipotent strength
[37]. Additionally, a strict copy number constraint is also observed
as the majority of full length RP’s have been shown to be single
copy genes [38].
Due to the necessity of protein synthesis in any living cell, and
the complexity of ribosome structure and assembly, it is perhaps
unsurprising that mutations in ribosomal genes almost inevitably
lead to pathological conditions such as Minutes in Drosophila [39]
and Diamond-Blackfan anemia (DBA) in humans [40,41].
Despite, or perhaps because of, their stringent conservation, the
evolution of RPs in vertebrates is relatively understudied.
Known Examples of Mammalian Ribosomal ProteinDuplicates
One of the most recently published DNA-mediated ribosomal
protein (DD-RP) gene duplicates is RPL22L1, paralog of
ribosomal protein RPL22. These mouse paralogs play essential,
distinct, and antagonistic roles in hematopoietic development [42].
Another known rodent-specific RT-RP duplicate is Rps23rg1, a
gene originating from a retrotransposition of s23 mRNA that
encodes proteins that decrease Alzheimer’s b-amyloid level and
tau phosphorylation [43]. There is also evidence for a ubiquitously
expressed RT-RP duplicate, Rpl36al, and testis-specific RPL10L
duplicate that have been implicated in compensation for the
reduced dosage of X-linked RP genes [44]. As mentioned in a
previous section, RPL3L is a DD-RP duplicate that has been
observed to be highly expressed in a group of tissues where parent
RPL3 has very little expression, exhibiting a potential functional
role [45].
Focus of this studyIn this study, we address several questions about gene
duplication and the evolution of RPs. Many research groups have
studied the dynamics of gene duplication in RPs in non-
mammalian systems such as yeast [46]. In addition, some research
has focused on individual human ribosomal proteins and their
duplicates (eg: RPS19 and RPL7a) or comparative analyses
between mammals [47–50]. To date, however, no study has
encompassed all 79 mammalian RPs in a large set of mammalian
genomes. In order to fill this gap and more thoroughly annotate
RP gene duplication events during mammalian evolution, we
created a pipeline that utilizes local synteny and conserved intron
content to (1) identify each duplicated RP gene in eight
mammalian species, (2) place each duplication event within the
mammalian phylogeny, (3) discriminate between RNA- and DNA-
mediated duplications, (4) estimate the degree of purifying selective
pressure exerted on every duplicated RP gene, and (5) determine
whether each duplicated RP gene copy exhibits evidence of
expression.
Materials and Methods
Ribosomal DatasetSeventy-six ribosomal protein (RP) sequences from nine species
[human, chimp, monkey, mouse, rat, dog, cow, opossum, and
chicken (outgroup)] were manually collected from Ensembl 62
[51]. Three RPs were excluded due to annotation issues. When a
single gene encoded multiple transcripts, the longest was used.
These protein sequences served as seed sequences, or input, to the
pipeline (Figure 1).
Extraction of Gene Family MembersRP seed sequences were submitted to tBLASTn against donor
genomes to capture as many putative duplicates of the seed gene as
possible. Each resulting putative duplicate was processed using
Pseudopipe [52] to determine the mechanism of duplication
(DNA- or RNA-mediated) and the fate of the duplicate (intact or
pseudogene). The default Pseudopipe filters for tBLASTn hits (E-
Tempo and Mode of Gene Duplication in Ribosomal Protein Evolution
PLOS ONE | www.plosone.org 2 November 2014 | Volume 9 | Issue 11 | e111721

value cutoff #1024 and identity and identity $40%) were used to
define putative duplicates. Ambiguous duplicates, where the
duplication mechanism was not confirmed, were resolved using
an intron comparison algorithm [18], which compares intron/
exon structure within a group while accounting for exon fusions
and large insertions in exonic regions. These methods generated a
set of RP superfamilies that consist of both protein-coding genes
and related pseudogenes.
Identification of Duplications and Phylogenetic AnalysisOrthologous and paralogous relationships were determined
using local synteny and a hierarchical clustering algorithm
described in Jun et al, 2008 [18,19]. A local synteny score was
assigned to all gene pairs based on the homology of genes (three
upstream and three downstream) neighboring the two query
genes. Pairwise synteny measures were obtained for all members of
a gene family. The output generated based on these scores was
used to construct phylogenetic trees in Newick format, represent-
ing the history of duplication in each family. Parsimony [53] was
used to assign each inferred duplication event to a specific branch
of the species tree [54,55]. ‘Tube’-style phylogenetic trees for 74
mammalian RP genes were used to illustrate the history of DNA/
RNA-mediated duplications across various evolutionary time
periods (ancient vs. lineage specific) (See Appendix S1 for all trees).
Conservation and EST AnalysesUsing exon-based reconstruction and the Nei Gojobori method,
Ka/Ks ratios for all members of a gene family were calculated
against the seed proteins. The putative exon-intron structures of
duplicates were generated with an in-house algorithm, using these
seed proteins. Results were then filtered based on p-values (,0.1)
and the fraction of the parental gene represented by each duplicate
(.65%). Pairwise distances using ClustalW were also calculated as
an added metric to evaluate sequence identity and account for all
Figure 1. Pipeline for ribosomal protein family analyses. Protein sequence for all parental ribosomal proteins were collected manually fromEnsembl62. These were input to tBLASTn against whole genomes to capture all putative duplicates. The resulting duplicates were processed byPseudopipe to determine the mechanism of duplication (DNA or RNA) and the fate of the duplicate (intact or pseudogenized). We then utilized ourin-house pipeline steps of hierarchical clustering by local synteny3 in order to build our gene family trees after filtering false-positives and redundantentries. Final gene family analyses were conducted in 2 steps: 1) calculating the selective pressures on all gene duplicates using the Nei-Gojoborimethod against the species- and family-specific seed protein via an exon-based reconstruction, and 2) checking for expression signatures via ESTanalyses using the UCSC genome browser EST track for both human and mouse.doi:10.1371/journal.pone.0111721.g001
Tempo and Mode of Gene Duplication in Ribosomal Protein Evolution
PLOS ONE | www.plosone.org 3 November 2014 | Volume 9 | Issue 11 | e111721

nucleotide level substitutions. Additionally, we also determined
branch-wise omega values for 28 ribosomal protein families with
following parameters, model = 2 & Nsite = 0, using codeML in
PAML 4.7 [56]. In order to confirm the selective pressures,
standard codon models M0, M1a, M2a were fitted to the data set
with codeML. We used likelihood ratio tests (LRT) to determine
the relative fit of the hierarchically nested models. Log likelihood
ratio test statistic is 2D, = 2(,1–,0), where ,1 is the log-likelihood
of the model corresponding to the alternative hypothesis and ,0
represents the log-likelihood corresponding to the model used as
null hypothesis. These values were compared with a chi-squared
distribution in which the difference between the number of
parameters of both models provides the degrees of freedom (df)
[57,58]. Log likelihood values and parameter estimates are
detailed in the results section and supplementary material.
In order to determine if duplicates were actively transcribed,
human and mouse expressed sequence tags (EST) were mined
from the UCSC genome browser EST. ESTs that mapped to
multiple locations that showed less than 95% identity or 95%
fraction length were discarded. Additionally, EST presence &
absence calls were also made using data mined from Bgee
database for annotated duplicates in our dataset [59].
Results
76 Ribosomal Protein Family Member AnalysesThe first step of our pipeline identified all detectable duplicates
of RP genes in eight mammalian genomes. RP families included
14,552 gene duplicates in the eight genomes analyzed: human,
chimp, monkey, mouse, rat, dog, cow, and opossum (Figure 2A).
Although data in figure 2A include duplicates with shared
ancestry, the counts for each species represent the number of
duplicate genes present in each extant species. To determine if
sequencing coverage had a significant impact on our detection of
RP gene duplicates, we compared the depth of sequence coverage
in each species’ genome to the number of duplications recovered
in that species. We found no significant correlation between the
number of duplications and genome coverage (Pearson’s r = 2
0.353, p = 0.391, Figure 2B, S2). We also tested for bias in
duplication types in each species and found no species-specific bias
in duplication mechanisms. As we found significant association
between species (p = 6.07e-17, two-way chi square test, Figure2B),
all species were grouped for subsequent analyses.
Next we assessed the fate of each duplicate. Of the 14,552
duplication events detected, only 28 of these gene duplications are
DNA-mediated (DD) events; the remainder (99.8%) are RNA-
mediated (RT) duplications. Approximately 88% of RNA-medi-
ated duplications are pseudogenes (12,800 duplicates), while 12%
are intact (1724 duplicates, Figure 2C). A data table listing all RP
gene duplicates recovered by our pipeline can be found in Table
S1. We also examined every ribosomal protein gene’s duplication
history and evolutionary trajectory in the context of the
encompassing species tree. One example of the resulting
information is shown in Figure 3, for the ribosomal protein gene
RPL36A. All 74 ribosomal protein gene family history trees are
attached in supplementary material. Hereafter, all the intact RNA-
mediated ribosomal protein gene duplicates will be referred to as
RT-RPs, intact DNA-mediated copies as DD-RPs and RNA-
mediated pseudogenes as RY-RPs. Leveraging previously pub-
lished data by Jun et al; we observed a clear overrepresentation of
RT-RPs among 8,872 gene families analyzed (Figure S1).
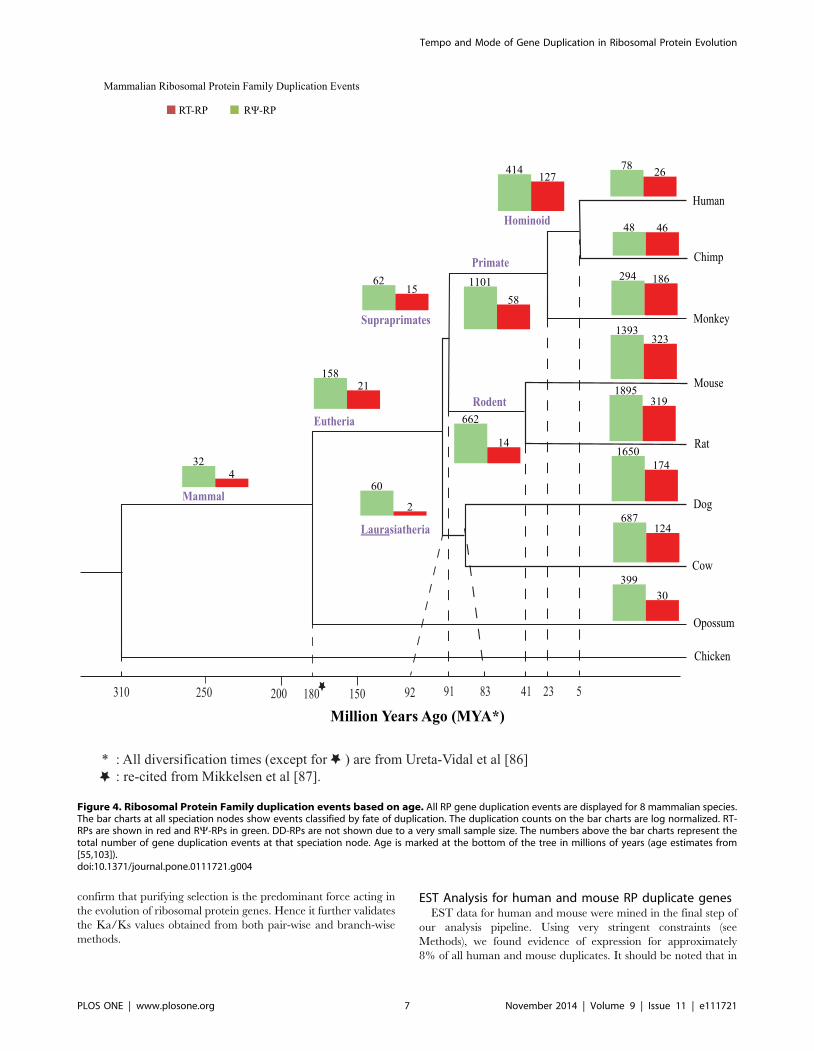
The Fate of Ribosomal Protein Duplications over timeIn the second step of our pipeline, we determined the probable
location of each RP duplication event in evolutionary history of
these eight species, and distinguished between RNA- and DNA-
mediated duplication events (Figure 3; [18]). Based on our
methodology, Figure 4 clearly shows that the majority of
detectable duplications have occurred during recent mammalian
evolution: 100 million years ago (MYA) or more recently.
However, a significant number of duplications date between
100–300 MYA. The majority of RP gene duplications older than
90 MYA result in RNA-mediated pseudogenes (RY-RPs) (190),
though some events (25) are intact RNA-mediated duplications
(RT-RPs), and a very small number (4) are linked to intact DNA-
mediated duplicates (DD-RPs) [data not shown for DD-RPS due
to small sample size]. It is important to note that many of the more
ancient duplications detected represent incomplete clades; there-
fore we infer a considerable amount of gene loss. However, our
inability to detect these genes may also be due to loss of synteny or
other limitations of our pipeline.
The majority of duplicates (N = 13,588) observed in our dataset
are young (91 MYA or younger). However, a few RT-RPs and
DD-RPs have been conserved in all (or most) of the eight
mammalian species analyzed (see the base of the tree in Figure 4).
Analysis of Selective Pressure Acting on All RibosomalGene Duplicates
To gain insight into the forces shaping the fate of these RP gene
duplicates, nonsynonymous/synonymous substitution rates were
evaluated using pair-wise and branch-wise methods (see Methods
section and [13,60,61]. For the pair-wise method, we observe that
DD-RP dups and RT-RP dups have mean Ka/Ks values of 0.166
(95% CI 0.083, 0.248) and 0.295 (95% CI 0.285, 0.305) suggesting
that they are under strong purifying selective pressure. RY-RP’s
were under relatively less purifying selective pressure with a mean
value of 0.455 (95%CI 0.453, 0.458) (Figure 5A). In order to avoid
false positives with Ka/Ks .1, we did not include cases that had a
very low Ka and Ks values. Calculation of pairwise DNA sequence
distances reveals that the mean sequence distance for DD-RP
duplicates was 0.091 (95% CI 0.062, 0.118), for RT-RP duplicates
was 0.0059 (95% CI 0.062, 0.118) and for RY-RPs was 0.172
(95% CI 0.169, 0.173). This corroborates the evidence from the
Ka/Ks analysis suggesting that these sequences are under strong
selective pressure (Figure S3). Next we compared selective
pressures on all RT-RP duplicates of various ages in each lineage.
(DD-RPs were not included in this analysis due to the very small
dataset.) Box-Whisker plots (Figure 5B and 5C) showed that RT-
RP duplicates at all speciation nodes, irrespective of their age or
lineage, are under strong selective pressures, as determined by
Ka/Ks values. However, chimp (Pt) values seem to be an
exception, likely due to a small sample size (Figure 5B). The
trends appeared similar for all RY-RPs as the median Ka/Ks
values are similar (,0.45) for all ages. Additionally, we also
provide scatterplots for all speciation nodes to confirm the strong
selection on all RP duplicates irrespective of age (see figures S6 and
S7). While pairwise Ka/Ks calculations are computationally rapid
and provide a good screen for selective pressure, especially within
a gene family, for added support we wanted to cross-check our
estimates of selective pressure using branch-specific omega values.
To do this we used PAML to calculate branch-specific omega
values for a sub-sample of 28 RP gene families (see Table S2). An
example RP gene tree with all PAML branch-specific omega
values is shown in Figure S4. Using this approach we obtained
Ka/Ks values for RT-RP duplicates (mean = 0.162, CI 0.137,
0.188), and for the RY-RPs (mean = 0.357, CI 0.347, 0.367). As
Tempo and Mode of Gene Duplication in Ribosomal Protein Evolution
PLOS ONE | www.plosone.org 4 November 2014 | Volume 9 | Issue 11 | e111721
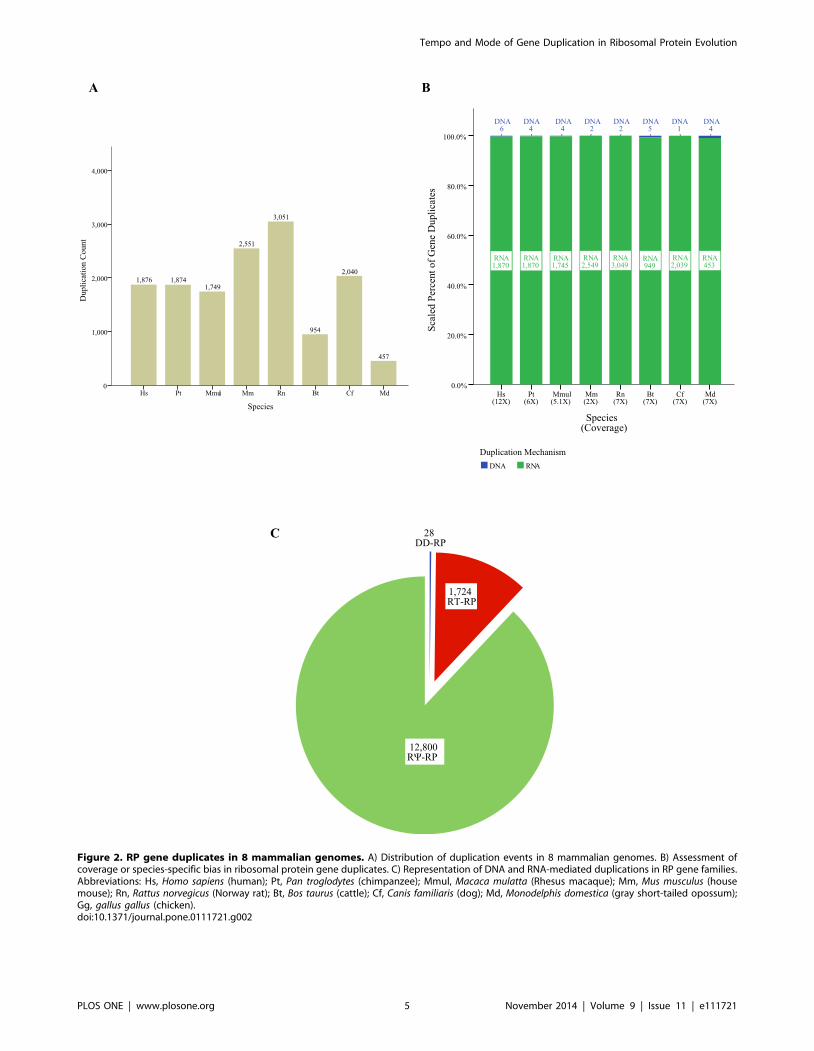
Figure 2. RP gene duplicates in 8 mammalian genomes. A) Distribution of duplication events in 8 mammalian genomes. B) Assessment ofcoverage or species-specific bias in ribosomal protein gene duplicates. C) Representation of DNA and RNA-mediated duplications in RP gene families.Abbreviations: Hs, Homo sapiens (human); Pt, Pan troglodytes (chimpanzee); Mmul, Macaca mulatta (Rhesus macaque); Mm, Mus musculus (housemouse); Rn, Rattus norvegicus (Norway rat); Bt, Bos taurus (cattle); Cf, Canis familiaris (dog); Md, Monodelphis domestica (gray short-tailed opossum);Gg, gallus gallus (chicken).doi:10.1371/journal.pone.0111721.g002
Tempo and Mode of Gene Duplication in Ribosomal Protein Evolution
PLOS ONE | www.plosone.org 5 November 2014 | Volume 9 | Issue 11 | e111721

previously mentioned, to avoid false positives with Ka/Ks ..1,
we excluded cases with very low Ka and Ks values. Both pairwise
and PAML-based estimation methods confirm the strong purifying
selective pressure acting on RT-RPs (Ka/Ks ,0.3) and a slightly
lower pressure on RY-RPs (Ka/Ks ,0.5). As evolutionary
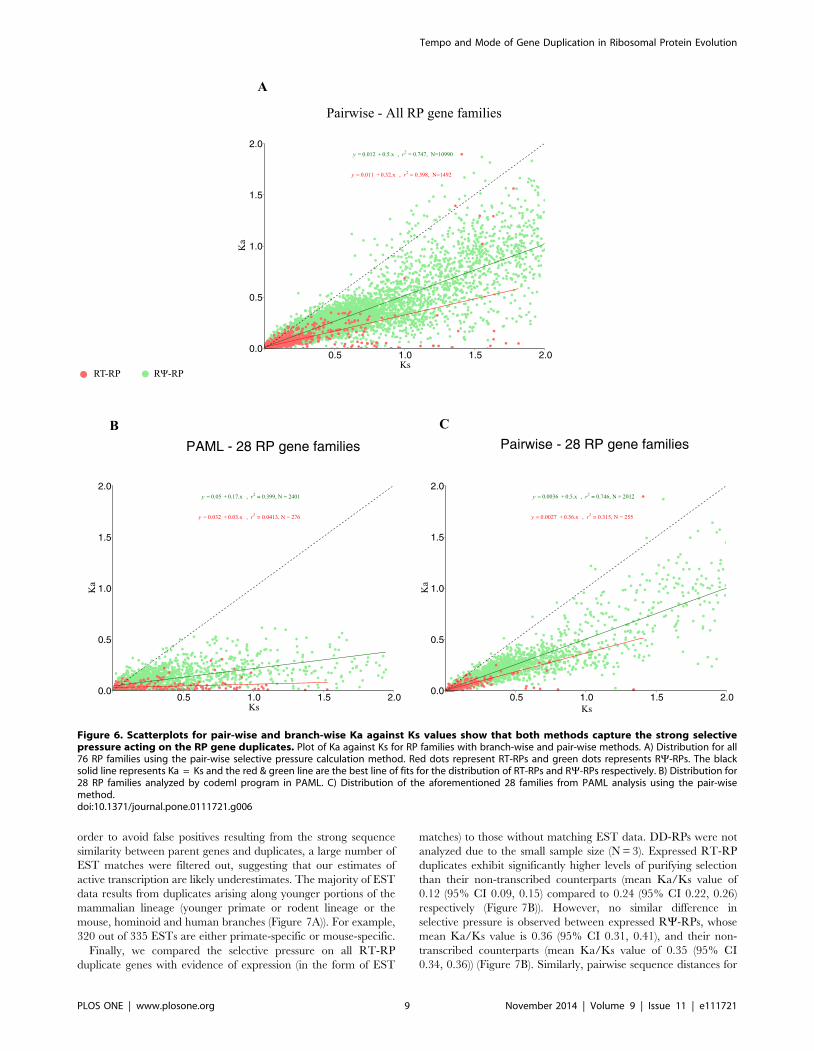
pressure is often time dependent, we also plotted Ka against Ks
estimated by both pair-wise (Figure 6A) and branch-wise (Fig-
ure 6B) methods. As expected the branch-wise method estimates
higher divergence, as seen by the large distribution of Ks values
(Figure 6B) compared to pairwise method. The influence of strong
purifying selection over time is readily observed in Ka values for
both methods as the data points of RP-RTs are compressed near
the origin relative to RY-RPs, which have a much wider
distribution (Figure 6).
In order to further confirm the nature of the selective pressure
acting on our RP-RTs and RY-RPs, we also used different codon-
substitution models developed by Nielsen and Yang [62] and Yang
et al. [58]. Random-site models M0, M1a and M2a which assume
variation in v among sites but not among lineages were fitted to
our data. The models used, parameter estimates and log-likelihood
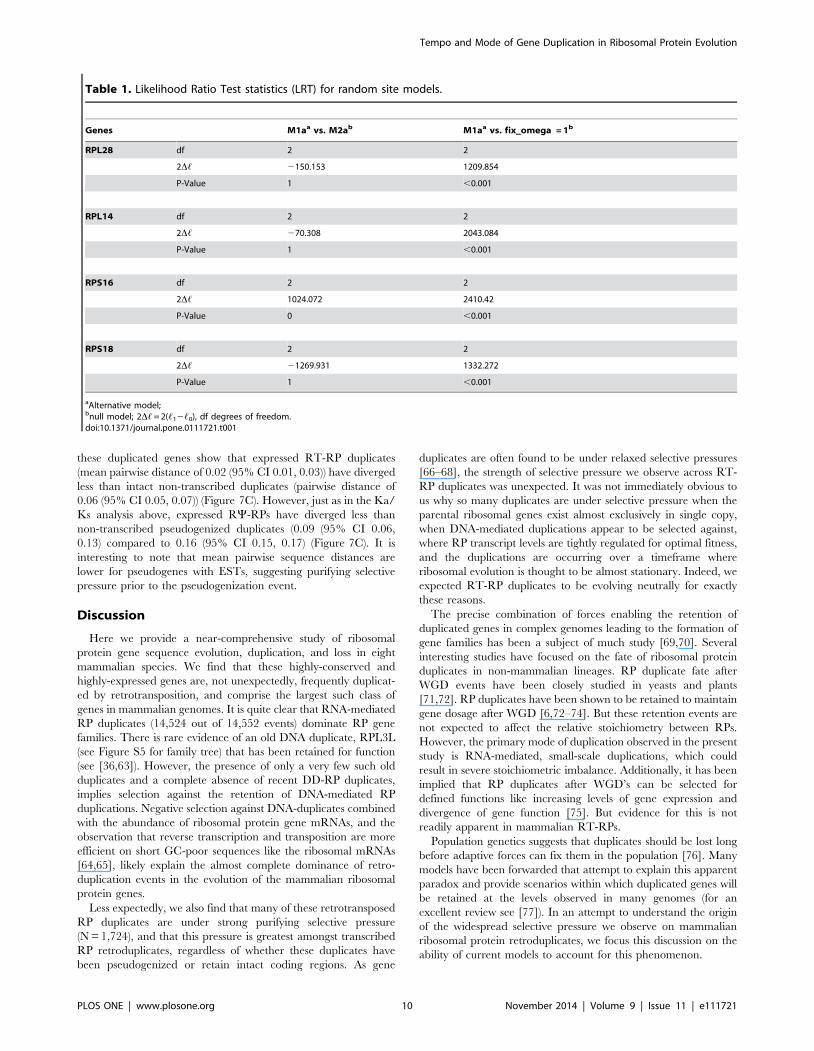
values are shown in Table S3. Table 1 shows the results of the
LRT tests for these models. We applied the simplest of site-based
models M0 [30], which assume a uniform v ratio for all codons, to
four random ribosomal genes namely Rps16, Rps18, Rpl14 and
Rpl28. The estimated single v value for each of these trees ranges
from 0.22 to 0.35 (table S3). These values can be interpreted as an
average of all lineages in the tree and over all sites in the protein.
The low v range obtained indicates a strong action of purifying
selection in the evolution of ribosomal gene duplicates studied.
To test if branch-specific omegas are statistically justified, we
compared Model M1a (nearly neutral), which constrains Ka/Ks
#1 but not positive selection (Ka/Ks .1) and M2a which allows
for positive selective pressure. This comparison leads us to reject
the nearly neutral model as seen in table 1. Our final comparison
was model M1a vs. M0 with a fix omega = 1 and we find out that
model M1a fits our data better (p-value ,0.0001). These results
Figure 3. Example of the inferred evolutionary history for duplications of the ribosomal protein gene Rpl36a. Grey outlined tube treerepresents the species tree that includes 8 mammals and chicken. Parental intron-bearing gene (in blue). RT-RPs (clear triangles), RY-RPs (greytriangles). An RT-RP duplicate generated from one of these events, Rpl36al (in red, at the base of the mammalian lineage on the branch between LCAwith opossum and the other mammals) is conserved in all descendent species. All the 74 ribosomal protein gene family history trees are attached assupplementary material.doi:10.1371/journal.pone.0111721.g003
Tempo and Mode of Gene Duplication in Ribosomal Protein Evolution
PLOS ONE | www.plosone.org 6 November 2014 | Volume 9 | Issue 11 | e111721
confirm that purifying selection is the predominant force acting in
the evolution of ribosomal protein genes. Hence it further validates
the Ka/Ks values obtained from both pair-wise and branch-wise
methods.
EST Analysis for human and mouse RP duplicate genesEST data for human and mouse were mined in the final step of
our analysis pipeline. Using very stringent constraints (see
Methods), we found evidence of expression for approximately
8% of all human and mouse duplicates. It should be noted that in
Figure 4. Ribosomal Protein Family duplication events based on age. All RP gene duplication events are displayed for 8 mammalian species.The bar charts at all speciation nodes show events classified by fate of duplication. The duplication counts on the bar charts are log normalized. RT-RPs are shown in red and RY-RPs in green. DD-RPs are not shown due to a very small sample size. The numbers above the bar charts represent thetotal number of gene duplication events at that speciation node. Age is marked at the bottom of the tree in millions of years (age estimates from[55,103]).doi:10.1371/journal.pone.0111721.g004
Tempo and Mode of Gene Duplication in Ribosomal Protein Evolution
PLOS ONE | www.plosone.org 7 November 2014 | Volume 9 | Issue 11 | e111721
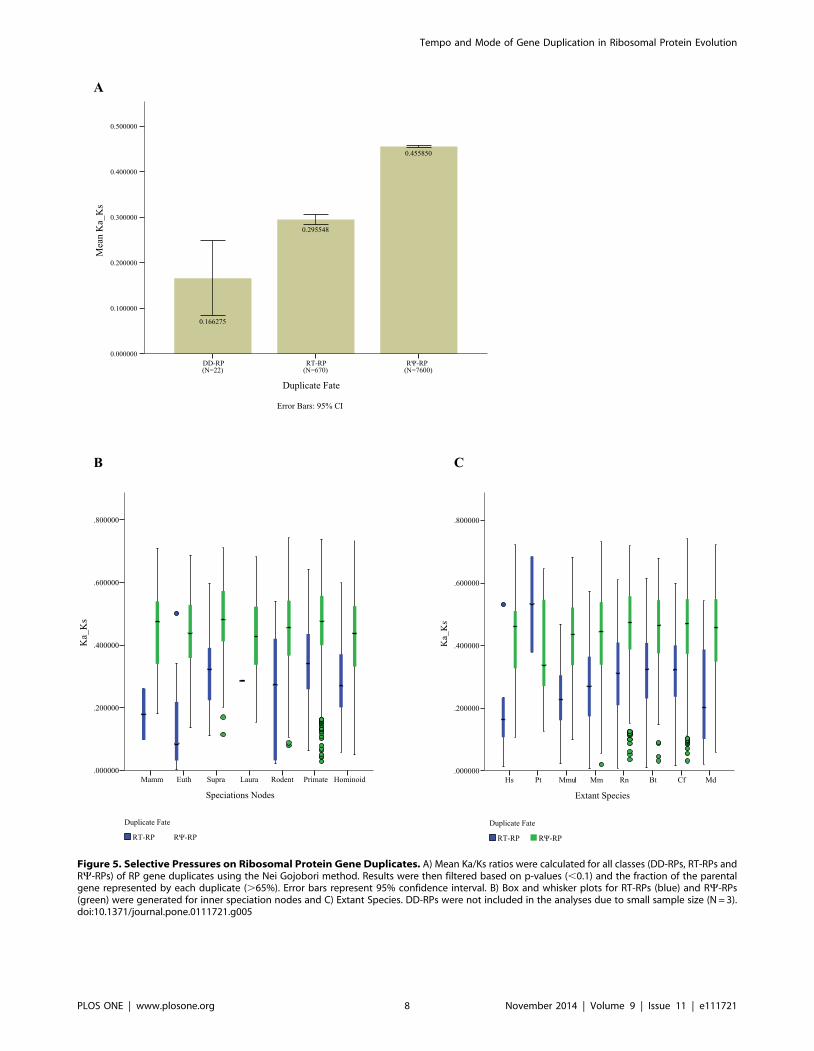
Figure 5. Selective Pressures on Ribosomal Protein Gene Duplicates. A) Mean Ka/Ks ratios were calculated for all classes (DD-RPs, RT-RPs andRY-RPs) of RP gene duplicates using the Nei Gojobori method. Results were then filtered based on p-values (,0.1) and the fraction of the parentalgene represented by each duplicate (.65%). Error bars represent 95% confidence interval. B) Box and whisker plots for RT-RPs (blue) and RY-RPs(green) were generated for inner speciation nodes and C) Extant Species. DD-RPs were not included in the analyses due to small sample size (N = 3).doi:10.1371/journal.pone.0111721.g005
Tempo and Mode of Gene Duplication in Ribosomal Protein Evolution
PLOS ONE | www.plosone.org 8 November 2014 | Volume 9 | Issue 11 | e111721
order to avoid false positives resulting from the strong sequence
similarity between parent genes and duplicates, a large number of
EST matches were filtered out, suggesting that our estimates of
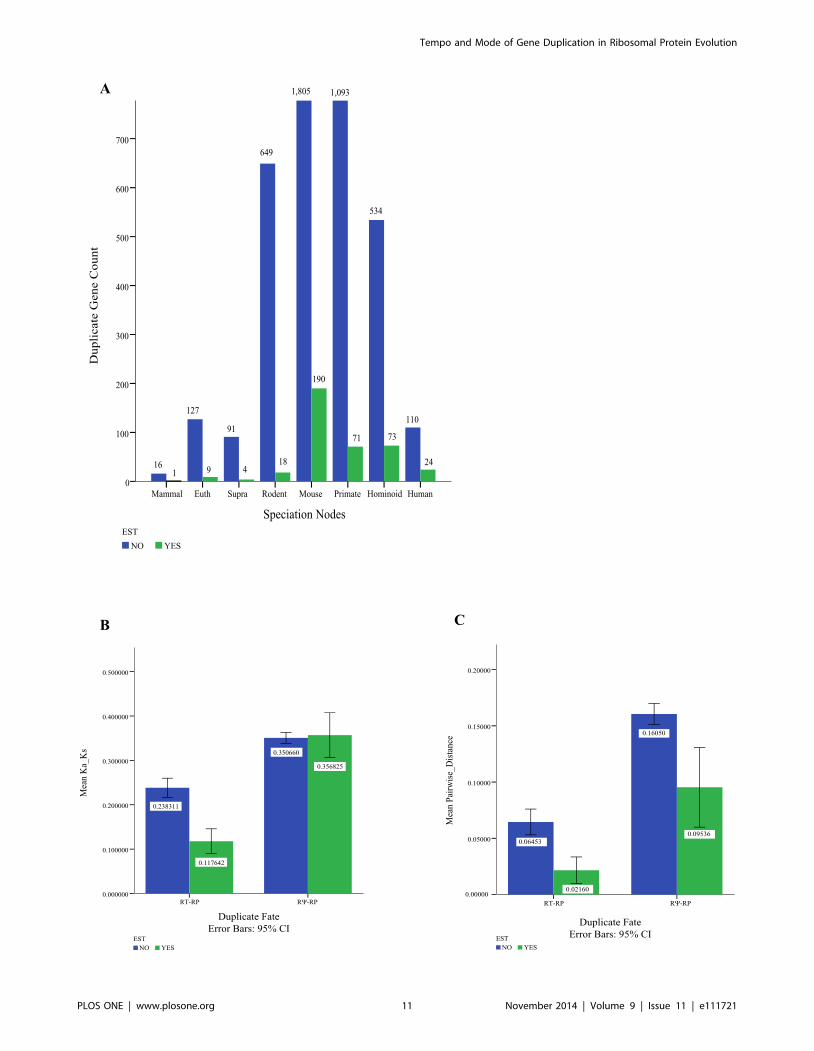
active transcription are likely underestimates. The majority of EST
data results from duplicates arising along younger portions of the
mammalian lineage (younger primate or rodent lineage or the
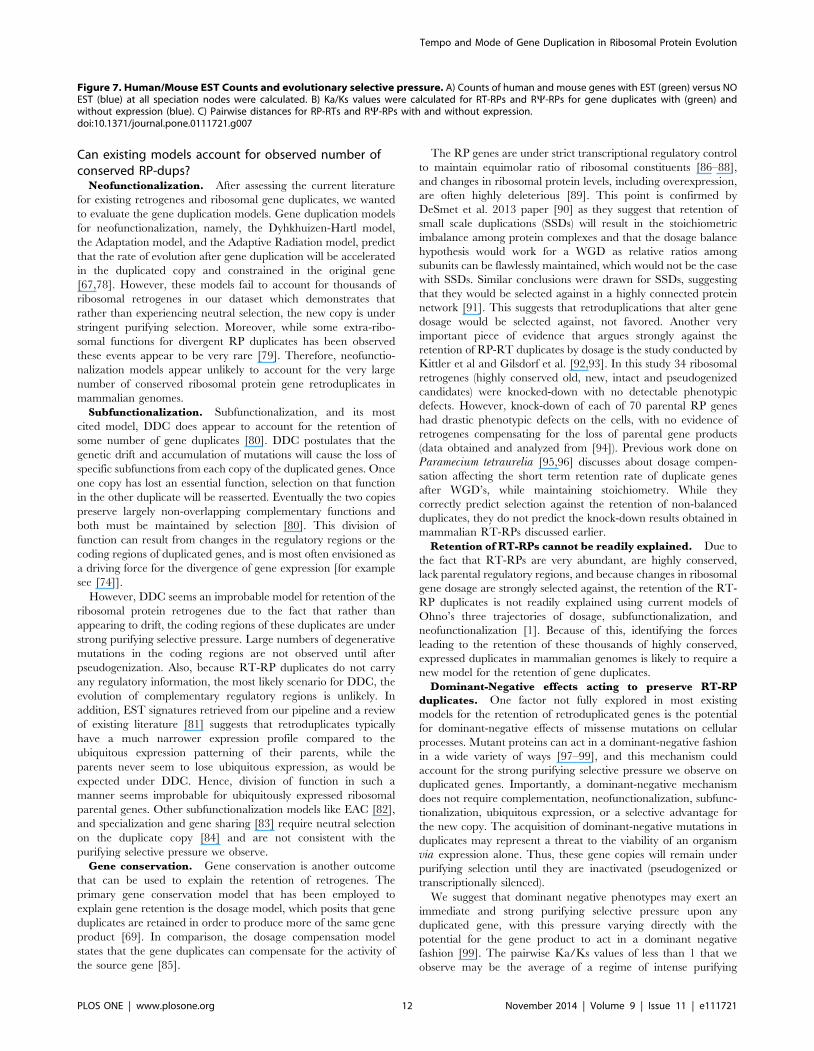
mouse, hominoid and human branches (Figure 7A)). For example,
320 out of 335 ESTs are either primate-specific or mouse-specific.
Finally, we compared the selective pressure on all RT-RP
duplicate genes with evidence of expression (in the form of EST
matches) to those without matching EST data. DD-RPs were not
analyzed due to the small sample size (N = 3). Expressed RT-RP
duplicates exhibit significantly higher levels of purifying selection
than their non-transcribed counterparts (mean Ka/Ks value of
0.12 (95% CI 0.09, 0.15) compared to 0.24 (95% CI 0.22, 0.26)
respectively (Figure 7B)). However, no similar difference in
selective pressure is observed between expressed RY-RPs, whose
mean Ka/Ks value is 0.36 (95% CI 0.31, 0.41), and their non-
transcribed counterparts (mean Ka/Ks value of 0.35 (95% CI
0.34, 0.36)) (Figure 7B). Similarly, pairwise sequence distances for
Figure 6. Scatterplots for pair-wise and branch-wise Ka against Ks values show that both methods capture the strong selectivepressure acting on the RP gene duplicates. Plot of Ka against Ks for RP families with branch-wise and pair-wise methods. A) Distribution for all76 RP families using the pair-wise selective pressure calculation method. Red dots represent RT-RPs and green dots represents RY-RPs. The blacksolid line represents Ka = Ks and the red & green line are the best line of fits for the distribution of RT-RPs and RY-RPs respectively. B) Distribution for28 RP families analyzed by codeml program in PAML. C) Distribution of the aforementioned 28 families from PAML analysis using the pair-wisemethod.doi:10.1371/journal.pone.0111721.g006
Tempo and Mode of Gene Duplication in Ribosomal Protein Evolution
PLOS ONE | www.plosone.org 9 November 2014 | Volume 9 | Issue 11 | e111721
these duplicated genes show that expressed RT-RP duplicates
(mean pairwise distance of 0.02 (95% CI 0.01, 0.03)) have diverged
less than intact non-transcribed duplicates (pairwise distance of
0.06 (95% CI 0.05, 0.07)) (Figure 7C). However, just as in the Ka/
Ks analysis above, expressed RY-RPs have diverged less than
non-transcribed pseudogenized duplicates (0.09 (95% CI 0.06,
0.13) compared to 0.16 (95% CI 0.15, 0.17) (Figure 7C). It is
interesting to note that mean pairwise sequence distances are
lower for pseudogenes with ESTs, suggesting purifying selective
pressure prior to the pseudogenization event.
Discussion
Here we provide a near-comprehensive study of ribosomal
protein gene sequence evolution, duplication, and loss in eight
mammalian species. We find that these highly-conserved and
highly-expressed genes are, not unexpectedly, frequently duplicat-
ed by retrotransposition, and comprise the largest such class of
genes in mammalian genomes. It is quite clear that RNA-mediated
RP duplicates (14,524 out of 14,552 events) dominate RP gene
families. There is rare evidence of an old DNA duplicate, RPL3L
(see Figure S5 for family tree) that has been retained for function
(see [36,63]). However, the presence of only a very few such old
duplicates and a complete absence of recent DD-RP duplicates,
implies selection against the retention of DNA-mediated RP
duplications. Negative selection against DNA-duplicates combined
with the abundance of ribosomal protein gene mRNAs, and the
observation that reverse transcription and transposition are more
efficient on short GC-poor sequences like the ribosomal mRNAs
[64,65], likely explain the almost complete dominance of retro-
duplication events in the evolution of the mammalian ribosomal
protein genes.
Less expectedly, we also find that many of these retrotransposed
RP duplicates are under strong purifying selective pressure
(N = 1,724), and that this pressure is greatest amongst transcribed
RP retroduplicates, regardless of whether these duplicates have
been pseudogenized or retain intact coding regions. As gene
duplicates are often found to be under relaxed selective pressures
[66–68], the strength of selective pressure we observe across RT-
RP duplicates was unexpected. It was not immediately obvious to
us why so many duplicates are under selective pressure when the
parental ribosomal genes exist almost exclusively in single copy,
when DNA-mediated duplications appear to be selected against,
where RP transcript levels are tightly regulated for optimal fitness,
and the duplications are occurring over a timeframe where
ribosomal evolution is thought to be almost stationary. Indeed, we
expected RT-RP duplicates to be evolving neutrally for exactly
these reasons.
The precise combination of forces enabling the retention of
duplicated genes in complex genomes leading to the formation of
gene families has been a subject of much study [69,70]. Several
interesting studies have focused on the fate of ribosomal protein
duplicates in non-mammalian lineages. RP duplicate fate after
WGD events have been closely studied in yeasts and plants
[71,72]. RP duplicates have been shown to be retained to maintain
gene dosage after WGD [6,72–74]. But these retention events are
not expected to affect the relative stoichiometry between RPs.
However, the primary mode of duplication observed in the present
study is RNA-mediated, small-scale duplications, which could
result in severe stoichiometric imbalance. Additionally, it has been
implied that RP duplicates after WGD’s can be selected for
defined functions like increasing levels of gene expression and
divergence of gene function [75]. But evidence for this is not
readily apparent in mammalian RT-RPs.
Population genetics suggests that duplicates should be lost long
before adaptive forces can fix them in the population [76]. Many
models have been forwarded that attempt to explain this apparent
paradox and provide scenarios within which duplicated genes will
be retained at the levels observed in many genomes (for an
excellent review see [77]). In an attempt to understand the origin
of the widespread selective pressure we observe on mammalian
ribosomal protein retroduplicates, we focus this discussion on the
ability of current models to account for this phenomenon.
Table 1. Likelihood Ratio Test statistics (LRT) for random site models.
Genes M1aa vs. M2ab M1aa vs. fix__omega = 1b
RPL28 df 2 2
2D, 2150.153 1209.854
P-Value 1 ,0.001
RPL14 df 2 2
2D, 270.308 2043.084
P-Value 1 ,0.001
RPS16 df 2 2
2D, 1024.072 2410.42
P-Value 0 ,0.001
RPS18 df 2 2
2D, 21269.931 1332.272
P-Value 1 ,0.001
aAlternative model;bnull model; 2D, = 2(,12,0), df degrees of freedom.doi:10.1371/journal.pone.0111721.t001
Tempo and Mode of Gene Duplication in Ribosomal Protein Evolution
PLOS ONE | www.plosone.org 10 November 2014 | Volume 9 | Issue 11 | e111721
Tempo and Mode of Gene Duplication in Ribosomal Protein Evolution
PLOS ONE | www.plosone.org 11 November 2014 | Volume 9 | Issue 11 | e111721
Can existing models account for observed number ofconserved RP-dups?
Neofunctionalization. After assessing the current literature
for existing retrogenes and ribosomal gene duplicates, we wanted
to evaluate the gene duplication models. Gene duplication models
for neofunctionalization, namely, the Dyhkhuizen-Hartl model,
the Adaptation model, and the Adaptive Radiation model, predict
that the rate of evolution after gene duplication will be accelerated
in the duplicated copy and constrained in the original gene
[67,78]. However, these models fail to account for thousands of
ribosomal retrogenes in our dataset which demonstrates that
rather than experiencing neutral selection, the new copy is under
stringent purifying selection. Moreover, while some extra-ribo-
somal functions for divergent RP duplicates has been observed
these events appear to be very rare [79]. Therefore, neofunctio-
nalization models appear unlikely to account for the very large
number of conserved ribosomal protein gene retroduplicates in
mammalian genomes.
Subfunctionalization. Subfunctionalization, and its most
cited model, DDC does appear to account for the retention of
some number of gene duplicates [80]. DDC postulates that the
genetic drift and accumulation of mutations will cause the loss of
specific subfunctions from each copy of the duplicated genes. Once
one copy has lost an essential function, selection on that function
in the other duplicate will be reasserted. Eventually the two copies
preserve largely non-overlapping complementary functions and
both must be maintained by selection [80]. This division of
function can result from changes in the regulatory regions or the
coding regions of duplicated genes, and is most often envisioned as
a driving force for the divergence of gene expression [for example
see [74]].
However, DDC seems an improbable model for retention of the
ribosomal protein retrogenes due to the fact that rather than
appearing to drift, the coding regions of these duplicates are under
strong purifying selective pressure. Large numbers of degenerative
mutations in the coding regions are not observed until after
pseudogenization. Also, because RT-RP duplicates do not carry
any regulatory information, the most likely scenario for DDC, the
evolution of complementary regulatory regions is unlikely. In
addition, EST signatures retrieved from our pipeline and a review
of existing literature [81] suggests that retroduplicates typically
have a much narrower expression profile compared to the
ubiquitous expression patterning of their parents, while the
parents never seem to lose ubiquitous expression, as would be
expected under DDC. Hence, division of function in such a
manner seems improbable for ubiquitously expressed ribosomal
parental genes. Other subfunctionalization models like EAC [82],
and specialization and gene sharing [83] require neutral selection
on the duplicate copy [84] and are not consistent with the
purifying selective pressure we observe.
Gene conservation. Gene conservation is another outcome
that can be used to explain the retention of retrogenes. The
primary gene conservation model that has been employed to
explain gene retention is the dosage model, which posits that gene
duplicates are retained in order to produce more of the same gene
product [69]. In comparison, the dosage compensation model
states that the gene duplicates can compensate for the activity of
the source gene [85].
The RP genes are under strict transcriptional regulatory control
to maintain equimolar ratio of ribosomal constituents [86–88],
and changes in ribosomal protein levels, including overexpression,
are often highly deleterious [89]. This point is confirmed by
DeSmet et al. 2013 paper [90] as they suggest that retention of
small scale duplications (SSDs) will result in the stoichiometric
imbalance among protein complexes and that the dosage balance
hypothesis would work for a WGD as relative ratios among
subunits can be flawlessly maintained, which would not be the case
with SSDs. Similar conclusions were drawn for SSDs, suggesting
that they would be selected against in a highly connected protein
network [91]. This suggests that retroduplications that alter gene
dosage would be selected against, not favored. Another very
important piece of evidence that argues strongly against the
retention of RP-RT duplicates by dosage is the study conducted by
Kittler et al and Gilsdorf et al. [92,93]. In this study 34 ribosomal
retrogenes (highly conserved old, new, intact and pseudogenized
candidates) were knocked-down with no detectable phenotypic
defects. However, knock-down of each of 70 parental RP genes
had drastic phenotypic defects on the cells, with no evidence of
retrogenes compensating for the loss of parental gene products
(data obtained and analyzed from [94]). Previous work done on
Paramecium tetraurelia [95,96] discusses about dosage compen-
sation affecting the short term retention rate of duplicate genes
after WGD’s, while maintaining stoichiometry. While they
correctly predict selection against the retention of non-balanced
duplicates, they do not predict the knock-down results obtained in
mammalian RT-RPs discussed earlier.
Retention of RT-RPs cannot be readily explained. Due to
the fact that RT-RPs are very abundant, are highly conserved,
lack parental regulatory regions, and because changes in ribosomal
gene dosage are strongly selected against, the retention of the RT-
RP duplicates is not readily explained using current models of
Ohno’s three trajectories of dosage, subfunctionalization, and
neofunctionalization [1]. Because of this, identifying the forces
leading to the retention of these thousands of highly conserved,
expressed duplicates in mammalian genomes is likely to require a
new model for the retention of gene duplicates.
Dominant-Negative effects acting to preserve RT-RP
duplicates. One factor not fully explored in most existing
models for the retention of retroduplicated genes is the potential
for dominant-negative effects of missense mutations on cellular
processes. Mutant proteins can act in a dominant-negative fashion
in a wide variety of ways [97–99], and this mechanism could
account for the strong purifying selective pressure we observe on
duplicated genes. Importantly, a dominant-negative mechanism
does not require complementation, neofunctionalization, subfunc-
tionalization, ubiquitous expression, or a selective advantage for
the new copy. The acquisition of dominant-negative mutations in
duplicates may represent a threat to the viability of an organism
via expression alone. Thus, these gene copies will remain under
purifying selection until they are inactivated (pseudogenized or
transcriptionally silenced).
We suggest that dominant negative phenotypes may exert an
immediate and strong purifying selective pressure upon any
duplicated gene, with this pressure varying directly with the
potential for the gene product to act in a dominant negative
fashion [99]. The pairwise Ka/Ks values of less than 1 that we
observe may be the average of a regime of intense purifying
Figure 7. Human/Mouse EST Counts and evolutionary selective pressure. A) Counts of human and mouse genes with EST (green) versus NOEST (blue) at all speciation nodes were calculated. B) Ka/Ks values were calculated for RT-RPs and RY-RPs for gene duplicates with (green) andwithout expression (blue). C) Pairwise distances for RP-RTs and RY-RPs with and without expression.doi:10.1371/journal.pone.0111721.g007
Tempo and Mode of Gene Duplication in Ribosomal Protein Evolution
PLOS ONE | www.plosone.org 12 November 2014 | Volume 9 | Issue 11 | e111721

selective pressure, followed by drift after pseudogenization. In a
recent study of flowering plants, De Smet et al., postulate a very
similar idea that dominant negative model constrains genes to be
maintained as single copies to avoid non-specific interactions [90].
Strongly conserved multiprotein complexes like the ribosome are
the most commonly observed context for dominant negative
phenotypes, but dominant negative phenotypes are not restricted
to such multi-protein complexes, in fact, they are widespread [98].
Because selection against dominant negative alleles acts immedi-
ately upon newly duplicated genes, and serves to maintain gene
products in a very restricted portion of protein conformational
space, it likely facilitates the retention of duplicates by many of the
models described above by increasing the half-life of functional
alleles in the population and the exploration of the small local
region of allowable variation in protein conformation. Liberles and
coworkers have proposed similar models in the context of negative
pleiotropy [91,100–102], and have reached parallel conclusions on
the impact of these bottlenecks in sequence space during evolution.
To gain support for these models of gene family evolution, it will
be important to functionally test the predictions of these models in
experimentally tractable systems.
Supporting Information
Figure S1 Observed frequencies for RNA-mediatedduplicates are much higher than expected frequenciesin RP families. Observed frequencies and expected frequencies
(in brackets) shown for each speciation node for 5 mammalian
genomes. The values were generated using data table created in
Jun et al [68]. Observed frequencies for RP-RTs were derived
from ribosomal families (Number of RP-RTs/Total Number of
Duplicates in RPs) and expected frequencies for intact retro-
duplicates were derived from 8872 non-ribosomal gene families
(Number of RTs in non-rp gene families/Total Number of
duplicates in non-rp gene families). All diversification times are
from Ureta-Vidal et al [54].
(EPS)
Figure S2 No Species-specific bias seen based onduplicate fates in ribosomal protein gene families.Distribution of duplicates (annotated by fate) across 8 mammalian
species. DD-RPs, RT-RPs and RY-RPs are shown in blue, green
and yellow respectively.
(EPS)
Figure S3 High sequence conservation observed acrossall duplicate fates in terms of pairwise distances. DD-
RPs and RT-RPs were seen to be under comparatively stronger
conservation than RY-RPs. Using pairwise distances instead of
Ka/Ks ratios as seen in figure 4. Error bars represent 95%
Confidence Interval.
(EPS)
Figure S4 Gene Tree for RPL10A showing PAML branchspecific omega values leading up to a clade. An abridged
Gene tree of RPL10A generated by parsimony-based syntenic
method (see Methods). The branch specific omega values are listed
at each node in purple. Ka/Ks values are represented at all leaves
in green. The RT-RP duplicates and their omega values are
highlighted in red.
(EPS)
Figure S5 Reconstructed evolutionary history for ribo-somal protein gene RPL3. Tube Tree showing RPL3L which
is a DD-RP that can be seen persistent in all mammals since its
origination (green line). Refer to figure 3 legend for tree
annotation.
(EPS)
Figure S6 Scatterplots for pair-wise Ka against Ksvalues show a strong selective pressure acting on theRP gene duplicates in older clades. Panel of Ka against Ks
graphs for RP duplicates using pair-wise method. Each panel
represents different clades for 8 mammalian genomes we studied.
Red dots represent RT-RPs and green dots represents RY-RPs.
The black dashed line represents Ka = Ks and the red & green line
are the best line of fits for the distribution of RT-RPs and RY-RPs
respectively.
(EPS)
Figure S7 Scatterplots for pair-wise Ka against Ksvalues show variable levels of purifying selection actingon the RP gene duplicates across all lineage specificclades. Each panel represents lineage specific clade of 8
mammalian genomes. Refer to figure S6 for more information
on the graph. Refer to figure 2 for abbreviations.
(EPS)
Table S1 Table representing all our RP gene duplicatesin 8 mammalian genomes and outgroup chicken. The
clade_num represents the syntenic relationships between gene
duplicates.
(XLSX)
Table S2 Table for all RP families that have PAMLbranch-specific Ka and Ks values. The clade_num repre-
sents the syntenic relationships between duplicates.
(XLSX)
Table S3 Log-likelihood and parameter estimates gen-erated from random-site models for RP genes. P =
number of free parameters for each model, l = log-likelihood value
for each model.
(PDF)
Appendix S1 74 RP gene trees with all annotatedduplication events.
(PDF)
Acknowledgments
We thank Dr. Jin Jun (University of Connecticut and Max-Plank Instritute
Leipzig, Germany) for immense help with setting up the project and
valuable suggestions during the inception of the work presented in the
manuscript. We thank Dr. Victoria Robinson (University of Connecticut)
for valuable suggestions in the manuscript regarding ribosomal protein
biology.
Author Contributions
Conceived and designed the experiments: CEN APD. Performed the
experiments: APD AO MDG. Analyzed the data: APD CEN AO AS.
Contributed reagents/materials/analysis tools: CEN MDG AO APD.
Wrote the paper: APD AO CEN.
References
1. Ohno S (n.d.) Evolution by gene duplication. Allen and Unwin, London.
2. Demuth J, Bie T, Stajich J, Cristianini N (2006) The evolution of mammalian
gene families. PloS one.
3. Bailey J, Gu Z, Clark R, Reinert K, Samonte R (2002) Recent segmental
duplications in the human genome. Science (New York, N.Y.).
Tempo and Mode of Gene Duplication in Ribosomal Protein Evolution
PLOS ONE | www.plosone.org 13 November 2014 | Volume 9 | Issue 11 | e111721
4. Bailey JA, Eichler EE (2006) Primate segmental duplications: crucibles ofevolution, diversity and disease. Nature reviews. Genetics 7: 552–64.
doi:10.1038/nrg1895.
5. Maere S, Bodt S, Raes J (2005) Modeling gene and genome duplications in
eukaryotes. Proceedings of the.
6. Hakes L, Pinney JW, Lovell SC, Oliver SG, Robertson DL (2007) All
duplicates are not equal: the difference between small-scale and genomeduplication. Genome biology 8: R209. doi:10.1186/gb-2007-8-10-r209.
7. Wolfe K, Shields D (1997) Molecular evidence for an ancient duplication of theentire yeast genome. Nature.
8. Meyer A, Schartl M (1999) Gene and genome duplications in vertebrates: theone-to-four (-to-eight in fish) rule and the evolution of novel gene functions.
Current opinion in cell biology.
9. Panopoulou G, Hennig S, Groth D, Krause A (2003) New evidence for
genome-wide duplications at the origin of vertebrates using an amphioxus geneset and completed animal genomes. Genome.
10. Dehal P, Boore J (2005) Two rounds of whole genome duplication in theancestral vertebrate. PLoS biology.
11. Zhang L, Lu H, Chung W, Yang J, Li W (2005) Patterns of segmentalduplication in the human genome. Molecular biology and evolution.
12. Brosius J, Gould SJ (1992) On ‘‘genomenclature’’: a comprehensive (andrespectful) taxonomy for pseudogenes and other ‘‘junk DNA’’. Proceedings of
the National Academy of Sciences of the United States of America 89: 10706–10.
13. Harrison PM, Zheng D, Zhang Z, Carriero N, Gerstein M (2005) Transcribedprocessed pseudogenes in the human genome: an intermediate form of
expressed retrosequence lacking protein-coding ability. Nucleic Acids Res 33:2374–83. doi:10.1093/nar/gki531.
14. Watanabe T, Totoki Y, Toyoda A, Kaneda M (2008) Endogenous siRNAsfrom naturally formed dsRNAs regulate transcripts in mouse oocytes. Nature.
15. Parker H, VonHoldt B, Quignon P, Margulies E (2009) An expressed fgf4retrogene is associated with breed-defining chondrodysplasia in domestic dogs.
Science (New York, N.Y.).
16. Parker H, VonHoldt B, Quignon P, Margulies E (2009) An expressed fgf4
retrogene is associated with breed-defining chondrodysplasia in domestic dogs.Science (New York, N.Y.).
17. Yu H, Jiang H, Zhou Q, Yang J, Cun Y (2006) Origination and evolution of ahuman-specific transmembrane protein gene, c1orf37-dup. Human molecular.
18. Jun J, M II, Mandoiu II, oiu, Nelson CE (2009) Identification of mammalianorthologs using local synteny. BMC Genomics 10: 630. doi:10.1186/1471-
2164-10-630.
19. Jun J, Ryvkin P, Hemphill E, Nelson C (2009) Duplication mechanism and
disruptions in flanking regions determine the fate of Mammalian geneduplicates. Journal of computational biology: a journal of computational
molecular cell biology 16: 1253–66. doi:10.1089/cmb.2009.0074.
20. Yu H, Jiang H, Zhou Q, Yang J, Cun Y (2006) Origination and evolution of a
human-specific transmembrane protein gene, c1orf37-dup. Human molecular.
21. Rodriguez V, Chen Y, Elkahloun A, Dutra A, Pak E, et al. (2007) Chromosome
8 BAC array comparative genomic hybridization and expression analysis
identify amplification and overexpression of TRMT12 in breast cancer. Genes,Chromosomes and Cancer 46: 694–707. doi:10.1002/gcc.20454.
22. Jiang Z, Chu P, Woda B, Liu Q, Balaji K (2008) Combination of quantitativeIMP3 and tumor stage: a new system to predict metastasis for patients with
localized renal cell carcinomas. Clinical Cancer.
23. Jiang Z, Lohse C, Chu P, Wu C, Woda B (2008) Oncofetal protein IMP3.
Cancer.
24. Tan J, Dunn J, Jaeken J (1996) Mutations in the MGAT2 gene controlling
complex N-glycan synthesis cause carbohydrate-deficient glycoprotein syn-drome type II, an autosomal recessive disease. American journal of human.
25. Rosengren A, Jokubka R, Tojjar D, Granhall C (2010) Overexpression ofalpha2A-adrenergic receptors contributes to type 2 diabetes. Science.
26. Roman T, Polanczyk G, Zeni C, Genro J (2005) Further evidence of the
involvement of alpha-2A-adrenergic receptor gene (ADRA2A) in inattentive
dimensional scores of attention-deficit/hyperactivity disorder. Molecular.
27. Carnemolla A, Fossale E, Agostoni E (2009) Rrs1 is involved in endoplasmic
reticulum stress response in Huntington disease. Journal of Biological.
28. Almeida A, Murakami Y, Layton D, Hillmen P (2006) Hypomorphic promoter
mutation in PIGM causes inherited glycosylphosphatidylinositol deficiency.Nature medicine.
29. Yu Z, Morais D, Ivanga M, Harrison P (2007) Analysis of the role ofretrotransposition in gene evolution in vertebrates. BMC Bioinformatics.
30. Wang P (2004) X chromosomes, retrogenes and their role in male
reproduction. Trends in Endocrinology & Metabolism.
31. Hori H, Higo K, Osawa S (1977) The rates of evolution in some ribosomal
components. Journal of Molecular Evolution.
32. Wool IG, Chan YL, Gluck A (n.d.) Structure and evolution of mammalian
ribosomal proteins. Biochem Cell Biol 73: 933–47.
33. Wool IG, Chan Y, Gluck A (n.d.)Structure and evolution of mammalian
ribosomal proteins. Biochem Cell Biol 73: 933–47.
34. Mager W (2013) Control of ribosomal protein gene expression. Biochimica et
biophysica acta 949: 1–15.
35. Fried M, Colombo P, Colombo MF (1992) Functional elements of the
ribosomal protein L7a (rpL7a) gene promoter region and their conservationbetween mammals and birds. Nucleic acids research 20: 3367.
36. Thorrez L, Deun K, Tranchevent L (2008) Using ribosomal protein genes asreference: a tale of caution. PloS one: 1–8.
37. Hariharan N, Kelley, Perry R (1989) Equipotent mouse ribosomal proteinpromoters have a similar architecture that includes internal sequence elements.
Genes & development.
38. Kenmochi N, Kawaguchi T, Rozen S, Davis E (1998) A map of 75 human
ribosomal protein genes. Genome.
39. Marygold S, Coelho C, Leevers S (2005) Genetic analysis of RpL38 and RpL5,
two minute genes located in the centric heterochromatin of chromosome 2 of
Drosophila melanogaster. Genetics.
40. Willig T, Draptchinskaia N, Dianzani I (1999) Mutations in ribosomal protein
S19 gene and Diamond Blackfan anemia: wide variations in phenotypicexpression. Blood.
41. Draptchinskaia N, Gustavsson P, Andersson B, Pettersson M, Willig TN, et al.(1999) The gene encoding ribosomal protein S19 is mutated in Diamond-
Blackfan anaemia. Nature genetics 21: 169–75. doi:10.1038/5951.
42. Zhang Y, Duc A, Rao S, Sun X, Bilbee A (2013) Control of Hematopoietic
Stem Cell Emergence by Antagonistic Functions of Ribosomal ProteinParalogs. Developmental cell.
43. Huang X, Chen Y, Li W, Cohen S (2010) The Rps23rg gene family originatedthrough retroposition of the ribosomal protein s23 mRNA and encodes
proteins that decrease Alzheimer’s b-amyloid level and tau. Human molecular.
44. Uechi T, Maeda N, Tanaka T (2002) Functional second genes generated byretrotransposition of the X-linked ribosomal protein genes. Nucleic Acids Res.
45. Thorrez L, Deun K, Tranchevent L (2008) Using ribosomal protein genes asreference: a tale of caution. PloS one: 1–8.
46. Wapinski I, Pfeffer A, Friedman N, Regev A (2007) Automatic genome-widereconstruction of phylogenetic gene trees. Bioinformatics.
47. Flygare J, Aspesi A, Bailey J, Miyake K (2007) Human RPS19, the genemutated in Diamond-Blackfan anemia, encodes a ribosomal protein required
for the maturation of 40S ribosomal subunits: 1–8.
48. Fried M, Colombo P, Colombo M (1992) Functional elements of the ribosomal
protein L7a (rpL7a) gene promoter region and their conservation betweenmammals and birds. Nucleic acids research 20: 3367.
49. Zhang Z, Harrison P, Gerstein M (2002) Identification and analysis of over2000 ribosomal protein pseudogenes in the human genome. Genome Res.
50. Balasubramanian S, Zheng D, Liu Y, Fang G, Frankish A, et al. (2009)
Comparative analysis of processed ribosomal protein pseudogenes in fourmammalian genomes. Genome Biol 10: R2. doi:10.1186/gb-2009-10-1-r2.
51. Flicek P, Amode M, Barrell D, Beal K, Brent S, et al. (n.d.) Ensembl 2011.Nucleic acids research 39: D800-6.
52. Zhang Z, Carriero N, Zheng D, Karro J (2006) PseudoPipe: an automatedpseudogene identification pipeline. Bioinformatics (Oxford, England).
53. Goodman M, Czelusniak J, Moore GW, Romero-Herrera AE, Matsuda G(1979) Fitting the Gene Lineage into its Species Lineage, a Parsimony Strategy
Illustrated by Cladograms Constructed from Globin Sequences. SystematicBiology 28: 132–163. doi:10.1093/sysbio/28.2.132.
54. Ureta-Vidal A, Ettwiller L, Birney E (2003) Comparative genomics: genome-wide analysis in metazoan eukaryotes. Nature Reviews Genetics.
55. Mikkelsen T, Wakefield M, Aken B, Amemiya C (2007) Genome of themarsupial Monodelphis domestica reveals innovation in non-coding sequences.
Nature.
56. Yang Z (2007) PAML 4: Phylogenetic Analysis by Maximum Likelihood.Molecular biology and evolution 24: 1586–1591.
57. Farfan M, Minana-Galbis D, Fuste MC, Loren JG (2009) Divergent evolutionand purifying selection of the flaA gene sequences in Aeromonas. Biology
Direct 2009 4: 23 4: 23. doi:10.1186/1745-6150-4-23.
58. Yang Z, Swanson WJ (2002) Codon-Substitution Models to Detect Adaptive
Evolution that Account for Heterogeneous Selective Pressures Among SiteClasses. Molecular biology and evolution 19: 49–57.
59. Bastian F, Parmentier G, Roux J, Moretti S, Laudet V, et al. (n.d.) Bgee:Integrating and Comparing Heterogeneous Transcriptome Data Among
Species: 124–131. doi:10.1007/978-3-540-69828-9_12.
60. Khachane AN, Harrison PM (2009) Assessing the genomic evidence for
conserved transcribed pseudogenes under selection. BMC Genomics 10: 435.
doi:10.1186/1471-2164-10-435.
61. Zheng D, Zhang Z, Harrison PM, Karro J, Carriero N, et al. (2005) Integrated
Pseudogene Annotation for Human Chromosome 22: Evidence for Transcrip-tion. Journal of Molecular Biology 349: 27–45. doi:10.1016/j.jmb.2005.02.072.
62. Nielsen R, Yang Z (1998) Likelihood Models for Detecting Positively SelectedAmino Acid Sites and Applications to the HIV-1 Envelope Gene. Genetics 148:
929–936.
63. Raay TJ, Connors TD, Klinger KW, L GM, Landes GM, et al. (1996) A Novel
Ribosomal Protein L3-like Gene (RPL3L) Maps to the Autosomal DominantPolycystic Kidney Disease Gene Region. Genomics 37: 172–176. doi:10.1006/
geno.1996.0538.
64. Goncalves I, Goncalves I, Duret L, Mouchiroud D (n.d.) Nature and Structureof Human Genes that Generate Retropseudogenes. Genome research 10: 672–
678. doi:10.1101/gr.10.5.672.
65. Zhang Z, Harrison P, Gerstein M (2002) Identification and analysis of over
2000 ribosomal protein pseudogenes in the human genome. Genome Res.
66. Han MV, Hahn MW (2009) Identifying parent-daughter relationships among
duplicated genes. Pacific Symposium on Biocomputing. Pacific Symposium onBiocomputing: 114–25.
Tempo and Mode of Gene Duplication in Ribosomal Protein Evolution
PLOS ONE | www.plosone.org 14 November 2014 | Volume 9 | Issue 11 | e111721
67. Hahn MW (2009) Distinguishing among evolutionary models for the
maintenance of gene duplicates. J Hered 100: 605–17. doi:10.1093/jhered/esp047.
68. Yu Z, Morais D, Ivanga M, Harrison P (2007) Analysis of the role of
retrotransposition in gene evolution in vertebrates. BMC Bioinformatics.69. Ohno S (n.d.) Evolution by gene duplication. Allen and Unwin, London.
70. Jun J, Ryvkin P, Hemphill E, M I, Mandoiu I, et al. (2009) The birth of newgenes by RNA- and DNA-mediated duplication during mammalian evolution.
Journal of computational biology: a journal of computational molecular cell
biology 16: 1429–44. doi:10.1089/cmb.2009.0073.71. Blanc G, Wolfe K (2004) Functional divergence of duplicated genes formed by
polyploidy during Arabidopsis evolution. The Plant Cell Online.72. Evangelisti AM, Conant GC (2010) Nonrandom Survival of Gene Conversions
among Yeast Ribosomal Proteins Duplicated through Genome Doubling.Genome Biology and Evolution 2: 826–834. doi:10.1093/gbe/evq067.
73. Freeling M (2009) Bias in Plant Gene Content Following Different Sorts of
Duplication: Tandem, Whole-Genome, Segmental, or by Transposition.Annual Review of Plant Biology 60: 433–453. doi:10.1146/annurev.ar-
plant.043008.092122.74. Amoutzias GD, He Y, Gordon J, Mossialos D, Oliver SG, et al. (2010)
Posttranslational regulation impacts the fate of duplicated genes. Proceedings of
the National Academy of Sciences. Vol. 107. pp. 2967–2971. doi:10.1073/pnas.0911603107.
75. Seoighe C, Wolfe KH (1999) Yeast genome evolution in the post-genome era.Current Opinion in Microbiology 2: 548–554. doi:10.1016/S1369-
5274(99)00015-6.76. Zhang J (2003) Evolution by gene duplication: an update. Trends in ecology &
evolution.
77. Hahn M (2009) Distinguishing among evolutionary models for the mainte-nance of gene duplicates. J Hered 100: 605–17.
78. Innan H, Kondrashov F (2010) The evolution of gene duplications: classifyingand distinguishing between models. Nature reviews. Genetics 11: 97–108.
doi:10.1038/nrg2689.
79. Xue S, Barna M (2012) Specialized ribosomes: a new frontier in generegulation and organismal biology. Nature Reviews Molecular Cell Biology,
Published online: 23 May 2012; | doi:10.1038/nrm3359 13: 355–369.doi:doi:10.1038/nrm3359.
80. Force A, Lynch M, Pickett FB, Amores A, Yan YL, et al. (1999) Preservation ofduplicate genes by complementary, degenerative mutations. Genetics 151:
1531–45.
81. Cusack B, Wolfe K (2007) Not born equal: increased rate asymmetry inrelocated and retrotransposed rodent gene duplicates. Molecular biology and
evolution.82. Marais D, Rausher M (2008) Escape from adaptive conflict after duplication in
an anthocyanin pathway gene. Nature.
83. Conrad B, Antonarakis SE (2007) Gene Duplication: A Drive for PhenotypicDiversity and Cause of Human Disease. Annual Review of Genomics and
Human Genetics 8: 17–35. doi:10.1146/annurev.genom.8.021307.110233.84. Innan H, Kondrashov F (2010) The evolution of gene duplications: classifying
and distinguishing between models. Nature reviews. Genetics 11: 97–108.85. Zhang J (2003) Evolution by gene duplication: an update. Trends in ecology &
evolution.
86. Dennis PP, Nomura M (1974) Stringent control of ribosomal protein gene
expression in Escherichia coli. Proceedings of the National Academy of
Sciences of the United States of America 71: 3819–23.
87. Mager W (2013) Control of ribosomal protein gene expression. Biochimica et
biophysica acta 949: 1–15.
88. Zhao Y, McIntosh K, Rudra D (2006) Fine-structure analysis of ribosomal
protein gene transcription. and cellular biology.
89. Marygold S, Roote J, Reuter G, Lambertsson A (2007) The ribosomal protein
genes and Minute loci of Drosophila melanogaster. Genome.
90. de Smet R, Adams KL, Klaas V, Vandepoele K, epoele, et al. (2013)
Convergent gene loss following gene and genome duplications creates single-
copy families in flowering plants. PNAS 110: 2898–2903. doi:10.1073/
pnas.1300127110.
91. Konrad A, Teufel AI, Grahnen JA, Liberles DA (2011) Toward a General
Model for the Evolutionary Dynamics of Gene Duplicates. Genome Biology
and Evolution 3: 1197–1209. doi:10.1093/gbe/evr093.
92. Gilsdorf M, Horn T, Arziman Z, Pelz O, Kiner E, et al. (2010) GenomeRNAi:
a database for cell-based RNAi phenotypes. 2009 update. Nucleic acids
research 38: D448–52.
93. Kittler R, Putz G, Pelletier L, Poser I, Heninger A (2004) An endoribonuclease-
prepared siRNA screen in human cells identifies genes essential for cell division.
Nature.
94. Gilsdorf M, Horn T, Arziman Z, Pelz O, Kiner E, et al. (2010) GenomeRNAi:
a database for cell-based RNAi phenotypes. 2009 update. Nucleic acids
research 38: D448–52. doi:10.1093/nar/gkp1038.
95. Hughes T, Ekman D, Ardawatia H, Elofsson A (2007) Evaluating dosage
compensation as a cause of duplicate gene retention in Paramecium tetraurelia.
Genome.
96. Aury J, Jaillon O, Duret L, Noel B, Jubin C, et al. (2006) Global trends of
whole-genome duplications revealed by the ciliate Paramecium tetraurelia.
Nature 444: 171–178. doi:10.1038/nature05230.
97. Veitia RA (2010) A generalized model of gene dosage and dominant negative
effects in macromolecular complexes. The FASEB Journal 24: 994–1002.
doi:10.1096/fj.09-146969.
98. Veitia R (2007) Exploring the molecular etiology of dominant-negative
mutations. The Plant Cell Online.
99. Gibson TJ, Spring J (1998) Genetic redundancy in vertebrates: polyploidy and
persistence of genes encoding multidomain proteins. Trends in genetics: TIG
14: 46–9; discussion 49–50.
100. Liberles DA, Teufel AI, Liu L, Stadler T (2013) On the Need for Mechanistic
Models in Computational Genomics and Metagenomics. Genome Biology and
Evolution 5: 2008–2018. doi:10.1093/gbe/evt151.
101. Liberles DA, Tisdell MDM, Grahnen JA (2011) Binding constraints on the
evolution of enzymes and signalling proteins: the important role of negative
pleiotropy. Proceedings of the Royal Society B: Biological Sciences 278: 1930–
1935. doi:10.1098/rspb.2010.2637.
102. Hughes T, Da Liberles (2007) The pattern of evolution of smaller-scale gene
duplicates in mammalian genomes is more consistent with neo-than
subfunctionalisation. Journal of Molecular Evolution.
103. Ureta-Vidal A, Ettwiller L, Birney E (2003) Comparative genomics: genome-
wide analysis in metazoan eukaryotes. Nature Reviews Genetics.
Tempo and Mode of Gene Duplication in Ribosomal Protein Evolution
PLOS ONE | www.plosone.org 15 November 2014 | Volume 9 | Issue 11 | e111721