Temperature -dependent Li isotope ratios in Appalachian Plateau and Gulf Coast Sedimentary Basin...
11
Temperature-dependent Li isotope ratios in Appalachian Plateau and Gulf Coast Sedimentary Basin saline water G. L. MACPHERSON 1 , R. C. CAPO 2,3 , B. W. STEWART 2,3 , T. T. PHAN 2,3 , K. SCHROEDER 4 AND R. W. HAMMACK 4 1 Department of Geology, University of Kansas, Lawrence, KS, USA; 2 Department of Geology and Planetary Science, University of Pittsburgh, Pittsburgh, PA, USA; 3 National Energy Technology Laboratory-Regional University Alliance, Pittsburgh, PA, USA; 4 U.S. Department of Energy, National Energy Technology Laboratory, Pittsburgh, PA, USA ABSTRACT Lithium (Li) concentrations of produced water from unconventional (horizontally drilled and hydraulically frac- tured shale) and conventional gas wells in Devonian reservoirs in the Appalachian Plateau region of western Pennsylvania range from 0.6 to 17 mmol kg 1 , and Li isotope ratios, expressed as in d 7 Li, range from +8.2 to +15&. Li concentrations are as high as 40 mmol kg 1 in produced waters from Plio-Pleistocene through Jurassic- aged reservoirs in the Gulf Coast Sedimentary Basin analyzed for this study, and d 7 Li values range from about +4.2 to +16.6&. Because of charge-balance constraints and rock buffering, Li concentrations in saline waters from sedimentary basins throughout the world (including this study) are generally positively correlated with chlo- ride (Cl), the dominant anion in these fluids. Li concentrations also vary with depth, although the extent of depth dependence differs among sedimentary basins. In general, Li concentrations are higher than expected from sea- water or evaporation of seawater and therefore require water–mineral reactions that remove lithium from the minerals. Li isotope ratios in these produced waters vary inversely with temperature. However, calculations of temperature-dependent fractionation of d 7 Li between average shale d 7 Li ( 0.7&) and water result in d 7 Li water that is more positive than that of most produced waters. This suggests that aqueous d 7 Li may reflect transport of water from depth and/or reaction with rocks having d 7 Li lighter than average shale. Key words: Appalachian Plateau, diagenesis, fluid transport, formation water, Gulf Coast Sedimentary Basin, lithium, produced water, saline water, stable lithium isotope ratios, water–rock reaction Received 15 October 2013; accepted 5 May 2014 Corresponding author: G. L. Macpherson, Department of Geology, University of Kansas, 1475 Jayhawk Blvd, Rm. 120 Lindley Hall, Lawrence, KS 66045, USA. Email: [email protected]. Tel: +1 (785)864-2742. Fax: +1 (785)864-5276. Geofluids (2014) 14, 419–429 INTRODUCTION Lithium, a low-mass lithophile alkali element, has two sta- ble isotopes, 6 Li and 7 Li; the Li isotope ratio ( 7 Li/ 6 Li) has been used to understand crustal processes, including water–rock reactions in near-surface environments (see Tomascak 2004; Millot et al. 2010b; Tipper et al. 2012; Romer et al. 2013; and references therein). The behavior of Li in marine sediments and pore waters has been used to understand processes in sedimentary basins (Kharaka et al. 1973, 1977; Breen et al. 1985; Macpherson 1989). Li isotopes in saline waters can aid in identifying sources of Li, mixing of different fluids and progressive water–rock reactions (Zhang et al. 1998; Chan et al. 1992, Chan et al. 1994; Chan et al. 2002; Bottomley et al. 2003; Millot et al. 2011; Eccles & Berhane 2011; see Table 1). In marine settings, Li is removed from seawater during weathering of ocean basalt and incorporated into authigen- ic smectite during which isotopic fractionation enriches the rock in 6 Li and the fluid in 7 Li. The fractionation is larger at lower temperatures, and the process may be complicated by ion-exchange reactions with ammonium (Zhang et al. 1998). Seafloor hydrothermal fluids are enriched in Li and have lower 7 Li/ 6 Li compared with seawater (Magenheim et al. 1995), suggesting that the relatively incompatible Li is removed from unspecified minerals in the sediments, and the progression is toward isotopic equilibrium with a source rock having a lower 7 Li/ 6 Li. Removal of Li from rock without isotopic fractionation has also been docu- mented for metamorphic reactions (Qiu et al. 2011a,b). Sedimentary basins are generally warm, low pH, reduc- ing environments with decreasing porosity with depth © 2014 John Wiley & Sons Ltd Geofluids (2014) 14, 419–429 doi: 10.1111/gfl.12084
Transcript of Temperature -dependent Li isotope ratios in Appalachian Plateau and Gulf Coast Sedimentary Basin...

Temperature-dependent Li isotope ratios in AppalachianPlateau and Gulf Coast Sedimentary Basin saline water
G. L. MACPHERSON1, R. C. CAPO2 , 3 , B . W. STEWART2 , 3 , T . T . PHAN2 , 3 , K . SCHROEDER4
AND R. W. HAMMACK4
1Department of Geology, University of Kansas, Lawrence, KS, USA; 2Department of Geology and Planetary Science,
University of Pittsburgh, Pittsburgh, PA, USA; 3National Energy Technology Laboratory-Regional University Alliance,
Pittsburgh, PA, USA; 4U.S. Department of Energy, National Energy Technology Laboratory, Pittsburgh, PA, USA
ABSTRACT
Lithium (Li) concentrations of produced water from unconventional (horizontally drilled and hydraulically frac-
tured shale) and conventional gas wells in Devonian reservoirs in the Appalachian Plateau region of western
Pennsylvania range from 0.6 to 17 mmol kg�1, and Li isotope ratios, expressed as in d7Li, range from +8.2 to
+15&. Li concentrations are as high as 40 mmol kg�1 in produced waters from Plio-Pleistocene through Jurassic-
aged reservoirs in the Gulf Coast Sedimentary Basin analyzed for this study, and d7Li values range from about
+4.2 to +16.6&. Because of charge-balance constraints and rock buffering, Li concentrations in saline waters
from sedimentary basins throughout the world (including this study) are generally positively correlated with chlo-
ride (Cl), the dominant anion in these fluids. Li concentrations also vary with depth, although the extent of depth
dependence differs among sedimentary basins. In general, Li concentrations are higher than expected from sea-
water or evaporation of seawater and therefore require water–mineral reactions that remove lithium from the
minerals. Li isotope ratios in these produced waters vary inversely with temperature. However, calculations of
temperature-dependent fractionation of d7Li between average shale d7Li (�0.7&) and water result in d7Liwater
that is more positive than that of most produced waters. This suggests that aqueous d7Li may reflect transport of
water from depth and/or reaction with rocks having d7Li lighter than average shale.
Key words: Appalachian Plateau, diagenesis, fluid transport, formation water, Gulf Coast Sedimentary Basin,
lithium, produced water, saline water, stable lithium isotope ratios, water–rock reaction
Received 15 October 2013; accepted 5 May 2014
Corresponding author: G. L. Macpherson, Department of Geology, University of Kansas, 1475 Jayhawk Blvd, Rm.
120 Lindley Hall, Lawrence, KS 66045, USA. Email: [email protected]. Tel: +1 (785)864-2742. Fax: +1 (785)864-5276.
Geofluids (2014) 14, 419–429
INTRODUCTION
Lithium, a low-mass lithophile alkali element, has two sta-
ble isotopes, 6Li and 7Li; the Li isotope ratio (7Li/6Li) has
been used to understand crustal processes, including
water–rock reactions in near-surface environments (see
Tomascak 2004; Millot et al. 2010b; Tipper et al. 2012;
Romer et al. 2013; and references therein). The behavior
of Li in marine sediments and pore waters has been used
to understand processes in sedimentary basins (Kharaka
et al. 1973, 1977; Breen et al. 1985; Macpherson 1989).
Li isotopes in saline waters can aid in identifying sources of
Li, mixing of different fluids and progressive water–rock
reactions (Zhang et al. 1998; Chan et al. 1992, Chan
et al. 1994; Chan et al. 2002; Bottomley et al. 2003;
Millot et al. 2011; Eccles & Berhane 2011; see Table 1).
In marine settings, Li is removed from seawater during
weathering of ocean basalt and incorporated into authigen-
ic smectite during which isotopic fractionation enriches the
rock in 6Li and the fluid in 7Li. The fractionation is larger
at lower temperatures, and the process may be complicated
by ion-exchange reactions with ammonium (Zhang et al.
1998). Seafloor hydrothermal fluids are enriched in Li and
have lower 7Li/6Li compared with seawater (Magenheim
et al. 1995), suggesting that the relatively incompatible Li
is removed from unspecified minerals in the sediments, and
the progression is toward isotopic equilibrium with a
source rock having a lower 7Li/6Li. Removal of Li from
rock without isotopic fractionation has also been docu-
mented for metamorphic reactions (Qiu et al. 2011a,b).
Sedimentary basins are generally warm, low pH, reduc-
ing environments with decreasing porosity with depth
© 2014 John Wiley & Sons Ltd
Geofluids (2014) 14, 419–429 doi: 10.1111/gfl.12084
(Day-Stirrat et al. 2010) and fluids with salinity mostly
greater than seawater. Processes affecting water chemistry
in sedimentary basins (Morton & Land 1987; Land &
Macpherson 1992; Land 1995; Kharaka & Hanor 2003)
include the following.
(1) Mixing with other aqueous fluids, including inherited
evaporated seawater and mineral-dehydration water.
(2) Mineral dissolution, such as evaporite minerals, feld-
spars, calcite, quartz, and heavy minerals.
(3) Mineral alteration, including progressive transforma-
tion of smectite and smectite-illite to more crystalline
illite (generally complete by approximately 100°C;Eberl & Hower 1976); albitization of plagioclase;
dolomitization of limestone; and transformation of
gypsum to anhydrite.
(4) Mineral precipitation, including formation of authigen-
ic clays, quartz, calcite, siderite, and ankerite.
(5) Maturation of organic matter.
Of these processes, the clay transformations are the most
likely to affect Li concentration and isotope ratios, because
clays are the largest reservoir of Li in this environment
(Macpherson 1989). Shale (mudrocks) contains the highest
amounts of clay minerals and also is the most abundant
lithology in most sedimentary basins (Sharp et al. 1988;
Hanor & McIntosh 2007), and so shale will be considered
the most important source of Li here. This study examines
the relationships between temperature and lithium concen-
trations and isotope ratios in waters produced from oil and
gas wells (produced waters) in two tectonically different
sedimentary basins in the United States, the Appalachian
Plateau region of the Appalachian Basin and the Gulf of
Mexico Coastal Sedimentary Basin (Gulf Basin).
In the first target of this study, the Appalachian Plateau,
use of horizontal drilling combined with hydraulic fractur-
ing to enhance porosity and permeability in shale (uncon-
ventional production) has led to greatly increased
production of methane and other hydrocarbons. Currently,
the primary target of unconventional production is the
organic matter-rich (2–15 wt.%) Middle Devonian Marcel-
lus Formation (Zagorski et al. 2011). The Appalachian
Basin is an extensively folded and faulted foreland basin
that was affected by several tectonic events in the Paleo-
zoic, culminating in the Permian Alleghanian orogeny.
Most of the large-displacement faulting and high-ampli-
tude folding are confined to the southeastern basin margin,
while the Marcellus Shale gas play, which extends from
New York and Ohio to West Virginia (Karbo et al. 2010),
is located in the less deformed Appalachian Plateau to the
west. Nonetheless, tectonically driven fluids are thought to
have affected even undeformed portions of the basin (Oli-
ver 1986; Evans 1995; Osborn et al. 2012).
In contrast, the second target of this study, the well
characterized Gulf of Mexico Coastal Sedimentary Basin
(Gulf Basin), has had a comparatively simple tectonic
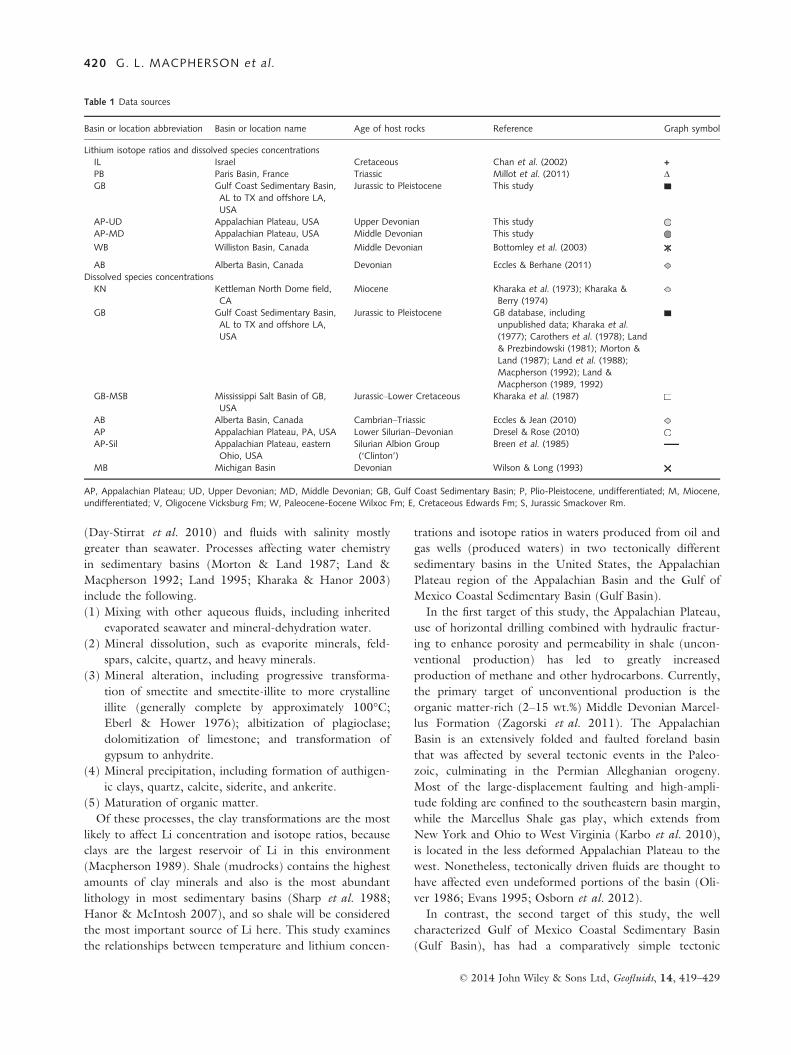
Table 1 Data sources
Basin or location abbreviation Basin or location name Age of host rocks Reference Graph symbol
Lithium isotope ratios and dissolved species concentrationsIL Israel Cretaceous Chan et al. (2002) +
PB Paris Basin, France Triassic Millot et al. (2011) ΔGB Gulf Coast Sedimentary Basin,
AL to TX and offshore LA,USA
Jurassic to Pleistocene This study
AP-UD Appalachian Plateau, USA Upper Devonian This studyAP-MD Appalachian Plateau, USA Middle Devonian This study
WB Williston Basin, Canada Middle Devonian Bottomley et al. (2003)
AB Alberta Basin, Canada Devonian Eccles & Berhane (2011)
Dissolved species concentrationsKN Kettleman North Dome field,
CAMiocene Kharaka et al. (1973); Kharaka &
Berry (1974)GB Gulf Coast Sedimentary Basin,
AL to TX and offshore LA,USA
Jurassic to Pleistocene GB database, includingunpublished data; Kharaka et al.(1977); Carothers et al. (1978); Land& Prezbindowski (1981); Morton &
Land (1987); Land et al. (1988);Macpherson (1992); Land &Macpherson (1989, 1992)
GB-MSB Mississippi Salt Basin of GB,USA
Jurassic–Lower Cretaceous Kharaka et al. (1987)
AB Alberta Basin, Canada Cambrian–Triassic Eccles & Jean (2010)
AP Appalachian Plateau, PA, USA Lower Silurian–Devonian Dresel & Rose (2010)AP-Sil Appalachian Plateau, eastern
Ohio, USASilurian Albion Group(‘Clinton’)
Breen et al. (1985)
MB Michigan Basin Devonian Wilson & Long (1993)
AP, Appalachian Plateau; UD, Upper Devonian; MD, Middle Devonian; GB, Gulf Coast Sedimentary Basin; P, Plio-Pleistocene, undifferentiated; M, Miocene,undifferentiated; V, Oligocene Vicksburg Fm; W, Paleocene-Eocene Wilxoc Fm; E, Cretaceous Edwards Fm; S, Jurassic Smackover Rm.
© 2014 John Wiley & Sons Ltd, Geofluids, 14, 419–429
420 G. L. MACPHERSON et al.
history: the basin subsided as it filled, with development of
growth faults and penetration by salt domes in some areas
but little other deformation (Sharp et al. 1988). In addi-
tion, the Gulf Basin continues to receive sediment, while
the entire Appalachian Basin is undergoing erosion without
new deposition.
We report here lithium concentrations and isotope ratios
in produced waters from (i) unconventional natural gas
wells completed in the Appalachian Plateau Middle Devo-
nian Marcellus Group (1 vertical well, 3 horizontal wells)
in Pennsylvania, (ii) conventional natural gas wells com-
pleted in the Appalachian Plateau Upper Devonian Brad-
ford and Venango Groups (3 wells) in Pennsylvania, and
(iii) conventional oils and gas wells in the Gulf Basin (Plio-
Pleistocene to Jurassic-aged reservoirs, 6 wells located in
Texas and offshore Louisiana). In order to understand the
distribution of Li in sedimentary basins and to explore
whether there are commonalities in the lithium isotope
ratio systematics despite differences in basin tectonics and
production reservoir composition, these are described in
context of published lithium isotope ratios and/or concen-
trations reported for the Alberta Basin, Michigan Basin, an
oilfield in Israel, Kettleman North Dome field in the San
Joaquin Basin in California, the Paris Basin and a single
sample from the Williston Basin (Table 1).
METHODS AND DATA
Sample collection and treatment
Appalachian Plateau samples were collected by personnel
from University of Pittsburgh, DOE-NETL and USGS.
Samples were collected as close to the wellhead as possible,
although some are separator, and some are holding tank
samples. Middle Devonian reservoir samples were collected
from unconventional gas wells in which fresh water (not
recycled saline water) was injected during the fracturing
process. Produced water chemistry changes with time dur-
ing early production, with most cation concentrations
increasing rapidly over the first several weeks of produc-
tion, then reaching near steady-state levels thought to rep-
resent in situ water chemistry (Chapman et al. 2012).
Samples for this study were collected during this later state.
Samples from the Gulf Basin reservoirs are part of a Uni-
versity of Texas database of Gulf Basin fluids, some of
which were collected by the first author.
All samples were filtered in the field, and most were
field-acidified to pH <2 using standard protocol (Kharaka
& Hanor 2003); a comparison of the d7Li of samples
filtered and acidified in the field with samples from the
same well and sampling time (i) filtered in the field but
acidified in the laboratory and (ii) refiltered in the labora-
tory and acidified in the laboratory, show no significant
differences (2r is within � 0.5&).
Analytical methods
Lithium and other cation concentrations were determined
by ICP-OES or ICP-MS; anion concentrations were deter-
mined by ion chromatography or titration (alkalinity). For
lithium isotope determination, lithium was separated from
other cations using column chromatography, following a
protocol modified from James & Palmer (2000). For every
sample, the 5 ml aliquot before and after the aliquot used
for lithium isotope determination was analyzed for lithium
and other cation concentrations to assure complete separa-
tion of lithium from other cations. Lithium isotope ratios
were measured with a Neptune Plus multicollector ICP-
MS at the University of Pittsburg, using the bracketing
method (blank–standard–blank–unknown–blank–standard–
blank) with 7Li and 6Li ions measured simultaneously. Iso-
tope ratios are reported as d7Li using the standard del
notation in units of &: (Rsmp/Rstd – 1) 9 1000, where
‘R’ is the 7Li/6Li atomic ratio, ‘smp’ is the sample, and
‘std’ is the NIST RM 8545 (LSVEC) standard. RM 8545
has a reported atomic 6Li/7Li of 0.08215 � 0.00023. The
precision of our repeated measurement of RM 8545, pur-
chased in 2012, was � 0.52& (2r, standard error of the
mean, n = 16). Mean and precision of our measurements
of IRMM-16 (reported as 0.35 � 1.41&, Qi et al. 1997)
was 0.07 � 0.35& (n = 11) and of Li7-N (reported as
30.4 � 1.1&, Carignan et al. 2007) was 30.07 � 0.16&(n = 11). We manufactured a Na-Ca-Cl fluid with total
dissolved solids of 110 parts per thousand and 50 ppm Li
to test the chromatographic separation of Li on a fluid
with a composition similar to the produced waters. Aver-
age d7Li of the 5 full procedural replicates and 3 within-
run replicate measurements of the lithium separated from
the Na-Ca-Cl fluid was 79.1 � 0.8&. Average of two rep-
licate measurements of the Li stock solution used to make
the artificial brine was 79.2 � 0.7&. For the produced
water samples, within-run replicates, long-term replicates,
and full procedural duplicates are all within less
than � 0.7& from the average, and within-run precision
was less than � 0.2& (Table 2). Full procedural blanks,
using a 6Li-enriched solution for isotope dilution determi-
nation, contained <0.04 ng lithium, and thus contribute
insignificantly to Li isotope ratios measured in samples,
that contained approximately 5 lg Li.
Lithium concentration and isotope ratios for our samples
are given in Table 2.
RESULTS
Li concentrations and Cl concentrations in Appalachian
Plateau produced waters analyzed in this study range from
about 0.6 to 17 and about 360 to 3000 mmol kg�1,
respectively (Table 2, Fig. 1). In Gulf Basin produced
waters analyzed in this study, Li and Cl concentrations
© 2014 John Wiley & Sons Ltd, Geofluids, 14, 419–429
Li isotope ratios in saline water 421

range from about 0.6 to 40 and about 800 to
4500 mmol kg�1, respectively. In other sedimentary basin
data compiled for this study, all but Kettleman North
Dame samples fall within the ranges for our data; Kettle-
man North Dome samples are more dilute.
d7Li of Appalachian Plateau samples analyzed for this
study range from about +8.2 to +15.2&, while Gulf Basin
samples analyzed for this study cover a wider range, from
about +4.2 to +16.6&. Compiled values of d7Li in pro-
duced waters used in this study fall with the range of Gulf
Basin samples except for Israel oil field samples, which
range up to the d7Li of seawater (about +31&).
DISCUSSION
Li concentrations
Li concentrations generally increase with depth in most
sedimentary basins, but there is also large variation at any
one depth, even within a single basin (Fig. 1a). In the
Alberta Basin and Appalachian Plateau, the maximum
aqueous Li concentration occurs at about 2.5 km. The Li
maximum in the Appalachian Plateau fluids
(17 mmol kg�1) is slightly higher than the maximum in
the Alberta Basin (about 14 mmol kg�1). In the Gulf
Table 2 Lithium concentrations and isotope ratios, new data for this study
Database ID Analysis type State County or offshore block Depth, m* Temperature, °C*
(a) Sample identification and propertiesAppalachian Plateau samples
AP-UD002 PA Clarion Co. 335* 15.3–17.4*AP-UD003 PA Greene Co. 1400 38.6–47.5*AP-UD004 PA Greene Co. 1250 36.2–44.4*AP-MD002 PA Greene Co. 2450 60.9–77.1*AP-MD002 MSDAP-MD002 FPDAP-MD003 PA Greene Co. 2450 60.9–77.1*AP-MD004 PA Washington Co. 1446–2460* 39.8–76.1*AP-MD004 MSDAP-MD005 PA Westmoreland Co. 1906–2937* 48.5–88.2*
Gulf Coast Sedimentary Basin SamplesGB-P020 LA offshore Eugene Island, Block 313 2822 84GB-M015 LA offshore State Lease 340 2972 91GB-V007 TX Hidalgo Co. 3749 154*GB-V007 MSD
GB-W039 TX Goliad Co. 2319 80GB-W039 MSDGB-E017 TX Karnes Co. 4090 157GB-S001 AL Mobile Co. na naGB-S001 MSD
Database ID Cl, mmol kg�1 Li, mmol kg�1 d7Li,& �2 s
(b) Concentrations and isotope ratiosAppalachian Plateau samples
AP-UD002 361 0.56 15.23 0.24AP-UD003 2290 2.83 10.50 0.24AP-UD004 2390 3.23 12.49 0.19AP-MD002 2290 11.5 9.48 0.17AP-MD002 9.51 0.18AP-MD002 9.54 0.16
AP-MD003 2210 17.4 9.50 0.16AP-MD004 2970 9.67 9.32 0.15AP-MD004 9.38 0.16AP-MD005 2020 7.40 8.15 0.16
Gulf Coast Sedimentary Basin samplesGB-P020 1930 0.62 10.69 0.15GB-M015 1360 0.62 8.79 0.15
GB-V007 2920 5.47 9.32 0.15GB-V007 10.05 0.15GB-W039 816 0.7 8.11 0.14GB-W039 7.85 0.16GB-E017 4530 39.5 4.21 0.16GB-S001 4220 9.96 16.60 0.17
GB-S001 16.27 0.14
*Temperature estimated from depth, mean annual temperature and geothermal gradient; depth estimated from countywide range of depth to Marcellus Shale.MSD, Measurement same-day duplicate; FPD, Full procedural duplicate; na, data not available.
© 2014 John Wiley & Sons Ltd, Geofluids, 14, 419–429
422 G. L. MACPHERSON et al.
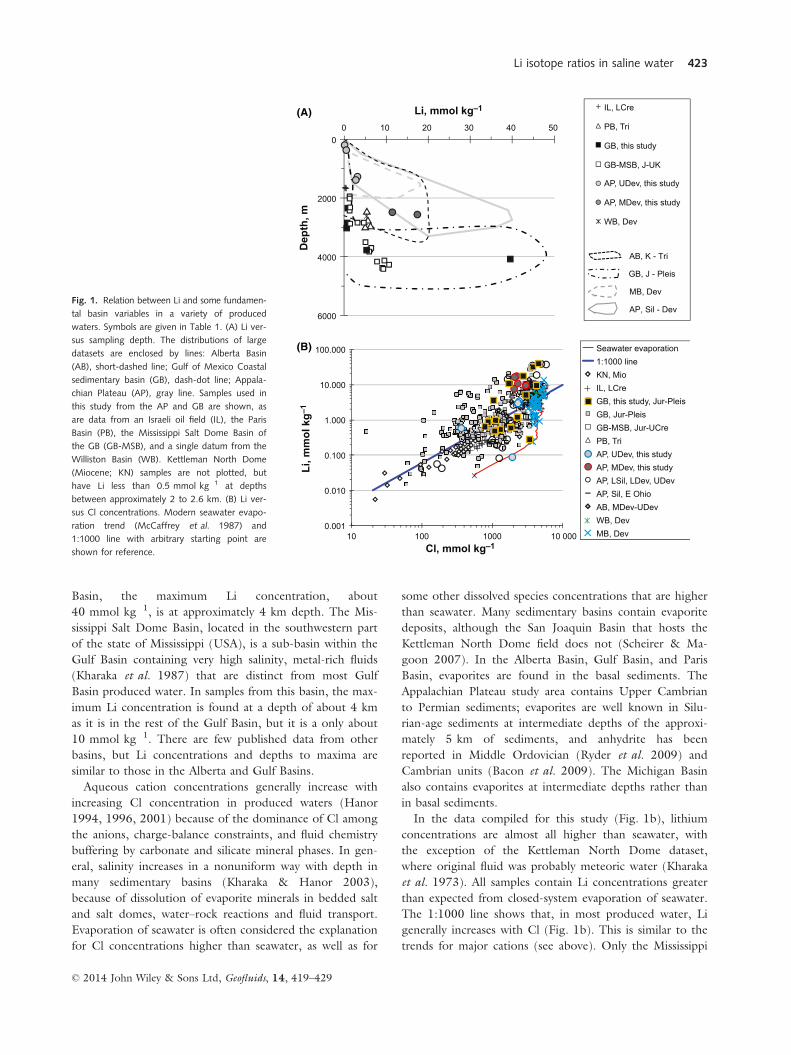
Basin, the maximum Li concentration, about
40 mmol kg�1, is at approximately 4 km depth. The Mis-
sissippi Salt Dome Basin, located in the southwestern part
of the state of Mississippi (USA), is a sub-basin within the
Gulf Basin containing very high salinity, metal-rich fluids
(Kharaka et al. 1987) that are distinct from most Gulf
Basin produced water. In samples from this basin, the max-
imum Li concentration is found at a depth of about 4 km
as it is in the rest of the Gulf Basin, but it is a only about
10 mmol kg�1. There are few published data from other
basins, but Li concentrations and depths to maxima are
similar to those in the Alberta and Gulf Basins.
Aqueous cation concentrations generally increase with
increasing Cl concentration in produced waters (Hanor
1994, 1996, 2001) because of the dominance of Cl among
the anions, charge-balance constraints, and fluid chemistry
buffering by carbonate and silicate mineral phases. In gen-
eral, salinity increases in a nonuniform way with depth in
many sedimentary basins (Kharaka & Hanor 2003),
because of dissolution of evaporite minerals in bedded salt
and salt domes, water–rock reactions and fluid transport.
Evaporation of seawater is often considered the explanation
for Cl concentrations higher than seawater, as well as for
some other dissolved species concentrations that are higher
than seawater. Many sedimentary basins contain evaporite
deposits, although the San Joaquin Basin that hosts the
Kettleman North Dome field does not (Scheirer & Ma-
goon 2007). In the Alberta Basin, Gulf Basin, and Paris
Basin, evaporites are found in the basal sediments. The
Appalachian Plateau study area contains Upper Cambrian
to Permian sediments; evaporites are well known in Silu-
rian-age sediments at intermediate depths of the approxi-
mately 5 km of sediments, and anhydrite has been
reported in Middle Ordovician (Ryder et al. 2009) and
Cambrian units (Bacon et al. 2009). The Michigan Basin
also contains evaporites at intermediate depths rather than
in basal sediments.
In the data compiled for this study (Fig. 1b), lithium
concentrations are almost all higher than seawater, with
the exception of the Kettleman North Dome dataset,
where original fluid was probably meteoric water (Kharaka
et al. 1973). All samples contain Li concentrations greater
than expected from closed-system evaporation of seawater.
The 1:1000 line shows that, in most produced water, Li
generally increases with Cl (Fig. 1b). This is similar to the
trends for major cations (see above). Only the Mississippi
0
2000
4000
6000
0 10 20 30 40 50
IL, LCre
PB, Tri
GB, this study
GB-MSB, J-UK
AP, UDev, this study
AP, MDev, this study
WB, Dev
AB, K - Tri
GB, J - Pleis
AP, Sil - Dev
MB, Dev
++
0.001
0.010
0.100
1.000
10.000
100.000
10 100 1000 10 000
Li, m
mol
kg–
1
Cl, mmol kg–1
Dep
th, m
Li, mmol kg–1
Seawater evaporation 1:1000 line KN, Mio IL, LCre GB, this study, Jur-Pleis GB, Jur-Pleis GB-MSB, Jur-UCre PB, Tri AP, UDev, this study AP, MDev, this study AP, LSil, LDev, UDev AP, Sil, E Ohio AB, MDev-UDev WB, Dev MB, Dev
(A)
(B)
Fig. 1. Relation between Li and some fundamen-
tal basin variables in a variety of produced
waters. Symbols are given in Table 1. (A) Li ver-
sus sampling depth. The distributions of large
datasets are enclosed by lines: Alberta Basin
(AB), short-dashed line; Gulf of Mexico Coastal
sedimentary basin (GB), dash-dot line; Appala-
chian Plateau (AP), gray line. Samples used in
this study from the AP and GB are shown, as
are data from an Israeli oil field (IL), the Paris
Basin (PB), the Mississippi Salt Dome Basin of
the GB (GB-MSB), and a single datum from the
Williston Basin (WB). Kettleman North Dome
(Miocene; KN) samples are not plotted, but
have Li less than 0.5 mmol kg�1 at depths
between approximately 2 to 2.6 km. (B) Li ver-
sus Cl concentrations. Modern seawater evapo-
ration trend (McCaffrey et al. 1987) and
1:1000 line with arbitrary starting point are
shown for reference.
© 2014 John Wiley & Sons Ltd, Geofluids, 14, 419–429
Li isotope ratios in saline water 423

Salt Basin of the Gulf Basin (Kharaka et al., 1987) and the
Michigan Basin (Wilson & Long 1993) samples follow
trends similar to seawater evaporation, consistent with ear-
lier interpretations of the major dissolved species in these
fluids. Although the Li:Cl relation follows a 1:1000 line,
Cl concentration is not a good predictor of Li concentra-
tion: Li concentration varies more than two orders of mag-
nitude for a single Cl concentration. This contrasts with
major cations, where the cation concentration generally
varies over much less than one order of magnitude at any
Cl concentration (Hanor 2001). For the entire dataset
used in this study, Cl concentration ranges over about 2.5
orders of magnitude and Li concentration over nearly 4
orders of magnitude. These observations suggest that (i)
evaporation of seawater or dilution of evaporated seawater
cannot account for the anomalously high Li content of
some samples, (ii) there is contribution from diagenesis of
Li-bearing minerals, and (iii) basin-to-basin (or even strata-
to-strata) variations in the Li concentration in the source
minerals must control the Li concentrations in produced
water.
Variations in major elements in saline waters from reser-
voirs of different ages may be attributed to time-varying
seawater chemistry (Lowenstein & Timofeeff 2008). For
example, Cretaceous and Late Silurian Ca-rich brines may
reflect seawater Ca concentrations approximately 3 times
greater than present. Experimental work shows that Li/Ca
in foraminifera and inorganic calcite is controlled by salin-
ity, temperature, and species (Marriott et al. 2004). Fossil
chemistry suggests little variation in Li/Ca in foraminifera
since the end of the Cretaceous (Delaney & Boyle 1988;
Hathorne & James 2006; Lear & Rosenthal 2006), coinci-
dent with little change in major-ion chemistry of seawater
during that time. If the nearly constant Li/Ca can be
extended back in time, even a threefold increase in Ca and
Li during Ca-seawater episodes is insufficient to explain Li
concentrations in produced waters that are 10–100 times
greater than seawater and evaporated seawater. Seawater Li
is controlled by continental weathering, seafloor weather-
ing, and ocean-floor sequestration of Li (Stoffyn-Egli &
Mackenzie 1984; Hathorne & James 2006). Therefore,
differences in the chemistry of seawater deposited with the
sedimentary basin sediments cannot be the sole explanation
for present Li concentrations.
Li isotope ratios
d7Li of produced waters varies inversely with lithium con-
centration, both in this work and in previous studies
(Fig. 2). d7Li ranges between the seawater value (d7Liapproximately 31&; for summary see Tomascak 2004) and
that of continental crust (d7Li approximately 0&; e.g.,
Teng et al. 2004). Analyses of shale sampled from cores,
to minimize the effects of recent weathering, are few,
restricted to samples from Australia (n = 10), Japan
(n = 2) and South Dakota (n = 1). The mean and median
d7Li for these 13 shales (James & Palmer 2000; Sturchio
& Chan 2003; Teng et al. 2004) are similar (�0.2& and
�0.7&, respectively), although the range is fairly wide
(8.4&).
Appalachian Plateau (Middle Devonian reservoir), Gulf
Basin (Cretaceous reservoir), and some Alberta Basin pro-
duced waters (Devonian reservoir) have both extremely
light d7Li and high Li concentration (Fig. 3). The Appala-
chian Plateau samples do not fall on simple mixing lines
between Middle Devonian and Upper Devonian Appala-
chian Plateau water (mixing line not shown) or with sea-
water (Fig. 2), even allowing the largest documented
range of past seawater d7Li (Misra & Froelich 2012). Fur-
ther, there is no discernable distinction between fluids pro-
duced from unconventional shale gas reservoirs and those
from conventional oil and gas reservoirs (Table 2). The
progression toward higher lithium concentration with
lighter d7Li, approaching continental crust and shale val-
ues, instead suggests a temperature-controlled process.
Temperature-controlled isotopic exchange between lith-
ium in solid phases and water is expressed by the fraction-
ation factor, a, which is the ratio of the lithium isotopic
ratio in the solid to that in the water at equilibrium at a
fixed temperature. There have been few determinations of
this factor at different temperatures. Chan et al. (1994)
reported results of three calculations of a over a tempera-
ture range of 2–350°C, using vent fluid and seawater
chemistry in comparison with variously altered basalt. Mil-
lot et al. (2010a) reported results of four laboratory exper-
iments over a temperature range of 25–250°C, reacting
seawater with basalt. At all temperatures, the fractionation
0
10
20
30
40
0.01 0.10 1.00 10.00 100.00
7 Li,
‰
Li, mmol kg–1
+++++++++++++++
Fig. 2. Relation between d7Li and Li concentration for this study and pub-
lished studies. Symbols same as in Figure 1 and Table 1. Two mixing lines
(Li in seawater evaporated to the Br level in the Middle Devonian samples
mixed with an extreme Middle Devonian sample, long-dashed line; modern
seawater mixed with the Gulf Basin sample with the lightest d7Li, dot-dash
line) show that mixing does not adequately explain the distribution of data.
Although estimates of Paleozoic seawater have not been published, Ceno-
zoic seawater may have had d7Li as low as 22& (Misra & Froelich 2012);
mixing with Cenozoic seawater also would not explain the data distribu-
tion.
© 2014 John Wiley & Sons Ltd, Geofluids, 14, 419–429
424 G. L. MACPHERSON et al.

factor is less than one, showing that liquid in equilibrium
with a solid will be heavier than the corresponding solid.
Equations fit to these datasets (this work and Scholz et al.
2010) give similar but not identical trends of a depen-
dence on temperature, in that the Millot data trend pre-
dicts a slightly lower a at any temperature than the Chan
data trend. Although originally designed to investigate sea-
water–basalt interactions, the data cover a temperature
range convenient for testing equilibration of sedimentary
basin fluids with shale. Experimental work determining
fractionation factors between fluids and sediments or min-
erals (Chan et al. 1994; Williams & Hervig 2005; Vigier
et al. 2008) are significantly different from the seawater–
basalt data and reveal very different fractionation factors
among the different experiments. This is probably the
result of different initial mineralogy of the sediments as
well as secondary mineral formation. For this study, we
elected to use the more consistent fractionation factor
experiments from water–basalt reactions, recognizing that
these will only approximate the lithium fractionation when
highly saline fluids react with shale or mudrock.
Due to the difficulty in determining a reasonably accu-
rate in situ temperature (MIT 2006) as well as proprietary
issues, there are few data for temperature (and/or depth).
For the Appalachian Plateau samples reported in this study,
temperatures were estimated using estimated depth to
production interval, mean annual air temperature and
geothermal gradient. The geothermal gradient in the area
ranges from 20°C km�1 (Renner & Vaught 1979) to
26.5°C km�1 (Rowan 2006; Yeager & Meyer 2010). For
most of the Appalachian Plateau samples, exact locations
are not known, so countywide estimates of these parame-
ters were used to estimate in situ temperature.
Data plot along a coherent mass fractionation trend that
is subparallel to the trend calculated for d7Li (water) in
equilibrium with a solid having d7Li of �0.7&, the median
for shale (discussed above; Fig. 3). Most compiled data
with reported temperatures also plot along the same trend,
which is close to the equilibrium line for a solid with d7Liof around �5&. This is outside the range of reported d7Lifor shale from core, and the small difference between the
water–rock fractionation trends using the Chan et al.
(1994) and Millot et al. (2010a) experimentally derived
fractionation factors (Fig. 3) does not explain the offset in
published data and our data from the equilibrium fraction-
ation line. Possible explanations for this are discussed next.
Nonequilibrium isotope fractionation
During the approach to the equilibrium state such as that
which occurs in modern weathering (Millot et al. 2010b;
Tipper et al. 2012) or in seawater–seafloor reactions (Simon
et al. 2006), a fluid is not expected to be at steady state with
respect to d7Li. Instead, its d7Li reflects an end member rock
or sediment composition and fractionation associated with
formation of secondary minerals, usually taken as removal of
Li from water accompanied by an increase in d7Li in the
water. With increased weathering progress, the d7Li of theliquid approaches equilibrium with the rock or sediment
with which it is reacting. In contrast, the produced waters in
sedimentary basins have been in contact with host rocks for
many tens to hundreds of millions of years. This suggests
that equilibrium between host rock and produced water is
likely in most sedimentary basins, and attributing the offset
in the trend of d7Li with temperature from the trend
expected for average shale is not reasonable.
Equilibrium with shale of lighter d7LiIt is remarkable that samples from this study and most
samples from the Paris Basin (where temperatures are also
estimated) all fall along the equilibrium line for a �5&material, suggesting the possibility that shale in sedimen-
tary basins is lighter than most shale measured to date.
Fluid migration after irreversible fluid–rock reactions
Previous work has shown that fluids and solutes in sedi-
mentary basins can migrate, sometimes for distances of
hundreds of kilometers (Ziegler & Longstaffe 2000;
Kharaka & Hanor 2003; Eccles & Berhane 2011). If fluids
come into d7Li-shale equilibrium at depth (and higher
temperature) and migrate upward without back reaction,
then the d7Li could be indicative of the maximum burial
of the fluid. The Appalachian Basin has undergone tecto-
nism, resulting in extensive faulting and folding in the
Valley and Ridge Province and less extensive deformation
0
5
10
15
20
25
0 100 200 300
7 Li,
‰
Temperature, °C
Solid phase: –0.7‰
Solid phase: –5‰
Fig. 3. Relation between reservoir temperature and d7Li. Symbols in
Table 1. Black solid line is calculated d7Li of water in equilibrium with aver-
age shale (�0.7&) using fractionation factors summarized in Chan et al.
(1994). Black dashed line is expected d7Li of water in equilibrium with aver-
age shale (-0.7&) using Millot et al. (2010a). Gray solid line is calculated
d7Li of water in equilibrium with shale with d7Li of �5&. Error bars for d7Li
are shown, or are smaller than symbol size; errors on in situ temperatures
are not known. Positive error bar on temperature of Appalachian Plateau
samples gives range of possible temperatures based on geothermal gradient
ranging from 20 to 26.5°C km�1, and for Washington and Westmoreland
County samples, the depth estimate of the Marcellus Formation as well as
the geothermal gradient range.
© 2014 John Wiley & Sons Ltd, Geofluids, 14, 419–429
Li isotope ratios in saline water 425
in the Appalachian Plateau Province, with the potential for
fluid movement as a result (Evans 1995; Evans et al. 2012;
Osborn et al. 2012). Rowan (2006), using vitrinite reflec-
tance, suggests that approximately 1800–3000 m (6000–
10 000 ft) of sediment has been eroded from southwestern
Pennsylvania. Before erosion, under a geothermal gradient
of 25°C km�1, the Devonian basin fill was subjected to
higher temperatures (from 45 to 75°C higher than present
in situ temperatures). In Greene County, near the western
Pennsylvania side of the Rowan (2006) cross section, cur-
rent in situ temperatures in the Middle Devonian wells are
approximately 60°C. A temperature of approximately
140°C would be required to explain the fluid-d7Li if the
shale-d7Li is approximately 0&; this is a temperature dif-
ferential of +80°C. The erosion hypothesis predicts a for-
mer temperature up to only approximately 115°C, and so
does not support, by itself, equilibrium with the median
shale d7Li-shale. In addition, Evans et al. (2012 and refer-
ences therein) suggest maximum burial temperatures of
only 80–118°C, based on fluid inclusions in late quartz
cement.
If the Gulf Basin and Paris Basin fluids, both in tectoni-
cally simpler basins than the Appalachian Plateau, indicate
fluid migration during compaction of the sediments, then
migration paths must be long: the temperature differentials
(again assuming a shale with d7Li of �0.7&) for Paris
Basin fluids are about 100°C, and the temperature differ-
entials for the Gulf Basin fluids range from about 30–
100°C, the latter requiring an upward fluid migration dis-
tance of up to approximately 4 km. Macpherson (1989),
based on mass balance constraints, proposed that Li in
Gulf Basin fluids represents the outcome of ongoing
greenschist facies metamorphism in the Gulf Basin and
upward fluid transport of Li removed from metamor-
phosed sediment.
Fractionation in sedimentary basins differing from that in
recent marine sediments
The fractionation factor–temperature trend used in this
study is based on experimental work reacting seawater and
basalt. Whether burial of mud in sedimentary basins and
the accompanying diagenetic processes fractionate lithium
isotopes differently is as yet fully unexplored. Day-Stirrat
et al. (2010) have shown that Upper Paleocene and Lower
Eocene mudstone in the Gulf Basin acts as an open system
with respect to potassium, so that potassium is imported
into the shale and is incorporated into illite transformed
from smectite. Whether this process is countered by an
export of monovalent ions and/or by fractionation of lith-
ium isotopes has not been investigated. Williams & Hervig
(2005) ran laboratory experiments at 300°C and 100 MPa
showing that larger sized clay minerals (>2 lm) may frac-
tionate Li isotopes 6& more (lighter) than smaller clay
minerals (<2 lm) during the illitization of smectite, when
exchangeable Li is excluded and when the solution con-
tains only Li and no other cations. The direct applicability
of this result to sedimentary basin diagenesis has not been
tested, but it is well established that the small size fraction
of Gulf Basin mudstones (<2 lm) is typically more than
50% clay minerals, while the larger fraction (>2 lm) is
<10% clay minerals (Hower et al. 1976).
Based on the above discussion, the d7Li–temperature
relations in the Appalachian Plateau and Gulf Basin pro-
duced waters reported here could result from fluid migra-
tion, equilibrium with a shale of lighter-than-average shale
d7Li, or a combination of these, or from isotopic fraction-
ation during the smectite-illite transition, a diagenetic reac-
tion common in sedimentary basins.
CONCLUSIONS
Values of d7Li for water produced from oil and gas wells
from the Appalachian Plateau Middle and Upper Devonian
reservoirs and Gulf Coast Sedimentary Basin (Gulf Basin)
Plio-Pleistocene to Jurassic reservoirs range from a high of
about +16.6&, which is lighter than seawater at +31&, to
a low of about +4.2&, the latter extending the published
range of d7Li in produced water.
Li concentration increases with depth more rapidly and
attains a higher concentration at shallower depth in Appa-
lachian Plateau produced water than in other sedimentary
basins. The highest Li concentration in the dataset consid-
ered is from the Gulf Basin. In all sedimentary basins con-
sidered, Li concentrations are higher than those expected
from seawater, diluted seawater or evaporated seawater.
The latter observation supports the idea that water–mineral
reactions add Li to produced water.
Concentrations of Li and Cl (the dominant anion in
produced waters) are generally positively related, but there
are wide variations in Li/Cl. Some restricted datasets, such
as Gulf Basin–Mississippi Salt Basin and Kettleman North
Dome, follow tighter Li-Cl trends, the former following a
trend parallel to but elevated in Li above seawater evapora-
tion, and the latter following a dilution trend for Li ele-
vated above seawater concentration with Cl diluted from
seawater concentration.
The d7Li of Appalachian Plateau and Gulf Basin pro-
duced waters, as well as previously published data from
produced waters in the Paris Basin, fall on a trend parallel
to the trend predicted for fractionation of lithium isotopes
in equilibrium with the median d7Li of shale. If this trend
indicates fluid migration from depth (or higher tempera-
ture), then migration paths are long. The trend can be
explained by migration in combination with reaction with
sedimentary basin rocks with a more negative d7Li than
the average shale. Because the equilibrium fractionation
factors used in these calculations were determined experi-
mentally on seawater reactions with basalt, additional work
© 2014 John Wiley & Sons Ltd, Geofluids, 14, 419–429
426 G. L. MACPHERSON et al.

is needed to resolve whether the offset from the marine–
sediment equilibrium trend is the result of a different type
of fractionation during diagenesis in sedimentary basins, or
the result of equilibration with lighter d7Li shale with or
without fluid migration. Finally, even though the Appala-
chian Plateau Middle Devonian shale producing gas is
unusually organic rich and gas production method is
unconventional, the fluids produced from this unit are sim-
ilar to other produced waters and suggest a continuum of
water–rock processes across conventional (sandstone, lime-
stone) and unconventional (tight shale) reservoirs.
ACKNOWLEDGEMENTS
This work was supported by the National Energy Technol-
ogy Laboratory’s ongoing research under the RES contract
DE-FE0004000. We also thank the Geology Foundation
of the University of Kansas, and the University of Kansas
Department of Geology. This work could not have been
completed without laboratory and field support from per-
sonnel from DOE-NETL, USGS, and University of Pitts-
burgh. The authors thank the reviewers, J.S. Hanor and P.
Tomascak, for their detailed and insightful comments that
greatly improved this manuscript. The authors declare no
conflict of interest.
REFERENCES
Bacon DH, Sass BM, Bhargava M, Sminchak J, Gupta N (2009)
Reactive transport modeling of CO2 and SO2 injection intodeep saline formations and their effect on the hydraulic
properties of host rocks. Energy Procedia, 1, 3283–90.Bottomley DJ, Katz A, Chan LH, Starinsky A, Douglas M, Clark
ID, Raven KG (2003) The origin and evolution of CanadianShield brines: evaporation of freezing of seawater? New lithium
isotope and geochemical evidence from the Slave craton.
Chemical Geology, 155, 295–320.Breen KJ, Angelo CG, Masters RW, Sedam AC (1985) Chemical
and isotopic characteristics of brines from three oil- and gas-
producing sandstones on eastern Ohio, with applications to the
geochemical tracing of brine sources. U.S. Geological SurveyWater-Resources Investigations Report 84-4314, p. 58.
Carignan J, Vigier N, Millot R (2007) Three secondary reference
materials for lithium isotope measurements: Li7-N, Li6-N, and
LiCl-N solutions. Geostandards and Geoanalytical Research, 31,7–12.
Carothers WW, Cocker JD, Law LeRoy M, Kharaka YK (1978)
Application of stable isotopes to the origin and evolution of oil-field waters in Pleistocene reservoir rocks, offshore, Texas. U.S.
Geological Survey Professional Paper 2310, pp. 117–27.Chan LH, Edmond JM, Thompson G, Gillis K (1992) Lithium
isotope composition of submarine basalts: implications for thelithium cycle in the oceans. Earth & Planetary Science Letters,108, 151–60.
Chan LH, Gieskes JM, You C-F, Edmond JM (1994) Lithium
isotope geochemistry of sediments and hydrothermal fluids ofthe Guaymas Basin, Gulf of California. Geochimica etCosmochimica Acta, 58, 4443–54.
Chan L-H, Starinsky A, Katz A (2002) The behavior of lithium
and its isotopes in oilfield brines: evidence from the Heletz-
Kokhav field, Israel. Geochimica et Cosmochimica Acta, 66, 615–23.
Chapman EC, Capo RC, Stewart BW, Kirby CS, Hammack RC,
Schroeder KT, Edenborn HM (2012) Geochemical and
strontium isotope characterization of produced waters fromMarcellus Shale natural gas extraction. Environmental Science &Technology, 46, 3545–53.
Day-Stirrat RJ, Milliken KL, Dutton SP, Loucks RG, Hillier S,
Schleicher AM (2010) Open-system behavior in deep WilcoxGroup mudstones, Texas Gulf Coast, USA. Marine andPetroleum Geology, 27, 1804–18.
Delaney ML, Boyle EA (1988) Tertiary paleoceanic chemical
variability: unintended consequences of simple geochemicalmodels. Paleoceanography, 3, 137–56.
Dresel PE, Rose AW (2010) Chemistry and origin of oil and gas
well brines in western Pennsylvania. PA Bureau of Topographicand Geologic Survey, Open-File Report OFOG 10-01.0, p. 48.
Eberl D, Hower J (1976) Kinetics of illite formation. GeologicalSociety of America Bulletin, 87, 1326–30.
Eccles DR, Berhane H (2011) Geological introduction to lithium-rich formation water with emphasis on the Fox Creek area of
west-central Alberta (NTS 83F and 83K). Energy Resources
Conservation Board, ERCB/AGS Open File Report 2011-10,
p. 22.Eccles DR, Jean GM (2010) Lithium groundwater and formation-
water geochemical data (tabular data, tab delimited format),
Alberta Geological Survey, DIG 2010-0001.Evans MA (1995) Fluid inclusions in veins from the Middle
Devonian shales: a record of deformation conditions and fluid
evolution in the Appalachian Plateau. Geological Society ofAmerica Bulletin, 107, 327–39.
Evans MA, Leo J, Burruss RC (2012) Spatial and temporal
variation of fluids in the Devonian Marcellus Shale during
deformation of the central Appalachian fold-and-thrust belt.
Proceedings, GEOFLUIDS VII, International Conference, June6–8, 2012, p. 4.
Hanor JS (1994) Origin of saline fluids in sedimentary basins. In:
Geofluids: Origin Migration and Evolution of Fluids inSedimentary Basins (ed Parnell J) Vol. 78, pp. 151–74.Geological Society Special Publication, London.
Hanor JS (1996) Variations in chloride as a driving force in
siliciclastic diagenesis. SEPM Special Publication No. 55, pp. 3–12.
Hanor JS (2001) Reactive transport involving rock-buffered fluids
of varying salinity. Geochimica et Cosmochimica Acta, 65, 3721–32.
Hanor JS, McIntosh JC (2007) Diverse origins and timing of
formation of basinal brines in the Gulf of Mexico sedimentary
basin. Geofluids, 7, 227–37.Hathorne EC, James RH (2006) Temporal record of lithium inseawater: a tracer for silicate weathering? Earth and PlanetaryScience Letters, 246, 393–406.
Hower J, Eslinger EV, Hower ME, Perry EA (1976) Mechanismof burial metamorphism of argillaceous sediment: 1.
Mineralogical and chemical evidence. Geological Society ofAmerica Bulletin, 87, 725–37.
James RH, Palmer MR (2000) The lithium isotope compositionof international rock standards. Chemical Geology, 166, 319–26.
Karbo DM, Wilhelm RG, Campbell DJ (2010) Natural gas plays
in the Marcellus Shale: challenges and potential opportunities.
Environmental Science & Technology, 44, 5679–84.
© 2014 John Wiley & Sons Ltd, Geofluids, 14, 419–429
Li isotope ratios in saline water 427

Kharaka YK, Berry FAF (1974) The influence of geological
membranes on the geochemistry of subsurface waters from
Miocene sediments at Kettleman North Dome in California.Water Resources Research, 10, 313–27.
Kharaka YK, Hanor JS (2003) Deep fluids in the continents: I.
Sedimentary basins. In: Surface and Ground Water, Weatheringand Soils, Treatise on Geochemistry, vol 5 (ed Drever JI.), pp. 1–48. Elsevier. http://www.amazon.com/Treatise-Geochemistry-
Ten-Volume-Set/dp/0080437516.
Kharaka YK, Berry FAF, Friedman I (1973) Isotopic composition
of oil-field brines from Kettleman North Dome, California, andtheir geologic implications. Geochimica et Cosmochimica Acta,37, 1899–908.
Kharaka YK, Callender E, Wallace RH Jr (1977) Geochemistry of
geopressured geothermal waters from the Frio Clay in the GulfCoast region of Texas. Geology, 5, 241–4.
Kharaka YKK, Maest AS, Carothers WW, Law LM, Lamothe PJ,
Fries TL (1987) Geochemistry of metal-rich brines from centralMississippi Salt Dome basin, USA. Applied Geochemistry, 2,543–61.
Land LS (1995) Na-Ca-Cl saline formation waters, Frio
Formation (Oligocene), South Texas, USA - Products ofdiagenesis. Geochimica et Cosmochimica Acta, 59, 2163–74.
Land LS, Macpherson GL (1989) Geochemistry of formation
waters, Plio-Pleistocene reservoirs, offshore Louisiana. GulfCoast Association of Geological Societies Transactions, 39, 421–30.
Land LS, Macpherson GL (1992) Origin of saline formation
waters, Cenozoic section, Gulf of Mexico sedimentary basin.AAPG Bulletin, 6, 1344–62.
Land LS, Prezbindowski DR (1981) The origin and evolution of
saline formation water, Lower Cretaceous carbonates, south-
central Texas. Journal of Hydrology, 54, 51–74.Land LS, Macpherson GL, Mack LE (1988) The geochemistry of
formation waters, Lower Miocene, off-shore Louisiana. GulfCoast Association of Geological Societies Transactions, 38, 503–11.
Lear CH, Rosenthal Y (2006) Benthic foraminiferal Li/Ca:insights into Cenozoic seawater carbonate saturation state.
Geology, 34, 985–8.Lowenstein TK, Timofeeff MN (2008) Secular variations inseawater chemistry as a control on the chemistry of basinal
brines: a test of the hypothesis. Geofluids, 8, 1–16.Macpherson GL (1989) Sources of lithium and barium in Gulf of
Mexico Basin formation waters. Sixth International Water-RockInteraction Conference Proceedings, pp. 453–6.
Macpherson GL (1992) Regional variations in formation-water
chemistry, Gulf of Mexico Sedimentary Basin–Major and minor
elements, Frio Formation fluids, Texas. American Association ofPetroleum Geologists Bulletin, 76, 740–57.
Magenheim AJ, Spivack AJ, Alt JC, Bayhurst G, Chan L-H,
Zuleger E, Gieskes JM (1995) 13. Borehold fluid chemistry in
Hole 504B, Leg 137: formation water or in-situ reaction?Proceedings of the Ocean Drilling Program, Scientific Results,137/140, 141–52.
Marriott CS, Henderson GM, Crompton R, Staubwasser M, ShawS (2004) Effect of mineralogy, salinity, and temperature on Li/
Ca and Li isotope composition of calcium carbonate. ChemicalGeology, 212, 5–15.
McCaffrey MA, Lazar B, Holland HD (1987) Evaporation path ofseawater and the coprecipitation of Br- and K+ with halite.
Journal of Sedimentary Petrology, 57, 928–37.Millot R, Scaillet B, Sanjuan B (2010a) Lithium isotopes in island
arc geothermal systems: guadeloupe, Martinique (French West
Indies) and experimental approach. Geochimica et CosmochimicaActa, 74, 1852–71.
Millot R, Vigier N, Gaillardet J (2010b) Behaviour of lithium andits isotopes during weathering in the Mackenzie Basin, Canada.
Geochimica et Cosmochimica Acta, 74, 3897–912.Millot R, Guerrot C, Innocent C, Negrel Ph, Sanjuan B (2011)
Chemical, multi-isotopic (Li–B–Sr–U–H–O) and thermalcharacterization of Triassic formation waters from the Paris
Basin. Chemical Geology, 283, 226–41.Misra S, Froelich PN (2012) Lithium isotope history of Cenozoic
seawater: changes in silicate weathering and reverse weathering.Science, 335, 818–23.
MIT (2006) Chapter 2, Geothermal resource base assessment, in
The Future of Geothermal Energy, Impact of Enhanced
Geothermal Systems (EGS) on the United States in the 21stCentury, Idaho National Laboratory, http://www1.eere.energy.
gov/geothermal/egs_technology.html, pp. 2-1–2-48.Morton RA, Land LS (1987) Regional variations in formationwater chemistry, Frio Formation (Oligocene), Texas Gulf Coast.
AAPG Bulletin, 71, 191–206.Oliver J (1986) Fluids expelled tectonically from orogenic belts:
their role in hydrocarbon migration and other geologicphenomena. Geology, 14, 99–102.
Osborn SG, McIntosh JC, Hanor JS, Biddulph D (2012) Iodine-
129, 87Sr/86Sr, and trace elemental geochemistry of Northern
Appalachian basin brines: evidence for basin-scale fluidmigration and clay mineral diagenesis. American Journal ofScience, 312, 263–87.
Qi HP, Taylor PDP, Berglund M, De Bi�evre P (1997) Calibratedmeasurements of the isotopic composition and atomic weight of
the natural Li isotope reference material IRMM-016.
International Journal of Mass Spectrometry and Ion Processes,171, 263–8.
Qiu L, Rudnick RL, Ague JJ, McDonough WF (2011a) A lithium
isotopic study of sub-greenschist to greenschist facies
metamorphism in an accretionary prism, New Zealand. Earthand Planetary Science Letters, 301, 213–21.
Qiu L, Rudnick RL, McDonough WF, Bea F (2011b) The
behavior of lithium in amphibolite- to granulite-facies rocks of
the Ivrea–Verbano Zone, NW Italy. Chemical Geology, 289, 76–85.
Renner JL, Vaught TL (1979) Preliminary definition of the
geothermal resources potential of Pennsylvania. U.S. Dept. of
Energy, NVO-1558-6, p. 16.Romer RL, Meixner A, Hahne K (2013) Lithium and boron
isotopic composition of sedimentary rocks – the role of source
history and depositional environment: a 250 Ma record from
the Cadomian orogeny to the Variscan orogeny. GondwanaResearch, doi: 10.1016.j.gr.2013.08.015.
Rowan EL (2006) Burial and thermal history of the central
Appalachian Basin, based on three 2-D models of Ohio,
Pennsylvania, and West Virgina. U.S. Geological Survey Open-File Report 2006-1019, p. 35.
Ryder RT, Crangle RD, Trippi MH, Swezey CS, Lentz EE,
Rowan EL, Hope RS (2009). Geologic cross section D-D’through the Appalachian Basin from the Findlay Arch, Sandusky
County, Ohio, to the Valley and Ridge Province, Hardy
County, West Virginia. U.S. Geologic Survey Scientific
Investigations Map 3067, p. 52.Scheirer AH, Magoon LB (2007) Distribution, and Stratigraphic
Relationship of Rock Units in the San Joaquin Basin Province,
California. U.S. Geological Survey Professional Paper 1713,
Chapter 5; doi:10.3133/pp1713.ch05.
© 2014 John Wiley & Sons Ltd, Geofluids, 14, 419–429
428 G. L. MACPHERSON et al.

Scholz F, Hensen C, De Lange GJ, Haeckel M, Liebetrau V,
Meixner A, Reitz A, Romer RL (2010) Lithium isotope
geochemistry of marine pore waters—Insights from cold seepfluids. Geochimica et Cosmochimica Acta, 74, 3459–75.
Sharp JM Jr, Galloway WE, Land LS, McBride EF, Blanchard PE,
Bodner DP, Dutton SP, Farr MR, Gold PB, Jackson TJ,
Lundegard PD, Macpherson GL, Milliken KL (1988) DiageneticProcesses in Northwestern Gulf of Mexico Sediments. In:
Diagenesis II: Developments in Sedimentology 43 (eds Chilingarian
GV, Wolf KA). pp. 43–113. Elsevier, New York.
Simon L, L�ecuyer C, Mar�echal C, Coltice N (2006) Geochemicalcycle of boron: implications for the long-term d11B evolution
of seawater and ocean crust. Chemical Geology (IsotopeGeoscience), 225, 61–76.
Stoffyn-Egli P, Mackenzie FT (1984) Mass balance of dissolvedlithium in the ocean. Geochimica et Cosmochimica Acta, 48,859–72.
Sturchio N, Chan L-H (2003) Chapter 10, Lithium IsotopeGeochemistry of the Yellowstone Hydrothermal System. In:
Volcanic, Geothermal, and Ore-Forming Fluids: Rulers andWitnesses of Processes within the Earth (eds Simmons SF, Graham
I) Society of Economic Geology Special Publication, no. 10, pp.171–80. ISBN 1-887483-90-X.
Teng FZ, McDonough WF, Rudnick RL, Dalp�e C, Tomascak PB,
Chappell BW, Gao S (2004) Lithium isotopic composition and
concentration of the upper continental crust. Geochimica etCosmochimica Acta, 68, 4167–78.
Tipper ET, Calmels D, Gaillardet J, Louvat P, Capmas F, Dubacq
B (2012) Positive correlation between Li and Mg isotope ratiosin the river waters of the Mackenzie Basin challenges the
interpretation of apparent isotope fractionation during
weathering. Earth and Planetary Science Letters 333–334, 35–45.
Tomascak PB (2004) Developments in the understanding andapplication of lithium isotopes in the earth and planetary
sciences. Reviews in Mineralogy & Geochemistry, 55, 153–95.Vigier N, Decarreau A, Millot R, Carignan J, Petit S, France-
Lanord C (2008) Quantifying Li isotope fractionation duringsmectite formation and implications for the Li cycle. Geochimicaet Cosmochimica Acta, 72, 780–92.
Williams LB, Hervig RL (2005) Lithium and boron isotopes in
smectite: the importance of crystal size. Geochimica etCosmochimica Acta, 69, 5705–16.
Wilson TP, Long DT (1993) Geochemistry and isotope chemistry
of Michigan Basin brines: devonian formations. AppliedGeochemistry, 8, 81–100.
Yeager BB, Meyer BR (2010) Injection/fall-off testing in the
Marcellus Shale: Using reservoir knowledge to improve
operational efficiency. Society of Petroleum Engineers, SPE139067, p. 19.
Zagorski WA, Bowman DC, Emery M, Wrightstone GR (2011)
Factors controlling well productivity in core areas of the
Marcellus Shale play. AAPG Search and Discovery Article#110147.
Zhang L, Chan LH, Gieskes JM (1998) Lithium isotope
geochemistry of pore waters from Ocean Drilling Program Sites
918/919, Irminger Basin. Geochimica et Cosmochimica Acta,62, 2437–50.
Ziegler K, Longstaffe FJ (2000) Multiple episodes of clay
alteration at the Precambrian/Paleozoic unconformity,Appalachian Basin: isotopic evidence for long-distance and local
fluid migrations. Clay and Clay Minerals, 48, 474–93.
© 2014 John Wiley & Sons Ltd, Geofluids, 14, 419–429
Li isotope ratios in saline water 429