Additive Manufacturing of AlSi10Mg and Ti6Al4V Lightweight ...
Upload
independentCategory
view
7download
0
DOI: 10.1002/ente.201402079
Synthesis of a Renewable Oxygenated Diesel Additive inan Adsorptive ReactorNuno S. GraÅa,* Aida E. Delgado, D�nia S. M. Constantino, Carla S. M Pereira, andAl�rio E. Rodrigues[a]
Introduction
One of the main global environmental concerns nowadays isglobal warming attributed to the increase of the atmosphericconcentration of CO2. Among the anthropogenic CO2 emis-sions, 82 % are caused by fossil-fuel combustion.[1] Therefore,the search for alternative fuels has become one of the greattrends in energy-sources research. Moreover, several studiespredict the shortage of fossil fuel reserves in the next 20 to30 years. In addition, the International Energy Agency(IEA) predicts an increase in the demand for fossil fuel incoming years; however, it also predicts the increase of theuse of renewable sources of energy.[2] As a result of theseeconomic and environmental concerns, research on alterna-tive fuels for automotive engines is increasing.
Biofuels, such as bioalcohols and biodiesel, are a renewablealternative to conventional fossil fuels. The most common bi-oalcohol today is ethanol, which can be used in car enginespure or blended with conventional fuel; its high octanenumber and high heat of vaporization make ethanol a suita-ble biofuel for transportation.[3] Another renewable biofuel isthe biodiesel constituted by methyl or ethyl esters of long-chain fatty acids produced by a transesterification reactionbetween methanol or ethanol with vegetable oils. Its renewa-ble origin makes biodiesel an attractive alternative to con-ventional diesel. However, its use presents some drawbackssuch as high NOx and particle emissions.[4] Furthermore, bio-diesel is inferior in terms of oxidation stability, energy con-tent, and cold-weather operability relative to conventionaldiesels.[5] One possibility to overcome these drawbacks is theuse of a suitable additive. However, the additives used inconventional diesel are less effective in biodiesel.[5]
The use of the acetal 1,1-diethoxyethane (DEE) as diesel-fuel additive shows a marked reduction of exhaust smoke.However, the blends present a flash point below the Europe-
an regulation limit (55 8C).[6] Therefore, the use of acetalswith a higher molecular weight could be a solution.
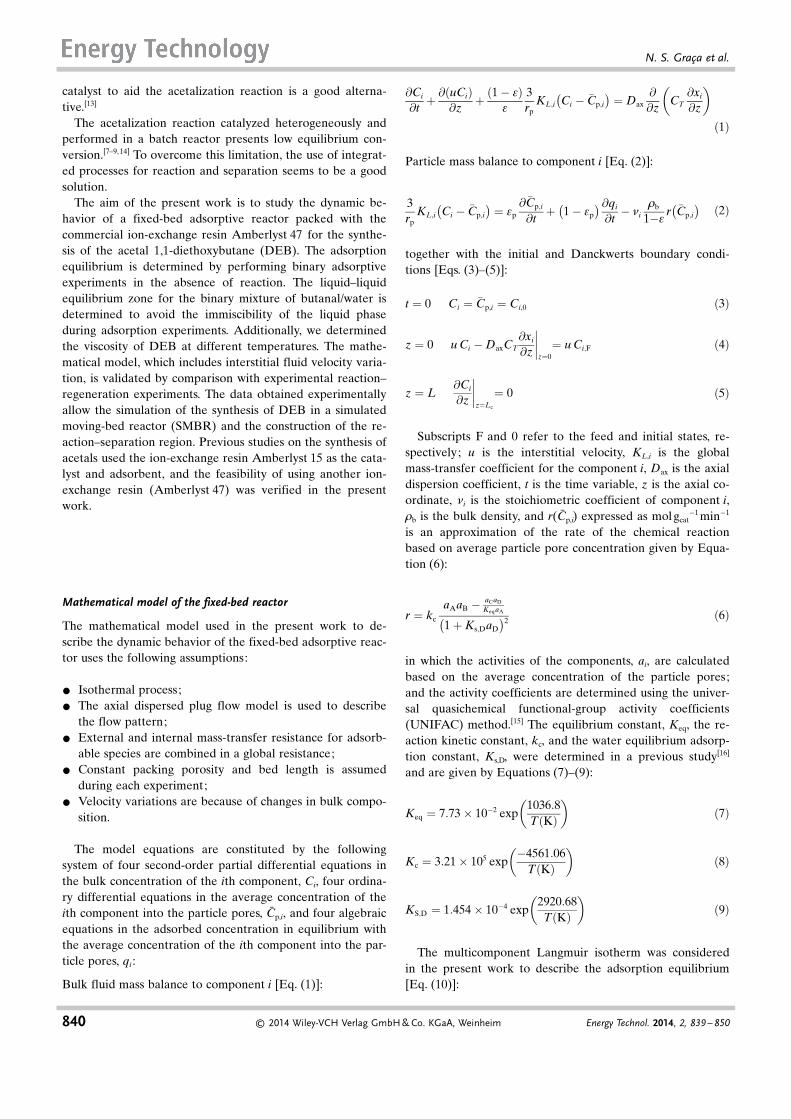
Acetals can be produced by the acid-catalyzed reaction be-tween two molecules of a monohydric alcohol and one mole-cule of an aldehyde (Figure 1). This reaction has been report-ed previously for the synthesis of different acetals such as
1,1-dimethoxyethane (R1 = CH3 and R2 = CH3),[7] 1,1-dieth-oxyethane (R1 =CH3 and R2 = C2H5),[8] and 1,1-dibutoxy-ethane (R1 =CH3 and R2 =C4H9).[9]
The acetalization reaction can be performed under homo-genous catalysis using a strong acid such as H2SO4, HF, orHCl.[10] However, some drawbacks such as separation prob-lems caused by the miscibility with the reaction medium andequipment corrosion at high catalyst concentration are asso-ciated with its use.[11,12] Therefore, the use of a heterogeneous
The synthesis of the acetal 1,1-diethoxybutane (DEB) wasstudied by the first time in a fixed-bed adsorptive reactorpacked with the commercial ion-exchange resin Amber-lyst 47. The adsorption equilibrium was investigated at 30 8Cby frontal chromatography with nonreactive binary pairs.The experimental determination of DEB viscosity, the hydro-dynamic study of the fixed-bed column, and the study of thebutanal/water liquid–liquid equilibrium were performed.
DEB production and column regeneration were performedin the fixed-bed adsorptive reactor. Simulation resultsshowed the feasibility of the synthesis of DEB in a simulatedmoving-bed adsorptive reactor to obtain a conversion andpurities in both extract and raffinate above 97 % with a pro-ductivity of 10.04 kg L
�1 d�1 and a desorbent consumption of4.42 L kg�1.
Figure 1. Overall acetalization reaction.
[a] Dr. N. S. GraÅa, A. E. Delgado, D. S. M. Constantino, Dr. C. S. M. Pereira,Prof. A. E. RodriguesLaboratory of Separation and Reaction Engineering (LSRE)Associate Laboratory LSRE/LSMDepartment of Chemical Engineering, Faculty of EngineeringUniversity of Porto, Porto (Portugal)Fax: (+ 351) 225081674E-mail: [email protected]
Energy Technol. 2014, 2, 839 – 850 � 2014 Wiley-VCH Verlag GmbH & Co. KGaA, Weinheim 839
catalyst to aid the acetalization reaction is a good alterna-tive.[13]
The acetalization reaction catalyzed heterogeneously andperformed in a batch reactor presents low equilibrium con-version.[7–9, 14] To overcome this limitation, the use of integrat-ed processes for reaction and separation seems to be a goodsolution.
The aim of the present work is to study the dynamic be-havior of a fixed-bed adsorptive reactor packed with thecommercial ion-exchange resin Amberlyst 47 for the synthe-sis of the acetal 1,1-diethoxybutane (DEB). The adsorptionequilibrium is determined by performing binary adsorptiveexperiments in the absence of reaction. The liquid–liquidequilibrium zone for the binary mixture of butanal/water isdetermined to avoid the immiscibility of the liquid phaseduring adsorption experiments. Additionally, we determinedthe viscosity of DEB at different temperatures. The mathe-matical model, which includes interstitial fluid velocity varia-tion, is validated by comparison with experimental reaction–regeneration experiments. The data obtained experimentallyallow the simulation of the synthesis of DEB in a simulatedmoving-bed reactor (SMBR) and the construction of the re-action–separation region. Previous studies on the synthesis ofacetals used the ion-exchange resin Amberlyst 15 as the cata-lyst and adsorbent, and the feasibility of using another ion-exchange resin (Amberlyst 47) was verified in the presentwork.
Mathematical model of the fixed-bed reactor
The mathematical model used in the present work to de-scribe the dynamic behavior of the fixed-bed adsorptive reac-tor uses the following assumptions:
* Isothermal process;* The axial dispersed plug flow model is used to describe
the flow pattern;* External and internal mass-transfer resistance for adsorb-
able species are combined in a global resistance;* Constant packing porosity and bed length is assumed
during each experiment;* Velocity variations are because of changes in bulk compo-
sition.
The model equations are constituted by the followingsystem of four second-order partial differential equations inthe bulk concentration of the ith component, Ci, four ordina-ry differential equations in the average concentration of theith component into the particle pores, C̄p,i, and four algebraicequations in the adsorbed concentration in equilibrium withthe average concentration of the ith component into the par-ticle pores, qi :
Bulk fluid mass balance to component i [Eq. (1)]:
@Ci
@tþ @ uCið Þ
@zþ 1� eð Þ
e
3rp
KL;i Ci � �Cp;i
� �¼ Dax
@
@zCT
@xi
@z
� �
ð1Þ
Particle mass balance to component i [Eq. (2)]:
3rp
KL;i Ci � �Cp;i
� �¼ ep
@ �Cp;i
@tþ 1� ep
� � @qi
@t� ni
1b
1�er �Cp;i
� �ð2Þ
together with the initial and Danckwerts boundary condi-tions [Eqs. (3)–(5)]:
t ¼ 0 Ci ¼ �Cp,i ¼ Ci,0 ð3Þ
z ¼ 0 u Ci �DaxCT@xi
@z
����z¼0¼ u Ci;F ð4Þ
z ¼ L@Ci
@z
����z¼Lc
¼ 0 ð5Þ
Subscripts F and 0 refer to the feed and initial states, re-spectively; u is the interstitial velocity, KL,i is the globalmass-transfer coefficient for the component i, Dax is the axialdispersion coefficient, t is the time variable, z is the axial co-ordinate, ni is the stoichiometric coefficient of component i,1b is the bulk density, and r(C̄p,i) expressed as mol gcat
�1 min�1
is an approximation of the rate of the chemical reactionbased on average particle pore concentration given by Equa-tion (6):
r ¼ kc
aAaB � aCaD
KeqaA
1þKs;DaD
� �2 ð6Þ
in which the activities of the components, ai, are calculatedbased on the average concentration of the particle pores;and the activity coefficients are determined using the univer-sal quasichemical functional-group activity coefficients(UNIFAC) method.[15] The equilibrium constant, Keq, the re-action kinetic constant, kc, and the water equilibrium adsorp-tion constant, Ks,D, were determined in a previous study[16]
and are given by Equations (7)–(9):
Keq ¼ 7:73� 10�2 exp1036:8T Kð Þ
� �ð7Þ
Kc ¼ 3:21� 105 exp�4561:06
T Kð Þ
� �ð8Þ
KS;D ¼ 1:454� 10�4 exp2920:68T Kð Þ
� �ð9Þ
The multicomponent Langmuir isotherm was consideredin the present work to describe the adsorption equilibrium[Eq. (10)]:
840 � 2014 Wiley-VCH Verlag GmbH & Co. KGaA, Weinheim Energy Technol. 2014, 2, 839 – 850
N. S. GraÅa et al.
qi ¼QiKi
�Cp;i
1þPn
j¼1 Kj�Cp;i
ð10Þ
in which Qi and Ki represent the total molar capacity pervolume of adsorbent and the equilibrium constant of compo-nent i, respectively. It is known that for the thermodynamicconsistency of the Langmuir isotherm, the total molar capaci-ty should be the same for all the components. However, pre-vious studies have shown that the use of the Langmuirmodel as an empirical tool instead of a rigorous descriptionof the physical phenomena of adsorption can provide a goodrepresentation of the experimental adsorption data on ion-exchange resins.[17–19]
Moreover, the interstitial fluid velocity variation was cal-culated using the total mass balance assuming ideal liquidvolumes additivity [Eq. (11)].[20]
dudz¼ � 1� eð Þ
e
3rp
XNC
i¼1
KL;iVmol;i Ci � �Cp;i
� �ð11Þ
in which Vmol,i is the molar volume of component i.
The axial dispersion coefficient was calculated based onthe Peclet number determined experimentally [Eq. (12)]:
Pe ¼ uLc
Daxð12Þ
The proposed model considers a global mass-transfer coef-ficient defined by Equation (13):
1KL¼ 1
keþ 1
epkið13Þ
in which ke and ki are the external and internal mass-transfercoefficients, respectively.
Santacesaria et al. showed that the internal mass-transfercoefficient varies over time, and the calculation of the rigor-ous value requires the solution of the complete model equa-tions inside particles.[21] As an approximation, the mean esti-mated value was used [Eq. (14)]:[22]
ki ¼5 Dm=t
rpð14Þ
The tortuosity factor, t, used in this work was 2.5, foundby a best fit procedure to the adsorption data.
The external mass-transfer coefficient was estimated bythe Wilson and Geankoplis correlation [Eq. (15)]:[23]
Shp ¼1:09
eðRepScÞ0:33 0:0015 < Rep < 55 ð15Þ
in which Shp and Rep are, respectively, the Sherwood andReynolds numbers, relative to the particle [Eqs. (16) and(17)]:
Shp ¼kedp
Dmð16Þ
Rep ¼1dpu
hð17Þ
and Sc is the Schmidt number [Eq. (18)]:
Sc ¼ h
1Dmð18Þ
The infinite dilution diffusivities were estimated by theScheibel correlation [Eq. (19)]:[24]
D0A;B cm2s�1� �
¼ 8:2� 10�8T
hBV1=3mol;A
1þ 3Vmol;B
Vmol;A
� �23
" #
ð19Þ
in which D0A,B [cm2 s�1] is the diffusion coefficient for a dilute
solute A into a solvent B, T is the temperature, Vmol,i is themolar volume of component i, and hB is the viscosity of sol-vent B.
For binary systems, the diffusion coefficient in concentrat-ed solutions, DA,B, was calculated using the Vignes equation[Eq. (20)].[25]
D2;1 ¼ D1;2 ¼ D01;2
� �x2
D02;1
� �x1 ð20Þ
For multicomponent concentrated solutions the Perkinsand Geankopolis mixing rule was used [Eq. (21)]:[26]
DA;mh0:8m ¼
Xn
i¼1
xiD0A;ih
0:8i ð21Þ
in which hi is the viscosity of the pure component and hm isthe viscosity of the mixture. The mixture viscosity and com-ponent diffusivities were calculated at each time at everyaxial position. The viscosity of the mixture was computedusing the Grunberg–Nissan correlation[27] without the excessviscosity function [Eq. (22)]:[28]
ln hmð Þ ¼X
i
xi ln hið Þ ð22Þ
Numerical solution
The model equations were solved using the commercial soft-ware gPROMS (general PROcess Modeling System) version3.1.5. The mathematical model involves a system of partialand algebraic equations (PDAEs). The axial coordinate wasdiscretized using the third-order orthogonal collocation inthe finite elements method (OCFEM). The system of ordina-ry differential equations (ODEs), which result from the axialdiscretization, was integrated over time using the DASOLVintegrator implementation in gPROMS.
Energy Technol. 2014, 2, 839 – 850 � 2014 Wiley-VCH Verlag GmbH & Co. KGaA, Weinheim 841
Synthesis of a Diesel Additive

Thirty finite elements were used for axial discretization.All simulations used a fixed tolerance of 10�7.
Results and Discussion
The desorption and reaction data obtained from the fixed-bed adsorptive reactor provide valuable information thatallows the study and the implementation of the synthesis ofDEB in a continuous adsorptive/reactive process such as theSMBR.[29,30] Previous work showed the feasibility of the ace-talization reaction in an SMBR,[31–33] and the mathematicalmodels used showed good agreement with the experimentalresults. Therefore, the same mathematical model was used inthis work to simulate the SMBR process. The simulationwork was performed using the synthesis of DEB in anSMBR as a case study, and the characteristic and operationconditions are presented in Table 1.
The successful operation of the chromatographic SMBRdepends on the correct choice of operating conditions. Theequilibrium theory applied to nonreactive SMB can be usedto determine the adequate operating conditions for theSMBR.[34,35] If the axial dispersion and mass-transfer resist-ance are neglected, the constraints of SMBR operation interms of interstitial velocity ratios for section 1 and section 4are given by Equations (23) and (24):
g1 ¼1� eð Þ
eep þ 1� ep
� � qD1
�Cp;D1
!
b ð23Þ
g4 ¼1� eð Þ
eep þ 1� ep
� � qC4
�Cp;C4
!1b
ð24Þ
If the above constraints are met, it is guaranteed thatwater (D) is preferentially carried by the liquid phase in sec-tion 1 and by the solid phase in other sections; and DEB (C)is preferentially carried by the solid phase in section 4 andby the liquid phase in other sections. Both sections 1 and 4play a very important role in SMBR operation. In section 1,the solid phase is regenerated by the removal of the ad-sorbed water. In section 4 the desorbent is cleaned by ad-sorbing the DEB. If we consider diluted water or DEB insections 1 and 4, respectively, the critical values of the inter-
stitial velocity ratio for these sections can be calculated if weconsider the safety margin of b=1.09 [Eqs. (25) and (26)]:
g1, min ¼ 2:465 ð25Þ
g4, max ¼ 0:635 ð26Þ
The critical value of the interstitial velocity ratio for sec-tion 1 is relatively low compared with that of other acetaliza-tions, such as the synthesis of 1,1-dibutoxyethane with Am-berlyst 15 (g1,min =6.860),[33] which means that the synthesisof DEB in the SMBR will present a relatively low desorbentrequirement.
Another important operation parameter is the switchingtime, which can be calculated by Equation (27):
t* ¼ eVc
Q*1g1 þ 1ð Þ ð27Þ
in which Q*1 is the flow rate in section 1 of the SMBR. Inprevious studies performed in an SMBR similar to that con-sidered in the simulations, a flow rate of 45 mL min�1 in sec-tion 1 provided a system pressure around 45 bar (the columnlimit is 60 bar). Under such conditions, the switching timeobtained is 4.4 min.
The reaction–separation region defines the operationregion in the g2–g3 plane in which a minimum value of ex-tract and raffinate purity is guaranteed. The reaction–separa-tion region is located above the diagonal g2 = g3, which corre-sponds to a zero feed flow rate, and above the horizontalbranch g3 =g4, which correspond to a zero raffinate flowrate.
The algorithm for the construction of the reaction–separa-tion region starts by setting a low value of the feed flow rate(0.01 mL min�1) and g2 =g4,max, and the value of g2 is incre-mented consecutively by steps of 0.5. For each g2, the valueof g3 is given by Equation (28):
g3 ¼1� eð Þ
e
QF
QSþ g2 ð28Þ
in which the solid flow rate (QS) is given by Equation (29):
QS ¼1� eð ÞVc
t*ð29Þ
For each pair of (g2, g3) both extract and raffinate puritiesand conversion are calculated. If the last pair of (g2, g3),which guarantee both purity and conversion specifications, isreached, the value of g2 is reinitiated and the feed flow rateis incremented by a step of 1 mL min�1. This procedure is re-peated until the maximum feed flow rate that guarantees thepurity specification is reached. The reaction–separationregion is constructed with the points in which the minimumpurity and conversion requirement are achieved. To evaluatethe SMBR performance the following criteria are used:
Table 1. Characteristics and operation conditions of the SMB unit.
Conditions 3-3-3-3
temperature [8C] 30catalyst/adsorbent Amberlyst 47column length [cm] 23column diameter [cm] 2.6bed porosity 0.42Peclet number 64.4CA,F [mol L
�1] 12.25CB,F [mol L
�1] 3.06
842 � 2014 Wiley-VCH Verlag GmbH & Co. KGaA, Weinheim Energy Technol. 2014, 2, 839 – 850
N. S. GraÅa et al.
Raffinate purity [%; Eq. (30)]:
PUR ¼ CC;R
CB;R þ CC;R þ CD;R� 100 ð30Þ
Extract purity [%; Eq. (31)]:
PUX ¼ CC;X
CB;X þ CC;X þ CD;X� 100 ð31Þ
Acetaldehyde conversion [%; Eq. (32)]:
X ¼ 1�QXCB;X þQRCB;R
QFCB;F
� �� 100 ð32Þ
Raffinate productivity [kgDBE Lresin�1 d�1; Eq. (33)]:
PR ¼ QRCC;R
1� eð ÞVunitð33Þ
Desorbent consumption [Ldesorbent kgDBE�1; Eq. (34)]:
DC ¼QDCA;D þQF CA;F � 2XCB;F
� �Vmol;A
QRCC;R
¼QDCA;D þQF CA;F � 2XCB;F
� �Vmol;A
PR 1� eð ÞVunit
ð34Þ
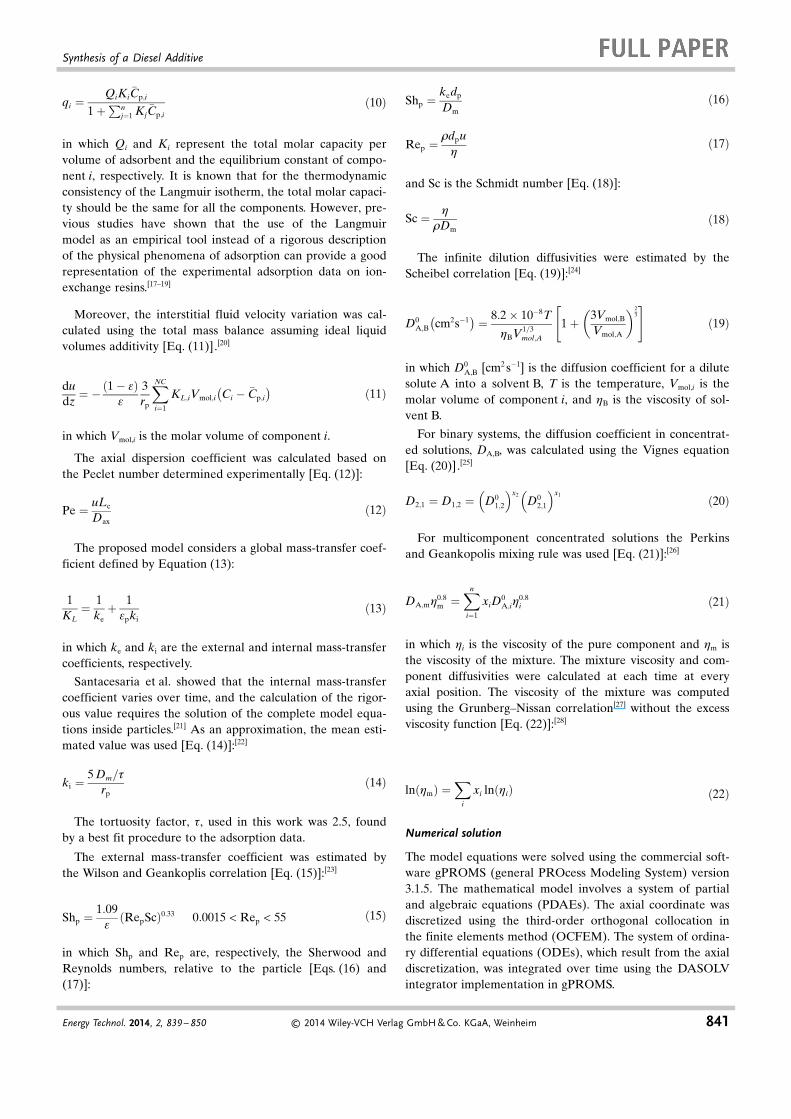
The minimum acetaldehyde conversion, extract, and raffi-nate purity considered in this work was 97 %. The reaction–separation region obtained is presented in Figure 2.
The performance of the SMBR at different operationpoints inside the reaction–separation region is presented inTable 2. The best performance is obtained at operationpoint 3, which is the point located farthest from the diagonalg2 =g3. Consequently, this point presents the highest differ-ence between g3 and g2, which corresponds to the highest
feed flow rate. Therefore, the best performance is obtainedfor the operation point that allows the highest feed flow rateand guarantees the minimum requirements of purity andconversion, also known as the vertex point.
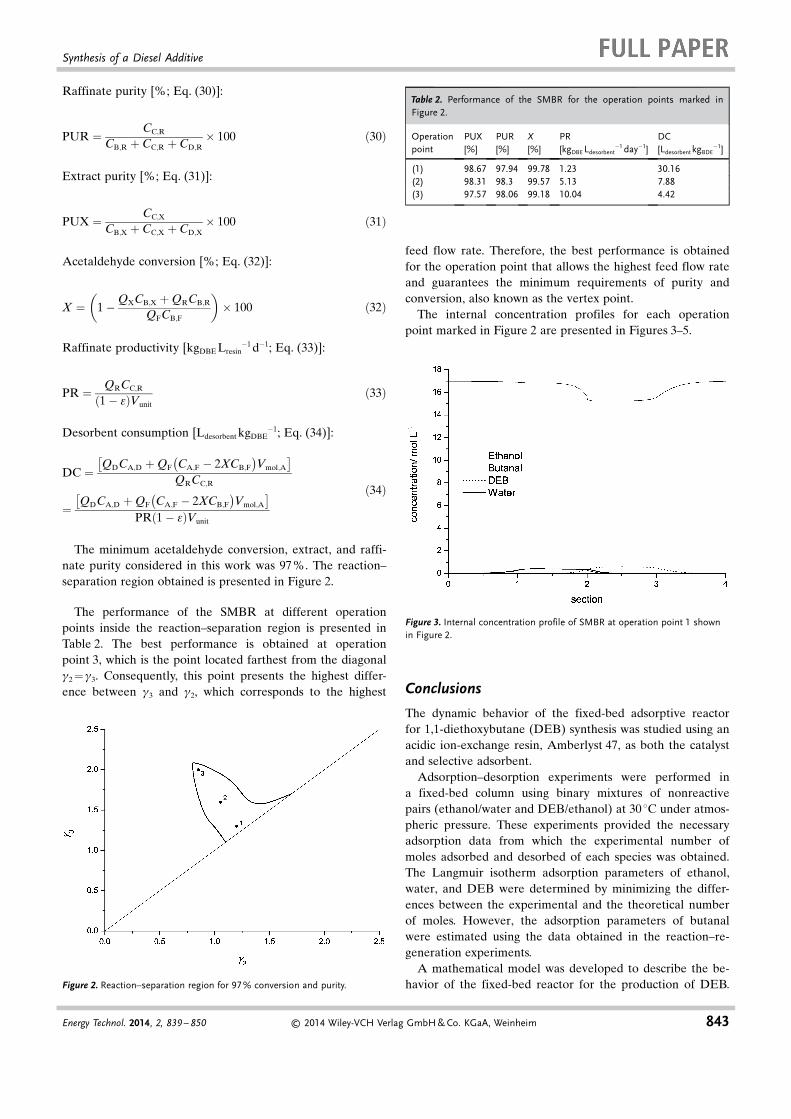
The internal concentration profiles for each operationpoint marked in Figure 2 are presented in Figures 3–5.
Conclusions
The dynamic behavior of the fixed-bed adsorptive reactorfor 1,1-diethoxybutane (DEB) synthesis was studied using anacidic ion-exchange resin, Amberlyst 47, as both the catalystand selective adsorbent.
Adsorption–desorption experiments were performed ina fixed-bed column using binary mixtures of nonreactivepairs (ethanol/water and DEB/ethanol) at 30 8C under atmos-pheric pressure. These experiments provided the necessaryadsorption data from which the experimental number ofmoles adsorbed and desorbed of each species was obtained.The Langmuir isotherm adsorption parameters of ethanol,water, and DEB were determined by minimizing the differ-ences between the experimental and the theoretical numberof moles. However, the adsorption parameters of butanalwere estimated using the data obtained in the reaction–re-generation experiments.
A mathematical model was developed to describe the be-havior of the fixed-bed reactor for the production of DEB.Figure 2. Reaction–separation region for 97 % conversion and purity.
Table 2. Performance of the SMBR for the operation points marked inFigure 2.
Operationpoint
PUX[%]
PUR[%]
X[%]
PR[kgDBE Ldesorbent
�1 day�1]DC[Ldesorbent kgBDE
�1]
(1) 98.67 97.94 99.78 1.23 30.16(2) 98.31 98.3 99.57 5.13 7.88(3) 97.57 98.06 99.18 10.04 4.42
Figure 3. Internal concentration profile of SMBR at operation point 1 shownin Figure 2.
Energy Technol. 2014, 2, 839 – 850 � 2014 Wiley-VCH Verlag GmbH & Co. KGaA, Weinheim 843
Synthesis of a Diesel Additive
This model includes: axial dispersion, external and internalmass-transfer resistances, multicomponent Langmuir adsorp-tion isotherms, and velocity variations caused by mixturemolar volume variations. The reaction–regeneration experi-mental results are predicted well by the proposed model.
On the basis of the results obtained, it was possible to de-termine the operation conditions of the simulated moving-bed reactor for the synthesis of DEB and to construct the re-action–separation region in which a purity and conversionabove 97 % is guaranteed. Simulation results show that atthe best operation point (near the vertex point of theregion), the productivity is 10.04 kg L
�1 d�1 and desorbentconsumption is 4.42 L kg�1.
Experimental Section
Experimental setup
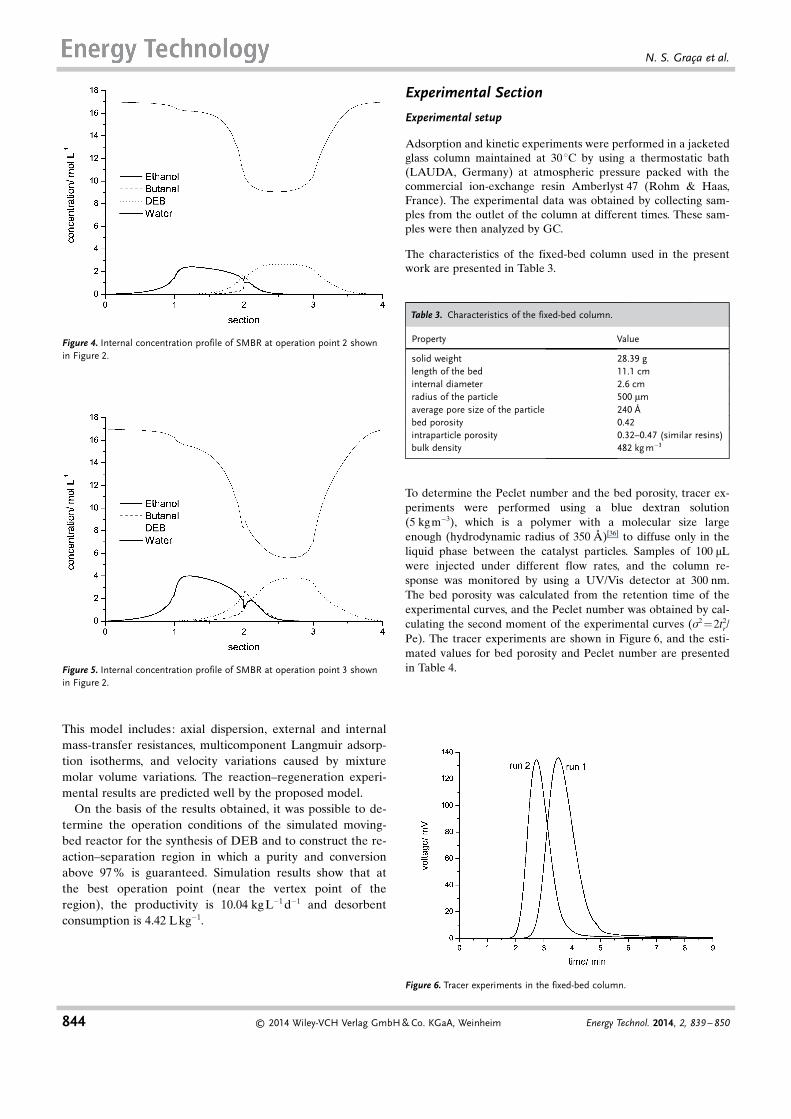
Adsorption and kinetic experiments were performed in a jacketedglass column maintained at 30 8C by using a thermostatic bath(LAUDA, Germany) at atmospheric pressure packed with thecommercial ion-exchange resin Amberlyst 47 (Rohm & Haas,France). The experimental data was obtained by collecting sam-ples from the outlet of the column at different times. These sam-ples were then analyzed by GC.
The characteristics of the fixed-bed column used in the presentwork are presented in Table 3.
To determine the Peclet number and the bed porosity, tracer ex-periments were performed using a blue dextran solution(5 kgm�3), which is a polymer with a molecular size largeenough (hydrodynamic radius of 350 �)[36] to diffuse only in theliquid phase between the catalyst particles. Samples of 100 mLwere injected under different flow rates, and the column re-sponse was monitored by using a UV/Vis detector at 300 nm.The bed porosity was calculated from the retention time of theexperimental curves, and the Peclet number was obtained by cal-culating the second moment of the experimental curves (s2 =2t2
r/Pe). The tracer experiments are shown in Figure 6, and the esti-mated values for bed porosity and Peclet number are presentedin Table 4.
Figure 4. Internal concentration profile of SMBR at operation point 2 shownin Figure 2.
Figure 5. Internal concentration profile of SMBR at operation point 3 shownin Figure 2.
Table 3. Characteristics of the fixed-bed column.
Property Value
solid weight 28.39 glength of the bed 11.1 cminternal diameter 2.6 cmradius of the particle 500 mmaverage pore size of the particle 240 �bed porosity 0.42intraparticle porosity 0.32–0.47 (similar resins)bulk density 482 kg m�3
Figure 6. Tracer experiments in the fixed-bed column.
844 � 2014 Wiley-VCH Verlag GmbH & Co. KGaA, Weinheim Energy Technol. 2014, 2, 839 – 850
N. S. GraÅa et al.

Catalyst/adsorbent
The catalyst/adsorbent used was the resin Amberlyst 47 (A47). Itis a macroreticular, sulfonic acid polymeric catalyst suitable foruse in pressure-drop-sensitive reactors such as tubular reactorsor in structured packings for reactive distillation columns; it isextremely resistant to breakdown by osmotic, mechanical, andthermal shocks. Its continuous, open-pore structure makes A47an excellent heterogeneous acid catalyst for a wide variety of or-ganic reactions. The ion-exchange capacity is 1.65 equiv. L�1 ofdry resin, and the surface area is 50 m2 g�1. The resin presentsa shrinkage of 4% if the liquid phase changes from water tomethanol and a shrinkage of 37% if the resin changes from wetto dry.
Chemicals
The chemicals used were DEB (>97%) and butanal (99 %)from Acros Organics, ethanol (99.5%) from Panreac, and ace-tone (99.98%) from Fisher Chemical (used as the internal stan-dard in GC). There is little information available on the physicalproperties of DEB, namely, there is no viscosity data available.Therefore, experimental measurements of viscosity were per-formed by using a Cannon–Fensk viscometer at different temper-atures (Figure 7).
Analytical methods
All samples were analyzed by GC (GC-2010 Plus, Shimadzu),and the compounds were separated in a fused-silica capillarycolumn (CP Wax 57CB, 25 m� 0.53 mm ID, df=22.0 mm) usinga thermal conductivity detector (TCD) and a flame ionizationdetector (FID) for peak identification and quantification. Thecolumn temperature was programmed with a 7.5 min initial holdat 50 8C, followed by a 50 8C min�1 ramp to 100 8C and held for
2 min. The carrier gas used was Helium N50. The injector anddetector temperature were maintained at 250 8C.
Adsorption–desorption experiments with nonreactive pairs
Adsorption–desorption experiments were performed in thefixed-bed column packed with A47. The column was saturatedwith a compound or a binary mixture (nonreactive pair) ofknown composition, and then the other compound or a differentconcentration of the nonreactive pair was fed into the columnuntil no changes were observed in the concentration of theoutlet stream. Samples were withdrawn at certain time intervalsand analyzed by GC.
The experimental data obtained were used to calculate thenumber of moles of each component retained/leaving the column(amount in interparticle space+amount in particle pores+a-mount adsorbed in the solid phase). Then, the adsorption equi-librium parameters were determined by minimizing the differ-ence between the experimental and theoretical number of molesadsorbed and desorbed for all the experiments [Eqs. (35)–(39)]:
nadsexp ¼ Q
Z 1
0CF � Cout tð Þ½ �dt ð35Þ
ndesexp ¼ Q
Z 1
0Cout tð Þ � CD½ �dt ð36Þ
nadstheo ¼
eþ 1� eð Þep
CF � C0ð Þ
þ 1� eð Þ 1� ep
� �q CFð Þ � q C0ð Þ½ �
( )
Vc ð37Þ
ndestheo ¼
eþ 1� eð Þep
CF � C0ð Þ
þ 1� eð Þ 1� ep
� �q CFð Þ � q CDð Þ½ �
( )
Vc ð38Þ
The objective function (fob) is:The binary pairs used in the
f ob ¼Xnt
k¼1
nadsexp � nads
theo
� �2þ ndes
exp � ndestheo
� �2h ið39Þ
adsorption–desorption experiments were ethanol/water and etha-nol/DEB. As there is a wide range of composition in which thenonreactive pair butanal/water is immiscible[37] (Figure 8), the ad-
Table 4. Results obtained from tracer experiments.
Run Q[mLmin�1]
tr
[min]E s2
[min2]Pe
1 7 3.42 0.416 0.373 62.92 9 2.67 0.417 0.217 65.9
Figure 7. Experimental DEB viscosity and polynomial fit in the temperaturerange of 25–50 8C. Figure 8. Liquid–liquid equilibrium of the butanal/water system.
Energy Technol. 2014, 2, 839 – 850 � 2014 Wiley-VCH Verlag GmbH & Co. KGaA, Weinheim 845
Synthesis of a Diesel Additive
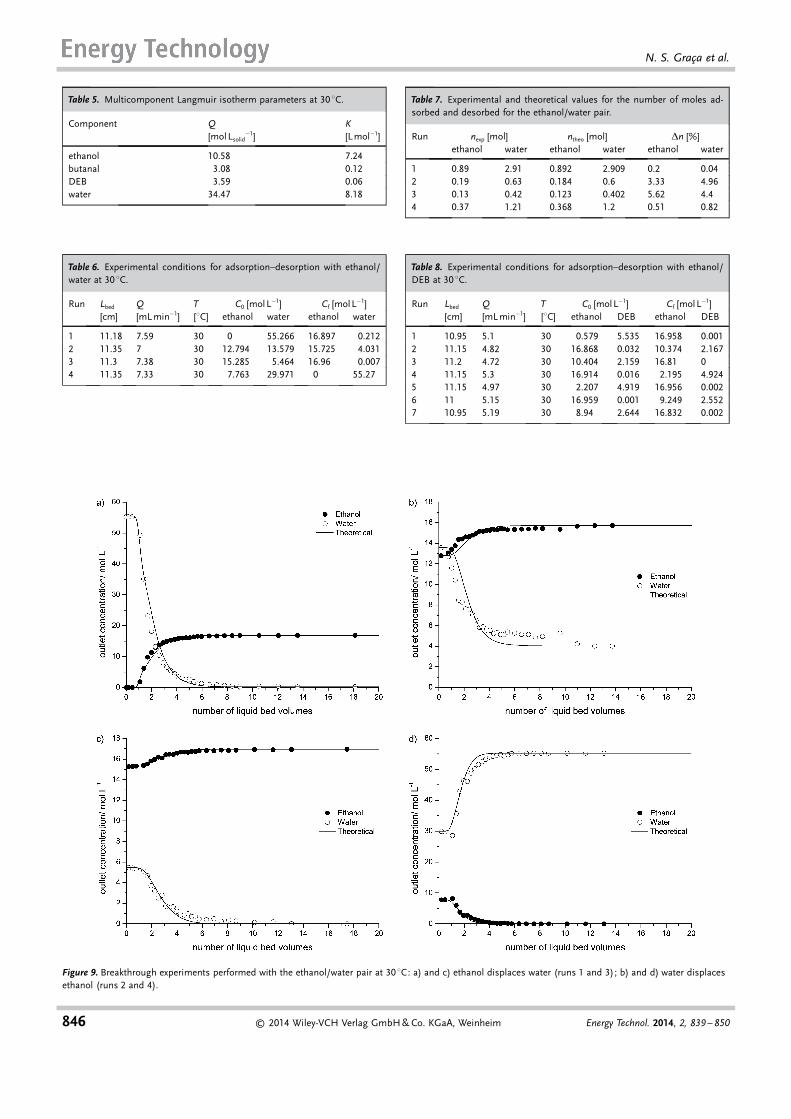
Table 5. Multicomponent Langmuir isotherm parameters at 30 8C.
Component Q[mol Lsolid
�1]K[Lmol�1]
ethanol 10.58 7.24butanal 3.08 0.12DEB 3.59 0.06water 34.47 8.18
Table 6. Experimental conditions for adsorption–desorption with ethanol/water at 30 8C.
Run Lbed Q T C0 [mol L�1] Cf [mol L�1][cm] [mL min�1] [8C] ethanol water ethanol water
1 11.18 7.59 30 0 55.266 16.897 0.2122 11.35 7 30 12.794 13.579 15.725 4.0313 11.3 7.38 30 15.285 5.464 16.96 0.0074 11.35 7.33 30 7.763 29.971 0 55.27
Table 7. Experimental and theoretical values for the number of moles ad-sorbed and desorbed for the ethanol/water pair.
Run nexp [mol] ntheo [mol] Dn [%]ethanol water ethanol water ethanol water
1 0.89 2.91 0.892 2.909 0.2 0.042 0.19 0.63 0.184 0.6 3.33 4.963 0.13 0.42 0.123 0.402 5.62 4.44 0.37 1.21 0.368 1.2 0.51 0.82
Table 8. Experimental conditions for adsorption–desorption with ethanol/DEB at 30 8C.
Run Lbed Q T C0 [mol L�1] Cf [mol L�1][cm] [mLmin�1] [8C] ethanol DEB ethanol DEB
1 10.95 5.1 30 0.579 5.535 16.958 0.0012 11.15 4.82 30 16.868 0.032 10.374 2.1673 11.2 4.72 30 10.404 2.159 16.81 04 11.15 5.3 30 16.914 0.016 2.195 4.9245 11.15 4.97 30 2.207 4.919 16.956 0.0026 11 5.15 30 16.959 0.001 9.249 2.5527 10.95 5.19 30 8.94 2.644 16.832 0.002
Figure 9. Breakthrough experiments performed with the ethanol/water pair at 30 8C: a) and c) ethanol displaces water (runs 1 and 3); b) and d) water displacesethanol (runs 2 and 4).
846 � 2014 Wiley-VCH Verlag GmbH & Co. KGaA, Weinheim Energy Technol. 2014, 2, 839 – 850
N. S. GraÅa et al.

sorption parameters of butanal were obtained by optimizationwith reaction data.
The experiments were performed in the correct direction of theliquid flow (from bottom to top or from top to bottom) so thatthe difference in the densities of the species does not lead toaxial backmixing. Concentration fronts that move from bottomto the top within the column are hydrodynamically stable if thecomponent above the front is less dense than the componentbelow it.[17] The densities of ethanol, butanal, DEB, and water at30 8C are 0.780, 0.802, 0.841, and 0.996 gcm�3, respectively.
The Langmuir isotherm parameters estimated by optimizationare presented in Table 5.
The experimental conditions of the breakthrough experimentsperformed for the nonreactive pair ethanol/water are summar-ized in Table 6.
The error percentage between the experimental and theoreticalnumber of moles adsorbed and desorbed in all ethanol/water ex-periments was lower than 6% (Table 7) if the optimized adsorp-tion parameters noted in Table 5 were used.
A comparison between the experimental and simulated results isshown in Figure 9.
The experimental conditions of the breakthrough performed forthe nonreactive pair ethanol/DEB are summarized in Table 8.
The errors between the experimental and theoretical number ofmoles adsorbed and desorbed of each component in all ethanol/DEB experiments are presented in Table 9. This error was neverhigher than 8.31%. The comparison between experimental andsimulated results is shown in Figures 10 and 11.
Reaction experiments
To conduct the reaction in the fixed-bed column packed withA47, a mixture of ethanol and butanal was fed continuously intothe column initially saturated with ethanol. The feed mixturewas less dense than the pure ethanol so it was fed from thebottom of the column. After the reaction, the column was regen-
Figure 10. Breakthrough experiments performed with the ethanol/DEB pair at 30 8C: a) and c) ethanol displaces DEB (runs 1 and 3); b) and d) DEB displacesethanol (runs 2 and 4).
Table 9. Experimental and theoretical values for the number of moles ad-sorbed and desorbed for the ethanol/DEB pair.
Run nexp [mol] ntheo [mol] Dn [%]ethanol DEB ethanol DEB ethanol DEB
1 0.72 0.24 0.721 0.233 0.17 2.812 0.27 0.09 0.276 0.09 2.20 0.513 0.26 0.09 0.274 0.092 4.95 2.034 0.62 0.21 0.635 0.209 2.34 0.615 0.65 0.22 0.635 0.209 2.39 5.226 0.35 0.11 0.323 0.107 8.31 3.137 0.35 0.11 0.329 0.11 6.28 0.32
Energy Technol. 2014, 2, 839 – 850 � 2014 Wiley-VCH Verlag GmbH & Co. KGaA, Weinheim 847
Synthesis of a Diesel Additive
erated with pure ethanol, and a top-down flow was adopted be-cause the reaction mixture present within the column is heavierthan pure ethanol.
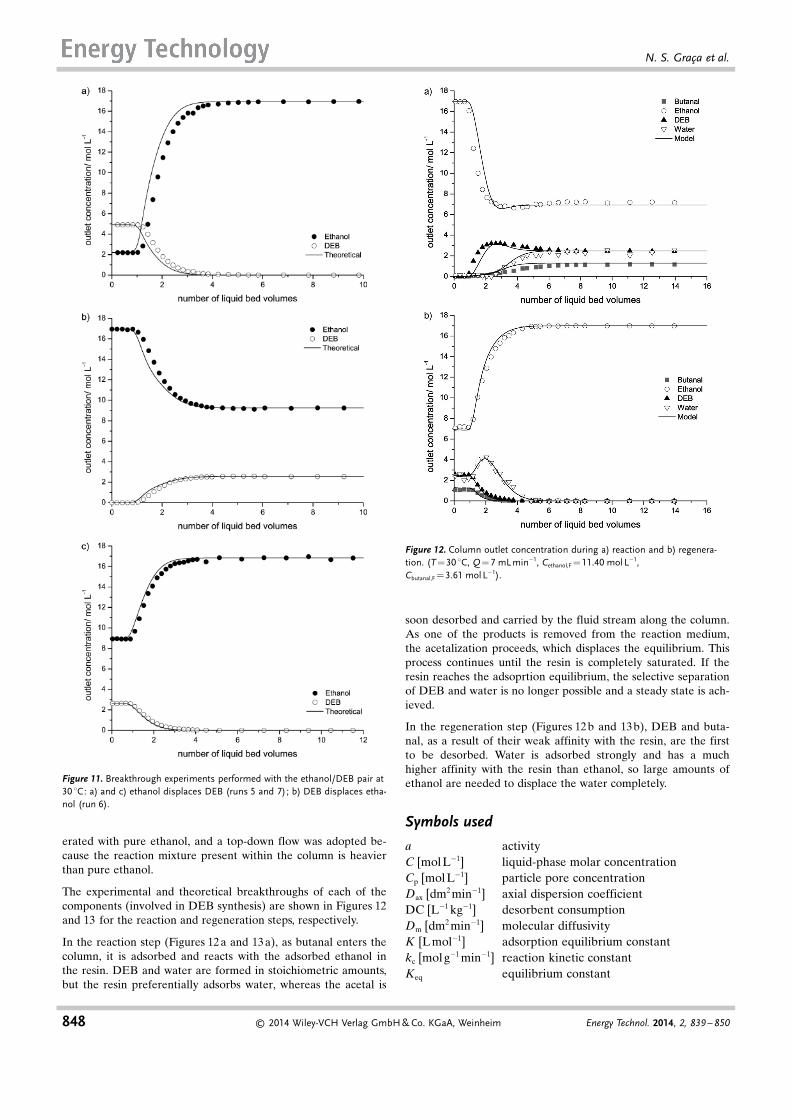
The experimental and theoretical breakthroughs of each of thecomponents (involved in DEB synthesis) are shown in Figures 12and 13 for the reaction and regeneration steps, respectively.
In the reaction step (Figures 12 a and 13 a), as butanal enters thecolumn, it is adsorbed and reacts with the adsorbed ethanol inthe resin. DEB and water are formed in stoichiometric amounts,but the resin preferentially adsorbs water, whereas the acetal is
soon desorbed and carried by the fluid stream along the column.As one of the products is removed from the reaction medium,the acetalization proceeds, which displaces the equilibrium. Thisprocess continues until the resin is completely saturated. If theresin reaches the adsoprtion equilibrium, the selective separationof DEB and water is no longer possible and a steady state is ach-ieved.
In the regeneration step (Figures 12b and 13b), DEB and buta-nal, as a result of their weak affinity with the resin, are the firstto be desorbed. Water is adsorbed strongly and has a muchhigher affinity with the resin than ethanol, so large amounts ofethanol are needed to displace the water completely.
Symbols used
a activityC [mol L�1] liquid-phase molar concentrationCp [mol L�1] particle pore concentrationDax [dm2 min�1] axial dispersion coefficientDC [L�1 kg�1] desorbent consumptionDm [dm2 min�1] molecular diffusivityK [L mol�1] adsorption equilibrium constantkc [mol g�1 min�1] reaction kinetic constantKeq equilibrium constant
Figure 11. Breakthrough experiments performed with the ethanol/DEB pair at30 8C: a) and c) ethanol displaces DEB (runs 5 and 7); b) DEB displaces etha-nol (run 6).
Figure 12. Column outlet concentration during a) reaction and b) regenera-tion. (T=30 8C, Q=7 mLmin�1, Cethanol,F = 11.40 mol L�1,Cbutanal,F =3.61 mol L�1).
848 � 2014 Wiley-VCH Verlag GmbH & Co. KGaA, Weinheim Energy Technol. 2014, 2, 839 – 850
N. S. GraÅa et al.

KL [dm min�1] mass-transfer coefficientKS,D water adsorption constantLc [dm] column lengthn [mol] number of molesPe Peclet numberPR [kg L
�1 d�1] productivityPUR [%] raffinate purityPUX [%] extract purityQ [L min�1] liquid flow rateq [mol L�1] particle solid concentrationQi [mol L�1] adsorption molar capacityQs [L min�1] solid flow rater [mol g�1 min�1] reaction rateRep particle Reynolds numberrp [dm] particle radiusSc Schmidt numberShp particle Sherwood numbert [min] timeT [8C] temperaturet* [min] switching timetr [min] retention timeu [dm min�1] interstitial velocityVc [L] column volumeVmol [mol L�1] molar volume
X [%] conversionx molar fractionz [dm] axial coordinate
Greek
b Safety marging solid/liquid interstitial velocity ratioe bed porosityep particle porosityh [cP] viscosity1b [gL
�1] bulk densitys [min2] varianceu stoichiometric coefficient
Subscripts
A ethanolB butanalC DEBD wateri component i
Abbreviations
DEB 1,1-diethoxybutaneDEE 1,1-diethoxyethaneSMBR simulated moving-bed reactor
Keywords: adsorption · heterogeneous catalysis · ionexchange · renewable resources · sustainable chemistry
[1] EIA, Emissions of Greenhouse Gases in the United States 2001,Wash-ington, DC, 2002.
[2] IEA, World Energy Outlook 2007.[3] B. Hahn-H�gerdal, M. Galbe, M. F. Gorwa-Grauslund, G. Lid�n, G.
Zacchi, Trends Biotechnol. 2006, 24, 549 – 556.[4] R. L. McCormick, M. S. Graboski, T. L. Alleman, A. M. Herring,
K. S. Tyson, Environ. Sci. Technol. 2001, 35, 1742 –1747.[5] B. R. Moser, S. Z. Erhan, Fuel 2008, 87, 2253 –2257.[6] F. Frusteri, L. Spadaro, C. Beatrice, C. Guido, Chem. Eng. J. 2007,
134, 239 –245.[7] G. K. Gandi, V. M. T. M. Silva, A. E. Rodrigues, Ind. Eng. Chem.
Res. 2005, 44, 7287 – 7297.[8] V. M. T. M. Silva, A. E. Rodrigues, Chem. Eng. Sci. 2001, 56, 1255 –
1263.[9] N. S. GraÅa, L. S. Pais, V. M. T. M. Silva, A. E. Rodrigues, Ind. Eng.
Chem. Res. 2010, 49, 6763 – 6771.[10] M. Kaufhold, M. El-Chahawi, U.S. Patent 5,527,969, 1996.[11] J. Lilja, D. Y. Murzin, T. Salmi, J. Aumo, P. M�ki-Arvela, M. Sundell,
J. Mol. Catal. A 2002, 182 –183, 555 –563.[12] A. K. Kolah, N. S. Asthana, D. T. Vu, C. T. Lira, D. J. Miller, Ind.
Eng. Chem. Res. 2007, 46, 3180 – 3187.[13] J. Andrade, D. Arntz, M. Kraft, G. Prescher, U.S. Patent 4,579,979,
1986.[14] V. M. T. M. Silva, A. E. Rodrigues, Chem. Eng. Sci. 2006, 61, 316 –
331.
Figure 13. Column outlet concentration during a) reaction and b) regenera-tion. (T=30 8C, Q=5 mLmin�1, Cethanol,F = 11.60 mol L�1,Cbutanal,F =3.52 mol L�1).
Energy Technol. 2014, 2, 839 – 850 � 2014 Wiley-VCH Verlag GmbH & Co. KGaA, Weinheim 849
Synthesis of a Diesel Additive

[15] A. Fredenslund, J. Gmehling, P. Rasmussen, Vapor-Liquid EquilibriaUsing UNIFAC, Elsevier, Amsterdam, 1977.
[16] M. Rahaman, N. S. GraÅa, C. S. M. Pereira, A. E. Rodrigues, Chem.Eng. J. 2014, submitted.
[17] V. M. T. M. Silva, A. E. Rodrigues, AIChE J. 2002, 48, 625 –634.[18] C. S. M. Pereira, V. M. T. M. Silva, A. E. Rodrigues, Sep. Sci. Technol.
2009, 44, 2721 –2749.[19] N. S. GraÅa, L. S. Pais, V. M. T. M. Silva, A. E. Rodrigues, Sep. Sci.
Technol. 2011, 46, 631 –640.[20] F. Lode, M. Houmard, C. Migliorini, M. Mazzotti, M. Morbidelli,
Chem. Eng. Sci. 2001, 56, 269 – 291.[21] E. Santacesaria, M. Morbidelli, A. Servida, G. Storti, S. Carr�, Ind.
Eng. Chem. Prod. Res. Dev. 1982, 21, 446 –451.[22] E. Glueckauf, Trans. Faraday Soc. 1955, 51, 1540 –1551.[23] D. M. Ruthven, Principles of Adsorption and Adsorption Processes,
Wiley, New York, 1984.[24] E. G. Scheibel, Ind. Eng. Chem. 1954, 46, 2007 –2008.[25] A. Vignes, Ind. Eng. Chem. Fundam. 1966, 5, 189 –199.[26] L. R. Perkins, C. J. Geankoplis, Chem. Eng. Sci. 1969, 24, 1035 –1042.[27] L. Grunberg, A. H. Nissan, Nature 1949, 164, 799 – 800.[28] W. Yu, K. Hidajat, A. K. Ray, Appl. Catal. A 2004, 260, 191 – 205.[29] M. Minceva, P. S. Gomes, V. Meshko, A. E. Rodrigues, Chem. Eng. J.
2008, 140, 305 –323.
[30] D. C. S. Azevedo, A. E. Rodrigues, Chem. Eng. J. 2001, 82, 95 –107.[31] C. S. M. Pereira, P. S. Gomes, G. K. Gandi, V. M. T. M. Silva, A. E.
Rodrigues, Ind. Eng. Chem. Res. 2008, 47, 3515 – 3524.[32] V. M. T. M. Silva, G. K. Gandi, A. E. Rodrigues, A. K. SenGupta, De-
velopment of Simulated Moving Bed Reactor Using a Cation Ex-change Resin as a Catalyst and Adsorbent for the Synthesis of Acetals.Ion Exchange and Solvent Extraction: A Series of Advances, Vol. 18,edited by Arup K. SenGupta, CRC 2007.
[33] N. S. GraÅa, L. S. Pais, V. M. T. M. Silva, A. E. Rodrigues, Chem.Eng. Process. 2011, 50, 1214 –1225.
[34] J. Fricke, M. Meurer, J. Dreisçrner, H. Schmidt-Traub, Chem. Eng.Sci. 1999, 54, 1487 – 1492.
[35] P. S. Gomes, C. P. Le¼o, A. E. Rodrigues, Chem. Eng. Sci. 2007, 62,1026 – 1041.
[36] J.-C. Janson, Protein Purification: Principles, High Resolution Meth-ods, and Applications, Wiley, Hoboken, 2011.
[37] M. B. Tapper, C. E. Engelhardt, B. A. Schecter, V. Fried, D. Zudke-vitch, AIChE Symp. Ser. 1985, 81 (244), 136 – 141.
Received: July 15, 2014Revised: August 11, 2014Published online on September 10, 2014
850 � 2014 Wiley-VCH Verlag GmbH & Co. KGaA, Weinheim Energy Technol. 2014, 2, 839 – 850
N. S. GraÅa et al.
Copyright © 2022 FDOKUMEN