The-operative-technique-of-tooth-removal-II.-Surgical-removal ...
Upload
independentCategory
view
2download
0
Journal of Environmental Chemical Engineering 2 (2014) 585–597
Contents lists available at ScienceDirect
Journal of Environmental Chemical Engineering
journa l homepage: www.e lsev ier .com/ locate / jece
Modeling of the adsorptive removal of arsenic: A statistical approach
P. Roy, N.K. Mondal *, K. Das
Department of Environmental Science, The University of Burdwan, Burdwan 713104, West Bengal, India
A R T I C L E I N F O
Article history:
Received 13 August 2013
Accepted 23 October 2013
Keywords:
Arsenic removal
Fe–SCC adsorbent
Artificial neural network model
Central composite design
Response surface methodology
A B S T R A C T
Arsenic in drinking water has been recognized as a serious community health problem because of its
toxic nature and therefore, its removal is highly essential. A series of adsorption experiments (batch and
column) were performed utilizing iron impregnated sugarcane carbon (Fe–SCC), a composite adsorbent,
to remove arsenic from aqueous systems. Under optimized batch conditions, the Fe–SCC could remove
up to 94.5% of arsenic from contaminated water. The artificial neural network (ANN) model was
developed from batch experimental data sets which provided reasonable predictive performance
(R2 = 0.964; 0.963) of arsenic adsorption. In batch operation, the adsorbent dose had the most significant
impact on the adsorption process. For column operation, central composite design (CCD) in response
surface methodology (RSM) was applied to investigate the influence on the breakthrough time for
optimization and evaluation of interacting effects of different operating variables. The perturbation plot
depicted that the breakthrough time is more sensitive to initial concentration and adsorbent dose than
flow rate. The optimized result obtained from bar plot revealed that the Fe–SCC was an effective and
economically feasible adsorbent; whereas more than 93% desorption efficiency showed the reusability of
the adsorbent. The high arsenic adsorptive removal ability and regeneration efficiency of this adsorbent
suggest its applicability in industrial/household systems and data generated would help in further
upscaling of the adsorption process.
� 2013 Elsevier Ltd. All rights reserved.
Introduction
Arsenic’s history in applied science has been overshadowedby its notoriety, and the drinking water containing arsenic is achallenging environmental issue [1–5]. Exposure to arsenicthrough drinking water sourced from groundwater has emergedas a major concern on a global scale [1,2,6]. Groundwaterenriched with arsenic in the form of arsenate [As(V)] and arsenite[As(III)] poses a serious health hazards in several developingcountries [2,7,8]. As high as, the WHO provisional guideline of10 mg/L of arsenic in drinking water is now recognized as aworldwide problem in many countries, especially in theSoutheast Asia, including India, Bangladesh, and China [1]. Alargest segment of population currently is at risk in the BengalBasin area of Bangladesh and West Bengal in India [9,10];however, it is remarkable that these two countries have retainedthe earlier WHO guideline of 50 mg/L as their standard of arsenicin drinking water [11,12]. About 70 million people are sufferingfrom arsenic problem alone in these regions; this is perhaps
Abbreviations: Fe–SCC, iron impregnated sugarcane carbon; ANN, artificial neural
network; ANOVA, analysis of variance; CCD, central composite design; D–R,
Dubinin–Radushkevich; RSM, response surface methodology; SDDC, silver diethyl
dithiocarbamate; SEM, scanning electron microscopy; 2FI, two factor interactions.
* Corresponding author. Tel.: +91 9434545694.
E-mail address: [email protected] (N.K. Mondal).
2213-3437/$ – see front matter � 2013 Elsevier Ltd. All rights reserved.
http://dx.doi.org/10.1016/j.jece.2013.10.014
the largest poisoning in world’s history [13,14]. Today, inWest Bengal, the arsenic contamination in groundwater, andeventually in drinking water, has been reported in the range from50 to 3600 mg/L and the arsenic species in contaminateddrinking water were found to be arsenate and arsenite in 1:1ratio [8,15].
Development of effective technologies to remove arsenic fromwater drew great attention over the last two decades. Severalphysiochemical techniques, such as adsorption, ion exchange, limesoftening, membrane filtration, coagulation and precipitation havebeen applied to remove arsenic from aqueous system. Amongthese, adsorption technology is mainly used because it is verysimple and cost effective [7,8,16–18]. Besides, it is also popular dueto availability of a wide range of adsorbents.
Among all types of conventional and non-conventionaladsorbents, commercially available activated carbon has beenextensively used for arsenic removal because of its extendedsurface area, micro/mesoporous structure and significant adsorp-tion capacity. However, owing to the high cost and difficultprocurement of activated carbon, efforts are being directed todevelop cheaper but effective adsorbents from a variety ofagricultural/industrial waste materials [2,7,8,19]. Consideringthe surface carbon chemistry, only physically active char carbonprepared from these agricultural/industrial waste materials islikely to provide good substitute for activated carbon. Carbonizedsugarcane bagasse, i.e., sugarcane carbon (SCC) is an alternative
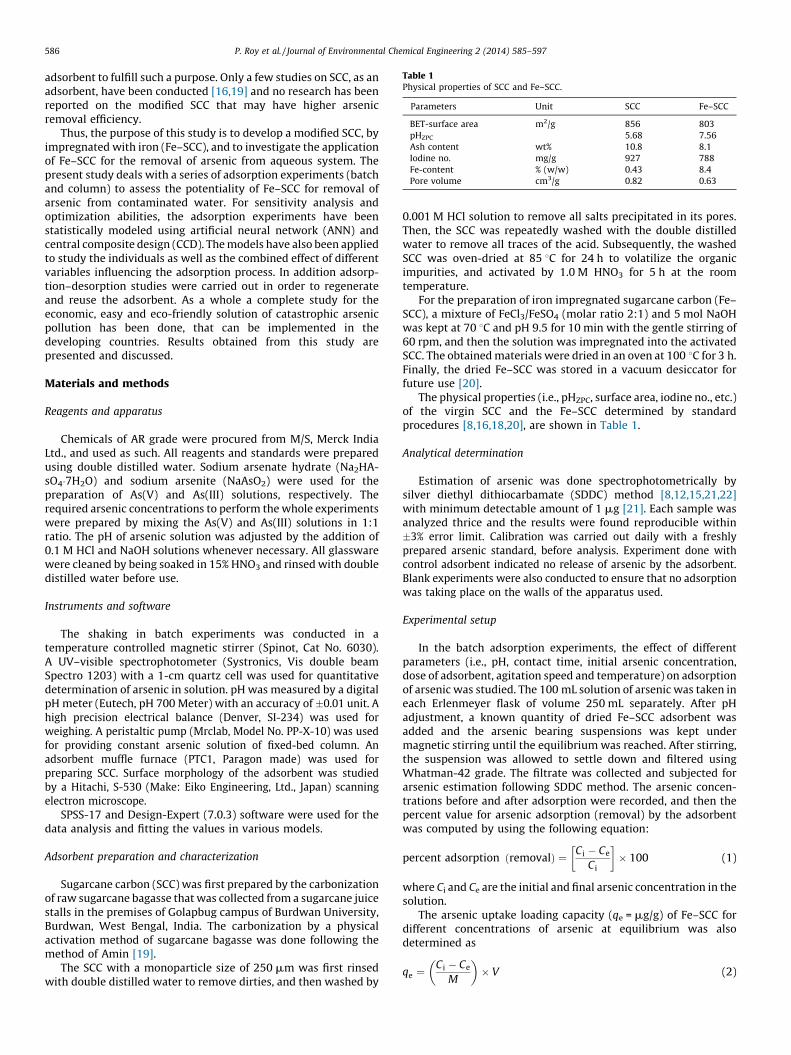
Table 1Physical properties of SCC and Fe–SCC.
Parameters Unit SCC Fe–SCC
BET-surface area m2/g 856 803
pHZPC 5.68 7.56
Ash content wt% 10.8 8.1
Iodine no. mg/g 927 788
Fe-content % (w/w) 0.43 8.4
Pore volume cm3/g 0.82 0.63
P. Roy et al. / Journal of Environmental Chemical Engineering 2 (2014) 585–597586
adsorbent to fulfill such a purpose. Only a few studies on SCC, as anadsorbent, have been conducted [16,19] and no research has beenreported on the modified SCC that may have higher arsenicremoval efficiency.
Thus, the purpose of this study is to develop a modified SCC, byimpregnated with iron (Fe–SCC), and to investigate the applicationof Fe–SCC for the removal of arsenic from aqueous system. Thepresent study deals with a series of adsorption experiments (batchand column) to assess the potentiality of Fe–SCC for removal ofarsenic from contaminated water. For sensitivity analysis andoptimization abilities, the adsorption experiments have beenstatistically modeled using artificial neural network (ANN) andcentral composite design (CCD). The models have also been appliedto study the individuals as well as the combined effect of differentvariables influencing the adsorption process. In addition adsorp-tion–desorption studies were carried out in order to regenerateand reuse the adsorbent. As a whole a complete study for theeconomic, easy and eco-friendly solution of catastrophic arsenicpollution has been done, that can be implemented in thedeveloping countries. Results obtained from this study arepresented and discussed.
Materials and methods
Reagents and apparatus
Chemicals of AR grade were procured from M/S, Merck IndiaLtd., and used as such. All reagents and standards were preparedusing double distilled water. Sodium arsenate hydrate (Na2HA-sO4�7H2O) and sodium arsenite (NaAsO2) were used for thepreparation of As(V) and As(III) solutions, respectively. Therequired arsenic concentrations to perform the whole experimentswere prepared by mixing the As(V) and As(III) solutions in 1:1ratio. The pH of arsenic solution was adjusted by the addition of0.1 M HCl and NaOH solutions whenever necessary. All glasswarewere cleaned by being soaked in 15% HNO3 and rinsed with doubledistilled water before use.
Instruments and software
The shaking in batch experiments was conducted in atemperature controlled magnetic stirrer (Spinot, Cat No. 6030).A UV–visible spectrophotometer (Systronics, Vis double beamSpectro 1203) with a 1-cm quartz cell was used for quantitativedetermination of arsenic in solution. pH was measured by a digitalpH meter (Eutech, pH 700 Meter) with an accuracy of �0.01 unit. Ahigh precision electrical balance (Denver, SI-234) was used forweighing. A peristaltic pump (Mrclab, Model No. PP-X-10) was usedfor providing constant arsenic solution of fixed-bed column. Anadsorbent muffle furnace (PTC1, Paragon made) was used forpreparing SCC. Surface morphology of the adsorbent was studiedby a Hitachi, S-530 (Make: Eiko Engineering, Ltd., Japan) scanningelectron microscope.
SPSS-17 and Design-Expert (7.0.3) software were used for thedata analysis and fitting the values in various models.
Adsorbent preparation and characterization
Sugarcane carbon (SCC) was first prepared by the carbonizationof raw sugarcane bagasse that was collected from a sugarcane juicestalls in the premises of Golapbug campus of Burdwan University,Burdwan, West Bengal, India. The carbonization by a physicalactivation method of sugarcane bagasse was done following themethod of Amin [19].
The SCC with a monoparticle size of 250 mm was first rinsedwith double distilled water to remove dirties, and then washed by
0.001 M HCl solution to remove all salts precipitated in its pores.Then, the SCC was repeatedly washed with the double distilledwater to remove all traces of the acid. Subsequently, the washedSCC was oven-dried at 85 8C for 24 h to volatilize the organicimpurities, and activated by 1.0 M HNO3 for 5 h at the roomtemperature.
For the preparation of iron impregnated sugarcane carbon (Fe–SCC), a mixture of FeCl3/FeSO4 (molar ratio 2:1) and 5 mol NaOHwas kept at 70 8C and pH 9.5 for 10 min with the gentle stirring of60 rpm, and then the solution was impregnated into the activatedSCC. The obtained materials were dried in an oven at 100 8C for 3 h.Finally, the dried Fe–SCC was stored in a vacuum desiccator forfuture use [20].
The physical properties (i.e., pHZPC, surface area, iodine no., etc.)of the virgin SCC and the Fe–SCC determined by standardprocedures [8,16,18,20], are shown in Table 1.
Analytical determination
Estimation of arsenic was done spectrophotometrically bysilver diethyl dithiocarbamate (SDDC) method [8,12,15,21,22]with minimum detectable amount of 1 mg [21]. Each sample wasanalyzed thrice and the results were found reproducible within�3% error limit. Calibration was carried out daily with a freshlyprepared arsenic standard, before analysis. Experiment done withcontrol adsorbent indicated no release of arsenic by the adsorbent.Blank experiments were also conducted to ensure that no adsorptionwas taking place on the walls of the apparatus used.
Experimental setup
In the batch adsorption experiments, the effect of differentparameters (i.e., pH, contact time, initial arsenic concentration,dose of adsorbent, agitation speed and temperature) on adsorptionof arsenic was studied. The 100 mL solution of arsenic was taken ineach Erlenmeyer flask of volume 250 mL separately. After pHadjustment, a known quantity of dried Fe–SCC adsorbent wasadded and the arsenic bearing suspensions was kept undermagnetic stirring until the equilibrium was reached. After stirring,the suspension was allowed to settle down and filtered usingWhatman-42 grade. The filtrate was collected and subjected forarsenic estimation following SDDC method. The arsenic concen-trations before and after adsorption were recorded, and then thepercent value for arsenic adsorption (removal) by the adsorbentwas computed by using the following equation:
percent adsorption ðremovalÞ ¼ Ci � Ce
Ci
� �� 100 (1)
where Ci and Ce are the initial and final arsenic concentration in thesolution.
The arsenic uptake loading capacity (qe = mg/g) of Fe–SCC fordifferent concentrations of arsenic at equilibrium was alsodetermined as
qe ¼Ci � Ce
M
� �� V (2)

[(Fig._2)TD$FIG]
87672
76
80
Removal Uptake capacity
pH
Rem
oval
%
48
52
56
Upt
ake
capa
city
(µ
g/g)
Fig. 2. Effect of pH on the adsorption of arsenic by Fe–SCC; initial arsenic
concentration: 100 mg/L; dose: 0.15 g; contact time: 20 min; temperature: 30 8C;
agitation speed: 300 rpm.
P. Roy et al. / Journal of Environmental Chemical Engineering 2 (2014) 585–597 587
where V is the volume of solution (L) and M is the mass of theadsorbent (g) used.
The experimental datasets, which were obtained from the batchexperiments, were used as inputs to the ANN model to provide thereasonable predictive performance of the adsorbent.
Fixed-bed column experiments were conducted using borosili-cate glass columns of 50-cm length and 3-cm internal diameter.The column was packed with different amounts of Fe–SCC, in orderto achieve different bed heights, between two supporting layersconsisting of 1-cm glass wool to prevent the floatage of theadsorbent.
The column study was conducted to evaluate the effects ofdifferent variables (initial arsenic concentration, flow rate, andadsorbent dose) on the breakthrough time of arsenic adsorptionusing CCD in response surface methodology (RSM). Arsenicsolutions having the desired initial concentration was adjustedto the optimum batch pH for the maximum removal of arsenic, andpumped into the column at the desired flow rate through the bed inan up-flow mode. The flow rates were chosen to have sufficientamount of effluent per 45 min for the practical purpose ofanalyzing arsenic concentration. Operation of the column wasstopped when the effluent concentration exceeded a value of 99.5%of the initial arsenic concentration. All experiments were done induplicate at room temperature (30 8C) with experimental errorlimit �5% and average values reported.
Results and discussion
Batch adsorption study
Effect of initial arsenic concentration
The adsorption behavior of arsenic was studied in theconcentration range of 50–500 mg/L initially at pH 7.0. In general,the removal percentage of arsenic on Fe–SCC adsorbent wasinitially increased with the increasing initial concentration ofarsenic reaching the optimum level of 81.8% at 100 mg/L arsenicconcentration. Thereafter, the percentage of removal showedsharp decrease (Fig. 1). At higher concentrations, lower adsorptionyield is probably due to the saturation of free adsorption sites.Though an increase in arsenic uptake, with decrease in percentageof adsorption, was attributed to lack of available active sites on theadsorbent surface to accommodate much more arsenic available inthe solution [9,23].
[(Fig._1)TD$FIG]100 200 300 400 50076
78
80
82
Removal Uptake capacity
Concentration (µg/L)
Rem
oval
%
60
120
180
240
Upt
ake
capa
city
(µg/
g)
Fig. 1. Effect of initial arsenic concentration on the adsorption of arsenic by Fe–SCC;
dose: 0.15 g; contact time: 20 min; pH: 7.0; temperature: 30 8C; agitation speed:
300 rpm.
Effect of pH
Fig. 2 represents the percentage removal (or uptake capacity) asa function of the pH at optimum concentration (100 mg/L) ofarsenic. The maximum removal of 81.8% (54.5 mg/g) was obtainedat the pH of 7.0. At this experimental pH of 7.0, both As(III) andAs(V) occur in several protonate forms: the predominant specieswere H3AsO3 and H2AsO3
� for As(III), and H2AsO4� and HAsO4
2�
for As(V). It seems reasonable that below pHZPC (7.56), the surfaceof Fe–SCC is positively charged and the neutral or negativelycharged arsenic species are adsorbed easily by electrostaticattraction force. And the reduced trend of removal at higher pH,might be due to an increase of repulsive interaction with increaseof negatively charged arsenic species and negatively charge surfacesites [17,24,25].
Effect of adsorbent dose
In studying the influence of the dry weight of Fe–SCC mass onthe removal efficiency at pH 7.0 with initial arsenic concentrationof 100 mg/L, it was found that the removal efficiency of arsenicincreased steadily (Fig. 3) with increasing adsorbent doses
[(Fig._3)TD$FIG]0.05 0.10 0.15 0.20 0.25 0.30
80
84
88 RemovalUptake Capacity
Adsorbent Dose (g)
Rem
oval
%
50
100
150
Upt
ake
capa
city
(µ
g/g)
Fig. 3. Effect of adsorbent dose on the adsorption of arsenic by Fe–SCC; initial
arsenic concentration: 100 mg/L; contact time: 20 min; pH: 7.0; temperature:
30 8C; agitation speed: 300 rpm.

[(Fig._4)TD$FIG]
10 20 30 40
80
85
90
Contact time (min)
Rem
oval
% Removal
Uptake capacity
32
34
36
Upt
ake
capa
city
(µg/
g)
Fig. 4. Effect of contact time on the adsorption of arsenic by Fe–SCC; initial arsenic
concentration: 100 mg/L; dose: 0.25 g; pH: 7.0; temperature: 30 8C; agitation
speed: 300 rpm.
[(Fig._5)TD$FIG]
30 40 50
90
91
92
93
Removal Uptake capacity
Temperature (0C)
Rem
oval
%
36.0
36.5
37.0
37.5
Upt
ake
capa
city
(µ
g/g)
Fig. 5. Effect of temperature on the adsorption of arsenic by Fe–SCC; initial arsenic
concentration: 100 mg/L; dose: 0.25 g; contact time: 30 min; pH: 7.0; agitation
speed: 300 rpm.
[(Fig._6)TD$FIG]
100 200 300 400 500
93.0
93.5
94.0
94.5Removal Uptake capacity
Agitation speed (rpm)
Rem
oval
%
36.8
37.2
37.6
38.0
Upt
ake
capa
city
(µ
g/g)
Fig. 6. Effect of agitation speed on the adsorption of arsenic by Fe–SCC; initial
arsenic concentration: 100 mg/L; dose: 0.25 g; contact time: 30 min; pH: 7.0;
temperature: 40 8C.
P. Roy et al. / Journal of Environmental Chemical Engineering 2 (2014) 585–597588
(0.05–0.30 g). No remarkable increment in the removal tendencywas noted thereafter on further increasing the adsorbent dose.Increasing removal with adsorbent dose might be attributed toincrease in adsorbent surface area with subsequent increment ofmore active sites [18,26].
Effect of contact time
The adsorption of arsenic on Fe–SCC with different time interval(10–40 min) at optimum value of arsenic concentration (100 mg/L)at pH 7.0 and 0.25 g of adsorbent dosage is shown in Fig. 4. Thepercentage removal of arsenic showed a rapid and steady increaseup to 30 min, and thereafter, no significant increase was recorded.It seems possible that an equilibrium had setup in 30 min (Fig. 4).The fast adsorption rate at the initial stage may be explained by theabundant availability of active sites on the adsorbent surface[18,27]. However, with a lapse of time, the remaining unsaturatedsites cannot be occupied because of repulsive force between thesolute (arsenic) on the solid and bulk phases [8,28].
Effect of temperature
The influence of temperature on the removal of arsenic by Fe–SCC was measured at different temperatures from 30 8C to 50 8C(Fig. 5). The percent removal of arsenic was increased from 90.0 to92.7% when temperature was increased from 30 8C to 40 8C andthereafter it was decreased. The decrease in adsorption might beattributed to the fact that at high temperature, solutes move withgreater speed, therefore, less time of interaction along with theadsorbent active sites was available for them [29,30].
Effect of agitation speed
The effect of different agitation speed varying from 50 to500 rpm was examined, and it appeared that the percentage ofarsenic adsorption was increased with the increase in agitationspeed (Fig. 6). At 500 rpm, maximum removal occurred at the levelof 94.5%; this is because the external mass transfer effect increaseswith increase in agitation, resulting in an increase in solutetransport from bulk to the adsorbent site and thereby increasingthe rate of adsorption [18,31].
Artificial neural network (ANN) modeling
ANN is an advance statistical or computational modelingprocedure which is similar to that of biological neural network.ANN can map a set of input parameters onto a corresponding set of
output parameters for processing of information based on theconnectionist approach, without knowing the intricate relation-ship among them [32]. Moreover, ANN can be trained to identifypatterns, and extract trends in imprecise and complicated non-linear data [8,32,33]. As adsorption is a complex non-linearprocess, neural network is found suitable for prediction andestimation of arsenic adsorption properties. Neural NetworkToolbox of SPSS-17 statistical software was used to predict theadsorption process of Fe–SCC under batch study. The topology ofANN architecture of this study is illustrated in Fig. 7.
A total of 22 experimental datasets, which were obtained frombatch adsorption experiments, were used to develop a three-layerfeed-forward neural network model by applying hyperbolictangent function under the standardized method. Out of these22 datasets, 81.8% were used to train the network, and remaining18.2% were used for testing and validation of the ANN model. Therewere six neurons (viz., pH, initial arsenic concentration, adsorbentdose, contact time, agitation speed and temperature) in the inputlayer whereas two neurons in the output layer (removal efficiencyand uptake capacity). The 7-3-2 ANN (including bias neuron)
[(Fig._7)TD$FIG]
Fig. 7. Neural network architecture of arsenic for batch operation.
P. Roy et al. / Journal of Environmental Chemical Engineering 2 (2014) 585–597 589
model is found to be working satisfactorily with an average relativeerror of 0.040 and sum square error of 1.147 during testing phase,indicating that the model is able to predict the adsorption processwith reasonable accuracy.
The performances of optimized ANN are shown in Figs. 8 and 9.In these figures, experimental and ANN-predicted values arecompared for both removal efficiency and uptake capacity ofarsenic, respectively. The values of R2 (0.964; 0.963) are very closeto 1 in each case, shows an excellent agreement between theexperimental and the ANN-predicted values.
The importance analysis for the developed network was alsoperformed to assess the relative effectiveness of the various[(Fig._8)TD$FIG]
Fig. 8. Importance analysis of the various operating parameters.
operating (input) parameters on the output parameters [32]. In thepresent scenario (Fig. 10), the degree of effectiveness of the inputparameters on the output parameters was found in the order ofadsorbent dose > contact time > temperature > agitationspeed > initial concentration > solution pH for arsenic adsorption.The influence percentages of these parameters on the output were100.0%, 68.0%, 56.4%, 40.0%, 21.0% and 11.1%, respectively.
Equilibrium isotherms and kinetics study
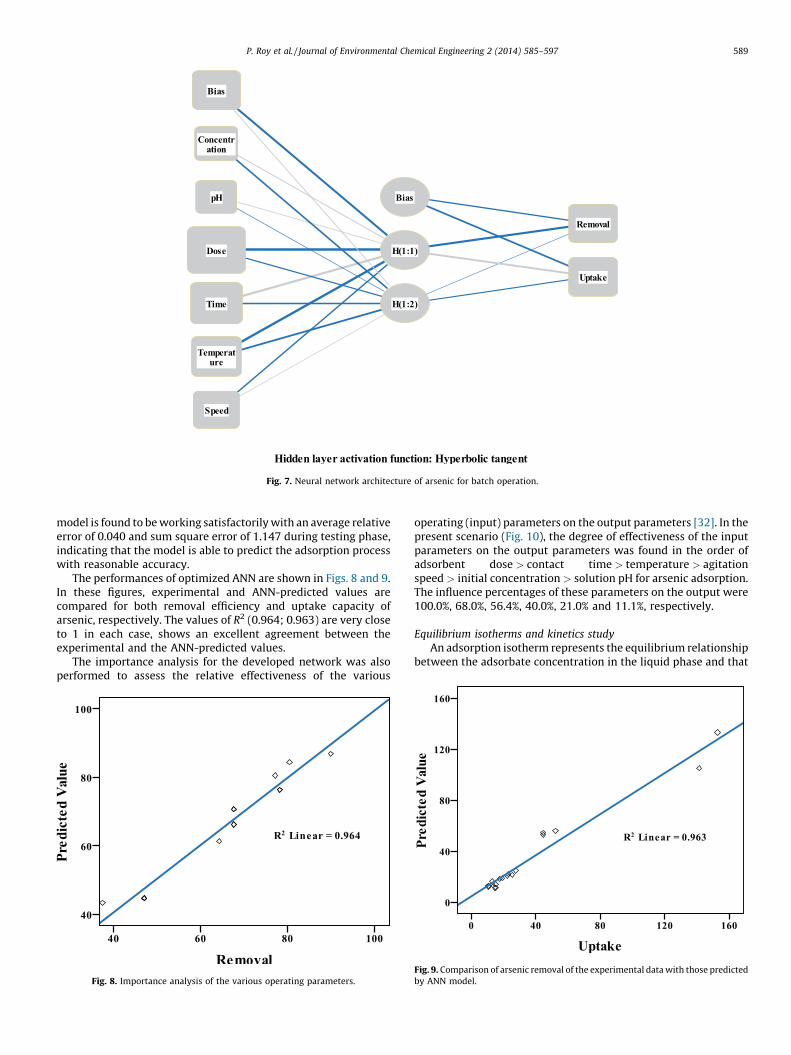
An adsorption isotherm represents the equilibrium relationshipbetween the adsorbate concentration in the liquid phase and that[(Fig._9)TD$FIG]
Fig. 9. Comparison of arsenic removal of the experimental data with those predicted
by ANN model.

[(Fig._10)TD$FIG]
Fig. 10. Comparison of arsenic uptake capacity of the experimental data with those
predicted by ANN model.
P. Roy et al. / Journal of Environmental Chemical Engineering 2 (2014) 585–597590
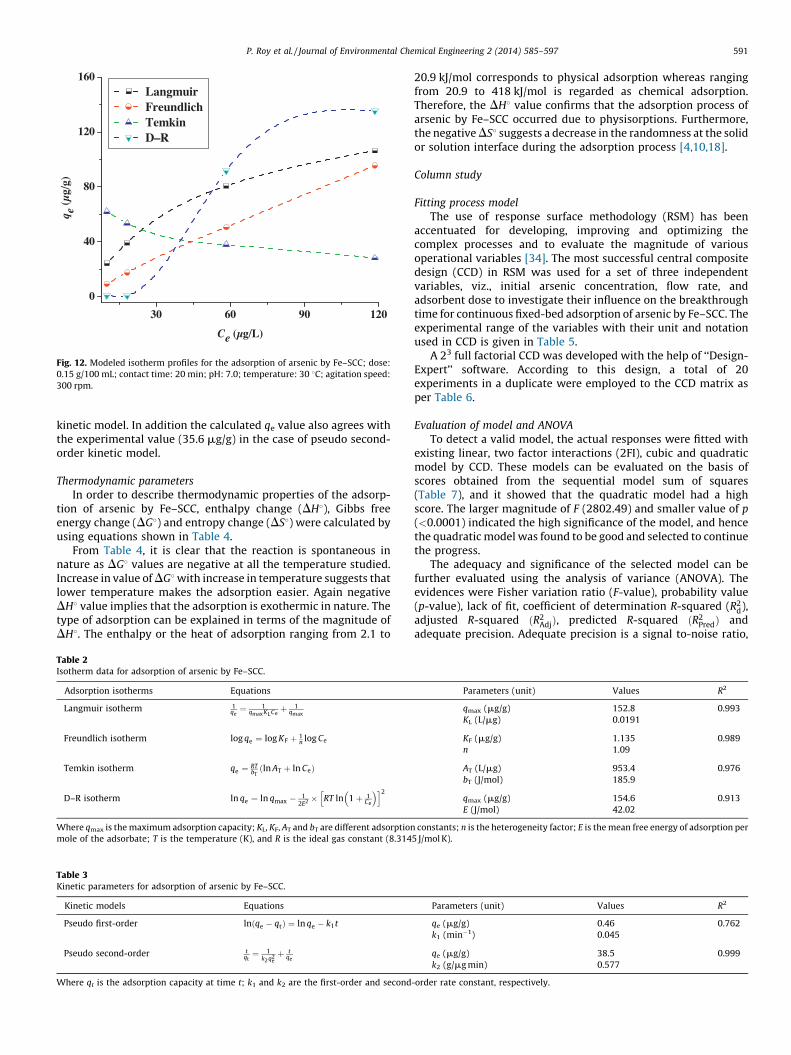
on the adsorbents surface at a given condition. A number ofisotherms have been developed to describe equilibrium relation-ships. In the present study, the Langmuir, Freundlich, Temkin andDubinin–Radushkevich (D–R) models were used to describe theequilibrium isotherms. The illustration of the equilibrium adsorp-tion plots and the summarized isotherm models are shown inFigs. 11 and 12, and Table 2.
[(Fig._11)TD$FIG]0.000 0.025 0.050 0.075 0.100
0.01
0.02
0.03
0.04
1/q e
(g/
µg)
1/Ce (L/µg)
Langmuir isotherm
2.4 3.0 3.6 4.2 4.8
50
100
150
200
250
q e (µg/
g)
lnCe (µg/L)
Temkin isotherm
Fig. 11. Four adsorption equilibrium plots: Langmuir, Freundlich, Temkin and D–R iso
agitation speed: 300 rpm).
From Table 2, it is observed that the Langmuir isotherm showedgood fit to the experimental equilibrium adsorption data than theFreundlich, Dubinin–Radushkevich and Temkin isotherm equationfor arsenic adsorption according to the values of R2. It is also seenfrom Table 2 that the Langmuir maximum adsorption capacity qmax
(mg/g) is 152.8 and the equilibrium constant KL (L/mg) is 0.0191.The separation factor (RL) values are 0.512, 0.344, 0.148 and 0.095while initial arsenic concentrations are 50, 100, 300 and 500 mg/L,respectively. All the RL values were found to be less than one andgreater than zero indicating the favorable adsorption of arsenic byFe–SCC. The Freundlich constant KF indicates the adsorptioncapacity of the adsorbent and the value of KF is 1.135 mg/g.Furthermore, the value of ‘n’ at equilibrium is 1.09. The value of n
lies in between 1 and 10 also represents a favorable adsorption.From Temkin constant, bT related to adsorption binding energy forarsenic is found 185.9 J/mol, clearly denying to follow the ion-exchange mechanism. In addition, D–R isotherm shows the valueof the adsorption energy (E) of 154.6 J/mol. The estimated value ofE (<8 kJ/mol) has been indicated toward the physisorption process[4,5,18].
The pseudo first-order and pseudo second-order kinetic modelswere tested to investigate the rate of adsorption of arsenic by Fe–SCC [4,18]. The linearized form of adsorption kinetics and theirconstants are presented in Table 3.
From the table, it is confirmed that the arsenic adsorptionfollowed the pseudo second-order reaction. It is also clear fromTable 3 that the pseudo second-order kinetic model showedexcellent linearity with high correlation coefficient (R2 = 0.999) at100 mg/L arsenic concentration in comparison to the first-order
0.9 1.2 1.5 1.8 2.1
1.5
1.8
2.1
2.4
logq
e (µ
g/g)
logCe (µg/L)
Freundlich isotherm
0.0000 0.0025 0.0050 0.0075 0.01003.00
3.75
4.50
5.25
6.00
lnq e
(µ
g/g)
[ln(1+1/Ce)]2
D–R isotherm
therm (dose: 0.15 g/100 mL; contact time: 20 min; pH: 7.0; temperature: 30 8C;
[(Fig._12)TD$FIG]
30 60 90 120
0
40
80
120
160 Langmuir Freundlich Temkin D–R
q e (µ
g/g)
Ce (µg/L)
Fig. 12. Modeled isotherm profiles for the adsorption of arsenic by Fe–SCC; dose:
0.15 g/100 mL; contact time: 20 min; pH: 7.0; temperature: 30 8C; agitation speed:
300 rpm.
P. Roy et al. / Journal of Environmental Chemical Engineering 2 (2014) 585–597 591
kinetic model. In addition the calculated qe value also agrees withthe experimental value (35.6 mg/g) in the case of pseudo second-order kinetic model.
Thermodynamic parameters
In order to describe thermodynamic properties of the adsorp-tion of arsenic by Fe–SCC, enthalpy change (DH8), Gibbs freeenergy change (DG8) and entropy change (DS8) were calculated byusing equations shown in Table 4.
From Table 4, it is clear that the reaction is spontaneous innature as DG8 values are negative at all the temperature studied.Increase in value of DG8 with increase in temperature suggests thatlower temperature makes the adsorption easier. Again negativeDH8 value implies that the adsorption is exothermic in nature. Thetype of adsorption can be explained in terms of the magnitude ofDH8. The enthalpy or the heat of adsorption ranging from 2.1 to
Table 3Kinetic parameters for adsorption of arsenic by Fe–SCC.
Kinetic models Equations
Pseudo first-order lnðqe � qtÞ ¼ ln qe � k1t
Pseudo second-order tqt¼ 1
k2q2eþ t
qe
Where qt is the adsorption capacity at time t; k1 and k2 are the first-order and second
Table 2Isotherm data for adsorption of arsenic by Fe–SCC.
Adsorption isotherms Equations
Langmuir isotherm 1qe¼ 1
qmaxKLCeþ 1
qmax
Freundlich isotherm log qe ¼ log KF þ 1n log Ce
Temkin isotherm qe ¼ RTbTðln AT þ ln CeÞ
D–R isotherm ln qe ¼ ln qmax � 12E2 � RT ln 1þ 1
Ce
� �h i2
Where qmax is the maximum adsorption capacity; KL, KF, AT and bT are different adsorption
mole of the adsorbate; T is the temperature (K), and R is the ideal gas constant (8.314
20.9 kJ/mol corresponds to physical adsorption whereas rangingfrom 20.9 to 418 kJ/mol is regarded as chemical adsorption.Therefore, the DH8 value confirms that the adsorption process ofarsenic by Fe–SCC occurred due to physisorptions. Furthermore,the negative DS8 suggests a decrease in the randomness at the solidor solution interface during the adsorption process [4,10,18].
Column study
Fitting process model
The use of response surface methodology (RSM) has beenaccentuated for developing, improving and optimizing thecomplex processes and to evaluate the magnitude of variousoperational variables [34]. The most successful central compositedesign (CCD) in RSM was used for a set of three independentvariables, viz., initial arsenic concentration, flow rate, andadsorbent dose to investigate their influence on the breakthroughtime for continuous fixed-bed adsorption of arsenic by Fe–SCC. Theexperimental range of the variables with their unit and notationused in CCD is given in Table 5.
A 23 full factorial CCD was developed with the help of ‘‘Design-Expert’’ software. According to this design, a total of 20experiments in a duplicate were employed to the CCD matrix asper Table 6.
Evaluation of model and ANOVA
To detect a valid model, the actual responses were fitted withexisting linear, two factor interactions (2FI), cubic and quadraticmodel by CCD. These models can be evaluated on the basis ofscores obtained from the sequential model sum of squares(Table 7), and it showed that the quadratic model had a highscore. The larger magnitude of F (2802.49) and smaller value of p
(<0.0001) indicated the high significance of the model, and hencethe quadratic model was found to be good and selected to continuethe progress.
The adequacy and significance of the selected model can befurther evaluated using the analysis of variance (ANOVA). Theevidences were Fisher variation ratio (F-value), probability value(p-value), lack of fit, coefficient of determination R-squared (R2
d),adjusted R-squared ðR2
AdjÞ, predicted R-squared ðR2PredÞ and
adequate precision. Adequate precision is a signal to-noise ratio,
Parameters (unit) Values R2
qe (mg/g) 0.46 0.762
k1 (min�1) 0.045
qe (mg/g) 38.5 0.999
k2 (g/mg min) 0.577
-order rate constant, respectively.
Parameters (unit) Values R2
qmax (mg/g) 152.8 0.993
KL (L/mg) 0.0191
KF (mg/g) 1.135 0.989
n 1.09
AT (L/mg) 953.4 0.976
bT (J/mol) 185.9
qmax (mg/g) 154.6 0.913
E (J/mol) 42.02
constants; n is the heterogeneity factor; E is the mean free energy of adsorption per
5 J/mol K).
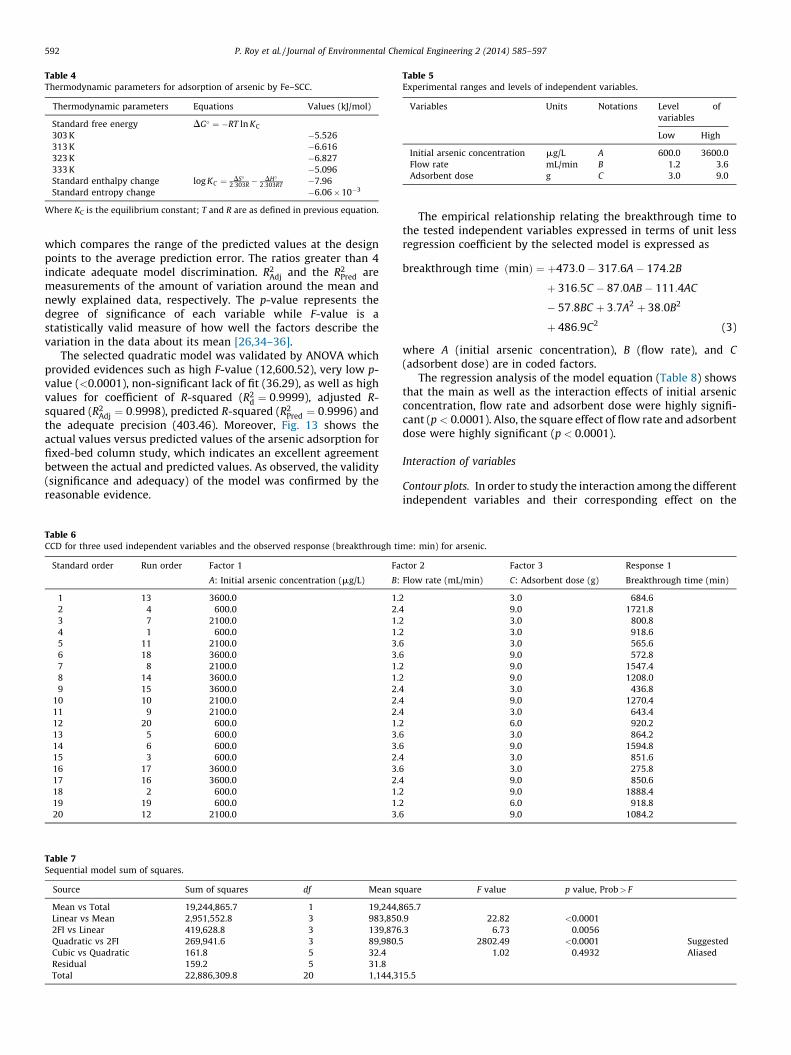
Table 4Thermodynamic parameters for adsorption of arsenic by Fe–SCC.
Thermodynamic parameters Equations Values (kJ/mol)
Standard free energy DG� ¼ �RT ln KC
303 K �5.526
313 K �6.616
323 K �6.827
333 K �5.096
Standard enthalpy change log KC ¼ DS�2:303R� DH�
2:303RT �7.96
Standard entropy change �6.06�10�3
Where KC is the equilibrium constant; T and R are as defined in previous equation.
Table 5Experimental ranges and levels of independent variables.
Variables Units Notations Level of
variables
Low High
Initial arsenic concentration mg/L A 600.0 3600.0
Flow rate mL/min B 1.2 3.6
Adsorbent dose g C 3.0 9.0
P. Roy et al. / Journal of Environmental Chemical Engineering 2 (2014) 585–597592
which compares the range of the predicted values at the designpoints to the average prediction error. The ratios greater than 4indicate adequate model discrimination. R2
Adj and the R2Pred are
measurements of the amount of variation around the mean andnewly explained data, respectively. The p-value represents thedegree of significance of each variable while F-value is astatistically valid measure of how well the factors describe thevariation in the data about its mean [26,34–36].
The selected quadratic model was validated by ANOVA whichprovided evidences such as high F-value (12,600.52), very low p-value (<0.0001), non-significant lack of fit (36.29), as well as highvalues for coefficient of R-squared (R2
d ¼ 0:9999), adjusted R-squared (R2
Adj ¼ 0:9998), predicted R-squared (R2Pred ¼ 0:9996) and
the adequate precision (403.46). Moreover, Fig. 13 shows theactual values versus predicted values of the arsenic adsorption forfixed-bed column study, which indicates an excellent agreementbetween the actual and predicted values. As observed, the validity(significance and adequacy) of the model was confirmed by thereasonable evidence.
Table 6CCD for three used independent variables and the observed response (breakthrough ti
Standard order Run order Factor 1 Fa
A: Initial arsenic concentration (mg/L) B:
1 13 3600.0 1.2
2 4 600.0 2.4
3 7 2100.0 1.2
4 1 600.0 1.2
5 11 2100.0 3.6
6 18 3600.0 3.6
7 8 2100.0 1.2
8 14 3600.0 1.2
9 15 3600.0 2.4
10 10 2100.0 2.4
11 9 2100.0 2.4
12 20 600.0 1.2
13 5 600.0 3.6
14 6 600.0 3.6
15 3 600.0 2.4
16 17 3600.0 3.6
17 16 3600.0 2.4
18 2 600.0 1.2
19 19 600.0 1.2
20 12 2100.0 3.6
Table 7Sequential model sum of squares.
Source Sum of squares df Mean sq
Mean vs Total 19,244,865.7 1 19,244,8
Linear vs Mean 2,951,552.8 3 983,850
2FI vs Linear 419,628.8 3 139,876
Quadratic vs 2FI 269,941.6 3 89,980.5
Cubic vs Quadratic 161.8 5 32.4
Residual 159.2 5 31.8
Total 22,886,309.8 20 1,144,31
The empirical relationship relating the breakthrough time tothe tested independent variables expressed in terms of unit lessregression coefficient by the selected model is expressed as
breakthrough time ðminÞ ¼ þ473:0� 317:6A� 174:2B
þ 316:5C � 87:0AB� 111:4AC
� 57:8BC þ 3:7A2 þ 38:0B2
þ 486:9C2 (3)
where A (initial arsenic concentration), B (flow rate), and C
(adsorbent dose) are in coded factors.The regression analysis of the model equation (Table 8) shows
that the main as well as the interaction effects of initial arsenicconcentration, flow rate and adsorbent dose were highly signifi-cant (p < 0.0001). Also, the square effect of flow rate and adsorbentdose were highly significant (p < 0.0001).
Interaction of variables
Contour plots. In order to study the interaction among the differentindependent variables and their corresponding effect on the
me: min) for arsenic.
ctor 2 Factor 3 Response 1
Flow rate (mL/min) C: Adsorbent dose (g) Breakthrough time (min)
3.0 684.6
9.0 1721.8
3.0 800.8
3.0 918.6
3.0 565.6
9.0 572.8
9.0 1547.4
9.0 1208.0
3.0 436.8
9.0 1270.4
3.0 643.4
6.0 920.2
3.0 864.2
9.0 1594.8
3.0 851.6
3.0 275.8
9.0 850.6
9.0 1888.4
6.0 918.8
9.0 1084.2
uare F value p value, Prob> F
65.7
.9 22.82 <0.0001
.3 6.73 0.0056
2802.49 <0.0001 Suggested
1.02 0.4932 Aliased
5.5

[(Fig._13)TD$FIG]
Actual
Pred
icte
dPredicted vs. Actual
200.0
625.0
1050.0
1475.0
1900.0
275.6 679.7 1083.8 1488.0 1892.1
Fig. 13. Plot of actual response versus predicted response for column operation.
[(Fig._14)TD$FIG]
600.0 1350.0 2100.0 2850.0 3600.0
1.2
1.8
2.4
3.0
3.6Breakthrough time
A: Init ial concentration
B: F
low
rat
e
25.4
114.8
204.2
293.6
383.0
472.4561.9651.3740.7
830.1
Fig. 14. Contour plot showing the combined effect of initial arsenic concentration
and flow rate on the breakthrough time for column operation of arsenic adsorption
by Fe–SCC; adsorbent dose: 6.0 g.
P. Roy et al. / Journal of Environmental Chemical Engineering 2 (2014) 585–597 593
response, contour plots were drawn (Figs. 14–16). Contour plot isthe projection of the response surface as a two-dimensional plane.This analysis gives a better understanding of the influence ofvariables, and their interaction on the response as a function of twovariables at a time.
The combined effect of initial arsenic concentration and flowrate on breakthrough time is shown in the contour plot of Fig. 14.The breakthrough time decreases with increase in both the initialarsenic concentration as well as the flow rate within theexperimental range. Such behavior can be explained in the sensethat all adsorbents have a limited number of active sites whichbecome saturated at a certain concentration [4,18,34]. Withincreasing inlet arsenic concentration, the active sites on theadsorbent surface become more quickly saturated and hencebreakthrough time is decreased. Also at higher flow rates, theadsorption efficiency was lower due to insufficient residence timeof the solute in the column and diffusion of the solute into thepores of the adsorbent, and therefore, leaving the column beforeequilibrium has reached with resultant an earlier breakthroughtime [7,8,22,34].
Fig. 15 depicts the interaction effect of initial arsenicconcentration and adsorbent dose on the breakthrough time.Within the experimental range, the response function, i.e., thebreakthrough time decreases with increasing initial arsenicconcentration, while increases with increasing adsorbent dose.The observed trend might be attributed to the fact that increase inadsorbent dosages in larger beds provided a greater number ofactive sites for arsenic with increase in the surface area of
Table 8Regression analysis of CCD.
Model terms Coefficient estimate Sum of squares
A �317.6 1,210,183.1
B �174.2 364,147.7
C 316.5 1,803,100.5
AB �87.0 60,552.0
AC �111.4 148,830.4
BC �57.8 40,090.1
A2 3.7 54.8
B2 38.0 5776.0
C2 486.9 262,638.4
adsorbent. In a consequence, the solute gets enough time tocontact with the adsorbent resulting in delayed breakthrough[7,8,34].
The contour plot in Fig. 16 shows the combined effect of flowrate and adsorbent dose on the breakthrough time for columnexperiments of arsenic adsorption by Fe–SCC. The interactive effectof flow rate and adsorbent dose has a remarkable impact on thebreakthrough time. The breakthrough time decreases withincreasing flow rate while it increases with increasing adsorbentdose. Such breakthrough pattern can be explained in terms ofinsufficient residence time of the arsenic in the column as well asthe availability of active adsorption sites, as already mentioned.
Thus, contour plots shows that the service time of the column,i.e., breakthrough time increases with decrease in influent arsenicconcentration, increase in adsorbent dose and decrease in flowrate. Therefore, at the maximum service time, the uptake of147.7 mg/g for arsenic was observed at 9.0 g dose, 1.2 mL/min flowrate, and 600.0 mg/L initial concentration of arsenic.
A literature review shows that only a few works on columnstudies have been reported, otherwise most of the studies forarsenic removal have been conducted in batch operation. However,the data obtained under batch conditions are generally notapplicable in industrial/household treatment systems (such ascolumn operations) where contact time is not sufficiently long for
Standard error F value p value, Prob> F
1.636 37,691.80 <0.0001
1.636 11,341.57 <0.0001
1.336 56,158.53 <0.0001
2.003 1885.92 <0.0001
1.636 4635.40 <0.0001
1.636 1248.63 <0.0001
2.833 1.71 0.2208
2.833 179.90 <0.0001
5.384 8180.01 <0.0001

[(Fig._15)TD$FIG]
600.0 1350.0 2100.0 2850.0 3600.0
3.0
4.5
6.0
7.5
9.0Breakthrough time
A: Initial concentration
C: A
dsor
bent
dos
e
280.5423.3
566.2
709.1
709.1
851.9994.8
1137.71280.51423.4
Fig. 15. Contour plot showing the combined effect of initial arsenic concentration
and adsorbent dose on the breakthrough time for column operation of arsenic
adsorption by Fe–SCC; flow rate: 2.4 mL/min.
[(Fig._17)TD$FIG]
Perturbation
Deviation from Reference Point (Coded Units)
Bre
akth
roug
h ti
me
-1.000 -0.500 0.000 0.500 1.000
150.0
475.0
800.0
1125.0
1450.0
A
A
B
B
C
CActual FactorsA: Initial concentration = 2100.0B: Flow rate = 2.4C: Adsorbent dose = 6.0
Fig. 17. Perturbation plot showing the effect of the tested variables on breakthrough
time.
P. Roy et al. / Journal of Environmental Chemical Engineering 2 (2014) 585–597594
the attainment of equilibrium. Hence, there is a need to performequilibrium studies using columns. The higher equilibrium uptakecapacity of arsenic in fixed-bed column reactors makes theadsorbent attractive for arsenic removal filter units. Therefore,the arsenic uptake capacity in column operation on Fe–SCC iscompared with previously reported other adsorbents (Table 9).Although it is difficult to compare the Fe–SCC directly with otheradsorbents because of different applied experimental conditions,still it is found (Table 9) that the arsenic uptake capacity on Fe–SCCis quite significant and is comparable to that of other adsorbentsused for the removal of arsenic in column mode. The results show
[(Fig._16)TD$FIG]
1.2 1.8 2.4 3.0 3.6
3.0
4.5
6.0
7.5
9.0Breakthrough time
B: Flow rate
C: A
dsor
bent
dos
e
415.7528.8
641.8
641.8
754.9
754.9
868.0
981.11094.11207.21320.3
Fig. 16. Contour plot showing the combined effect of flow rate and adsorbent dose
on the breakthrough time for column operation of arsenic adsorption by Fe–SCC;
initial arsenic concentration: 2100.0 mg/L.
the applicability of Fe–SCC for the removal of arsenic from aqueoussolutions using an up-flow fixed-bed continuous column.
Perturbation plot. The effects of initial arsenic concentration, flowrate and adsorbent dose on the breakthrough time were evaluated.The individual effect of independent variables including initialarsenic concentration (A), flow rate (B) and adsorbent dose (C) wasfound by perturbation plot. A perturbation plot does not show theeffect of interactions and it is like one factor-at-a-time experimen-tation. The perturbation plot as in Fig. 17 helps to compare theeffect of all independent variables at a particular point in thedesign space. The response is plotted by changing only one factorover its range while holding the other factors constant. A steepslope or curvature in a factor shows that the response is sensitive tothat factor [26,37,38]. A relatively flat line shows insensitivity tochange in that particular factor. The present result revealed thatbreakthrough time is more sensitive to initial concentration andadsorbent dose than flow rate.
Optimization using the desirability functions
The possible goals in the Design-Expert software’s are tomaximize, minimize, target, in range and set to an exact value(factors only). In numerical optimization, the desired goal waspreferred for each variable and response from menu [26,34].
Bar plot (Fig. 18) demonstrates the desirability values ofoptimization procedure in which the criterion was set as ‘‘maxi-mum’’ for initial arsenic concentration, ‘‘minimum’’ for Fe–SCC dose,‘‘in range’’ for flow rate and the goal was set as ‘‘maximum’’ toanalyze economically viable optimal condition. The objective of thisprocess was to find the maximum breakthrough time by utilizing lessadsorbent dose. In this, the desirability value ranges from 0.871 to 1for individual variables and 0.988 for combination of all the variables.
By seeking from 100 starting points in the response surfacechanges, the best local maximum breakthrough time was found tobe 682.4 min when the independent variables retained at 3.0 g ofFe–SCC dose, 3600.0 mg/L of initial arsenic concentrations and1.2 mL/min of flow rate at maximum desirability value of 0.988.
Finally, for their validation, duplicate confirmatory columnexperiments were conducted using optimal conditions. Theexperimental value, which coincides well with optimized resultobtained from CCD, suggests that the Fe–SCC may be an effectiveand economically feasible adsorbent for arsenic removal in theaqueous system.
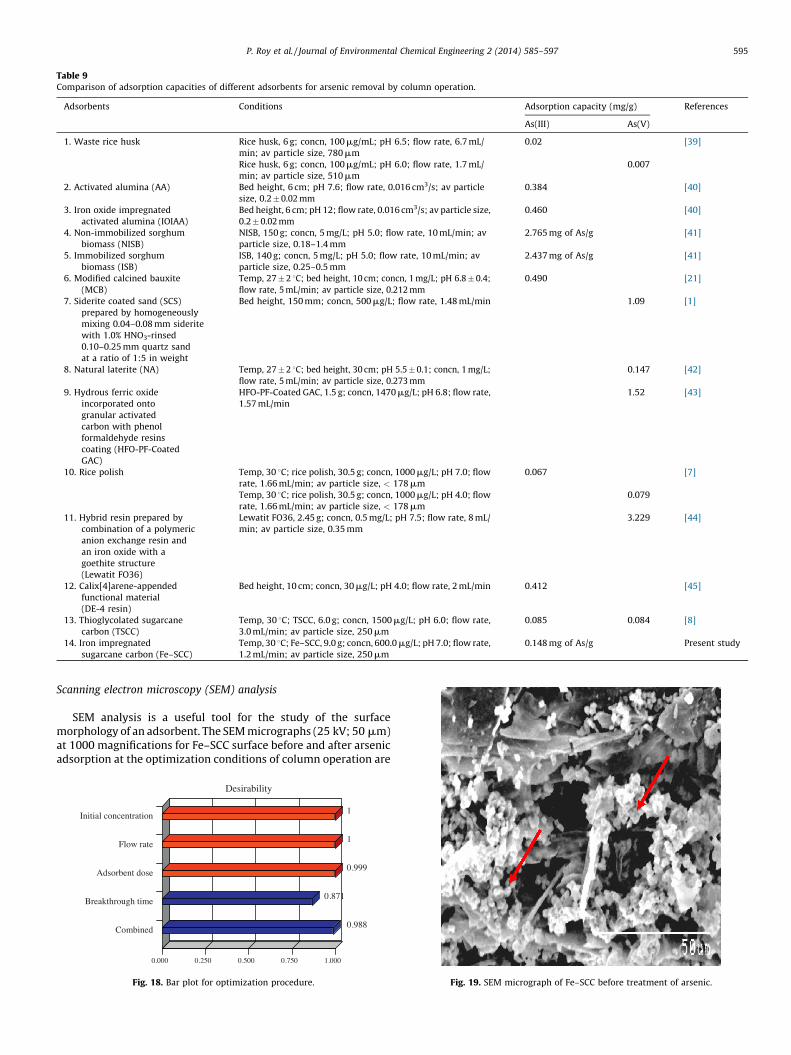
Table 9Comparison of adsorption capacities of different adsorbents for arsenic removal by column operation.
Adsorbents Conditions Adsorption capacity (mg/g) References
As(III) As(V)
1. Waste rice husk Rice husk, 6 g; concn, 100 mg/mL; pH 6.5; flow rate, 6.7 mL/
min; av particle size, 780 mm
0.02 [39]
Rice husk, 6 g; concn, 100 mg/mL; pH 6.0; flow rate, 1.7 mL/
min; av particle size, 510 mm
0.007
2. Activated alumina (AA) Bed height, 6 cm; pH 7.6; flow rate, 0.016 cm3/s; av particle
size, 0.2�0.02 mm
0.384 [40]
3. Iron oxide impregnated
activated alumina (IOIAA)
Bed height, 6 cm; pH 12; flow rate, 0.016 cm3/s; av particle size,
0.2� 0.02 mm
0.460 [40]
4. Non-immobilized sorghum
biomass (NISB)
NISB, 150 g; concn, 5 mg/L; pH 5.0; flow rate, 10 mL/min; av
particle size, 0.18–1.4 mm
2.765 mg of As/g [41]
5. Immobilized sorghum
biomass (ISB)
ISB, 140 g; concn, 5 mg/L; pH 5.0; flow rate, 10 mL/min; av
particle size, 0.25–0.5 mm
2.437 mg of As/g [41]
6. Modified calcined bauxite
(MCB)
Temp, 27�2 8C; bed height, 10 cm; concn, 1 mg/L; pH 6.8� 0.4;
flow rate, 5 mL/min; av particle size, 0.212 mm
0.490 [21]
7. Siderite coated sand (SCS)
prepared by homogeneously
mixing 0.04–0.08 mm siderite
with 1.0% HNO3-rinsed
0.10–0.25 mm quartz sand
at a ratio of 1:5 in weight
Bed height, 150 mm; concn, 500 mg/L; flow rate, 1.48 mL/min 1.09 [1]
8. Natural laterite (NA) Temp, 27�2 8C; bed height, 30 cm; pH 5.5� 0.1; concn, 1 mg/L;
flow rate, 5 mL/min; av particle size, 0.273 mm
0.147 [42]
9. Hydrous ferric oxide
incorporated onto
granular activated
carbon with phenol
formaldehyde resins
coating (HFO-PF-Coated
GAC)
HFO-PF-Coated GAC, 1.5 g; concn, 1470 mg/L; pH 6.8; flow rate,
1.57 mL/min
1.52 [43]
10. Rice polish Temp, 30 8C; rice polish, 30.5 g; concn, 1000 mg/L; pH 7.0; flow
rate, 1.66 mL/min; av particle size, < 178 mm
0.067 [7]
Temp, 30 8C; rice polish, 30.5 g; concn, 1000 mg/L; pH 4.0; flow
rate, 1.66 mL/min; av particle size, < 178 mm
0.079
11. Hybrid resin prepared by
combination of a polymeric
anion exchange resin and
an iron oxide with a
goethite structure
(Lewatit FO36)
Lewatit FO36, 2.45 g; concn, 0.5 mg/L; pH 7.5; flow rate, 8 mL/
min; av particle size, 0.35 mm
3.229 [44]
12. Calix[4]arene-appended
functional material
(DE-4 resin)
Bed height, 10 cm; concn, 30 mg/L; pH 4.0; flow rate, 2 mL/min 0.412 [45]
13. Thioglycolated sugarcane
carbon (TSCC)
Temp, 30 8C; TSCC, 6.0 g; concn, 1500 mg/L; pH 6.0; flow rate,
3.0 mL/min; av particle size, 250 mm
0.085 0.084 [8]
14. Iron impregnated
sugarcane carbon (Fe–SCC)
Temp, 30 8C; Fe–SCC, 9.0 g; concn, 600.0 mg/L; pH 7.0; flow rate,
1.2 mL/min; av particle size, 250 mm
0.148 mg of As/g Present study
[(Fig._19)TD$FIG]
P. Roy et al. / Journal of Environmental Chemical Engineering 2 (2014) 585–597 595
Scanning electron microscopy (SEM) analysis
SEM analysis is a useful tool for the study of the surfacemorphology of an adsorbent. The SEM micrographs (25 kV; 50 mm)at 1000 magnifications for Fe–SCC surface before and after arsenicadsorption at the optimization conditions of column operation are[(Fig._18)TD$FIG]
1
1
0.999
0.871
0.988
Desirability
0.000 0.250 0.500 0.750 1.000
Initial concentration
Flow rate
Adsorbent dose
Breakthrough time
Combined
Fig. 18. Bar plot for optimization procedure. Fig. 19. SEM micrograph of Fe–SCC before treatment of arsenic.

[(Fig._20)TD$FIG]
Fig. 20. SEM micrograph of Fe–SCC after treatment of arsenic in column experiment.
P. Roy et al. / Journal of Environmental Chemical Engineering 2 (2014) 585–597596
shown in Figs. 19 and 20, respectively. Fig. 19 clearly shows thepresence of porous, rough, and irregular surface morphology of theunloaded Fe–SCC. The surface roughness of an unloaded adsorbentindicated the availability of a tremendous surface area of Fe–SCCmeant for high adsorption capacity in the adsorption process[8,12,18]. Contrary to this, after adsorption, the adsorbent surfaceseemed to have decreased porosity due to the heavy impregnationof arsenic onto the surface of the Fe–SCC (Fig. 20).
Reusability of the adsorbent
A successful adsorption process operation requires multiplereuses of the adsorbent that greatly reduces the process cost andalso decreases the dependency of the process on a continuoussupply of adsorbents [3,7]. In the regeneration study, Fe–SCC wasreused for three adsorption-desorption cycles at 1.2 mL/min. Theadsorption study was performed at optimal conditions of 1.2 mL/min flow rate, 3.0 g Fe–SCC dose and 3600.0 mg/L initialconcentration of arsenic. Since maximum arsenic adsorption incolumn experiments was studied at pH 7.0, elution for desorptionstudy was attempted using both acidic (HCl) and basic (NaOH)solutions (from 0.5 to 5.0 M). Preliminary study on desorption ofarsenic using HCl from 0.5 to 5.0 M indicate that the desorptionefficiency of arsenic from Fe–SCC is approximately 4–16%.However, it was found that with increase in concentration ofNaOH solutions, the desorption increased and more than 93% ofarsenic were desorbed from Fe–SCC using 5.0 M NaOH solution.And the weight loss of the adsorbent was insignificant at the end ofdesorption.
Conclusions
The study revealed that Fe–SCC could be an efficaciousadsorbent in the removal of arsenic from water. Under optimizedconditions (Fe–SCC dose 0.25 g, initial arsenic concentration100 mg/L, contact time 30 min, pH 7.0, temperature 40 8C, agitationspeed 500 rpm), the maximum removal of arsenic was 94.5%. ANNmodel was applied upon batch experimental values to provide thereasonable predictive performance of the adsorbent. The findingsindicate that the model provides reasonable predictive perfor-mance (R2 = 0.963; 0.964) of arsenic adsorption and workssatisfactorily with an average relative error of 0.040 and sum
square error of 1.147 during testing phase to predict the adsorptionprocess with reasonable accuracy. Importance analysis of thedeveloped ANN showed that the adsorbent dose was the mostsignificant parameter. The study on equilibrium adsorptionrevealed that Langmuir isotherm model gave the best fit toexperimental data. The nature of adsorption of arsenic by Fe–SCCwas physisorption as inferred from the D–R isotherm model. Theadsorption is pseudo second-order, exothermic and spontaneous.The effects of initial arsenic concentration, flow rate and adsorbentdose on the breakthrough time for column operation weredesigned by CCD. The CCD suggested quadratic model wasvalidated by ANOVA. The experimental values were found to bein good agreement with the values predicted by the model. Theinfluence of the experimental variables and their interaction onbreakthrough time was projected by contour and perturbationplots. The variables were found to have significant effects on thebreakthrough time. The optimized result obtained from CCDrevealed that the Fe–SCC is an effective and economically feasibleadsorbent. Desorption study with 0.5 M NaOH exhibits desorptionefficiencies of greater than 93% for the three adsorption-desorptioncycles. Overall, it can be concluded that the application ofstatistical model is an effective approach for optimization,modeling and designing the arsenic adsorption process. The datapresented in this investigation can be further extrapolated fordesigning and establishing an efficient arsenic removal plan whiletreating the groundwater that might have contaminated.
Acknowledgements
Authors are extending their sincere gratitude to Professor (Dr.)J.K. Datta, Department of Environmental Science, The University ofBurdwan, for his moral support and valuable suggestion forpreparing this manuscript.
References
[1] H. Guo, D. Stuben, Z. Berner, Adsorption of arsenic(III) and arsenic(V) fromgroundwater using natural siderite as the adsorbent, J. Colloid Interface Sci.315 (2007) 47–53.
[2] D. Mohan, C.U. Pittman Jr., Arsenic removal from water/wastewater usingadsorbents – a critical review, J. Hazard. Mater. 142 (2007) 1–53.
[3] K. Vijayaraghavan, M. Arun, U.M. Joshi, R. Balasubramanian, Biosorption of As(V)onto the shells of the Crab (Portunus sanguinolentus): equilibrium and kineticstudies, Ind. Eng. Chem. Res. 48 (2009) 3589–3594.
[4] J.A. Baig, T.G. Kazi, A.Q. Shah, G.A. Kandhro, H.I. Afridi, S. Khan, N.F. Kolachi,Biosorption studies on powder of stem of Acacia nilotica: removal of arsenic fromsurface water, J. Hazard. Mater. 178 (2010) 941–948.
[5] Y. Wu, Y. Wen, J. Zhou, Q. Dai, Y. Wu, The characteristics of waste Saccharomycescerevisiae biosorption of arsenic(III), Environ. Sci. Pollut. Res. 19 (2012) 3371–3379.
[6] S.V. Flanagan, R.B. Johnston, Y. Zheng, Arsenic in tube well water in Bangladesh:health and economic impacts and implications for arsenic mitigation, Bull. WorldHealth Organ. 90 (2012) 839–846.
[7] D. Ranjan, M. Talat, S.H. Hasan, Rice polish: an alternative to conventionaladsorbents for treating arsenic bearing water by up-flow column method, Ind.Eng. Chem. Res. 48 (2009) 10180–10185.
[8] P. Roy, N.K. Mondal, S. Bhattacharya, B. Das, K. Das, Removal of arsenic(III) andarsenic(V) on chemically modified low-cost adsorbent: batch and column opera-tions, Appl. Water Sci. 3 (2013) 293–309.
[9] P.K. Pandey, S. Choubey, Y. Verma, M. Pandey, K. Chandrashekhar, Biosorptiveremoval of arsenic from drinking water, Bioresour. Technol. 100 (2009) 634–637.
[10] K.S. Prasad, P. Srivastava, V. Subramanian, J. Paul, Biosorption of As(III) ion onRhodococcus sp. WB-12: biomass characterization and kinetic studies, Sep. Sci.Technol. 46 (2011) 2517–2525.
[11] C. Pennesi, F. Veglio, C. Totti, T. Romagnoli, F. Beolchini, Nonliving biomassof marine macrophytes as arsenic(V) biosorbents, J. Appl. Phycol. 24 (2012)1495–1502.
[12] S. Kamsonlian, S. Suresh, C.B. Majumder, S. Chand, Biosorption of arsenic fromcontaminated water onto solid Psidium guajava leaf surface: equilibrium, kinetics,thermodynamics, and desorption study, Biorem. J. 16 (2012) 97–112.
[13] S. Nigam, K. Gopal, P.S. Vankar, Biosorption of arsenic in drinking waterby submerged plant: Hydrilla verticilata, Environ. Sci. Pollut. Res. 20 (2013)4000–4008.
[14] S. Nigam, P.S. Vankar, K. Gopal, Biosorption of arsenic from aqueous solution usingdye waste, Environ. Sci. Pollut. Res. 20 (2013) 1161–1172.
P. Roy et al. / Journal of Environmental Chemical Engineering 2 (2014) 585–597 597
[15] A.K. De, Environmental Chemistry, 6th ed., New Age International, New Delhi,2008.
[16] K.A. Krishnan, K.G. Sreejalekshmi, R.S. Baiju, Nickel(II) adsorption onto biomassbased activated carbon obtained from sugarcane bagasse pith, Bioresour. Technol.102 (2011) 10239–10247.
[17] A. Maiti, J.K. Basu, S. De, Experimental and kinetic modeling of As(V) and As(III)adsorption on treated laterite using synthetic and contaminated groundwater:effects of phosphate, silicate and carbonate ions, Chem. Eng. J. 191 (2012) 1–12.
[18] B. Das, N.K. Mondal, R. Bhaumik, P. Roy, Insight into adsorption equilibrium,kinetics and thermodynamics of lead onto alluvial soil, Int. J. Environ. Sci. Technol.(2013), http://dx.doi.org/10.1007/s13762-013-0279-z.
[19] N.K. Amin, Removal of reactive dye from aqueous solutions by adsorption ontoactivated carbons prepared from sugarcane bagasse pith, Desalination 223 (2008)152–161.
[20] Q.L. Zhang, Y.C. Lin, X. Chen, N.Y. Gao, A method for preparing ferric activatedcarbon composites adsorbents to remove arsenic from drinking water, J. Hazard.Mater. 148 (2007) 671–678.
[21] P.B. Bhakat, A.K. Gupta, S. Ayoob, Feasibility analysis of As(III) removal in acontinuous flow fixed bed system by modified calcined bauxite (MCB), J. Hazard.Mater. B139 (2007) 286–292.
[22] A. Gupta, N. Sankararamakrishnan, Column studies on the evaluation of novelspacer granules for the removal of arsenite and arsenate from contaminatedwater, Bioresour. Technol. 101 (2010) 2173–2179.
[23] P. King, K. Anuradha, S.B. Lahari, Y. Prasanna Kumar, V.S. Prasad, Biosorption ofzinc from aqueous solution using Azadirachta indica bark: equilibrium and kineticstudies, J. Hazard. Mater. 152 (2008) 324–329.
[24] C.Y. Chen, T.H. Chang, J.T. Kuo, Y.F. Chen, Y.C. Chung, Characteristics of molybdate-impregnated chitosan beads (MICB) in terms of arsenic removal from water andthe application of a MICB-packed column to remove arsenic from wastewater,Bioresour. Technol. 16 (2008) 7487–7494.
[25] Y.Y. Chang, S.M. Lee, J.K. Yang, Removal of As(III) and As(V) by natural andsynthetic metal oxides, Colloids and Surfaces A: Physicochem. Eng. Aspects346 (2009) 202–207.
[26] M.P.S. Kumar, B.R. Phanikumar, Response surface modelling of Cr6+ adsorptionfrom aqueous solution by neem bark powder: Box–Behnken experimental ap-proach, Environ. Sci. Pollut. Res. 20 (2013) 1327–1343.
[27] A.N.S. Saqib, A. Waseem, A.F. Khan, Q. Mahmood, A. Khan, A. Habib, A.R. Khan,Arsenic bioremediation by low cost materials derived from Blue Pine (Pinuswallichiana) and Walnut (Juglans regia), Ecol. Eng. 51 (2013) 88–94.
[28] H.H. Sokker, N.M. El-Sawy, M.A. Hassan, B.E. El-Anadouli, Adsorption of crude oilfrom aqueous solution by hydrogel of chitosan based polyacrylamide prepared byradiation induced graft polymerization, J. Hazard. Mater. 190 (2011) 359–365.
[29] M.R. Samani, S.M. Borghei, A. Olad, M.J. Chaichi, Removal of chromium fromaqueous solution using polyaniline–poly ethylene glycol composite, J. Hazard.Mater. 184 (2010) 248–254.
[30] F. Kanwal, R. Rehman, T. Mahmud, J. Anwar, R. Ilyas, Isothermal and thermody-namical modeling of chromium(III) adsorption by composites of polyaniline withrice husk and saw dust, J. Chil. Chem. Soc. 57 (2012) 1058–1063.
[31] S. De, A. Maiti, Arsenic Removal from Contaminated Groundwater, 1st ed., TheEnergy and Resources Institute (TERI), New Delhi, 2012.
[32] K.R. Raj, A. Kardam, J.K. Arora, S. Srivastava, An application of ANN modeling onthe biosorption of arsenic, Waste Biomass Valor. 4 (2013) 401–407.
[33] A.K. Giri, R.K. Patel, S.S. Mahapatra, Artificial neural network (ANN) approach formodelling of arsenic (III) biosorption from aqueous solution by living cells ofBacillus cereus biomass, Chem. Eng. J. 178 (2011) 15–25.
[34] S. Chowdhury, S. Chakraborty, P.D. Saha, Response surface optimization of adynamic dye adsorption process: a case study of crystal violet adsorption ontoNaOH-modified rice husk, Environ. Sci. Pollut. Res. 20 (2013) 1698–1705.
[35] Y. Abdollahi, A. Zakaria, K.A. Matori, K. Shameli, H. Jahangirian, M. Rezayi, T.Abdollahi, Interactions between photodegradation components, Chem. Cent. J. 6(2012), http://dx.doi.org/10.1186/1752-153X-6-100.
[36] D.C. Montgomery, Design and Analysis of Experiments, 7th ed., Wiley, New York,2008.
[37] S. Chattoraj, B. Sadhukhan, N.K. Mondal, Predictability by Box–Behnken model forcarbaryl adsorption by soils of Indian origin, J. Environ. Sci. Health B 48 (2013)626–636.
[38] M. Bimakr, R.A. Rahman, F.S. Taip, N.M. Adzahan, M.Z.I. Sarker, A. Ganjloo,Supercritical carbon dioxide extraction of seed oil from Winter Melon (Benincasahispida) and its antioxidant activity and fatty acid composition, Molecules 18(2013) 997–1014.
[39] M.N. Amin, S. Kaneco, T. Kitagawa, A. Begum, H. Katsumata, T. Suzuki, K. Ohta,Removal of arsenic in aqueous solutions by adsorption onto waste rice husk, Ind.Eng. Chem. Res. 45 (2006) 8105–8110.
[40] T.S. Singh, K.K. Pant, Experimental and modelling studies on fixed bed adsorptionof As(III) ions from aqueous solution, Sep. Purif. Technol. 48 (2006) 288–296.
[41] N. Haque, G.M. Morrison, G. Perrusquia, M. Gutierrez, A.F. Aguilera, I. Cano-Aguilera, J.L. Gardea-Torresdey, Characteristics of arsenic adsorption to sorghumbiomass, J. Hazard. Mater. 145 (2007) 30–35.
[42] A. Maiti, S. DasGupta, J.K. Basu, S. De, Batch and column study: adsorption ofarsenate using untreated laterite as adsorbent, Ind. Eng. Chem. Res. 47 (2008)1620–1629.
[43] J.M. Zhuang, E. Hobenshield, T. Walsh, Arsenate sorption by hydrous ferric oxideincorporated onto granular activated carbon with phenol formaldehyde resinscoating, Environ. Technol. 29 (2008) 401–411.
[44] M.R. Boldaji, R. Nabizadeh, M.H. Dehghani, K. Nadafi, A.H. Mahvi, Evaluating theperformance of iron nanoparticle resin in removing arsenate from water,J. Environ. Sci. Health. Part A Toxic/Hazard Subst. Environ. Eng. 45 (2010)946–950.
[45] I. Qureshi, S. Memon, Synthesis and application of calixarene-based functionalmaterial for arsenic removal from water, Appl. Water Sci. 2 (2012) 177–186.
Copyright © 2022 FDOKUMEN