A phase-space beam position monitor for synchrotron radiation
Upload
charite-deCategory
view
0download
0
Phys. Status Solidi B 247, No. 8, 1925–1931 (2010) / DOI 10.1002/pssb.200983945 p s sb
statu
s
soli
di
hysi
ca
Synchrotron infrared spectroscopicellipsometry for characterization of biofunctional surfaces
Guoguang Sun1, Dana Maria Rosu1, Xin Zhang2, Marc Hovestadt3,4, Simona Pop1, Ulrich Schade5,Dennis Aulich5, Michael Gensch5, Bernhard Ay3, Hermann-Georg Holzhutter4, Dietrich R. T. Zahn6,Norbert Esser3, Rudolf Volkmer3, Jorg Rappich2, and Karsten Hinrichs*,1
basic solid state physicswww.pss-b.comp
1 Department Berlin, Leibniz-Institut fur Analytische Wissenschaften – ISAS – e.V., Albert-Einstein-Str. 9, 12489 Berlin, Germany2 Helmholtz-Zentrum Berlin fur Materialien und Energie GmbH, Institut fur Si-Photovoltaik, Kekulestr. 5, 12489 Berlin, Germany3 Charite Universitatsmedizin Berlin, Institut fur Medizinische Immunologie, Abteilung Molekulare Bibliotheken, Hessische Str. 3-4,
10115 Berlin, Germany4 Institute of Biochemistry, University Medicine Berlin-Charite, Monbijoustr. 2, 10117 Berlin, Germany5 Helmholtz-Zentrum Berlin fur Materialien und Energie GmbH, BESSY II, Albert-Einstein-Str. 15, 12489 Berlin, Germany6 Chemnitz University of Technology, Semiconductor Physics, 09107 Chemnitz, Germany
Received 16 October 2009, accepted 24 February 2010
Published online 15 June 2010
Keywords adsorbates, biosensors, infrared ellipsometry, infrared spectra, peptides, surfaces and interfaces, thin films
* Corresponding author: e-mail [email protected], Phone: þ49 30 6392 3541, Fax: þ49 30 6392 3544
The structural and thickness homogeneity of different biofunc-
tional surfaces after coating an Au substrate was studied by
infrared spectroscopic ellipsometry (IRSE). Monolayer cover-
age was achieved by washing the samples in aqueous solution.
A selected cysteine-modified CHL peptide and an anti-
glutathione S-transfer (GST) antibody produced a characteristic
change in the IR ellipsometric spectra after peptide and
antibody adsorption, confirming the biosensing ability of this
technique. IR ellipsometric mapping at the synchrotron storage
ring BESSY II in Berlin allowed laterally resolved character-
ization of the protein films. The IR ellipsometric tanC and D
maps revealed that the protein films are inhomogeneous in
structure and thickness after adsorption of the peptide and
antibody. The absolute thickness of the protein films varied
considerably by up to 3 to 7 nm. We also studied cytosine films
with different thicknesses (d¼ 58 nm and 125 nm) and a
guanine film (d¼ 84 nm). For the two cytosine films the
synchrotron spectra revealed that the thicker film in particular
was rather homogeneous in thickness but inhomogeneous in
structure. For the guanine film the shape of vibrational bands in
the ellipsometric spectra correlated with anisotropic molecular
orientations.
� 2010 WILEY-VCH Verlag GmbH & Co. KGaA, Weinheim
1 Introduction Recently, the use of biosensing sur-faces has increased in various fields, including biotechnol-ogy, biomedical, pharmaceutical, and environmentalapplications, health-related diagnostics, the food industryand even national security, mainly due to their specificity,high sensitivity, and rather low sample requirements [1–2].
So far various surface-sensitive methods have beenapplied to study biosensors on different substrates, such asatomic force microscopy [3–4], scanning electron micro-scopy [3, 5–6], Fourier-transform infrared reflection-absorp-tion spectroscopy (FT-IRRAS) [3, 7–8], surface plasmonresonance [9–10], X-ray photoelectron spectroscopy (XPS)[11–12], and impedance spectroscopy [13].
Biosensing surfaces can be build up for specificmolecular recognition. Molecular recognition is for example
observed for pairs of large molecules like protein/antibody aswell as for pairs of smaller biomolecules such as the DNAbases like cytosine and guanine. Hydrogen bonding plays aubiquitous role in molecular recognition [14] of DNA baseparing. In DNA, adenine and thymine or cytosine andguanine form hydrogen-bonded base pairs. Recently, scan-ning tunnelling microscopy demonstrated hydrogen bond-ing-based molecular recognition [14]. These effects providea new mechanism for designing sensors that transduce amolecular recognition event into an electronic signal [14].
In this work, infrared spectroscopic ellipsometry (IRSE)performed in the laboratory and at the synchrotron storagering BESSY II was used to characterize various biofunc-tional surfaces and peptide adsorption. Not only did it proveto be a technique with high detection sensitivity, but
� 2010 WILEY-VCH Verlag GmbH & Co. KGaA, Weinheim

1926 G. Sun et al.: Synchrotron IRSE for characterization of biofunctional surfacesp
hys
ica ssp st
atu
s
solid
i b
Figure 1 (online color at: www.pss-b.com) Scheme of the ellipso-metric principle [30, 31]. Linear polarized radiation becomeselliptically polarized after reflection at the sample’s surface.
compared to other traditional methods such as XPS, IRSE isnon-destructive, contact-free and does not depend on specialrequirements such as (ultrahigh) vacuum [15]. The exclusiveadvantage of IRSE is measuring at least two independentellipsometric parameters, which can be related via opticalsimulations directly to the optical constants and thicknessesof the films studied. Since s- and p-polarized reflectancemeasurements can also be included, this provides anadvantage compared to traditional FT-IRRAS and ATRspectroscopy. Similar to other IR methods, IR bandsassociated with vibrations of specific molecular groups arealso observed in the IRSE spectra, allowing one to studysurface structure, anisotropy, and molecular orientations[16–19]. Here, we used IRSE to examine peptide andantibody layers, as well as cytosine und guanine films. Thelayer homogeneity was further investigated by IR synchro-tron mapping ellipsometry [20–23].
Characteristic protein absorption bands, so-called amidebands were found in the mid-infrared spectral range. Theamide A band at 3330 cm�1 is due to N–H stretching vibration[24]. The absorption bands from 1600 to 1700, 1510 to 1580,and 1200 to 1350 cm�1 are assigned to amide I, II and IIIbands, respectively [24]. The amide I band is mainly related toC––O vibrations, although also partly to C–N and C–C–Ndeformation vibrations, while amide II is a highly mixed modearising from in-plane components of N–H deformationvibrations and stretching vibrations of C–N [24].
The key feature for using IR spectroscopy to studyproteins is that the amide bands depend on the proteinsecondary structure [24]. In some cases the frequency andamplitude of amide I bands correlate with structure [24, 25].For smaller biomolecules such as the DNA bases cytosineand guanine, vibrational bands can be assigned to vibrationsinvolving specific molecular groups, e.g. NH2 and C––O,whose location within the molecular geometry is specified.However, the vibrational band assignment for cytosine is stillcontroversial [26–29].
2 Experiments2.1 Preparation2.1.1 Protein films Au (180 nm) / Cr (5–7 nm) / glass
was used as a substrate for the grafting process. A peptidewith the sequence C-ßA-ßA-LAKDLIVPRR was used,subsequently referred to as cysteine modified CHL peptide.The cysteine modified CHL peptide was immobilized on N-(2-carboxyethyl) maleimide functionalized Au surfaces byimmersion in the peptide solution (0.1 mM in TBS buffer,pH¼ 8) for 12 h. After rinsing the surfaces with buffersolution several times, the samples were immersed in anti-GST antibody for 12 h. Again, the surfaces were rinsed withTBS buffer solution several times and dried in a N2 stream.After each preparation step the samples were immediatelymeasured by IRSE. The apparatus was purged with dry air.Au substrates with a roughness of about 1.6 nm were used.A 180 nm Au film with a 5–7 nm Cr co-adhesive layerunderneath was deposited on microscope glass slides byphysical vapor evaporation and used as the solid substrate.
� 2010 WILEY-VCH Verlag GmbH & Co. KGaA, Weinheim
2.1.2 Cytosine and guanine films Flat p-type (B-doped) silicon (111) surfaces with resistivity in the range of 1to 30Vcm were used as substrates. The one-side polished flatsilicon substrates were provided by Wacker Siltronic. Priorto biomolecular deposition, the substrates were hydrogenterminated via a wet-chemical procedure. The flat substrateswere first degreased in isopropanol and deionized (DI) waterin order to remove organic contaminants. Afterwards thesubstrates were dipped in HF (40%) solution for 2 min toremove the natural oxide and subsequently hydrogenterminated at the surface by saturating the exposed bonds.This procedure results in a surface roughness of about 4 A asdetermined from XRR measurements.
High purity (99þ%) cytosine and guanine powderswere purchased from Across Organics. The materials wereevaporated under UHV conditions from Knudsen cells at410 K with an evaporation rate of 0.3 nm/min in the case ofcytosine, and at 510 K with an evaporation rate of 2 nm/minfor guanine. Evaporation rates were monitored via a quartzcrystal microbalance and ex situ calibrated via AFMmeasurements of the film thicknesses [26].
2.2 Infrared spectroscopic ellipsometry(IRSE) Figure 1 shows the principle of ellipsometry. Moredetails about IRSE can be found in Ref [30].
Generally, linearly polarized radiation becomes ellipti-cally polarized upon reflection. This state of polarization canbe described by two ellipsometric parameters: amplituderatio (tanC) and phase shift difference (D) of the twoorthogonally polarized components of the reflected wave (rs
and rp), see Fig. 1. The ellipsometric parameters are definedby the quantity r, which is the ratio of the complex reflectioncoefficients rp and rs:
r ¼ rprs
¼ tanCeiD: (1)
IRSE measurements were performed using a photo-metric ellipsometer in the mid-IR spectral range (4000 to400 cm�1), which was attached to a Bruker 66 or Vertex 70
www.pss-b.com
Phys. Status Solidi B 247, No. 8 (2010) 1927
Original
Paper
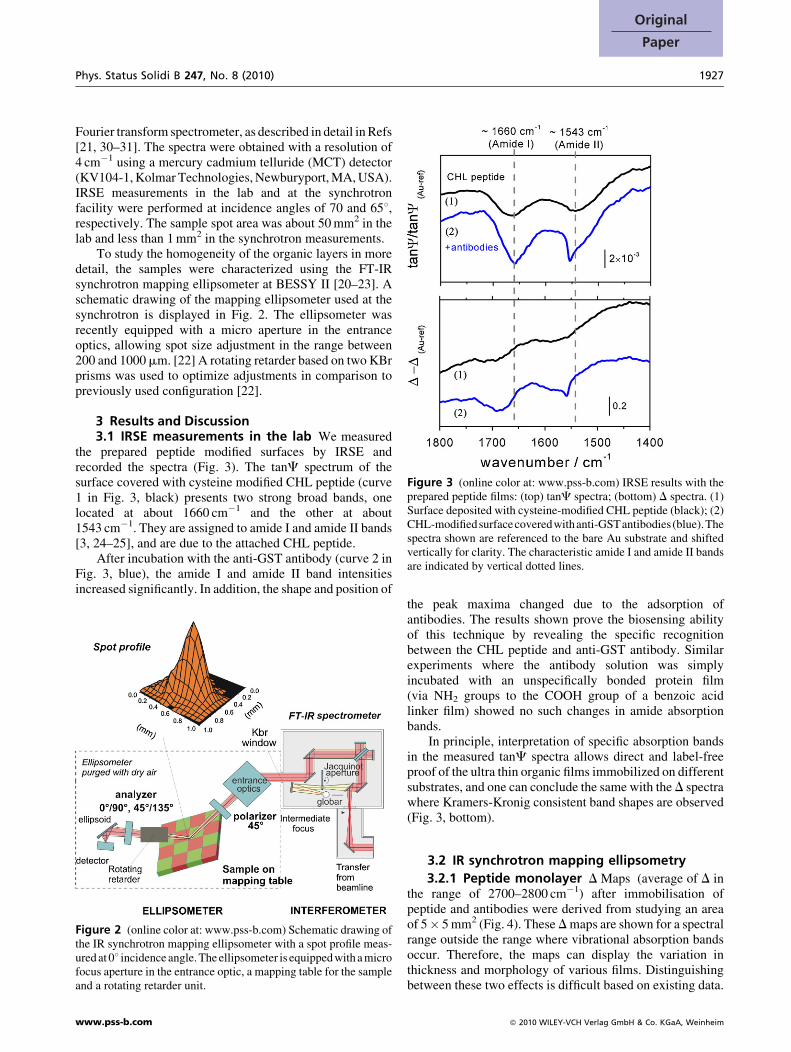
Figure 3 (online color at: www.pss-b.com) IRSE results with theprepared peptide films: (top) tanC spectra; (bottom) D spectra. (1)Surface deposited with cysteine-modified CHL peptide (black); (2)CHL-modifiedsurfacecoveredwithanti-GSTantibodies (blue).Thespectra shown are referenced to the bare Au substrate and shiftedvertically for clarity. The characteristic amide I and amide II bandsare indicated by vertical dotted lines.
Fourier transform spectrometer, as described in detail in Refs[21, 30–31]. The spectra were obtained with a resolution of4 cm�1 using a mercury cadmium telluride (MCT) detector(KV104-1, Kolmar Technologies, Newburyport, MA, USA).IRSE measurements in the lab and at the synchrotronfacility were performed at incidence angles of 70 and 658,respectively. The sample spot area was about 50 mm2 in thelab and less than 1 mm2 in the synchrotron measurements.
To study the homogeneity of the organic layers in moredetail, the samples were characterized using the FT-IRsynchrotron mapping ellipsometer at BESSY II [20–23]. Aschematic drawing of the mapping ellipsometer used at thesynchrotron is displayed in Fig. 2. The ellipsometer wasrecently equipped with a micro aperture in the entranceoptics, allowing spot size adjustment in the range between200 and 1000mm. [22] A rotating retarder based on two KBrprisms was used to optimize adjustments in comparison topreviously used configuration [22].
3 Results and Discussion3.1 IRSE measurements in the lab We measured
the prepared peptide modified surfaces by IRSE andrecorded the spectra (Fig. 3). The tanC spectrum of thesurface covered with cysteine modified CHL peptide (curve1 in Fig. 3, black) presents two strong broad bands, onelocated at about 1660 cm�1 and the other at about1543 cm�1. They are assigned to amide I and amide II bands[3, 24–25], and are due to the attached CHL peptide.
After incubation with the anti-GST antibody (curve 2 inFig. 3, blue), the amide I and amide II band intensitiesincreased significantly. In addition, the shape and position of
Figure 2 (online color at: www.pss-b.com) Schematic drawing ofthe IR synchrotron mapping ellipsometer with a spot profile meas-ured at 08 incidence angle. The ellipsometer is equipped with a microfocus aperture in the entrance optic, a mapping table for the sampleand a rotating retarder unit.
www.pss-b.com
the peak maxima changed due to the adsorption ofantibodies. The results shown prove the biosensing abilityof this technique by revealing the specific recognitionbetween the CHL peptide and anti-GST antibody. Similarexperiments where the antibody solution was simplyincubated with an unspecifically bonded protein film(via NH2 groups to the COOH group of a benzoic acidlinker film) showed no such changes in amide absorptionbands.
In principle, interpretation of specific absorption bandsin the measured tanC spectra allows direct and label-freeproof of the ultra thin organic films immobilized on differentsubstrates, and one can conclude the same with the D spectrawhere Kramers-Kronig consistent band shapes are observed(Fig. 3, bottom).
3.2 IR synchrotron mapping ellipsometry
3.2.1 Peptide monolayer D Maps (average of D inthe range of 2700–2800 cm�1) after immobilisation ofpeptide and antibodies were derived from studying an areaof 5� 5 mm2 (Fig. 4). These D maps are shown for a spectralrange outside the range where vibrational absorption bandsoccur. Therefore, the maps can display the variation inthickness and morphology of various films. Distinguishingbetween these two effects is difficult based on existing data.
� 2010 WILEY-VCH Verlag GmbH & Co. KGaA, Weinheim

1928 G. Sun et al.: Synchrotron IRSE for characterization of biofunctional surfacesp
hys
ica ssp st
atu
s
solid
i b
Figure 4 (online color at: www.pss-b.com)Dmaps for single stepsin the production of the biosensor (a) CHL peptide; (b) anti-GSTantibody. For the maps the average of D in the range of 2700–2800 cm�1 was used.
Assuming that the variation in D is only caused by athickness change, the maps could be interpreted as thicknesschanges in the films. The variation in D is smaller thanapprox. 0.6–0.88 for the peptide film. Assuming a highfrequency refractive index of about 1.5 at an incidence angleof 658 and a gold substrate, aD variation of 0.78 at 2750 cm�1
would correspond to a thickness change of about 3.3 nm. Tofurther estimate thickness changes, it might be helpful tolook in more detail at the tanC amplitude of characteristicbands (amide I at 1683 cm�1 for the peptide and antibody).Corresponding maps are shown in Fig. 5. For an isotropicfilm the band amplitudes can correlate with the variation inD. However, such a correlation between the tanC andDmapswas not found. Therefore, the observed inhomogeneities
Figure 5 (online color at: www.pss-b.com) tanC maps for singlesteps in the preparation of the biosensor: (a) CHL peptide; (b) anti-GST antibody. For the maps the amplitude of the amide I band wasused. The maps correspond to tanC values at 1683 cm�1.
� 2010 WILEY-VCH Verlag GmbH & Co. KGaA, Weinheim
cannot be explained simply by thickness changes. Mostlikely, the protein films contain structural inhomogeneities.
In conclusion, these experiments show that the bindingof the antibody can be studied successfully. This is the firsttime that the homogeneity of ultra thin peptide films of abiosensor has been studied by IRSE. However, reliablydetermining the optical constants, especially for theadsorbed peptides, is not yet possible for such films due tothe considerable inhomogeneity in thickness and structure.
Selected spectra for single preparation steps of thebiosensor were recorded with the initial linker surface, thepeptide covered surface and the sample after incubation withthe antibody (Fig. 6). The initial linker surface shows acharacteristic band of the C––O stretching vibration above1700 cm�1 and weak peaks above 1600 cm�1. These weakbands are most likely due to phenyl ring vibrations of theinitial linker film. After binding the CHL peptide (asdescribed before), vibrational bands due to amide I andamide II vibrations are identified at 1670–1675 and1528 cm�1. Some variations in amplitude and frequencyare also observed. After the surface was immersed in the anti-GST antibody solution, not only did the amplitudes of theamide I and II bands change significantly, but also thefrequencies. Amide I band is found at 1644–1649 cm�1 andamide II band is between 1541 and 1551 cm�1. Additionally,it also can be seen that the amplitudes and frequencies ofamide I and amide II bands are clearly different for theparticular spots.
3.2.2 Thin cytosine and guanine films We sub-sequently analyzed two cytosine films with differentthicknesses and an anisotropic guanine film on silicon usingthe synchrotron mapping ellipsometer. The molecularstructures of cytosine and guanine are shown in Fig. 7. For
Figure 6 (online color at: www.pss-b.com) tanC spectra for fivespots along a 5 mm line in the x-direction with 1 mm spacing of thecenter of the spots for single preparation steps of the biosensor. Forcomparison the spectrum of the original linker film is shown on theleft. The spectrum after treatment with CHL peptide solution isshown in the middle and after incubation with anti-GST antibodysolution on the right.
www.pss-b.com
Phys. Status Solidi B 247, No. 8 (2010) 1929
Original
Paper
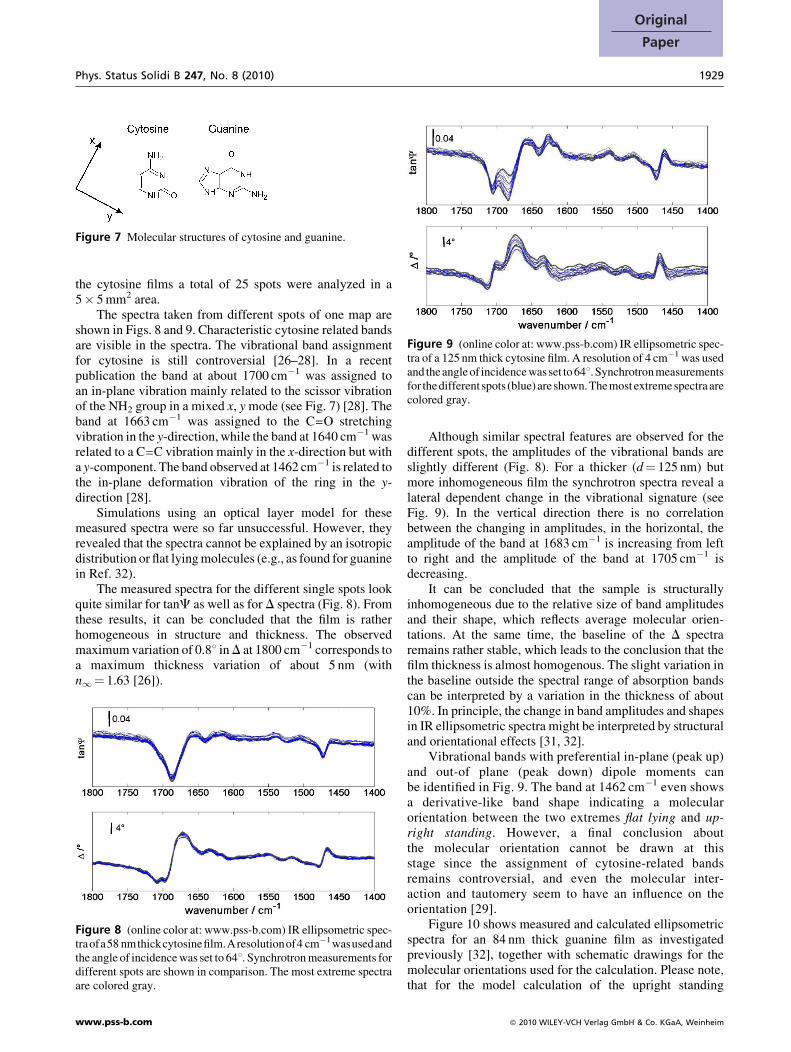
Figure 7 Molecular structures of cytosine and guanine.
Figure 9 (online color at: www.pss-b.com) IR ellipsometric spec-tra of a 125 nm thick cytosine film. A resolution of 4 cm�1 was usedand the angle of incidence was set to648. Synchrotronmeasurementsfor the different spots (blue)are shown.Themost extreme spectra arecolored gray.
the cytosine films a total of 25 spots were analyzed in a5� 5 mm2 area.
The spectra taken from different spots of one map areshown in Figs. 8 and 9. Characteristic cytosine related bandsare visible in the spectra. The vibrational band assignmentfor cytosine is still controversial [26–28]. In a recentpublication the band at about 1700 cm�1 was assigned toan in-plane vibration mainly related to the scissor vibrationof the NH2 group in a mixed x, y mode (see Fig. 7) [28]. Theband at 1663 cm�1 was assigned to the C––O stretchingvibration in the y-direction, while the band at 1640 cm�1 wasrelated to a C––C vibration mainly in the x-direction but witha y-component. The band observed at 1462 cm�1 is related tothe in-plane deformation vibration of the ring in the y-direction [28].
Simulations using an optical layer model for thesemeasured spectra were so far unsuccessful. However, theyrevealed that the spectra cannot be explained by an isotropicdistribution or flat lying molecules (e.g., as found for guaninein Ref. 32).
The measured spectra for the different single spots lookquite similar for tanC as well as for D spectra (Fig. 8). Fromthese results, it can be concluded that the film is ratherhomogeneous in structure and thickness. The observedmaximum variation of 0.88 inD at 1800 cm�1 corresponds toa maximum thickness variation of about 5 nm (withn1¼ 1.63 [26]).
Figure 8 (online color at: www.pss-b.com) IR ellipsometric spec-traofa58 nmthickcytosinefilm.Aresolutionof4 cm�1wasusedandthe angle of incidence was set to 648. Synchrotron measurements fordifferent spots are shown in comparison. The most extreme spectraare colored gray.
www.pss-b.com
Although similar spectral features are observed for thedifferent spots, the amplitudes of the vibrational bands areslightly different (Fig. 8). For a thicker (d¼ 125 nm) butmore inhomogeneous film the synchrotron spectra reveal alateral dependent change in the vibrational signature (seeFig. 9). In the vertical direction there is no correlationbetween the changing in amplitudes, in the horizontal, theamplitude of the band at 1683 cm�1 is increasing from leftto right and the amplitude of the band at 1705 cm�1 isdecreasing.
It can be concluded that the sample is structurallyinhomogeneous due to the relative size of band amplitudesand their shape, which reflects average molecular orien-tations. At the same time, the baseline of the D spectraremains rather stable, which leads to the conclusion that thefilm thickness is almost homogenous. The slight variation inthe baseline outside the spectral range of absorption bandscan be interpreted by a variation in the thickness of about10%. In principle, the change in band amplitudes and shapesin IR ellipsometric spectra might be interpreted by structuraland orientational effects [31, 32].
Vibrational bands with preferential in-plane (peak up)and out-of plane (peak down) dipole moments canbe identified in Fig. 9. The band at 1462 cm�1 even showsa derivative-like band shape indicating a molecularorientation between the two extremes flat lying and up-right standing. However, a final conclusion aboutthe molecular orientation cannot be drawn at thisstage since the assignment of cytosine-related bandsremains controversial, and even the molecular inter-action and tautomery seem to have an influence on theorientation [29].
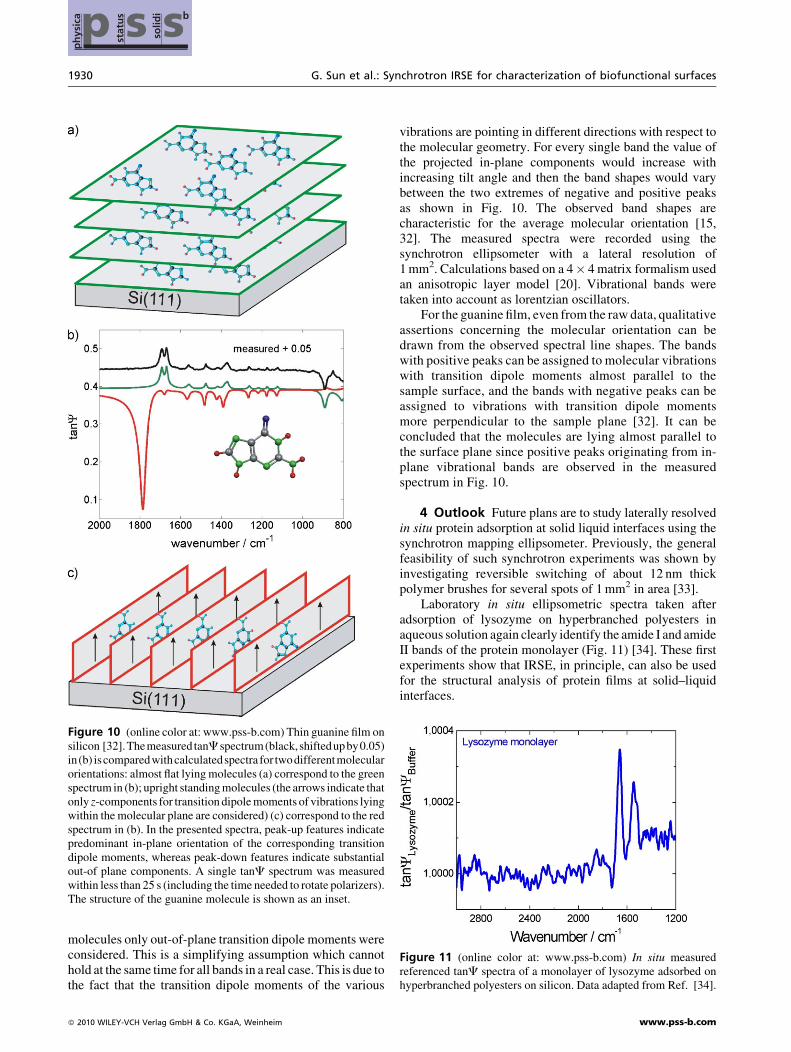
Figure 10 shows measured and calculated ellipsometricspectra for an 84 nm thick guanine film as investigatedpreviously [32], together with schematic drawings for themolecular orientations used for the calculation. Please note,that for the model calculation of the upright standing
� 2010 WILEY-VCH Verlag GmbH & Co. KGaA, Weinheim
1930 G. Sun et al.: Synchrotron IRSE for characterization of biofunctional surfacesp
hys
ica ssp st
atu
s
solid
i b
Figure 11 (online color at: www.pss-b.com) In situ measuredreferenced tanC spectra of a monolayer of lysozyme adsorbed onhyperbranched polyesters on silicon. Data adapted from Ref. [34].
Figure 10 (online color at: www.pss-b.com) Thin guanine film onsilicon [32].Themeasured tanCspectrum(black, shiftedupby0.05)in(b) iscomparedwithcalculatedspectra for twodifferentmolecularorientations: almost flat lying molecules (a) correspond to the greenspectrum in (b); upright standing molecules (the arrows indicate thatonly z-components for transition dipole moments of vibrations lyingwithin the molecular plane are considered) (c) correspond to the redspectrum in (b). In the presented spectra, peak-up features indicatepredominant in-plane orientation of the corresponding transitiondipole moments, whereas peak-down features indicate substantialout-of plane components. A single tanC spectrum was measuredwithin less than 25 s (including the time needed to rotate polarizers).The structure of the guanine molecule is shown as an inset.
molecules only out-of-plane transition dipole moments wereconsidered. This is a simplifying assumption which cannothold at the same time for all bands in a real case. This is due tothe fact that the transition dipole moments of the various
� 2010 WILEY-VCH Verlag GmbH & Co. KGaA, Weinheim
vibrations are pointing in different directions with respect tothe molecular geometry. For every single band the value ofthe projected in-plane components would increase withincreasing tilt angle and then the band shapes would varybetween the two extremes of negative and positive peaksas shown in Fig. 10. The observed band shapes arecharacteristic for the average molecular orientation [15,32]. The measured spectra were recorded using thesynchrotron ellipsometer with a lateral resolution of1 mm2. Calculations based on a 4� 4 matrix formalism usedan anisotropic layer model [20]. Vibrational bands weretaken into account as lorentzian oscillators.
For the guanine film, even from the raw data, qualitativeassertions concerning the molecular orientation can bedrawn from the observed spectral line shapes. The bandswith positive peaks can be assigned to molecular vibrationswith transition dipole moments almost parallel to thesample surface, and the bands with negative peaks can beassigned to vibrations with transition dipole momentsmore perpendicular to the sample plane [32]. It can beconcluded that the molecules are lying almost parallel tothe surface plane since positive peaks originating from in-plane vibrational bands are observed in the measuredspectrum in Fig. 10.
4 Outlook Future plans are to study laterally resolvedin situ protein adsorption at solid liquid interfaces using thesynchrotron mapping ellipsometer. Previously, the generalfeasibility of such synchrotron experiments was shown byinvestigating reversible switching of about 12 nm thickpolymer brushes for several spots of 1 mm2 in area [33].
Laboratory in situ ellipsometric spectra taken afteradsorption of lysozyme on hyperbranched polyesters inaqueous solution again clearly identify the amide I and amideII bands of the protein monolayer (Fig. 11) [34]. These firstexperiments show that IRSE, in principle, can also be usedfor the structural analysis of protein films at solid–liquidinterfaces.
www.pss-b.com

Phys. Status Solidi B 247, No. 8 (2010) 1931
Original
Paper
5 Conclusions Here, we used infrared spectroscopicellipsometry to characterize peptide adsorption on biosensingsurfaces. For spot sizes of about 50 mm2 the peptide films weresuccessfully identified via characteristic IR bands. IRsynchrotron mapping ellipsometry with sample spot sizesbelow 1 mm2 proved that the studied peptide film isinhomogeneous in thickness and structure. Such inhomo-geneities must be studied in more detail for furtherquantification. Importantly, the IRSE lab measurements didshow that our biosensing surfaces can recognize antibodies.
Mapping experiments revealed a homogeneous structurefor a 54 nm cytosine film and an inhomogeneous lateralmolecular structure for a 125 nm thick film. Summarizing,this example showed the advantage of synchrotron mappingellipsometry compared to standard lab ellipsometry.Synchrotron mapping ellipsometry made it possible to detectstructural inhomogeneity of biomolecular films that could notbe observed directly in lab measurements analyzing a largerarea. Interpretation of molecular orientations is still in progressfor cytosine films, but was successful for thin guanine films.
Acknowledgements We thank Ilona Fischer and D. Patzekfor technical assistance. Financial support by the European Unionthrough the EFRE program (ProFIT grant, contract Nr. 10136530/1/2) is gratefully acknowledged. Financial support by theSenatsverwaltung fur Wissenschaft, Forschung und Kultur desLandes Berlin, and the Bundesministerium fur Bildung,Wissenschaft, Forschung und Technologie is also gratefullyacknowledged, as well as the DFG funded International ResearchTrainings Group (1360). We thank Sentech Instruments forcooperation with the synchrotron mapping ellipsometer andKlaus-Jochen Eichhorn and Senta Reichelt for cooperating withthe adsorption experiments of lysozyme. Support by the EU throughSSA DASIM (ctr. No. 00055326) and through the EFRE program(ProFIT grant, contract no. 10125494) is gratefully acknowledged.We thank Dr. A. Roseler for valuable discussions.
References
[1] A. Sadana, Biosensors: Kinetics of Binding and DissociationUsing Fractals (Elsevier B.V., Amsterdam, 2003), p. 4.
[2] B. D. Aaalhotra and A. R. F. Turner, Advances in Biosensors:Perspectives in Biosensors, Vol. 5 (Elsevier science B.V.,Amsterdam, 2003), p. 6.
[3] F. Caruso, D. Neil Furlong, K. Ariga, I. Ichinose, and T.Kunitake, Langmuir 14, 4559–4565 (1998).
[4] X. Cheng, H. E. Canavan, M. Jeanette Stein, J. R. Hull, S. J.Kweskin, M. S. Wagner, G. A. Somorjai, D. G. Castner, andB. D. Ratner, Langmuir 21, 7833–7841 (2005).
[5] X. Pan, J. Kan, and L. Yuan, Sens. Actuators B 102, 325–330(2004).
[6] A. Janshoff, K.-P. S. Dancil, C. Steinem, D. P. Greiner, V. S.-Y. Lin, C. Gurtner, K. Motesharei, M. J. Sailor, and M. R.Ghadiri, J. Am. Chem. Soc. 120, 12108–12116 (1998).
[7] R. M. Nyquist, A. S. Eberhardt, L. A. Silks, Z. Li, X. Yang,and B. I. Swanson, Langmuir 16, 1793–1800 (2000).
[8] B. Liu, R. Hu, and J. Deng, Anal. Chem. 69, 2343–2348(1997).
[9] P. Schuck, Annu. Rev. Biophys. Biomol. Struct. 26, 541–566(1997).
www.pss-b.com
[10] J. M. Brockman, B. P. Nelson, and R. M. Corn, Annu. Rev.Phys. Chem. 51, 41–63 (2000).
[11] T. Strother, W. Cai, X. Zhao, R. J. Hamers, and L. M. Smith,J. Am. Chem. Soc. 122, 1205–1209 (2000).
[12] A. Glidle, T. Yasukawa, C. S. Hadyoon, N. Anicet, T.Matsue, M. Nomura, and J. M. Cooper, Anal. Chem. 75,2559–2570 (2003).
[13] E. Katz and I. Willner, Electroanalysis 15, 913–947 (2003).[14] S. Chang, J. He, A. Kibel, M. Lee, O. Sankey, P. Zhang, and
S. Lindsay, Nature Nanotechnol. 4, 297–301 (2009).[15] D. M. Rosu, J. C. Jones, J. W. P. Hsu, K. L. Kavanagh, D.
Tsankov, U. Schade, N. Esser, and K. Hinrichs, Langmuir 25,919–923 (2009).
[16] Y. Mikhaylova, L. Ionov, J. Rappich, M. Gensch, N. Esser, S.Minko, K.-J. Eichhorn, M. Stamm, and K. Hinrichs, Anal.Chem. 79, 7676–7682 (2007).
[17] L. Ionov, A. Sidorenko, K.-J. Eichhorn, M. Stamm, S. Minko,and K. Hinrichs, Langmuir 21, 8711 (2005).
[18] Z. G. Hu, P. Prunici, and P. Hess, J. Phys. Chem. B 110,14824–14831 (2006).
[19] D. C. Bradford, E. Hutter, J. H. Fendler, and D. Roy, J. Phys.Chem. B 109, 20914–20922 (2005).
[20] K. Hinrichs, M. Gensch, K. Sahre, K.-J. Eichhorn, N. Esser,U. Schade, A. Roseler, and E. H. Korte, Appl. Spectrosc. 57,1250–1253 (2003).
[21] M. Gensch, N. Esser, E. H. Korte, U. Schade, and K. Hinrichs,Infrared Phys. Technol. 49(1-2), 39–44 (2006).
[22] M. Gensch, K. Roodenko, K. Hinrichs, R. Hunger, A. G. Guell,A. Merson, U. Schade, Y. Shapira, Th. Dittrich, J. Rappich, andN. Esser, J. Vac. Sci. Technol. B 23, 1838 (2005).
[23] K. Roodenko, Y. Mikhaylova, L. Ionov, M. Gensch, S.Minko, M. Stamm, K.-J. Eichhorn, U. Schade, N. Esser,and K. Hinrichs, Appl. Phys. Lett. 92, 103102 (2008).
[24] V. P. Tolstoy, I. V. Chernyshova, and V. A. Skryshevsky (eds.),Handbook of Infrared Spectroscopy of Ultrathin Films (Wiley& Sons, Inc., Hoboken, New Jersey, 2003), pp. 618–621.
[25] T. Buffeteau, E. Le Calvez, S. Castano, B. Desbat, D.Blaudez, and J. Dufourcq, J. Phys. Chem. B 104, 4537–4544 (2000).
[26] S. D. Silaghi, M. Friedrich, C. Cobet, N. Esser, W. Braun, andD. R. T. Zahn, Phys. Status Solidi B 242(15), 3047 (2005).
[27] M. Szczesniak, K. Szczepaniak, J. S. Kwiatkowski, K.KuBulat, and W. B. Person, J. Am. Chem. Soc. 110,8319–8330 (1988).
[28] M. Ostblom, B. Liedberg, l. M. Demers, and C. A. Mirkin, J.Phys. Chem. B 109, 15150–15160 (2005).
[29] A. Haug, S. Schweizer, F. Latteyer, M. B. Casu, H. Peisert, C.Ochsenfeld, and T. Chasse, ChemPhysChem 9, 740–747(2008).
[30] A. Roeseler, Handbook of Ellipsometry, edited by H. G.Tompkins and E. A. Irene (William Andrew Publishing–Springer, New York, 2005), pp. 763–798.
[31] K. Hinrichs, M. Gensch, and N. Esser, Appl. Spectrosc. 59,272A–282A (2005).
[32] K. Hinrichs, S. D. Silaghi, C. Cobet, N. Esser, and D. R. T.Zahn, Phys. Status Solidi B 242, 2681 (2005).
[33] D. Aulich, O. Hoy, I. Luzinov, K.-J. Eichhorn, M. Stamm, M.Gensch, U. Schade, N. Esser, and K. Hinrichs, Phys. StatusSolidi C 7, 197–199 (2010).
[34] S. Reichelt, K.-J. Eichhorn, D. Aulich, K. Hinrichs, N. Jain,D. Appelhans, and B. Voit, Colloids Surf. B, Biointerfaces69, 169–177 (2009).
� 2010 WILEY-VCH Verlag GmbH & Co. KGaA, Weinheim
Copyright © 2022 FDOKUMEN