Dynamical and Magnetic Field Time Constants for Titan's Ionosphere - Empirical Estimates

1
Titan'satmospheresimulation1
experimentusingcontinuumUV-VUV2
synchrotronradiation3
4
Z. Peng1,2, T. Gautier2, N. Carrasco2, P. Pernot1, A. Giuliani3, A. Mahjoub2, J.-J. Correia2, A. 5
Buch4, Y. Bénilan5, C. Szopa2, and G. Cernogora2 6
7
1Laboratoire de Chimie Physique, UMR 8000, CNRS, Univ Paris-Sud, Orsay, F-91405, 8
France 9
2 Université Versailles St-Quentin, UPMC Univ. Paris 06, CNRS, LATMOS, F-78280 10
Guyancourt, France 11
3Synchrotron SOLEIL, L’Orme des Merisiers, Saint-Aubin - BP 48, F-91192, Gif-sur-Yvette, 12
France 13
4Laboratoire Génie des Procédés et Matériaux, École Centrale Paris, F-92295 Châtenay-14
Malabry, France 15
5Laboratoire Interuniversitaire des Systèmes Atmosphériques, UMR 7583, Universités Paris 16
VII & Paris XII, F-94010 Créteil, France 17
Corresponding authors: [email protected], [email protected] 18
19

2
Abstract 20
A new reactor, named APSIS for Atmospheric Photochemistry SImulated by Synchrotron, is 21
designed for simulating the reactivity occurring in planetary upper atmospheres. In this 22
reactor, a gas mixture roughly reproducing the main Titan’s atmosphere composition (N2/CH4 23
= 90/10) is irradiated by a continuous-spectrum in the 60−350 nm range, provided by the 24
DISCO beamline at SOLEIL synchrotron radiation facility. This spectral range enables the 25
dissociation and ionization of N2 and CH4, as observed in plasma reactors and Titan’s 26
ionosphere. The neutral products are detected in situ by quadrupole mass spectrometry, and 27
collected with a cryogenic trap for ex-situ analysis by gas chromatography-mass spectrometry. 28
The detected reaction products include C2, C3, C4 and probably C5 organic compounds, with 29
important amounts of nitrogen-bearing species: HCN, CH3CN and C2N2. Neutral mass spectra 30
obtained with APSIS are compared with INMS experiments of the Cassini space probe in the 31
upper Titan atmosphere and with other results of current Titan atmosphere chemistry 32
laboratory simulations. 33
Index terms: Planetary atmospheres (0343); Chemical kinetics and photochemical properties 34
(0317); Instruments and techniques (0394); planetary ionospheres (2459); Titan (6281). 35
Keywords: laboratory simulation; planetary atmospheres; Titan; photochemistry; plasma. 36
37
38
39

3
1 Introduction 40
Titan, the largest moon of Saturn, is of great interest for planetary sciences and astrobiology, 41
mainly because its dense atmosphere is the subject of an active and rich organic chemistry, 42
driven by methane (CH4) history in the present and past atmosphere [Mandt et al., 2012; 43
Nixon et al., 2012]. More specifically, in the upper atmosphere above 700 km altitude, the 44
Cassini space mission revealed a complex chemistry initiated by solar EUV-VUV radiation 45
and Saturn magnetospheric electron influx [Carrasco et al., 2007; Cravens et al., 2006; 46
Vuitton et al., 2007; Waite Jr et al., 2005]. High energy radiations partially ionize the gaseous 47
medium mainly composed of molecular nitrogen (N2) and methane, leading to a natural 48
plasma with an ionization ratio of about 1ppm [Larsson et al., 2012]. The ion and neutral 49
chemistry occurring in this atmospheric layer leads to the formation of large organic species 50
consistent with an aerosol initiation in Titan’s upper atmosphere [Lavvas et al., 2009; Waite 51
Jr. et al., 2007]. 52
Despite the numerous observations made by the Cassini Orbiter [Waite Jr et al., 2009], the 53
formation mechanism of these heavy species is still poorly understood, but may be related 54
with nitrile compounds [Jennings et al., 2012; Vuitton et al., 2006] or polycyclic aromatic 55
hydrocarbons [Sagan et al., 1993]. In order to interpret these observations, two kinds of 56
complementary laboratory studies are realized in gas-phase reactors with an energy source 57
initiating the primary ionization and dissociation processes of N2-CH4 gas mixtures. With 58
plasma discharges, such as in the PAMPRE reactor, energy is deposited through electron 59
impact [Alcouffe et al., 2010; Carrasco et al., 2009; Szopa et al., 2006], whereas VUV 60
monochromatic irradiation has been used in photochemical studies [Imanaka and Smith, 61
2010]. 62

4
Plasma discharges are more efficient for the production of aerosols, but Titan’s chemistry is 63
mainly driven by photochemical processes. In order to address the issue of the sensitivity of 64
the global chemistry to the energy source, we designed a new photochemical reactor, APSIS - 65
Atmospheric Photochemistry SImulated by Synchrotron - to be coupled with a VUV photon 66
source. The experiment has been mounted on DISCO, a VUV beamline at the SOLEIL 67
synchrotron radiation facility. 68
Activation of N2 requires VUV wavelengths below 100 nm (Figure 1). Typical leak-tight 69
windows made of LiF, CaF2 or MgF2 are capable of handling the pressure difference between 70
the ultra high vacuum of the beamline and the pressure of the reactor, but are opaque below 71
~110 nm (11.3 eV), preventing the activation of molecular nitrogen. Photochemical reactors 72
operating at Ly-alpha and above therefore focus on methane chemistry [Ádámkovics and 73
Boering, 2003; Romanzin et al., 2008; Trainer et al., 2004]. Although it is relatively easy to 74
irradiate any media with UV photons through windows, it is much more difficult to deliver to 75
a gas sample VUV photons with energy above the transparency limit of the windows. 76
Therefore, the APSIS chamber is coupled windowless to the DISCO beamline, using a 77
differential pumping system. A non-reactive carrier gas, helium, is continuously injected 78
between the beam line and the APSIS chamber in order to prevent the reactive mixture to be 79
pumped out of the reactor into the differential pumping system. The spectrum of the DISCO 80
beamline is generally 104 - 106 times more intense than the solar spectrum at Titan but much 81
more uniform and has no peak at Ly-α, 121.6 nm (see Figure 1). 82
This experiment differs significantly from the single previous synchrotron study of Titan’s 83
atmosphere [Imanaka and Smith, 2007; 2010], working at 0.066 or 0.13 mbar and using a 84
narrowband synchrotron radiation source. The experiments presented here were done in the 85
same experimental conditions (temperature and pressure) as in the PAMPRE plasma reactor 86
in order to compare the chemistries generated with photons and electrons. 87

5
The experimental setup is detailed in section 2. Specific analytical techniques involving in-88
situ mass spectrometry and ex-situ cryogenic trap and its GC-MS analysis are presented in 89
section 3. The main results addressed in section 4 include the time-scale of the experiments in 90
various pressure conditions, GC-MS product identification, and in-situ MS product 91
quantification. A comparison with the PAMPRE plasma results, the synchrotron results of 92
[Imanaka and Smith, 2010], and the Cassini INMS measurements is discussed in section 5. 93
94
2 Experimental setup 95
2.1 The APSIS reactor 96
The stainless-steel reactor is presented in Figure 2. It is a parallelepiped with internal 97
dimensions (width x length x height) of 500 mm × l14 mm × 92 mm. The geometry is 98
elongated to accommodate the optical depth of CH4 in the experimental conditions described 99
below. A reactive gas mixture is flowed into the reactor using a 0 – 10 sccm range MKS mass 100
flow controller. A primary pumping unit ensures a stationary flow of reactive gas whose 101
partial pressure reaches a few millibars and a residence time of the gas mixture of a few 102
minutes. The pressure is measured with an absolute capacitance gauge (Ceravac from 103
Oerlikron). Before each experiment, the reactor is pumped down to ~10-5 mbar by a turbo 104
molecular pump to clean out the chamber from residual gas traces. 105
2.2 The DISCO beamline 106
Photon sources covering the VUV nitrogen dissociation energy domain may be found on 107
synchrotron radiation facilities. An important property of synchrotron radiation is its 108
spectrum, covering a wide range of photon energies, from terahertz to hard X-rays. DISCO, a 109
bending magnet based beamline, has been described in more details elsewhere [Giuliani et al., 110

6
2009; Giuliani et al., 2011]. It possesses three end-stations. One of those, referred to as APEX 111
(for Atmospheric Pressure Experiment), is fitted with a pressure differential pumping system, 112
which allows delivering monochromatic VUV photons down to 60 nm up to a rare gas 113
pressure of 1 bar. The reactor was mounted on that particular port. 114
2.3 Experimental parameters 115
A gas mixture of N2/CH4 = 90/10 (purity > 99.999%, Air Liquide) is injected at different 116
flows, resulting in different partial pressures. Partial pressures of N2 and CH4, total pressures 117
with helium and the corresponding residence times of the gas mixture at the studied gas flows 118
are shown in Table 1. The experiments are conducted at room temperature. 119
3 Analytical techniques 120
3.1 In situ mass spectrometry 121
In situ measurement of the gas phase composition is achieved using a Pfeiffer QME 200 122
quadrupole mass spectrometer (MS), described in detail previously [Carrasco et al., 2012]. In 123
the MS, neutral molecules are ionized by electron impact at a standard 70 eV electron energy. 124
Gas sampling is done through a capillary tube (0.8 mm internal diameter), mobile along the 125
reactor length dimension and radially close to the irradiated column (Figure 2). The capillary 126
tube is long enough to reduce the conductance between the reactor chamber and the MS, 127
which is ideally kept at an operating pressure PMS below 10-5 mbar [Sciamma-O'Brien et al., 128
2010]. As a consequence, only stable molecules can be measured with this setup. The MS 129
detector has a resolution of 1 u and covers the 1 to 100 u mass range. 130
The DISCO photon flux, (a few 1011 ph.s-1 for 0.1 nm bandwidth) leads to a nitrogen 131
dissociation ratio of less than 10-4. The signal at m/z 28 of N2 should therefore be constant 132
enough throughout the experiments to be considered as a fixed reference. A slight electronic 133

7
drift is often observed during the experiments lasting several hours. It affects proportionally 134
all the ion signals, confirmed by a similar drift of the total pressure measurement in the ion 135
source of the mass spectrometer. The intensity of the mass peak at m/z 28 is therefore used to 136
normalize the mass spectra. 137
We made two types of experiments in order (i) to monitor the time-dependent evolution of a 138
series of mass peaks during the irradiation (MID measurements), and (ii) to characterize the 139
stationary states before (DISCO OFF) and after (DISCO ON) irradiation on a continuous 140
mass range (scan analogs). Studying the stationary state allows to increase the signal to noise 141
ratio by long acquisition time-scales: a 10 seconds shift is chosen for each mass between m/z 142
2 to 80. 143
We monitored the temporal evolution of the gas mixture composition recording the intensity 144
of the maximum of mass peaks of interest in Multiple Ion Detection (MID) mode: m/z = 15, 145
26, 27, 28, 38, 39, 41, and 52. The signal at each of these masses was accumulated during 1 s, 146
leading to a total time-resolution of 15 s. 147
As described in [Sciamma-O'Brien et al., 2010], the peak at m/z 15 is representative of 148
methane. A possible contribution of 15N+ also occurs for N2-CH4 gas mixtures, but for a gas 149
mixture with 10% of methane, this contribution is found to be negligible. 150
Except for m/z 28 dominated by N2 signature, the ion masses chosen in the MID method 151
correspond to product formation in mass regions C2, C3 and C4, with 2, 3 or 4 heavy (C or N) 152
atoms bearing species respectively. 153
3.2 Data treatment of scan analogs 154
As can be seen on the scan analogs obtained at 10 sccm with the DISCO ON and DISCO OFF 155
conditions (Figure 3), productions are not obvious for masses higher than m/z 50. In order to 156

8
improve the signal-to-noise ratio for these larger masses, we use two integration methods 157
described below. 158
3.2.1 Estimation of the relative concentration of the major products versus N2 159
In order to determine the intensities of the peaks in the mass spectra, signal integration for 160
each integer m/z is applied. Effective signals are obtained by excluding the additive 161
contribution of the baseline [Listgarten and Emili, 2005], assumed constant in a spectrum and 162
estimated by averaging the signals above m/z 70 (called the “asymptotic zone” thereafter). 163
Taking into account a peak center shift from integer m/z to the right by 0.2 – 0.3 u, we 164
integrate the baseline-corrected signals in the m/z interval [i-0.25, i+0.75] and affect the result 165
to the intensity at m/z i. Then, all intensities are normalized with respect to m/z 28, yielding 166
relative intensities. Difference spectra (DISCO ON – DISCO OFF), calculated from the 167
integrated signals, provide an estimation of the product relative concentrations. 168
3.2.2 Treatment for heavy species (m/z > 45) 169
In the present operational conditions, the intensities in the difference spectra (i.e. the 170
productions) of the heavy species are often close to the noise level of the mass spectrometer. 171
To detect any significant production, the occurrence of significant peaks at masses above m/z 172
45 has been tested against pure noise. We checked that the signal in the asymptotic zone (m/z > 173
70) can be assimilated to white noise (Gaussian distribution, no autocorrelation) in all 174
experiments. The spectra are baseline corrected as described above, and normalized to the 175
maximal intensity of the m/z 28 peak. The cumulated sum (CS) of the MS DISCO ON – 176
DISCO OFF difference is calculated, starting the summation from the higher mass limit (m/z 177
= 80). Thereafter, the resulting data are named Difference Mass Spectra Cumulated Sum 178
(DMS-CS). 179

9
Using this procedure, significant deviations of the DMS-CS trace from pure noise are easier to 180
detect than by inspecting the raw or even unit-integrated difference MS. Significant deviations 181
are identified against the 3-sigma (99%) confidence interval DMS-CS for pure white noise 182
signals with mean 0 and variances equal to the asymptotic variance of each DISCO OFF and 183
DISCO ON signals. The 99% CI is defined by CI99(k) = [-3*U(k), 3*U(k)], where U(k) = {(k-184
kmax+1)*(uOn2+uOff
2)} 1/2 where k is the index of the current MS point, uON and uOFF are the 185
standard deviations of the signals in the asymptotic zone. 186
3.3 Cryogenic trap and GC-MS analysis 187
In order to detect and identify low concentration products, we installed a cryogenic trap on the 188
outlet of the APSIS reactor, upstream of the vacuum pump. The trap, immerged in liquid 189
nitrogen, is a cylindrical glass coil of 1.3 cm diameter with a total volume of 133 cm3, 190
described in [Gautier et al., 2011]. The gas mixture is pumped from the reactor through the 191
cryogenic trap by the primary pump (Figure 2). Products resulting from the reaction inside the 192
reactor condense in the trap according to their phase diagrams. It has been checked that 193
neither nitrogen nor methane condenses in the trap. 194
The trap is settled on the experiment for 8 hours, after which it is isolated and heated up to 195
room temperature. Once evaporated, the trapped products are injected in a Gas 196
Chromatograph coupled to a Mass Spectrometer (GC-MS) through a six-port valve to perform 197
direct gas injection. The GC-MS device used is a ThermoScientific GC-Trace with a 198
ThermoScientific DSQ II mass spectrometer in quadrupole detection mode. The column is a 199
MXT-QPlot (Restek) of 30 m length, 0.25 mm internal diameter, and 10 µm stationary phase 200
thickness. The stationary phase in this column is a porous polymer optimized to separate light 201
organic molecules, bearing typically 1 to 5 carbon atoms. A temperature programming was 202
used for the analysis, starting with an isotherm at 30 °C for five minutes, followed by a 203

10
gradient of 5 °C.min-1 from 30 °C to 190 °C, and ending with a second isotherm at 190 °C for 204
5 min. The carrier gas is helium (99.999%) with a constant flow rate of 1 mL.min-1. Helium 205
flow is injected through the trap in order to ensure a better introduction of products into the 206
GC. Injector is heated up to 250 °C and operates in the splitless mode. Temperature of the ion 207
source is set at 200 °C. A blank run is performed before each injection, to ensure that there is 208
no contamination from the previous run. 209
210
4 Results 211
4.1 MS time-dependent measurements 212
4.1.1 Methane consumption 213
The time evolution of the 2815 II ratio of MID signals for an experiment performed at 0.6 214
sccm is given in Figure 4, where I15 and I28 are respectively the simultaneously measured 215
intensities of the mass peaks at m/z 15 and 28. It represents to the evolution of the methane 216
over nitrogen ratio during the experiment. The starting time of the photolysis by the DISCO 217
beamline can be easily located by the instantaneous increase of acetylene production detected 218
at m/z 26 (Figure 4). 219
Methane relative consumption may be calculated by: 220
[ ] 02815
281502815
04
4
)(
)()(
II
IIII
CH
CH SS−=∆, (1) 221
The subscript 0 refers to the initial conditions (before the irradiation by the synchrotron beam) 222
and the subscript SS refers to the steady state conditions when MS signal reaches an 223
asymptotic value. 224

11
The methane relative consumption obtained for different gas flow conditions is reported in 225
Table 2. The methane relative consumption at SS slightly increases when the gas flow 226
decreases, from a few 10-3 for 10 sccm up to 1% for 0.6 sccm. This evolution is consistent 227
with a dilution effect of the photons: at 0.6 sccm, the photons absorbed by methane (in the 228
100-130 nm wavelength range) penetrate in the reactor for about 15 cm, and only about 3 cm 229
at 10 sccm. 230
4.1.2 Timescale of the experiments 231
The timescale τ of the experiments is deduced from the time dependence of the m/z 26 ion 232
abundance. As seen on Figure 5, this species follows a simple exponential law: 233
������ = ����� − ������ − ���� × exp�−�
�� (2), 234
where ����� is the stationary intensity of I26, ��� the initial intensity (before irradiation), and τ 235
the timescale of the observed evolution. 236
The timescale τ is obtained by a linear fit of Log(I26ss-I26t) (Figure 5). The timescale is of 237
about 5-8 minutes in all the gas flow conditions studied: from 320 s at 0.6 sccm and up to 500 238
s at 10 sccm, comparable to the residence time of the gas in the reactor, of a few minutes. 239
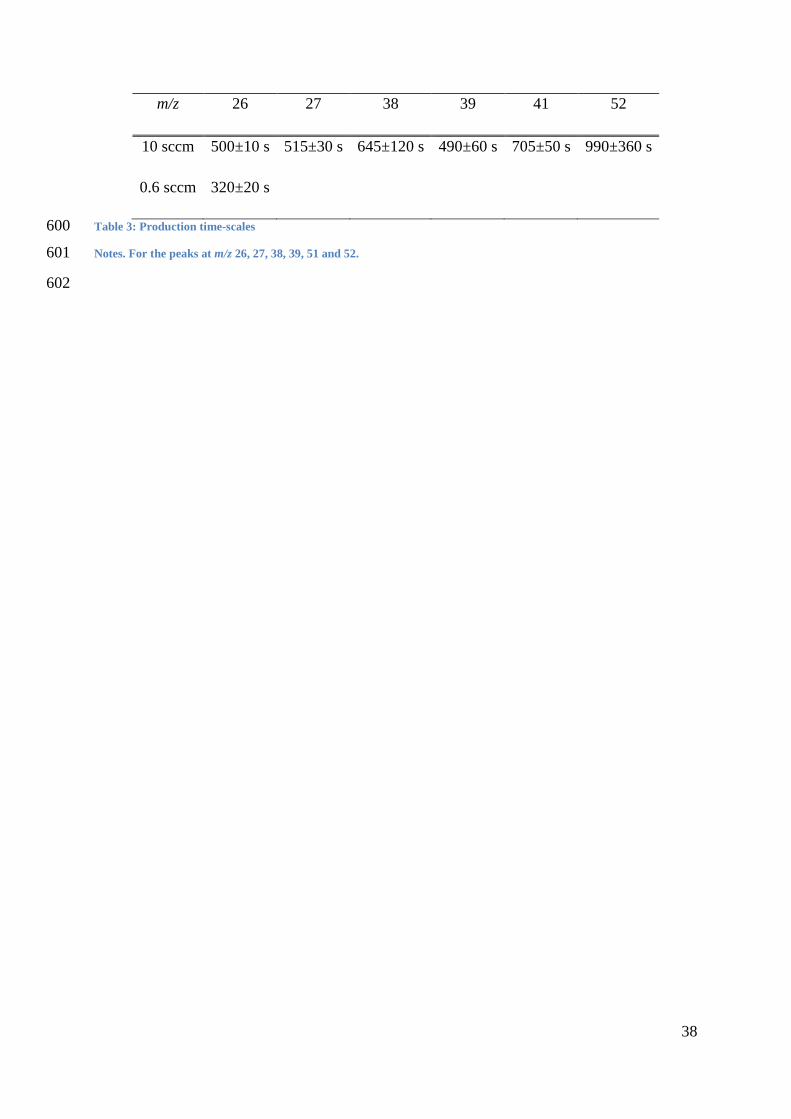
4.1.3 Products formation kinetics 240
Species with mass signatures at m/z 26, 27, 38, 39, 41 and 52 are produced simultaneously 241
with methane consumption (see Figure 5), showing a production of C2, C3 and C4 species. 242
Even if the MS peak intensities are not directly representative of the corresponding neutral 243
concentrations due to the different ionization thresholds and fragmentation patterns of the 244
products, the ratio of the main peaks intensities against the one at m/z 28, provides a rough 245
estimation of the mole fraction of the products diluted in N2. Figure 6 informs us that the 246

12
products mole fractions are about 10-5 for C2 compounds and around the ppm for C3 and C4 247
species. 248
The calculated timescales for the abovementioned masses in the 10 sccm experiments are 249
reported in Table 3. A slight increase of the timescale is observed with the size of the 250
products: from about 500 s for C2 compounds, up to 600-700 s for C3, and up to 1000 s for 251
C4 compounds, in agreement with a sequential growth process. 252
The overlap of the fragments in the MS does not allow to explicitly identify those products. 253
For example the mass peak at m/z 27 could be given by HCN+ or the fragment ion C2H3+ of 254
C2H4. In order to relieve this indetermination, we accumulated the products in a cryogenic 255
trap and analyzed the content by GC-MS. 256
4.2 Products identification with the Cryogenic Trapping - GCMS analysis 257
The GC-MS analysis of products accumulated during 8 running hours of a 7 sccm experiment 258
is shown on Figure 7. It confirms the detection of C2, C3 and C4 compounds by in situ mass 259
spectrometry MID analysis. If we assume that the GC-MS response is the same for C2 to C4 260
compounds we can also assume that the concentration of C2 compound is larger than C3 and 261
C4 compounds. More interestingly, GC-MS enables the unambiguous identification of the 262
major C2 species, such as ethane (C2H6), ethylene (C2H4) and acetylene (C2H2), the major C3 263
compounds (acetonitrile CH3CN, propane C3H8 and propene C3H6), and C4 compounds (2-264
butene C4H8 and ethane dinitrile C2N2 (cyanogen)). Hydrogen cyanide, HCN, is not clearly 265
detected in the cold trap, but it could be co-eluted with water, leading to the large peak at 17 – 266
18 min in the chromatogram. 267
4.3 Effect of enhancing the pressure in the mass spectrometer 268
The low mole fractions of about 10-5 observed by MID for the major products in C2 and C3 269
are near the detection limit of the MS. The use of this instrument in standard conditions 270

13
prevents therefore any detection of products with lower concentrations, in particular for 271
heavier compounds. 272
In order to enhance the dynamic range and consequently the sensitivity of the MS detection, 273
we performed a second series of experiments in the same conditions as described in Table 1, 274
with a shortened sampling capillary length between the APSIS reactor and the MS. The 275
pressure reached in the ionization chamber of the MS increased from PMS=10-6 mbar (LP Low 276
Pressure) in the first set of experiments, up to PMS=10-4 mbar (HP High Pressure) in the 277
second case. The effects are illustrated on Figure 8, on the example of a 10 sccm experiment. 278
The baseline intensity is actually efficiently decreased from about 2×10⁻⁵ down to 4×10⁻⁶, 279
enabling to detect previously invisible products. 280
However, this pressure increase in the MS is not without undesirable consequences. A 281
secondary effect is observed at high pressure in the MS on Figure 8: the ratio I14/I28 reflecting 282
the cracking pattern of N2 is lower than at low pressure. The ratio between these two mass 283
peaks should ideally be pressure-independent, cracking patterns being defined by the direct 284
and the dissociative ionization pathways of the reaction between molecular nitrogen and 285
electrons at 70 eV in the ionization chamber. 286
In order to further study this unsuitable effect, we introduced only molecular nitrogen in the 287
MS, at various pressures. Results are given in Figure 9. A constant I14/I28 ratio is obtained for 288
PMS between 2×10⁻⁷ to 6×10⁻⁶ mbar, but a strong non-linear behavior is observed above 289
PMS=6×10⁻⁶ mbar. 290
The operating instructions of the instrument recommends to work with pressures no larger 291
than PMS=10-5 mbar in the ion source with the Secondary Electron Multiplier as a detector, in 292
spite of the possibility to use the filament up to a pressure of PMS=10-4 mbar. [Mao and Leck, 293
1987; Tilford, 1994] reported that non-linear sensitivities can actually be observed at 294

14
pressures in the range 10-5−10-4 mbar, possibly due to ion space charge effects. Some 295
variations of cracking patterns of H2 and H2O have also been reported at high pressure by 296
[Breth et al., 1983]. We show that an evolution of the cracking pattern of N2 can also be 297
observed at pressures, below PMS=10-5 mbar. We have checked that this effect does not 298
depend on the gas temperature (temperature lowered from room temperature down to about 299
200 K), and that no cross-sensitivity is observed by mixing nitrogen with a second gas like 300
argon, helium or hydrogen. 301
The non-linear effects, detected at high PMS pressures on the I14/I28 signature, are certainly 302
affecting the cracking patterns of other species and prevent us from any quantitative analysis. 303
Nevertheless, in order to detect products with smaller concentrations in the scan analog MS 304
configuration (see Analytical techniques section), we favored a high PMS pressure condition in 305
the mass spectrometer for the rest of the study (PMS = a few 10-5 mbar), as done also by 306
[Imanaka and Smith, 2007; 2010]. 307
4.4 Products detection by mass spectrometry 308
The difference spectra, generated as described in the data treatment section, are calculated at 309
all working flow rates: 0.6, 2, 7 and 10 sccm (Figure 10). We observe that photochemical 310
products appear at all flow rates in the C2 (m/z 25 – 30), C3 (m/z 38 – 44) and C4 (m/z 49 – 311
57) regions. However, only the production of C2 compounds is seen unambiguously for all 312
conditions. The productions of C3 and C4 species become significant only at higher flow rates 313
(7 sccm and 10 sccm), except for C3H8 at m/z 44. 314
For experiments which have been repeated, some differences are noticeable, but they decrease 315
with increasing gas flow, as expected from the signal to noise ratio improvement. However a 316
few masses with densities above the noise level at m/z 27, 29, 31, 33 display repeatability 317
issue. Those are located in the wings of the peaks of intense species (visible on Figure 3), N2 318

15
and O2 (O2 from the residual air in the MS, as described in [Carrasco et al., 2012]). A slight 319
variation in the peak shape between two scan analogs is sufficient to perturb the integrated 320
mass spectra difference for these species. 321
As a result of low influx, the pressure in the reactor is low, so is it in the MS: PMS increases 322
from 2.7×10⁻⁵ mbar for the experiment at 0.6 sccm up to 2.0×10⁻⁴ mbar for the experiments at 323
10 sccm. The low pressure remarkably elevates the baseline of normalized signals in 324
comparison with that at high influx (see Figure 7), which leads to lower signal-to-noise ratios 325
and narrower dynamic range of the spectra. The product signals seem not high enough to be 326
significantly detected considering the low signal to noise ratio in these conditions. As, in the 327
higher mass range (m/z 45 – 80) of our experiments, the abundances are low, the DMS-CS 328
(see Section 3.2) are plotted in Figure 11 for all the experiments. One sees that at 0.6 and 2 329
sccm, the experimental signals do not depart from the pure noise limits. It is therefore illusory 330
to detect any product in this mass range. At 7 sccm, both experiments rise above pure noise at 331
masses below m/z 56, revealing the presence of C4 compounds, albeit in barely detectable 332
densities. The situation is improved at 10 sccm, where the C4 group is significantly rising 333
above pure noise. The systematic departure from the null axis of both experiments hints to 334
some signal emerging in the C5 range, below m/z 70, but still below the significance limit. 335
We therefore focus on the higher gas flow conditions, 7 and 10 sccm. When the flow rate 336
increases from 7 sccm to 10 sccm, the relative intensities are globally preserved. The C2, C3 337
and C4 relative concentrations can be calculated from the spectra on Figure 10: C2 are around 338
10-5, C3 around 10-6 and C4 slightly higher than 10-7. This expected trend of decreasing 339
relative concentrations with the heavy atom number is predicted in [Dobrijevic and Dutour, 340
2006], and observed by [Dobrijevic and Dutour, 2006; Gautier et al., 2011; Thejaswini et al., 341
2011]. 342

16
5 Discussions 343
We compared on Figure 12 the neutral mass spectrum obtained at 10 sccm with the APSIS 344
experiment with other neutral compositions observed in several cases of interest for Titan 345
atmospheric study: (a) the neutral mass spectrum obtained with the PAMPRE plasma 346
discharge [Carrasco et al., 2012]; (b) the neutral mass spectrum obtained with a synchrotron 347
radiation experiment with 60 nm photons [Imanaka and Smith, 2010]; and (c) a measurement 348
of the INMS mass spectrometer onboard Cassini [Waite Jr. et al., 2007]. We have chosen the 349
m/z 20−60 range to focus on the significant productions observed with the APSIS experiment, 350
corresponding to the C2, C3 and C4 compounds. In the experimental simulations, the peaks at 351
m/z 40 and 44 are often disturbed by a contribution of argon and carbon dioxide respectively 352
due to residual air signature in the system. The productions at these masses should therefore 353
not be further considered. 354
A general decrease of the intensities with the size of the detected species is well observed in 355
all spectra, but with differing orders of magnitude, reported in Table 4. The product mixing 356
ratios in the 60 nm synchrotron irradiation [Imanaka and Smith, 2010] and in the PAMPRE 357
plasma discharge [Carrasco et al., 2012] are one order of magnitude higher than in Titan 358
INMS spectra and about two orders of magnitude higher than in the APSIS experiment. 359
The higher productions in PAMPRE and in the reactor of Imanaka & Smith may result from 360
their higher energy deposition. In APSIS, the production is lower than in Titan atmosphere 361
despite a higher photon influx (Figure 1). This could be due to a much shorter residence time 362
of the gas: a few hundred seconds in the APSIS reactor (Table 1) compared to 107 – 108 s in 363
Titan’s stratosphere [Lebonnois et al., 2001]. 364
More important is the distribution among the products, in particular the ratio between the 365
intensities at m/z 26 and 27, corresponding on a first approach to the mixing ratios of C2H2 366

17
and HCN. Both the synchrotron radiation study at 60 nm and the PAMPRE plasma 367
experiments measure a significantly higher intensity at m/z 27, in opposition to the INMS and 368
the APSIS mass spectra. 369
Other nitrogen-bearing species, CH3CN m/z 41, and C2N2 m/z 52, are detected in Titan and in 370
the APSIS and PAMPRE reactors, but not in the synchrotron experiment of Imanaka & Smith. 371
CH3CN and C2N2 are both produced by reactions involving atomic nitrogen as a reactant: 372
N� D� � + C�H� → CH�CN + H and CHCN + N → C�N� + H respectively. 373
Nitrogen atoms are also efficiently adsorbed on the reactor walls. Therefore, we can suspect 374
in the case of Imanaka & Smith that a lower pressure decreases the bimolecular reaction rate 375
to benefit atomic nitrogen adsorption on the walls (M. Smith, personal communication). 376
Overall, in spite of systematic lower productions rates, the APSIS reactor provides a new 377
complementary tool to simulate Titan atmospheric reactivity. In the future, the low production 378
efficiency could be improved by either decreasing the pressure in the reactor or prolonging 379
the residence time of the reactive gas. 380
6 Conclusion 381
A new reactor, named APSIS (Atmospheric Photochemistry SImulated by Synchrotron), has 382
been designed to simulate planetary atmospheric photochemistry processes. We report here a 383
study focusing on Titan’s upper atmosphere. We used a nitrogen-methane gas flow irradiated 384
by a continuous 60-350 nm VUV beam provided by the DISCO line at SOLEIL synchrotron 385
radiation facility. The neutral photochemical products were monitored by mass spectrometry, 386
showing a time-scale of about 15 min, and a measurable production of species with two up to 387
four (probably five) heavy atoms. The C2 hydrocarbons are by far the major products, but 388
nitrogen bearing species such as HCN, CH3CN and C2N2 were also detected, in agreement 389
with Cassini’s INMS observations at Titan. 390

18
We compared the mass spectra with those obtained by a plasma experiment [Carrasco et al., 391
2012] and with another synchrotron based experiment [Imanaka and Smith, 2010], and with 392
the in-situ measurements of the INMS mass spectrometer instrument onboard Cassini probing 393
the neutral content of Titan upper atmosphere. In spite of lower photochemical production 394
efficiency, the APSIS reactor seems to simulate Titan’s neutral composition rather 395
realistically. Nevertheless, its production efficiency should be improved in the future by 396
increasing the residence time of the gas in the reactor. 397
Seeing that none of the simulation experiments previously discussed convincingly reproduces 398
the neutral compounds in Titan atmosphere at both levels of species identity and relative 399
amounts, we are performing in parallel a modeling study, to help interpret these simulation 400
experiments and to improve their performance. 401
Overall, the feasibility of the novel APSIS experiment, for atmospheric photochemistry 402
simulation, has been demonstrated in this study, showing the great interest of this platform for 403
further investigation of planetary atmospheres. 404
7 Acknowledgement 405
The conception and construction of reactor APSIS was supported by the CNES (Centre 406
National d’Etude Spatiale) and the PRES UniverSud Paris. A. Mahjoub thanks the ANR-407
JCJC-0038 contract for a postdoctoral position. Experiments were performed on the DISCO 408
beamline at SOLEIL Synchrotron, France (proposal numbers 20100104 and 20100723). We 409
are grateful to the SOLEIL staff for smoothly running the facility. D.P.Q. Nguyen is also 410
acknowledged for his work during his master training period on the pressure-dependency of 411
the I14/I28 ratio in the MS. 412

19
8 References 413
Ádámkovics, M., and K. A. Boering (2003), Photochemical formation rates of organic aerosols through 414
time-resolved in situ laboratory measurements, J. Geophys. Res., 108(E8), 5092, 415
doi:10.1029/2002JE002028. 416
Alcouffe, G., M. Cavarroc, G. Cernogora, F. Ouni, A. Jolly, L. Boufendi, and C. Szopa (2010), 417
Capacitively coupled plasma used to simulate Titan's atmospheric chemistry, Plasma Sources 418
Science and Technology 19(1), 015008, doi:10.1088/0963-0252/19/1/015008. 419
Breth, A., R. Dobrozemsky, and G. Schwarzinger (1983), Some basic problems in th edeconvolution of 420
gas-analytical mass spectra, International Journal of Mass Spectrometry and Ion Physics, 48, 3-421
6, doi:10.1016/0020-7381(83)87014-4. 422
Carrasco, N., O. Dutuit, R. Thissen, M. Banaszkiewicz, and P. Pernot (2007), Uncertainty analysis of 423
bimolecular reactions in Titan ionosphere chemistry model, Planetary and Space Science, 55(1-424
2), 141-157, doi:10.1016/j.pss.2006.06.004. 425
Carrasco, N., T. Gautier, E. Essebbar, P. Pernot, and G. Cernogora (2012), Volatile products controlling 426
Titan’s tholins production, Icarus, 219(1), 230-240, doi:10.1016/j.icarus.2012.02.034. 427
Carrasco, N., et al. (2009), Chemical Characterization of Titan's Tholins: Solubility, Morphology and 428
Molecular Structure Revisited. , The Journal of Physical Chemistry A, 113(42), 11195-11203, 429
doi:10.1021/jp904735q. 430
Cravens, T. E., et al. (2006), Composition of Titan’s ionosphere, Geophysical Research Letters, 33, 431
L07105, doi:10.1029/2005GL025575. 432
Dobrijevic, M., and I. Dutour (2006), A random graphs model for the study of chemical complexity in 433
planetary atmospheres, Planetary and Space Science, 54(3), 287-295, 434
doi:10.1016/j.pss.2005.10.001. 435
Gautier, T., N. Carrasco, A. Buch, C. Szopa, E. Sciamma-O'Brien, and G. Cernogora (2011), Nitrile gas 436
chemistry in Titan atmosphere, Icarus, 213(2), 625-635, doi:doi:10.1016/j.icarus.2011.04.005. 437
Giuliani, A., et al. (2009), DISCO: a low-energy multipurpose beamline at synchrotron SOLEIL, Journal 438
of Synchrotron Radiation, 16(6), 835-841, doi:doi:10.1107/S0909049509034049. 439
Giuliani, A., et al. (2011), A differential pumping system to deliver windowless VUV photons at 440
atmospheric pressure, Journal of Synchrotron Radiation, 18(4), 546-549, 441
doi:doi:10.1107/S0909049511016517. 442
Imanaka, H., and M. A. Smith (2007), Role of photoionization in the formation of complex organic 443
molecules in Titan's upper atmosphere, Geophys. Res. Lett., 34(2), L02204, 444
doi:10.1029/2006gl028317. 445

20
Imanaka, H., and M. A. Smith (2010), Formation of nitrogenated organic aerosols in the Titan upper 446
atmosphere, Proceedings of the National Academy of Sciences, 107(28), 12423-12428, 447
doi:10.1073/pnas.0913353107. 448
Jennings, D. E., et al. (2012), Seasonal Disappearance of Far-infrared Haze in Titan's Stratosphere, 449
Astrophysical Journal, 754, L3, doi:10.1088/2041-8205/754/1/L3. 450
Larsson, M., W. D. Geppert, and G. Nyman (2012), Ion chemistry in space, Reports on Progress in 451
Physics, 75(6), 066901, doi:10.1088/0034-4885/75/6/066901. 452
Lavvas, P., R. V. Yelle, and V. Vuitton (2009), The detached haze layer in Titan's mesosphere, Icarus, 453
201(2), 626-633. 454
Lebonnois, S. b., D. Toublanc, F. Hourdin, and P. Rannou (2001), Seasonal Variations of Titan's 455
Atmospheric Composition, Icarus, 152(2), 384-406, doi:10.1006/icar.2001.6632. 456
Listgarten, J., and A. Emili (2005), Statistical and Computational Methods for Comparative Proteomic 457
Profiling Using Liquid Chromatography-Tandem Mass Spectrometry, Molecular & Cellular 458
Proteomics, 4(4), 419-434, doi:10.1074/mcp.R500005-MCP200 459
Mandt, K. E., J. J. H. Waite, B. Teolis, B. A. Magee, J. Bell, J. Westlake, C. Nixon, O. Mousis, and J. 460
Lunine (2012), The 12C/13C ratio on Titan from Cassini INMS measurements and implications 461
for the evolution of methane, Astrophysical Journal, 749(2), 160, doi:10.1088/0004-462
637X/749/2/160. 463
Mao, F. M., and J. H. Leck (1987), The quadrupole mass spectrometer in practical operation, Vacuum, 464
37, 669-675, doi:10.1016/0042-207X(87)90053-4. 465
Nixon, C. A., et al. (2012), Isotopic Ratios in Titan's Methane: Measurements and Modeling, The 466
Astrophysical Journal, 749(2), 159, doi:10.1088/0004-637X/749/2/159. 467
Romanzin, C., Y. Bénilan, A. Jolly, and M. C. Gazeau (2008), Photolytic behaviour of methane at 468
Lyman-α and 248 nm: Studies in the frame of a simulation program of Titan’s atmosphere 469
(S.E.T.U.P.), Advances in Space Research, 42(12), 2036-2044, doi:10.1016/j.asr.2008.04.011. 470
Sagan, C., B. N. Khare, and W. R. Thompson (1993), Polycyclic aromatic hydrocarbons in the 471
atmospheres of Titan and Jupiter, Astrophysical Journal, 414, 399-405, doi:10.1086/173086. 472
Sciamma-O'Brien, E., N. Carrasco, C. Szopa, A. Buch, and G. Cernogora (2010), Titan's atmosphere: An 473
optimal gas mixture for aerosol production?, Icarus, 209(2), 704-714, 474
doi:10.1016/j.icarus.2010.04.009. 475
Szopa, C., G. Cernogora, L. Boufendi, J.-J. Correia, and P. Coll (2006), PAMPRE: A dusty plasma 476
experiment for Titan’s tholins production and study, Planet. Space Sci., 54, 394-404, 477
doi:10.1016/j.pss.2005.12.012. 478

21
Thejaswini, H. C., A. Majumdar, T. Maung Tun, and R. Hippler (2011), Plasma chemical reactions in 479
C2H2/N2, C2H4/N2, and C2H6/N2 gas mixtures of a laboratory dielectric barrier discharge, 480
Advances in Space Research, 48(5), 857-861, doi:10.1016/j.asr.2011.04.020. 481
Tilford, C. R. (1994), Process monitoring with residual gas analysers (RGAs): limiting factors, Surface 482
and Coatings Technology, 68/69, 708-712, doi:10.1016/0257-8972(94)90242-9. 483
Trainer, M. G., A. A. Pavlov, D. B. Curtis, C. P. McKay, D. Worsnop, A. E. Delia, D. W. Toohey, O. B. 484
Toon, and M. A. Tolbert (2004), Haze Aerosols in the Atmosphere of Early Earth: Manna from 485
Heaven, Astrobiology, 4, 409-419, doi:doi:10.1089/ast.2004.4.409. 486
Vuitton, V., R. Yelle, and V. Anicich (2006), The Nitrogen Chemistry of Titan's Upper Atmosphere 487
Revealed ApJ 647(2), L175, doi:10.1086/507467. 488
Vuitton, V., R. V. Yelle, and M. J. McEwan (2007), Ion chemistry and N-containing molecules in Titan's 489
upper atmosphere, Icarus, 191(2), 722-742, doi:10.1016/j.icarus.2007.06.023. 490
Waite Jr, J. H., et al. (2005), Ion Neutral Mass Spectrometer Results from the First Flyby of Titan, 491
Science, 308, 982-986, doi:10.1126/science.1110652. 492
Waite Jr, J. H., D. T. Young, J. Westlake, J. I. Lunine, C. P. McKay, and W. S. Lewis (2009), High-Altitude 493
Production of Titan’s Aerosols, in Titan from Cassini-Huygens, edited by R. H. Brown, J.-P. 494
Lebreton and J. H. Waite, pp. 201-214, Springer. 495
Waite Jr., J. H., D. T. Young, T. E. Cravens, A. J. Coates, F. J. Crary, B. Magee, and J. Westlake (2007), 496
The Process of Tholin Formation in Titan’s Upper Atmosphere, Science, 316, 870-875, 497
doi:0.1126/science.1139727. 498
499
500
501

22
9 List of figures 502
503
Figure 1: Energy spectra of APSIS and solar spectrum at the top of Titan’s atmosphere. ...... 24 504
Figure 2: Schematic diagram of the APSIS setup. ................................................................... 25 505
Figure 3: Effect of ~1 h DISCO irradiation on the 10 sccm reactive gas mixture, with HP in 506
the MS. ..................................................................................................................................... 26 507
Figure 4: Monitoring of methane consumption (I15/I28) (black, right axis) and acetylene 508
production (I26/I28) (red, left axis) for 7 sccm of injected 90-10 N2-CH4 gas mixture. The 509
irradiation start is depicted by the vertical dashed line at 200 s. .............................................. 27 510
Figure 5: Time dependent evolution of the parameter Log(Iss-It) for an experiment led at 10 511
sccm, for m/z 26, 27, 38, 39, 41 and 52. ................................................................................... 28 512
Figure 6: Time monitoring of products for a 10 sccm experiment. ......................................... 29 513
Figure 7: Chromatograms of the sample evaporated from the cryogenic trap. ........................ 30 514
Figure 8: Comparison of the scan analog initial mass spectra obtained for a similar 10 sccm 515
experimental conditions in the cases of (in red) a low 10-6 mbar pressure condition in the MS; 516
and (in black) a high 10-4 mbar pressure condition in the MS. ................................................ 31 517
Figure 9: (Lower panel) Evolution of I14 and I28 for a pure nitrogen influx in the MS, at 518
various pressure conditions; (upper panel) Pressure dependence of the ratio I14/I28................ 32 519
Figure 10: Difference between the MS of the initial state and the state after ~1 h irradiation 520
obtained for various gas flows in the APSIS reactor (and HP conditions in the MS). ............ 33 521
Figure 11: Cumulated sum of « ON - OFF » MS differences (DMS-CS) for the different 522
available pressure conditions (blue and green curves). The DMS-CS is computed starting 523
from the higher masses. It is compared with the 99% confidence interval for the DMS-CS 524
between two Gaussian random variables with mean 0 and variances equal to the asymptotic 525
variance of the ON and OFF signals (red dash). ...................................................................... 34 526

23
Figure 12: Mass spectra of neutral species in (a) the PAMPRE plasma discharge study 527
[Carrasco et al., 2012]) (red dot), (b) a synchrotron experiment at 60 nm reported in 528
[Imanaka and Smith, 2010] (blue dot), (c) Titan atmosphere measured by the INMS [Waite Jr. 529
et al., 2007] (black solid), and (d) the APSIS experiment at 10 sccm (green solid). The 530
intensities at m/z=28 and 29, corresponding to N2, in (a) and (d) are artificially added for 531
convenience in comparison. ..................................................................................................... 35 532
533
534

24
535
Figure 1: Energy spectra of APSIS and solar spectrum at the top of Titan’s atmosphere. 536
537
538

25
539
Figure 2: Schematic diagram of the APSIS setup. 540
541

26
20 25 30 35 40 45 50 55 601E-6
1E-5
1E-4
1E-3
0,01
0,1
1
DISCO OFF DISCO ON
Time (s)
542
Figure 3: Effect of ~1 h DISCO irradiation on the 10 sccm reactive gas mixture, with HP in the MS. 543
544

27
0 200 400 600 800 1000 1200 1400 1600 1800 2000
4,0x10⁻⁵
4,5x10⁻⁵
5,0x10⁻⁵
5,5x10⁻⁵
6,0x10⁻⁵
6,5x10⁻⁵
7,0x10⁻⁵
7,5x10⁻⁵
8,0x10⁻⁵
8,5x10⁻⁵I 26
/I 28
Time (s)
0,0905
0,0910
0,0915
0,0920
0,0925
0,0930
I 15/I 28
545
Figure 4: Monitoring of methane consumption (I15/I28) (black, right axis) and acetylene production (I26/I28) (red, left 546 axis) for 7 sccm of injected 90-10 N2-CH4 gas mixture. The irradiation start is depicted by the vertical dashed line at 547 200 s.548
549

28
100 200 300 400 500 600 700 800-8,2-8,0-7,8-7,6-7,4-7,2-7,0-6,8-6,6-6,4-6,2-6,0-5,8-5,6-5,4-5,2-5,0-4,8-4,6-4,4
52 41 39 38 27 26
Log(
I ss-I
t)
Time (s)
550
Figure 5: Time dependent evolution of the parameter Log(I ss-I t) for an experiment led at 10 sccm, for m/z 26, 27, 38, 551 39, 41 and 52. 552
553

29
0 200 400 600 800 1000 1200 1400 1600 1800 20004,0x10-6
5,0x10⁻⁶
6,0x10⁻⁶
7,0x10⁻⁶
8,0x10⁻⁶
9,0x10⁻⁶
1,0x10⁻⁵
1,1x10⁻⁵
I38/I28 I39/I28 I41/I28
Time (s)
1,00x10⁻³
1,05x10⁻³
1,10x10⁻³ I27/I28
5,0x10⁻⁵
6,0x10⁻⁵
7,0x10⁻⁵
8,0x10⁻⁵
I26/I28
2,8x10⁻⁶
2,9x10⁻⁶
3,0x10⁻⁶
3,1x10⁻⁶
3,2x10⁻⁶
I52/I28
554
Figure 6: Time monitoring of products for a 10 sccm experiment. 555
556

30
557
558
559
Figure 7: Chromatograms of the sample evaporated from the cryogenic trap. 560
561

31
10 15 20 25 30 35 40 45 50 55 601E-6
1E-5
1E-4
1E-3
0,01
0,1
1 LP HP
AU
m/z
562
Figure 8: Comparison of the scan analog initial mass spectra obtained for a similar 10 sccm experimental conditions 563 in the cases of (in red) a low 10-6 mbar pressure condition in the MS; and (in black) a high 10-4 mbar pressure 564 condition in the MS. 565
566

32
1E-6 1E-5 1E-4
1E-10
1E-9
1E-8
1E-7 I14 I28
Inte
nsity
(A
)
Pressure (mbar)
1E-6 1E-5 1E-424
30
36
42
48
54
60
I14/
I28
567
Figure 9: (Lower panel) Evolution of I14 and I28 for a pure nitrogen influx in the MS, at various pressure conditions; 568 (upper panel) Pressure dependence of the ratio I14/I28. 569
570

33
571
572
Figure 10: Difference between the MS of the initial state and the state after ~1 h irradiation obtained for various gas 573 flows in the APSIS reactor (and HP conditions in the MS). 574
575

34
576
577
Figure 11: Cumulated sum of « ON - OFF » MS differences (DMS-CS) for the different available pressure conditions 578 (blue and green curves). The DMS-CS is computed starting from the higher masses. It is compared with the 99% 579 confidence interval for the DMS-CS between two Gaussian random variables with mean 0 and variances equal to the 580 asymptotic variance of the ON and OFF signals (red dash). 581
582

35
20 25 30 35 40 45 50 55 60-7
-6
-5
-4
-3
-2
-1
0Lo
g N
orm
aliz
ed In
tens
ity
m/z
PAMPRE Synchrotron, at 60nm INMS APSIS
583
Figure 12: Mass spectra of neutral species in (a) the PAMPRE plasma discharge study [Carrasco et al., 2012]) (red 584 dot), (b) a synchrotron experiment at 60 nm reported in [Imanaka and Smith, 2010] (blue dot), (c) Titan atmosphere 585 measured by the INMS [Waite Jr. et al., 2007] (black solid), and (d) the APSIS experiment at 10 sccm (green solid). 586 The intensities at m/z=28 and 29, corresponding to N2, in (a) and (d) are artificially added for convenience in 587 comparison. 588
589
590

36
Reactive N2+CH4 gas
flow (sccm)
Partial pressure of N2-
CH4 (mbar)
Total pressure with
He (mbar)
Residence time of gas
mixture (min)
0.6 1.3 2.1 ~11
2 1.5 2.5 ~4
7 4.5 7.0 ~3
10 6.5 8.7 ~3
Table 1: Experimental conditions 591
Notes. Pressure conditions and residence times of gas mixture in the experiments. Total pressure is measured after the 592 addition of helium. 593
594
595

37
N2+CH4 Gas flow (sccm) [ ]
[ ]4
4 0
CH
CH
∆ [ ]
[ ]4
4 0
CH
CHσ ∆
0.6 1.7×10⁻² 0.3×10⁻²
2 4.6×10⁻³ 1.0×10⁻³
7 3.4×10⁻³ 0.6×10⁻³
7 3.0×10⁻³ 0.6×10⁻³
7 3.7×10⁻³ 1.7×10⁻³
10 3.2×10⁻³ 0.2×10⁻³
Table 2: Methane relative consumption 596
Notes. Obtained for gas flows increasing from 0.6 to 10 sccm.597
598
599
38
m/z 26 27 38 39 41 52
10 sccm 500±10 s 515±30 s 645±120 s 490±60 s 705±50 s 990±360 s
0.6 sccm 320±20 s
Table 3: Production time-scales 600
Notes. For the peaks at m/z 26, 27, 38, 39, 51 and 52. 601
602

39
Mass spectra C2 C3 C4
PAMPRE, plasma 10-3 10-4 10-5 - 10-4 Synchrotron, 60 nm 10-3 10-4 10-5
INMS 10-4 10-6 - 10-5 10-6 - 10-5
APSIS 10-5 10-6 10-7 Table 4: Order of magnitude of the neutral product mixing ratios 603
Notes. Observed in Titan atmosphere (INMS), in a synchrotron experiment at 60 nm ([Imanaka and Smith, 2010]), in 604 the plasma PAMPRE experiment ([Carrasco et al., 2012]) and in APSIS. 605
606
Copyright © 2022 FDOKUMEN