Titan's winter polar vortex structure revealed by chemical tracers
13
Titan’s winter polar vortex structure revealed by chemical tracers N. A. Teanby, 1 R. de Kok, 1 P. G. J. Irwin, 1 S. Osprey, 1 S. Vinatier, 2 P. J. Gierasch, 3 P. L. Read, 1 F. M. Flasar, 4 B. J. Conrath, 3 R. K. Achterberg, 5 B. Be ´zard, 2 C. A. Nixon, 5 and S. B. Calcutt 1 Received 11 June 2008; revised 21 August 2008; accepted 15 September 2008; published 2 December 2008. [1] The winter polar vortex on Saturn’s largest moon Titan has profound effects on atmospheric circulation and chemistry and for the current northern midwinter season is the major dynamical feature of Titan’s stratosphere and mesosphere. We use 2 years of observations from Cassini’s composite infrared spectrometer to determine cross sections of five independent chemical tracers (HCN, HC 3 N, C 2 H 2 ,C 3 H 4 , and C 4 H 2 ), which are then used to probe dynamical processes occurring within the vortex. Our results provide compelling evidence that the vortex acts as a strong mixing barrier in the stratosphere and mesosphere, effectively separating a tracer-enriched air mass in the north from air at lower latitudes. In the mesosphere, above the level of the vortex jet, a tracer-depleted zone extends away from the north pole toward the equator and enrichment is confined to high northern latitudes. However, below this level, mixing processes cause tongues of gas to extend away from the polar region toward the equator. These features are not reproduced by current general circulation models and suggest that a residual polar circulation is present and that waves and instabilities form a more important part of Titan’s atmospheric dynamics than previously thought. We also observe an unexpected enrichment of C 4 H 2 in the northern stratosphere, which suggests photochemical polymerization of C 2 H 2 . Our observations provide stringent new constraints for dynamical and photochemical models and identify key polar processes for the first time. Some of the processes we see have analogues in Earth’s polar vortex, while others are unique to Titan. Citation: Teanby, N. A., et al. (2008), Titan’s winter polar vortex structure revealed by chemical tracers, J. Geophys. Res., 113, E12003, doi:10.1029/2008JE003218. 1. Introduction [2] Titan is unique in the solar system because it has a thick atmosphere dominated by nitrogen and methane with an active photochemical cycle. Understanding processes occurring within Titan’s atmosphere is a major goal of the Cassini-Huygens mission, which arrived at the Saturnian system in July 2004 and has been returning data ever since. Titan lies in Saturn’s equatorial plane and takes 15.9 Earth days to complete one orbit. Rotation of Titan is tidally locked so that the same face is always toward Saturn, resulting in a day that is the same length as the orbital period. Titan experiences seasons because of Saturn’s obliq- uity of 26.7° and has a year lasting 29.5 Earth years. Titan is currently experiencing northern midwinter and so far the Cassini data set covers early to mid northern winter. For the current season atmospheric temperature cross sections obtained by Cassini’s Composite Infrared Spectrometer (CIRS) [Flasar et al., 2005; Achterberg et al., 2008a] provide strong evidence for a polar vortex in the (northern) winter hemisphere with a circumpolar jet located at around 30–50°N and 300 km altitude, which exhibits winds of up to 190 m s 1 , the fastest anywhere on Titan. The vortex has profound effects on the entire atmosphere but until now major dynamical processes occurring within the vortex have remained unconstrained, resulting in discrepancies between observations and model predictions [Crespin et al., 2008; Teanby et al., 2008b]. CIRS has recently built up a data set large enough to determine chemical species distributions within the vortex itself. These species act as atmospheric tracers and allow us to probe never before seen aspects of the vortex structure. [3] Photochemical reactions [Wilson and Atreya, 2004] in Titan’s upper atmosphere (>500 km) produce a vast array of minor species, including hydrocarbon and nitrile gases, which are eventually removed by condensation in the lower stratosphere (100 km). This source-sink relationship creates equilibrium gas profiles with a positive concentra- tion gradient with respect to altitude in the stratosphere (50–300 km) and mesosphere (300–500 km). As a conse- quence of this gradient, these species can be used as tracers of atmospheric motion. For example, currently subsidence at JOURNAL OF GEOPHYSICAL RESEARCH, VOL. 113, E12003, doi:10.1029/2008JE003218, 2008 1 Atmospheric, Oceanic and Planetary Physics, University of Oxford, Oxford, UK. 2 Observatoire de Paris, LESIA, Meudon, France. 3 Department of Astronomy, Cornell University, Ithaca, New York, USA. 4 NASA Goddard Space Flight Center, Greenbelt, Maryland, USA. 5 Department of Astronomy, University of Maryland, College Park, Maryland, USA. Copyright 2008 by the American Geophysical Union. 0148-0227/08/2008JE003218 E12003 1 of 13
-
Upload
independent -
Category
Documents
-
view
2 -
download
0
Transcript of Titan's winter polar vortex structure revealed by chemical tracers
Titan’s winter polar vortex structure revealed by chemical tracers
N. A. Teanby,1 R. de Kok,1 P. G. J. Irwin,1 S. Osprey,1 S. Vinatier,2 P. J. Gierasch,3
P. L. Read,1 F. M. Flasar,4 B. J. Conrath,3 R. K. Achterberg,5 B. Bezard,2 C. A. Nixon,5
and S. B. Calcutt1
Received 11 June 2008; revised 21 August 2008; accepted 15 September 2008; published 2 December 2008.
[1] The winter polar vortex on Saturn’s largest moon Titan has profound effects onatmospheric circulation and chemistry and for the current northern midwinter season is themajor dynamical feature of Titan’s stratosphere and mesosphere. We use 2 years ofobservations from Cassini’s composite infrared spectrometer to determine cross sectionsof five independent chemical tracers (HCN, HC3N, C2H2, C3H4, and C4H2), which arethen used to probe dynamical processes occurring within the vortex. Our results providecompelling evidence that the vortex acts as a strong mixing barrier in the stratosphereand mesosphere, effectively separating a tracer-enriched air mass in the north from air atlower latitudes. In the mesosphere, above the level of the vortex jet, a tracer-depletedzone extends away from the north pole toward the equator and enrichment is confined tohigh northern latitudes. However, below this level, mixing processes cause tongues ofgas to extend away from the polar region toward the equator. These features are notreproduced by current general circulation models and suggest that a residual polarcirculation is present and that waves and instabilities form a more important part ofTitan’s atmospheric dynamics than previously thought. We also observe an unexpectedenrichment of C4H2 in the northern stratosphere, which suggests photochemicalpolymerization of C2H2. Our observations provide stringent new constraints for dynamicaland photochemical models and identify key polar processes for the first time. Some of theprocesses we see have analogues in Earth’s polar vortex, while others are unique to Titan.
Citation: Teanby, N. A., et al. (2008), Titan’s winter polar vortex structure revealed by chemical tracers, J. Geophys. Res., 113,
E12003, doi:10.1029/2008JE003218.
1. Introduction
[2] Titan is unique in the solar system because it has athick atmosphere dominated by nitrogen and methane withan active photochemical cycle. Understanding processesoccurring within Titan’s atmosphere is a major goal of theCassini-Huygens mission, which arrived at the Saturniansystem in July 2004 and has been returning data ever since.Titan lies in Saturn’s equatorial plane and takes 15.9 Earthdays to complete one orbit. Rotation of Titan is tidallylocked so that the same face is always toward Saturn,resulting in a day that is the same length as the orbitalperiod. Titan experiences seasons because of Saturn’s obliq-uity of 26.7� and has a year lasting 29.5 Earth years. Titan iscurrently experiencing northern midwinter and so far theCassini data set covers early to mid northern winter. For the
current season atmospheric temperature cross sectionsobtained by Cassini’s Composite Infrared Spectrometer(CIRS) [Flasar et al., 2005; Achterberg et al., 2008a]provide strong evidence for a polar vortex in the (northern)winter hemisphere with a circumpolar jet located at around30–50�N and 300 km altitude, which exhibits winds of upto 190 m s�1, the fastest anywhere on Titan. The vortex hasprofound effects on the entire atmosphere but until nowmajor dynamical processes occurring within the vortex haveremained unconstrained, resulting in discrepancies betweenobservations and model predictions [Crespin et al., 2008;Teanby et al., 2008b]. CIRS has recently built up a data setlarge enough to determine chemical species distributionswithin the vortex itself. These species act as atmospherictracers and allow us to probe never before seen aspects ofthe vortex structure.[3] Photochemical reactions [Wilson and Atreya, 2004] in
Titan’s upper atmosphere (>500 km) produce a vast array ofminor species, including hydrocarbon and nitrile gases,which are eventually removed by condensation in the lowerstratosphere (�100 km). This source-sink relationshipcreates equilibrium gas profiles with a positive concentra-tion gradient with respect to altitude in the stratosphere(50–300 km) and mesosphere (300–500 km). As a conse-quence of this gradient, these species can be used as tracersof atmospheric motion. For example, currently subsidence at
JOURNAL OF GEOPHYSICAL RESEARCH, VOL. 113, E12003, doi:10.1029/2008JE003218, 2008
1Atmospheric, Oceanic and Planetary Physics, University of Oxford,Oxford, UK.
2Observatoire de Paris, LESIA, Meudon, France.3Department of Astronomy, Cornell University, Ithaca, New York,
USA.4NASA Goddard Space Flight Center, Greenbelt, Maryland, USA.5Department of Astronomy, University of Maryland, College Park,
Maryland, USA.
Copyright 2008 by the American Geophysical Union.0148-0227/08/2008JE003218
E12003 1 of 13
the northern winter pole brings tracer-enriched air from theupper atmosphere into the lower atmosphere where it can beobserved and used as a diagnostic for atmospheric circula-tion [Teanby et al., 2008a]. Titan’s minor species have alarge range of lifetimes, from a few weeks to severalthousand years, which means that they are sensitive toatmospheric dynamics over a range of timescales anddifferent gases can be used to study different aspects of thevortex. Cassini-CIRS is uniquely able to measure Titan’strace gas abundances with sufficient spatial resolution toallow indirect imaging of chemical and dynamical processesoccurring within the vortex.[4] The behavior of Titan’s meridional stratospheric and
mesospheric circulation can be split into three main seasonalregimes. Around the equinoxes, models predict a transitionalregime of two symmetrical meridional cells, comprisingrising air at the equator and subsiding air at the poles[Hourdin et al., 1995; Tokano et al., 1999; Hourdin et al.,2004; Rannou et al., 2005; Richardson et al., 2007]. Duringinterequinox periods this pattern quickly becomes unstableand is replaced by a single south-north (north-south) cellduring northern winter (summer).[5] These predictions are in broad agreement with obser-
vations of trace gas enrichment at northern latitudes deter-mined previously with Cassini-CIRS nadir (downwardlooking) data [Flasar et al., 2005; Teanby et al., 2006;Coustenis et al., 2007; Teanby et al., 2008a, 2008b]. Theseobservations suggest that circulation in Titan’s stratosphere/mesosphere currently comprises a single meridional circu-lation cell with an upper branch flowing from the summer(south) to winter (north) pole. However, these nadir studieswere generally only sensitive to a single atmospheric leveland provide very limited information on vertical atmosphericstructure. The best way of determining detailed horizontaland vertical atmospheric structure is by observing spectra ina limb viewing geometry (toward the horizon) at multiplelatitudes. A recent study has used such observations toobtain a cross section of the vortex zonal mean temperaturestructure [Achterberg et al., 2008a], which can be used toderive zonal mean thermal winds, defining the vortex jetstructure. However, to constrain transport and chemicalprocesses occurring within the vortex composition profilesare also required. So far, composition studies using limb data[Teanby et al., 2007; Vinatier et al., 2007; Vinatier, 2007]
have only probed a few discrete latitudes or have been atvery low spectral resolution with large uncertainties. Whilethese studies give important information on vertical abun-dances, they do not provide a complete picture of vortexstructural composition, which is essential for understandingTitan’s complex polar interactions and for advancing numer-ical models to the next level.[6] In this paper we use Cassini-CIRS limb spectra to
determine altitude-latitude cross sections of vortex compo-sition during Titan’s midwinter season (2006 and 2007).
2. CIRS Data
[7] CIRS is a Fourier transform spectrometer that recordsspectra in the far- and mid-IR (10–1500 cm�1, 1 mm to7 mm). This spectral range covers emission features of mostof Titan’s photochemical inventory and spectra can be usedto derive atmospheric temperature and composition. The fullspectral range of CIRS is covered by three separate focalplanes, which use the same telescope and scan mechanism:FP1 10–600 cm�1 (far-IR); FP3 600–1100 cm�1 (mid-IR);and FP4 1100–1500 cm�1 (mid-IR).[8] The apodized spectral resolution of CIRS is adjustable
between 0.5 and 15.5 cm�1. Here, we use high (0.5 cm�1)spectral resolution mid-IR data from FP3 and FP4 as thisallows unambiguous identification of spectral emissionfeatures from Titan’s diverse range of constituent gases. Inlimb-viewing geometry these spectral regions are mostsensitive to temperature and composition of the stratosphereand lower mesosphere (150–500 km).[9] FP3 and FP4 each comprise a linear array of 10 square
pixels with a small field of view (0.27 � 0.27 mrad), whichallows limb measurements of Titan’s atmosphere to deter-mine temperature and composition with vertical resolutionsof less than an atmospheric scale height (20–40 km). Moredetailed information on CIRS can be found in Kunde et al.[1996] and Flasar et al. [2004].[10] In total we used 13 observation sequences from 11
Titan flybys taken from January 2006 to December 2007(Table 1). Each observation sequence was acquired in alimb staring mode, in which the linear pixel arrays werealigned perpendicular to Titan’s horizon and limb spectrawere repeatedly measured at the same location. This type ofobservation typically had a duration of around 4 h and wastaken when Cassini was approximately 150,000 km fromTitan. To increase the signal-to-noise ratio, the multiplyobserved altitude-radiance profiles were averaged togetherby fitting a smooth spline function [Teanby, 2007] with aknot spacing of 30 km to the measured radiances at eachwave number as in the work by Teanby et al. [2007].[11] Typically, during each Titan flyby, time constraints
meant that only one or two latitudes and longitudes could beobserved in this configuration. Therefore, to probe thevortex structure we must slowly build up a compositeatmospheric cross section from multiple flybys coveringthe full 2 year period. This procedure assumes that (1) theatmosphere is zonally symmetric, with no longitudinalvariation and (2) the large-scale atmospheric structure hasnot changed significantly during the 2 year observationperiod. While this seems like a large interpretive jump, itmust be remembered that Titan’s year lasts around 30 Earthyears so seasonal effects are slow and numerical models
Table 1. Summary of Cassini-CIRS Observations Used to Obtain
the Atmospheric Cross Sections in Figure 3a
DateLatitude(�N)
Longitude(�W) Orbit N
FOV Size(km)
15 Jan 2006 53.7 65.1 20 730 4220 May 2006 �33.6 �120.9 24 260 5020 May 2006 51.4 �99.7 24 793 432 Jul 2006 �53.8 �80.4 25 531 4021 Jul 2006 46.6 �122.1 26 300 499 Oct 2006 61.0 �87.7 30 638 439 Oct 2006 29.2 41.0 30 419 4012 Dec 2006 16.1 �111.1 35 271 4812 Jan 2007 3.7 33.1 37 685 4229 Jan 2007 29.6 �19.1 38 727 4125 Mar 2007 �20.6 143.0 41 715 4430 Aug 2007 68.5 101.7 49 391 4521 Dec 2007 �46.2 �74.9 54 786 45
aN is the number of spectra used from each observation. FOV size is theprojected diameter of the field of view on Titan’s limb.
E12003 TEANBY ET AL.: TITAN’S POLAR VORTEX
2 of 13
E12003

predict little change in composition during this time [Rannouet al., 2005], with any temporal changes being small com-pared to the latitude-altitude variations considered here.[12] In addition, these assumptions are backed up by
observational evidence as follows: (1) Temperature andcomposition mapping by Flasar et al. [2005] and Teanbyet al. [2006, 2008b] show a zonally symmetric structure,with no significant longitudinal variations. (2) Observedtemporal variations in composition from the 4 years ofCassini’s prime mission (2004–2008) show that since early2006 atmospheric composition in the southern hemispherehas remained stable [Teanby et al., 2008a]. We have thusrestricted our analysis to data taken in 2006–2007. Slightlymore variability is expected in the north but the configura-tion of Cassini’s orbit meant that much less data areavailable at high northern latitudes. Therefore, it is notpossible to determine reliable temporal trends in the northat present because the time series of nadir observations isvery short compared to Titan’s seasonal cycle [Teanby et al.,2008a]. Assumption 2 is tested further in section 4.1.
3. Methods
[13] Inversion for temperature and composition fromCIRS spectra is described in detail by Teanby et al.[2007]. In brief, we used a constrained iterative nonlinearretrieval method [Rodgers, 1976; Houghton et al., 1984]based on the correlated-k approximation [Lacis andOinas, 1991] as implemented by Irwin et al. [2008].First, the n4 band of methane from 1240 to 1360 cm�1
(FP4) was used to determine a temperature profile foreach observation assuming a stratospheric methane abun-dance of 1.41% as measured by the Huygens probe massspectrometer [Niemann et al., 2005]. During this stage thetangent altitude of the observation was corrected to allow forinstrument pointing errors, which were typically less than10–20 km. Second, the temperature profile was fixed andcontinuous profiles of the constituent gases were determinedby fitting 620–733 cm�1 (FP3). Damping was applied to theinversion to suppress spurious unresolved vertical structuresmaller than an atmospheric scale height. Additional forwardmodeling error was added to the measured spectra to accountfor small differences introduced by the correlated-k approx-imation. The altitude scale of the atmospheric profiles weredetermined by assuming hydrostatic equilibrium and analtitude/latitude-dependent gravity: this required us to makereasonable assumptions about temperatures in the lowerstratosphere and troposphere, which were unconstrained bythese observations. Spectroscopic parameters were the sameas from Teanby et al. [2007] except that we have usedupdated line data for HC3N from Jolly et al. [2007].[14] To ensure that spectra were modeled accurately, we
have allowed for finite field-of-view size using the method ofTeanby and Irwin [2007], so that modelled spectra at eachtangent altitude comprised an average of five spectra distrib-uted uniformly across the field of view. This is a significantimprovement over the analysis of Teanby et al. [2007].[15] The contribution functions (rate of change of radiance
with respect to the determined parameter) saturated ataltitudes below 150 km (180 km near the north pole) andno information on atmospheric composition could beextracted below these altitudes [Teanby et al., 2007]. Above
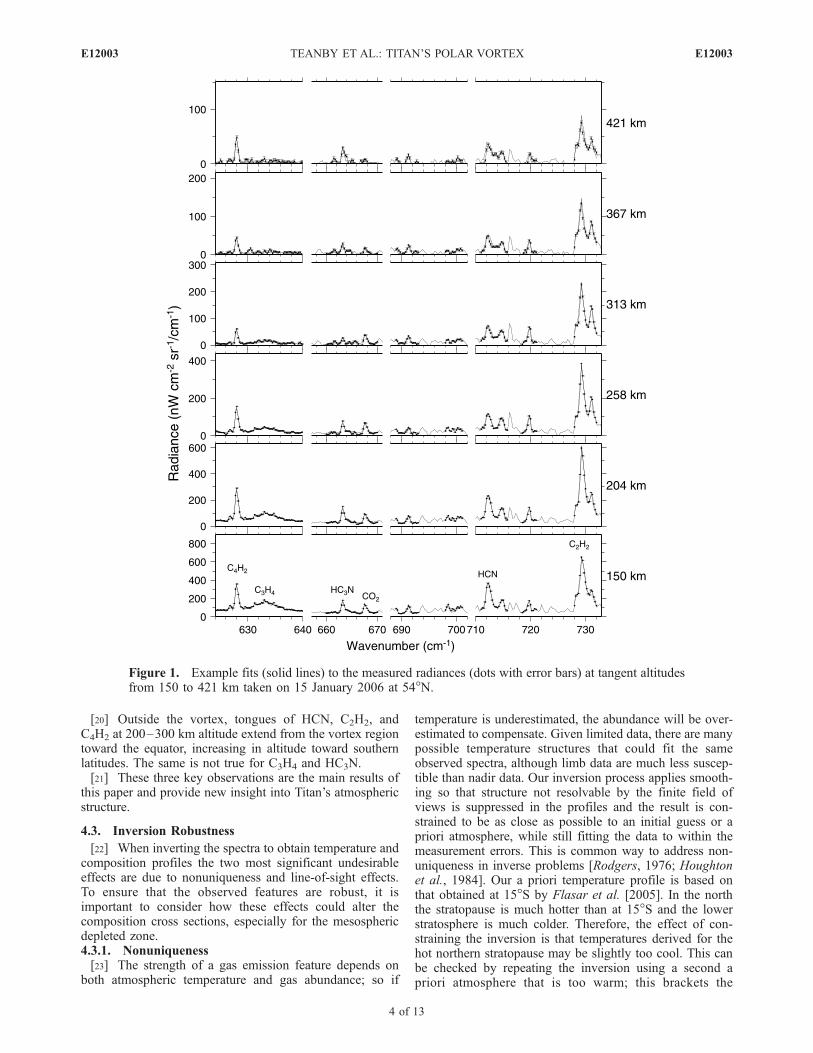
300–500 km (depending on the latitude and gas species) thesignal-to-noise ratio became too low to allow a reliablecomposition determination. An example fit to the data isshown in Figure 1.
4. Results
4.1. Atmospheric Stability
[16] To check that Titan’s atmospheric composition wasstable over the 2 year observation period, we comparecomposition profiles obtained from our data in May 2006and December 2007 around 40�S (Figure 2). Any changesin atmospheric composition would be most obvious in shortlifetime species such as HC3N and C4H2. However, for allspecies differences are slight and to within the error bars,indicating a stable atmospheric composition in the southernhemisphere at this time. A similar comparison is notpossible in the north because of strong composition gra-dients and lack suitable observations. However, the consis-tent trend from low to high abundance of all species as wemove further north, despite the disordered observation timeswith respect to latitude (Table 1), indicates that observedfeatures are not artifacts. Therefore, we conclude that it isvalid to collapse all our results onto single latitude-altitudeatmospheric cross sections, effectively providing a goodrepresentation of the zonally averaged tracer distributionwithin Titan’s polar vortex for midwinter.
4.2. Composition Cross Sections
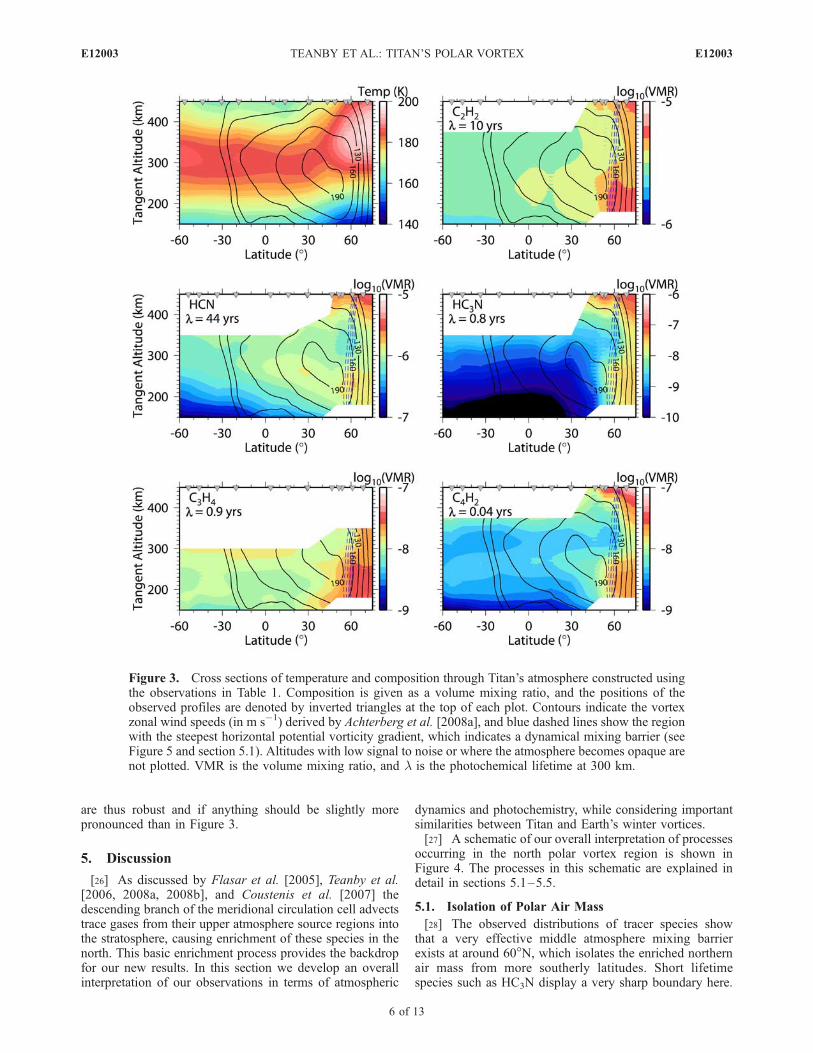
[17] Figure 3 shows the combined temperature and com-position cross sections for 2006–2007 (northern midwinter)derived from the Cassini-CIRS limb soundings in Table 1.The plot also includes zonal mean thermal wind contours forthe vortex jet derived from temperature gradients [Achterberget al., 2008a]. The composition cross sections provide a largeamount of new information about the vortex structure.However, care is taken to interpret only the gross featuresbecause of the composite nature of the data set.[18] The most striking feature is the sharp boundary in
composition seen around 60�N for all five tracers, demon-strating that isolation of enriched and unenriched air massesis occurring within the vortex. Above 300 km altitude,enrichment of trace species is confined close to the poleand composition contours appear to track those of zonalwind. However, below 300 km the enrichment extends tolower latitudes. This is visible for all species studied here,especially those with the shortest lifetimes (HC3N and C4H2).[19] For all five tracer species an unexpected feature is
the extended deep abundance minimum, or mesosphericdepleted zone (MDZ), occurring above the vortex circum-polar jet at around 350 km and encroaching as far north as65�N. This is a new feature and has not been predicted bynumerical models. In the case of the longest lived species(HCN) the minimum is bounded by more enriched air to thesouth, effectively forming a depleted torus around Titan’snorth pole extending over 10–20� of latitude. The existenceof a mesospheric depleted zone both explains and puts intocontext isolated observations of abundance minima inHCN, HC3N, C3H4, and C4H2 profiles previously reportedby Teanby et al. [2007], Vinatier et al. [2007], and Vinatier[2007]. There is no such counterpart for Earth’s polarvortex, highlighting key physical differences.
E12003 TEANBY ET AL.: TITAN’S POLAR VORTEX
3 of 13
E12003
[20] Outside the vortex, tongues of HCN, C2H2, andC4H2 at 200–300 km altitude extend from the vortex regiontoward the equator, increasing in altitude toward southernlatitudes. The same is not true for C3H4 and HC3N.[21] These three key observations are the main results of
this paper and provide new insight into Titan’s atmosphericstructure.
4.3. Inversion Robustness
[22] When inverting the spectra to obtain temperature andcomposition profiles the two most significant undesirableeffects are due to nonuniqueness and line-of-sight effects.To ensure that the observed features are robust, it isimportant to consider how these effects could alter thecomposition cross sections, especially for the mesosphericdepleted zone.4.3.1. Nonuniqueness[23] The strength of a gas emission feature depends on
both atmospheric temperature and gas abundance; so if
temperature is underestimated, the abundance will be over-estimated to compensate. Given limited data, there are manypossible temperature structures that could fit the sameobserved spectra, although limb data are much less suscep-tible than nadir data. Our inversion process applies smooth-ing so that structure not resolvable by the finite field ofviews is suppressed in the profiles and the result is con-strained to be as close as possible to an initial guess or apriori atmosphere, while still fitting the data to within themeasurement errors. This is common way to address non-uniqueness in inverse problems [Rodgers, 1976; Houghtonet al., 1984]. Our a priori temperature profile is based onthat obtained at 15�S by Flasar et al. [2005]. In the norththe stratopause is much hotter than at 15�S and the lowerstratosphere is much colder. Therefore, the effect of con-straining the inversion is that temperatures derived for thehot northern stratopause may be slightly too cool. This canbe checked by repeating the inversion using a second apriori atmosphere that is too warm; this brackets the
Figure 1. Example fits (solid lines) to the measured radiances (dots with error bars) at tangent altitudesfrom 150 to 421 km taken on 15 January 2006 at 54�N.
E12003 TEANBY ET AL.: TITAN’S POLAR VORTEX
4 of 13
E12003

inversion and shows that differences caused by the con-straints are to within the formal inversion errors. Such errorsare not sufficient in size to significantly affect the compo-sition results. In fact, because the effect of our assumed apriori is to produce temperatures that are slightly too cool atthe stratopause, this would result in a slight overestimate ofthe abundances within the MDZ. The converse is true forthe lower stratosphere. Therefore, this effect would reducethe contrast of the observed composition features slightly.4.3.2. Line-of-Sight Effects[24] For tangent altitudes below around 200 km the
atmosphere starts to have significant opacity. This meansthat the effective tangent point will be closer to the spacecraftthan the geometric tangent point. Therefore, when observingthe north pole from an equatorial orbit a slightly lowerlatitude is observed than would be expected from geometryalone. This effect was studied in detail by Achterberg et al.
[2008a], who compared 1D and 2D temperature inversiontechniques. They found that assuming a 1D atmospherestructure, as we have done here, can result in underestimatingthe temperature by up to 4 K near the hot stratopause at highnorthern latitudes. In the cold lower stratosphere, the effect isto overestimate the temperature by a similar amount. Thiseffect would not remove the composition structure we see butreduce the contrast slightly. South of 50�N this effect is notsignificant. A 2D inversion for composition is not possiblebecause of the limited information contained in single gasemission peaks. Therefore, it is best to assume a 1D atmo-spheric structure for both temperature and compositionretrievals to ensure consistency.[25] Both nonuniqueness and line-of-sight effects would
conspire to reduce the contrast of our observed compositionfeatures but could not cause their existence. Neither effectcan explain the presence of a MDZ. The observed features
Figure 2. Comparison of composition profiles obtained at 34 and 46�S on 20 May 2006 and21 December 2007, respectively. The profiles are consistent to within the inversion errors, showing that thesouthern hemisphere has a stable composition over our observation period. This allows us to confidentlybuild an atmospheric cross section from observations taken at different times throughout 2006–2007; l isthe photochemical lifetime at 300 km from Wilson and Atreya [2004].
E12003 TEANBY ET AL.: TITAN’S POLAR VORTEX
5 of 13
E12003
are thus robust and if anything should be slightly morepronounced than in Figure 3.
5. Discussion
[26] As discussed by Flasar et al. [2005], Teanby et al.[2006, 2008a, 2008b], and Coustenis et al. [2007] thedescending branch of the meridional circulation cell advectstrace gases from their upper atmosphere source regions intothe stratosphere, causing enrichment of these species in thenorth. This basic enrichment process provides the backdropfor our new results. In this section we develop an overallinterpretation of our observations in terms of atmospheric
dynamics and photochemistry, while considering importantsimilarities between Titan and Earth’s winter vortices.[27] A schematic of our overall interpretation of processes
occurring in the north polar vortex region is shown inFigure 4. The processes in this schematic are explained indetail in sections 5.1–5.5.
5.1. Isolation of Polar Air Mass
[28] The observed distributions of tracer species showthat a very effective middle atmosphere mixing barrierexists at around 60�N, which isolates the enriched northernair mass from more southerly latitudes. Short lifetimespecies such as HC3N display a very sharp boundary here.
Figure 3. Cross sections of temperature and composition through Titan’s atmosphere constructed usingthe observations in Table 1. Composition is given as a volume mixing ratio, and the positions of theobserved profiles are denoted by inverted triangles at the top of each plot. Contours indicate the vortexzonal wind speeds (in m s�1) derived by Achterberg et al. [2008a], and blue dashed lines show the regionwith the steepest horizontal potential vorticity gradient, which indicates a dynamical mixing barrier (seeFigure 5 and section 5.1). Altitudes with low signal to noise or where the atmosphere becomes opaque arenot plotted. VMR is the volume mixing ratio, and l is the photochemical lifetime at 300 km.
E12003 TEANBY ET AL.: TITAN’S POLAR VORTEX
6 of 13
E12003

[29] We propose that this mixing barrier is a dynamicaleffect caused by the polar vortex. This can be investigatedfurther by using temperature and wind fields [Achterberget al., 2008a] to determine the potential vorticity (PV).[30] Potential vorticity is proportional to the dot product
of the absolute vorticity and the gradient of potentialtemperature. As a consequence of Kelvin’s circulationtheorem, potential vorticity is conserved for adiabatic fric-tionless flows, so a strong horizontal gradient in PV implieshorizontal mixing is inhibited, leading to an effectivemixing barrier [Andrews et al., 1987]. Therefore, PVeffectively provides another independent tracer in additionto the composition measurements. For the Earth’s polarvortex a mixing barrier is indeed associated with a steepgradient of potential vorticity [McIntyre and Palmer, 1983;McIntyre, 1989]. Following Read et al. [2006] potentialvorticity q can be approximated by:
q ¼ �g f þ xqð Þ @q@p
ð1Þ
where: g is gravitational acceleration, f = 2Wsinf, W is theangular rotation rate of Titan, f is latitude, q is potentialtemperature, p is pressure, and xq is the vertical componentof absolute vorticity calculated at constant potentialtemperature given by:
xq ¼ � 1
r2 cosf@
@fru cosfð Þ ð2Þ
We calculated the zonal velocity u using the thermal windequation for a curved atmosphere and assuming a lowerboundary condition wind velocity of 4W at 10 mbar[Achterberg et al., 2008a] - q is then evaluated on constant
q surfaces following Read et al. [2006] using a finitedifference technique. Because of Titan’s significant atmo-spheric curvature the distance to Titan’s center r cannot beassumed constant and must remain inside the differentialterm in equation (2).[31] The potential temperature q [Houghton, 2002] of a
parcel of air at temperature T and pressure p is calculated byassuming the parcel is moved adiabatically to the 10 mbarpressure level:
q ¼ Tp0
p
� �k
ð3Þ
where p0 is the 10mbar reference pressure and k is the ratio ofheat capacities (cp�cv)/cp. Assuming a representative meanatmospheric temperature of 200 K for Titan’s atmosphereand a composition of 98.6% N2 (cp = 29.1 J K�1 mol�1)and 1.4% CH4 (cp = 33.5 J K�1 mol�1) gives a meanspecific heat capacity of cp = 29.2 J K�1 mol�1 and avalue of k = 0.281.[32] The 1/p factor causes q to increase exponentially
with altitude, making horizontal trends hard to determine.Lait [1994] points out that scaling PV by a function qn
preserves the relative horizontal PV gradients on surfaces ofconstant q. Therefore, an appropriate choice of n can beused to remove the intrinsic exponential increase in PV withaltitude, while preserving the conservative properties of PV.Lait suggests a value of �9/2 for an isothermal atmosphere.However, we found that the atmospheric structure of Titanis such that �7/2 is more effective at removing the verticaltrend in PV. This makes the horizontal structure much easierto see and allows comparison of relative PV gradients atdifferent atmospheric levels.
Figure 4. Schematic of the dynamical processes occurring in Titan’s north polar region.
E12003 TEANBY ET AL.: TITAN’S POLAR VORTEX
7 of 13
E12003

[33] Figure 5 shows scaled and unscaled PV surfaces.Note that calculation of q effectively involves taking thesecond latitude derivative (curvature) of a highly smoothedtemperature field and is hence susceptible to calibrationsubtleties at high altitudes (above 400 km). Therefore, onlygross features should be interpreted. Latitudes south of30�N are not plotted as the thermal wind equation startsto break down within 30� of the equator and at southernlatitudes temperature gradients are too small to provide areliable PV determination.[34] The region of steepest horizontal PV gradient is
indicated in Figure 3 and displays a remarkable correspon-dence with the mean position of the observed compositionboundaries. This provides the strongest evidence to date fordynamical isolation of air inside Titan’s north polar vortexand illustrates the importance of the vortex’s influence onatmospheric circulation and composition in this region.Similar dynamical isolation occurs in Earth’s Antarcticpolar vortex, causing depletion of trace species and allowingan ozone hole to develop within the vortex [Schoeberl andHartmann, 1991].
5.2. Mesospheric Depleted Zone
[35] All five tracer species show greater polar confine-ment at higher altitudes, which suggests a dynamical ratherthan a chemical origin for the mesospheric depleted zone,
especially when combined with the fact that the bottomboundary of this zone occurs at a similar altitude to thevortex circumpolar jet (300 km). Evidently some secondaryprocess is causing greater confinement at high altitude andincreased equatorward transport at lower altitudes. Flattemperature contours observed in the lower stratosphereare also consistent with enhanced transport in this region.However, this could also be caused by a radiative effect dueto a transition between the hot stratopause and the coldlower atmosphere, which is just exiting from an extendedpolar night.[36] Equatorward transport in the stratosphere could be
caused by horizontal eddies resulting from barotropic insta-bilities due to large horizontal wind shears close to thevortex circumpolar jet. However, the latitudinal wind gra-dient is such that barotropic instabilities are most likelysouth of the vortex jet [Luz et al., 2003], whereas ourobservations require mixing north of the vortex jet.[37] Our preferred interpretation is that the observed
tracer distribution is caused by a residual meridional circu-lation near the north pole that is poleward above the vortexjet and equatorward below. The possible origin of thiscirculation is discussed in detail in section 5.3.[38] Low abundances within the depleted zone could thus
be a consequence of poleward advection of air from furthersouth that has an abundance corresponding to an equilibrium
Figure 5. (a) Potential vorticity (PV) derived from the smoothed temperature cross section ofAchterberg et al. [2008a] and assuming thermal wind balance. (b) Potential vorticity from Figure 5amodified using a scaling similar to that of Lait [1994] to remove the intrinsic strong altitude dependenceof PVand bring out the horizontal structure. (c) and (d) Same as Figures 5a and 5b but regridded in termsof altitude. Plots cover approximately the same vertical range, but q and altitude are not linearly related.Note that above �400 km the determination of PV becomes susceptible to calibration effects and onlygross features should be interpreted. The scaled PV (Figures 5b and 5d) shows sharp horizontal gradientsat 60�N throughout the stratosphere and lower mesosphere, implying a strong dynamical resistance tohorizontal mixing consistent with the observed tracer distribution.
E12003 TEANBY ET AL.: TITAN’S POLAR VORTEX
8 of 13
E12003

photochemical profile. This is supported by the observationthat for HCN, HC3N, and C4H2 abundances in the depletedzone are similar to those at southern latitudes where verticalgas profiles are close to their equilibrium conditions.[39] The existence of a depleted zone implies that no
streamlines can pass through this region from higher alti-tudes, otherwise enrichment would occur here because ofconnection with enriched air from the high-altitude photo-chemical production zone.
5.3. Explanation for Inferred North Polar ResidualCirculation
[40] The observed mesospheric depleted zone implies thata residual circulation exists close to Titan’s north pole. Inthis section we discuss possible origins for this inferredcirculation.[41] At Titan’s south pole numerical models [e.g., Crespin
et al. 2008] predict a residual circulation in the stratosphereextending up to the 1 mbar level, ascending at around 40�Sand descending at the south pole. In the models this is drivenby excess cooling at the south pole due to enriched aerosolabundances left over from southern winter/spring, whichcauses subsidence and acts in the opposite sense to the overallsolar-heating-driven upwelling of the main meridional circu-lation. However, this mechanism could not explain a residualcirculation at the north pole. Excess aerosol and trace gasabundances in the north would cause enhanced radiativecooling of the middle and lower stratosphere [Bezard et al.,1995], but this would simply help to drive the main south-north meridional circulation cell. Also the sharp horizontalPV gradients associated with the vortex winds would inhibitsuch a cell.[42] Another possibility is due to breaking atmospheric
waves. Determinations of Titan’s stratospheric and meso-spheric winds [Hubbard et al., 1993; Achterberg et al.,2008a] show a superrotating atmosphere circling themoon in under 48 h, which can be explained by theGierasch-Rossow mechanism [Gierasch, 1975; Rossow andWilliams, 1979; Hourdin et al., 2004]. This wind field cancause atmospheric waves to break and deposit additionalmomentum into the zonal flow, thus setting up a residualcirculation.[43] These waves could include gravitational tides forced
by Titan’s eccentric orbit [Strobel, 2006] or broad spectrumgravity waves generated in the lower atmosphere by con-vection or wind shear instabilities. Gravitational tides canhave a wave number zero or two pattern, with the westwardpropagating wave number two component being signifi-cantly weaker than the corresponding eastward component[Walterscheid and Schubert, 2006]. Gravitational tides havea slower phase speed than the background flow [Strobel,2006]. Therefore, they propagate westward with respect tothe background flow and thus exert a drag on the back-ground flow when they break, causing a meridional flowtoward the pole. In other words, the residual meridionalcirculation transports angular momentum to offset thestresses from the waves and maintain a steady state.Gravitational tides have not yet been observed in Titan’sstratosphere or mesosphere [Achterberg et al., 2008b],although Muller-Wodarg et al. [2006] recently report wavestructures in the thermosphere (>1000 km) that could betidal in origin.
[44] On the other hand, gravity waves can propagate inboth east and west directions with respect to the backgroundflow and when they break can either exert an acceleration ordrag on this background flow, inducing a flow either awayfrom or toward the pole, respectively. The existence ofgravity waves in Titan’s atmosphere is supported by amounting body of evidence including: the Voyager radiooccultation [Hinson and Tyler, 1983; Friedson, 1994]; theSgr28 stellar occultation [Sicardy et al., 1999]; and theHuygens probe temperature profile [Fulchignoni et al.,2005]. Breaking gravity waves, possibly aided by tidalwaves above the vortex jet, could thus cause a polewardresidual circulation in the north polar region. The occur-rence of wave drag above the stratopause could help toclose off the vortex jet at high altitudes, which is consistentwith the observation that zonal wind speeds decrease withaltitude above the stratopause at all latitudes.[45] To investigate where gravity waves could break and
how they could affect the flow, we performed a sensitivitystudy using the Doppler spread parameterization (DSP) ofHines [1997].[46] It is assumed that most of the gravity waves seen
in Titan’s stratosphere originate from processes in thetroposphere (e.g., convection, shear instabilities, etc.). Cal-culations were made determining the characteristics ofmomentum forcing in an idealized atmosphere characteristicof Titan. We launched a broad spectrum of waves evenlydistributed about j = 1 . . . Nj azimuths near the tropopause(100 mbar, 40 km) and taken to be isotropic about the meanwind. These spectra were assumed to propagate verticallythrough prescribed background winds up into the meso-sphere (0.001 mbar, 525 km). In the DSP, the evolution ofwave spectra is controlled by background and wave-inducedwinds. Specifically, this is governed by the monotonicallynonincreasing cutoff vertical wave number, mj, whosevariation with height signifies critical level filtering ofwaves by background wind such that waves with wavenumbers higher than mj break and deposit momentum intothe background flow.
mj ¼Ntrop
F1sj þ F2sT þDVj
ð4Þ
Here Ntrop is the Brunt-Vaisala frequency at the launchheight; sj is the root-mean-square speed of the gravitywaves travelling in the jth azimuth direction; sT is the root-mean-square speed of all the gravity waves; and F1 and F2
are adjustable parameters having values of 1.5 and 0.4,respectively [Hines, 1997]. The first term in the denomi-nator represents the Doppler spreading of waves from lowto high vertical wave numbers by waves travelling in the jthazimuth, while the second term represents the destabilizinginfluence of all waves. The final term is the wind shearbetween the launch height and overlying levels andrepresents Doppler shifting by the background wind alone.One further parameter is the characteristic horizontalwavelength, which is important for scaling the total wavemomentum in the launch spectra. We chose a horizontalwavelength of 200 km, consistent with the wavelength ofhorizontal structures observed during the Sgr28 stellaroccultation [Sicardy et al., 1999].
E12003 TEANBY ET AL.: TITAN’S POLAR VORTEX
9 of 13
E12003

[47] It is important to note that at present many of theparameters are not well constrained for Titan, so ourmodeling can only represent the qualitative aspects untilfurther data become available. In our study we haveassumed that (1) the variance of the gravity wave windspeed sT
2 is similar to values for gravity waves on Earth; (2)the background wind speeds drop linearly (in altitude) fromtheir value at 10 mbar to zero at Titan’s surface, in broadagreement with the overall trend from the Huygens resultsat 15�S [Bird et al., 2005]; and (3) the gravity waves followa modified Desaubies low wave number spectrum [Frittsand Alexander, 2003].[48] Figure 6 shows the normalized stress exerted on the
background flow by gravity wave breaking at 50�N. Onearth a gravity wave wind variance sT
2 of 1 m2 s�2 iscommonly used [Manzini and McFarlane, 1998]. On TitansT2 is not well constrained, so we have used bracketing
values of 0.5 and 5.0 m2 s�2.[49] The derived temperature profiles contain increased
levels of uncertainty in the north polar middle and lowerstratosphere. This is caused by trying to observe the coldestregion of the stratosphere through the hot stratopause regionand results in limited temperature information below about1 mbar (180 km). Therefore, the derived backgroundthermal wind speeds are not well constrained in this region.Also, the winds derived by Achterberg et al. [2008a]assumed a bottom boundary condition of four times solidbody rotation speed at 10 mbar based on the Huygensmeasurements at 15�S. This may not be realistic near thevortex and higher wind speeds may exist in the loweratmosphere. Therefore, in Figure 6 we have used three testwind profiles: thermal wind from Achterberg et al. [2008a]with (1) a linear interpolation from 10 mbar to zero at thesurface (Figure 6a), (2) wind above the jet core and a linear
decrease below the jet core to 100m s�1 at 40 km (Figure 6b),and (3) wind above the jet core and a linear decrease belowthe jet core to 150 m s�1 at 40 km (Figure 6c). At present, it isnot possible to constrain winds accurately in Titan’s loweratmosphere, so these test wind profiles simply provide a wayof determining the sensitivity of gravity wave breaking toplausible background wind fields.[50] Critical level filtering of eastward propagating waves
occurs when the phase speeds of the waves match that of thebackground flow. Figure 6 shows that this happens almostimmediately above the launch altitude due to the largepositive vertical wind shear below the vortex jet. Thiscauses waves to break, exerting an eastward stress on thebackground flow, causing a slight acceleration in the direc-tion of the superrotation, which induces flow away from thepole. Waves travelling westward with respect to the back-ground flow break above the vortex core in a region ofnegative vertical wind shear. This occurs when the waveamplitude is large enough to cause the local lapse rate toexceed the adiabat, which causes a local instability andprecipitates wave breaking. The breaking of these wavesexerts a westward stress on the background flow and causesa slight deceleration/drag, which induces a flow toward thepole. Therefore, qualitatively, breaking gravity waves pro-vide a forcing in the right direction to induce a residualcirculation near the north pole.[51] The test cases in Figure 6 show that waves travelling
westward with respect to the background flow tend to breakwhen the background winds are similar to those at the launchheight. For wind case in Figure 6a, waves tend to breakaround 500 km, which is too high to provide a residualcirculation at the correct altitude to explain the mesosphericdepleted zone. However, wind cases in Figure 6b and 6cshow that if winds in the lower stratosphere are increased
Figure 6. Normalized stress imparted to the zonal flow by breaking gravity waves launched from thetropopause for different wind profiles and gravity wave strengths sT
2. Stress is east positive and westnegative. Eastward travelling waves break in positive vertical wind shear below the vortex jet, whereaswestward propagating waves break in negative wind shear above the vortex jet. Eastward/westwardstresses from breaking waves causes an acceleration/drag, which for a steady atmospheric state must bebalanced by a residual circulation that transports angular momentum away from/toward the north pole.Faster stratospheric wind speeds and stronger waves cause westward propagating waves to break at loweraltitudes.
E12003 TEANBY ET AL.: TITAN’S POLAR VORTEX
10 of 13
E12003
then the gravity waves break around the right altitude toprovide a south-north residual circulation at 350 km, whichcould result in the observed mesospheric depleted zone.Another possibility is that if vortex winds temporarilyfluctuate and weaken, then wave breaking could occur atlower altitudes. More data on the polar winds and gravitywave strength is required before further conclusions can bedrawn. At present, we can only say that gravity wavesprovide a possible mechanism for setting up a residualcirculation at Titan’s north pole, which could explain theobserved mesospheric depleted zone.[52] Note that the effect of gravity waves on the merid-
ional circulation would be strongest around the north pole,where strong vortex winds filter the gravity wave spectra,leading to wave drag/acceleration above/below the vortexjet. At equatorial latitudes the zonal wind speeds inferredfrom CIRS [Achterberg et al., 2008a] are reduced comparedto the jet core but remain high and could cause the sametype of filtering, albeit at a reduced level. However, ourmeasurements of tracer species would not be sensitive to ahorizontal residual circulation in equatorial and southernregions as the horizontal composition gradients are too lowto result in any measurable enhancements. Therefore, thesouthern extent of the residual circulation cannot be con-strained at present.[53] The effects discussed in this section have Terrestrial
analogues. On Earth, the effects of small-scale gravity waveson the mean meridional circulation are well documented[Hitchman et al., 1989; Garcia and Boville, 1994] and arelinked with the mesospheric Murgatroyd-Singleton circula-tion toward the winter pole [Murgatroyd and Singleton,1961]. Our sensitivity study shows that a similar mechanismcould also be active in Titan’s mesosphere.[54] Important difference exist between Titan and Earth’s
stratospheres. In the Earth’s winter stratosphere, the effect ofgravity waves is small compared to breaking planetaryRossby waves, which act to weaken the polar vortex.Associated with this is a circulation toward the winter pole,the Brewer-Dobson circulation [Brewer, 1949; Dobson,1956]. However, on Titan planetary waves are not expected[Leovy and Pollack, 1973] so gravity wave effects couldbecome significant. Small-scale gravity wave driving hasalso been suggested as a mechanism for accelerating Earth’sstratospheric polar night jet [Alexander and Rosenlof, 1996].
5.4. Gas Tongues and Photochemical Effects
[55] Of the gases studied here, those with the longestlifetimes are C2H2 (10 years) and HCN (44 years) [Wilsonand Atreya, 2004]. The dynamical mixing barrier is mostprobably not effective over such long timescales so thesegases are able to escape the vortex. Mixing to lowerlatitudes could occur via small-scale wave driving close tothe pole and barotropic instabilities equatorward of thevortex jet; both these processes are consistent with Titan’ssuperrotating atmosphere. This equatorward mixing wouldthen produce the observed extended tongues of gas awayfrom the enriched north polar air mass. HCN has a steepervertical gradient and hence a greater polar enrichment[Teanby et al., 2007; Vinatier et al., 2007] and morepronounced tongue. HCN abundance isolines in this tongueincrease in altitude consistently toward the south pole,implying upward advection south of the north polar vortex-
dominated region (60�N) due to upwelling in the returningbranch of the meridional circulation cell (Figure 4). Theupward advection injects HCN-enriched air into the meso-sphere, which has the effect of closing off the equatorwardflank of the depleted zone and forms a HCN-depleted torusencircling the pole, thus explaining the observed meridionalstructure.[56] C4H2 also displays a tongue; this is surprising as it has
a very short lifetime (2 weeks) and should not be able tosurvive long enough to escape the vortex and reach equato-rial latitudes. This is not an artifact and is visible in fourindependent profiles covering 0–30�N. Therefore, this ob-servation suggests either a stratospheric source for C4H2 atlow northern latitudes or a much longer lifetime thanexpected from photochemical models. The quoted lifetimeis most relevant for disc-averaged conditions at 300 km[Wilson and Atreya, 2004]. It is possible that the lifetimecould be increased significantly in the north because ofreduced UV flux and increased shielding by stratospherichaze. However, south of 45�N these effects should not besignificant; so the existence of a C4H2 tongue there suggestsa stratospheric source. We propose that the C4H2 tongue iscaused by partial polymerization of the C2H2 tongue at200–300 km altitude. Polymerization of C2H2 by solarphotons to C4H2 is thought to occur in Titan’s loweratmosphere [Wilson and Atreya, 2004] so our results couldbe the first observational evidence in support of thisprocess and provide a new constraint for photochemicalmodels.[57] It is interesting to note that C3H4 and HC3N do not
show a tongue, even though they have longer lifetimes thanC4H2. This indicates that net photochemical loss of C3H4
and HC3N is too large to cause observable enrichment atthese altitude levels and that photochemical pathwaysleading to their formation must occur above 500 km.[58] C3H4 and HC3N have similar photochemical life-
times (�1 year) [Wilson and Atreya, 2004], so should havesimilar distributions. However, this is not the case, andC3H4 enrichment extends about 10–15� of latitude furthersouth than HC3N, which drops off very rapidly away fromthe pole. This implies an additional loss process for HC3N,which is consistent with previous observations of its verticalprofile [Teanby et al., 2007; Vinatier, 2007] and latitudinalenrichment [Teanby et al., 2008a, 2008b], perhaps incorpo-ration into photochemical hazes [Wilson and Atreya, 2003]or photolysis in the lower atmosphere [Clarke and Ferris,1996].
5.5. Meridional Circulation Returning Branch
[59] The distributions of all five tracer species are con-sistent with a meridional circulation cell that descendsbelow the condensation level (�100 km), causing subse-quent rain out of trace gases onto the north pole. This isconsistent with numerical models, which predict a returningbranch below 100 km. Condensation prevents homogeniza-tion of the atmosphere’s composition by removing trace gasenrichment before it can be advected to lower latitudes.
6. Conclusion
[60] Our main result is the much improved definition ofthe winter polar vortex chemical structure, which is exactly
E12003 TEANBY ET AL.: TITAN’S POLAR VORTEX
11 of 13
E12003

what is required to understand and model Titan’s polarprocesses. Figure 4 summarizes our overall interpretation ofdynamical processes currently occurring in Titan’s midwin-ter stratosphere and mesosphere. Observed compositiongradients provide strong evidence for a middle atmospheremixing barrier around 60�N. This is further corroborated bystrong potential vorticity gradients in the same region,suggesting a dynamical origin analogous with Earth’s polarvortices. Above the vortex jet a tracer-depleted mesosphericzone encroaches northward up to around 65�N, confiningenriched air to high latitudes, whereas in the stratospherebelow the vortex jet evidence for transport to lowerlatitudes is seen. This could be explained by a poleward/equatorward residual circulation above/below the vortexjet, possibly driven by small-scale gravity waves. Enrichedgas tongues extending away from the pole suggest hori-zontal mixing by gravity waves and barotropic instabilities.In addition, our results suggest that polymerization of theC2H2 tongue to C4H2 occurs at 200–300 km. Thesefeatures of Titan’s atmosphere have been impossible toobserve before now and provide new avenues to explore foratmospheric modeling.
[61] Acknowledgments. This research was funded by the UK Scienceand Technology Facilities Council. The authors would like to thank theCassini-CIRS instrument team, without which this research would not havebeen possible. We also thank Bryan Lawrence at the British AtmosphericData Centre for supplying the gravity wave parameterization code.
ReferencesAchterberg, R. K., B. J. Conrath, P. J. Gierasch, F. M. Flasar, and C. A.Nixon (2008a), Titan’s middle-atmospheric temperatures and dynamicsobserved by the Cassini Composite Infrared Spectrometer, Icarus, 194,263–277.
Achterberg, R. K., B. J. Conrath, P. J. Gierasch, F. M. Flasar, and C. A.Nixon (2008b), Observation of a tilt of Titan’s middle-atmospheric super-rotation, Icarus, 197, 549–555, doi:10.1016/j.icarus.2008.05.014.
Alexander, M. J., and K. H. Rosenlof (1996), Nonstationary gravity waveforcing of the stratospheric zonal mean wind, J. Geophys. Res., 101,23,465–23,474.
Andrews, D. G., J. R. Holton, and C. B. Leovy (1987), Middle AtmosphereDynamics, Academic, Orlando, Fla.
Bezard, B., A. Coustenis, and C. P. McKay (1995), Titan’s stratospherictemperature asymmetry—A radiative origin, Icarus, 113, 267–276.
Bird, M. K., et al. (2005), The vertical profile of winds on Titan, Nature,438, 800–802.
Brewer, A. W. (1949), Evidence for a world circulation provided by themeasurements of helium and water vapour distribution in the strato-sphere, Q. J. R. Meteorol. Soc., 75, 351–363.
Clarke, D. W., and J. P. Ferris (1996), Mechanism of cyanoacetylene photo-chemistry at 185 and 254 nm, J. Geophys. Res., 101, 7575–7584.
Coustenis, A., et al. (2007), The composition of Titan’s stratosphere fromCassini/CIRS mid-infrared spectra, Icarus, 189, 35–62.
Crespin, A., S. Lebonnois, S. Vinatier, B. Bezard, A. Coustenis, N. A.Teanby, R. K. Achterberg, P. Rannou, and F. Hourdin (2008), Diag-nostics of Titan’s stratospheric dynamics using Cassini/CIRS data andthe 2-dimensional IPSL circulation model, Icarus, 197, 556–571,doi:10.1016/j.icarus.2008.05.010.
Dobson, G. M. B. (1956), Origin and distribution of the polyatomic mole-cules in the atmosphere, Proc. R. Soc. London, Ser. A, 236, 187–193.
Flasar, F. M., et al. (2004), Exploring the Saturn system in the thermalinfrared: The Composite Infrared Spectrometer, Space Sci. Rev., 115,169–297.
Flasar, F. M., et al. (2005), Titan’s atmospheric temperatures, winds, andcomposition, Science, 308, 975–978.
Friedson, A. J. (1994), Gravity-waves in Titan’s atmosphere, Icarus, 109,40–57.
Fritts, D. C., and M. J. Alexander (2003), Gravity wave dynamicsand effects in the middle atmosphere, Rev. Geophys., 41(1), 1003,doi:10.1029/2001RG000106.
Fulchignoni, M., et al. (2005), In situ measurements of the physical char-acteristics of Titan’s environment, Nature, 438, 785–791.
Garcia, R. R., and B. A. Boville (1994), Downward control of the meanmeridional circulation and temperature distribution of the polar winterstratosphere, J. Atmos. Sci., 51, 2238–2245.
Gierasch, P. J. (1975), Meridional circulation and the maintenance of theVenus atmospheric rotation, J. Atmos. Sci., 32, 1038–1044.
Hines, C. O. (1997), Doppler-spread parameterization of gravity-wavemomentum deposition in the middle atmosphere. Part 2. Broad andquasi monochromatic spectra, and implementation, J. Atmos. Sol. Terr.Phys., 59, 387–400.
Hinson, D. P., and G. L. Tyler (1983), Internal gravity-waves in Titan’satmosphere observed by Voyager radio occultation, Icarus, 54, 337–352.
Hitchman, M. H., J. C. Gille, C. D. Rodgers, and G. Brasseur (1989), Theseparated polar winter stratopause—A gravity-wave driven climatologi-cal feature, J. Atmos. Sci., 46, 410–422.
Houghton, J. T. (2002), The Physics of Atmospheres, 3rd ed., CambridgeUniv. Press, Cambridge, U.K.
Houghton, J. T., F. W. Taylor, and C. D. Rodgers (1984), Remote Soundingof Atmospheres, Cambridge Univ. Press, Cambridge, U.K.
Hourdin, F., O. Talagrand, R. Sadourny, R. Courtin, D. Gautier, andC. McKay (1995), Numerical simulation of the general circulation ofthe atmosphere of Titan, Icarus, 117, 358–374.
Hourdin, F., S. Lebonnois, D. Luz, and P. Rannou (2004), Titan’s strato-spheric composition driven by condensation and dynamics, J. Geophys.Res., 109, E12005, doi:10.1029/2004JE002282.
Hubbard, W. B., et al. (1993), The occultation of 28-Sgr by Titan, Astron.Astrophys., 269, 541–563.
Irwin, P., N. Teanby, R. de Kok, L. Fletcher, C. Howett, C. Tsang,C. Wilson, S. Calcutt, C. Nixon, and P. Parrish (2008), The NEMESISplanetary atmosphere radiative transfer and retrieval tool, J. Quant.Spectrosc. Radiat. Transfer, 109, 1136–1150.
Jolly, A., Y. Benilan, and A. Fayt (2007), New infrared integrated bandintensities for HC3N and extensive line list for the n5 and n6 bendingmodes, J. Mol. Spectrosc., 242, 46–54.
Kunde, V., et al. (1996), Cassini infrared Fourier spectroscopic investiga-tion, Proc. Soc. Photo Opt. Instrum. Eng., 2803, 162–177.
Lacis, A. A., and V. Oinas (1991), A description of the correlated kdistribution method for modeling nongray gaseous absorption, thermalemission, and multiple-scattering in vertically inhomogeneous atmo-spheres, J. Geophys. Res., 96, 9027–9063.
Lait, L. R. (1994), An alternative form for potential vorticity, J. Atmos. Sci.,51, 1754–1759.
Leovy, C. B., and J. B. Pollack (1973), First look at atmospheric dynamicsand temperature variations on Titan, Icarus, 19, 195–201.
Luz, D., F. Hourdin, P. Rannou, and S. Lebonnois (2003), Latitudinaltransport by barotropic waves in Titan’s stratosphere. II. Results from acoupled dynamics-microphysics-photochemistry GCM, Icarus, 166,343–358.
Manzini, E., and N. A. McFarlane (1998), The effect of varying the sourcespectrum of a gravity wave parameterization in a middle atmospheregeneral circulation model, J. Geophys. Res., 103, 31,523–31,539.
McIntyre, M. E. (1989), On the Antarctic ozone hole, J. Atmos. Terr. Phys.,51, 29–33.
McIntyre, M. E., and T. N. Palmer (1983), Breaking planetary-waves in thestratosphere, Nature, 305, 593–600.
Muller-Wodarg, I. C. F., R. V. Yelle, N. Borggren, and J. H. Waite Jr.(2006), Waves and horizontal structures in Titan’s thermosphere, J. Geo-phys. Res., 111, A12315, doi:10.1029/2006JA011961.
Murgatroyd, R. J., and F. Singleton (1961), Possible meridional circulationsin the stratosphere and mesosphere, Q. J. R. Meteorol. Soc., 87, 125–135.
Niemann, H. B., et al. (2005), The abundances of constituents of Titan’satmosphere from the GCMS instrument on the Huygens probe, Nature,438, 779–784.
Rannou, P., S. Lebonnois, F. Hourdin, and D. Luz (2005), Titan atmospheredatabase, Adv. Space Res., 36, 2194–2198.
Read, P. L., P. J. Gierasch, B. J. Conrath, A. Simon-Miller, T. Fouchet, andY. H. Yamazaki (2006), Mapping potential-vorticity dynamics on Jupiter.I: Zonal-mean circulation from Cassini and Voyager 1 data, Q. J. R.Meteorol. Soc., 132, 1577–1603.
Richardson, M. I., A. D. Toigo, and C. E. Newman (2007), PlanetWRF: Ageneral purpose, local to global numerical model for planetary atmosphericand climate dynamics, J. Geophys. Res., 112, E09001, doi:10.1029/2006JE002825.
Rodgers, C. D. (1976), Retrieval of atmospheric temperature and composi-tion from remote measurements of thermal radiation, Rev. Geophys.Space Phys., 14(4), 609–624.
Rossow, W. B., and G. P. Williams (1979), Large-scale motion in the Venusstratosphere, J. Atmos. Sci., 36, 377–389.
Schoeberl, M. R., and D. L. Hartmann (1991), The dynamics of the strato-spheric polar vortex and its relation to springtime ozone depletions,Science, 251, 46–52.
E12003 TEANBY ET AL.: TITAN’S POLAR VORTEX
12 of 13
E12003
Sicardy, B., et al. (1999), The structure of Titan’s stratosphere from the 28Sgr occultation, Icarus, 142, 357–390.
Strobel, D. F. (2006), Gravitational tidal waves in Titan’s upper atmosphere,Icarus, 182, 251–258.
Teanby, N. A. (2007), Constrained smoothing of noisy data using splines intension, Math. Geol., 39, 419–434.
Teanby, N. A., and P. G. J. Irwin (2007), Quantifying the effect of finitefield-of-view size on radiative transfer calculations of Titan’s limb spectrameasured by Cassini-CIRS, Astrophys. Space Sci., 310, 293–305.
Teanby, N. A., et al. (2006), Latitudinal variations of HCN, HC3N, andC2N2 in Titan’s stratosphere derived from Cassini CIRS data, Icarus, 181,243–255.
Teanby, N. A., et al. (2007), Vertical profiles of HCN, HC3N, and C2H2
in Titan’s atmosphere derived from Cassini/CIRS data, Icarus, 186,364–384.
Teanby, N. A., P. G. J. Irwin, R. de Kok, and C. A. Nixon (2008a), Dyna-mical implications of seasonal and spatial variations in Titan’s strato-spheric composition, Philos. Trans. R. Soc. London, Ser. A, in press.
Teanby, N. A., et al. (2008b), Global and temporal variations in hydrocar-bons and nitriles in Titan’s stratosphere for northern winter observed byCassini/CIRS, Icarus, 193, 595–611.
Tokano, T., F. M. Neubauer, M. Laube, and C. P. McKay (1999), Seasonalvariation of Titan’s atmospheric structure simulated by a general circula-tion model, Planet. Space Sci., 47, 493–520.
Vinatier, S. (2007), Analyse des spectres infrarouges thermiques emis parl’atmosphere de Titan enregistres par l’instrument Cassini/CIRS, Ph.D.thesis, Univ. Denis Diderot Paris VII, Paris.
Vinatier, S., et al. (2007), Vertical abundance profiles of hydrocarbons inTitan’s atmosphere at 15�S and 80�N retrieved from Cassini/CIRS spec-tra, Icarus, 188, 120–138.
Walterscheid, R. L., and G. Schubert (2006), A tidal explanation for theTitan haze layers, Icarus, 183, 471–478.
Wilson, E. H., and S. K. Atreya (2003), Chemical sources of haze formationin Titan’s atmosphere, Planet. Space Sci., 51, 1017–1033.
Wilson, E. H., and S. K. Atreya (2004), Current state of modeling thephotochemistry of Titan’s mutually dependent atmosphere and iono-sphere, J. Geophys. Res., 109, E06002, doi:10.1029/2003JE002181.
�����������������������R. K. Achterberg and C. A. Nixon, Department of Astronomy, University
of Maryland, College Park, MD 20742, USA.B. Bezard and S. Vinatier, Observatoire de Paris, LESIA, Meudon,
F-92195 France.S. B. Calcutt, R. de Kok, P. G. J. Irwin, S. Osprey, P. L. Read, and N. A.
Teanby, Atmospheric, Oceanic and Planetary Physics, University ofOxford, Oxford OX1 3PU, UK. ([email protected])B. J. Conrath and P. J. Gierasch, Department of Astronomy, Cornell
University, Ithaca, NY 14853, USA.F. M. Flasar, NASA Goddard Space Flight Center, Code 693, Greenbelt,
MD 20771, USA.
E12003 TEANBY ET AL.: TITAN’S POLAR VORTEX
13 of 13
E12003