A Coupled Model of Titan's Atmosphere and Ionosphere
19
Icarus 147, 386–404 (2000) doi:10.1006/icar.2000.6448, available online at http://www.idealibrary.com on A Coupled Model of Titan’s Atmosphere and Ionosphere M. Banaszkiewicz Space Research Centre, Bartycka 18A, 00-716 Warsaw, Poland L. M. Lara European Space Agency, ESTEC, Space Science Department, Postbus 299, NL-2200AG Noordwijk, The Netherlands E-mail: [email protected] and R. Rodrigo, J. J. L ´ opez-Moreno, and G. J. Molina-Cuberos Instituto de Astrof´ ısica de Andaluc´ ıa-CSIC, Apdo. 3004, E-18080 Granada, Spain Received August 6, 1999; revised April 24, 2000 The paper deals with a coupled model of the upper atmosphere and ionosphere of Titan. The neutral atmosphere is described by a comprehensive photochemical model for 30 ◦ solar zenith angle with molecular and turbulent diffusive transport taken into account. At the upper boundary (1430 km) escaping flux of light molecules is included in boundary conditions, while near the lower boundary (32 km) condensation of less volatile species is introduced. The at- mosphere is coupled with the ionosphere via a large set of bi- and termolecular ion-neutral reactions. The ionosphere is considered to be in chemical equilibrium; in addition to ion-neutral reactions, recombination loss and ionization by solar photons as well as by saturnian magnetospheric electrons and photoelectrons appear in the mass balance equations. In the most advanced models, from several considered, heavy hydrocarbon ions and heavy nitriles are grouped and represented as two pseudoions. The peak ion density of 5200–6000 cm -3 , depending on the employed model, is obtained at a height of 970–1000 km, i.e., slightly lower than in previous ionospheric studies, which, however, were carried out for 60 ◦ so- lar zenith angle. The main ionospheric component near the peak is HCNH + , but at lower altitudes heavy nitriles followed by heavy hydrocarbons are more abundant, while near the upper boundary (>1400 km) CH + 5 and C 2 H + 5 compete with HCNH + . When ter- molecular reaction rates are increased to about 5 × 10 -23 cm 6 s -1 , as suggested by V. G. Anicich and M. J. McEwan (1997, Planet. Space Sci. 45, 897–923) for a nitrogen-dominated atmosphere, ion density profiles change significantly (50%) in the lower part of the ionosphere, at 700–800 km. The astonishing result by J. L. Fox and R. V. Yelle (1997, Geophys. Res. Lett. 24, 2179–2192), whose iono- spheric model prefers heavy pseudoions as main constituents near the peak, can, in part, be reproduced if the density of C 4 H 2 , a neutral molecule that controls heavy ion production rate, is increased by a factor of 100. The ionosphere is quite sensitive (up to 30% change in density) to variation in recombination rates and/or electron tem- perature profile. As it can be expected, densities of certain minor neutral components are severely influenced by coupling with ions, e.g., by an order of magnitude for CH 3 C 2 H. Surprisingly enough, even some major neutral species, like CH 4 , show a 50% change in the thermospheric density profile when ion–neutral reactions are introduced. This proves that for molecules in a shallow chemical equilibrium with other neutral species, even a small perturbation caused by reactions with ions can result in a significant change of the density. An interesting and reassuring conclusion has been ob- tained for HCN: to reach the agreement with the observed mixing ratio profile in the thermosphere, the loss due to polymerization should be considered together with a strongly productive interac- tion with ions. In view of the results obtained for the neutral atmo- sphere it seems that coupling with ions can be as important as other factors that shape the neutral density profiles and should be taken into account in future models that will aim at data interpretation from the Cassini/Huygens mission. c 2000 Academic Press Key Words: Titan; atmosphere; ionosphere. 1. INTRODUCTION The atmosphere and the upper ionosphere of Titan have been intensively studied since Voyager 1 encounter with the satellite in November 1980. Following the early work by Strobel (1982), the first comprehensive post-Voyager model of the neutral atmo- sphere by Yung et al. (1984) took into account several dozens of constituents and included the most important physical processes. Uncertain parameters, like some chemical reaction rates and the altitude profile of the turbulent diffusion coefficient, were tuned up to bring the model as close as possible to the first analy- sis of Voyager infrared observations (Hanel et al. 1981, Maguire et al. 1981, Kunde et al. 1981, Samuelson et al. 1983). The main chemical cycles were identified and the overall composition of the atmosphere was derived. This model, which has served for 386 0019-1035/00 $35.00 Copyright c 2000 by Academic Press All rights of reproduction in any form reserved.
Transcript of A Coupled Model of Titan's Atmosphere and Ionosphere

Icarus147, 386–404 (2000)
doi:10.1006/icar.2000.6448, available online at http://www.idealibrary.com on
A Coupled Model of Titan’s Atmosphere and Ionosphere
M. Banaszkiewicz
Space Research Centre, Bartycka 18A, 00-716 Warsaw, Poland
L. M. Lara
European Space Agency, ESTEC, Space Science Department, Postbus 299, NL-2200AG Noordwijk, The NetherlandsE-mail: [email protected]
and
R. Rodrigo, J. J. L´opez-Moreno, and G. J. Molina-Cuberos
Instituto de Astrofısica de Andalucıa-CSIC, Apdo. 3004, E-18080 Granada, Spain
Received August 6, 1999; revised April 24, 2000
The paper deals with a coupled model of the upper atmosphereand ionosphere of Titan. The neutral atmosphere is described by acomprehensive photochemical model for 30◦ solar zenith angle withmolecular and turbulent diffusive transport taken into account. Atthe upper boundary (1430 km) escaping flux of light molecules isincluded in boundary conditions, while near the lower boundary(32 km) condensation of less volatile species is introduced. The at-mosphere is coupled with the ionosphere via a large set of bi- andtermolecular ion-neutral reactions. The ionosphere is consideredto be in chemical equilibrium; in addition to ion-neutral reactions,recombination loss and ionization by solar photons as well as bysaturnian magnetospheric electrons and photoelectrons appear inthe mass balance equations. In the most advanced models, fromseveral considered, heavy hydrocarbon ions and heavy nitriles aregrouped and represented as two pseudoions. The peak ion densityof 5200–6000 cm−3, depending on the employed model, is obtainedat a height of 970–1000 km, i.e., slightly lower than in previousionospheric studies, which, however, were carried out for 60◦ so-lar zenith angle. The main ionospheric component near the peakis HCNH+, but at lower altitudes heavy nitriles followed by heavyhydrocarbons are more abundant, while near the upper boundary(>1400 km) CH+5 and C2H+5 compete with HCNH+. When ter-molecular reaction rates are increased to about 5× 10⁻²³ cm6 s−1,as suggested by V. G. Anicich and M. J. McEwan (1997, Planet.Space Sci. 45, 897–923) for a nitrogen-dominated atmosphere, iondensity profiles change significantly (50%) in the lower part of theionosphere, at 700–800 km. The astonishing result by J. L. Fox andR. V. Yelle (1997, Geophys. Res. Lett. 24, 2179–2192), whose iono-spheric model prefers heavy pseudoions as main constituents nearthe peak, can, in part, be reproduced if the density of C4H2, a neutralmolecule that controls heavy ion production rate, is increased by afactor of 100. The ionosphere is quite sensitive (up to 30% changein density) to variation in recombination rates and/or electron tem-perature profile. As it can be expected, densities of certain minor
neutral components are severely influenced by coupling with ions,e.g., by an order of magnitude for CH3C2H. Surprisingly enough,even some major neutral species, like CH4, show a 50% change inthe thermospheric density profile when ion–neutral reactions areintroduced. This proves that for molecules in a shallow chemicalequilibrium with other neutral species, even a small perturbationcaused by reactions with ions can result in a significant change ofthe density. An interesting and reassuring conclusion has been ob-tained for HCN: to reach the agreement with the observed mixingratio profile in the thermosphere, the loss due to polymerizationshould be considered together with a strongly productive interac-tion with ions. In view of the results obtained for the neutral atmo-sphere it seems that coupling with ions can be as important as otherfactors that shape the neutral density profiles and should be takeninto account in future models that will aim at data interpretationfrom the Cassini/Huygens mission. c© 2000 Academic Press
Key Words: Titan; atmosphere; ionosphere.
1. INTRODUCTION
been
2),
ofses.
d theedaly-
offor
386
0019-1035/00 $35.00Copyright c© 2000 by Academic PressAll rights of reproduction in any form reserved.
The atmosphere and the upper ionosphere of Titan haveintensively studied sinceVoyager 1encounter with the satellitein November 1980. Following the early work by Strobel (198the first comprehensive post-Voyagermodel of the neutral atmo-sphere by Yunget al.(1984) took into account several dozensconstituents and included the most important physical procesUncertain parameters, like some chemical reaction rates analtitude profile of the turbulent diffusion coefficient, were tunup to bring the model as close as possible to the first ansis ofVoyagerinfrared observations (Hanelet al.1981, Maguireet al.1981, Kundeet al.1981, Samuelsonet al.1983). The mainchemical cycles were identified and the overall compositionthe atmosphere was derived. This model, which has served

A
o
T
a
o
td
s
diao
t,nn
H
(oat
witheac-resetslar
ular
ereandrilesain
.lec-
on-
em-
o-odele.
t andalsheen-d toiga-i)an, theA–che foras atific
ass
theem-eremassross-
trichere.tailedat-
th a
TITAN’S ATMOSPHERE: IONS
years as a reference to all detailed studies of physical proceoccurring in Titan’s atmosphere, has been later followed byengineering model of the atmosphere containing updatedtude profiles of the temperature and of the N2 number density(Lellouch and Hunten 1987). In the decade following the wby Yung et al. (1984), several atmospheric components pdicted by the model, like CO, H2O, HCN, HC3N, and CH3CN,have been detected and their vertical profiles determined (guy et al. 1990; Bezardet al. 1992, 1993; Nollet al. 1996;Gurwell and Muhleman 1997; Hidayatet al. 1997; Cousteniset al. 1998). Also,Voyagerinfrared and UV data have beereanalyzed (Cousteniset al. 1989, Strobelet al. 1992), and inconsequence, new constraints on the stratospheric mixing rand on the vertical profiles of several constituents have bset. Independently, a number of reaction rates used in the mhave been updated, and a new scheme of methane photby Ly-α has been introduced (Mordauntet al.1993). All thesenew results stimulated the development of a new generatiophotochemical models (Toublancet al.1995, Laraet al.1996).
As compared with the neutral atmosphere data, informaprovided byVoyagerabout Titan’s ionosphere was scarce. Raoccultation measurements (Lindalet al. 1983) set upper limitson the electron number density: 3000 cm−3 on the evening sideand 5000 cm−3 on the morning side of Titan. Recently thoobservations were reanalyzed by Birdet al. (1997), who con-cluded that the electron density should be even lower (atminator): 2500 cm−3. A pattern of draped magnetic field linehas been revealed by magnetic field measurements (Kieveand Russel 1983). Electron and ion densities measured alonVoyagerorbit showed an increase in Titan’s wake that was crelated with the temperature decrease (Hartleet al.1982). Sincethe depth of magnetic field diffusion into Titan’s atmospherepends on the plasma production rate, which in turn is determby the neutral atmosphere density profile, photoionization rand the ionizing flux of suprathermal magnetospheric electra self-consistent model of Titan’s ionosphere and the dramagnetic field is not easily constructed. The first step in thisrection was made by Ip (1990), who considered a 1D modeplasma and magnetic field transport into the atmosphere indiffusion–convection approximation, assuming that the elecimpact ionization is a dominating ion production mechanismwas indicated by earlier observations (Strobel and Shema1982). The main conclusion from this work was that the iospheric peak density of about 5000 cm−3 occurs at an altitude∼1200 km. The most abundant ion appeared to be HCN+.A different ionospheric model was constructed by Kelleret al.(1992), who calculated the ion production rate due to magtospheric electrons using a sophisticated numerical codeet al.1992) and concluded that the ionization by solar photis at least four times more effective. They considered a stestate 1D photochemical model of the ionosphere and, despidifferences with Ip’s (1990) approach, obtained HCNH+ as the
main constituent near the ionospheric peak at a height of ab1050 km.ND NEUTRAL CONSTITUENTS 387
ssesthealti-
rkre-
an-
n
tioseenodellysis
n of
ionio
e
ter-slsong theor-
e-nedte,ns,
peddi-l ofthe
ronasskyo-
ne-Gannsdy-e all
A new stage in Titan’s ionospheric studies was reachedthe publication of an extended data base of ion–neutral rtions by Anicich and McEwan (1997), which comprised mothan 600 records and was by far larger than the reactionused in previous models. In addition to common bimolecureactions, Anicich and McEwan considered also termolecreactions between ions and neutrals, where N2 was supposedto act as the catalyzer third body. Fox and Yelle (1997) wfirst to introduce the new data into their ionospheric codeobtained a remarkable result: heavy hydrocarbons and nitwith the number of H atoms not less than 3 became the mionospheric constituents, with HCNH+ shifted to the third placeIn their model, however, ionization due to magnetospheric etrons was neglected. Later on, Cravenset al. (1998) ran theircode with Anicich and McEwan (1997) reaction rates but, ctrary to Fox and Yelle’s (1997) result, derived again HCNH+ asthe major ion component.
All ionospheric models that have been discussed so farployed neutral density profiles by Yunget al. (1984), with theexception of the very recent work by Galandet al.(1999), whichmakes use of the neutral model by Toublancet al. (1995). Inthis study we make a step forward in modeling Titan’s ionsphere by introducing an up-to-date neutral atmosphere mby Laraet al.(1996) and coupling it with the ionospheric codIn that way, neutral and ion models become interdependenall their constituents form a joint system. The specific goof the study are the following: (i) to check how strongly tneutral and ion chemistry are coupled, (ii) to obtain ion dsity profiles for an improved neutral atmosphere model ancompare them with the results of previous ionospheric investtions (Ip 1990, Kelleret al.1992, Fox and Yelle 1997), and (iito find out how termolecular reactions (Anicich and McEw1997) can influence the ionospheric model. Independentlywork is stimulated by an expected outcome of the joint NASESA Cassini/Huygensmission to the saturnian system, whiwas successfully launched in 1997. The planned arrival datthe Cassinispacecraft is January 2005, and the mission hnominal termination date of July 2008. One of the 12 scieninstruments on board of the spacecraft is the ion-neutral mspectrometer (INMS) (Kasprzaket al.1996). Its objectives areto measure the ion and neutral composition and structure inupper atmosphere of Titan, to study Titan atmospheric chistry, to investigate the interaction of Titan’s upper atmosphwith the magnetosphere and solar wind, and to measure theof ions and neutral species encountered during ring plane cings and icy satellite flybys (NASA 1989). Both theCassiniandHuygensinstruments will produce detailed mass spectromemeasurements of the ions and the neutrals in Titan’s atmospTo interpret those measurements, it is essential to have a deknowledge of the ion chemistry occurring in this fascinatingmosphere.
The paper is organized in several sections. We start wi
outpresentation of the neutral atmosphere model, followed by adescription of the ionospheric model. In the next section, the
e
rs
i
n
e
,e
ag
c
theon-tions
km,caleixing
fortionqui-
by
ab-ericof
pthandsolso-d intmo-
ed,O
sp ofl-hisndit
s atab-
o ni-
be-as
aran ofesse.withd itn’sthe
388 BANASZKIEW
coupling between two models is considered. Then we presenresults of calculations and discuss them. Finally, we concludepaper with a summary of the most important issues considand those that should be addressed in the future.
2. NEUTRAL ATMOSPHERE
The model of Titan’s neutral atmosphere presented here issically taken from the Laraet al.(1996) work. It differs from theearlier comprehensive study by Yunget al.(1984) and Toublancet al.(1995) in the following aspects: (i) condensation of neutconstituents in the lower stratosphere is based on the diffugrowth of ice crystals, (ii) dissociation profiles of molecular ntrogen (by cosmic ray impact and EUV radiation between 8and 1000A) to the end-states N(4S) and N(2P) are included (seealso Laraet al. 1999), (iii) source profiles of water moleculeresulting from meteoroid ablation are introduced, and (iv) a neddy diffusion profile is proposed to better match the theoretmixing ratios to available observations. The model is construcfor Titan’s mid-latitude atmosphere and refers to 30◦ solar zenithangle.
The system of steady-state continuity equations for eachtral species reads
Pi − ni l i = 1
r 2
∂(r 28i )
∂r, (1)
wherePi is the photochemical production rate of thei species,ni is the number density, andl i is the volumic specific loss ratat altitudez. The vertical flux8i comprises two terms:
8i = −ni Di
(1
ni
∂ni
∂r+ 1+ αi
T
∂T
∂r+ 1
Hi
)− ni K
(1
ni
∂ni
∂r+ 1
T
∂T
∂r+ 1
H
). (2)
In (2), T is the atmospheric temperature,Di is the moleculardiffusion coefficient,Hi is the individual scale height,K is theeddy diffusion coefficient,αi is the thermal diffusion coefficientandH is the bulk atmospheric scale height. All these parametexcept forT(r ), K (r ), andDi (r ), which are inputs to the modecalculations, are computed according to the standard proce(Rodrigoet al.1990).
The density profile of N2 is adopted from Yelleet al. (1997).Atmospheric constituents that are calculated from Eqs. (1)(2) are divided into two subsets: (i) hydrocarbons and oxycompounds, H, H2, 1CH2, 3CH2, CH3, CH4, C2H2, C2H4, C2H6,C3H2, C3H4, C3H6, C3H8, C4H2, CH2O, CH3OH, CH2CO, H2O,CO,CO2, C6H2, C8H2; and (ii) nitrogen compounds, N, N(4S),C3N, C2N2, C4N2, HCN, H2CN, HC3N, H2C3N, CH3CN.
The vertical distributions of the hydrocarbon and oxygen copounds were calculated without including the nitrogen spe
(except for N2, of course). These distributions were then usto calculate the concentrations of the nitrogen compoundsICZ ET AL.
t thethered
ba-
alivei-00
sewcalted
eu-
rs,ldure
nden
m-ies
each group, the continuity equations were solved for alllong-lived constituents, using a Crank–Nicholson scheme. Cvergence in each family was reached when successive iterayielded solutions differing by less than 1 part in 104. The alti-tude range is [40, 1432] km, and the altitude step equals 6which provides approximately 5 and 15 vertical steps per sheight in the stratosphere and mesosphere, respectively. Mratios are imposed as boundary conditions at the lower endlong-lived species. They are calculated either from saturalaws (condensible species) or from local photochemical elibrium (volatiles: H, CH3, HCO, O(3P), N(4S)), or extrapolatedfrom observations (CH4, C2H4, CO, H2). At the upper bound-ary, zero flux is assumed for all species excepting H, H2, O(3P),and N(4S), which are allowed to escape with velocities givenJeans’ thermal escape mechanism.
Photochemistry in Titan’s stratosphere is initiated by thesorption of solar radiation and the dissociation of atmosphmolecules. Laraet al.(1996) used a simple classical treatmentthe photolysis processes, similar to that presented by Yunget al.(1984). The absorption of the solar radiation at the given deis taken into account as a function of both the wavelengthsolar zenith angle (Chapman function). Absorption by aerobelow 240 km is included via transmission coefficient. Altgether 114 neutral–neutral chemical reactions are includethe model. Some of the chemical reactions depend on the aspheric neutral temperature, which is taken from the Yelleet al.(1997) recommended model.
Following earlier models (Samuelsonet al.1983, Yunget al.1984), an external source of water molecules is introducwhich is necessary to provide OH radicals to react with Cin order to produce CO2. All previous photochemical modelhave modeled the O source as a downward flux at the tothe boundary. Englishet al. (1996) developed a model to caculate the interplanetary dust flux into Titan’s atmosphere. Tmodel computes the input of meteoritic material at Titan, aby combining the results with an ablation model, it makespossible to estimate leading and trailing deposition profileTitan for 100% water ice interplanetary meteoroids. Thislation results into a H2O net source of 3.1× 106 cm−2 s−1. Inorder to adequately describe the chain of reactions leading ttrile molecule production, HCN in particular, the N2 dissociationprofile has been recalculated. Specifically, an updated profilelow 600 km, which results from galactic cosmic ray impact, hbeen applied to obtain the production rate of N(4S), the atomicspecies which is essential in nitrile compound production. Let al. (1999) have recently suggested that the incorporatioHCN in Titan’s atmospheric haze may be an important procaffecting the HCN profile and the C/N ratio in Titan’s hazThis incorporation process has been modeled by analogythe loss of carbon through formation of polyacetylenes, anis also considered in this neutral–ion coupled model of Titaatmosphere. Condensation of hydrocarbons and nitriles in
ed. Inlower stratosphere via diffusive growth of ice crystals has beenquantitatively assessed using new data on saturation laws as a

o
id
a.e
oa
i
a
o
e
ft
in
e
n,
diedevenoubthescon-there-
andha-ch,by
ns isandandionsainave
hanadions
. Toetsouttheatesd
theataar ashosehichrceareion
ationrbonseu-(Foxunt,
no-
TITAN’S ATMOSPHERE: IONS A
function of temperature and aerosol distributions borrowed frCabaneet al.(1992) and Fr`ereet al.(1990). A new vertical pro-file of the eddy diffusion coefficient has been employed wthe aim to better fit the CH4 thermospheric vertical profile anthe stratospheric abundance of minor compounds. Althoughapproach was partially successful, the new profile considerimproved the agreement between observations and theoryextensive description of the above sketched and other featurthe neutral atmosphere model is presented in Laraet al.(1996).
3. IONOSPHERE
Titan’s ionosphere has not been directly observed byVoyagerinstruments, but an upper limit on the electron density of ab5000 cm−3 has been derived from plasma wave experimentlater reduced to 2400± 1100 cm−3 (Bird et al. 1997). Modelsby Ip (1990) and Kelleret al. (1992) have revealed a complcated structure of ionospheric species with a maximum den≈ 5000 cm−3 at an altitude of 1050–1100 km with HCNH+
being the main ion near the peak. Our model is, in its mfeatures, similar to that of Kelleret al. (1992), but uses differ-ent input data: (i) photoionization rates are calculated for szenith angle 30◦, to be consistent with the neutral atmosphemodel, instead of 60◦ or 90◦ as used by Kelleret al.; (ii) theneutral atmosphere density profile is changed with respecthat by Yunget al. (1984); (iii) magnetospheric electron anphotoelectron fluxes differ from those obtained by Ganet al.(1992) and employed by Kelleret al.(1992) in their ionosphericmodel; and (iv) the number of ionospheric constituents islarged and the set of reactions increased due to a new datacomplied recently by Anicich and McEvan (1997). On the othhand, we have neglected the coupling between thermal electemperature and energy influx via suprathermal electron fluthat was considered by Kelleret al. (1992). Instead, we tooktheir electron temperature profile A, which corresponds toionization for a solar zenith angle of 60◦ and is closest to whawe can expect in our case. In the next subsections we presenionospheric model in detail. The most recent general reviewTitan’s ionosphere, which summarizes all modeling work doso far, was given by Nagy and Cravens (1998).
3.1. Constituents, Reactions, and Equations
Titan’s ionosphere is exceptional, among the bodies ofSolar System, in its composition and a variety of occurrspecies. Since the atmosphere is highly reduced, there aretraces of oxygen-bearing compounds. Most of the constituare either hydrocarbon or nitrilic ions stemming from two maatmospheric species, N2 and CH4. Since both neutral and ionmolecules with a large number of atoms are relatively staand easily produced in reactions of simple species, abundaof many heavy compounds are significant. In consequencecomprehensive ionospheric model should take into account m
tens of ion compounds. All of them can react, in principle, wineutral components which would result in thousands of reactND NEUTRAL CONSTITUENTS 389
m
th
theblyThes of
utnd
-sity
in
larre
t tod
n-baseertronxes
ull
t ourof
ne
theg
onlyntsin
bleces
anyanyth
channels. Although many of these reactions are well stuexperimentally and their rates are accurately determined,more are not quantitatively assessed, which casts some don the modeling results for many minor ions. Two approacare possible: (i) to assume that the rates of reactions notsidered in the literature are negligible as compared withreferenced ones, or (ii) to estimate the efficiency of missingactions by employing available data for similar compoundsby using the kinetic theory that theoretically describes mecnisms of intermolecular interaction. We prefer the first approaand therefore we will use only the reaction rates confirmedexperimental studies. Our data base for ion–neutral reactiotaken from the comprehensive survey compiled by AnicichMcEwan (1997). Apart from binary reactions between ionsneutrals, we also include in the model termolecular reactwith molecular nitrogen acting as a catalyst (third body). Agthe problem arises as to what to do if termolecular reactions hbeen experimentally studied for an ambient gas different tN2. According to Anicich and McEwan (1997), this might leto gross underestimation of the role of termolecular reactin the ionospheric chemistry since N2 is very efficient in stimu-lating ion–neutral reactions as compared with other speciescheck this hypothesis we perform our calculations for two sof termolecular reaction rates; the first one is copied, withany changes, from the Anicich and McEwan paper, while insecond we increase the rate of all termolecular reaction rto a level of 5× 10⁻²³ cm6 s−1 recommended by Anicich anMcEwan as appropriate for the nitrogen atmosphere.
The way to introduce ion components in the model isfollowing. We analyze one by one all reactions from the dbase and include in the model ion components that appereactants (on the right-hand side of the reaction scheme). Tion species that appear as products in all reactions in wthey can be found are included in the model only if their sourates, due to photoionization or electron impact ionization,known. Otherwise they are considered as an “unspecified”that acts as an effective sink in the system of mass conservequations. In some cases, heavy ions with a number of caatoms exceeding three are grouped together into so-called “pdoions” and introduced as single species to the equationsand Yelle 1997). Two such pseudoions are taken into accoone representing heavy hydrocarbons (CxHy, x≥ 3) and anothergrouping heavy nitriles (CxHyNz, x≥ 3). At the end we obtain55 or 57 (with pseudoions included) ion components of the iosphere: H+, H+2 , H+3 , C+, CH+, CH+2 , CH+3 , CH+4 , CH+5 , C2H+,C2H+2 , C2H+3 , C2H+4 , C2H+5 , C2H+6 , C3H+, C3H+2 , C3H+3 , C3H+4 ,C3H+5 , C3H+6 , C3H+7 , C4H+2 , C4H+3 , C4H+5 , C4H+7 , C5H+5 , C6H+4 ,C6H+5 , C6H+6 , C6H+7 , C7H+7 , N+, NH+, NH+2 , N+2 , N2H+, H2O,CN+, HCN+, HCNH+, CNC+, CCN+, CHCCN+, CHCCNH+,C2H3CN+, C2H3CNH, HC5N+, C2N+2 , CO+, HCO+, HOC+,CH2OH+, NO+, C3N+.
The system of ionospheric equations reads
ion Pj − nj l j = 0 (3)

athbfetre
t
a
e
e
e
a
ares
ations I
d inby
ungon
ioneric
e500
eryres-s to-
f hot
ferdedeedtheeld,tos,
undup
turnthe
elds tot at-ag-1D
d. Inllerareal to(ii)
390 BANASZKIEW
and describes steady-state local photochemical equilibriumgiven altitude. We neglect the ambipolar diffusion since insubram configuration of the magnetic field we apply, it wouldperpendicular to the magnetic field and therefore not too eftive. The production terms in (3) are due to ionization of neuspecies by either solar photons (photoionization) or magnspheric electrons and photoelectrons, but also result frombi- and termolecular reactions. Similarly, the loss terms inclurecombination and chemical reactions. Reaction terms induce nonlinearity to (3). The system (3) is complementedthe charge conservation equation∑
j
n j = ne. (4)
In consequence, the electron densityne is the last unknown in(3) and (4).
3.2. Photoionization and Recombination
Photoionization production rates of two main ions, N+2 andCH+4 , are calculated as functions of altitude from the standformula (Kelleret al.1992)
Pionj (z) = nj (z)
∫ λmax
λmin
I (z, λ)σi j (λ) dλ, (5)
where the photon flux at the altitudez
I (z, λ) = I∞(λ) exp
(−
2∑k=1
σ absk (λ)Nk(z)
)(6)
is a function of the incident fluxI∞ that enters the atmosphernj (z) is the number density of thej th neutral component,σi j (λ)andσ abs
k (λ) are photoionization and photoabsorption cross stions, respectively, andNk(z) is the effective column densitycalculated according to the Chapman expression (Kelleret al.1992).
Altitude profiles of production rate for several other specifor which photoionization rates
kj =∫ λmax
λmin
I∞(λ)σi j (λ) dλ (7)
are known (e.g., values from Huebner (1991) rescaled to Titorbit), can be derived from the equation
Pionj (z) = nj (z)kj
I (z, λ)
I∞(λ). (8)
Finally, in case no appropriate data about photoionization rexisted in the literature,kj values for species in question wedetermined applying the rule of chemical similarity to tho
constituents in which photoionization rates were fairly well etablished.ICZ ET AL.
t aeec-alto-thedero-by
rd
,
c-
s,
n’s
tes
e
Recombination rates were either taken Kelleret al.(1992) orassumed equal to 7.5× 10⁶ s−1 when the experimental data forconsidered ion are missing. Photoionization and recombinarates for the ions included in the model are listed in Tableand II.
The incident fluxI∞(λ) compiled by Kelleret al.(1992), withthe same discretization into 50 lines 50 bins, was first usethe model. In that way we were able: (i) to test our codecomparing its results with those presented by Kelleret al. forthe same neutral density profiles, in this case taken from Yet al.(1984), and (ii) to observe the difference in ion productirates when the new neutral atmosphere model of Laraet al.(1996) was introduced. It occurred that the total ion productrate due to solar photons was quite similar for both atmosphmodels. When the incident flux by Kelleret al. was comparedwith the recent model by Galandet al.(1999), it appeared that thformer contained 20% more energy in the spectrum belowA than the latter. Therefore, we decided to decrease Kelleret al.flux in the energy range mentioned to match the Galandet al.model.
3.3. Magnetospheric Electrons and Photoelectrons
Titan’s orbit lies in the outer magnetosphere of Saturn, vclose to the magnetopause. At times, when the solar wind psure gets stronger and the magnetospheric boundary moveward Saturn, Titan appears in the magnetosheat region ocompressed solar wind plasma. During theVoyager 1encounterwith Titan, i.e., the situation that all ionospheric models reto, Titan was well inside Saturn’s magnetosphere, surrounby relatively hot and rare ionized gas that moved with a spof about 150 km/s with respect to Titan (30% smaller thancorotation speed). Since Titan has no intrinsic magnetic fithe interaction of saturnian plasma flow with Titan is similarthe interaction of solar wind with Venus. This similarity extendin particular, to a pattern of magnetic field lines draped aroa nonmagnetic body. In the case of Titan, the field lines pilenear the subram point on the leading side of Titan and thengently toward the flanks of the planet. On the trailing side,magnetic wake was predicted by theory and observed inVoyagerdata (Nesset al.1982).
Magnetospheric plasma, which moves along magnetic filines, interacts with the neutral atmosphere and contributethe production of ionospheric species. Several models thatempted to self-consistently describe the coupling of the mnetic field and ionospheric plasma, starting from a simplemodel (Ip 1991) to sophisticated 2D (Cravenset al. 1998) and3D ones (Ledvina and Cravens 1998), have been publishethis paper, we follow a different approach, introduced by Keet al. (1992), by assuming that: (i) the magnetic field linesparabola with the radius of curvature at the subram point equthe distance from the subram point to the center of Titan, and
s-the parabola closest to Titan reaches an altitude of 725 km at thesubram point (3300 km from the planet’s center). Suprathermal
A
dis-
aize
t theux
wo-
rd-
esearesons
u-ec-lec-
onaresring
d byhensity
nceshengle
tronthe
TITAN’S ATMOSPHERE: IONS
TABLE IPhotoionization Rates
Reactiona Rateb,c (×106 s−1)
1 H==>H+ + e 0.073
2 H2==>H+2 + e 0.054
3 H2==>H+ +H+ e 0.0095
4 1CH2==>CH+2 + e 0.76
5 3CH2==>CH+2 + e 0.76
6 CH3==>CH+3 + e 0.76
7 CH4==>CH+4 + e
8 CH4==>CH+3 +H+ e
9 CH4==>CH+2 +H2+ e
10 CH4==>CH+ +H+H2+ e
11 CH4==>H+ +CH3+ e
12 C2H2==>C2H+2 + e 0.78
13 C2H2==>C2H+ +H+ e 0.074
14 C2H4==>C2H+4 + e 0.58
15 C2H4==>C2H+3 +H+ e 0.29
16 C2H4==>C2H+2 +H2+ e 0.20
17 C2H6==>C2H+6 + e 0.065
18 C3H2==>C3H+2 + e 0.75
19 C3H4==>C3H+4 + e 0.75
20 C3H6==>C3H+6 + e 0.75
21 C3H8==> Z+ e 0.75
22 C4H2==>C4H+2 + e 0.75
23 N==>N+ + e 0.19
24 N(4S)==>N+ + e 0.19
25 N2==>N+2 + e
26 N2==>N+ +N+ e
27 H2O==>H2O+ + e 0.33
28 H2O==>OH+ +H+ e 0.055
29 H2O==>O+ +H2+ e 0.0058
30 H2O==>H+ +OH+ e 0.023
31 C3N==>C3N+ + e 0.33
32 C2N2==>C2N+2 + e 0.33
33 C4N2==> Z+ e 0.33
34 HCN==>HCN+ + e 0.75
35 H2CN==>H2CN+ + e 0.75
36 HC3N==>HC3N+ + e 0.75
37 H2C3N==>H2C3N+ + e 0.75
38 CH2O==>CH2O+ + e 0.40
39 CH2O==>HCO+ +H+ e 0.20
40 CH2O==>CO+ +H2+ e 0.12
41 CH3OH==>CH3OH+ + e 0.50
42 CH3OH==>CH3O+ +H+ e 0.12
43 CH3OH==> Z+ e 0.12
44 CH2CO==> Z+ e 0.75
45 CH3CN==> Z+ e 0.75
46 CO==>CO+ + e 0.31
47 CO==>C+ +O+ e 0.079
48 CO==>O+ +C+ e 0.0060
49 CO2==>CO+2 + e 0.66
ND NEUTRAL CONSTITUENTS 391
TABLE I—Continued
Reactiona Rateb,c (×106 s−1)
50 CO2==>CO+ +O+ e 0.050
51 CO2==>O+ +CO+ e 0.064
52 CO2==>C+ +O2+ e 0.029
53 C6H2==>C6H+2 + e 0.7554 C8H2==>C8H+2 + e 0.75
55 C2H6==>C2H+5 +H+ e 0.055
56 C2H6==>C2H+4 +H2+ e 0.24
57 C2H6==>C2H+3 +H+H2+ e 0.08
58 C2H6==>C2H+2 + 2H2+ e 0.05
a Z denotes ions not considered in the model.b At 1 AU; in the code the rates are normalized to Saturn’s orbit.c Photoionization rates for N2 and CH4 are calculated from Eq. (5).
magnetospheric electrons that show a Maxwellian velocitytribution in a half-sphere far away from Titan (ne = 0.1 cm−3,Te = 200 eV, pitch angleα <π/2) move along in a paraboldirection towards the atmosphere where they start to ionneutral components and produce secondary electrons. Asame time their velocity distribution changes. The electron fltransported along magnetic field lines is calculated by a tstream code, similarly as in the Ganet al. (1992) approach. Inthis method, electrons are divided into two subfluxes accoing to their pitch angle: forward- (0≤α <π/2) and backward-(π/2≤α≤π ) moving electrons. The interaction of those fluxwith the atmosphere is described by a pair of coupled linintegro-differential equations, in which the following processare taken into account: (i) elastic backscattering of electron atmospheric species (N2, CH4), (ii) degradation of electronenergy in inelastic collisions (ionization and excitation of netral components), (iii) production of photoelectrons and sondary electrons, and (iv) energy exchange with thermal etrons (Nagy and Banks 1970). In the case of N2, inelastic crosssections for excitation and ionization are taken from Solomet al.(1988). Backscattering in elastic and inelastic collisionsborrowed from the same paper. For CH4 we use cross sectionrecommended by Gan and Cravens (1992), while backscatteprobabilities are assumed to be the same for N2. Since some ofthe cross sections we use are different from those employeGanet al. (1992), the results of both models differ even for tsame neutral atmosphere model. When the atmospheric deis changed from the Kelleret al. (1992) profiles to Laraet al.(1996) values, but the cross sections are the same, differein the electron flux energy distribution are not significant. Tresults change slightly with the decrease of solar zenith afrom 60◦, as used by Kelleret al. (1992), to 30◦ preferred inour models (Fig. 1). In Fig. 1 magnetospheric and photoelecfluxes are presented for three parabolas with distances from
subram point to Titan’s center equal to 3300, 3600, and 4000 km,respectively.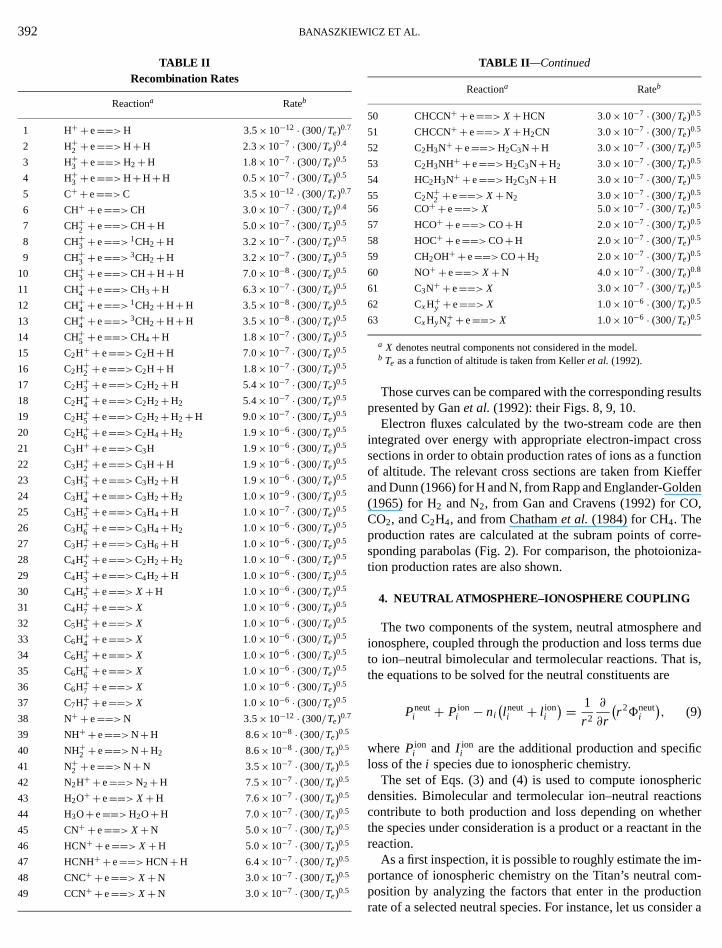
ults
enss
ionferen,
rre-za-
anddueis,
c
ricnserthe
-m-
392 BANASZKIEW
TABLE IIRecombination Rates
Reactiona Rateb
1 H+ + e==>H 3.5× 10−12 · (300/Te)0.7
2 H+2 + e==>H+H 2.3× 10−7 · (300/Te)0.4
3 H+3 + e==>H2+H 1.8× 10−7 · (300/Te)0.5
4 H+3 + e==>H+H+H 0.5× 10−7 · (300/Te)0.5
5 C+ + e==>C 3.5× 10−12 · (300/Te)0.7
6 CH+ + e==>CH 3.0× 10−7 · (300/Te)0.4
7 CH+2 + e==>CH+H 5.0× 10−7 · (300/Te)0.5
8 CH+3 + e==> 1CH2+H 3.2× 10−7 · (300/Te)0.5
9 CH+3 + e==> 3CH2+H 3.2× 10−7 · (300/Te)0.5
10 CH+3 + e==>CH+H+H 7.0× 10−8 · (300/Te)0.5
11 CH+4 + e==>CH3+H 6.3× 10−7 · (300/Te)0.5
12 CH+4 + e==> 1CH2+H+H 3.5× 10−8 · (300/Te)0.5
13 CH+4 + e==> 3CH2+H+H 3.5× 10−8 · (300/Te)0.5
14 CH+5 + e==>CH4+H 1.8× 10−7 · (300/Te)0.5
15 C2H+ + e==>C2H+H 7.0× 10−7 · (300/Te)0.5
16 C2H+2 + e==>C2H+H 1.8× 10−7 · (300/Te)0.5
17 C2H+3 + e==>C2H2+H 5.4× 10−7 · (300/Te)0.5
18 C2H+4 + e==>C2H2+H2 5.4× 10−7 · (300/Te)0.5
19 C2H+5 + e==>C2H2+H2+H 9.0× 10−7 · (300/Te)0.5
20 C2H+6 + e==>C2H4+H2 1.9× 10−6 · (300/Te)0.5
21 C3H+ + e==>C3H 1.9× 10−6 · (300/Te)0.5
22 C3H+2 + e==>C3H+H 1.9× 10−6 · (300/Te)0.5
23 C3H+3 + e==>C3H2+H 1.9× 10−6 · (300/Te)0.5
24 C3H+4 + e==>C3H2+H2 1.0× 10−9 · (300/Te)0.5
25 C3H+5 + e==>C3H4+H 1.0× 10−7 · (300/Te)0.5
26 C3H+6 + e==>C3H4+H2 1.0× 10−6 · (300/Te)0.5
27 C3H+7 + e==>C3H6+H 1.0× 10−6 · (300/Te)0.5
28 C4H+2 + e==>C2H2+H2 1.0× 10−6 · (300/Te)0.5
29 C4H+3 + e==>C4H2+H 1.0× 10−6 · (300/Te)0.5
30 C4H+5 + e==> X+H 1.0× 10−6 · (300/Te)0.5
31 C4H+7 + e==> X 1.0× 10−6 · (300/Te)0.5
32 C5H+5 + e==> X 1.0× 10−6 · (300/Te)0.5
33 C6H+4 + e==> X 1.0× 10−6 · (300/Te)0.5
34 C6H+5 + e==> X 1.0× 10−6 · (300/Te)0.5
35 C6H+6 + e==> X 1.0× 10−6 · (300/Te)0.5
36 C6H+7 + e==> X 1.0× 10−6 · (300/Te)0.5
37 C7H+7 + e==> X 1.0× 10−6 · (300/Te)0.5
38 N+ + e==>N 3.5× 10−12 · (300/Te)0.7
39 NH+ + e==>N+H 8.6× 10−8 · (300/Te)0.5
40 NH+2 + e==>N+H2 8.6× 10−8 · (300/Te)0.5
41 N+2 + e==>N+N 3.5× 10−7 · (300/Te)0.5
42 N2H+ + e==>N2+H 7.5× 10−7 · (300/Te)0.5
43 H2O+ + e==> X+H 7.6× 10−7 · (300/Te)0.5
44 H3O+ e==>H2O+H 7.0× 10−7 · (300/Te)0.5
45 CN+ + e==> X+N 5.0× 10−7 · (300/Te)0.5
46 HCN+ + e==> X+H 5.0× 10−7 · (300/Te)0.5
47 HCNH+ + e==>HCN+H 6.4× 10−7 · (300/Te)0.5
48 CNC+ + e==> X+N 3.0× 10−7 · (300/Te)0.5
49 CCN+ + e==> X+N 3.0× 10−7 · (300/Te)0.5
ICZ ET AL.
TABLE II—Continued
Reactiona Rateb
50 CHCCN+ + e==> X+HCN 3.0× 10−7 · (300/Te)0.5
51 CHCCN+ + e==> X+H2CN 3.0× 10−7 · (300/Te)0.5
52 C2H3N+ + e==>H2C3N+H 3.0× 10−7 · (300/Te)0.5
53 C2H3NH+ + e==>H2C3N+H2 3.0× 10−7 · (300/Te)0.5
54 HC2H3N+ + e==>H2C3N+H 3.0× 10−7 · (300/Te)0.5
55 C2N+2 + e==> X+N2 3.0× 10−7 · (300/Te)0.5
56 CO+ + e==> X 5.0× 10−7 · (300/Te)0.5
57 HCO+ + e==>CO+H 2.0× 10−7 · (300/Te)0.5
58 HOC+ + e==>CO+H 2.0× 10−7 · (300/Te)0.5
59 CH2OH+ + e==>CO+H2 2.0× 10−7 · (300/Te)0.5
60 NO+ + e==> X+N 4.0× 10−7 · (300/Te)0.8
61 C3N+ + e==> X 3.0× 10−7 · (300/Te)0.5
62 CxH+y + e==> X 1.0× 10−6 · (300/Te)0.5
63 CxHyN+z + e==> X 1.0× 10−6 · (300/Te)0.5
a X denotes neutral components not considered in the model.b Te as a function of altitude is taken from Kelleret al. (1992).
Those curves can be compared with the corresponding respresented by Ganet al. (1992): their Figs. 8, 9, 10.
Electron fluxes calculated by the two-stream code are thintegrated over energy with appropriate electron-impact crosections in order to obtain production rates of ions as a functof altitude. The relevant cross sections are taken from Kiefand Dunn (1966) for H and N, from Rapp and Englander-Gold(1965) for H2 and N2, from Gan and Cravens (1992) for COCO2, and C2H4, and from Chathamet al. (1984) for CH4. Theproduction rates are calculated at the subram points of cosponding parabolas (Fig. 2). For comparison, the photoionition production rates are also shown.
4. NEUTRAL ATMOSPHERE–IONOSPHERE COUPLING
The two components of the system, neutral atmosphereionosphere, coupled through the production and loss termsto ion–neutral bimolecular and termolecular reactions. Thatthe equations to be solved for the neutral constituents are
Pneuti + Pion
i − ni(l neuti + l ion
i
) = 1
r 2
∂
∂r
(r 28neut
i
), (9)
wherePioni and I ion
i are the additional production and specifiloss of thei species due to ionospheric chemistry.
The set of Eqs. (3) and (4) is used to compute ionosphedensities. Bimolecular and termolecular ion–neutral reactiocontribute to both production and loss depending on wheththe species under consideration is a product or a reactant inreaction.
As a first inspection, it is possible to roughly estimate the importance of ionospheric chemistry on the Titan’s neutral co
position by analyzing the factors that enter in the productionrate of a selected neutral species. For instance, let us consider a
the center
TITAN’S ATMOSPHERE: IONS AND NEUTRAL CONSTITUENTS 393
FIG. 1. Spectra of magnetospheric electrons and photoelectrons at six different positions on magnetic field lines with subram distances fromof Titan equal to 3300, 3600, and 4000 km. The lefts panel corresponds to 30◦ solar zenith angle, the right to 60◦. The positions are at: (1)s= −15,000 km,
(2) s= −5,000 km, (3)s= −1 km, (4)s= 1 km, (5)s= 5,000 km, (6)s= 15,000 km, as measured from the subram point. Spectra 1 to 3 are for inward fluxes,,thoslt
ua
romto
andore,ion
s in
spectra 4 to 6 for outward fluxes.
bimolecular reaction,P = kn1n2, wherek is the reaction rateand n1 and n2 are the densities of reacting molecules. Inion–neutral reaction, one of those densities corresponds tionized species. Typical values ofk in neutral–neutral reactionare on the order of 10−11 cm3 s−1, while those for ion–neutrareactions are two orders of magnitude larger. Assuming than1
is the same neutral density in neutral–neutral and ion–nereactions we want to compare, one should consider the r
of possible values ofn2, first when it corresponds to a neutracomponent, and next when it describes an ion. In the thermean
tralnge
sphere, typical mixing ratios of neutral components range f10−10 to 10−1. Concisely, at a height of 1000 km, it translatesnumber densities on the order of 1.2× 10⁻¹ to 3.8× 108 cm−3.The expected ion densities at this altitude are between 1103 cm−3 for the most abundant species. It seems, therefthat neutral components can be significantly affected bychemistry if their mixing ratio is less than 10−5. Two factorscan change this conservative estimate: (i) if transport term
lo-(1) are neglected in a first approximation, the neutral densityobtained for the case with no coupling with ions results from a
W
(
so)e
srh
ioio
tralnotlves,ber65..
estno-nlytiontakendro-lly,urth
casetheweel 3,iths ofoth
g. 3.nem-unt.strys notion–ere
ein-ages-hy-
een
theni-stryons,% ofse in
Neeofile
394 BANASZKIE
FIG. 2. Production rates of N+2 and CH+4 due to photoionization (thicklines) and ionization by magnetospheric electrons and photoelectronslines). Solid lines are for 30◦ solar zenith angle, dotted for 60◦.
balance between loss and production terms. Hence, even aperturbation of this balance, e.g., due to ion–neutral reactican change neutral densities of abundant components. (iiseveral ions, recombination is quite efficient and can compas production mechanism, with neutral–neutral reactions.
The method of solving the coupled system of equationas follows. We start with a zeroth iteration, in which neutequations are solved without any contribution from ions. Tthe iteration loop is initiated with two sets of equations solvconsecutively in each step: (i) ion equations with current neudensities (from the previous step), and (ii) neutral equatwith the production and loss terms due to ion–neutral react
passed from (i). At the end of each iteration step, the convergeICZ ET AL.
thin
mallns,Forte,
isalenedtralnsns
criterion is checked: the relative difference in densities of neuand ion components from two consecutive iterations shouldbe larger than 0.01%. Neutral and ion equations are, themsesolved iteratively at each step of the loop. The typical numof iteration steps when solving the coupled system is about
5. RESULTS
We have run four different models, starting from the simplone and adding, each time, a new physical effect in the iospheric code. In the first model, photoionization was the oionizing mechanism considered. In the second model, ionizaby magnetospheric electrons and photoelectrons was alsointo account. Two pseudoions corresponding to heavy hycarbons and nitriles were introduced in the third model. Finaincreased termolecular reaction rates were applied in the fomodel. The solar zenith angle is always 30◦.
The neutral densities have changed as compared with thewhere ion chemistry was not included. On the other hand,differences among the four models are minor. Therefore,show here, as a representative example, the results of modi.e., the model with all ionizing processes included and wheavy species grouped into pseudoions. The mixing ratiomost of the neutral components are shown in Figs. 3–6 for bcases: with and without coupling to ion chemistry.
The major atmospheric constituents are presented in FiSurprisingly, the CH4 mixing ratio has significantly changed ithe upper atmosphere: it is a factor of 1.5 smaller when chical terms due to ion–neutral reactions are taken into accoThe column-integrated chemical loss by ionospheric chemirepresents 25% of the total loss rate. This increased loss ibalanced by an enhancement on the production rate byneutral chemistry. The mixing ratios in the upper thermosphare still in reasonable agreement with UV observations byVoy-ager (Strobel et al. 1992). Changes of similar order can bobserved in C2H6, where the column-integrated loss rateduced by ion–neutral reactions represents similar percent(i.e.,∼25%), whereas C2H4 and H2 number densities are enhanced 50%. In Fig. 4, the vertical profiles of some otherdrocarbons are illustrated. The increase of CH3 density is dueto a net production rate of 2.96× 108 cm−2 s−1 by ion–neutralreactions. Other species show substantial differences betwthe cases with ions switched off or on: C2H2 density at high al-titudes increases by a factor of 3 when ions are included, C4H2
is larger by a factor of 4, but it can hardly be compared withdensity of CH3C2H, which increases about one order of magtude. The production rate of methyl acetylene by ion chemi(Pion) is about the same as that from neutral–neutral reactiwhereas the loss by reactions with ions only represents a 30loss by neutral chemistry. As a results, there is a net increathe production rate, which enhances CH3C2H number density.Nitriles, in Fig. 6, show a variety of patterns: the profile of HCwith ion coupling and without considering polymerization (sFig. 7) is as much as 3 times higher, at all heights, than the pr
ncewithout it. When polymerization of this compound is considered
TITAN’S ATMOSPHERE: IONS AND NEUTRAL CONSTITUENTS 395
FIG. 3. Altitude mixing ratio profiles of hydrocarbons. Stars and associated error bars represent the observed thermospheric profile of CH4. Thick lines,
ion–neutral chemistry on; thin lines, ion–neutral chemistry off.tts
r
-n
n
achogen
in the formPploy–HCN = 1.5× 10⁻¹³ [HCN]1.5 (Laraet al.1999),theoretical results get closer to available observations. Insense, we conclude that by introducing a loss to the hazefor HCN in the ion–neutral photochemical modeling, it is posble to simultaneously reproduce the hydrogen cyanide obsetions and C2 hydrocarbon profiles in Titan’s lower stratospheFigure 7 shows the HCN profile obtained when (i) N2 disso-
ciation is only by EUV solar radiation (800–1000A). This cyanide (as already noted by Laraet al.1999). (iii) Ion–neutralFIG. 4. Altitude mixing ratio profiles of hydrocarbons. The vertical solid line represents the estimated thermospheric (atz≥ 825 km) C2H2 mixing ratio from
Voyager/UVS (Smithet al.1982). Thick lines, ion–neutral chemistry on; thinhisermi-
rva-e.
case is equivalent to the nominal model by Laraet al. (1996)after checkingJ12 in their Table I. In that table, it is erroneously stated that N2 photodissociation occurs in the regio80–800A whereas N2+ hν→ 2N(2D) indeed comes about ithe spectral region 800–1000A. (ii) Ion-neutral chemistry istaken into account, but no HCN polymerization. This approseriously overestimates the stratospheric abundance of hydr
lines, ion–neutral chemistry off.

396
ing raat eve
BANASZKIEWICZ ET AL.
ta
es
er-
ro-ries
FIG. 5. Altitude mixing ratio profiles of oxygen compounds. Th
chemistry and polymerization of HCN are considered inmodeling, which represents the best approximation to availobservations (Tanguyet al.1990, Hidayatet al.1997, Gurwelland Muhleman 1997). HC3N relative abundance noticeably dcreases in the thermosphere, whereas in the mesosphere it
tio is slightly higher. CH3CN number density is diminishedof the atmosphere: escape flux at the top of the atmosphere, up-ble III we
ry altitude, even by an order of magnitude at 1400 km. Theward flux or condensation flux at the bottom. In TaFIG. 6. Altitude mixing ratio profiles of nitrogen compounds. Th
ick lines, ion–neutral chemistry on; thin lines, ion–neutral chemistry off.
heble
-mix-
oxygen-bearing compounds, H2O, CO, CO2, O(3P), and HCO,are somewhat modified by coupling with ion species in the thmosphere (Fig. 5).
The immediate consequence of variation of the density pfiles is the change of fluxes of neutral molecules at the bounda
ick lines, ion–neutral chemistry on; thin lines, ion–neutral chemistry off.

a
TITAN’S ATMOSPHERE: IONS AND NEUTRAL CONSTITUENTS 397
FIG. 7. Comparison between the observed HCN vertical profiles and the different model cases. Squares, Tanguyet al.(1990); triangles, Hidayatet al.(1997);stars, Gurwell and Muhleman (1997). The observations are represented by symbols instead of lines for clarity, but the altitudes at which the symbolsre plotted
do not represent specific altitudes at which the measurements were made. Dastt ionac-
line: N2 dissociation by EUV radiation only, no ion–neutral chemistry. Dash
give the integrated production and loss rates (total and by iospheric chemistry) for all neutral and long-lived species in
model. All integrated rates are referred to the tropopause. Iondensity profilecount photoionization as the only source of charged species. The00 cm−3 at a height
s are shown in Figs. 8–12, for the four cases con-TABLE IIIColumn-Integrated Rates for Long-Lived Compounds Considered in the Model
Component Ptotal L total Pion L ion (P − L)total
CH4 4.02× 10⁸ 1.04× 10¹⁰ 3.65× 10⁸ 2.59× 10⁹ −1.00× 10¹⁰
C2Hc2 6.15× 10⁸ 5.11× 10⁹ 5.90× 10⁸ 4.87× 10⁹ 1.03× 10⁹
C2Hc6 2.85× 10⁹ 1.65× 10⁸ 1.08× 10⁶ 4.38× 10⁷ 2.69× 10⁹
CH3C2Hc 2.57× 10⁸ 2.56× 10⁸ 1.17× 10⁸ 5.62× 10⁷ 1.26× 10⁶
C3Hc8 3.96× 10⁷ 2.34× 10⁶ 0.00 5.35× 10⁴ 3.73× 10⁷
C4Hc2 6.48× 10¹⁰ 6.48× 10¹⁰ 8.00× 10⁷ 1.19× 10⁸ 3.05× 10⁶
He 1.02× 10¹⁰ 5.17× 10⁹ 2.95× 10⁹ 9.73× 10⁶ 5.00× 10⁹
He2 7.25× 10⁹ 1.12× 10⁸ 1.70× 10⁹ 1.11× 10⁸ 7.14× 10⁹
CO 1.05× 10⁷ 1.15× 10⁷ 1.87× 10⁶ 1.90× 10⁶ −9.08× 10⁵
COc2 2.19× 10⁶ 9.71× 10⁴ 1.61× 10³ 1.47× 10² 2.09× 10⁶
N2 1.24× 10⁹ 1.86× 10⁹ 1.13× 10⁹ 1.40× 10⁹ −6.18× 10⁸
HCNc 4.53× 10⁹ 4.48× 10⁹ 13.9× 10⁹ 8.68× 10⁸ 4.68× 10⁷
HC3Nc 1.86× 10⁹ 1.84× 10⁹ 4.86× 10⁴ 9.13× 10⁷ 2.20× 10⁷
electron density reaches its peak of about 53
Note.Superscripts are defined as follows: “total”= ion–neu3); “c” = species suffering condensation; “e” = species esc
Solid line: ion–neutral chemistry on and HCN incorporation into the haze.h-dotteded line: ion–neutral chemistry on and no HCN polymerization.
no-hesidered. In each figure two panels with the most abundancomponents are shown. The first model (Fig. 8) takes into
tral coupling; “ion”= P andL by ion chemistry only (Modelaping at the upper boundary (1432 km).

r
-
llreon
td
t
odelto-
ally,aredingt-la bigibu-thesof
y ofrge.
arer re-anf
398 BANASZKIEW
FIG. 8. Density of electrons and major ions for Model 1.
of 1000 km. Both numbers can be compared with the cosponding values by Kelleret al.(1992): 5500 cm−3 at 1050 km.The most abundant ion is HCNH+ in agreement with the models by Ip (1990) and Kelleret al. (1992). Qualitatively, the ob-tained ion profiles are quite similar to those published by Keet al. (1992). Their results, however, should not be compadirectly with this model, but rather with model 3, which takinto account similar physical effects (magnetospheric electrpseudoions). In the second model (Fig. 9) ionization by magtospheric electrons and photoelectrons is introduced. The meffect, as one could expect, is an overall increase of the elecdensity, by about 35% at 1400 km, 10% near the peak, ana factor of 2 at about 750 km. The sudden drop of electron dsity at 725 km is an artifact of our modeling and results froswitching on the magnetospheric source of ionization aboveheight: the magnetic field line closest to Titan reaches 725at the subram point. Apart from a change of density values,
shape of ion profiles is very similar to that obtained in modelThe next model is, probably, the best approximation of TitanICZ ET AL.
re-
eredsns,e-ainronby
en-mhiskmthe
ionosphere of all cases presented here (Figs. 10, 11). As in m2, photoionization and electron impact ionization by magnespheric electrons and photoelectrons are included. Additionfollowing the Fox and Yelle (1997) approach, two pseudoionsadded to the chain of ion–neutral reactions: one corresponto heavy hydrocarbons (CxH+y , x≥ 3) and another represening heavy nitriles (CxHyN+z , x≥ 3). The densities of individuaions are almost the same as in model 2; there is, however,increase in electron density below 1000 km due to the contrtion from pseudoions. In fact, below 850 km, they becometwo major ions, CxHyNz, x≥ 3, being the dominant one. It ievident that the production of heavy ions in the lower partthe ionosphere is very effective and results in large densitthose species even if their recombination rates are quite laThe peak electron density increases to 6140 cm−3 at 980 km.In Fig. 11, the densities of minor ionospheric componentsshown. In the fourth model, we have increased termoleculaaction rates (Fig. 12). As discussed by Anicich and McEw(1997), in the presence of N2 as the third molecule, rates o
1.’s FIG. 9. Density of electrons and major ions for Model 2.

A
.etF
k
fi
ed.or asesle-
loss, re-
udeiza-
n
ts is
ughsity
l-stry
TITAN’S ATMOSPHERE: IONS
FIG. 10. Density of electrons and major ions for Model 3.
many reactions should be significantly higher than thosetained in experiments with other ambient gases. They arguethe reaction rates as high as∼10−23 cm6 s−1 are quite possibleIn order to check how such an increase will affect ionosphchemistry we have set the rates of most termolecular reacat the value recommended by Anicich and McEwan (1997).comparison, the old and the new values of reaction rateslisted in Table IV.
The density profiles are presented in Fig. 12. Above 850there is no apparent difference from model 3. Below that altituthe role of termolecular reactions grows rapidly with decreasheight, in correlation with increasing density of N2. At 700 km,termolecular reactions with high rates result in a factor odecrease in the electron density. The number density ofdecreases proportionally.
6. DISCUSSION
As we have expected density profile of several minor netral components (CH3C2H, HC3N, and CH3CN, for instance)
ND NEUTRAL CONSTITUENTS 399
ob-that
ricionsorare
m,de,ing
2ons
u-
drastically changed when ion–neutral coupling was introducHowever, quite significant changes can be noticed also ffew major constituents as well. To find out which procesdominate in modifying neutral density we analyzed all revant ion–neutral reactions for CH4, HCN, and C2H4. Figures13, 14,and 15 contain the most important production andmechanisms for methane, hydrogen cyanide, and ethylenespectively. Also, production and loss rates at 1000 km altit(near the ionospheric peak) are presented together with iontion and recombination rates. In the case of CH4, its loss in reac-tions with CH+3 and N+2 is not at all compensated by productio(Fig. 13). Hence, the density of CH4 obtained in our models issmaller than that calculated by Laraet al. (1996). For HCN themost important mechanism coupling ion–neutral constituenits production through recombination of HCN+; therefore the netincrease of the density is observed for this component, altholoss terms are quite significant (Fig. 14) too. Finally, the denincrease of C2H4 follows from a single reaction of C2H+5 withHCN, which by far exceeds any other contribution (Fig. 15). Athough neutral–neutral reactions dominate the chemi
FIG. 11. Density of minor ions for Model 3.

400 BANASZKIEWICZ ET AL.
TABLE IVTermolecular Rates
Reaction Standard ratesa New ratesb
1 H+ +H2==>H+3 3.00E-29 3.00E-29
2 H+3 +H2==> Zc 9.00E-30 9.00E-30
3 C+ +H2==>CH+ 2.10E-29 2.10E-29
4 CH+ +N2==> Z 5.30E-29 5.30E-29
5 CH+2 +N2==> Z 1.40E-28 5.00E-23
6 CH+2 +CO==> Z 2.00E-27 5.00E-23
7 CH+3 +H2==>CH+5 1.10E-28 5.00E-23
8 CH+3 +N2==>CH+5 5.40E-29 5.00E-23
9 CH+3 +H2O==> Z 6.00E-25 5.00E-23
10 CH+3 +HCN==> Z 1.07E-23 1.07E-23
11 CH+3 +CH3CN==> Z 1.90E-22 1.90E-22
12 CH+3 +HC3N==> Z+HCN 3.80E-23 3.80E-23
13 CH+3 +HC3N==> Z 3.80E-23 3.80E-23
14 CH+3 +C2N2==> Z 8.00E-24 8.00E-24
15 CH+3 +CO==> Z 2.30E-27 5.00E-23
16 C2H+2 +H2==>C2H+4 1.30E-27 1.30E-27
17 C2H+2 +C2H2==> Z 1.60E-26 1.60E-26
18 C2H+2 +HCN==>C2H3CN+ 1.00E-27 1.00E-27
19 C2H+3 +H2==>C2H+5 2.00E-29 2.00E-29
20 C2H+3 +C2H2==>C4H+5 2.98E-25 2.98E-25
21 C2H+3 +C2N2==> Z 5.35E-28 5.35E-28
22 C2H+4 +H2==>C2H+6 1.00E-30 1.00E-30
23 C2H+4 +C2H4==> Z 6.30E-26 6.30E-26
24 C2H+4 +HCN==> Z 2.45E-29 2.45E-29
25 C2H+5 +H2==> Z 1.00E-30 1.00E-30
26 C2H+5 +CH4==> Z 1.40E-30 1.40E-30
27 C2H+5 +C2H2==>C4H+7 1.30E-25 1.30E-25
28 C2H+5 +C2H4==> Z 5.00E-29 5.00E-29
29 C2H+5 +HCN==> Z 5.00E-29 5.00E-29
30 C3H+ +H2==>C3H+3 2.30E-27 2.30E-27
31 C3H+ +HCN==> Z 3.60E-28 3.60E-28
32 C3H+ +CO==> Z 2.90E-27 2.90E-27
33 C3H+2 +H2==>C3H+4 1.00E-30 1.00E-30
34 C3H+3 +H2==>C3H+5 1.00E-30 1.00E-30
35 C3H+3 +C4H2==> Z 3.60E-28 3.60E-28
36 C3H+4 +H2==>C3H+6 1.00E-30 1.00E-30
37 C3H+5 +H2==>C3H+7 1.00E-30 1.00E-30
38 C3H+5 +C2H4==> Z 5.40E-26 5.40E-26
39 C3H+5 +C3H6==> Z 6.40E-26 5.40E-26
40 C3H+5 +HCN==> Z 1.00E-26 1.00E-26
41 C3H+5 +HC3N==> Z 1.00E-23 1.00E-23
42 C4H+2 +C2H2==>C6H+4 2.30E-26 5.00E-23
43 C4H+2 +C4H2==> Z 4.70E-28 5.00E-23
44 C4H+2 +CO==> Z 2.30E-27 5.00E-23
45 C4H+3 +C2H2==> Z 1.50E-26 5.00E-23
46 C4H+3 +C4H2==> Z 3.60E-28 1.10E-23
47 N+ +N2==> Z 4.00E-29 5.00E-23
48 N+2 +N2==> Z 6.30E-29 5.00E-23
49 N2H+ +H2==> Z 4.00E-30 5.00E-23
50 N2H+ +N2==> Z 4.00E-30 5.00E-23
51 H2O+ +N2==> Z 1.00E-28 5.00E-23
52 H3O+ +C2H2==> Z 8.00E-28 8.00E-23
TABLE IV—Continued
Reaction Standard ratesa New ratesb
53 H3O+ +C2H4==> Z 2.00E-27 2.00E-27
54 H3O+ +H2O==> Z 3.40E-27 3.40E-27
55 CN+ +CO==> Z 1.00E-28 1.00E-28
56 HCNH+ +C2H2==> Z 5.00E-29 5.00E-29
57 HCNH+ +C2H4==> Z 7.00E-27 7.00E-27
58 HCNH+ +HCN==> Z 4.20E-28 4.20E-28
59 CNC+ +HCN==> Z 1.80E-28 1.80E-28
60 CCN+ +HCN==> Z 1.80E-28 1.80E-28
61 CHCCN+ +HCN==> Z 1.80E-28 1.80E-28
62 CHCCN+ +HC3N==> Z 1.20E-22 1.20E-22
63 CHCCN+ +CO==> Z 1.30E-29 1.30E-29
64 C2N2+ +C2N2==>C3H+6 1.70E-23 1.70E-23
65 CO+ +N2==>C3H+6 2.10E-29 2.10E-29
66 HCO+ +H2==>C3H+6 5.30E-31 5.30E-31
67 HCO+ +CO==>C3H+6 2.40E-30 2.40E-30
a According to Anicich and McEwan (1997).b Used in Model 4.c Z denotes ions not included in the model.
FIG. 12. Density of electrons and major ions for Model 4.

A
io
u
d
t
rht
o
o
re-nt
-ions
ng,l and
del
s weretys andllepo-the
iffi-hye byuld
chxe ofd
TITAN’S ATMOSPHERE: IONS
FIG. 13. Flowchart of CH4 reaction scheme. The numbers give reactrates (cm−3 s−1) at 1000 km.
prevailing in Titan’s atmosphere, some minor compounds, sas CH3C2H, HC3N, and CH3CN, are highly affected by ion–neutral reactions. Since, our modeling has been restrictethe thermosphere, the stratospheric mixing ratio of most ofcompounds is still in agreement withVoyager/IRIS observations(Cousteniset al. 1989). For those species where ion chemisinfluences their number density, extrapolation of the results tostratosphere is not straightforward because (i) ionization souin the stratosphere are less effective than in the thermosp(ii) turbulent transport plays a decisive role, and (iii) catalycycles or direct neutral–neutral reactions are very importanthat atmospheric region. Most of the conclusions derived fr
FIG. 14. Flowchart of HCN reaction scheme.
ND NEUTRAL CONSTITUENTS 401
n
ch
tothe
rythecesere,ict inm
FIG. 15. Flowchart of C2H4 reaction scheme.
the neutral modeling by Laraet al.(1996, 1999) are pertinent tthis ion–neutral coupled model.
The ion chemistry is, in our models, quite similar to that psented by Kelleret al.(1998) in their Fig. 6. The most abundaion, HCNH+, is produced mainly in two reactions, C2H+5 withHCN and HCN+ with CH4, and is predominantly lost via recombination. Heavy hydrocarbons accumulate in ladder reactwith C2H2 and C2H4.
Our results differ from the earlier models by Kelleret al.(1992, 1998) and by Fox and Yelle (1997). It is not surprisiconsidering that we use a different neutral atmosphere modeapply it for a 30◦ solar zenith angle instead of 60◦, as the othersdid. In general, the ion density profiles computed in our moare much closer to these in the model by Kelleret al. (1992)than to those by Fox and Yelle (1997). The main ion specieidentify are CH+5 and C2H+5 in the upper part of the ionosphe(between 1200 and 1430 km), HCNH+ near the electron densipeak (between 900 and 1200 km), and heavy hydrocarbonnitriles in the lower ionosphere (below 900 km). Fox and Ye(1997) report that, according to their model, the major comnent in the considered range of altitudes (700–1430 km) isheavy hydrocarbon pseudoion and that HCNH+ contributes toa mere 20% of the electron density at its maximum. It is dcult, from the short description of their model, to find out wFox and Yelle’s profiles are so different than ours and thosKeller et al. In an attempt to understand what the cause cobe, we have run our model 3 with the density of C4H2 increasedby a factor of 100, resulting in a diacetylene mixing ratio mucloser to that obtained by Yunget al. (1984) and used by Foand Yelle. In that way we increased significantly the loss ratHCNH+. Indeed, the density of HCNH+ is then greatly reduce
and the main ion near the ionospheric peak becomes CxHy,x≥ 3 (Fig. 16). On the other hand, HCNH+ is still the most
W
s
1e
l
e
cr
a
17,total
. Theatess offrom
reweren-
r cc)talom-readoui
anem
402 BANASZKIE
FIG. 16. Density of electrons and major ions for Model 3 when the denof C4H2 is increased by a factor of 100.
abundant ion in the upper part of the ionosphere, betweenand 1400 km, contrary to the results of Fox and Yelle. The pelectron density is reduced to 5440 cm−3.
As we have already mentioned, we do not calculate etron temperature together with suprathermal electron flux,rather employ the vertical profile given by Kelleret al. (1992).In that way we loose self-consistency between the threements of the complicated system of atmospheric phenom(i) suprathermal electron transport, (ii) thermal electron enebalance, and (iii) ionospheric chemistry (Kelleret al.1992). Inorder to check how sensitive our solutions are to the chanin the electron temperature, we have run the ionosphericwith the increased electron temperature profile adopted fRoboz and Nagy (1994). They considered vertical heat flowthe ionosphere starting from a temperature of∼190 K at 700 km,the same as Kelleret al. (1992), and reaching about 1800 K1500 km (to be compared with 1050 K of Kelleret al.at the same
height). Such a large increase of temperature should significainfluence recombination rates and, consequently, ion denICZ ET AL.
ity
100ak
ec-but
ele-na:
rgy
gesodeomin
t
profiles. That the effect really occurs one can see in Fig.where densities of major ion components are shown. Theelectron density decreases by∼15% and reaches∼5230 cm−3 atthe peak. The densities of components change accordinglyrelated effect of ion density dependence on recombination ris illustrated in Fig. 18, where recombination rate constantheavy hydrocarbons and heavy nitriles have been changed1× 10−6 to 5× 10⁻⁷ cm−3 s−1, but the electron temperatuprofile was kept the same as in model 3 (Fig. 10). This slorecombination rate directly results in a 30% increase of ion dsity in the lower ionosphere. The peak density at∼1000 kmincreases, however, only moderately (by 200 electrons pedue to the relatively small contribution of heavy ion to the toplasma content in this region. The range of considered recbination rates corresponds, more or less, to the values spin the literature. In a recent experimental paper by Lehfaet al.(1997) recombination rates of light alkanes, from meth(CH+5 ) to octane (C8H+17), are reported to span the interval fro5.5× 10−7 to 8.3× 10⁻⁷ cm−3 s−1 with a 30% error bar.
ntlysity
FIG. 17. Density of electrons and major ions for Model 3 when the electrontemperature is taken from Roboz and Nagy (1994).

m
tt
p
A
n
etwiT
ed
im-rons.
km,on.oto-. At
ced:r, atlec-, bydel
elec-sub-ion
m In-ch
n’s
on of
itan.
ion
ho-
par-
gerion.
. E.
. Ev-
nal
6.tan.
TITAN’S ATMOSPHERE: IONS A
FIG. 18. Density of electrons and major ions for Model 3 when the recobination rates for heavy ions are decreased by a factor of 2.
One of the difficulties in an appropriate modeling of mulcomponent Titan’s ionosphere is the problem of closure ofequation system. It happens that in ion–neutral reactions,molecules with an increasing number of atoms are easilyduced. Moreover, their reaction rates with neutral componedo not seem to decrease significantly with increasing mass.result, to properly describe the ionosphere, one should takeaccount hundreds or thousands of ion components endingchain at ions heavy enough to either (i) become broken dowcollisions with neutrals or (ii) recombine at a fast rate. Suchapproach is, however, not possible, since reaction rates asas photoionization and reaction rates of heavy molecules arknown. The way out is to introduce pseudoions, represenwhole groups of species chemically similar, as we did folloing the previous modelers. In our case, two such pseudowere considered: heavy hydrocarbons and heavy nitriles.next step in this direction has already been done by Kelleret al.
(1998): they split heavy hydrocarbon group into many subpoulations with different average molecular mass, e.g., HxC+y withND NEUTRAL CONSTITUENTS 403
-
i-heionro-ntss a
intothein
anwellnot
ing-
onshe
xi < x< xj , yi < y< yj . Again, the progress here is hamperby the lack of knowledge of reaction rates.
An interesting aspect of this study is the role of electronpact ionization by magnetospheric electrons and photoelectAccording to our calculations and in agreement with Kelleret al.(1992), in the main ionospheric layer between 900 and 1200the dominating mechanism of ion production is photoionizatiAt the peak, ionization by magnetospheric electrons and phelectrons amounts to less than 20% of total production ratelower and upper altitudes, however, its role is more pronoun50–60% at 700 km, and about 50% at 1430 km. Moreoveeven higher altitudes, ionization due to magnetospheric etrons shows a maximum (at 1500–1600 km) and exceedsfar, photoionization. This result can, to some extent, be modependent and requires further studies. Since ionization bytrons depends strongly on the longitude with respect to theram direction, one can expect a variety of different ionizatpatterns in combination with seasonal effects (Kelleret al.1992,Galandet al.1999).
ACKNOWLEDGMENTS
One of the authors (M.B.) appreciates the hospitality of the colleagues frostituto de Astrof´ısica de Andaluc´ıa, where this study was initiated. This researwas partially supported by the Spanish Comisi´on Interministerial de Ciencia yTecnolog´ıa under Contract ESP96-0623.
REFERENCES
Anicich, V. G., and M. J. McEwan 1997. Ion-molecule chemistry in Titaionosphere.Planet. Space Sci.45, 897–923.
Bezard, B., A. Marten, and G. Paubert 1992. First ground based detecticyanoacetylene on Titan.Bull. Am. Astron. Soc.24, 953.
Bezard, B., A. Marten, and G. Paubert 1993. Detection of acetonitrile on TBull. Am. Astron. Soc.25, 1100.
Bird, M. K., R. Dutta-Roy, S. W. Asmar, and T. A. Rebold 1997. Detectof Titan’s ionosphere from Voyager 1 radio occultation observations.Icarus130, 426–436.
Cabane, M., E. Chassefi´ere, and G. Israel 1992. Formation and growth of ptochemical aerosols in Titan’s atmosphere.Icarus96, 176–189.
Chatham, H., D. Hills, R. Robertson, and A. Gallagher 1984. Total andtial electron collision ionization cross sections for CH4, C2H6, SiH4, Si2H6.J. Chem. Phys.81, 1770–1777.
Coustenis, A., B. B´ezard, and D. Gautier 1989. Titan’s atmosphere from Voyainfrared observations. I. The gas composition of Titan’s equatorial regIcarus80, 54–76.
Coustenis, A., A. Salama, E. Lellouch, Th. Encrenaz, G. L. Bjoraker, RSamuelson, Th. de Graauw, H. Feuchtgruber, and M. F. Kessler 1998idence for water vapor in Titan’s atmosphere from ISO/SWS data.Astron.Astrophys.336, L85–L89.
Cravens, T. E., C. J. Lindgren, and S. A. Ledvina 1998. A two-dimensiomultifluid MHD model of Titan’s plasma environment.Planet. Space Sci.46,1193–1205.
English, M., L. M. Lara, R. D. Lorenz, P. M. Ratcliff, and R. Rodrigo 199Ablation and chemistry of meteoritic materials in the atmosphere of TiAdv. Space Res.17, 157–160.
p-Fox, J. L., and R. V. Yelle 1997. Hydrocarbon ions in the ionoshere of Titan.Geophys. Res. Lett.24, 2179–2182.

l
r
o
e
y
a
s
i
o
e
io
R
a
l
n
87–
here
lson
,nels
ere.
ty
The
and
enomo-
. L.
andture
on—
per
ere:
A.ter
ay
dednn,
404 BANASZKIEW
Frere, C., R. Raulin, G. Israel, and M. Cabane 1990. Microphysical modeof Titan’s aerosols: Application to the in-situ analysis.Adv. Space Sci.10,159–163.
Galand, M., J. Lilensten, D. Toublanc, and S. Maurice 1999. The ionospheTitan: Ideal diurnal and nocturnal cases.Icarus104, 92–105.
Gan, L., and T. E. Cravens 1992. Electron impact cross-sections and corates for methane.Planet. Space Sci.40, 1535–1544.
Gan, L., C. N. Keller, and T. E. Cravens 1992. Electrons in the ionospherTitan.J. Geophys. Res.97, 12,136–12,151.
Gurwell, M. A., and D. O. Muhlehman 1997. Stratospheric CO, HCN and HC3Non Titan.Ann. Geophys.15, C778.
Hanel, R., and 15 colleagues 1981. Inrfared observations of the saturnian sfrom Voyager 1.Science212, 192–200.
Hartle, R. E., E. C. Sittler, Jr., K. W. Ogilvie, J. D. Scudder, A. J. Lazarus,S. K. Atreya 1982. Titan’s ion exosphere observed from Voyager 1.J. Geophys.Res.87, 1383–1393.
Hidayat, T., A. Marten, B. B´ezard, D. Guatier, T. Owen, H. E. Matthews, anG. Paubert 1997. Millimeter and submillimeter heterodyne observationTitan: Retrieval of the vertical profile of HCN and the12C/13C ratio. Icarus126, 170–182.
Huebner, W. F. 1991. Book Review—Physics and chemistry of comets.Sky &Telescope81, 611.
Huebner, W. F. 1985. The photochemistry of comets. InThe Photochemistryof Atmospheres: Earth, the Other Planets, and Comets(J. S. Levine, Ed.),pp. 437–481. Academic Press, San Diego.
Ip, W.-H. 1990. Titan’s upper ionosphere.Astrophys J.362, 354–363.
Kasprzak, W., H. Niemann, D. Harpold, J. Richards, H. Manning, E. Patrand P. Mahaffy 1996. Cassini orbiter ion and neutral mass spectrometestrument, InSPIE-Int. Soc. Opt. Eng. 2803, Cassini/Huygens: A Missionthe Saturnian System, pp. 129–140.
Keller, C. N., V. G. Anicich, and T. E. Cravens 1998. Model of Titan’s ionsphere with detailed hydrocarbon chemistry.Planet. Space Sci.46, 1157–1174.
Keller, C. N., T. E. Cravens, and L. Gan 1992. A model of the ionospherTitan.J. Geophys. Res.97, 12,117–12,135.
Kieffer, L. J., and G. H. Dunn 1966. Electron impact ionization cross-sectdata for atoms, atomic ions and diatomic molecules: I. Experimental dRev. Mod. Phys.38, 1–25.
Kievelson, M. G., and C. T. Russell 1983. The interaction of flowing plasmwith planetary ionospheres: A Titan–Venus comparison.J. Geophys. Res.88,49–57.
Kunde, V. G., A. C. Aikin, R. A. Hanel, D. E. Jennings, W. C. Magire, andE. Samuelson 1981. C4H2, HC3N, and C2N2 in Titan’s atmosphere.Nature292, 686–688.
Lara, L. M., E. Lellouch, J. J. L´opez-Moreno, and R. Rodrigo 1996. Verticdistribution of Titan’s atmospheric neutral constituents.J. Geophys. Res.101,23,261–23,283.
Lara, L. M., E. Lellouch, and V. Shematovich 1999. Titan’s atmospheric haThe case for HCN incorporation.Astron. Astrophys.341, 312–317.
Ledvina, S. A., and T. E. Cravens 1998. A three-dimensional MHD modeplasma flow around Titan.Planet. Space Sci.46, 1175–1191.
Lehfaoui, L., C. Rebrion-Rowe, S. Laub´e, J. B. A. Mitchell, and B. R. Rowe1997. The dissociative recombination of hydrocarbon ions. I. Light alka
J. Chem. Phys.106, 5406–5412.Lellouch, E., and D. M. Hunten 1987. Titan’s atmosphere engineering mo
ICZ ET AL.
ing
e of
ling
of
stem
nd
dof
ck,r in-to
-
of
nsata.
as
.
l
ze:
of
es.
ESA Space Science Department International Publication ESLAB, pp.199. European Space Agency, Paris.
Lindal, G. F., G. E. Wood, H. B. Hotz, and D. N. Sweetnam 1983. The atmospof Titan: An analysis of the Voyager 1 radio occultation measurements.Icarus53, 348–363.
Maguire, W. C., R. A. Hanel, D. E. Jennings, V. G. Kunde, and R. E. Samue1981. C3H8 and C3H4 in Titan’s Atmosophere.Nature292, 683–686.
Morduant, D. H., I. R. Lamber, G. P. Morley, M. N. R. Ashfold, R. N. DixonC. M. Western, L. Schneider, and K.H. Welge 1993. Primary product chanin photodissociation of methane at 121.6 nm.J. Chem. Phys.98, 2054-2065.
Nagy, A. F., and P. M. Banks 1970. Photoelectron fluxes in the ionosphJ. Geophys. Res.75, 6260–6230.
Nagy, A. F., and T. E. Cravens 1998. Titan’s ionosphere: A review.Planet. SpaceSci.46, 1149–1155.
NASA 1989.Cassini Mission: Saturn Orbiter, Announcement of Opportuni,NASA A.O. No. OSSA-I-89, October 10.
Ness, N. F., M. H. Acuna, K. W. Behannon, and F. M. Neubauer 1982.induced magnetosphere of Titan.J. Geophys. Res.87, 1369–1381.
Noll, K. S., T. R. Geballe, R. F. Knacke, and Y. L. Pendleton 1996. Titan’s 5µmspectral window: Carbon monoxide and the albedo of the surface.Icarus124,625–632.
Rapp, D., and P. Englander-Golden 1965. Total cross sections for ionizationattachment in gases by electron impact: I. Positive ionization.J. Chem. Phys.43, 1464–1479.
Roboz, A., and A. F. Nagy 1994. The energetics of Titan’s ionosphere.J. Geo-phys. Res.99, 2087–2093.
Rodrigo, R., E. Garcia-Alvarez, M. J. Lopez-Gonzalez, and J. J. Lopez-Mor1990. A nonsteady one-dimensional theoretical model of Mars’ neutral atspheric composition between 30 and 200 km.J. Geophys. Res.95, 14,795–14,810.
Samuelson, R. E., W. C. Maguire, R. A. Hanel, V. G. Kunde, D. E. Jennings, YYung, and A. C. Aikin 1983. CO2 on Titan.J. Geophys. Res.88, 8709–8715.
Smith, G. R., D. F. Strobel, A. L. Broadfoot, B. R. Sandel, D. E. Shemansky,J. B. Holberg 1982. Titan’s upper atmosphere: Composition and temperafrom EUV solar occultation results.J. Geophys. Res.87, 1351–1359.
Soloman, S. C., P. B. Hays, and V. J. Abreu 1988. The auroral 6300 A emissiObservations and modeling.J. Geophy. Res.93, 9867–9882.
Strobel, D. F. 1982. Chemistry and evolution of Titan’s atmosphere.Planet.Space Sci.30, 839–848.
Strobel, D. F., and D. E. Shemansky 1982. EUV emission from Titan’s upatmosphere: Voyager 1 encounter.J. Geophys. Res.87, 1361–1368.
Strobel, D. F., M. E. Summers, and X. Zhu 1992. Titan’s upper atmosphStructure and ultraviolet emissions.Icarus100, 512–526.
Tanguy, L., B. Bezard, A. Marten, D. Gautier, E. Gerard, G. Paubert, andLecacheux 1990. Stratospheric profiles of HCN on Titan from millimeobservations.Icarus85, 43–57.
Toublanc, D., J. P. Parisot, J. Brillet, D. Gautier, F. Raulin, and C. P. McK1995. Photochemical modeling of Titan’s atmosphere.Icarus113, 2–16.
Yelle, R. V., D. F. Strobel, E. Lellouch, and D. Gautier 1997. Recommenmodel for Titan’s atmosphere. InHuygens: Science, Payload and Missio(A. Wilson, Ed.). ESA-SP 1177, pp. 243–256. ESA Publications DivisioNoordwijk.
del.Yung Y. L., M. Allen, and J. P. Pinto 1984. Photochemistry of the atmosphere
of Titan.Astrophys. J. Suppl.55, 465–506.