Influence of neutral transport on ion chemistry uncertainties in Titan ionosphere
30
Influence of neutral transport on ion chemistry uncertainties in Titan ionosphere N. Carrasco, Eric H´ ebrard, M. Banaszkiewicz, M. Dobrijevic, P. Pernot To cite this version: N. Carrasco, Eric H´ ebrard, M. Banaszkiewicz, M. Dobrijevic, P. Pernot. Influence of neutral transport on ion chemistry uncertainties in Titan ionosphere. Icarus, Elsevier, 2007, 192, pp.519-526. <10.1016/j.icarus.2007.08.016>. <hal-00177563> HAL Id: hal-00177563 https://hal.archives-ouvertes.fr/hal-00177563 Submitted on 19 Feb 2008 HAL is a multi-disciplinary open access archive for the deposit and dissemination of sci- entific research documents, whether they are pub- lished or not. The documents may come from teaching and research institutions in France or abroad, or from public or private research centers. L’archive ouverte pluridisciplinaire HAL, est destin´ ee au d´ epˆ ot et ` a la diffusion de documents scientifiques de niveau recherche, publi´ es ou non, ´ emanant des ´ etablissements d’enseignement et de recherche fran¸cais ou ´ etrangers, des laboratoires publics ou priv´ es.
Transcript of Influence of neutral transport on ion chemistry uncertainties in Titan ionosphere

Influence of neutral transport on ion chemistry
uncertainties in Titan ionosphere
N. Carrasco, Eric Hebrard, M. Banaszkiewicz, M. Dobrijevic, P. Pernot
To cite this version:
N. Carrasco, Eric Hebrard, M. Banaszkiewicz, M. Dobrijevic, P. Pernot. Influence of neutraltransport on ion chemistry uncertainties in Titan ionosphere. Icarus, Elsevier, 2007, 192,pp.519-526. <10.1016/j.icarus.2007.08.016>. <hal-00177563>
HAL Id: hal-00177563
https://hal.archives-ouvertes.fr/hal-00177563
Submitted on 19 Feb 2008
HAL is a multi-disciplinary open accessarchive for the deposit and dissemination of sci-entific research documents, whether they are pub-lished or not. The documents may come fromteaching and research institutions in France orabroad, or from public or private research centers.
L’archive ouverte pluridisciplinaire HAL, estdestinee au depot et a la diffusion de documentsscientifiques de niveau recherche, publies ou non,emanant des etablissements d’enseignement et derecherche francais ou etrangers, des laboratoirespublics ou prives.

ACCEP
TED M
ANUSC
RIPT
ACCEPTED MANUSCRIPT
Influence of neutral transport on ion chemistry
uncertainties in Titan ionosphere
N. Carrasco1,2 , E. Hébrard3 , M. Banaszkiewicz4, M. Dobrijevic5 , P. Pernot1,2
1Laboratoire de Chimie Physique, CNRS, UMR 8000, Orsay, F-91405
2Université Paris-Sud 11, Orsay, F-91405
3 Laboratoire Interuniversitaire des Systèmes Atmosphériques, CNRS, UMR 7583,Université Paris 7-12, Créteil, F-94010
4 Space Research Centre, Bartycka 18A, 00-716 Warsaw, Poland
5Laboratoire d’Astrodynamique, d’Astrophysique et d’Aéronomie de Bordeaux,CNRS, UMR 5804, Université Bordeaux 1, Floirac, F-33270
Number of manuscript pages: 30
Number of figures: 8
Number of tables: 1
1

ACCEP
TED M
ANUSC
RIPT
ACCEPTED MANUSCRIPT
Running head : Influence of neutral transport on Titan ion chemistry
Corresponding author :
Pascal Pernot
Laboratoire de Chimie Physique
Bat. 349, Université Paris-Sud 11
91405 Orsay Cedex
France
E-mail address: [email protected]
2
ACCEP
TED M
ANUSC
RIPT
ACCEPTED MANUSCRIPT
Abstract
Models of Titan ionospheric chemistry have shown that ion densities depend
strongly on the neutral composition. The turbulent diffusion transport condi-
tions, as modeled by eddy coefficients, can spectacularly affect the uncertainty
on predicted neutral densities. In order to evaluate the error budget on ion
densities predicted by photochemical models, we perform uncertainty propaga-
tion of neutral densities by Monte Carlo sampling and assess their sensitivity
to two turbulent diffusion profiles, corresponding to the extreme profiles at
high altitudes described in the literature. A strong sensitivity of the ion den-
sity uncertainties to transport is observed, generally more important than to
ion-molecule reaction parameters themselves. This highlights the necessity to
constrain eddy diffusion profiles for Titan ionosphere, which should progres-
sively be done thanks to the present and future measurements of the orbiter
Cassini.
Key Words: Atmosphere chemistry, Atmosphere composition, Atmosphere dy-
namics, Ionospheres, Titan.
3
ACCEP
TED M
ANUSC
RIPT
ACCEPTED MANUSCRIPT
1 Introduction
Discrepancies between the outputs of different models and available data are dif-
ficult to assess in the absence of quantified uncertainties. In particular, modelling
the chemistry of planetary ionospheres involves numerous physical and chemical
parameters, which values are known from laboratory measurements with experi-
mental uncertainty factors. These uncertainty sources should be accounted for in
the modelling, in order to quantify the uncertainties on the model outputs and more
generally to evaluate the model predictivity (Wakelam et al. 2005; Zádor et al. 2006;
Hébrard et al. 2007).
In a previous work (Carrasco et al. 2006), we evaluated the uncertainties on a
Titan ionospheric chemistry model (based on the work of Banaszkiewicz et al., 2000),
due to the rate constants and branching ratios of ion-molecule reactions. Neutral
densities were considered as fixed inputs, with the neutral density profiles calculated
by Lara et al. (1996). In parallel, Hébrard et al. (2007) studied the chemical kinetics
uncertainties in a photochemical model for neutral species in Titan atmosphere.
Considering that ion densities closely depend on the neutral atmosphere composition
(Keller et al. 1998), one can expect a direct impact of neutral uncertainties on ion
uncertainties. In order to evaluate this influence, we built a semi-coupled Titan
ionospheric model for neutral and ion species, using the chemistry model described in
Carrasco et al. 2006 with neutral density profiles and their uncertainties as calculated
by Hébrard et al. (2007).
Dynamics plays undoubtedly some role in the distribution of Titan’s both neutral
and ionic constituents but yet, the significance of eddy diffusion processes is not
entirely known and still requires some attention. The eddy diffusion coefficient K(z)
usually acts in photochemical modeling of planetary atmospheres as a free parameter
that must be estimated to fit observations (see Fig. 1). In particular, the eventuality
that the globally averaged distribution of Titan’s constituents may be accurately
and simultaneously described with a single eddy diffusion profile is still discussed
4

ACCEP
TED M
ANUSC
RIPT
ACCEPTED MANUSCRIPT
(Wilson and Atreya 2004). Hidayat et al. (1997) inferred a low homopause profile
(840 km) from their millimeter observations of HCN vertical profile in much of the
lower regions of the atmosphere; Strobel et al. (1992) inferred a higher homopause
profile (1040 km) from their analysis of Voyager UVS solar occultation and airglow
data; Toublanc et al. (1995) developed a very low homopause profile (680 km) from
Toon et al. (1992) profile and adapted it to fit Tanguy et al. (1990) HCN distribution
and Voyager UVS data for methane CH4. This diversity of profiles is in part due
to the differences in the chemical scheme adopted by the authors. In fact, Hébrard
et al. (2007) showed that the eddy diffusion profile may not currently be constrained
as tightly as expected. Uncertainties attached to the computed abundances can be
indeed so important that modifying the eddy diffusion coefficient K(z) does not
change significantly their agreement with the different abundances inferred from the
available observations. It appears moreover that the uncertainty factors of computed
abundances are very sensitive to the choice of the eddy diffusion profile adopted,
especially to the choice of a high- or low-homopause profile.
[Figure 1 about here.]
In order to assess their effect on ion densities, we considered two turbulent dif-
fusion profiles for the neutral species, corresponding to the extreme profiles at high
altitudes described in the literature (Strobel et al. 1992; Toublanc et al. 1995).
We first evaluated the uncertainties on the ion densities for both neutral turbulent
transport cases, with a fixed ion-molecule chemistry. Then, we calculated the con-
tributions of both uncertainty sources (neutral densities and ion-molecule reaction
parameters), and identified the main sources of uncertainty for all the major ions
predicted by our model of Titan ionosphere.
5

ACCEP
TED M
ANUSC
RIPT
ACCEPTED MANUSCRIPT
2 Methods
2.1 Ion and neutral chemistry semi-coupled models for Titan
ionosphere
Titan ionospheric chemistry model (Banaszkiewicz et al. 2000; Carrasco et al. 2006)
is semi-coupled with a photochemistry model of neutral species (Hébrard et al.,
2007). Neutral density profiles are calculated with their uncertainties by the neutral
photochemistry model. These profiles, with their uncertainties, are taken as inputs
of the ionospheric chemistry model. Furthermore the correlations between neutral
densities are taken into account through their covariance matrix. Density profiles
are built with a 5 km scale in the 800-1300 km altitude range.
2.2 Uncertainty propagation
Because of non-linearities in the model and large uncertainties on numerous param-
eters, chances to be outside the validity range of linear uncertainty propagation are
important. To avoid this bias, we used a Monte Carlo sampling method, which
requires the definition of a probability density function for input parameters. As
their are not correlated, we design separately the probability density functions for
the kinetic parameters and for the neutral density profiles.
Uncertainties of kinetic parameters of ion-molecule reactions. The distri-
butions are parametrized from the preferred values and the uncertainties reported
in the review of Anicich and McEwan 1997. If an uncertainty value is not given for
rate constants, the preferred value is considered as being inaccurate, with a relative
uncertainty of 60% (highest uncertainty value reported in the review). The global
rate k is depicted by a log-uniform distribution (Carrasco et al. 2006).
As uncertainty is not quantified for branching ratios in the reference review, un-
certainty intervals have been defined according to the statistical deviations reported
6

ACCEP
TED M
ANUSC
RIPT
ACCEPTED MANUSCRIPT
in Carrasco et al. 2006: 10% for branching ratios larger than 0.5, 30% for branching
ratios between 0.1 and 0.5 and 100% for the smaller values. For a few reactions,
branching ratios are not reported. In such cases the pathways are considered as
equiprobable with an uncertainty of 90%. Branching ratios were previously (Car-
rasco and Pernot 2007) modeled by Dirichlet distributions, which respect the sum
rule for these parameters. In this work, we refine our elicitation of the branch-
ing ratios with Dirichlet uniform distributions (DIUD), which have the additional
property not to favor any value within the given intervals (see the Appendix).
The sample for probability density function of ion-molecule reaction parameters
can be produced with the following procedure. In order to preserve the intrinsic
correlation due to the sum rule, partial reaction rates for a reaction with n pathways
are produced following three steps:
1. a global rate k is sampled from a log-uniform distribution;
2. the branching ratios, bi, are sampled from the DIUD method (see Appendix),
3. the partial rate constants, ki, are products of two random numbers (ki = kbi)n1 .
Uncertainties on neutral densities. The different chemical sources of uncer-
tainties in photochemical models of Titan’s atmosphere and their associated proba-
bility density functions were recently reviewed and evaluated at representative tem-
peratures through a comprehensive cross-examination of extensive reaction rates
database (Hébrard et al., 2006) and implemented through a Monte-Carlo procedure
into a 1D photochemical model of Titan’s neutral atmosphere (Hébrard et al., 2007).
A sample of Nrun = 500 density profiles for each neutral species is generated at all
altitudes up to 1300 km and stored for analysis. The data are in a three dimensional
table
{cijk; i = 1, Nsp; j = 1, Nalt; k = 1, Nrun} (1)
where Nsp is the number of species, Nalt is the size of the altitude grid.
7

ACCEP
TED M
ANUSC
RIPT
ACCEPTED MANUSCRIPT
These profiles could be used directly in the 0D ionospheric model. However we
preferred to build an intermediate probability density function (PDF) because it
provides insight into the structure of neutral densities uncertainties. In addition
this procedure enables a much larger number of runs to be used for uncertainty
propagation and analysis in ionospheric chemistry. Typically, we found that cumu-
lative density functions for ion densities were satisfyingly converged for 104 samples,
a number presently out of reach of the 1D model.
To design the PDF for neutral densities, we first analyze their correlation struc-
ture. We consider two sources of correlation :
• ρaltij,il = 〈cijk, cilk〉k: spatial correlations for a given species, resulting mainly
from continuity laws of chemistry-transport processes, where 〈...〉k denotes the
correlation coefficient calculated over the sample;
• ρspil,jl = 〈cilk, cjlk〉k: inter-species correlations, resulting from the chemical pro-
cesses and mass conservation law.
To account for non-linearities, Rank Correlation Coefficients (RCC) have been used.
They convert nonlinear but monotonic relationship into a linear relationship by
replacing the values of the sampled inputs/outputs by their respective ranks (Hamby
1994; Helton et al. 2006).
The spatial correlation of densities for a species is linked to the deformations
caused to the density profile by chemistry fluctuations. If the density variations are
similar at all altitudes (all curves in a sample remain parallel), the RCC should be
equal to 1. A negative correlation would indicate opposite variations between two
altitudes. We calculated the RCC for altitudes between 800 and 1300 km in the
case of Strobel et al. 1992 eddy diffusion profile. As expected, spatial correlation is
high: for all species, ρaltij,il is above 0.4, and for most species, the RCC distribution
over altitudes is strongly peaked at the maximal value. Globally, when a species
undergoes a density increase/decrease at the base of the ionosphere, there is a similar
8

ACCEP
TED M
ANUSC
RIPT
ACCEPTED MANUSCRIPT
increase/decrease in all the upper column. As we are performing 0D calculations
for ionospheric chemistry, we can assume that it is safe to consider that all altitudes
are maximally correlated, ρaltij,il=1 for all altitude-pairs and species.
To evaluate the correlation between neutral densities, we chose an altitude rep-
resentative for ionospheric chemistry, i.e. 1200 km, and RCC’s for all pairs of
species have been evaluated at that altitude. We checked that the RCC’s ma-
trix was globally constant in the ionospheric altitude range. It appears that some
neutral densities are significantly correlated. A good approximation of the correla-
tion matrix was obtained by using the linear correlations between the log-densities
log10 cil. This representative correlation matrix was used at every altitudes. The
probability density function is thus finally built as a multivariate normal density,
parametrized by the average values log10 cil and uncertainty factors Fil, such as
log10 cil = log10 cil ± log10 Fil, and the correlation matrix with elements ρspil,jl.
The sample for the full neutral densities probability density function, assuming
unity correlation between altitudes and altitude-independent inter-species correla-
tions, can be produced with the following procedure:
• Initializations:
– estimate average values and uncertainty factors of log-densities for all
species, at all altitudes;
– evaluate inter-species linear correlation matrix of log-densities C at a
representative altitude and calculate its Cholesky decomposition (Gelman
et al., 1995).
• Monte Carlo loop:
– generates Nsp standard normal deviates {ui ∼ N(0, 1); i = 1, Nsp};
– combines these into Nsp correlated numbers εi by the Cholesky procedure;
– loop over altitudes (j);
9

ACCEP
TED M
ANUSC
RIPT
ACCEPTED MANUSCRIPT
∗ generates samples of correlated log-densities with altitude dependent
uncertainties{log10 cij = log10 cij + εi × log10 Fij ; i = 1, Nsp
}.
3 Results and Discussion
3.1 Correlation of neutral densities
[Table 1 about here.]
We evaluated the correlation between the neutral density profiles in the Strobel
case. Representative values for some important species are reported in Table 1.
Strong correlations are observed between some neutrals, e.g. H2/CH4, N2/CH4 or
C2H2/C2H4, and result from the chemical network. A salient feature is the negative
correlation of CH4 with all other species in the table (increasing the density of CH4
causes a decrease in the density of those species). The strong negative correlation
of CH4 with N2 and H2 has probably not a chemical origin, but a physical one, i.e.
mass conservation. Full exploration of the other correlation is not relevant to the
present study, but will be detailed in a future article. A consequence to be kept in
mind for data fitting is that, within the framework of a consistent photochemical
model, densities of species should not be adjusted independently of each other. For
this study, we conclude that those strong correlations cannot be a priori neglected
in the uncertainty propagation to ionospheric chemistry.
In order to check this point, we generated two samples in the Strobel case, one
correlated and one uncorrelated (setting the correlation matrix to identity: C = I).
We compared the densities and their uncertainties obtained with the two samples.
The effect is illustrated on the 40 most abundant ions (Fig. 2). Except for very
few ions, the impact is negligible. Predicted ion densities and uncertainties are
practically insensitive to the correlation of neutral densities.
[Figure 2 about here.]
10

ACCEP
TED M
ANUSC
RIPT
ACCEPTED MANUSCRIPT
A significant effect can however be observed on the correlation between ion den-
sities, as can be seen from the compared cumulative density functions of correlation
coefficients of all ions pairs on Fig. 3. For uncorrelated neutral densities, the RCC’s
are globally weak, massively located, with 90% probability, between -0.1 and 0.6,
whereas for the correlated case the corresponding probability interval spreads be-
tween -0.3 and 0.8. The proportion of significant correlations increases thus notably
when neutrals correlation is taken into account. We observe therefore a correla-
tion transfer from neutrals to ions. This might be relevant for the computation of
observables combining ion densities. As observed before, this correlation restricts
considerably the degrees of freedom when, for instance, adjusting the ion densities
to match an observable (as an ion mass spectrum).
[Figure 3 about here.]
In conclusion to this section, we note that correlation between neutral densities
has certainly to be taken into account for data fitting or sensitivity analysis, but
that it can safely be neglected for the sole purpose of uncertainty propagation.
3.2 Effect of the neutral transport processes on the ion con-
centrations
As shown in Hébrard et al. (2007), the turbulent macroscopic transport of the neutral
species in Titan ionosphere is not yet tightly constrained by the existing observations
and might vary between two extreme cases described in Strobel et al. (1992) and
Toublanc et al. (1995). For simplicity, these two cases will be called the “Strobel
case” and the “Toublanc case”. The eddy coefficient profiles are given on Fig. 1. The
Strobel case corresponds to a high homopause level (1040 km) whereas the Toublanc
case corresponds to a low homopause level (680 km). The two corresponding neutral
density profiles obtained by Hébrard et al. (2007), for diurnally averaged chemistry,
11

ACCEP
TED M
ANUSC
RIPT
ACCEPTED MANUSCRIPT
were used as inputs of our simulations, allowing us to evaluate the impact of the
poorly known neutral transport processes on the ionic species.
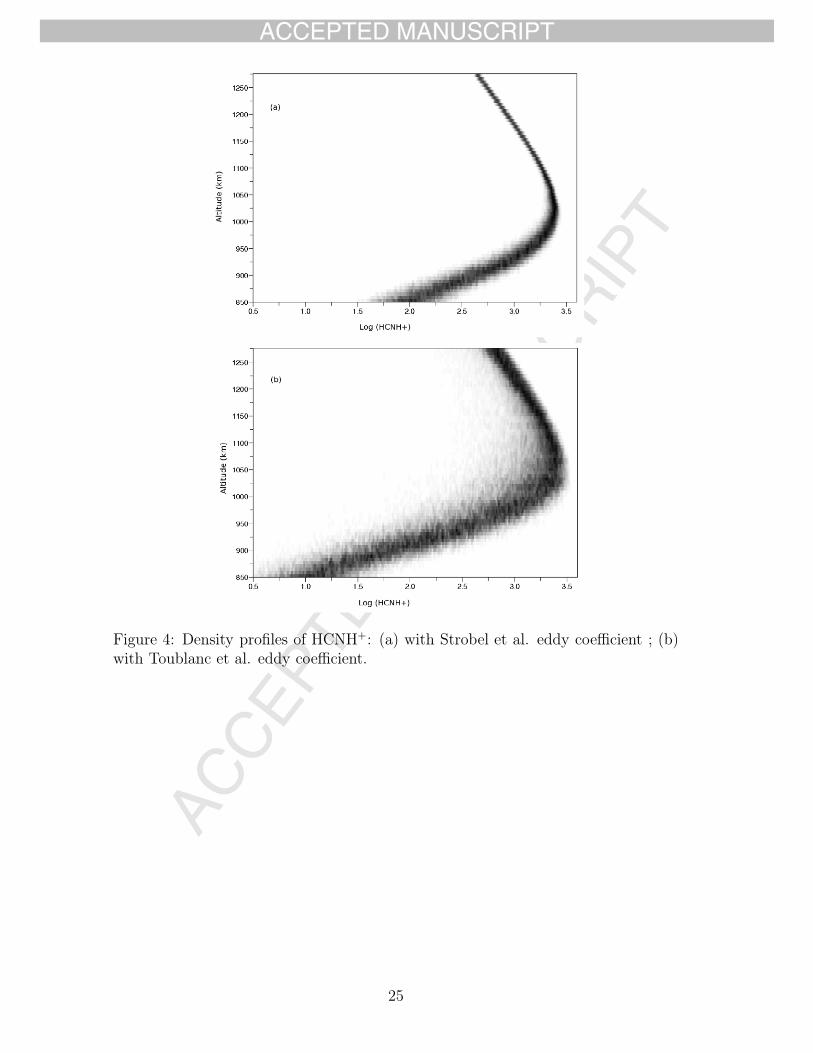
The density profile of the major ion , HCNH+ in Titan ionosphere, is represented
on Fig. 4 for both neutral transport cases. The nominal profiles are significantly
different for altitudes lower than 950 km: HCNH+ density is up to 10 times larger
at 800 km in the Strobel case. This confirms the sensitivity of the ionospheric
chemistry model to the neutral density profiles previously noticed by Keller et al.
(1998). Moreover, the uncertainties on HCNH+ density differ significantly from one
case to the other, with a larger uncertainty in the Toublanc case, at all altitudes.
[Figure 4 about here.]
The altitude 1200 km is of specific interest, being the average altitude of the
first Cassini’s flyby T5 providing data on ion densities. We compared the effect of
both neutral diffusion cases on the ten major ions calculated by our model at this
altitude: HCNH+, C2H+5 , CH+
5 , N+2 , C3H
+5 , CH+
3 , N2H+, N(3P)+, C2H
+4 and C2H
+3 .
The densities with their uncertainties are reported on Fig. 5. The ions are ranked by
decreasing density. The results are highly dependent on the eddy diffusion profile:
quite precise ion densities in the Strobel case, and relative uncertainties of one or
two orders of magnitude for all ions in the Toublanc case.
[Figure 5 about here.]
One can conclude that the eddy coefficient chosen to describe the transport of
the neutral species influences significantly the nominal density profiles of the ion
species but also their uncertainty. The chemistry of the ions in Titan ionosphere
cannot be decorrelated from transport considerations.
There is still to understand why the uncertainties in the Toublanc case are much
larger than in the Strobel case. A reason lies probably in the uncertainty on the
major neutral reactant, methane (CH4). Indeed the uncertainty on the methane
12

ACCEP
TED M
ANUSC
RIPT
ACCEPTED MANUSCRIPT
profiles at the ionospheric altitudes is substantially larger in the Toublanc case (see
Fig. 6). The uncertainty factor FCH4 at 1200 km is equal to about 1.1 in the Strobel
case and about 5.7 in the Toublanc case. High-homopause profiles seem to restrain
to some extent the propagation of chemical uncertainties in the upper atmosphere
contrary to low-homopause profiles.
[Figure 6 about here.]
The reason for such a discrepancy on methane uncertainty is not yet fully es-
tablished. However, the vertical transport is more important in the case of a high
homopause. This means that the vertical renewal of the species through transport,
compensates more efficiently for the chemical losses. The transport can thus be
considered as an attenuation factor of the chemical uncertainties on the neutral
densities.
3.3 Comparison of two uncertainty sources: neutral densities
and ion-molecule reactions parameters
We compared the respective contributions of the neutral densities and of the pa-
rameters of ion-molecule reactions to the ion density uncertainty by first performing
uncertainty propagation on both uncertainty sources separately. As earlier, both
Strobel and Toublanc cases were considered to encompass extreme transport pro-
cesses in Titan ionosphere.
The ten major ion densities are reported in Fig. 7, with their uncertainties
for both Strobel and Toublanc cases. Each case is compared with the uncertainty
contribution of the ion-molecule reaction parameters. In the Toublanc case, the
uncertainty due to the ion-molecule reaction parameters is negligible in comparison
to the uncertainty due to the neutral densities. This implies that in this case,
the uncertainty on the ion densities is mainly controlled by the uncertainty on the
neutral atmosphere rather than by the ion reactivity itself. In the Strobel case,
13

ACCEP
TED M
ANUSC
RIPT
ACCEPTED MANUSCRIPT
similar amplitudes for both uncertainty sources are observed. The conclusions are
therefore depending on the ions: a prevalence of the neutral density uncertainty is
observed for C3H+5 and C2H
+3 , whereas a prevalence of the ion-molecule reaction
parameters is observed for C2H+4 . Similar contribution of both uncertainty sources
affect HCNH+, C2H+5 , CH+
5 , N+2 , CH+
3 , N2H+, and N(3P)+.
[Figure 7 about here.]
The Strobel case corresponds to a high homopause configuration. One can notice
that the hypothesis of a high homopause seems to be consolidated by the recent
INMS data (Yelle et al., 2006).
4 Conclusion
We presented the first evidence of the influence of the modeling of turbulent trans-
port of neutral species on the uncertainty of ion chemistry in Titan ionosphere.
We found a strong sensitivity of ion chemistry to the description of turbulent
neutral transport. The uncertainties on the ion densities were much higher with a
low homopause hypothesis than with a high homopause level. This effect can be
explained by a competition between vertical transport and chemistry: an efficient
vertical transport attenuates the chemical uncertainties. In the case of a low ho-
mopause, the uncertainty of the ion densities due to the ion chemistry was even
found negligible in comparison to the uncertainty due to the neutral densities. This
highlights the necessity to constrain eddy diffusion profiles for Titan ionosphere,
which should progressively be done thanks to the present and future measurements
of the Cassini orbiter (Yelle et al. 2006).
The present study focused on the sensitivity of a Titan ionospheric model to
two particular sources of uncertainty: the description of the neutral density profiles,
and the ion-molecule chemistry parameters. Additional sources of uncertainty are
still to be studied, such as uncertainties on the photo-dissociation or recombination
14

ACCEP
TED M
ANUSC
RIPT
ACCEPTED MANUSCRIPT
rates, which would allow a complete overview of the needs and limits of the actual
model, in order to improve it.
We showed that neutral species are strongly correlated by the photochemical
model and transfer an important correlation between ion densities. This provides
chemistry-based constraints that might be useful when trying to fit models to mea-
sured Mass Spectra, for instance by tuning neutral densities.
The present simulations provide a basis for a sensitivity analysis, from which to
identify the key reactions and species strongly responsible for outputs uncertainty.
In a forthcoming paper, we will present results along this line, pertaining to both
ion-molecule and neutral chemistry.
Appendix:
Dirichlet Uniform Distribution (DIUD) for branching
ratios of ion-molecule reactions
An elicitation scheme is based on considerations about the nature of the uncertainties
to be represented. Branching ratios are often specified by intervals (Jenkinson 2005;
Bates et al. 2003), and it is assumed that there is no reason to favor any value
within a given interval. This case seems indeed to be the one favored by experts
in the measurement of branching ratios. They consider that they report intervals
accounting for systematic errors with enough latitude to encompass all acceptable
values (Carrasco et al. 2006).
The distribution is defined uniformly over the (n − 1)-simplex
(b1, . . . , bn) ∼ Dirichlet(1, . . . , 1) (2)
15

ACCEP
TED M
ANUSC
RIPT
ACCEPTED MANUSCRIPT
with an additional set of constraints,
bi ∈ [bi,min, bi,max] (3)
The definition of the limits of the intervals depends on the available information. If
one gets a set as (bi,�bi)ni=1, one has simply bi,min = bi −Δbi and bi,max = bi + Δbi.
For the sake of convenience, we name this truncated uniform Dirichlet distribution
DIUD in the following. It has 2n parameters
(b1, . . . , bn) ∼ DIUD(b1, . . . , bn, Δb1, . . . , Δbn) (4)
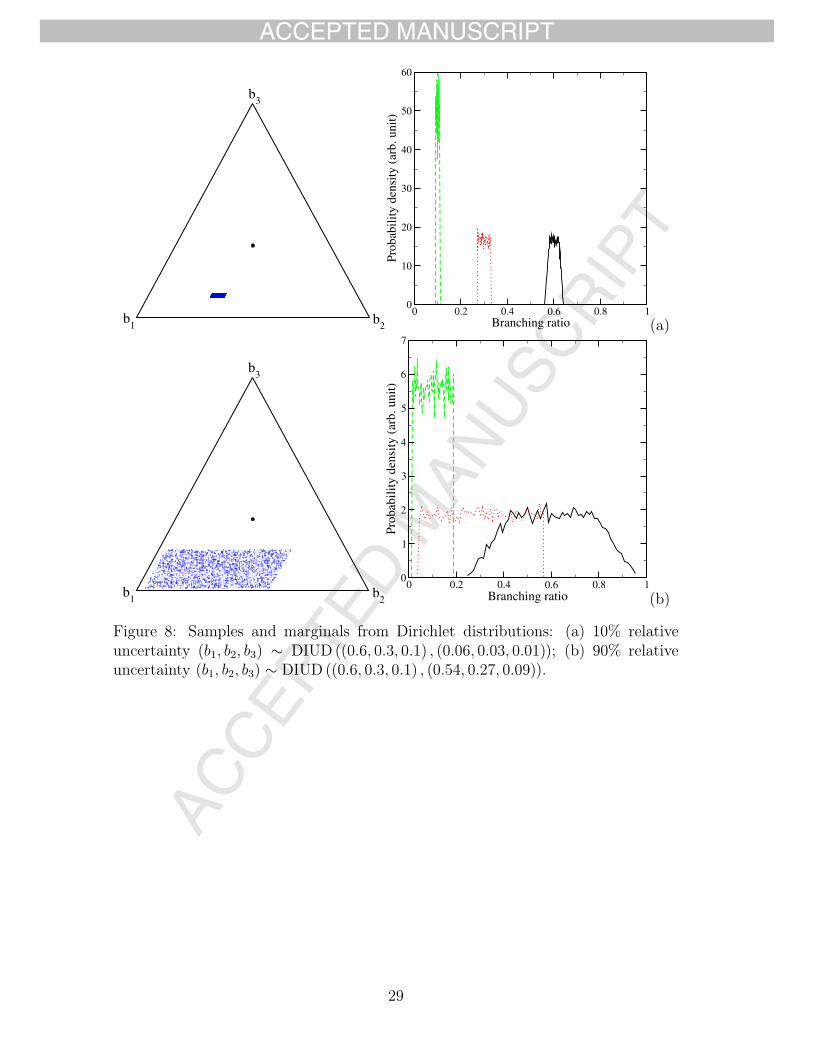
Samples corresponding to the same branching ratios (0.6, 0.3, 0.1) for 10% and 90%
relative uncertainty are displayed in Fig. 8. Note that, although the distribution
is uniform over the restricted (n − 1)-simplex, this is not the case for the marginal
distributions.
The most thorough method to produce samples from this distribution is to draw
samples from the uniform Dirichlet distribution (generated by the Gamma algo-
rithm, Gelman et al. 1995) and to reject those lying outside the prescribed intervals.
However for fairly accurate branching ratios, this method can spill a lot of random
draws.
[Figure 8 about here.]
Acknowledgments
This work was partly supported by EuroPlaNet through travel grants to M.D. and
M.B. We also acknowledge the support received from Centre National de Recherche
Scientifique (CNRS) and from Centre National d’Etude Spatiale (CNES) through
postdoctoral positions for N.C. We gratefully thank O. Dutuit, R. Thissen and C.
Alcaraz for fruitful discussions.
16

ACCEP
TED M
ANUSC
RIPT
ACCEPTED MANUSCRIPT
References
Anicich, V., McEwan, M., 1997. Ion-molecule chemistry in Titan’s ionosphere.
Planetary and Space Science 45 (8), 897–921.
Banaszkiewicz, M., Lara, L., Rodrigo, R., Lopez-Moreno, J., Molina-Cuberos, G.,
2000. A coupled model of Titan’s atmosphere and ionosphere. Icarus 147, 386–404.
Bates, S., Cullen, A., Raftery, A., 2003. Bayesian uncertainty assessment in multi-
compartment deterministic simulation models for environmental risk assessment.
Environmetrics 14, 355–371.
Carrasco, N., Dutuit, O., Thissen, R., Banaszkiewicz, M., Pernot, P., 2006. Un-
certainty analysis of bimolecular reactions in Titan ionosphere chemistry model.
Planetary and Space Science 55, 141–157.
Carrasco, N., Pernot, P., 2007. Modeling of branching ratio uncertainty in chemical
networks by dirichlet distributions. Journal of Physical Chemistry A in press.
Gelman, A., Carlin, J. B., Stern, H. S., Rubin, D. B., 1995. Bayesian Data Analysis.
Chapman & Hall, London.
Hamby, D., 1994. A review of techniques for parameter sensitivity analysis of envi-
ronmental models. Environmental Monitoring and Assessment 32, 135–154.
Hébrard, E., Dobrijevic, M., Bénilan, Y., Raulin, F., 2006. Photochemical kinetics
uncertainties in modeling Titan’s atmosphere: a review. Journal of Photochem-
istry and Photobiology C: Photochemistry Reviews 7, 211–230.
Hébrard, E., Dobrijevic, M., Bénilan, Y., Raulin, F., 2007. Consequences of chem-
ical kinetics uncertainties in modeling Titan’s atmosphere. Planetary and Space
Science accepted.
17

ACCEP
TED M
ANUSC
RIPT
ACCEPTED MANUSCRIPT
Helton, J., Johnson, J., Sallaberry, C., Storlie, C., 2006. Survey of sampling-based
methods for uncertainty and sensitivity analysis. Reliability Engineering and
System Safety 91, 1175–1209.
Hidayat, T., Marten, A., Bézard, B., Gautier, D., Owen, T., Matthews, H., Paubert,
G., 1997. Millimeter and submillimeter heterodyne observations of Titan: Re-
trieval of the vertical profile of HCN and the 12C/13C solar ratio. Icarus 126 (1),
170–182.
Jenkinson, D., 2005. The elicitation of probabilities - A review of the statistical
literature. BEEP working paper, University of Sheffield.
Keller, N. G., Anicich, V. G., Cravens, T. E., 1998. Model of Titan’s ionosphere
with detailed hydrocarbon ion chemistry. Planetary and Space Science 46, 1157.
Lara, L., Lellouch, E., Lopez-Moreno, J., Rodrigo, R., 1996. Vertical distribution of
titan’s atmospheric neutral constituents. J. Geophys. Res. 101 (23261-23283).
Strobel, D. F., Summers, M., Zhu, X., 1992. Titan’s upper atmosphere: structure
and ultraviolet emissions. Icarus 100, 512–526.
Tanguy, L., Bézard, B., Marten, A., Gautier, D., Gérard, E., Paubert, G.,
Lecacheux, A., 1990. Stratospheric profile of HCN on Titan from millimeter
observations. Icarus 85, 43–57.
Toon, O., McKay, C., Griffith, C., Turco, R., 1992. A physical model of Titan’s
aerosols. Icarus 95, 24–53.
Toublanc, D., Parisot, J., Brillet, J., Gautier, D., Raulin, F., McKay, C., 1995.
Photochemical modeling of Titan’s atmosphere. Icarus 113, 2–26.
Wakelam, V., Selsis, F., Herbst, E., Caselli, P., 2005. Estimation and reduction of
the uncertainties in chemical models: application to hot core chemistry. A. &
A. 444, 883–891.
18
ACCEP
TED M
ANUSC
RIPT
ACCEPTED MANUSCRIPT
Wilson, E., Atreya, S., 2004. Current state of modeling the photochemistry of
Titan’s mutually dependent atmosphere and ionosphere. Journal of Geophysical
Research 109.
Yelle, R., Borggren, N., de La Haye, V., Kasprzak, W., Niemann, H., Müller-
Wodarg, I., Waite, J., 2006. The vertical structure of Titan’s upper atmosphere
from Cassini Ion Neutral Mass Spectrometer measurements. Icarus 182 (2), 567–
576.
Zádor, J., Zsély, I., Turányi, T., 2006. Local and global uncertainty analysis of
complex chemical kinetic systems. Reliability Engineering and System Safety 91,
1232–1240.
19

ACCEP
TED M
ANUSC
RIPT
ACCEPTED MANUSCRIPT
CH4 C2H2 C2H4 C2H6 N2 HCNH2 -0.85 0.23 0.41 0.31 0.86 0.52
CH4 -0.20 -0.45 -0.56 -0.99 -0.69C2H2 0.84 0.15 0.13 0.02C2H4 0.25 0.40 0.19C2H6 0.56 0.43N2 0.68
Table 1: Rank correlation coefficients between selected neutral densities at 1200 km.Coefficients with an absolute value above 0.5 are in bold face.
20

ACCEP
TED M
ANUSC
RIPT
ACCEPTED MANUSCRIPT
List of Figures1 Eddy diffusion profiles - Hidayat et al. (1997) profile (solid line),
Strobel et al. (1992) profile (dashed line) and Toublanc et al. (1995)profile (dot dashed line). The methane molecular diffusion coefficientprofile is also included. . . . . . . . . . . . . . . . . . . . . . . . . . . 22
2 Effect of inter-species correlation of neutral species on ion densitiesat 1200 km with a Strobel et al. (1992) eddy diffusion profile: the iondensities of the 40 most abundant ions are depicted. Empty boxes:no correlation, Filled boxes: correlation. . . . . . . . . . . . . . . . . 23
3 Inter-species rank correlation coefficients for the densities of ions ofthe ionospheric model at 1200 km: empirical cumulative density func-tion (CDF) for all pairs of ions. Dashed line: uncorrelated neutraldensities; plain line : correlated case. . . . . . . . . . . . . . . . . . . 24
4 Density profiles of HCNH+: (a) with Strobel et al. eddy coefficient ;(b) with Toublanc et al. eddy coefficient. . . . . . . . . . . . . . . . . 25
5 Densities of the ten major ions at altitude 1200 km for the two eddycoefficients. Boxplots depict 50% and 90% confidence intervals. Foreach ion density, the upper boxplot corresponds to the Toublanccase, whereas the lower boxplot depicts uncertainty propagation inthe Strobel case. . . . . . . . . . . . . . . . . . . . . . . . . . . . . . 26
6 Density profile of methane in Titan ionosphere (a) in the Strobel case,(b) in the Toublanc case. . . . . . . . . . . . . . . . . . . . . . . . . 27
7 Densities of the ten major ions at altitude 1200 km for the two eddycoefficients : (a) Strobel case, (b) Toublanc case. Boxplots depict50% and 90% confidence intervals. For each ion density, the upperboxplot corresponds to uncertainty propagation of the neutral den-sity, whereas the lower boxplot depicts uncertainty propagation of ionchemistry parameters. . . . . . . . . . . . . . . . . . . . . . . . . . . 28
8 Samples and marginals from Dirichlet distributions: (a) 10% relativeuncertainty (b1, b2, b3) ∼ DIUD ((0.6, 0.3, 0.1) , (0.06, 0.03, 0.01)); (b)90% relative uncertainty (b1, b2, b3) ∼ DIUD ((0.6, 0.3, 0.1) , (0.54, 0.27, 0.09)). 29
21

ACCEP
TED M
ANUSC
RIPT
ACCEPTED MANUSCRIPT
Figure 1: Eddy diffusion profiles - Hidayat et al. (1997) profile (solid line), Strobelet al. (1992) profile (dashed line) and Toublanc et al. (1995) profile (dot dashedline). The methane molecular diffusion coefficient profile is also included.
22

ACCEP
TED M
ANUSC
RIPT
ACCEPTED MANUSCRIPT
0
2
4
6
8
10
12
14
16
18
20
22
24
26
28
30
32
34
36
38
400.01 0.1 1 10 100 1000
Ion density (cm-3
)
Fig. 2 – Effect of inter-species correlation of neutral species on ion densities at 1200km with a Strobel et al. (1992) eddy diffusion profile: the ion densities of the 40 mostabundant ions are depicted. Empty boxes: no correlation, Filled boxes: correlation.
23

ACCEP
TED M
ANUSC
RIPT
ACCEPTED MANUSCRIPT
-1 -0.8 -0.6 -0.4 -0.2 0 0.2 0.4 0.6 0.8 1[ion]-[ion] RCC
0
0.1
0.2
0.3
0.4
0.5
0.6
0.7
0.8
0.9
1
Prob
abili
ty
Correlated neutralsUncorrelated neutrals
Figure 3: Inter-species rank correlation coefficients for the densities of ions of theionospheric model at 1200 km: empirical cumulative density function (CDF) for allpairs of ions. Dashed line: uncorrelated neutral densities; plain line : correlatedcase.
24
ACCEP
TED M
ANUSC
RIPT
ACCEPTED MANUSCRIPT
Figure 4: Density profiles of HCNH+: (a) with Strobel et al. eddy coefficient ; (b)with Toublanc et al. eddy coefficient.
25

ACCEP
TED M
ANUSC
RIPT
ACCEPTED MANUSCRIPT
HCNH+
C2H5+
CH5+
N2+
C3H5+
CH3+
N2H+
N(3P)+
C2H4+
C2H3+
1 10 100 1000 10000
Ion density (cm-3
)
Figure 5: Densities of the ten major ions at altitude 1200 km for the two eddycoefficients. Boxplots depict 50% and 90% confidence intervals. For each ion density,the upper boxplot corresponds to the Toublanc case, whereas the lower boxplotdepicts uncertainty propagation in the Strobel case.
26

ACCEP
TED M
ANUSC
RIPT
ACCEPTED MANUSCRIPT
Figure 6: Density profile of methane in Titan ionosphere (a) in the Strobel case, (b)in the Toublanc case.
27

ACCEP
TED M
ANUSC
RIPT
ACCEPTED MANUSCRIPT
HCNH+
C2H5+
CH5+
N2+
C3H5+
CH3+
N2H+
N(3P)+
C2H4+
C2H3+
1 10 100 1000 10000
Ion density (cm-3
)
(a)
HCNH+
C2H5+
CH5+
N2+
C3H5+
CH3+
N2H+
N(3P)+
C2H4+
C2H3+
1 10 100 1000 10000
Ion density (cm-3
)
(b)
Figure 7: Densities of the ten major ions at altitude 1200 km for the two eddy co-efficients : (a) Strobel case, (b) Toublanc case. Boxplots depict 50% and 90% confi-dence intervals. For each ion density, the upper boxplot corresponds to uncertaintypropagation of the neutral density, whereas the lower boxplot depicts uncertaintypropagation of ion chemistry parameters.
28
ACCEP
TED M
ANUSC
RIPT
ACCEPTED MANUSCRIPT
b1 b
2
b3
0 0.2 0.4 0.6 0.8 1Branching ratio
0
10
20
30
40
50
60
Prob
abili
ty d
ensi
ty (
arb.
uni
t)
(a)
b1 b
2
b3
0 0.2 0.4 0.6 0.8 1Branching ratio
0
1
2
3
4
5
6
7
Prob
abili
ty d
ensi
ty (
arb.
uni
t)
(b)
Figure 8: Samples and marginals from Dirichlet distributions: (a) 10% relativeuncertainty (b1, b2, b3) ∼ DIUD ((0.6, 0.3, 0.1) , (0.06, 0.03, 0.01)); (b) 90% relativeuncertainty (b1, b2, b3) ∼ DIUD ((0.6, 0.3, 0.1) , (0.54, 0.27, 0.09)).
29