Modeling of synchrotron-based laboratory simulations of Titan’s ionospheric photochemistry
21
Modeling of synchrotron-based laboratory simulations of Titan’s ionospheric photochemistry Z. Peng a , N. Carrasco b,c , P. Pernot a,⇑ a Laboratoire de Chimie Physique, UMR8000, CNRS, Univ Paris-Sud, F-91405 Orsay, France b Université de Versailles Saint-Quentin, CNRS/INSU, LATMOS, UMR 8190, F-78280 Guyancourt, France c Institut Universitaire de France, 103 Bvd St-Michel, 75005 Paris, France article info Article history: Received 28 October 2013 Revised 10 February 2014 Accepted 27 March 2014 Available online 8 May 2014 Keywords: Titan Photochemistry Modeling Uncertainty analysis Laboratory simulation N 2 /CH 4 plasma abstract The APSIS reactor has been designed to simulate in the laboratory with a VUV synchrotron irradiation the photochemistry occurring in planetary upper atmospheres. A N 2 —CH 4 Titan-like gas mixture has been studied, whose photochemistry in Titan’s ionospheric irradiation conditions leads to a coupled chemical network involving both radicals and ions. In the present work, an ion–neutral coupled model is developed to interpret the experimental data, taking into account the uncertainties on the kinetic parameters by Monte Carlo sampling. The model predicts species concentrations in agreement with mass spectrometry measurements of the methane consumption and product blocks intensities. Ion chemistry and in particular dissociative recombination are found to be very important through sensitivity analysis. The model is also applied to complementary environmental conditions, corresponding to Titan’s ionospheric average conditions and to another existing synchrotron setup. An innovative study of the correlations between species concentrations identifies two main competitive families, leading respectively to saturated and unsaturated species. We find that the unsaturated growth family, driven by C 2 H 2 , is dominant in Titan’s upper atmosphere, as observed by the Cassini INMS. But the saturated species are substantially more intense in the measurements of the two synchrotron experimental setups, and likely originate from catalysis by metallic walls of the reactors. Ó 2014 The Authors. Published by Elsevier Ltd. This is an open access article under the CC BY-NC-ND license (http://creativecommons.org/licenses/by-nc-nd/3.0/). 1. Introduction Titan’s ionosphere extends above 800 km of altitude, with local pressures no higher than 10 5 –10 6 mbar. In such diluted conditions, the efficient organic chemistry detected by mass spectrometers onboard the Cassini orbiter was unexpected, and revived our understanding of the organic chemistry occurring in Titan’s atmosphere [1–18]. Large condensable molecules responsible for the nucleation leading to solid atmospheric aerosols are now known to be produced in the ionosphere [9,19–22]. The reason for the chemical growth in spite of the low molecular density has been found in the chemical coupling between radicals and reactive charged species present in the ionosphere, i.e. positive ions, negative ions and electrons [22]. The complexity of the chemistry is however far from being charted, as illustrated by the absence of data on the dissociative recombination products for species larger than four carbon and/or nitrogen atoms [23–25], or even for modest size ions of importance in Titan’s ionosphere, such as CH 2 NH þ 2 [17]. The initial steps of molecular growth following EUV photolysis of N 2 =CH 4 =C 2 H 2 mixtures were studied, at the second time-scale, in an ion trap by Thissen et al. [26]. No substantial growth was observed in these conditions, unless C 2 H 2 was present in the initial mixture. On the other hand, at the much longer time-scale of Titan’s ionosphere, a correlation analysis of the positive ions densities recorded by Cassini’s Ion and Neutral Mass Spectrometer (INMS) enabled Westlake et al. [18] to infer small growth units having one or two carbon atoms. To complete and more easily approach in the laboratory this partially ionized chemistry starting with N 2 =CH 4 , a new generation of photochemical reactors has been developed [27,28]. In this case, VUV synchrotron sources are used to simulate the VUV part of the solar spectrum, the major source of ionization in Titan’s iono- sphere. A first series of results was obtained with the ‘‘Atmospheric Photochemistry Simulated by Synchrotron’’ (APSIS) experiment using a mass spectrometer for neutrals detection, and compared with Cassini’s data [28]. The trends on the neutral species are in http://dx.doi.org/10.1016/j.grj.2014.03.002 2214-2428/Ó 2014 The Authors. Published by Elsevier Ltd. This is an open access article under the CC BY-NC-ND license (http://creativecommons.org/licenses/by-nc-nd/3.0/). ⇑ Corresponding author. Tel.: +33 1 69 15 54 28. E-mail address: [email protected] (P. Pernot). GeoResJ 1–2 (2014) 33–53 Contents lists available at ScienceDirect GeoResJ journal homepage: www.elsevier.com/locate/GRJ
Transcript of Modeling of synchrotron-based laboratory simulations of Titan’s ionospheric photochemistry
GeoResJ 1–2 (2014) 33–53
Contents lists available at ScienceDirect
GeoResJ
journal homepage: www.elsevier .com/locate /GRJ
Modeling of synchrotron-based laboratory simulations of Titan’sionospheric photochemistry
http://dx.doi.org/10.1016/j.grj.2014.03.0022214-2428/� 2014 The Authors. Published by Elsevier Ltd.This is an open access article under the CC BY-NC-ND license (http://creativecommons.org/licenses/by-nc-nd/3.0/).
⇑ Corresponding author. Tel.: +33 1 69 15 54 28.E-mail address: [email protected] (P. Pernot).
Z. Peng a, N. Carrasco b,c, P. Pernot a,⇑a Laboratoire de Chimie Physique, UMR8000, CNRS, Univ Paris-Sud, F-91405 Orsay, Franceb Université de Versailles Saint-Quentin, CNRS/INSU, LATMOS, UMR 8190, F-78280 Guyancourt, Francec Institut Universitaire de France, 103 Bvd St-Michel, 75005 Paris, France
a r t i c l e i n f o a b s t r a c t
Article history:Received 28 October 2013Revised 10 February 2014Accepted 27 March 2014Available online 8 May 2014
Keywords:TitanPhotochemistryModelingUncertainty analysisLaboratory simulationN2/CH4 plasma
The APSIS reactor has been designed to simulate in the laboratory with a VUV synchrotron irradiation thephotochemistry occurring in planetary upper atmospheres. A N2—CH4 Titan-like gas mixture has beenstudied, whose photochemistry in Titan’s ionospheric irradiation conditions leads to a coupled chemicalnetwork involving both radicals and ions. In the present work, an ion–neutral coupled model is developedto interpret the experimental data, taking into account the uncertainties on the kinetic parameters byMonte Carlo sampling. The model predicts species concentrations in agreement with mass spectrometrymeasurements of the methane consumption and product blocks intensities. Ion chemistry and inparticular dissociative recombination are found to be very important through sensitivity analysis. Themodel is also applied to complementary environmental conditions, corresponding to Titan’s ionosphericaverage conditions and to another existing synchrotron setup. An innovative study of the correlationsbetween species concentrations identifies two main competitive families, leading respectively tosaturated and unsaturated species. We find that the unsaturated growth family, driven by C2H2, isdominant in Titan’s upper atmosphere, as observed by the Cassini INMS. But the saturated species aresubstantially more intense in the measurements of the two synchrotron experimental setups, and likelyoriginate from catalysis by metallic walls of the reactors.� 2014 The Authors. Published by Elsevier Ltd. This is an open access article under the CC BY-NC-ND license
(http://creativecommons.org/licenses/by-nc-nd/3.0/).
1. Introduction
Titan’s ionosphere extends above 800 km of altitude, with localpressures no higher than 10�5–10�6 mbar. In such dilutedconditions, the efficient organic chemistry detected by massspectrometers onboard the Cassini orbiter was unexpected, andrevived our understanding of the organic chemistry occurringin Titan’s atmosphere [1–18]. Large condensable moleculesresponsible for the nucleation leading to solid atmosphericaerosols are now known to be produced in the ionosphere[9,19–22]. The reason for the chemical growth in spite of the lowmolecular density has been found in the chemical couplingbetween radicals and reactive charged species present in theionosphere, i.e. positive ions, negative ions and electrons [22].
The complexity of the chemistry is however far from beingcharted, as illustrated by the absence of data on the dissociativerecombination products for species larger than four carbon
and/or nitrogen atoms [23–25], or even for modest size ions ofimportance in Titan’s ionosphere, such as CH2NHþ2 [17]. Theinitial steps of molecular growth following EUV photolysis ofN2=CH4=C2H2 mixtures were studied, at the second time-scale, inan ion trap by Thissen et al. [26]. No substantial growth wasobserved in these conditions, unless C2H2 was present in the initialmixture. On the other hand, at the much longer time-scale ofTitan’s ionosphere, a correlation analysis of the positive ionsdensities recorded by Cassini’s Ion and Neutral Mass Spectrometer(INMS) enabled Westlake et al. [18] to infer small growth unitshaving one or two carbon atoms.
To complete and more easily approach in the laboratory thispartially ionized chemistry starting with N2=CH4, a new generationof photochemical reactors has been developed [27,28]. In this case,VUV synchrotron sources are used to simulate the VUV part of thesolar spectrum, the major source of ionization in Titan’s iono-sphere. A first series of results was obtained with the ‘‘AtmosphericPhotochemistry Simulated by Synchrotron’’ (APSIS) experimentusing a mass spectrometer for neutrals detection, and comparedwith Cassini’s data [28]. The trends on the neutral species are in

34 Z. Peng et al. / GeoResJ 1–2 (2014) 33–53
agreement with Titan’s observations: an efficient organic growthand the formation of nitrogen-bearing products.
However no analytical device enabled the direct detection ofthe ions in the reactive medium. Knowing their central role inthe organic growth in Titan’s atmosphere, our aim is to design afully coupled model to theoretically probe the ion content in theAPSIS reactor and interpret the results observed on the neutral spe-cies. Building an exhaustive chemical model involving all theknown and partially known processes, as well as their uncertain-ties to perform uncertainty propagation and sensitivity analysis,prevents from a complex description of the dynamics within theAPSIS reactor.
As a first approach, the study is performed with a 1-cell model,run in reference conditions corresponding to the experimentsreported in Peng et al. [28]. These results are used to validate themodel and perform uncertainty and sensitivity analysis to high-light prominent processes explaining the observed chemicalgrowth. Complementary model runs have been performed for dif-ferent conditions of the physical parameters (irradiation spectrum,pressure, temperature) and compared to the reference one to inferthe impact of these parameters in laboratory simulations and dif-ferent environments. Finally, the model has been run in conditionssimilar to the experiments of Imanaka & Smith [27] for comparisonwith APSIS, and in Titan-like conditions.
The model is established in Section 2, describing the main char-acteristics of the APSIS reactor, the chemical scheme, the chemis-try-transport 1-cell model, and the generation of electron-impactmass spectra. The probabilistic description of the uncertain chem-ical parameters, and notably new wavelength-dependent photoly-sis branching ratios, and the method to handle it are alsodeveloped in this section. Application of the model to the APSISreactor is presented in Section 3.1. The stationary state mole frac-tions of the products are analyzed and compared to experimentaldata. Exploration of the Monte Carlo samples generated for uncer-tainty analysis is performed with several objectives: (i) identifica-tion of the main uncertainty sources, in terms of reaction type andspecific reactions (key reactions); (ii) detection of species commu-nities in the chemical network to identify dominant growth path-ways. This section is completed with the analysis of simulations indifferent physical conditions (irradiation spectrum, pressure andtemperature). The following sections are devoted to the analysisof simulations of Imanaka & Smith’s reactor (Section 3.2), and toa proxy of Titan’s ionospheric conditions (Section 3.3). Theconclusion outlines the main results of this research in relationwith the detailed chemical modeling of N2/CH4 plasmas and therepresentativity of laboratory simulations of Titan’s ionosphericchemistry.
2. The N2/CH4 photochemical plasma model
2.1. The APSIS reactor
The APSIS reactor is described in detail in Peng et al. [28]. Itis a stainless-steel parallelepiped with internal dimensions(length �width ce:hsp sp="0.25"/>� height) of 500 mm � 114 mm� 92 mm. The experimental conditions chosen for the modelingare reported in Table 1. A reactive gas mixture N2/CH4 = 90/10(purity > 99.999%,Air Liquide) is flowed into the reactor at a gasflow of 7 standard cubic centimeter per minute (sccm), controlledby a MKS mass flow controller. A primary pumping unit ensures astationary flow of reactive gas whose partial pressure reaches4.5 mbar and a residence time of the gas mixture of about 180 s.
The APSIS chamber is coupled windowless to the DISCO beam-line at SOLEIL synchrotron facility [29], using a differential pump-ing system [30]. A non-reactive carrier gas (He) is continuouslyinjected between the beamline and the APSIS chamber in order
to prevent the reactive mixture to be diffusing out of the reactorinto the differential pumping system and leading to a total pres-sure of 7:0� 0:1 mbar in the reactor. The experiments are con-ducted at room temperature.
In situ measurement of the gas phase composition is achievedusing a Pfeiffer QME 200 quadrupole mass spectrometer (MS).The MS detector has a resolution of 1 u and covers the 1–100 urange. Electron energy is 70 eV. Gas is sampled by a capillary tubemobile along the reactor length and probing at about 1 cm fromthe irradiated column. This tube is long enough to reduce theconductance between the reactor chamber and the MS, withthe consequence that only stable molecules can be detected withthis setup.
The photon flux of the DISCO beamline (a few 1011 ph s�1 for0.1 nm bandwidth) leads to a N2 dissociation ratio of less than10�4. The signal at m/z 28 of N2 is therefore constant enoughthroughout the experiments to be considered as a fixed reference,and it is used to normalize the mass spectra (Section 2.4).
2.2. The reaction scheme
The present chemical scheme incorporates the complete neutralchemistry,i.e. photodissociation, bimolecular thermal reactions andtrimolecular thermal recombinations, from Hébrard et al. [31,32],with new developments for the photodissociation branching ratiosof CH4;N2;H2;C2H2;C2H4;C2H6 and HCN, following Gans et al. [33],as described in Section 2.2.1. In addition, the model implementsthe ion chemistry database established by Carrasco et al. [34]and Plessis et al. [23], including photo-ionizations, ion–moleculereactions and dissociative recombinations involving C, H and N.Oxygen chemistry is excluded, since O2 is just a trace gas in thereactor and, according to GC–MS analysis, does not play a signifi-cant role in APSIS photochemistry [28]. The single electron sourcein the APSIS reactor being photoelectrons, with insufficient energyto ionize the medium, electron impact reactions are not included.
The present chemical scheme considers only positive, singlycharged ions. The DISCO spectrum intensity is vanishing below50 nm, which prevents the double ionization of N2 [35] and CH4
[36], and therefore a sizeable production of dications. Negativeions have been identified as interesting vectors for the formationof heavy particles in Titan’s ionosphere [14] and chemical plasmas[37], but their formation by attachment of thermal electronsinvolves essentially minor radical species and proceeds at verysmall rates [14].
In total, the model includes 244 species (125 neutrals and 119ions) reacting with each other through 1708 reactions (33 photol-ysis, 415 bimolecular reactions, 82 termolecular reactions, 574 dis-sociative recombinations, 604 ion–molecule reactions). All theparameters describing the rate constants of these processes areuncertain (some of them unknown). They are represented by ran-dom variables with prescribed distributions, following Hébrardet al. [31,32], Carrasco et al. [34] and Plessis et al. [23].
The present model is original for two reasons: (1) it implementsa new consistent treatment of the separation between photolysiscross-section and branching ratios, which are typically measuredin different experiments (see next section); and (2) it is the singleion–neutral coupled model implementing the state-of-the-art dis-sociative recombination scheme developed by Plessis et al. [23],which for the first time includes all available data for this process,notably the partial measurements of branching ratios.
2.2.1. Representation of photolysis cross-sections and branching ratiosIn previous works, photolysis rate constants were treated as
lognormally distributed uncertain parameters [38,32,31,39]. InPeng et al. [40] and Gans et al. [33], the separation of photolysiscross-sections and branching ratios was proposed for several

Table 1Summary of the conditions for the simulations in this study. I0: integrated photon flux (from 50 to 200 nm); L: reactors length, A: reactor cross-section (width x height); P: totalpressure; T: temperature; sr: residence time; N2 : CH4: composition of reactant gas; qCH4
: methane relative consumption at stationary state.
Scenario Spectrum I0 (ph m�2 s�1) L (m) A(cm2) P (Pa) T (K) sr (s) N2:CH4 qCH4(%)
APSIS DISCO 2� 1012 0.5 105 700 300 284 90:10 0.07
60 nm 60 nm – – – – – – – 5.082 nm 82 nm – – – – – – – 3.3Sun Solar – – – – – – – 0.008Low Pre DISCO – 5� 105 – 7� 10�4 – – – 0.07
Low T DISCO – – – – 150 – – 0.03
‘‘I & S’’a 60 nm 8� 1013 0.7 120 13 300 53 95:5 70.0
‘‘Titan’’ Solar 1� 109 5� 105 105 7� 10�4 150 2:8� 106 90:10 2.2
a Ref.: Imanaka and Smith [27].
Z. Peng et al. / GeoResJ 1–2 (2014) 33–53 35
reasons, the main one being that these data are typically measuredseparately, and that each has a specific type of measurementuncertainty, with an essential sum-to-one constraint for thebranching ratios [41]. This separation has already been systemati-cally implemented by our team for the ion–neutral reactions[34,41,42], the dissociative recombination reactions [23], andrecently for the neutral pathways of CH4 photolysis [33]. This linewas pursued here for the main photolysis processes, and their neu-tral and ionic products. Moreover, the elaboration of informedwavelength-dependent representations for branching ratios is allthe more important, considering the flat spectrum of the DISCObeamline, in contrast with the Ly-a-dominated solar spectrum inthe wavelength range of interest [33].
2.2.1.1. Cross-sections. For the species considered here, the uncer-tainty in measured cross-sections at a given wavelength is mainlydue to systematic effects, such as discrepancy between differentmeasurements or temperature effects [31,43]. By comparison, therandom errors within each dataset are negligible. Considering thatthere is not enough information in the literature to define a wave-length-dependent uncertainty factor, we account for the dominantsystematic error by adopting a representation with full inter-wave-length uncertainty correlation. On purpose, we use a wavelength-independent uncertainty factor Fri
for species i. In the Monte CarloUncertainty Propagation (see Section 2.3.4), random samples of thecross-sections are thus obtained through
ln riðkÞ ¼ ln r0i ðkÞ þ �i; ð1Þ
where we use for all wavelengths the same random number �i, sam-pled from a normal distribution with mean zero and standard devi-ation ln Fri
. We used the uncertainty factors recommended inHébrard et al. [31]. The reference cross-sections for N2 and CH4
were taken from Peng et al. [40].
2.2.1.2. Branching ratios. The rather uniform spectrum of the DISCObeamline [28], calls for a continuous representation of photolysisbranching ratios. However, photolysis branching ratios are oftenknown at sparse discrete wavelengths, and large uncertaintyresults from the inter-/extra-polation out of these reference points.The case of CH4 has been treated by Gans et al. [33], who developeda novel wavelength-dependent probabilistic-tree model to accountfor all existing information about neutral fragmentation channels.For the photochemical model of the APSIS experiments with ioniz-ing VUV photons, one has to complete this scheme with the ionicchannels. This is true for all photolyzed species, and we extendedthe method proposed in Gans et al. [33].
The heterogeneity of information sources on branching ratiodata is a major problem: the available data are typically composedof: (i) the nominal data and the corresponding uncertainties for theneutral channels of a large set of species in Hébrard et al. [31]; (ii)
the SWRI nominal data for both neutral and ionic channels for onlya few species, i.e. CH4;N2;H2;C2H2;C2H4;C2H6 and HCN, [44]; and(iii) for CH4, the probabilistic representation of Gans et al. [33].There are overlaps between these data, and some contradictionsas well. A set of branching ratios for ionic and neutral products,with the corresponding uncertainties, was designed as follows:
� For the species without photoionization channel in the wave-length range of the experiment, nominal data and uncertaintiesare taken from Hébrard et al. [32,31];� For N2;H2;C2H2;C2H4;C2H6 and HCN, nominal data in the SWRI
database are used, and uncertainties for neutral channels aretaken from Hébrard et al. [31]. Ionic channels have no recom-mended uncertainty. Considering that there is generally a muchhigher precision for ion detection techniques than for neutralsor radicals, we use a nested scheme to preserve as much uncer-tainty structure as possible:
Aþ hm�!
��������!Bneuð1�DBn=iÞ��������!Bn1ð1�DBn1Þ Neutral Channel 1
��������!Bn2ð1�DBn2Þ Neutral Channel 2. . . . . .
8>><>>:
��������!Bionð1�DBn=iÞ��������!Bi1ð1�DBi1Þ Ionic Channel 1
��������!Bi2ð1�DBi2Þ Ionic Channel 2. . . . . .
8>><>>:
8>>>>>>>>>>><>>>>>>>>>>>:
;
ð2Þ
where Bneu and Bion are respectively the total neutral and ioniccontributions and both have a relative uncertainty of DBn=i. Bn1;Bn2
. . . and Bi1;Bi2 . . . are the branching ratios of the neutral and ionicchannels, respectively, and DBn1;DBn2 . . . and DBi1;DBi2 . . . are theircorresponding relative uncertainties. For lack of data and accordingto their typical values in the literature [45], we assign the branchingratios of all ionic channels a 20 % relative uncertainty. Their totalcontribution is typically more accurate and its relative uncertaintywas estimated to DBn=i ¼ 3%.� The representation of the branching ratios for the photolysis of
CH4 is based on the same scheme. We apply the representationdescribed in Gans et al. [33] to the neutral part, with a lowerwavelength limit extented to 80 nm, where the neutral chan-nels become negligible in Huebner and Link [44]. The remainingpart of the representation is the same as in the previous case.
To ensure the continuity in the interpolation/extrapolation ofthe branching ratio data for wavelength intervals (e.g. branchingratios provided in SWRI [44] or recommended in Hébrard et al.[31]), we need to preserve the correlation between wavelengthsin a branching ratio sample. To address the nature of these wave-length-interval data, we use the generalized Dirichlet distribution(Dirg), which can be easily parameterized by nominal values and
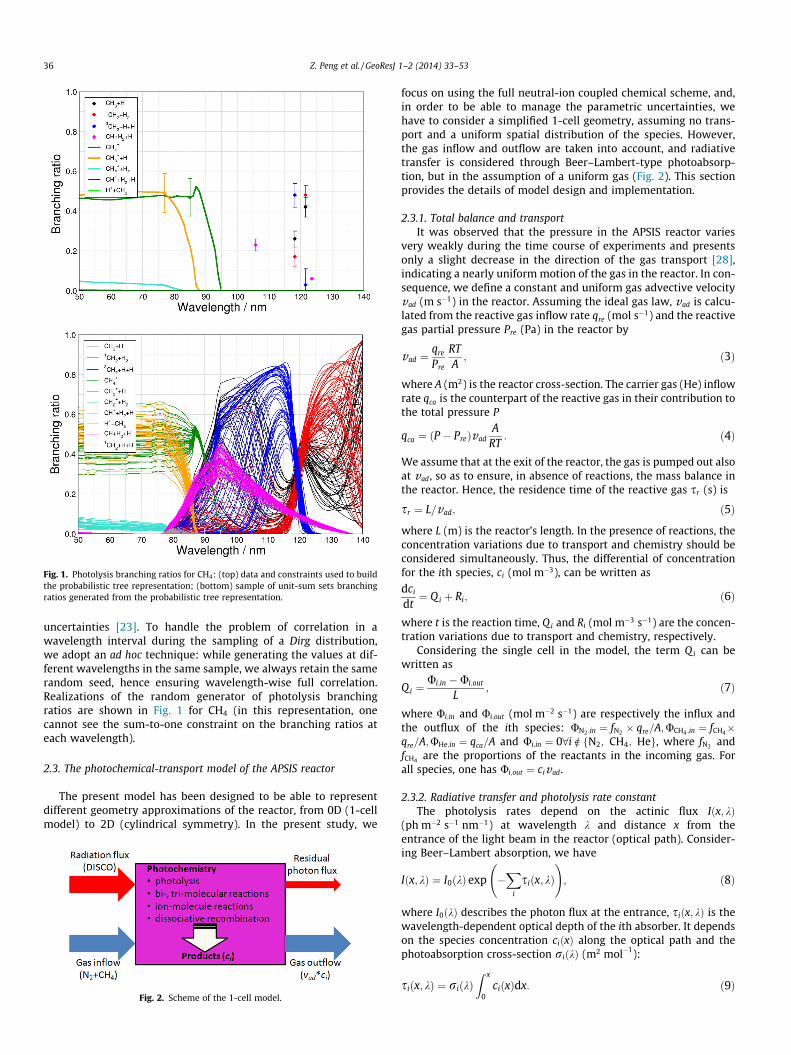
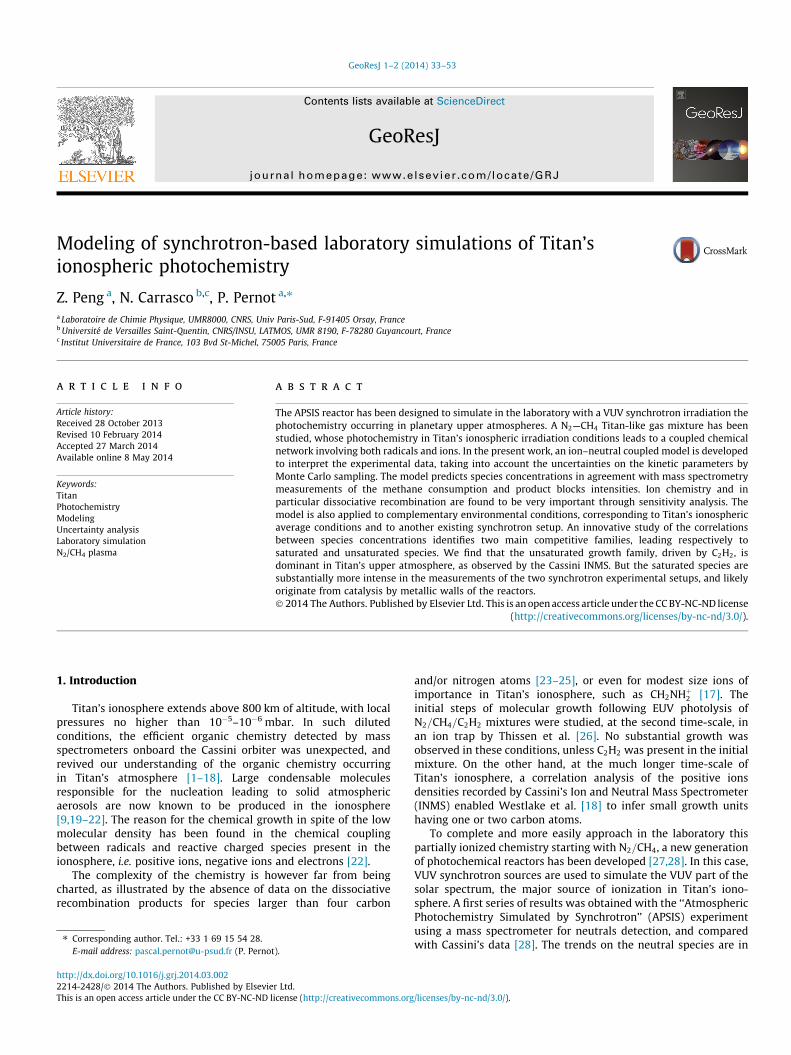
Fig. 1. Photolysis branching ratios for CH4: (top) data and constraints used to buildthe probabilistic tree representation; (bottom) sample of unit-sum sets branchingratios generated from the probabilistic tree representation.
36 Z. Peng et al. / GeoResJ 1–2 (2014) 33–53
uncertainties [23]. To handle the problem of correlation in awavelength interval during the sampling of a Dirg distribution,we adopt an ad hoc technique: while generating the values at dif-ferent wavelengths in the same sample, we always retain the samerandom seed, hence ensuring wavelength-wise full correlation.Realizations of the random generator of photolysis branchingratios are shown in Fig. 1 for CH4 (in this representation, onecannot see the sum-to-one constraint on the branching ratios ateach wavelength).
2.3. The photochemical-transport model of the APSIS reactor
The present model has been designed to be able to representdifferent geometry approximations of the reactor, from 0D (1-cellmodel) to 2D (cylindrical symmetry). In the present study, we
Fig. 2. Scheme of the 1-cell model.
focus on using the full neutral-ion coupled chemical scheme, and,in order to be able to manage the parametric uncertainties, wehave to consider a simplified 1-cell geometry, assuming no trans-port and a uniform spatial distribution of the species. However,the gas inflow and outflow are taken into account, and radiativetransfer is considered through Beer–Lambert-type photoabsorp-tion, but in the assumption of a uniform gas (Fig. 2). This sectionprovides the details of model design and implementation.
2.3.1. Total balance and transportIt was observed that the pressure in the APSIS reactor varies
very weakly during the time course of experiments and presentsonly a slight decrease in the direction of the gas transport [28],indicating a nearly uniform motion of the gas in the reactor. In con-sequence, we define a constant and uniform gas advective velocityvad (m s�1) in the reactor. Assuming the ideal gas law, vad is calcu-lated from the reactive gas inflow rate qre (mol s�1) and the reactivegas partial pressure Pre (Pa) in the reactor by
vad ¼qre
Pre
RTA; ð3Þ
where A (m2) is the reactor cross-section. The carrier gas (He) inflowrate qca is the counterpart of the reactive gas in their contribution tothe total pressure P
qca ¼ ðP � PreÞvadA
RT: ð4Þ
We assume that at the exit of the reactor, the gas is pumped out alsoat vad, so as to ensure, in absence of reactions, the mass balance inthe reactor. Hence, the residence time of the reactive gas sr (s) is
sr ¼ L=vad; ð5Þ
where L (m) is the reactor’s length. In the presence of reactions, theconcentration variations due to transport and chemistry should beconsidered simultaneously. Thus, the differential of concentrationfor the ith species, ci (mol m�3), can be written as
dci
dt¼ Q i þ Ri; ð6Þ
where t is the reaction time, Qi and Ri (mol m�3 s�1) are the concen-tration variations due to transport and chemistry, respectively.
Considering the single cell in the model, the term Q i can bewritten as
Qi ¼Ui;in �Ui;out
L; ð7Þ
where Ui;in and Ui;out (mol m�2 s�1) are respectively the influx andthe outflux of the ith species: UN2 ;in ¼ fN2 � qre=A;UCH4 ;in ¼ fCH4�qre=A;UHe;in ¼ qca=A and Ui;in ¼ 08i R fN2; CH4; Heg, where fN2 andfCH4 are the proportions of the reactants in the incoming gas. Forall species, one has Ui;out ¼ civad.
2.3.2. Radiative transfer and photolysis rate constantThe photolysis rates depend on the actinic flux Iðx; kÞ
(ph m�2 s�1 nm�1) at wavelength k and distance x from theentrance of the light beam in the reactor (optical path). Consider-ing Beer–Lambert absorption, we have
Iðx; kÞ ¼ I0ðkÞ exp �X
i
siðx; kÞ !
; ð8Þ
where I0ðkÞ describes the photon flux at the entrance, si x; kð Þ is thewavelength-dependent optical depth of the ith absorber. It dependson the species concentration ciðxÞ along the optical path and thephotoabsorption cross-section riðkÞ (m2 mol�1):
siðx; kÞ ¼ riðkÞZ x
0ciðxÞdx: ð9Þ

Z. Peng et al. / GeoResJ 1–2 (2014) 33–53 37
The photolysis rate constant of the jth channel of the ith absorber atposition x, is given by
JijðxÞ ¼Z
kIðx; kÞriðkÞbijðkÞdk; ð10Þ
where bijðkÞ is the branching ratio at wavelength k of this channel.As there is a single cell in the model design of the present study,
an average value of the photolysis rate constant has to be used.JijðxÞ at the cell center, Jijð�xÞ, is commonly chosen in atmosphericmodeling studies [38], but this is not appropriate for our model,where the rate constant can strongly vary along the optical path.Instead, we calculate the average of JijðxÞ along the reactor length,
JijðxÞ ¼1L
Z L
0JijðxÞdx: ð11Þ
Based on the assumption of uniform gas density, one can easilyderive
JijðxÞ ¼Z
kI0ðkÞriðkÞbijðkÞ
1� e�LP
iðciriðkÞÞ
LP
iðciriðkÞÞdk: ð12Þ
To evaluate this integral, the wavelength is discretized with a reso-lution of 1 nm, adapted to the spectral resolution of the cross-sec-tions database of Hébrard et al. [31]. The additional photolysisdata used in this study, from the SWRI database [44], are interpo-lated on this wavelength grid using a Gauss–Legendre quadrature[46].
2.3.3. Integration methodThe implicit-explicit Runge–Kutta–Chebyshev (IRKC) method
[47], capable of integrating systems of partial differential equations(PDEs), is applied to the present model. It handles the equations byboth an explicit part FEðt; yÞ and an implicit part FIðt; yÞ, i.e.
y0ðtÞ ¼ FEðt; yÞ þ FIðt; yÞ: ð13Þ
For a transport-reaction model, it is suggested that FE and FI
respectively describe the parts of a cell’s differential which arerespectively dependent (e.g. diffusion and photolysis) andindependent (e.g. thermal reactions) on other cells. The latter, FI ,is usually regarded as a system of ordinary differential equations(ODEs) and can be very stiff, which is the case for our coupledion–neutral model. The IRKC method is able to cope with theproblem of stiffness in FI [48].
The present model has no internal transport. In theory, thewhole model could therefore be considered as a set of ODEs andsolved in FI or by other ODE solvers. However, the photolysis istreated in FE, as in transport–reaction models, because we treatthe radiative transfer explicitly, and complex evaluation of Jaco-bian elements for the photolysis makes it impractical to regardthe photolysis rate equations as ODEs.
Besides, IRKC enables to account for diffusion: for further stud-ies in higher dimension (1D or 2D), IRKC will be well adapted to atransport–reaction model. The part of thermal reactions, indepen-dent on other cells, could be treated implicitly and separately ineach cell, so that it could be repeatedly implemented by the pro-gram. This leads to small storage requirements and good comput-ing performance.
Tests were performed to check the convergence and stability ofthe stationary state of the present model integrated by the IRKCmethod. The stationary state is very robust to either perturbationsof initial conditions or the choice of propagator toleranceparameters.
2.3.4. Uncertainty managementAs the chemical parameters of the model are intrinsically uncer-
tain, one has to evaluate the impact of this uncertainty of the input
parameters on the model outputs (mole fractions of products). Theformula of the propagation of distributions [49]
pðY ¼ yÞ ¼Z
dX1dX2 . . . dXnpðX1;X2; . . . ;XnÞ
� dðy� f ðX1;X2; . . . ;XnÞÞ; ð14Þ
provides a transformation from the joint probability density func-tion pðX1;X2; . . . ;XnÞ of all input parameters, to that of the output(s)Y ¼ f ðX1;X2; . . . ;XnÞ. From pðYÞ, one can compute all the necessarystatistics.
It is rarely possible to perform the integration above analyti-cally. Instead, the BIPM recommends the use of Monte Carlo Uncer-tainty Propagation (MCUP) methods [49], in which we propagaterepresentative samples of the inputs distributions, rather thanthe analytic distributions themselves. We generate random setsof input parameters according to their probability density function,and then, for each set, evaluate the corresponding outputs ofthe model, thus building a representative sample of the outputsdistribution.
The MCUP method is convenient to treat models with manyinputs and outputs. Its convergence does not depend on the num-ber of input parameters. Moreover, it is directly applicable tomulti-outputs models, through a single set of samples. As a result,the intrinsic correlation between the outputs is preserved and canbe used for further analysis (Section 3.1.3).
However, the MCUP method is expensive in computer time(repeated runs of the model necessary to generate significant sta-tistics). We limit our sampling to 500 runs, with random samplesgenerated for each process type according to Carrasco et al. [34],Hébrard et al. [32], Plessis et al. [23] and Gans et al. [33].
2.4. Generation of mass spectra
We present here the procedure to generate electron impactmass spectra from the simulated neutral species concentrations.We adopt a 1 u mass resolution, for direct comparison with exper-imental spectra. The intensity, Ij, of a mass peak at integer m/z j ismodeled by
Ij ¼X
i
ricifij; j ¼ 1;2 . . . n; ð15Þ
where ri and ci are respectively the electron impact cross-sectionand the concentration of the ith species, n is the maximal mass,and fij is the fragmentation pattern of the ith species at m/z j, withthe constraint
Pnj¼1fij ¼ 1 [50].
The electron impact cross-sections for a CxHyNz species aremodeled by the formula proposed by Puccio and Miller [50]
ri=Å2 ¼ 0:460xþ 1:086yþ 1:348z: ð16Þ
The fragmentation patterns for almost all stable species up to 6heavy (C, N) atoms and some heavier species are extracted fromthe NIST Chemistry Webbook [51], well covering the stable speciesof interest in the present study, and including Earth natural isotopicabundances. However, this database provides no fragmentationdata for radicals and there are only few data of this type in the lit-erature. In consequence, we chose to exclude the radicals from theMS. Finally, we average the fragmentation patterns of isomers, ifthey are not distinguished in the model. For example, C3H6 in ourmodel represents both propene and cyclopropane: their fragmenta-tion patterns are averaged with equal weights.
In details, the generation of the neutral MS from a Monte Carlosample of species concentrations proceeds according to the follow-ing steps:

38 Z. Peng et al. / GeoResJ 1–2 (2014) 33–53
1. Perform the Monte Carlo loop by calculating the kth sampleof the intensities IðkÞj ; ðj ¼ 1;2 . . . n; k ¼ 1;2 . . . mÞ at differentm/z from the kth of m samples of the species concentrationscðkÞi by
IðkÞj ¼X
i
ricðkÞi fij; j ¼ 1;2; . . . ; n; k ¼ 1;2 . . . m: ð17Þ
2. Normalize, within each set of samples, the intensities withrespect to that at m/z 28 (molecular ion signal of N2, themost abundant species), for comparison with otherexperimental mass spectra.
3. Generate statistics of the normalized intensities.
Note that the estimated electron impact cross-sections (Eq. (16))and the NIST fragmentation patterns [51] are uncertain. However,compared to the relative uncertainties on the kinetic parametersand the species concentrations (often larger than 100%), theirrelative uncertainties (�10% [50]) are treated as negligible.
There are some sources of bias to be considered when compar-ing the simulated MS to experimental ones: (i) the APSIS and theNIST standard MS were measured at different pressures, whichmay significantly influence the fragmentation patterns [28]; (ii)different mass spectrometers may overlap the major peaks (e.g.m/z 28) with neighboring peaks in different ways, interfering inthe determination of the intensities of these minor peaks. Theseeffects are difficult to quantify, and are not accounted for in thegeneration of the simulated MS.
3. Results and discussion
The 1-cell model has been run in reference conditions corre-sponding to the APSIS experiments [28]. These results are used toevaluate the model and perform uncertainty and sensitivity analy-sis. Additional sets of model runs have been performed for differ-ent conditions of the physical parameters (irradiation spectrum,pressure, temperature) and compared to the reference one to inferthe impact of these parameters in laboratory simulations. Finally,the model has been applied to conditions similar to the experi-ments of Imanaka & Smith [27] , and to a rough proxy of Titan’sionosphere. The parameters for all simulations are reported inTable 1.
3.1. Simulation of the APSIS reactor
The reference case of the APSIS model corresponds to the exper-iments at 7 sccm, which were available when we began to developthe model [28]. The physical conditions of the reference case are:P ¼ 7 mbar (700 Pa), T ’ 300 K and a reactive gas inflowqre ¼ 7 sccm (4.7 � 10�6 mol s�1), resulting in a gas residence timeof 284 s (Table 1).
We integrate this model until the system reaches a stationarystate (SS), i.e. about 1000 s after the start of irradiation. This timeis comparable to the largest time constant measured in the APSISexperiments, for the peak at m/z 52 (990 s) [28].
3.1.1. Comparison to experimental resultsThe distribution of the stationary state mole fractions (normal-
ized to N2) is presented in Fig. 3. Starting from the C2 block, theconcentrations of stable neutrals globally decrease with their mass.The main C2 species, i.e. C2H2;C2H4;C2H6 and HCN, have molefractions around 10�5, and the main C3 (C3H6;C3H8, etc.), C4(C2H3CN;C4H8, etc.) around 10�6 and 10�7, respectively. In the C7and C8 blocks, several species still have a mole fraction between10�10 and 10�15,e.g. C7H4;C7H6 and C8H2.
The total mole fraction of ions is about 10�9. The decrease of ionconcentrations with mass is less evident than for neutrals. Most ofthe major ions (from C1 to C10) have mole fraction between 10�10
and 10�15.The stationary state CH4 consumption ratio
dCH4 ¼½CH4�0 � ½CH4�SS
½CH4�0; ð18Þ
in the experiments and in the model are respectivelydCH4 ¼ 0:30� 0:06% and 0:07� 0:01%. They are not in perfectagreement, but, considering the model simplicity and absence ofadjustable parameters, a factor of 4 is tolerable. More specifically,the simplified description of advection and radiative transfer inthe 1-cell model may result in a bias of the effective gas residencetime and in consequence of the methane consumption.
Some species predicted by the present model were not identi-fied in the APSIS in situ mass spectra, e.g. NH3 and CH2NH, becausetheir parent MS peaks are hidden by the signals of OHþ and14N15Nþ. But their formation is confirmed in the PAMPRE reactorin similar conditions [52], and thus likely also in the APSIS exper-iments. Besides, the model predicts the formation of other specieswith a concentration below the detection limit of the APSIS MSmeasurements, e.g. most C5 and C6 species, especially benzene.
The mole fractions (except for N2 and CH4) were summed byblock. In each Cx block, the distribution of the results is expressedby a violin plot, whose widths at different mole fraction valuesshow the corresponding probability density (Fig. 4). Experimentalresults from the 7 sccm APSIS experiments [28] have been overlaidfor comparison. The experimental mass spectrum intensities havebeen divided by their relative (to N2) ionization cross-sections,estimated according to Eq. (16), i.e. 3, 4 and 5 for the C2, C3 andC4 blocks, respectively. Note that the Cx (x P 2) abundances fol-low a powerlaw distribution, as described by Dobrijevic andDutour [53].
The simulation predictions are in good agreement with theAPSIS MS measurements (Fig. 4), except for the C2 block, for whichthe large measurement uncertainties of the intensities on the N2
peak shoulders [28] have to be considered. Note that this fairagreement also somewhat results from the large uncertainty onthe model predictions.
In the reference simulation, radicals account for about one thirdof the total mass of products at stationary state. Thus, the simu-lated mass spectra, ignoring radicals, can only be compared tothe APSIS MS on a qualitative or semi-quantitative basis (seeFig. 5). Except for the C2 block, the major bands in the experimen-tal spectrum are well covered by the 95% confidence intervals ofthe simulated MS (the red shaded area in Fig. 5). However, themean of the simulated spectrum is not in satisfactory agreementwith the experimental spectrum: it underestimates the productionof saturated C3 and C4 MS fragments and overestimates that ofunsaturated C4 fragments. In the database used to build the spec-tra, the major fragmentation patterns of hydrocarbons mightchange the number of heavy atoms, but have a strong tendencyto preserve the saturation state. For instance, the main fragmentof C3H8 is at m=z 29 (C2H5) vs. 30 (C2H6), that of C4H10 is at m=z43 (C3H7) vs. 44 (C3H8), and for the unsaturated species, that ofC4H4 is at m=z 52 vs. 58 (C4H10). Without considering specificdetails, one can conclude from this comparison that the experi-ment and simulation differ mostly by their production in saturatedspecies.
The main causes of this discrepancy could be:
� incompleteness of the reaction scheme: an exhaustive searchhas been performed for the construction of the reaction scheme.Up to now, most C3-producing reactions have been included in

Fig. 3. Mole fractions (normalized to N2) of neutral species (left panel) and ions (right panel) at the stationary state for the 500 runs of the 1-cell model with all uncertainparameters. The species are sorted downwards by increasing mass. Only species with an average mole fraction above 10�15 are represented and CH4 has been left out of thegraph for legibility: its Log10 Mole Fraction is �0.9545 � 0.0001. Cx blocks are materialized by alternating colors. Neutral species with even/odd electron counts are markedby a square/circle symbol. Error bars cover a 95% confidence intervals.
Z. Peng et al. / GeoResJ 1–2 (2014) 33–53 39
the model, while saturated C3 species are still not satisfactorilysimulated. Moreover, it is unlikely that missing reactions, ran-domly taken for each reaction type, could result in a systematicunderestimation of saturated species,
� oversimplification of the reactor geometry: we consideredthe effect of a dark zone (the region in the reactor not or weaklyirradiated) by running the model without irradiation but with agas inflow composition identical to that of the stationary state

Fig. 5. Simulated neutral mass spectra (solid lines) of the reference case (red)compared to in situ gas phase MS in an APSIS experiment at 7 sccm (blue points).Additional simulations with trimolecular rate constants multiplied by a factor of 3(cyan) and 10 (dark green) are also represented. The MS intensities are normalizedwith respect to that of N2. The 95% confidence interval of the simulated referencespectrum is shown by shaded area. (For interpretation of the references to colour inthis figure caption, the reader is referred to the web version of this article.)
0 2 4 6 8
−10
−8−7
−6−5
−4
Cx Block
Log1
0 M
ole
Frac
tion
Fig. 4. Violin plots of the mole fractions of the Cx blocks for the referencesimulation, excluding He, N2 and CH4. Blue points represent the correspondingexperimental values corrected for ionization cross-sections. (For interpretation ofthe references to colour in this figure caption, the reader is referred to the webversion of this article.)
40 Z. Peng et al. / GeoResJ 1–2 (2014) 33–53
gas outflow in the reference case. The gas inflow models the nonor weakly irradiated part of the reactor, where reactive speciesother than N2 and CH4 are supplied by transport/diffusion. Thestationary state of this test case is little shifted from the refer-ence case, demonstrating, at least, that the basic growth schemewould hardly change in the dark zone of the reactor,� chemistry taking place in the capillary between the reactor
and the mass spectrometer: radicals and ions (about one thirdof the total mass of products) pumped into the capillary cannotqualitatively change the gas composition before reaching themass spectrometer. This was shown by another test case, wherewe let the stationary state reactive gas of the reference casereact until equilibrium in a closed box, without irradiation. Inthis case, radicals and ions have infinitely long time to combinewith each other and be recombined with electrons, no matterwhether catalyzed by the capillary stainless steel surface ornot. In these conditions, saturated species concentrations areincreased by at most 40%, still far from the observed differencebetween the experimental and simulated spectra. However, the
increase of saturated species concentration resulting fromradical recombination in this test case, points out that higherradical recombination rates would lead to a better reproductionof saturated species,� wall effects: how could radical recombination rates be higher
than in our reference model? It is unlikely due to homogeneoustrimolecular reactions, since, although globally known withlarge uncertainty, their rate constants could hardly be systemat-ically underestimated. Therefore, we may only consider hetero-geneous catalysis, most probably on the reactor stainless steelwalls, as detailed below.
Radicals and ions can be efficiently adsorbed or chemisorbed onstainless steel walls and undergo further chemistry. For instance,it has been observed that NH3 can be generated in this mannerby successive hydrogenation of atomic nitrogen and N-containingradicals [54]. In their laboratory simulation experiments of Titan’sionospheric chemistry Thissen et al. [26] concluded that surfaceeffects were responsible for an excess production of NH3 andHCN. Radicals recombination on the wall of the antechamber ofthe INMS mass spectrometer has been retained to explain the dis-crepancy between measured concentrations of C6H6 along the tra-jectory of the spacecraft in Titan’s atmosphere [11]. Overall, walleffects in CH4/N2 plasmas are very complex and are the subjectof ongoing studies [55].
Gorodetsky et al. [56] measured a CH3 recombination coeffi-cient of 3� 10�4 on stainless steel at 300 K. According to this value,the reaction rate of CH3 recombination on stainless steel is one totwo orders of magnitude below that of the homogeneous rate.They determined also the temperature dependency of the rateconstant, usually more reliable than its absolute value. Theyshowed that recombination is accelerated about 10 times as tem-perature increases by 10 K. This high sensitivity may make theAPSIS recombination rate highly uncertain, since the temperatureduring the experiments is not regulated. In addition, the largeuncertainty usually associated with measurements of heteroge-neous reaction rates and the existence of multiple radical recombi-nations on the reactor’s wall should also be considered. The largeuncertainties prevent us from making a quantitative comparisonof the contributions of the homogeneous and the heterogeneousradical recombinations, but it cannot be ruled out that heteroge-neous recombinations have a comparable, or even larger contribu-tion than the homogeneous ones.
Without detailed reaction rate constants, it is difficult to modelheterogeneous recombination explicitly without introducingadjustable parameters in the model [54]. In order to account forheterogeneous recombination in the present model, we made sim-ulations where all the homogeneous trimolecular rate constantswere multiplied by a factor 3 or 10 (cyan and dark green solid linesin Fig. 5, respectively). In the case of the factor 3, the unsaturatedpart of the C3 and C4 bands decreases slightly and their saturatedparts increase significantly, by a factor about 3, leading to a betteragreement of the C3 and C4 blocks. When trimolecular rate con-stants are 10 times larger than in the reference case, one gets anoverestimation of the saturated part.
We observe that faster trimolecular recombination producesmore saturated species, at the expense of unsaturated species.Unsaturated species play a major role in the growth without‘‘heterogeneous recombination’’ included in the model, and theirpreponderance over saturated ones, not observed in the experi-ments, can be well compensated in the model by ‘‘heterogeneousrecombination’’ that consumes unsaturated species and producessaturated ones. This is a strong indication of the contribution ofheterogeneous reactions in the laboratory simulation setups ofatmospheric chemistry, such as the APSIS reactor.

Z. Peng et al. / GeoResJ 1–2 (2014) 33–53 41
3.1.2. Uncertainty analysisUncertainty analysis for simulations of N2/CH4 plasmas were
provided for Titan’s atmosphere by Hébrard et al. [38,32] and Penget al. [39] for neutral species predicted by a neutral model and byCarrasco et al. [34,42] and Plessis et al. [25] for ions predicted in afixed neutral bath ionospheric model. The impact on predictionsuncertainty of a fully coupled ion–neutral chemistry is assessedhere for the first time. A particular concern was resulting fromthe introduction in the model of the exhaustive database of disso-ciative recombination branching ratios (with large uncertainties)of Plessis et al. [23] and its strong coupling with the neutral chem-istry [25], and also from the large uncertainties in the branchingratios of the photolysis of CH4 at most wavelengths covered bythe DISCO spectrum [33,28].
In the following, we discuss the uncertainty factors of the molefractions in these various models. These are defined as Fi ¼ expðulog yi
Þ, where ulog yiis the standard deviation of the logarithm of
the mole fraction yi of species i, estimated on the Monte Carlo sam-ple. If the distribution of yi is lognormal, then one has about 95%probability for the mole fraction to be in the interval
~yi=F2i ; ~yi � F2
i
h i, where ~yi ¼ expðlog yiÞ is the geometric mean. As a
thumbrule, mole fractions with uncertainty factors of about 3 areknown up to an order of magnitude.
Empirical Cumulated Density Functions (ECDF) of the uncer-tainty factors on the stationary mole fractions of neutrals and ionsof the APSIS simulation are reported in Fig. 6, where we display alsothe ECDF for the uncertainty factors obtained in Hébrard et al. [32]for neutral species at 1200 km in Titan’s ionosphere, and by Carras-co et al. [34] at the same altitude for a ionic model with fixed neutralbath. The uncertainty factors for both ions and neutrals are globallyincreased when compared with their uncoupled versions. The effectis stronger for ions, a direct consequence of their production fromneutral species with uncertain densities, whereas these densitieswere fixed in Carrasco et al. [34]. These authors ranked this uncer-tainty source as a major one in the uncertainty budget of predictedions densities, which is confirmed by the present study. Globallyhowever, 60% of the ions are predicted with smaller uncertaintythan neutrals, an effect of the reaction rate constants of ionicprocesses being usually measured with better precision.
Fig. 6. Empirical Cumulated Density Functions of the uncertainty factors, in logscale, of the neutrals (blue) and ions (red) concentrations at the stationary state ofthe APSIS model. The uncertainty factors of the simulated neutral species in Titan’satmosphere at 1200 km from Hébrard et al. [32] (cyan) and ions from Carrasco et al.[34] (pink) are reported for comparison. The heavy dash vertical line marks the ‘‘upto one order of magnitude’’ 95% uncertainty range. (For interpretation of thereferences to colour in this figure caption, the reader is referred to the web versionof this article.)
The ECDF for 70 % of the lower uncertainty factors of neutralsmole fractions is indistinguishable between the present modeland the neutral model of Hébrard et al. [32], and substantially lar-ger uncertainty factors occur in the present model for the remain-ing 30%. At this level it is difficult to identify the cause of thisenhanced uncertainty factors: working at room temperature inAPSIS should avoid the large temperature extrapolation uncer-tainty in Titan’s ionospheric models [32], but on the other hand,working at higher pressures favors the trimolecular reactions,which rate constants have large uncertainty factors (Fk from 2 to10).
The uncertainty factors on the stationary mole fractions of neu-trals and ions are presented in Fig. 7 as a function of their molec-ular mass, and the species with the largest uncertainty factorshave been tagged. As in Hébrard et al. [38] and Peng et al. [39],we observe that uncertainty has the trend to increase with molec-ular mass, which may be roughly interpreted as the accumulationof uncertainty along growth pathways (see detailed discussion inPeng et al. [39]). For species like N2H;N2H2 and N2H4, very largeuncertainty factors are due to their production from NH2, itselfissued from the dissociative recombination of CH2NHþ2 , for whichthere are no data on the branching ratios. Similarly, for most othertagged species, we find unknown dissociative recombinationbranching ratios as a key factor. For ions, large uncertainties canbe also traced back to large uncertainty on some dissociativerecombination branching ratios.
3.1.3. Sensitivity analysis3.1.3.1. Main contributions to prediction uncertainty. To betterunderstand the large uncertainty factors in the predictions of thepresent model, we analyze their variance with regard to the maintypes of reactions. For this, we calculate the portion of the totalvariance explained by each type of process: photolysis, reactions(neutral and ionic bi- and trimolecular), and dissociative recombi-nation, by running simulations where a single type of process istreated as uncertain, while the others have fixed rate constants.
The results are summarized in Fig. 8, where we report, for eachtype of process, the frequency of it being the dominant contributorto the output variance of the stationary mole fraction of neutralsand ions. For reference, we plot also the occurrence frequency ofeach reaction type in the model (see Section 2.2). The scores forneutrals and ions are remarkably correlated to this occurrencefrequency, with minor deviations for both categories. The contribu-tion of bi- and trimolecular reactions to the mole fractions variancein the reference case is dominant, from nearly 80% for neutrals to60% for ions. Dissociative recombination contribute significantly,with a score of about 30% for both ions and neutrals, slightly lowerthan the occurrence frequency of this process. Photodissociationand photoionization appear as negligible for neutral species, inaccordance to the weak number of these processes in the model,but have an enhanced contribution to 15% of the cases for ions,for which photoionization is a necessary initiation pathway. It isto be noted that the highly uncertain representation of the photol-ysis branching ratios of methane and other photoabsorbers (seeSection 2.2.1) does not impact significantly on the uncertaintybudget of this simulation. Similarly, the contribution of dissocia-tive recombination does not seem to be enhanced by the coupledchemical scheme. For both photolysis and dissociative recombina-tion, the care taken in the representation of branching ratios assum-to-one variables is certainly repaid for in the uncertaintybudget.
3.1.3.2. Key reactions identification. Beyond the overall viewprovided by the previous variance analysis, we aim at the identifi-cation of key reactions, defined as the reactions that contributesignificantly to the model output uncertainty [57]. A key reaction

Table 2Key reactions identified for the reference simulation, their rate constant uncertaintyfactor Fk in the conditions of the reference APSIS simulation, the correspondingnumber N> of species used for selection, and their S score (see text). Bold charactersindicate the maximum in each column.
Reaction Fk Scores
N> S
Hþ C2H3�!C2H2 þ H2 3.9 55 6.9H1þ C2H4 �! C2H5 2.0 48 6.6Hþ CH3 �! CH4 2.9 39 6.9CH2NHþ2 þ e� �! 3CH2 þNH2 5.2 32 7.4
CH2NHþ2 þ e� �! 1CH2 þNH2 5.2 26 7.1
CH2NHþ2 þ e� �! HCNþ H2 þ H 5.2 19 <3.0
Nþ2 þ CH4 �! CHþ2 + H2+ N2 3.6 31 8.1
Nð2DÞ þN2 �! Nð4SÞ þ N2 2.1 30 5.0
N2 þ hm �! Nþ2 þ e� <1.1 19 4.1
N2 þ hm �! Nð4SÞ þ Nð2DÞ <1.1 17 4.4
CH4 þ hm �! CHþ + H2 þ H + e� 1.4 17 3.7
C2Hþ5 þHCN �! HCNHþ + C2H4 1.2 17 3.1CHCN + CHCN �! C4N2 þH2 10.0 17 6.2Nð4SÞ þ CHCN �! C2N2 þH 2.9 16 3.3
Fig. 7. Uncertainty factors of the neutrals (blue, upper) and ions (red, lower) concentrations at the stationary state of the 1-cell model with all uncertain parameters. Thenames of the species with the largest uncertainty factors are reported. (For interpretation of the references to colour in this figure caption, the reader is referred to the webversion of this article.)
0.0
0.2
0.4
0.6
0.8
Freq
uenc
y
Photodissociation/Photoionization
Reactions Dissoc. recomb.
NeutralsIonsOccurrence
Fig. 8. Frequency for each reaction type as the major contributor to the variance ofthe mole fractions of neutral species (blue) and ions (red). The occurrence frequencyof each reaction type in the database is reported for reference (gold). (Forinterpretation of the references to colour in this figure caption, the reader isreferred to the web version of this article.)
42 Z. Peng et al. / GeoResJ 1–2 (2014) 33–53
might appear for two different reasons: (i) reactions that have astrong effect on the mass flux in a reaction network; (ii) reactionswith a rate constant in need of further study to improve theprediction precision of model outputs; or both. A few recentstudies identified the key reactions of complex chemical networksby computing the rank correlation coefficients between rate con-stants and species concentrations from the Monte Carlo samples[32,39,57,58]. To select their key reactions, Hébrard et al. [32]and Peng et al. [39] retained reactions presenting correlation coef-ficients larger than 0.2 in absolute value with the mole fractions ofmore than 15 species. We adopted the same procedure, which pro-duced 14 key reactions, as listed in Table 2 with the correspondingnumber N> of above-threshold species, and reaction rate uncer-tainty factors Fk estimated from the input Monte Carlo sample.
In order to confirm this selection, we estimated the global influ-ence of a reaction through the sum of the squares of its correlationcoefficients with the stationary mole fractions of all species. Wedefine the score Sj of the jth reaction as
Sj ¼X
i2fspeciesgr2
ij; ð19Þ
where rij is the rank correlation coefficient between the ith speciesand the corresponding reaction rate. The scores are reported inTable 2. All the reactions with the higher S scores are also in thetop list selected by the other method, and only the scoring orderis slightly perturbed.

Fig. 9. Correlation matrix of Monte Carlo stationary state mole fractions. Species are sorted: 1/ by charge (neutrals in the bottomleft, ions in the topright; the black lines in thelower triangle mark the limit between neutral species and ions); and 2/ by increasing mass. The Cx blocks are overlined and labeled by the number of heavy atoms (darkgreenfor neutrals; purple for ions). Correlation coefficients from �1 to 1 are denoted by pixels whose color gradually changes from blue (�1) to red (1) via white (0), except on thediagonal, where the color code is red for hydrocarbons and blue for N-bearing species. The inset is the C6 block of neutral species. (For interpretation of the references to colorin this figure legend, the reader is referred to the web version of this article.)
Z. Peng et al. / GeoResJ 1–2 (2014) 33–53 43
The list of key reactions is heterogeneous in the sense that,as stated above, it contains reactions with high uncertaintyfactors (above 3) and reactions with small uncertainty factors(below 1.5).
The first ones (e.g. Hþ C2H3�!C2H2 þH2; Fk ¼ 3:9) contributeimportantly to the uncertainty budget of the simulation, and moreaccurate estimations of their rate constants would have a positiveimpact on prediction precision at a global level. In the same cate-gory, Nþ2 þ CH4�!CHþ2 þH2 þN2 (Fk ¼ 3:6) is a minor channel ofa reaction with a rather accurate global rate constant (Fk ¼ 1:15)which would benefit of a better evaluation of its branching ratio(b ¼ 0:08� 0:08; Carrasco et al. [42]). This global reaction is an
important step in the formation of primary ions from CH4. Anotherexample is the dissociative recombination of CH2NHþ2 (the thirdmost abundant ion in the reference simulation after HCNH+ andC3Hþ7 , see Fig. 3), for which both the rate constant and the branch-ing ratios are unknown. The strong impact of this process on somespecies has been noted in Section 3.1.2. This hampering lack of datawas also mentioned by Yelle et al. [17] for a Titan ionosphericmodel. The branching ratios of this reaction determine the portionof CH2NHþ2 converted to CH2NH, methanimine, a possible precur-sor of tholins [59].
In the second group of reactions, one has for instance the pho-tolysis of N2. This process is essential to the formation of ions and

Fig. 10. Heatmap of the outputs correlation matrix. Correlation coefficients from �1 to 1 are denoted by squares whose color gradually changes from blue (�1) to red (1) viawhite (0). The colored borders (orange, purple, green) delimit the clusters discussed in the text. The hierarchical tree is displayed at the top of the matrix, and the relevantclusters G1, G2 and G3 are underlined by color. (For interpretation of the references to colour in this figure caption, the reader is referred to the web version of this article.)
44 Z. Peng et al. / GeoResJ 1–2 (2014) 33–53
integration of N in the system, but it is rather hopeless to expect areduction of its already small uncertainty factor ðFk < 1:1Þ.
It is striking that two trimolecular reactions appear at the top ofthe list. In the model of Titan’s upper atmosphere [32], most keyprocesses were photolysis and bimolecular reactions, and only
one trimolecular reaction was found to be influential, at low alti-tude. Indeed, trimolecular reactions are influential in the APSISmodel because their rate is enhanced by the comparatively highpressure in the reactor. We note also that, despite the sizableuncertainty on its rate constant (Fk ’ 7), Hþ CH! CþH2, the

Z. Peng et al. / GeoResJ 1–2 (2014) 33–53 45
most influential reaction in the model of Titan’s upper atmospherereported by Hébrard et al. [32], is not identified as a key reactionfor the present simulation, although we will see that it reappearsin the list for simulations in Titan-like conditions (Table 4).
Two reactions involving CHCN appear in the list. This speciesplays a key role in the formation of C2N2 and C4N2. An issue withits chemistry has been raised by Imanaka and Smith [27], and wereport the discussion to Section 3.2.
3.1.4. Species correlation analysisAlthough we know in every detail the reaction scheme of the
model, its complexity and the high uncertainty on many kineticparameters make it delicate to predict the main pathways withouta numerical search. We propose here to exploit the sample of spe-cies mole fractions generated for uncertainty/sensitivity analysis togather information on the relationships between species throughcorrelation analysis.
The correlation coefficient between the stationary molefractions of two species calculated from the MCUP outputs samplecontains information on the way these species respond to a globalperturbation of the system (i.e. random variation of all therate constants). Considering a scheme with a single reaction, e.g.R1 þ R2�!P1 þ P2, and taking the concentrations at a given time,one expects a strong (unit) positive correlation between reactantsrR1R2 ¼ 1 and between products rP1P2 ¼ 1, and a strong anticorrela-tion between reactants and products rRIPj
¼ �1. For more complexsystems, the correlation strength depends on the structure of thereaction network between two species, and on the relative effectsof various reaction rate constants on those species.
3.1.4.1. Inter-species correlation matrix. In a first step, we considerthe inter-species correlation matrix, and more particularly exam-ine the presence of structures and their link to the underlyingchemical scheme. The rank correlation matrix of mole fractionsat stationary state for the APSIS simulation is shown in Fig. 9,where the species are sorted (i) by charge; and (ii) by mass. TheCx blocks are overlined and labeled by the corresponding numberof heavy atoms.
At the global scale, one observes that the neutrals and ionspresent rather different correlation patterns, with a massiveinter-blocks correlation structure for the ions, whereas the correla-tion pattern seems more specific between neutral species. There isalso a notable correlation pattern between neutrals and ions. Theinter-ions structure is reminiscent of the inter-mass correlationmatrix built recently by Westlake et al. [18] from the intensitiesof INMS ion data between 1200 and 2000 km, over a large sampleof Cassini flybys. Westlake et al. [18] observed a block pattern inthe matrix and linked it to molecular growth through the additionof C1 and C2 units.
If we enter into more details, we observe several features in theneutral and ion Cx blocks along the diagonal: some species withina Cx block form a red square, hinting to a similarity of their
Table 3Species lists, sorted by increasing molecular mass, from the three clusters identified in Fig.
Clustername
Species in cluster
G1 CHþ2 ;C2H;C2H2, CNþ;HNCþ , C2Hþ3 ;C2Hþ4 , C3;Cþ3 ;C3Hþ , C3Hþ2 ;CHCN; l�
HC2NC;C2NCH, CHCCNþ;HC3N;C4Hþ3 , C2N2;C2Nþ2 , CHCCNHþ;HC2N2;CC4H2Nþ ;C5Hþ5 ;C6Hþ2 , C6H2;HC5Nþ , C6Hþ3 ;HC5N;C5H2Nþ , C4Nþ2 ;C6Hþ4 ,C5HNþ2 ;C7Hþ7 ;C8Hþ2 , C8Hþ3 ;C6HNþ2 , C7H3Nþ;C6H2Nþ2 , C8Hþ6 ;C8Hþ7 ;C7H5
G2 CHþ3 ;NH2;NH3;NHþ3 , NHþ4 ;C2H4;CH2NH, N2H;CH3Nþ;CH2NHþ2 ;N2H2;
CH3CNHþ;C2H3NH2;CH2CHCNHþ;C3H5Nþ;C4H5Nþ;C5Hþ7 ;C5Hþ9 , C6H7
G3 3CH2;NH;C2H3, H2CN;C2H5, HCNH;C3H3;CH3C2H, CH2CCH2;C3H5, C3
C6H8;C6H9;C6H10, C6H11;C6H12, C6H13;C6H14
reactivity. The most striking example arises in the C6 neutral block(see the inset of Fig. 9), where two squares of red pixels are visible:a square in the lower left of the block, between C6H and C6H7,relatively unsaturated species, and another in the upper right,between C6H8 and C6H14, relatively saturated hydrocarbons. Outof these two squares, there are off-diagonal light blue pixels,which indicate a negative correlation of species between the twosquares. We interpret this pattern as revealing separate andcompeting pathways for unsaturated and saturated species in thisblock. This pattern is present in other blocks, although with lessclarity.
Inter-blocks correlation may provide information on moleculargrowth. Highly positive correlation between two species withdifferent heavy atom numbers may not only suggest a similarformation pathway, but also a direct link by a reaction realizingmolecular growth, i.e. the addition of small chemical units. Positiveinter-block correlations are obvious between most saturated heavyneutrals, or between most unsaturated heavy neutrals. They aremore common between heavy ions, either between unsaturatedones or between saturated ones.
In general, unsaturated and saturated ions are positively corre-lated to their respective neutral counterparts. Saturated specieshave negative correlations with unsaturated ones, regardless ofwhether they are neutrals or ions. Given all that, saturated andunsaturated species are likely to be formed through distinctgrowth/formation pathways.
3.1.4.2. Cluster analysis. Except for simple chemical schemes, infor-mation based on inter-species correlation is too condensed toenable the reconstruction of a detailed mechanism, but we canuse it as a basis for a cluster analysis, grouping together speciesresponding similarly to the perturbation. Species within a clusterare then assumed, through their similarity, to be part of a commonpathway. For instance, in the case of molecular growth which is ourmain target here, we expect that all species depending on a givengrowth unit will share a cluster, possibly with this unit.
The clustering analysis was done using the heatmap function inR [60], which builds a hierarchical clustering tree. The heatmapfunction plots a matrix, with rows and columns reordered to matchthe dendrogram plotted in the margins. The dendrogram isobtained by a hierarchical clustering algorithm hclust. The clustersare built iteratively, starting by one matrix row (column) percluster. We used the default agglomeration method in the hclustfunction, the complete linkage method, which finds and groupssimilar clusters [61]. The correlation matrix (Fig. 9) reordered bythe hierarchical clustering method is displayed in Fig. 10.
We focus on the largest clusters of positively correlated species.The three main ones (named G1, G2 and G3), totaling 133 speciesover the whole 244, are emphasized in the heatmap. The list ofspecies in these clusters is provided in Table 3.
A large cluster of 74 positively correlated species (orange bor-der) is seen at the bottom right. In this group, named G1, 77% of
10. The species with the highest score S (see text) in each group are reported in bold.
C3Hþ3 , c� C3Hþ3 ;CN2, C2H2Nþ;C4, C4Hþ;C4H;C3Nþ , C4H2;C4Hþ2 ;C3NH,
2H3CNþ;C2HNþ2 ;C4Hþ5 , C4Hþ9 ;C5Hþ;C4Nþ , C5Hþ2 ;C4HNþ , C5Hþ3 ;C5H4,C4HNþ2 ;C5H3Nþ , C6Hþ5 ;C5H4Nþ , C6Hþ7 ;C3HNþ3 , C5H5Nþ;C6H2Nþ ,Nþ;C9Hþ8 ;C10Hþ9 , C10Hþ11;C11Hþ9CH2NH2;CH3NH;N2H3;CH3NH2, N2H4;CH3NHþ3 ;C2HNþ;CH3CN;C3Hþ5 ,Nþ;C6H8Nþ
H6;C3H7;C3H8, C4Hþ7 ;C4H8;C4H9, C4H10 ;C5H6;C5H8;C5H9;C5H10 ;C5H11 ;C5H12,

46 Z. Peng et al. / GeoResJ 1–2 (2014) 33–53
the members are ions and 47% are N-bearing species. At the top leftof the heatmap, another cluster (G2 – green square) contains 29species, and is composed for 55% of ions and 83% of N-bearingspecies. The third remarkable cluster, G3, is located near themiddle of the heatmap (purple border) and contains 30 species.It is composed for 87% of neutral hydrocarbons.
The mass distribution and van Krevelen diagram [62,63] for thethree groups are given in Fig. 11. The three clusters contain heavyspecies, but the G1 cluster contains the largest proportion of the hea-vier ones. At the compositional level, there is a neat discrimination ofthe three groups in the (N/C;H/C) space: the G1 cluster containsmostly H-poor (H/C6 1) species, the G3 cluster is essentiallycomposed of rather saturated hydrocarbons (H/C>1), while the G2cluster contains more saturated species than the first one.
As we did for key reactions, we define within each cluster ascore S for each species according to its cumulative squared corre-lation coefficient with the other species in the cluster (cf. Eq. (19)).
Cluster G1. The species with the highest score within G1 is byfar C2H2 (S ¼ 15:2).
All of the species in the cluster are rather unsaturated and mostof them are ions. N-bearing species in this cluster are secondary
Fig. 11. Compositional analysis of the main clusters identified in Fig. 10: (top) molecularzone for better legibility).
products of the hydrocarbons discussed next. Considering thesefeatures, as well as the mechanism of molecular growth by addi-tion of small units discussed previously, we identified a growthpathway through the recursive addition of C2H2 by ion–moleculereactions. A typical pathway is
C2Hþ2 �!þC2H2
�HC4Hþ3 �!
þC2H2 C6Hþ5 �!þC2H2
�HC8Hþ6 : ð20Þ
In the chemical scheme, C2H2 can be added to most ions with a siz-able rate constant, while increasing the degree of unsaturation inthe products. In their synchrotron irradiation study of differentN2/CH4/C2Hx gas mixtures, Thissen et al. [26] have observed thatC2H2 is the most efficient C2 compound to promote ions growth.
On the other hand, the importance of the ion chemistry does notmean that the contribution of the neutral chemistry is negligible. Aneutral growth scheme was highlighted by Peng et al. [39]:
C2H �!þC2H2
�HC4H2�!
þR
�RHC4H �!þC2H2
�HC6H2; ð21Þ
where R represents various radicals. This scheme may also be typ-ical for the production of unsaturated species, albeit a hydrogen
mass distribution; (bottom) van Krevelen diagram (this is a closeup on the densest

Z. Peng et al. / GeoResJ 1–2 (2014) 33–53 47
abstraction step is necessary to reactivate the intermediate. Other-wise 2 hydrocarbons of even hydrogen atom number, usually stablespecies, are not able to react with each other. Growth pathways byrepeated addition of C2H to form polyacetylenes as proposed in Ar/C2H2 plasmas [64], or studied in molecular jets [65], are found to benegligible in APSIS conditions, where the very low concentration ofC2H (Fig. 3) rapidly dampens this process.
Cluster G2. The species with the highest score within G2 isCH3NH2 (S ¼ 10:9), with close scores for NH2 (S ¼ 10:6) and NH3
(S ¼ 10:2). Moreover, 83% of the species in this block areN-bearing ones. The cluster contains a major nitrogen fixationpathway [66]
CH4 �!þNð2DÞ
�HCH2NH �!þRHþ
�RCH2NHþ2 �!
þe�
�CH2
NH2 �!þCH3 CH3NH2: ð22Þ
By analogy with the pathway involving C2H2, we observe also aminor growth pathway involving the repeated addition of C2H4
through ion–molecule reactions, e.g.
CHþ3 �!þCH4
�H2C2Hþ5 �!
þC2H4
�CH4
C3Hþ5 �!þC2H4 C5Hþ9 ; ð23Þ
that forms species more saturated than those in the G1 block.However, the importance of this pathway in hydrocarbon growthis quite limited. In the experiments by Thissen et al. [26], no signif-icant effect was observed when adding C2H4 to a N2/CH4/C2H2 gasmixture, except for the increased abundance of C3Hþ5 . In fact, therate constants of neutral growth reactions involving C2H4 aresignificantly smaller than those involving C2H2: for example, therate constant at 300 K for the addition of C2H2 to C4H is about 30times larger than for the addition of C2H4.
Cluster G3. This cluster contains relatively saturated species,including the most saturated hydrocarbons. The species with thehighest score within G3 is C5H12 (S ¼ 6:8), closely followed byC3H7 (S ¼ 6:3). The former is a terminal product, whereas C3H7
appears as a hub within this cluster and enables the formation ofheavy saturated species by addition to small radical units(CH3;C2H3;C2H5 . . .). Saturated hydrocarbons are usually formedby trimolecular reactions, preserving or decreasing the degree ofunsaturation of the products. Note that trimolecular reactionsinvolve quite often two radicals, whose concentrations are muchlower than those of stable C2 species, such as C2H2. Thus, thiscluster’s pathways may not be as efficient in promoting moleculargrowth as those operating in the G1 group.
3.1.4.3. The pathways of molecular growth. To conclude this correla-tion analysis, the clusters G3 and G1 have been identified asstrongly involved in the growth of saturated and unsaturated spe-cies, respectively. As previously discussed, they are in competitionand a possible link between both groups is the ratio between C2H2
and C2H3 (in the G3 group), which are interconnected by reactionswith H atoms.
In spite of the partition of the correlation matrix, interactionsbetween the clusters discussed above, still exists, forming speciesof a degree of unsaturation between the typical cases and complex-ifying the growth scheme. However, considering the size of theclusters in the heatmap, the prominence of the G1 cluster isflagrant, and, in view of the importance of ion chemistry in thepresent simulation, the addition of C2H2 through ion–moleculereactions might be considered at the center of the growth schemein APSIS conditions.
3.1.5. Impact study of physical conditionsHaving highlighted the growth mechanism in the APSIS model,
we explore the chemistry of the system in different physicalconditions, in order to interpret other observations or experiments.To identify the effect of various physical factors, we design variants
of the reference model with a single modified factor: irradiationspectrum, pressure, and temperature. The parameters for allsimulations are gathered in Table 1.
3.1.5.1. Irradiation spectrum. We consider here simulations withmonochromatic beams at 60 nm and 82 nm, as used by Imanakaand Smith [27] (the adopted 1 nm wavelength resolution doesnot enable to simulate their 82.5 nm). The simulations are per-formed with the same integrated photon flux as the referenceone. Another simulation is performed with a proxy of the solarspectrum [67], again at the same integrated intensity as in thereference case. Monte Carlo samples of 150 runs were performedfor each case.
For comparison with the reference (DISCO) case, we calculatedmethane consumption ratio qCH4
and the ratios of the mole frac-tions of the modified simulation over the reference simulationand reported them in Fig. 12 for neutral species. The uncertaintyon the ratios is obtained by combination of variance [68].
In the 60 nm case, qCH4¼ 5%, about two orders of magnitude
higher than the reference value (0.07 %, cf. Table 1). Moreover,the relative production of individual species increases with theirmolecular mass (Fig. 12 (top)). This increase is explained by theenhancement of ion chemistry: N2 photolysis at 60 nm essentiallyproduces Nþ2 , which almost quantitatively ionizes methanethrough reactions
Nþ2 þ CH4 �! CHþ2 þH2 þ N2; ð24ÞNþ2 þ CH4 �! CHþ3 þHþ N2; ð25Þ
and initiates the growth of hydrocarbon ions. This process has beenidentified as a key reaction for the APSIS simulation and its effect inpromoting the growth through ion chemistry has also been high-lighted in the literature [26,69].
Irradiation at 82 nm is less efficient than at 60 nm (qCH4¼ 3:3%).
Although at this wavelength N2 is not ionized but produces N atoms,the direct production of CH4 ionic photoproducts still benefits ofmore photons than in the wide DISCO spectrum. Furthermore, thiswavelength is promoting the formation of N-bearing species(outlined by red squares in Fig. 12(middle)), in agreement with theexperimental results of Imanaka and Smith [27].
In the conditions of solar-like irradiation (Fig. 12 (bottom)), thefraction of ionizing photons is considerably reduced, and the meth-ane consumption drops to qCH4
¼ 0:008% (Table 1). Besides, oneobserves a decrease of the relative mole fractions with mass. Asthe ionizing part of the spectrum is reduced, ion-promoted molec-ular growth is not efficient, considering the limited residence timein the reactor in this simulation. This also translates into a system-atic tendency in each Cx block to have a reduction of the unsatu-rated species (red lines in Fig. 12 (bottom)).
Uncertainty analysis. The uncertainties on the stationarymole fractions for the 60 nm and solar irradiations are foundto be little sensitive to the irradiation type. In Section 3.1.2,the contribution of the photolysis to the concentration uncer-tainties was shown to be minor. As long as the uncertaintyintroduced by the photolysis is not increased drastically, theirtotal contribution to the uncertainty cannot be significant. Inthese two cases, the principal contribution of the photolysisstems from photoionization at 60 nm and photodissociation atLy-a, respectively. The branching ratios at these two wave-lengths are accurately measured (relative uncertainties below20%). Therefore, the major uncertainty source remains neutralthermal reactions, and the concentration uncertainties are closeto those in the reference case.
By contrast, the mole fractions uncertainty increases notably inthe 82 nm case. At this wavelength, one is close to the lowerextremity of the wavelength range covered by the representation

Fig. 12. Ratios of stationary concentrations of neutral species for differentirradiation spectra to those in the reference model: (top) 60 nm; (middle) 82 nm;and (bottom) solar spectrum. Mean values and uncertainties (95% confidenceinterval) are respectively depicted by squares and error bars. In the middle graph,N-bearing species are enhanced by red squares. In the bottom graph, thediscrimination between unsaturated and saturated species in each block ishighlighted by red bars. (For interpretation of the references to colour in thisfigure, the reader is referred to the web version of this article.)
Fig. 13. Ratios of stationary concentrations in the case of low pressure (top) andlow temperature (bottom) to those in the reference model. Mean values anduncertainties (95% confidence interval) are respectively denoted by squaresand error bars. The discrimination between unsaturated and saturated species ineach block is highlighted by red bars. (For interpretation of the references to color inthis figure legend, the reader is referred to the web version of this article.)
48 Z. Peng et al. / GeoResJ 1–2 (2014) 33–53
of the branching ratios of the neutral channels of CH4 photolysis(see Section 2.2.1, Fig. 1(b)). Far from the wavelengths wheremeasurements exist, all neutral channel branching ratios arestrongly uncertain (relative uncertainties �50–100%). Since CH4
photolysis is a key process, this large uncertainty contributes sig-nificantly to the uncertainty budget of the species concentrations.Despite this substantial uncertainty increase, the previously iden-tified promotion of the formation of N-bearing species by theexclusive production of N atoms by N2 photolysis is significantfor many species, such as Nð4SÞ;HCN;CH2NH, etc.
3.1.5.1.1. Pressure. In this simulation, the pressure P in the reactoris lowered from the reference case by a factor 106, which
corresponds to the pressure around 850 km in Titan’s upperatmosphere (� 5� 10�4 Pa). To ensure that the averaged photoab-sorption rates of N2 and CH4 are similar to the reference case, thereactor cell is elongated by the same factor to maintain the amountof gas (L ¼ 5� 105 m).
Methane consumption is unaffected (Table 1), but the speciesdistribution is strongly modified (Fig. 13 (top)). Some species(C6H;Cþ and CNþ, for instance) are � 108 times more abundantthan in the reference case, while others are reduced by similaramounts. We observe also a shift of the product distributiontoward lower masses, signifying a limited growth.
A systematic discrimination between saturated and unsatu-rated species is notable in each Cx block. The mole fraction ratioof a species increases with its degree of unsaturation within a block(red lines in Fig. 13 (top)). In the C5 and C6 blocks, the ratiobetween the extremes can reach 10 orders of magnitude.
Assuming an unchanged composition of the reactive gas, lower-ing the pressure by a factor of 106 induces a lowering of the rate ofall bimolecular reactions by a 1012 factor, while trimolecular reac-tions are slowed down by a factor of 1018. The latter class containsthe radical recombinations forming heavy saturated species.Trimolecular reactions are important at several mbar (seeSection 3.1.3.2) and contribute significantly to the production ofthe most saturated species. However, this contribution vanishesrapidly as the pressure decreases, resulting in very low molefractions of the most saturated species, i.e. C5H11;C6H14, etc., andless lowered mole fractions of less saturated species, such as

Z. Peng et al. / GeoResJ 1–2 (2014) 33–53 49
C5H7 and C6H10. The most unsaturated species, i.e. C5H3;C6H2 . . .
are not significantly affected.
3.1.5.2. Temperature. In this simulation, the temperature is lowereddown to 150 K, close to that in Titan’s ionosphere. The relativemole fractions are shown in Fig. 13 (bottom).
Compared to the reference simulation at 300 K, methane con-sumption is halved (Table 1), and few stationary concentrationsare significantly altered, except those of heavy saturated neutralspecies. Lowering the temperature is not as effective to slow downthe growth as lowering the pressure, because only neutral reactionrate constants decrease with temperature: there are only marginaltemperature effects on photolysis cross-sections [70,71,43], or onion–molecule reactions.
However, we observe a discrimination between the species ofvarious degree of unsaturation in heavy species blocks (seeFig. 13 (bottom)). Among the main growth families, only the onedriven by trimolecular reaction (G3) is notably slowed down bythe decrease in temperature, provoking a depletion of heavy satu-rated species. Moreover, dissociative recombinations are slightlyaccelerated by the decreased temperature of thermalized electrons(between 35 and 70%), which contributes also to increase the pro-duction of unsaturated species.
3.2. Simulation of Imanaka & Smith’s reactor
The model is now applied to Imanaka & Smith’s reactor [27]with 60 nm irradiation, in the conditions of their experiment(A¼1:2�10�2 m2, L ¼ 0:7 m, T ¼ 300 K, P ¼ 13 Pa, I0¼1016 ph s�1,N2=CH4 ¼ 95=5).
Methane consumption (qCH4¼ 70%) is about three orders of
magnitude above the reference case (Table 1), and the largest inour set of simulations. This is mostly due to a higher photon fluxcombined with a lower CH4 partial pressure. The relative charge isabout 4� 10�7. This charge is two orders of magnitude larger thanfor APSIS, because all photons at 60 nm contribute to ionization.
The experimental in situ MS and a simulated MS are comparedin Fig. 14. The experimental spectrum is globally out of the 95%confidence interval of the simulated MS: the model systematicallyoverestimates the production of unsaturated species and underes-timates that of saturated species, by factors as large as 103.
Fig. 14. Mass spectra for Imanaka and Smith [27] experiment at 60 nm: (solid lines)simulated neutral mass spectrum (red); same with trimolecular rate constantsmultiplied by a factor 30 (dark green) ; (blue dots) experimental in situ gas phaseMS. The MS intensities are normalized with respect to that of N2. The 95%confidence intervals of simulated spectra for the first case is marked by a shadedarea. (For interpretation of the references to colour in this figure caption, the readeris referred to the web version of this article.)
A series of factors might be responsible for this discrepancy:
� The mass spectrometer in Imanaka & Smith’s experimentswas used at too high pressure to retain the linearity of itsMS signals, as discussed for the APSIS experiments in Penget al. [28]. However, the non-linearity of MS signals appearsin a relatively uniform way in a band, therefore this argu-ment cannot explain the systematic differential effectsobserved in all bands.
� The stable species considered in the simulated spectrumonly accounts for a minor part (� 10%) of total mass ofproducts in the case of Imanaka & Smith’s reactor. The rad-icals, accounting for a large part of the total mass ignored inthe simulated spectrum, are certainly an important sourceof disagreement. However, the factor 1000 between thesaturated parts of measured and simulated MS bands is stillnot explained. Assuming that the chemical model is basi-cally correct, the saturated part could have a concentration(not an intensity in the simulated MS) comparable to theunsaturated part in the same block, only if large radicalsignored in the simulated MS are (nearly) saturated, whichcannot be the case. Even in the homogeneous model ofthe APSIS experiments, at a higher pressure disfavoringthe growth of unsaturated species, these are still dominantin the blocks of heavy species. Therefore, the assumption ofa correct chemistry is not true, i.e. the present homoge-neous model is not adequate to simulate the chemistryoccurring during Imanaka & Smith’s experiments.
Following the same logic as for the APSIS reactor, we address thelimitations of homogeneous chemistry, by enhancing the trimolec-ular rate constants. In view of lower pressure and larger internalsurface-to-volume ratio of Imanaka & Smith’s reactor than theAPSIS reactor, both resulting in a larger relative contribution ofheterogeneous chemistry, we tested three cases with 10, 30 and100 times faster trimolecular rate constants. As for the referencecase, the unsaturated part of MS bands is slightly lowered andthe saturated part is significantly increased by this modification.As trimolecular rate constants are amplified, the unsaturated partof the C3–C5 bands of the simulated MS gradually approachesthe experimental results and their saturated part reaches and thenovertakes the measured values.
The simulated spectrum corresponding to a factor 30 is shownin Fig. 14. Though still not satisfactory, for instance in the saturated
Fig. 15. Simulated neutral mass spectrum in Titan-like conditions (solid lines, red)compared to INMS neutral MS [9] (blue points). The MS intensities are normalizedwith respect to that of N2. The 95% confidence intervals of simulated spectra areshown by shaded area. (For interpretation of the references to colour in this figurecaption, the reader is referred to the web version of this article.)

50 Z. Peng et al. / GeoResJ 1–2 (2014) 33–53
part of the C4–C6 band which is still overestimated, the agreementbetween the simulated spectrum and the experimental one isnotably improved, especially for the saturated part. This may illus-trate the very important effect of heterogeneous chemistry in thisreactor, probably even stronger than in APSIS, because of the morefavorable (tubular) geometry and lower pressure.
As discussed by Imanaka and Smith [27], the overestimation inTitan’s atmospheric models of the density of C4N2 (m=z 62 and76) is due to a lack of loss processes for CHCN. This is verifiedhere also for experimental laboratory conditions. In the presentcase, the overestimation is by more than two orders of magnitude(Fig. 14). This discrepancy is possibly higher than the ones notedfor Titan modeling [27], see also Fig. 15. This would suggest thatwall effects might be an efficient sink for CHCN in Imanaka &Smith setup. In any case, there is an urgent need of data on thereactivity of CHCN, either in homogeneous or heterogeneousconditions.
3.3. Simulation of a reactor in Titan’s ionospheric conditions
Combining the solar spectrum irradiation, low T and low Pcases studied above, one obtains a set of conditions reminiscentof Titan’s ionosphere. Without aiming at a realistic simulationof this environment, a few adaptations of the parameters arenecessary to get more representative conditions, such as adaptingthe photon flux and removing the carrier gas. The main differenceof physical conditions between Titan atmosphere and the present1-cell model is the effective gas residence time correspondingto complex transport processes at Titan [72–74], which wasadjusted: an effective residence time of sr ¼ 2:8� 106 s wasfound to give a globally satisfying products distribution(Fig. 15). It is 104 times that in the reference case and about 10times larger than the transport time constant at 850 km in Titan’satmosphere [72].
Methane consumption is 2.2%, about 30 times that of APSIS sim-ulation, a consequence of the much increased residence time, andthe ionization ratio is about 10�8. This value is in good agreementwith an estimation of the ionization ratio in Titan’s ionosphere –the electron number density (about 102 cm�3) over N2 numberdensity (1010–1011 cm�3) – at 950 km [75], which corresponds tothe altitude for the INMS spectrum used for comparison below.
Table 4Consensus list of key reactions identified for the ‘‘Titan’s ionosphere’’ simulation, theirrate constant uncertainty factor Fk in the conditions of the simulation, thecorresponding number N> of species used for selection, and their S score (see text).Bold characters indicate the maximum in each column.
Reaction Fk Scores
N> S
1CH2 þN2 �! 3CH2 þN2 2.0 41 7.01CH2 þ CH4 �! 2CH3 1.5 36 6.3C2H4 þ hm �! C2H3 þ H 1.3 35 3.6C2H4 þ hm �! C2Hþ4 + e� 1.2 26 3.5C2H4 þ hm �! C2H2 þ H2 1.4 25 3.3Nð2DÞ þ C2H4 �! CH3CN + H 1.5 34 6.2Hþ CH �! CþH2
a 7.4 27 5.7N2 þ hm �! Nð4SÞ þ Nð2DÞb,a < 1.1 23 4.6
N2 þ hm �! Nþ2 þ e�b < 1.1 20 4.5C2H2 þ hm �! C2H + H 1.5 21 3.6C2Hþ C2H2 �! C4H2 + H 2.1 18 4.3Nð2DÞ þ C2H2 �! CHCN + H 1.3 18 3.3
CH4 þ hm �! CHþ4 þ e� 1.2 17 4.2
CH4 þ hm �! CHþ3 þ Hþ e� 1.3 16 3.0
CH4 þ hm �! CHþ þ H2 þ Hþ e�b 1.4 17 3.8
a key reactions in common with Hébrard et al. [32].b key reactions shared with the APSIS list (Table 2).
In Fig. 15, the simulated MS is compared to the INMS neutralspectrum of T19 flyby between 950 and 1000 km, published inWaite et al. [9]. The agreement between the observations and thesimulated spectrum for Titan is remarkably better than for eitherthe APSIS (Fig. 5) or Imanaka & Smith’s (Fig. 14) experiments. Inparticular, one notes a good reproduction of the preponderanceof unsaturated species within each block. This confirms the effectof low pressure and temperature underlined above (Sections3.1.5.1.1 and 3.1.5.2) to favor the growth of unsaturated species.
The preponderance of unsaturated species at Titan indirectlysupports our hypothesis that the reactor’s metallic wall plays animportant role in the production of saturated species in the labora-tory simulation experiments, simply because in Titan’s atmo-sphere, there is no such an efficient ‘‘wall’’ that promotesheterogeneous chemistry. Note however that wall effects on theINMS antechamber have been discussed by Vuitton et al. [11],and that heterogeneous reactions promoted by the aerosols arebeginning to be studied [76].
The reproduction of the fact that C6 block’s concentration is lar-ger than C5 block’s also validates the present reaction scheme ingeneral terms. Though underestimated by the model, C6H6 (mainlyat m/z 78) stands out as a major heavy product. Being highly unsat-urated, it is efficiently formed in Titan’s atmosphere thanks to thephysical conditions for its growth, i.e. low pressure and low tem-perature. On the other hand, overestimation of the intensities atm/z 62 and m/z 76, associated with C4N2, is due to a lack of losspathways for CHCN, as discussed in Section 3.2.
3.3.1. Key reactionsFor comparison with the key reactions identified in a neutral
model of Titan’s chemistry by Hébrard et al. [32], we used thesame procedure as in Section 3.1.3 on the present results.The list of key reactions is reported in Table 4. The intersectionwith Hébrard et al. [32] is reduced to two reactionsN2 þ hm�!Nð4SÞ þNð2DÞ and Hþ CH�!CþH2. The first one hasalready been evoked in Section 3.1.3. The second reaction has avery large uncertainty factor and has been shown to be able toinduce different chemical regimes in Dobrijevic et al. [77]. A bet-ter estimation of this rate constant remains thus a priority forTitan’s chemistry modeling.
4. Conclusion
APSIS experiments have been studied by a 1-cell model with afully coupled chemical scheme, i.e. involving all photolysis, bimo-lecular, trimolecular, ion–molecule reactions and dissociativerecombinations with available kinetic data. The methane con-sumption is found acceptable and the production in Cx blocks isin good agreement with the experimental MS measurements.
Ion chemistry and the full dissociative recombination schemehave been shown to be important in the model. Without them,the production of heavy species and heavy unsaturated species,respectively, are drastically lowered. By sensitivity analysis, pho-tolysis and several reactions sensitive to pressure, mostly trimolec-ular reactions, appear as global key reactions. Influential photolysisreactions are consistent with the previous studies [32,39], andinfluential trimolecular reactions result from the relatively highpressure in the APSIS reactor.
Block patterns are observed in a species correlation matrix,indicating the importance of the addition of small units for molec-ular growth. Cluster analysis of the species correlation matrixreveals three major clusters of species: G1, where the growth ofunsaturated species has been shown to be promoted by C2H2
through ion–molecule reactions; G2, in which the nitrogen

Z. Peng et al. / GeoResJ 1–2 (2014) 33–53 51
incorporation in hydrocarbons plays a central role; and G3, wherethe formation of heavy saturated species is ensured by trimolecu-lar termination of radicals. The global efficiency of the G1 familyamong the three is clearly identified, i.e. the growth pathways ofunsaturated species via ion chemistry are the most efficient to formheavy species.
This completes the discussion of Plessis et al. [25] about thespecies responsible for the promotion of the chemistry with a fulldissociative recombination scheme. Plessis et al. [25] pointed outtwo antagonistic effects of dissociative recombination: a globalchemical lysis of heavy ions and a promotion of the moleculargrowth due to the production of numerous small reactive species.In fact, the non H-loss dissociative recombination channels,through which many of small neutrals including C1 and C2 are pro-duced, supply the main unsaturated reactants of the G1 cluster, butnot saturated ones. In the APSIS model, these non H-loss channelsincrease the production rate of C2H2 by a factor of �10, leading to amore efficient growth of unsaturated species. Therefore dissocia-tive recombination produces small unsaturated species, especiallyC2H2, enhancing the most efficient growth pathways. This illus-trates the promoting effects of dissociative recombination dis-cussed by Plessis et al. [25], and makes them able to overtake thechemical lysis effect.
Titan’s ionosphere meets simultaneously the conditions favor-ing the growth of unsaturated species, i.e. low pressure and lowtemperature, leading to densities of unsaturated species, detectedin an INMS neutral spectrum, in agreement with our modelingresults. In contrast, the simulated MS for the APSIS and Imanaka& Smith’s experiments are not in good agreement withthe experimental data in the saturated part of each Cx block. Themodel systematically underestimates the intensities of thesaturated parts, revealing the insufficiency of homogeneous chem-istry, which favors the growth of unsaturated species. If the recom-binations catalyzed by the reactor’s walls are accounted for, thesimulated MS are significantly improved, which strongly suggeststhe existence of noticeable wall effects in the laboratory simulationsetups.
Based on this analysis, we have well identified competinghomogeneous and heterogeneous chemistries in the reactors. Theformer essentially involves the growth of unsaturated speciesand is representative of the chemistry in Titan’s upper atmosphere,and the latter promotes the production of saturated species andcan be regarded as a bias of laboratory reactors. It was also shownthat the unsaturated parts in the simulated MS are much less sen-sitive than the saturated parts to our ad hoc implementation of het-erogeneous chemistry. Therefore one may consider preferentiallythe experimental results on unsaturated species for a qualitativelaboratory simulation of Titan’s photochemistry.
The existence of wall effects also reveals the needs for furtherstudies: simulation experiments at relatively low temperature(e.g. at �0 �C, leading to wall recombinations �100–1000 timesslower than at room temperature [56]) or using less catalytic wallmaterials to reduce these effects [78], and measurements of thekinetic parameters of involved heterogeneous reactions for theirappropriate consideration in the model.
Several elementary processes have been identified at differentstages of the present study as needing new or improved kineticdata, often confirming the data requests of other authors: the dis-sociative recombination rate and branching ratios for CH2NHþ2[17]; the rate constant of the CHþH reactions [32,77]; newreactions consuming CHCN [27]; the photolysis branching ratiosof CH4 around 80 nm, and more generally over the whole80–140 nm range. These parameters are important sources ofuncertainty and/or bias in the model predictions, and they areurgently needed to improve the detailed chemical modeling ofN2/CH4 plasmas and Titan’s ionosphere.
References
[1] Wilson EH, Atreya SK. Chemical sources of haze formation in Titan’satmosphere. Planet Space Sci 2003;51:1017–33. http://dx.doi.org/10.1016/j.pss.2003.06.003.
[2] Wilson EH, Atreya SK. Current state of modeling the photochemistry of Titan’smutually dependent atmosphere and ionosphere. J Geophys Res 2004;109:E06002. http://dx.doi.org/10.1029/2003JE002181.
[3] Cravens TE, Robertson IP, Clark J, Wahlund JE, Waite JH, Ledvina SA, NiemannHB, Yelle RV, Kasprzak WT, Luhmann JG, McNutt RL, Ip WH, De La Haye V,Müller-Wodarg I, Young DT, Coates AJ. Titan’s ionosphere: model comparisonswith Cassini Ta data. Geophys Res Lett 2005;32:L12108. http://dx.doi.org/10.1029/2005GL023249.
[4] Atreya SK, Adams EY, Niemann HB, Demick-Montelara JE, Owen TC,Fulchignoni M, Ferri F, Wilson EH. Titan’s methane cycle. Planet Space Sci2006;54:1177–87. http://dx.doi.org/10.1016/j.pss.2006.05.028.
[5] Cravens T, Robertson I, Waite Jr J, Kasprzak W, Keller C, Ledvina S, Niemann H,Luhmann J, McNutt R, Ip W, Haye VDL, Mueller-Wodarg I, Wahlung J, AnicichV, Vuitton V. Composition of Titan’s ionosphere. Geophys Res Lett2006;33:L07312. http://dx.doi.org/10.1029/2005GL025575.
[6] Vuitton V, Yelle R, Anicich V. The nitrogen chemistry of Titan’s upperatmosphere revealed. Astrophys J 2006;647:L175–8. http://dx.doi.org/10.1086/507467.
[7] Atreya SK. Titan’s organic factory. Science 2007;316:843–5. http://dx.doi.org/10.1126/science.1141869.
[8] Vuitton V, Yelle R, McEwan M. Ion chemistry and N-containing molecules inTitan’s upper atmosphere. Icarus 2007;191:722–42. http://dx.doi.org/10.1016/j.icarus.2007.06.023.
[9] Waite J, Young D, Cravens T, Coates A, Crary F, Magee B, Westlake J. The processof tholin formation in Titan’s upper atmosphere. Science 2007;316:870–5.http://dx.doi.org/10.1126/science.1139727.
[10] De La Haye V, Waite J, Cravens T, Robertson I, Lebonnois S. Coupled ion andneutral rotating model of Titan’s upper atmosphere. Icarus 2008;197:110–36.http://dx.doi.org/10.1016/j.icarus.2008.03.022.
[11] Vuitton V, Yelle RV, Cui J. Formation and distribution of benzene on Titan. JGeophys Res 2008;113:E05007. http://dx.doi.org/10.1029/2007JE002997.
[12] Crary FJ, Magee BA, Mandt K, Waite Jr JH, Westlake J, Young DT. Heavy ions,temperatures and winds in Titan’s ionosphere: combined Cassini CAPS andINMS observations. Planet Space Sci 2009;57(14–15):1847–56. http://dx.doi.org/10.1016/j.pss.2009.09.006.
[13] Krasnopolsky V. A photochemical model of Titan’s atmosphere and ionosphere. Icarus 2009;201:226–56. http://dx.doi.org/10.1016/j.icarus.2008.12.038.
[14] Vuitton V, Lavvas P, Yelle R, Galand M, Wellbrock A, Lewis G, Coates A,Wahlund J-E. Negative ion chemistry in Titan’s upper atmosphere. PlanetSpace Sci 2009;57:1558–72. http://dx.doi.org/10.1016/j.pss.2009.04.004.
[15] Vuitton V, Yelle R, Lavvas P. Composition and chemistry of Titan’sthermosphere and ionosphere. Philos Trans R Soc A Math Phys Eng Sci2009;367:729–41. http://dx.doi.org/10.1098/rsta.2008.0233.
[16] Wilson EH, Atreya SK. Titan’s carbon budget and the case of the missingethane. J Phys Chem A 2009;113(42):11221–6. http://dx.doi.org/10.1021/jp905535a.
[17] Yelle RV, Vuitton V, Lavvas P, Klippenstein SJ, Smith MA, Hörst SM, Cui J.Formation of NH3 and CH2NH in Titan’s upper atmosphere. Faraday Discuss2010;147:31–49. http://dx.doi.org/10.1039/c004787m.
[18] Westlake JH, Waite Jr JH, Mandt KE, Carrasco N, Bell JM, Magee BA, Wahlund J-E. Titan’s ionospheric composition and structure: photochemical modeling ofCassini INMS data. J Geophys Res 2012;117:E01003. http://dx.doi.org/10.1029/2011JE003883.
[19] Lavvas P, Coustenis A, Vardavas I. Coupling photochemistry with hazeformation in Titan’s atmosphere, Part I: model description. Planet Space Sci2008;56:27–66. http://dx.doi.org/10.1016/j.pss.2007.05.026.
[20] Lavvas P, Coustenis A, Vardavas I. Coupling photochemistry with hazeformation in Titan’s atmosphere, Part II: results and validation with Cassini/Huygens data. Planet Space Sci 2008;56:67–99. http://dx.doi.org/10.1016/j.pss.2007.05.027.
[21] Wahlund J-E, Galand M, Müller-Wodarg I, Cui J, Yelle R, Crary F, Mandt K,Magee B, Waite Jr J, Young D, Coates A, Garnier P, Ågren K, André M, Eriksson A,Cravens T, Vuitton V, Gurnett D, Kurth W. On the amount of heavy molecularions in Titan’s ionosphere. Planet Space Sci 2009;57:1857–65. http://dx.doi.org/10.1016/j.pss.2009.07.014.
[22] Lavvas P, Yelle RV, Koskinen T, Bazin A, Vuitton V, Vigren E, Galand M,Wellbrock A, Coates AJ, Wahlund J-E, Crary FJ, Snowden D. Aerosol growth inTitan’s ionosphere. Proc Natl Acad Sci 2013;110(8):2729–34. http://dx.doi.org/10.1073/pnas.1217059110.
[23] Plessis S, Carrasco N, Pernot P. Knowledge-based probabilistic representationsof branching ratios in chemical networks: the case of dissociativerecombinations. J Chem Phys 2010;133:134110. http://dx.doi.org/10.1063/1.3479907.
[24] Pernot P, Plessis S, Carrasco N. Probabilistic representations of partialbranching ratios: bridging the gap between experiments and chemicalmodels. J Phys Conf Ser 2011;300:012027. http://dx.doi.org/10.1088/1742-6596/300/1/012027.
[25] Plessis S, Carrasco N, Dobrijevic M, Pernot P. Production of neutral species inTitan’s ionosphere through dissociative recombination of ions. Icarus2012;219:254–66. http://dx.doi.org/10.1016/j.icarus.2012.02.032.

52 Z. Peng et al. / GeoResJ 1–2 (2014) 33–53
[26] Thissen R, Vuitton V, Lavvas P, Lemaire J, Dehon C, Dutuit O, Smith MA,Turchini S, Catone D, Yelle RV, Pernot P, Somogyi A, Coreno M. Laboratorystudies of molecular growth in the titan ionosphere. J Phys Chem A2009;113:11211–20. http://dx.doi.org/10.1021/jp9050353.
[27] Imanaka H, Smith MA. Formation of nitrogenated organic aerosols in the Titanupper atmosphere. Proc Natl Acad Sci 2010;107:12423–8. http://dx.doi.org/10.1073/pnas.0913353107.
[28] Peng Z, Gautier T, Carrasco N, Pernot P, Giuliani A, Mahjoub A, Correia J-J, BuchA, Bénilan Y, Szopa C, Cernogora G. Titan’s atmosphere simulation experimentusing continuum UV-VUV synchrotron radiation. J Geophys Res Planets2013;118:778–88. http://dx.doi.org/10.1002/jgre.20064.
[29] Giuliani A, Jamme F, Rouam V, Wien F, Giorgetta J-L, Lagarde B, Chubar O, BacS, Yao I, Rey S, Herbeaux C, Marlats J-L, Zerbib D, Polack F, Refregiers M. DISCO:a low-energy multipurpose beamline at synchrotron SOLEIL. J SynchrotronRadiat 2009;16:835–41. http://dx.doi.org/10.1107/S0909049509034049.
[30] Giuliani A, Yao I, Lagarde B, Rey S, Duval J-P, Rommeluere P, Jamme F, RouamV, Wein F, De Oliveira C, Ros M, Lestrade A, Desjardins K, Giorgetta J-L,Laprevote O, Herbaux C, Refregiers M. A differential pumping system to deliverwindowless VUV photons at atmospheric pressure. J Synchrotron Radiat2011;18:546–9. http://dx.doi.org/10.1107/S0909049511016517.
[31] Hébrard E, Dobrijevic M, Bénilan Y, Raulin F. Photochemical kineticsuncertainties in modeling Titan’s atmosphere: a review. J PhotochemPhotobiol A: Chem 2006;7:211–30. http://dx.doi.org/10.1016/j.jphotochemrev.2006.12.004.
[32] Hébrard E, Dobrijevic M, Pernot P, Carrasco N, Bergeat A, Hickson KM, CanosaA, Le Picard SD, Sims IR. How measurements of rate coefficients at lowtemperature increase the predictivity of photochemical models of Titan’satmosphere. J Phys Chem A 2009;113:11227–37. http://dx.doi.org/10.1021/jp905524e.
[33] Gans B, Peng Z, Carrasco N, Gauyacq D, Lebonnois S, Pernot P. Impact of a newwavelength-dependent representation of methane photolysis branching ratioson the modeling of Titan’s atmospheric photochemistry. Icarus2013;223:330–43. http://dx.doi.org/10.1016/j.icarus.2012.11.024.
[34] Carrasco N, Alcaraz C, Dutuit O, Plessis S, Thissen R, Vuitton V, Yelle R, Pernot P.Sensitvity of a Titan ionospheric model to the ion–molecule reactionparameters. Planet Space Sci 2008;55:1644–57. http://dx.doi.org/10.1016/j.pss.2008.04.007.
[35] Dutuit O, Carrasco N, Thissen R, Vuitton V, Alcaraz C, Pernot P, Balucani N,Casavecchia P, Canosa A, Picard SL, Loison J-C, Herman Z, Zabka J, Ascenzi D,Tosi P, Franceschi P, Price SD, Lavvas P. Critical Review of N, N+, N+ 2, N++, andN++ 2 Main Production Processes and Reactions of Relevance to Titan’sAtmosphere. Astrophys J Suppl Ser 2013;204:20. http://dx.doi.org/10.1088/0067-0049/204/2/20.
[36] Eland JH. Double photoionisation spectra of methane, ammonia and water.Chem Phys 2006;323:391–6. Available from: <http://dx.doi.org/10.1016/j.chemphys.2005.09.047>.
[37] De Bleecker K, Bogaerts A, Goedheer W. Detailed modeling of hydrocarbonnanoparticle nucleation in acetylene discharges. Phys Rev E 2006;73:026405.http://dx.doi.org/10.1103/PhysRevE.73.026405.
[38] Hébrard E, Dobrijevic M, Bénilan Y, Raulin F. Photochemical kineticsuncertainties in modeling Titan’s atmosphere: first consequences. PlanetSpace Sci 2007;55:1470–89. http://dx.doi.org/10.1016/j.pss.2007.04.006.
[39] Peng Z, Dobrijevic M, Hebrard E, Carrasco N, Pernot P. Photochemical modelingof Titan atmosphere at the 10 percent uncertainty horizon. Faraday Discuss2010;147:137–53. http://dx.doi.org/10.1039/c003366a.
[40] Peng Z, Cailliez F, Dobrijevic M, Pernot P. Null Variance Altitudes for thephotolysis rate constants of species with barometric distribution: illustrationon Titan upper atmosphere modeling. Icarus 2012;218:950–5. http://dx.doi.org/10.1016/j.icarus.2012.02.006.
[41] Carrasco N, Pernot P. Modeling of branching ratio uncertainty in chemicalnetworks by Dirichlet distributions. J Phys Chem A 2007;111:3507–12. http://dx.doi.org/10.1021/jp067306y.
[42] Carrasco N, Dutuit O, Thissen R, Banaszkiewicz M, Pernot P. Uncertaintyanalysis of bimolecular reactions in Titan ionosphere chemistry model. PlanetSpace Sci 2007;55:141.
[43] Chen F, Wu C. Temperature-dependent photoabsorption cross sections in theVUV-UV region. I. Methane and ethane. J Quant Spectrosc RadiatTransfer 2004;85(2):195–209. http://dx.doi.org/10.1016/S0022-4073(03)00225-5.
[44] Huebner W, Link W. Photo cross-sections and rate coefficients; 2011. <http://amop.space.swri.edu/>.
[45] Anicich V. Evaluated bimolecular ion–molecule gas phase kinetics of positiveions for use in modelling planetary atmospheres, cometary comae andinterstellar clouds. J Phys Chem Ref Data 1993;22:1469–569. http://dx.doi.org/10.1063/1.555940.
[46] Press WH, Teukolsky SA, Vetterling WT, Flannery BP. Numericalrecipes. Cambridge University Press; 1992.
[47] Shampine LF, Sommeijer BP, Verwer JG. IRKC: an IMEX solver for stiffdiffusion–reaction PDEs. J Comput Appl Math 2006;196:485–97. http://dx.doi.org/10.1016/j.cam.2005.09.014.
[48] Verwer J, Sommeijer B. An implicit-explicit Runge–Kutta–Chebyshev schemefor diffusion–reaction equations. SIAM J Sci Comput 2004;25(5):1824–35.http://dx.doi.org/10.1137/S1064827503429168.
[49] BIPM, IEC, IFCC, ILAC, ISO, IUPAC, IUPAPOIML. Evaluation of measurement data– supplement 1 to the Guide to the expression of uncertainty in measurement– Propagation of distributions using a Monte Carlo method. Technical Report101:2008, Joint Committee for Guides in Metrology, JCGM; 2008.
[50] Puccio MA, Miller JH. Detection of trace hydrocarbons in flames using directsampling mass spectrometry coupled with multilinear regression analysis.Anal Chem 2010;82:5160–8. http://dx.doi.org/10.1021/ac1003823.
[51] Stein S. NIST chemistry webbook. NIST standard reference database number69, chapter Mass Spectra. National Institute of Standards and Technology,Gaithersburg MD, 20899; 2013. (Retrieved August 30, 2013).
[52] Carrasco N, Gautier T, Essebbar E, Pernot P, Cernogora G. Volatile productscontrolling Titan’s tholins production. Icarus 2012;219:230–40. http://dx.doi.org/10.1016/j.icarus.2012.02.034.
[53] Dobrijevic M, Dutour I. The distribution of hydrocarbons in Titan’satmosphere: an evolutionary algorithm-based model. Planet Space Sci2007;55(14):2128–36. http://dx.doi.org/10.1016/j.pss.2007.06.003.
[54] Carrasco E, Jimenez-Redondo M, Tanarro I, Herrero VJ. Neutral and ionchemistry in low pressure dc plasmas of H2/N2 mixtures: routes for theefficient production of NH3 and NH4+. Phys Chem Chem Phys2011;13:19561–72. http://dx.doi.org/10.1039/C1CP22284H.
[55] Jacq S, Cardinaud C, Brizoual LL, Granier A. H atom surface loss kinetics inpulsed inductively coupled plasmas. Plasma Sources Sci Technol2013;22(5):055004. http://dx.doi.org/10.1088/0963-0252/22/5/055004.
[56] Gorodetsky A, Zalavutdinov R, Zakharov A, Vnukov S, Varshavskaya I,Makhankov A, Mazul I, Federici G. Increased recombination of CH3 radicalson stainless steel. J Nucl Mater 2005:892–6. http://dx.doi.org/10.1016/j.jnucmat.2004.10.133.
[57] Wakelam V, Smith IWM, Herbst E, Troe J, Geppert W, Linnartz H, Öberg K,Roueff E, Agundez M, Pernot P, Cuppen HM, Loison J-C, Talbi D. Reactionnetworks for interstellar chemical modelling: improvements and challenges.Space Sci Rev 2010;156:13–72. http://dx.doi.org/10.1007/s11214-010-9712-5.
[58] Dobrijevic M, Hébrard E, Plessis S, Carrasco N, Bruno-Claeys M, Pernot P.Comparison of methods for the determination of key reactions in chemicalsystems: Application to Titan’s atmosphere. Adv Space Res 2010;45:77–91.http://dx.doi.org/10.1016/j.asr.2009.06.005.
[59] Rosi M, Falcinelli S, Balucani N, Casavecchia P, Skouteris D. A theoretical studyof formation routes and dimerization of methanimine and implications for theaerosols formation in the upper atmosphere of Titan. In: Murgante B, Misra S,Carlini M, Torre CM, Nguyen H-Q, Taniar D, Apduhan BO, Gervasi O, editors.Computational science and its applications – ICCSA 2013. Lecture notes incomputer science, vol. 7971. Berlin Heidelberg: Springer; 2013. p. 47–56.http://dx.doi.org/10.1007/978-3-642-39637-3_4.
[60] R Development Core Team. R: A language and environment for statisticalcomputing. R foundation for statistical computing, Vienna, Austria; 2012.<http://www.R-project.org>.
[61] Murtagh F, Contreras P. Algorithms for hierarchical clustering: an overview.Wiley Interdiscip Rev Data Min Knowl Discovery 2012;2:86–97. http://dx.doi.org/10.1002/widm.53.
[62] van Krevelen W. Graphical-statistical method for the study of structure andreaction processes of coal. Fuel 1950;29:269–84.
[63] Wu Z, Rodgers R, Marshall A. Two- and three-dimensional van Krevelendiagrams: A graphical analysis complementary to the kendrick mass plot forsorting elemental compositions of complex organic mixtures based onultrahigh-resolution broadband Fourier Transform Ion Cyclotron Resonancemass measurements. Anal Chem 2004;76(9):2511–6. http://dx.doi.org/10.1021/ac0355449.
[64] Benedikt J. Plasma-chemical reactions: low pressure acetylene plasmas. J PhysD: Appl Phys 2010;43(4):043001. http://dx.doi.org/10.1088/0022-3727/43/4/043001.
[65] Kaiser RI, Mebel AM. On the formation of polyacetylenes andcyanopolyacetylenes in Titan’s atmosphere and their role in astrobiology.Chem Soc Rev 2012;41:5490–501. http://dx.doi.org/10.1039/C2CS35068H.
[66] Balucani N. Elementary reactions of N atoms with hydrocarbons: first stepstowards the formation of prebiotic N-containing molecules in planetaryatmospheres. Chem Soc Rev 2012;41:5473–83. http://dx.doi.org/10.1039/C2CS35113G.
[67] Floyd LE, Reiser PA, Crane PC, Herring LC, Prinz DK, Brueckner GE.Solar cycle 22 UV spectral irradiance variability: current measurementsby SUSIM UARS. Sol Phys 1998;177:79–87. http://dx.doi.org/10.1023/A:1004907902440.
[68] BIPM, IEC, IFCC, ILAC, ISO, IUPAC, IUPAP, OIML. Evaluation of measurementdata – guide to the expression of uncertainty in measurement (GUM).Technical Report 100:2008, Joint Committee for Guides in Metrology, JCGM;2008.
[69] Imanaka H, Smith M. Role of photoionization in the formation of complexorganic molecules in Titan’s upper atmosphere. Geophys Res Lett2007;34:L02204. http://dx.doi.org/10.1029/2006GL028317.
[70] Wu CYR, Chen FZ, Judge DL. Temperature-dependent photoabsorption crosssections in the VUV-UV region: Ethylene. J Geophys Res Planets2004;109(E7):E07S15. http://dx.doi.org/10.1029/2003JE002180.
[71] Jolly A, Benilan Y. Review of quantitative spectroscopy of polyynes. J QuantSpectrosc Radiat Transfer 2008;109(6):963–73. http://dx.doi.org/10.1016/j.jqsrt.2007.12.010.

Z. Peng et al. / GeoResJ 1–2 (2014) 33–53 53
[72] De La Haye, V. Corona formation and heating efficiencies in titan’s upperatmosphere: construction of a coupled ion, neutral and thermal structuremodel to interpret the first inms cassini data [PhD thesis]. The University ofMichigan; 2005.
[73] Yelle RV, Cui J, Mueller-Wodarg ICF. Methane escape from Titan’s atmosphere.J Geophys Res Planets 2008;113:E10003. http://dx.doi.org/10.1029/2007JE003031.
[74] Strobel DF. Titan’s hydrodynamically escaping atmosphere: escape rates andthe structure of the exobase region. Icarus 2009;202:632–41. http://dx.doi.org/10.1016/j.icarus.2009.03.007.
[75] Mandt KE, Gell DA, Perry M, Hunter Waite J, Crary FA, Young D, Magee BA,Westlake JH, Cravens T, Kasprzak W, Miller G, Wahlund J-E, Agren K, EdbergNJT, Heays AN, Lewis BR, Gibson ST, de la Haye V, Liang M-C. Ion densities andcomposition of Titan’s upper atmosphere derived from the Cassini ion neutralmass spectrometer: analysis methods and comparison of measured iondensities to photochemical model simulations. J Geophys Res Planets2012;117:2156–202. http://dx.doi.org/10.1029/2012JE004139.
[76] Sekine Y, Lebonnois S, Imanaka H, Matsui T, Bakes EL, McKay CP, Khare BN,Sugita S. The role of organic haze in Titan’s atmospheric chemistry: II. Effect ofheterogeneous reaction to the hydrogen budget and chemical composition ofthe atmosphere. Icarus 2008;194:201–11. http://dx.doi.org/10.1016/j.icarus.2007.08.030.
[77] Dobrijevic M, Carrasco N, Hébrard E, Pernot P. Epistemic bimodality andkinetic hypersensitivity in photochemical models of Titan’s atmosphere.Planet Space Sci 2008;56:1630–43. http://dx.doi.org/10.1016/j.pss.2008.05.016.
[78] Oinuma G, Inanaga Y, Tanimura Y, Kuzumoto M, Tabata Y, Watanabe K. Acomparative study of the surface recombination of nitrogen atoms on variousmaterials at atmospheric pressure. J Phys D Appl Phys 2010;43:255202. http://dx.doi.org/10.1088/0022-3727/43/25/255202.