Evolution of the ionospheric mapping and modelling during the ...
28
Física de la Tierra I5SN: 0214-4557 2000, 12, 127-154 Evolution of the ionospheric mapping and modelling during the lastfour decades fimna ZOLESI Istituto Nazionale di Oeaf¡sica, Via di Vigna Murata 605, 00143 Roma, Italy Ljiljana R. CANDER Ruthe-rford Apple-tan Labaratory, Chiltan, Didcot, Oxan OXI 1 OQX, UK ABSTRACT Since- tite- be-ginning of tite- ionaspite-ric discavery, ianosphe-ric mapping ano] made- lling itas be-en tite- subject of an intense- ano] cantinuous work by geapitysicists and radio- use-rs witit tite- aim to understand bette-r aur environment ano] to improve o]ive-rsity ab ap- plicatians in radia-propagatian. ‘me evalutian in the last faur decades of tite-se studies, brom HP system design, circuit planning and perfonnance- predictions ta real-time control of tite ianosphe-ric paraine-te-rs lar space- we-athe-r purposes ano] Earth satellite- communications, itas be-en reporteo] itere by a sitart revie-w of tite- principal ano] accepted metbods. Changes of tite needed appflcations, fram global ta regional madelling ano] from long ta shart-term or e-ven instantane-aus ano] now-casting mapping, connected with rapid progre-ss of tite competer sysLems bave- be-en e-ansio]e-re-d tao. Key words: Lanaspite-re-, Madelling, Mapping, Pre-dictian, Fare-casting. 1. INTRODUCTION Tite impact of solar pitenamena ano] assaciated ge-omagnetic, magnetosp- he-ric ano] ionospite-ric activity on tite near-Eartit space e-nviranment is an ¡m- partant tapie- un ge-opitysics. Terrestrial ano] Eartb-space- tele-communicatian systems, electric pawer netwarks, geophysicai exploration, spacecraft control ant] scientific researcit campaigns are- itiglil>’ affecte-o] by salarterre-sírial activit>’ (e.g., Míen e-t al., 1989; Bote-ler, 1990; Garney, 1990). Terrestrial ionaspitere is a calo] magne-Lised plasma environme-nt envelaping tite Eartit wide-it be-itaviour is strongly influenced bath by magne-tospite-re aboye- ano] by tite- neutral at- mospitere belaw. Togeter wit te ionospiteric aeronomy, te- itigitly variable electric cune-nt ¡u te- ionosphere ano] magne-tosphe-re-, conne-cting unto currents ¡u inte-rplane-tary space that are- carneo] by tite plasma of te solar wind, ano] tite-ir assaciaLe-d electric fields have a strang impacLs on tite ¡anosplie-rie- struc- ture- ano] dynamic (Ricitmano], 1995). 127 Física de la Tierra 2000, 12, 127-154
-
Upload
khangminh22 -
Category
Documents
-
view
1 -
download
0
Transcript of Evolution of the ionospheric mapping and modelling during the ...
Física de la Tierra I5SN: 0214-4557
2000, 12, 127-154
Evolution of the ionospheric mappingand modelling during the lastfour decades
fimna ZOLESIIstituto Nazionale di Oeaf¡sica,
Via diVigna Murata 605, 00143 Roma, ItalyLjiljana R. CANDER
Ruthe-rford Apple-tan Labaratory, Chiltan, Didcot,Oxan OXI 1 OQX, UK
ABSTRACT
Since- tite- be-ginning of tite- ionaspite-ric discavery, ianosphe-ric mapping ano] made-lling itas be-en tite- subject of an intense- ano] cantinuous work by geapitysicists and radio-use-rs witit tite- aim to understand bette-r aur environment ano] to improve o]ive-rsity ab ap-plicatians in radia-propagatian. ‘me evalutian in the last faur decades of tite-se studies,brom HP system design, circuit planning and perfonnance- predictions ta real-timecontrol of tite ianosphe-ric paraine-te-rs lar space- we-athe-r purposes ano] Earth satellite-communications, itas be-en reporteo] itere by a sitart revie-w of tite- principal ano] acceptedmetbods. Changes of tite needed appflcations, fram global ta regional madelling ano]from long ta shart-term or e-ven instantane-aus ano] now-casting mapping, connectedwith rapid progre-ss of titecompeter sysLems bave- be-en e-ansio]e-re-d tao.
Key words: Lanaspite-re-, Madelling, Mapping, Pre-dictian, Fare-casting.
1. INTRODUCTION
Tite impact of solar pitenamena ano] assaciated ge-omagnetic, magnetosp-he-ric ano] ionospite-ric activity on tite near-Eartit space e-nviranment is an ¡m-partant tapie- un ge-opitysics. Terrestrial ano] Eartb-space- tele-communicatiansystems, electric pawer netwarks, geophysicai exploration, spacecraft controlant] scientific researcit campaigns are- itiglil>’ affecte-o] by salarterre-sírial activit>’(e.g., Míen e-t al., 1989; Bote-ler, 1990; Garney, 1990). Terrestrial ionaspitere isa calo] magne-Lised plasma environme-nt envelaping tite Eartit wide-it be-itaviouris strongly influenced bath by magne-tospite-re aboye- ano] by tite- neutral at-mospitere belaw. Togeter wit te ionospiteric aeronomy, te- itigitly variableelectric cune-nt ¡u te- ionosphere ano] magne-tosphe-re-, conne-cting unto currents¡u inte-rplane-tary space that are- carneo] by tite plasma of te solar wind, ano]tite-ir assaciaLe-d electric fields have a strang impacLs on tite ¡anosplie-rie- struc-ture- ano] dynamic (Ricitmano], 1995).
127 Física de la Tierra
2000, 12, 127-154

Bruno Zotes! aná Ljiljana R. Cander Evohaion of the ionospher!c and modelling...
In aH lonaspiterie niodelling studie-s, tite-re- have- be-en twa distinct de-velop-ments under way. ‘me f¡rst focuses upan effarts to improve e-xisting physical,empine-al ano] semiempirical mode-Is be-yant] tite-ir climatalogical level (Sojka,1989). ‘me se-cono] is associate-d witit te realtime- use- of data re-sulting from im-praving technique-s bar salarterrestrial monitoring (Cande-retal., 1999). Consi-de-ring tite- evolution of tite- ionospite-ric mapping ant] mot]elling during tite lastfaur decades in tis paper, an attempt is made- to answe-r tite- following titree-questions: (1) Witat maps ant] mode-Is are available for ionosphe-rie- long-te-rinpredictian ant] sitort-te-nn forecasting, mainly propagation, purposes, (2) Witatre-se-arcit efforts are nee-ded for tite- improveme-nt of such maps ant] mode-Is, ant](3) Are tite-se maps ant] modeis sti]l needed?
‘me paper presents a subjective- view of past, prese-nt ant] future- ionospitericprediction ant] forecasting mapping ano] madelling from tite- perspective- of tite-irevolution during tite- last faurdecades. After tite- introduction, lang-term rnappingant] mode-iling are- presente-o] in tite ne-xt section toge-titer witit a brie-f outline of titedata ana¡ysis te-eitnique-s. Section 3 discusse-s tite main re-sults fnom tite stndy oftite- mapp¡ug ant] modelling witit sitort time- horizan. Results support tite view thatt]ay-to-t]ay E re-gion ianosphe-ric variability is esse-ntially altered duning ve-nydisturbe-o] canditions ano] titerefare- tite- consequences of titase- effe-cts bar short-te-rin madelling purposes are discusse-d. A possible way to transform te- e-xistingglobal, regional and/or local maps ano] madeis ta tite servíce praducts ano] de-ve-iop tite new ones is discussed un section 4. It describes alsa deve-lapme-nts iii aurability to forecast tite- pote-ntially damaging space- weathereve-nts. Ge-ne-rally, it isconcluded that tite- model sitaulo] be time-depende-nt witit input parameters thatmust be- determine-o] direetly froro local abservatians. Local, re-al-time- observa-tions applied to regional modeis are nee-e-ssary. men, by combining tite pitysicalant] regional madeis, jonospiterie prediction ano] fore-casting will be- substan-tially improved. Only ne-ce-ssary re-fe-rences are given to complete- te- paper.
2. LONG-TERM MAPPING AND MODELLING
Long-tenn prediction of tite- se-le-cte-o] ianospiteric citaracteristies constitutedin te last decades tite- first ano] principal step for e-ver>’ peiformance- pre-dictionme-titad of tite HP radio systems. Tite-se pre-dictians needed for radio syste-m de-sign, for circuit planning ano] frequency management we-re- base-o] aix tite anal>’-sis of long series of montitly median ar mean values e-oue-late-d witit tite- le-ve) ofsolar activity indices. Usually geopitysicists ant] radio- use-rs itave considere-o]tite median montly conditions of the ionospiteric citaracte-ristics as reference-bar tite- normal or quiet ionospite-re. l4aweve-r. tis is not e-xactly true-. Firstiy, be--cause- titis parameter was introduce-o] by radio use-rs to make sure- tbat a givenvalue- sitaulo] be excee-decl it>’ tite 50% of tite- values, at tite same time- in tite-manth. Se-condí>’, be-cause- it refe-rs to tite- annual month so its geopitysical me-aning is ratiter discussible-.
Física de Ea Tierra2000,12,127-154
128


Bruno Zotes! and Ljiljana R. Cander Evolution of(he ionospheric and modelhing. -.
computer to map, in universal time (UT), tite- principal ionospiteric characte-risties use-o] to pre-dict tite- radio propagat¡on frequencies, vaho] for any locationat tite- Earth ant] for any montit ant] haur of tite- day ano] solar epocit (ITU-R,1997; ITU-BR, 1997).
Conside-ring tite complex morpitology of tite F2 layer ayer tite globe, titatcannot be describe-o] by an analytical function as for a Chapman layer as it is fortite Pl ano] E laye-rs, tite numerical metitod adopte-o] by ITU-R is titat derive-o] bytite me-titad de-ve-lope-dat ITS by Janes ant] Gallet since 1960 (Janes ant] Galle-t,1960 ano] 1965). Figure lis an example sitawing tite de-gree- of ge-agrapiticalstructure- repre-sented.
-5
Tite term numerical map is use-o] to denote a funetion, Q(2, 0, 7) of titetitree- variables: latitude 2, longitude O ant] time T. Tite function QQL, 0, $t) is
obtained by fitting certain polynomial series of functions of tite Linee variablesto tite basic lonospiterie data. Tite general form of tite numerical map funetion,~2(2,O , 7) is tite- Fourier time series:
J~1
= a0(X,0) + L[cxjUtO)cos(jT) + bj(Á,0)sin(jT)]j~I
(1)
Longitude
Figure 1. Numerical map of MUF(ZFRO)F2. June 1983.UT=18. Values are given in MHz.
Física de la Tierra2000, 12.127-154 130

Bruno Zoles! ¿md Ljiljana R. Cander Evolution of (he ionospheric and modelh!ng...
wite-re a ~s Lite- ge-ograpitie- latitude- (~9flO <,% < 900) 6 is tite- east geagraphiclongitude (00 <6 <3600), Tis tite universal time- e-xpressed lix an angle (~1800— .c T c + 1800), H is te- maximum number of itarmonics use-o] to represe-nt tediurnal variation.
‘me Fourier coefficients, a9. 6), vary with tite geograpitie co-ardinates ano]are re-presente-o] by series of tite bonn (~90o <2 < 900):
k
aJ(a,6)=XU2JkGk(2,6), j=0,1,2 H (2)a
a
b~Gt6)= ~ U2~í~0~Gt6)~ j = 1,2 H (3)k=0
‘me-refore-, a numerical map can be written more- explicitly in tite form
a£XX, 6, T) = Y +
a (4)0(2,+~ (IT) U2~, ~ (2, 6) + sin (jT)2 U2j1~
k~0 .1
wite-re- G~ (2,6, 7) — 5j~qi X cas 2~ sin iB, is tite geograpitic co-ordinates func-tions. Tite modified magnetic dip X follows tite re-Jatian
x=g’(í¡ cosa) (5)
on tite- place witere liste magnetic t]ip. He-re- tite- integer q~, i = 0,1 m, de--notes tite itighe-st power of sin X bar tite- i-tit-orde-r harmonics in longitude-,ano] ni denotes tite itighe-st arder of longitude.
Tite caefficients of numerical maps of tite montitiy median values of boF2ano] M(3000)F2 were presente-o] un tite Re-pon 340 of CCIR (CCILR Report ix.340, 1988). ‘me- coefficie-nts U~, witicit de-fine tite function, CAQ., 0, 7) of titenumerical map of tite given citaracteristie bar tite indicated mantit ano] level ofsolar activity. are given bar eacit montit of tite- year bar foF2 ano] M(3000)F2ant] for twa le-ve-ls of solar activity: R12 = O ano] R12 = íoo. me R12 is titetweive--mont smootited mean of sunspat numbe-rs ant] is use-o] as salar indexaltitougit otiter kino]s of smaated means caulo] itave be-en use-o]. For e-ve-ny R12different from O or 100 tite cae-bicie-nts U8~, may be- evaluated by an interpa-lation of tite- previous values bar R12 = O ano] R12 = 100 or by an extrapolation
131 Física de la Tierra2000, 12. 127-154

Bruno Zoles! aoci Ljiljana R. Cander Evolution of (he ionospheric and modehhing..
lar R112> 100. Far a synthe-tic description of tite- me-thod se-e- Sun X. ant] PanZ., 1987.
Tite advantage of titis nume-rical mapping me-titad is tat wite-n new databe-come available-, an electronic computer can e-asily revise tite coefficients.Howe-ver, tite- accuracy of tite- global re-presentation of tite- F2-Iaye-r characte-rístics abta¡ued from tite- maps depends mastly on tite geograpitical t]istribu-tion of tite ionospiteric stations tite data of witicit were use-o] un tite gene-rationof numerical eaefficients. Tite- montitly median values of foF2 witicit wereuse-o] to develop tite global maps were- obtaine-d from ayer 100 vertical saun-ding ianospite-ric statians operating in difIere-nt times. Figure- 2 sitows tite- mapof tite- stations.
VI,-— uY~ —i——~i-—— Bu lv t~ ha
-
600
Tky U300 A~~.~4¡—-~
IVa er R mr ng.30’ — — - 00 5rS
a—A
• te
u’~w~ft-í -I V .1 ~ rvmrrn
.900600 12O~ 1800
-nr LWI- 1200
lt>na,n,,Ip- 600 00
Figure 2. Map of slations, A data, A B data, xC data.
By abserving tite-se- stations, it is clear titat tite- best-generated maps of titeianospite-ric citaracteristics are at tite- regions for which data were available-. Ontite otiter hano], tite degree of accuracy of maps is quite law lar titase regianssucit as de-se-ns or ace-ans lar witicit data were not available from ah sort of re-asans. Janes ant] Oalle-t demonstrated successfuily titat tite usage of a set offunctions, witich adequately represent tite me-asure-o] ionospiteric data, cocí]te-a] to instabilities in are-as for witicit data are- sparse or missing altogetiter.
600
Física de la Tierra2000,12,!27-154 132
Bruno Zote-si ¿mdLjiljana R. Cander Evolution ofihe ionospheric and modelling...
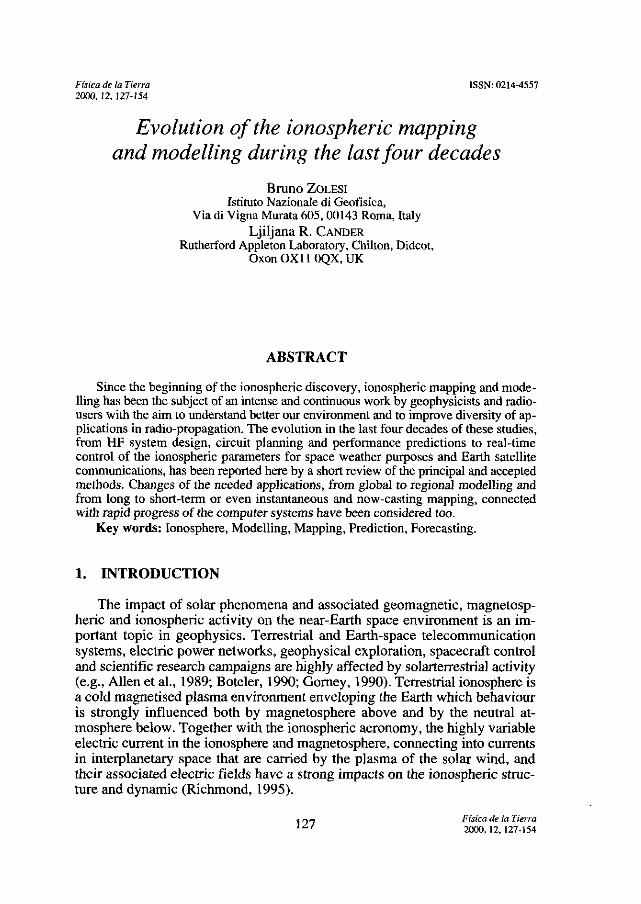
To avaid tese instabilities it was necessary to collect as many ianospite-ricdata as passible-, titat is itow, aix)>’ after tite IOY (hUy 1957 to Decembe-r 1958)witen te number of te stations was almost triplicate-, tite numericalrepresen-tatian of tite- ionaspheric eitaracteristics was passíble-. Figure- 3 shaws foF2met]ians for Mare-it 1958.
Figure 3. Map of monthly medians foF2, March 1958, UTOO.
‘me probiem was partially solved by Janes ano] Oalle-t (Janes ano] Galle-t,1965) by adding, to tite obse-rved median mantitly data coming bram re-al ver-tical saunOing staLians, re-ferre-O Lo as points A, tite daLa evaluated anO coniingbrom twa sets of virtual po¡uts re-ferre] to as paints B ano] C (Fig. 2). ‘me- datacom¡ug from te points 8 were obtaine-d by a prediction using a correlatian obtite available- data at tite sanie statian. Tite-y use-o] a me-titad (Craw ant] Zacitari-san, 1960) tat applie-d an interpolation of te- ionaspiteric characteristic by apolynom of tite first or secano] orde-r va. aix index of tite salar activity. Ob-viously data caming bram te points A ano] 8 we-re available- only bar tan] base-re-gions. Witereas te C data, use] as re-ference pa¡uts, were abtaineo] by an in-
600 120~ 1800 ~l20o ~60o 00 600longitude
133 Física de la Tierra2000,12, 127-154

Bruno Zoles! and Ljiljana R. Cander Evoluhon of (he ionospher!c and mociehhing...
terpolation of tite- ionospite-ric citaracteristie considere-o] as a variable of anly oneca-ardinate, i.e-. tite- latitude-. Tite diumal variatian of tite citaracteristics at tite- Eant] C paints itas be-en represente-] by Fourier series. Titat is itaw, as a whole,tite data distribution from A, B ano] C paints cantributed to de-termine tite- mt-me-rical coefficie-nts. Altitaugh, titis me-titad witit its following improveme-ntsgaye- goad re-sults espe-cially from tite- ionospiteric predictors point of view, tite-maps of foF2 still lack tite- required precision.
A ver>’ important improve-ment was proposed by Rusit et al. (Rusit et al.,1983; 1984) in arder to salve titis problem. Tite-y decide-o] to employ a titeare-tical model of tite ionosphere to ge-ne-rate values of foF2 in ah mid-latitude- re-gians inclwding titase lacations witere observations are not available. Tite va-lues determined by me-ans of tite tite-oretical model were- addet] to tite- onesdrawn from tite observations, titus contributing to ge-ne-rate tite- nume-rical ca-e-fficie-nts, witicit produce global maps of tite F2-layer critical frequency for aspecific montit. Tite results of titis me-titad shaw titat tite descriptian of tite- glo-bal beitaviaur of tite foF2 is consiste-nt witit tite structure- of tite- mid-latirude F2-layer ano] agrees with oter obse-rvations sucit as topside- soundings. Rusit et al.use-o] tite- time--depende-nt ion continuity equation describe-o] by Anderson (An-derson, 1973a; 1973b) to calculate tite tite-ore-tical values of foF2.
If tite- ion density N~ is e-e-pial to tite- electron de-nsity N tite- values obtainedby tite solution of tite ion continuity equation can be used to determine directí>’foF2 as follows:
N =1e .24- lO$foF2)2 (6)
where N is e-xpre-ssed in e-le-ctron/cm’ ant] foF2 in MHz. Canside-ring that titecontínuíty equation is given by
L+v.(Ng»JL%L, (7)&
wite-re- Pi tite ion productian rate, L~ tite lass rate ant] 1/jis tite transport velocity.Tite- transport of tite ionospiteric plasma is due principail>’ to diffusion ano]neutral winds along tite Unes of tite geomagnetic fiel] ant] to electromagneticdrift perpendicular la tite fiel] lunes. Mode-Is of tite neutral composition are titenuse] ta obtain parame-ters sucit as neutral tempe-rature-, production, loss ano] t]if-fusion rates, neutral winds and geomagnetic he-id, alt of titem ne-ce-ssary lar tite-solution of tite ion continuity equation.
Tite effects of neutral wint]s ant] tite-ir corre-lation witit tite ge-omagnetic fie-Idare- ve-ny important for tite- solution of tite continuity equation. Tite values of me-ridional ant] zonal winds are- inferreo] fallowing tite- me-titad describe-] by Rusitetal. by fitting calculated values of foF2using tite- continuity equation ano] cam-paring tite-m witit tite available- ant] observe-o] data. Tite- southe-m wind campo-
Física de la Tierra2000, 12,127-154 134

Evolulion of 1/te ionospheric and modell!ng...Bruno Zoles! anci Ljiljana R. Cander
nent was adjuste-d in arder ta abtain an agreeme-nt be-twe-e-n observe] ant] cal-culated data. ‘me same- operatian was re-peated for anotiter location placed at tesame- magnetic latitude- but wit a dibfe-rent de-clination. Using te same- sout-ite-rn wind tite zonal wino] compone-nt was adjusted so that tite calcuiated valuesab foF2 sitaul] agree wit tite- observe] data.
‘me- numerical caefficients, re-pre-senting te global variatian of baF2, de--ve-lope] by Rusit et al. ano] tat are- consiste-nt witit pitysicai processes titat go-vera tite- F-re-gion, we-re put ¡uto te- same format as tose- of CCIR ant] Janesetal. (Janes et al, 1969). ‘me-se- new coe-fficie-nts derive] brom observe] data ab teworld-wide network of vertical incidence ionosonde- stations (A data) were-titen use-o] to pre-dicted data (B o]ata) ano] teoretical data points (D data) obtai-neo] from tite- time continuity equatian at mio] ano] itigit-Iatitudes.
Various comparisans be-tween te diunial beitaviour of te- foF2 abtaine-o] bynew coefficie-nts, ano] tat obtaine-d by tite oid CCIR coefficients demanstratetitat new me-tito] gives be-tte-r re-sults. ‘mis is particulariy true ¡u re-gions forwitich observe-o] data are availabie- (Matuura, 1983).
A furtiter improve-ment un ionospiteric mapp¡ug itas ten provided by Faxano] McNamara (Fox ano] McNamara, 1988). ‘me-y de-ve-lope-] a me-titad witicitmerged te fe-atures ab tite- Australian Ionospiteric Prediction Service JPS mapsano] tite- maps obtained wit tite- Janes ano] Oallet me-titad modified ano] imple--mente-o] by Rusit et al. Examining te advantages ano] limitations of te existingITS ano] IPS mapping me-tods tite-y stateo] tat tite maps are- itano]-o]rawn ano] assucit te-y cannot be easily re-vise-o] ano] are subje-ctive-, altougit, wite-n itano] dra-wing, it is possibie- ta take- into account tite- importance- of same- points or samepitysical insigitts. On te otiter itan], PS maps are o]rawn aix an extended bankof clata ano] base-o] an te ionospite-ric ¡ude-x T titat gives regre-ssion fines of baF2vs T wit a better correlation tan otiter indexes, (Turner, 1968; Wilkinsan,1982). Regarding more-ayer te- improved flS maps, Fax ano] McNamara obje-ctto decision take-n by Rusit e-t al. to use- data fram only twa se-le-cte-o] ye-ars, one- ata le-vel of salar activity ano] te atiter at a iower le-vel. For tite New World mapsof boF2 tite-y itave applied a linear regre-ssion analysis of tite- montly medianvalues against te solar index T titus obtaining te- values of foF2 at T = O ano]T=100.
Tite-y provided additional data un arder to fui te- gaps e-xist¡ug un tite worlddistributionprior to te mapping, by using te ITS foF2 caefficients compute-o]by Rusit et al. valí] far mid-latitude-. As it is we-ll knawn, tite- maps abtaineo] byusing tite observe] median data ano] tite ITS maps as ¡uputs failed to sitow an>’equatorial anamaiy. Par low-and itigit-latitude- regions, tite data base was sup-pie-mente-o] by me-ans of a procedure- knawn as «refiiiing» witicit derives fromIPS maps to witicit an interpolation aix geomagne-tic ca-ordinates at a given ma-dified dip latitude is applie-].
A madified Janes ano] Gallet me-titad was applied ta tite- mentianed data ¡uarder to produce tite- giobal maps. Twa impartant modificatians itave- be-en ¡u-traduce-] ta tite- mentioned Janes ano] Galle-u me-tito]. Tite- first one is titat wit
135Física de la Tierra2000, 12, 127-154
Bruno Zolesi and Lj!ljana R. Cander Evolution of 0w ionospher!c and modehhing..
te- new me-titad tite data fram al! tite years are use-] to obtain maps at T = O ant]T = 100 by an easie-r interpalatian or extrapalation. Tite secano] t]iffe-re-ncecanee-ms tite citoice of titebasic functions use-o] un mapping. In fact a goad des-criptian of tite- be-itaviour of foF2 global distribution, autside tite- equatorial re-gion, was given by means of lawer-order functions titan titase use-o] by Janesano] GalJet, witereas, wititin tite equatorial region, tite beitaviour is we-J1 descri-be-] by using itigit-art]er functions. Tite-se consit]erations are applied by me-anstwa kinds of functions, of whicit tite first one- is use-o] globally ano] tite- secano]only be-low tite- same cut-off latitude-. Finatly new set of updated coe-fficientsitave- be-en calculated using also data tite-are-tically calculated ayer tite oce-ans byRush e-t al in 1989.
2.2. Regional methods tú map foF2 ano] M(3000)F2
The- study ano] tite applicatian of regional mapping te-citniques, batit lar ms-tantane-aus or re-al-time- predictian as we-ll for median conditions, emerge- fromtite ne-ed ta imprave- tite-ir performances. It is possible- by use tite- available or amore- dense- network of ionospheric stations ant], in a restricteo] are-a, by sim-plifying tite- difficultie-s. On tite- atiter han], it is not cample-te-ly obviaus titat aregional te-citnique- sitaulo] always give bette-r re-sults titan tite- global me-titao]s. Infact an incorre-ct application of tite data bank or simply tite- use of non validatedme-asurements of a poar ne-twork of ionaspiteric statians may empitasise- «vir-tual» local variations, ve-ny bar from tite re-al be-itaviour. ‘me study ano] de-ve--lopme-nt of global me-titods were perfarmeo] in tite past due- to tite wide appli-catian of tite- ionospite-ric mapping ta long distance 1-IT radio links. It is insteadre-lative-ly re-ce-nt tite treno] to ge-ne-rate regional methods in arder to obtain be-trerre-sults witen te-se are- interfaced witit otiter ge-opitysical modeis botit lar te-le-communicatians as for geopitysical mat]elling.
Tite purpose to propase- an organie study of difIere-nt regional mode-Is taapply in tite- Eurapean are-a was an important task of tite faur years Europe-anprojects COST 238 PRIME (1991-1995) ano] tite COST2Sl IITS (1995-1999).‘men it was just during tite-se- twa projects life- times titat many regional mode-isant] mapping me-tot]s we-re- de-ve-lope-], examine-o] ano] teste-o] ¡u tite-ir applicationto tite Burope-an are-a ant] fanally compare-] witit tite performances of tite- mostuse-o] ITU-R global me-titad.
Some of tite-se- modeis as SIRM (Zale-si et al., 1993; 1996), PASHA (De-France-sciti e-t al., 1994), MQMF2 (Mikitailov et al. 1990; Mikitailov ano] Mik-itailov, 1993) ano] EOF (Dvinskikit, N, 1 ant] N.Y. Naie-t]oya, 1991) we-re- ini-tiated befare tite PRIME project comnieneement ano] were improved hita onusing tite update-d PRIME data bank. Otiter modeis as KGRID, LINLAT,ILCNN, SWILM, ISIRM, SAILT, MQMF2R ano] UNDIV we-re- gene-rateo] intite cante-st of te-se twa Eurapean actions PRIIvIE ant] IITS (Zoie-si ant] Cander,1998). Tite- potential of tite-se- te-citnique-s we-re- sitown ta diffe-re-nt mid-latitude-
F~sica de la Tierra2000, 12. 127-154 136

Bruno Zolesí and Lilijana R. Cander Evolution ofMe ionosphe ríe and rnodehhing...
regional are-as such as on Nort East ano] Saut East Ame-rica ano] aix Nortit EastAsia ant] Soutit Australia by Zalesi el al. (1996) ¡u case of tite SJRM model,ano] aix EasternCit¡ua by Wang et al. (1997) ¡u case- ob tite adapte-o] PRIME mo-del. It is important ta note- titat firstly during tite- PRIME action ano] titen latero]uring IITS action a testing proce-dure was de-ve-lope-] ano] applie-d by an ím-partial te-sting te-am to ve-rify ano] rank te performances of te difbe-re-nt met-itods, including Lite- global ITU-R. ‘mis wark was performed by using tite im-prave-] ano] valuo] data bank (Levy e-t al., 1998). Important canside-ratian wasgiven also ta tite bufbe-r zane between tite global ano] regional mode-ls in an at-íe-mpt ta avaid largegradie-nts e-specially at high latitudes wbere a complex be-itaviour of te- lonospiterie conditions exists (Leitinger, 1993; Hanhaba, 1999).
lii tite- COSi’ 251 proje-ct tite- be-st mapping me-titods appeared ta be- tite-MQF2R for tite faF2 ano] te- UNDIV for tite M(3000)F2) (Bradley, 1999 ano]re-ferences te-re-un). ‘me-y performed mucit be-tter titan te- global of ITU-R ano]still bette-r Litan Lite otiter moJe-ls propase-O in COSi’ acLions. Howe-ver, aH Litedifbere-nces, e-xpresse-d as standard deviatian of te e-rrars ¡u terms of MHz, we-re-rater small especially from te- point of view of predictors of tite mantitly me-dian conditions.
MQMF2R (Muitiquadrie- Me-tito] of spatial inte-rpalatian base-o] aix baF2 vsMF2 Regressian) is an irnprave-d version of MQMF2, a long-term predictionme-titad frrst de-ve-lope] for world wide- median mapp¡ug (Mikitaulav ano] Mik-itailav, 1993; Mikitailov e-t al., 1990) ano] ten applied ta tite- Eurapean re-gian ta¡nodel faF2 ano] M(3000)F2 ionospiteric characteristics (Mikitailov anO Ter-yakit¡u, 1992). Data bank use-o] ¡u MQMF2R bar baF2 cansists of aset of nume-rical coe-bficíents calculatedayer a range- of ianaspiteric stations, as far a singlestation madel, ¡uside tite regional are-a ano] ¡u te- buffet zane, by a foF2 polyno-mial regression vs salar activity ¡ude-x MF2. ‘me- MQMF2 meto] is base-] aix te-multiquadric (MQ) algarithm of spatial ¡uterpalatian (Te-ryokitin ano] Mikhailov,1992) for witicit a se-le-cte-o] ianospite-ric citaracteristic is represente]Uy:
f=XC~[1—se-nGcos6i cas(9—q~)--cos6cos6,j +b (8)~=1
witit
(9>i=1
witere Gis tite geagrapitic colatitude, q, is tite- geograpitic longitude- ano] Ci are- aset of numerical caefficie-nts ano] b a constant. Titis me-tao] draws a surface-strictly ayer given set of points lix distinctian fram oter metitads adopte-o] barionospiteric mapping. ‘me whole Jata bank inside regional are-a as we-1l as lii tite
137 Física de la Tierra2000,12, 127-154

Bruno Zoles! and Ljiljana R. Cander Evolution of Ihe ionospheric and mocielhing..
Januar>’ (R12 10, OSUT)
-10 0 lO 20 30 40 50 60
70 7065 65
~f 60 60
55 55
~ 50 50‘a
~ 45 45
40 40
35-lo
fonguaJe geode(icx deg
Figure 4. Example of MQMF2R map, for foF2, over the COST 251 region, in winter and solar mini-mum (R12=10} conditions. (*3 Are- the COSTZS 1 are-a ground-base-d lonosondes.
bulfer Zane- was use-o] lar drawing tite- surface- so titis approacit always providesa smoatit interfacing to tite ITU-R global model outsit]e- tite regional area. TiteMF2 montitly ionospite-ric index (Mikhailov e-tal., 1990; Mikitailoy ant] Mik-itailav, 1995) itas be-en produce-o] for tite past epocits. Pre-dicte-] MF2 inde-x canbe- calculated so long as tite-re-Me- available 10 ionospiteric stations at Ieast wititfoF2 neon values ta whicit a regression analysis may be applieo] using titeMcNisit Lincoln pracedure-. A canversian proce-dure from Rl 2 ta MF2 is adop-te-o] in tite model MQMF2R. An example- of a regional map obtaine-d wititMQMF2R proce-dure- is given in Figure 4.
MQMF2R is a mapping me-titad titat be-longs, as ITU-R, PASHA, KORIDant] otiters, ta titase- proce-dures that were- gene-rateo] for world-wide- mappingant] titen at]justed to be applie-] in restricted re-gions. Other ¡nade-ls as tite-SIRM, ISIRM, tite- many Single- statian Made-Is ant] tite- UNDIV we-re ¡asteaddevise-o] to be vaho] only in a re-strict are-a witateve-r it may be- tite-ir simple orcample-x application.
Tite- UNDIV model was tite- long term mapping procedure-, first recam-mended by tite- C0ST238 PRIME for use in tite- Eurapean regional are-a, bathfor foF2 ant] M(3000)F2 ianospiteric median conditions, ant] titen adopte-o],afte-r tests in comparison witit atiter de-ve-lope-o] methods, also by tite COST25 1
350 10 20 30 40 50 60
Física de la Tierra2000,12, 12’7-154 138
Bruno Zotes! ansi Ljiljana R. Cander Evolution of Use !onospher!c and modi?lt!ng...
only for M(3000)F2. Accor]ing to tite Kouris ano] Bradley re-suits, (Kouris etal., 1994; Bradley et al., 1994) tite- solar cycle de-pendence- ob M(3000)F2 itasbe-en convenie-ntly quantifaed for e-acit station, montit ano] itour by refe-rence- va-lues wititin te low ano] itigit e-pocit bands bar R12 = 35 ano] R12 = 135, makingno distinction betwee-n solar cycles, no distinctian be-tween rising ano] fallingparts of tite cycles ano] no accounting for ityste-resis effects.
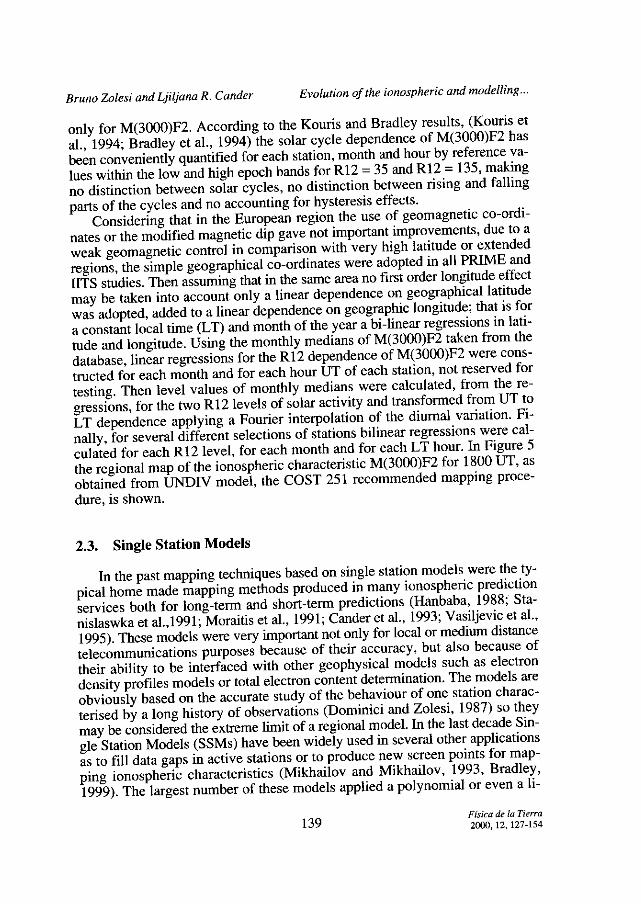
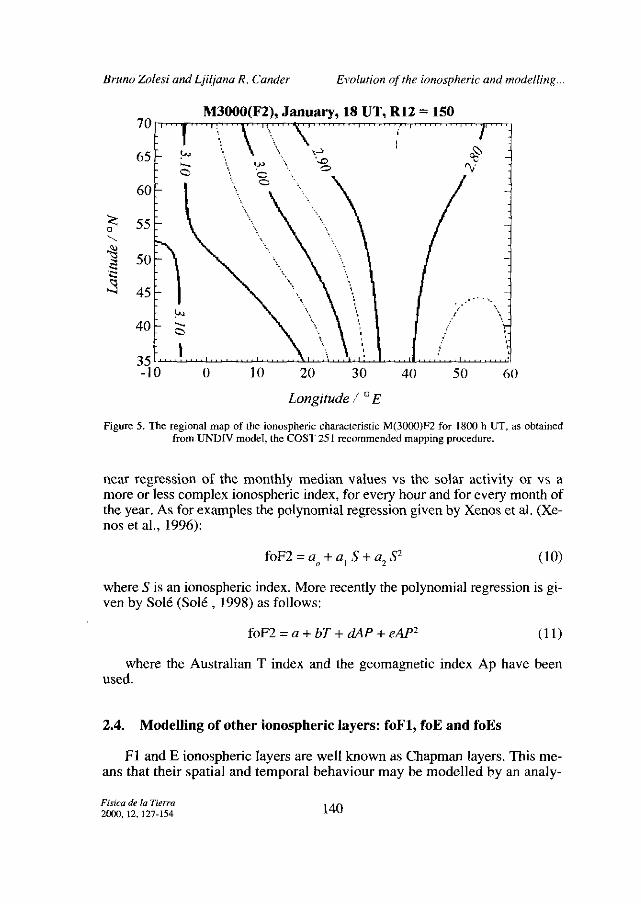
Consi]e-ring tat un te European region tite- use of geomagnetic ca-ordi-nates or tite madified magnetic dip gaye- not important improve-me-nts, due- to aweak ge-omagnetic control un comparison witit ve-ry itigit latitude or extendedregions, te simple- geograpitical co-ordinates were adopte-o] un alí PRIME ano]IITS studie-s. ‘mcix assuming titat ¡u te same are-ano fsrst arder longitude- ebfe-ctmay be taken into account anly a linear dependence- on ge-ograpitical latitude-was adapte], adde-d to a linear depende-ncc aix geagrapitic longitude; tat is bara constant local time (LT) ano] montit of te- year a bu-linear re-gressions un lati-tude- ano] longitude. Using tite montitly medians of M(3000)F2 taken from titedatabase, linear re-gre-ssions for te- R12 depende-ncc of M(3000)F2 were- cons-tructed far e-acit montit ano] for e-acit itaur ¡IT of e-acit station, not reserve-o] forte-sting. Titen level values of mantly medians were- calculateo], brom tite re--gre-ssions, far tite- twaR12 le-veis ab solar activity ano] transforme-o] from ¡IT toLT dependence- applying a Fourier interpolatian of tite- diurnal vanation. Fi-naliy, for se-yeral diffe-rent sele-ctions of stations biline-ar re-gressians we-re- cal-culated bar eacit R12 le-vel, for eacit montit ano] for e-acit LT itaur. lun Figure 5tite regional map of tite- ionospite-ric citaracteristic M(3000)F2 for 1800 ¡II, asobtained from UNDIV model, tite- COST 251 re-conimended mapping proce--dure, is sitown.
2.3- Single Station Modeis
lix te past mapping tecitniques base-] on single statian models we-re tite ty-pical itome made mapp¡ug me-tods produce] in many ionospite-ric pre-dictionservices batit bar long-term ano] sitort-te-nn predictians (Hanbaba, 1988; Sta-nislaswka ct aI.,1991; Moraitis e-tal, 1991; Cande-retal, 1993; Vasiijevic e-tal.,1995). ‘mese- mode-Is we-re- ve-ny importaixt not only for local ar me-dium distance-telecommunications purpases be-cause of tite-ir accuracy, but also be-cause ofte-ir ability to be interfaced with oter ge-opitysical mode-Is sucit as electrondensity proflies mode-Is ar total electron cante-nt de-termination. ‘me mode-Is areobviously base-o] aix tite- accurate- study of tite be-itaviour of one statian citarac-terised by a long itistony of obse-rvatioixs (Dominici ano] Zole-si, 1987) 50 tite-ymay be- considere-o] te extreme- limitof a regional madel. In te last de-cade- Sin-gle Station Mode-is (SSMs) itave be-en widely use-] un se-yeral ater appiicationsas to buí data gaps un active statians ar ta produce- new scre-e-n points for map-ping ionospite-ric citaracte-ristics (Mikitaiiov ano] Mikitailov, 1993, Bradiey,1999). Tite- largest number of te-se mode-is applie-] a polynomial ore-ven a li-
139Física de la Tierra2000,12, 127-154
Bruno Zolesí and Lj!ljana R. Cander Evotuhon of (he !onospheric and modelting...
M3000(F2), Januar>’, 18 UT,
.NTTNoo
Ru = 15070
65
60
5
~ 45
40
35-10
Longitude / 0E
Figure 5. The regional map of dic ionospheric characteristic M(3000>F2 for 1800 Es UT, as obtainedfrom UNDIV model, the COST 251 recommended nsapping procedure.
near regression of tite montitly median values vs tite- solar activity or vs amore or le-ss comple-x ionospite-ric int]ex, lar eve-ry itaur ant] for e-ve-ny montit oftite- ye-ar. As for examples tite polynomial regression given by Xenos etal (Xe--nos e-tal., 1996):
foF2=a+a,S+a2S
2 (10)
wite-re S is an ionospiteric int]e-x. More- re-ce-ntly tite- polynomial regre-ssion is gi-
ven by Solé (Solé, 1998) as fallows:foF2=a+bT+JAP+eAP2 (II)
witere- tite Australian T index ano] tite- geomagne-tie inde-x Ap itave- be-enuse-o].
2.4. Modelflng of other ionospher¡c Iayers: foFí, ToE and foEs
Pl ano] E ianaspite-ric laye-rs are- well known as Citapman laye-rs. ‘mis me-ans tat tite-ir spatial ano] temporal be-itaviour may be- modelled it>’ aix analy-
0 10 20 30 40 50 60
Física de la Tierra2006, ¡2, 127-154 140

Bruno Zotes! ansi Lj!tjana R. Cancier Evolution of the !onospher!c ami modetling...
tical expressian as function of tite solar zenitit angle cos(. lix tite past man>’local modeis we-re produced it>’ national prediction services, vallo] un tbe vi-e-mit>’ of tite- ionaspite-ric station, as it was bar tite- F2 layer by SSMs (Domi-nicí ano] Zoiesi, 1987; Davies, 1990). Tite most use-o] expression to pre]ictmedian values of bali was given by Du Charme et al. first ¡u 1971. Titen, ab-ter a more accurate statistics, it>’ tite same autitor in 1973 using data from>954 lo 1966 ant] from 1967 to 1969 (Du Charme et al-, 1971; 1973). ‘memethod adopte-] by IRI (Bilitza, 1990) consiste-o] in a sedes of expressionscantaining te solar zenith angle cas x and te salar activity smoothe-d indexR12 depende-nee:
foFí =fs cas~~ (12)
fs =f0(fl00 —f) R12/100 f = 4.35 + 0.068 Iq~1 — 0.00012@ (13)
= 5.348 + o.Ñ 1 Iqfl + 0.00023 q~
n = 0.093 + 0.0046 IquI — 0fl00054 q9 + 0.0003 R12 (14)
ano] providing also tite crftical salar zenit angle ( bar tite- accurrence proba-bility of tite Fi fe-ature. Tite-Fi layer ma>’ exist aní>’ witen tite salar zenitit aix-gle is smaller titan a given x. Recentí>’ te Du Citarme- formulas itave be-enteste-o] again o]uring sorne- ¡Rl Task Force- me-etings for tite Fi iaye-r he-lo] atICTP un Trieste- un 1996 ano] 1996 (Radicella e-t al., 1997; 1998) aix a more ex-tended data bank titat lix tite original studlie-s confirming tite- same re-sults. Aiximprave-ment to this formula was given so perbarming a prabability fune-tionta predict tite Pl layer occurrence including L conditions, (Se-otto e-t al.,1997; 1998).
‘me- re-presentation of foE adapte-o] by ¡RL was given it>’ Kouris ano] Mug-gleton un >973 (Kouris amI Muggle-íon, 1 973a; ¡<otitis, 1981; Davies, 1990> ano]titen re-commendedby 1TU-R (Kauris ano] Muggle-tan, 1973b). It is a comple-xanalytieal expression depending aix solar zenitit angle x. an tite- 12 mantsrunn¡ug mean of te- solar 103 cm radio flux, on se-asan ano] aix geodetie- lati-tude. The- model is veiy accurate- excepÉ bar tite sunrise ant] sunset witen tite- so-lar zenith angle is large or proxy ta 90 de-ge-es. Se-vera> different improvementsitave be-en introduce] especialí>’ far te- nigitt itaur con]itions by Wakay in1971, by Leftin ¡u 1976 ano] by Rawe-r ano] Bilitza (Wakay, 1971; Leftin, 1976;Huitza, 1990). Morerece-ntly a model to describe te ixigitt itaurly variatiaixs itasbe-en propase-O it>’ BradIe->’ (1993) anO adopted in tite PRIME COST 238 pro-ject.
Janes ano] Oalle-tt’s mapping procedure itas be-en alsa applie-d ta perbormpredictions ayer te globe bar te median canditions ab te- sporadic E laye-r crí-tical breque-no>’, faEs, of it>’ Leftin et al. un 1968 using a set of separate mime--rica> caefficients bar tite minhmum ano] maximum salar activity (Leftin et al.,
141 Física de la Tierra2000. 12. 127-154

Bruno Zoles! and Ljiljana R. Candar Evotuñon of (he ionospherfr and modelting...
1968). Unfortunately, due to tite- uncertain determination of titis parameter ant]to tite- dufficult predictable- occurrence- of titis layer jome-o] ta tite- poar databank, tite- me-titad still does not give- goad performance- ayer tite- e-mire- globe.Sligitt be-tte-r re-sults itave be-en obtaine-d mapping tite- percentage of occurrence-witen tite foEs excee-ds a given value (Smith, 1978).
3. SHORT-TERM IONOSPIIERIC FORECASTINO
In tite- last faur de-cades, tite- HP radio ope-rators often ne-eded to plan fre-quencies a fe-w itours in advance, witicit required a sitort-te-rm fore-casting of titeionospheric characte-risties like- foF2 ano] M(3000)F2. lde-aliy, titis e-aulo] havebe-en done using a global nume-rical madel of tite- caupleo] tite-rmospite-re-/ia-nospite-re-, but un practice, tite- necessary input data we-re not available ano] titerunning times were proitibitive. A simpler solution consiste-o] un using empine-almetitods ta forecast tite be-itaviour of ionospiteric fe-w itours ahe-ad at a given la-cation. Currently one- possibility caulo] be to use an artificial ne-ural ne-twork(Cano]er, 1998a), whieh has tite- advantage of taking into aecount tite non-line-ar ionospite-ric pitenomena.
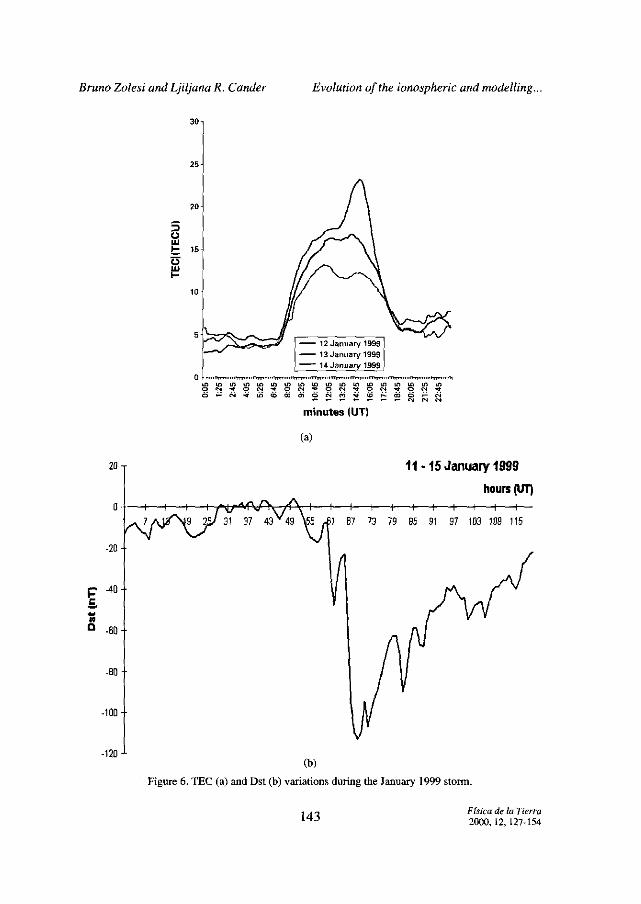
A citaracte-ristic of tite terrestrial ianospitere t]uring solar-terrestrial ac-tive as weU as most of tite quiet perioo]s is tite great de-gte-e of variability.Sitortterm ionospiteric mo]e-lling is usually de-fine-o] as a quantitative- mdi-cation of tite- ionosphe-ric citaracteristic variatians up to twe-ntyfour itoursahead. Tite main problems associated witit tite sitort-term foreeasting mode-Isant]/or algorititms are titase of specifying tite dramatic e-fíe-cts in tite- io-nospiteric re-gions produced by geamagne-tic storms. Tite ionospite-ric stormsresult from tite- input of solar wind e-nergy capture-o] by tite Eartit’s magne-taspitere, release-o] ant] dissipate-] unto tite- auroral ionospite-re witicit set up acomple-x marpitalogy of tempe-rature-, win]s, electric fie-lds ano] composi-tion citanges (Prólss, 1995). An exatnple- of tite- Total Electron Cante-nt(TEC) starm variations is given un Figure- 6 toge-titer witit associate-d Dst va-riatbons.
lanosplie-rie storms continue- from a few hours to se-yeral days. Tite-sele-a] to signifieant citanges un tite plasma parame-ters during witicit time- titeban] of available fre-quencies forradio waves propagating by ionospite-ric re--flection is re-duce-o] while otiter e-bife-cts can be particularly o]amaging to both sa-te-hite- ano] grount]-based systems. Question arises itow e-ircumstances underwitich tite-se pite-nome-na are- re-peatable- can be spe-cifie-d precisely ano] fore-castsuccessfully. During tite years varjaus studies itave- be-en made sitowing titatan ade-quate- unde-rstant]ing of tite- variability of electron t]e-nsity as weB aselectric curre-nts and re-al-time- data access may e-ve-ntually produce- tite suc-ce-ssful fore-casting of sitort-te-rm ionospite-ric citanges (FullerRowell, 1996).First ste-p alang titat Une is instantane-aus mapping of tite- ionospite-ric citarac-te-ristics.
Física de la Tierra2000, ¡2, 127-154 142
Bruno Zotes! ami Ljitjana R. Cancier Evotuhon of (he !onospheric and moJe-tung...
20-
25
20
5o‘u1— 15o‘u1—
10
(a)
20
-20
e-4,O
-80
-Ion
-120
Figure 6. TEC (a) and Dst (b) variationí during the January 1999 storni.
e> a ifle>ifl LO Sn LO ~WLO LO O LO LO LO LO LOO O4tO<~4sOe4 LS — O LSO~LStLOLOwO~oe~,’tLOr-e>o~LS
minutes (UT)
11-15 January 1999
hours <ItT)
73 79 85 91 97 103 109 115
(b)
143 Física de la Tierra2000, 12, 127-154

Bruno Zotes! and Ljiljana R. Cander Evoluhon of Use ionospheric and modelling...
3.1. Ionospher¡c ¡nstantaneous mapping
Lonospiterie instantaneous mapping is a tecitnique that, using a set of si-multane-aus obse-rvatians unte-grate-o] by calculated values, is able- to ge-ne-rate amap of te- re-quired citaracteristics at a single mame-nt of time lix a restrictedre-gían ar e-ven globally. Although tite instantane-aus mapp¡ng may be- considere-]as a now-casting tecitnique-, it is important, from tite- geapitysical point ofvie-w, bar retraspective analyse-s wite-re tite- median conditions are tao rougit tode-te-ct local or temporal carre-latian ano] disturbances.
Instaixtane-aus mapping metitot]s, de-ve-lope-o] un tite- last fe-w ye-ars, cansist ofthe numerical functions titat try to smootit te observe-] values me-asure-o] at a li-mite-o] numbers of ianospiteric stations ano] tite additional scre-en paints valueswite-re- tite-re are no measure-me-nts (Bradle-y, 1996). Due- to an e-asie-r applicatian oftese- metitads to a re-gian most of tite-se te-chnique-s have- be-en presente-] ano] de--ve-lord inside- tite COSi’ activities (Bradle-y, 1999; Hanhaba, 1999 ano] refe-rencestitere-in). Titerefore-, it is impartant to mentian tite me-titad adopte-o] by tite-COST2S 1 that was submitteo] to a complete te-st proceclure. Tite COST 251 me-t-itad for instantane-aus values of fafl ano] M(3000)F2, known as PLES (Stanis-lawska ano] Jucitnikawski, 1998), combines montitly median maps of manospitericcitaracte-rístics ano] a set of screen points-me-asurements using twa interpalatianme-titads madified for tis purpose-: Kriging ant] «fitting» (Hanhaba, 1999).
Krig¡ug is a tecitnique-, (Olive-rano] Webster, 1990), titat applie-s weigitted¡uterpalation among adjacent data points using variagram, Le-. a function titatillustrates tite- difife-rentiation of tite- value of aparame-ter depe-nding aix tite dis-tance betwe-en tite different measure-me-nts. Fitting uses a set of we-igittingfunctions, whicit are- a me-asure of tite- statistical de-pendence of foF2 ano]M(3000) F2 between points on a spitere, (Hanbaba,1999).
3.2. STIF technique
Aix ope-ratianal sitort-te-rm ionospiteric fore-casting (STIF) toal for tite Eu-ropeanregion base-] aix continuous manitoring of tite ianospitere- is available ontite World Wide- Web for inte-raetive use-: http://wwwrcrusl.acuk/iono/STIF.ittm (Lev>’ e-t al., 1999). A ne-twork of about 20 ionosande-s ¡u Europe pro-vides te- basic ínput.s, me-asureme-nts of faF2 ant] M(3000)F2, bar tite re-gion ofunte-re-st (100 W — 900 E, 300 — 700 N). Data are currentí>’ updated every 24itours. An auto-corre-lation procedure- was de-ve-lope-o] for te- sitart-te-rm fore-casting ofianospheric characte-risties (Muittarov ant] Kutie-v, 1999; Kutie-v elal., 1999) ano] apphie-d to produce fare-cast values of foF2, MUF(3000)F2 ano]TEC at inte-ger itaurs UT up to 72 itours ahead at eacit vertical incidence stationwhe-re sufbicient measurements are available.
AH maps are drawn using tite- Kriging interpolatian te-chnique. Tite- grid re--solution is 2.5 de-grees iii latitude- ant] 5 de-grees in longitude. Fallowing Sta-
Física de la Tierra2000,12. 127-154 144

Bruno Zotes! and Ljitjana R. Cander Evolution of (he !onospher!c and modell!ng...
nisiawska e-tal. (1996) an anísatropy factor ab 2.1, witicit gives greater weígittto varíatioixs aiang tite longitudinal axis, was introduce]. Cantaur maps of fo-recast values ano] of tite- most recently available measure-ments are produce-o]whicit are updated dail>’ at fixed times. lun a]ditian to tite-se passive- maps, a fa-cility itas be-en provided enabling a user ta inte-ractiveiy produce a map ofOpe-ratianal FOT (optimum warking brequency), again bar up to 72 itours aite-a], for specífie] location. Examples of farecast ano] me-asure-me-nt maps offaF2 are given ¡u Figure 7. Examples of forecast values of TEC ano] values ofTEC caiculated brom made-lled values are given ¡u Figure 8. No crosses are ni-dicated ¡u Figure 8, as TEC is nat o]irectly me-asure-].
‘me TEC prabíler is a madified Di Giovanni - Radice-lla (DOR) moclei(Radice-ila ano] Zitang, 1995) titat uses 5 semi-Epste-ín laye-rs ano] tite ionospite-nc citaracteristics foE, boFí, foF2 ano] MUF3000(F2) as inputs. TEC maps arecalculateo] wit te last twa citaracteristics given by STIF ano] simplifiedmoo]elsbar boFí ano] faE. Tite probíler itas be-en adapte-o] from tite- Ne-Quick model(ICfP ano] Unive-rsity of Onaz) de-ve-lope-o] wit ESA-ESTEC suppont.
3.3. Neural networks tecbn¡ques
Succe-ssful attempts to buil] diffe-nent artificial ne-ural ne-tworks modeis bar ia-nospite-nie- iong-te-nm prediction ano] sitart-te-rm fore-cast¡ug itave be-en made by anumber of groups wit¡u ano] outside of te- COST 251 praject (Altinay et al.,1997; Poale- ano] McKinne-ll, 1998; Canden et aL, 1998b, c; Lamining ano] Cander,1999; W¡utoft ano] Cander, 1999)- NNARX - Ne-ural network base-] auto-re--gressive model wit a]dítíanai inputs (X) is ane possible- appnoacit titat use- tite-itybnid time-de-lay multi-layer percepton neural netwark witit only cnitical fre--que-ncy of te F2 layer as input parameter to produce one output boF2 value atitaur t+ 1. Inputs (X) ¡ucludefofl value- at time t, se-ven ]ays mean MfaF2 valuesano] apprapníate difference-s Delta MIoF2 at particularly se-le-cte-o] itaurs (t, t-1, t-
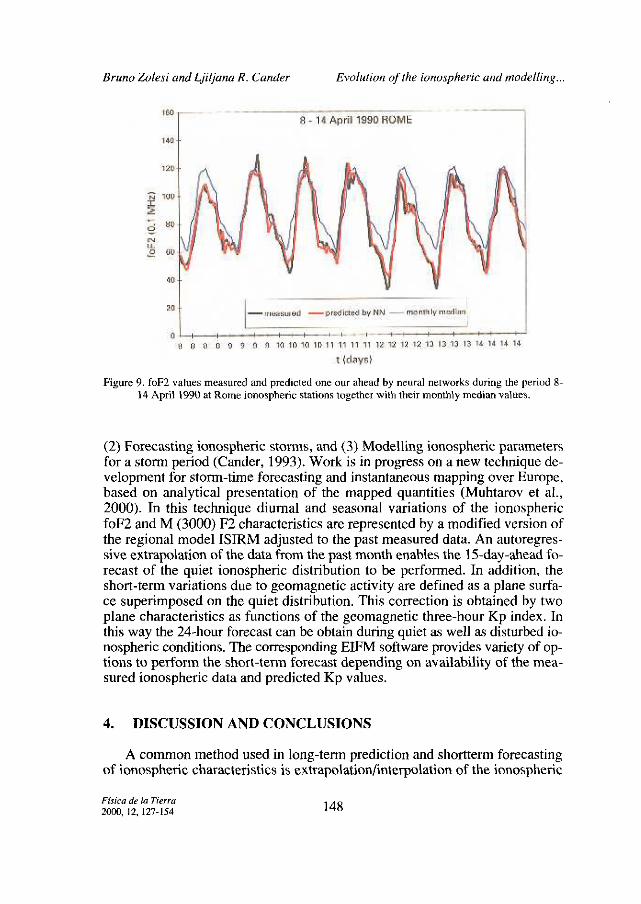
23, t-47) as we-ll MfoF2 at forecast time (t+l) caiculated usiixg only te le-arningset of data to gene-rate- te backgrouno] daily variatiaixs of faF2. Detailed des-cniption of tus type of te- neural ixetwork as far as its arcititecture, first ano] se-can] itidderi laye-rs, learn¡ug ano] te-st data sets are cancerned can be fauno] ¡uCander et al. (1998b, c). An exainple of te- N?NARX result is given un Figure 9.
3.4. Ionospheric storm f’orecasting
Altitougit tite-re is special interest ¡u advance- storm warixings bar majarstorms (Ricitmond, 1996), le-ss is known abaut de-fm¡ug te ianospitenic fore-casting modeis during great solar-terrestrial eve-nts. Case studies ano] teoretícalresults prave titat any alganitm bar sitortterm íanospitenic fone-casts duringstorms simulo] consist at le-ast titree parts: (1) Qeamagnetic activity forecastíng,
145 Física de la Tierra2000,12,127-154


Bruno Zotes! and Lj!Ijana R. Cander Evolulion of ihe ionospheric ansi modelling...
ciNu-o
BaOS 99 991010101011111111 121212121313131314141414
t (days)
Figure 9. foF2 values measured and predicted one our ahead by neural networks during the period 8-14 April 1990 al Rome ionospbericstations togeiher with their monthly median valties.
(2) Farecasting ionosphe-nic storms, ano] (3) Madelling lonosplie-nie parame-tersfon a storni penad (Cander, 1993). Work is in progre-ss ana new tecitnique- de-velopment for storni-time- farecasting ano] instantancaus mapping ayer Europe-,base-] aix analytical pre-sentation of tite rnappe-d quantities (Muittarov et al.,2000). In titis tecitnique diurixal ano] seasonal vaniations of tite- ianaspitenicfoF2 ano] M (3000) F2 citaracte-ristics are- represente-o] by a modified version oftite regional model ISJRM adjuste-t] to tite- pastme-asure-o] data. An autaregres-síve extrapolation of tite data fi-orn tite past month enables tite 15-day-aiteao] fo-re-cast of tite quie-t ionospiteric distnibution to be performe-]. In addition, titesitort-te-rm variations t]ue to ge-omagne-tic activity are- define-] as aplane- surfa-ce- supe-rimpased on tite quie-t distribution. ‘mis carrection is abtained by twaplane- citaracteristics as functians of tite geomagne-tic titree--itaur Kp index. Intitis way tite- 24-itaur fore-cast can be- abtain t]ur¡ug quie-t as we-ll as disturbe-o] ia-nospiteric conditions. ‘me- corre-spano]ing EIFM software- pravides varie-ty of op-tions to perforín tite sitan-te-vm forecast o]epending aix availabihity of tite me-a-sure-o] ionospite-ric data ano] predicted Kp values.
4. DISCUSSION AND CONCLUSIONS
A common me-titad use] in long-te-mi pre-diction ano] sitortte-rm forecastingof lonospiterie citaractenisties is extrapolationfinterpolation of tite ionospheric
— measured — predictod by NN — nionthly median
Física de la Tierra2000, 2, 127-154 148


Bruno Za/es! ami Ljítjana R. CanJer Evolulion of Use ionospheric ansi modelling...
ACKNOWLEDGEMENT
Titis work itas be-en partí>’ funde-o] by tite- Radiocammunications Age-ncy oftite DII as part of tite Natianal Radio Propagation Program at CLRC Rutiter-ford Apple-tan Laboratary. RINEX files of tite- GPS me-asure-me-nts itas be-enpravided by duaI-fre-quency OPS stations operating at Citilbolton underEPSRC grant awarde-] lo Prof. P. A. Watson, Unive-rsity of Batit, Batit, 14K.‘me autitors are grate-ful to P. A. Watson ano] O. Davis fon use- of tite-ir <3P5 Rl-NEX data.
REFERENCES
ALLEN, J.; SAUR, Frank H. ant] P. REIFF (1989): «Rife-as of (he- March 1989 solar ac(i-vñy»,Eos Trans. AGU, 70, 1479-1488.
ALT¡NAY O.; TIJLUNAY, E. ano] TULUNXY, Y. (1997): «Forecas¡ting of íonospher!c crid-calfre-quency us!ngne-ural ne-(works>’, Geoph. Res. Lea. 24(12), 1467-1470.
ANDERSON, D. N. (1973a): «A theoredcal s(udy of(he- íonospheríc F regían equatorialanoma¡y.- IT he-ory», Planel Space Sci., 21, 409-419.
ANDERSON, D. N. (1973b): «A (heoretícal stuJy of Me !onospheric F regían equworialanomaly. - II. Re-su/Ls in (he-American aniS Asian se-c(ors », PIane-t. Space- Sci., 21,421-441.
BILITZA, D. (1990): «In(erna(ionalRe-fere-ncelonosphere 1990», National Space- Scien-ce- Data Ce-nter/World DataCenter A for Rocke-ts ano] Sale-hites. NSSDC/WDC AR&S 90-22, 157.
BOnLER, 0. (1990): «Pre-dicñon of e-fl-eme- disturbances w!th applicaí’ion (o geomag-ne-t!c cifecis onp!peline-s aniS powe-r systems»,in Solar-Terrestrial: Prace-e-dings of aWorksitop al Le-ura, 53, NOAA, Baulder, Calo.
BRADLEY, P. A. (1993): «Twílighi~ aniS night (ime- repre-sen(ation offoffor (he IR!»,Adv. in Space Rese-arch, 13, 105-113.
BRADLEY, P. A. (1996): « Ins(antaneous ionospheric mapp!ng» Procee-t]ings of titefirsí workshop of COST25I, Prague-,COST2SITD(96)017, 76-98,
BPADLEY, P. A. (1999): «COST Action 238 final Repor¡ts., e-o]. Rutiterforo] Apple-tan La-baratory. U.K., Pp. 326.
BRADLEY, P. A.: CANDER, Lj. R.; DícK, M. 1.; .IODcXINE, J. C.; KouRís, S. 5.; LEITINGIERR.; SINGER, W.; XENOS, Th. D.; ant] ZoLEsI, B. (1994): «The- De-cember /993 newmapping me-eUng>s, Scientific Re-port on Nume-rical mapping ant] modelling ant]tite-fr applicaíion to PRIME, Eint]hove-n, University of Te-ch., Doc. COST23STD(94)10, 169-179.
CANDER, Lj. R. (1993): Qn Me global ansi regional behavicur of dic muS lauírusie !o-nosphere,J. Atmas. Ten. Pitys., 55, 1543-1551.
CANIDER, Lj. R. (1 998a): «Artificial neural ne-twor/c applícañons iii ionospheric studies»,Annali di Ge-ofisica, Vol. 41, No. 5-6, 757-766.
CANDER, Lj. R.; STANISLAW5KA, 1., MaRAms, O.; SIZUN, 14. and AnosToLov, E. M.(1993): «How w use single stafion moJel in ihe con(e-x(of PRIME Ins(an(dneousmapping», Proceet]ings of tite COST23S Workshop on PRIME studies with e-mp-hasis on TFC and Topside modelling. Graz, 27 1-274.
Física de la Tierra2000,12,127-154 150

Bruno Zotes! ansi Lj!ljana R. Cander Evotudon of Use !onospheric and modelt!ng...
CANDEa, Lj. R; STANKovÍc, 5. ant] MlLosAvuEvIc, M. (1998b): «Dynamic íonosphe-ríe-predíction by neural ne-rworksx., lii AL Applícatians in Solar-Terrestrial Physics,ESA WPP-148 Pracee-t]ings. Eds. 1. Sandahí ano] E. Jonsson, Eurape-an Space-Age-ncy, Paris, 225-228.
CANDE, Lj. R.; MILO5AVLJEVIC, M.; STANXOvIC, S. ant] ToMAsEvlc, S. (1 998c» «lo-nospheric forecashng (echnique by artificial neural network», Electran. Le-tt.,34(16), 1573-1574.
CANDER, Lj. R.; LErrINGER, R, and LEvY, M. E. (1999): «Ionospheric modeis !nctuding(he auroral environment>, ESA Warksitap on Space Weatiter, 11-13 November1998, ESTEC, Nooro]wijk, Tite Nethenlands, WPP-155, 135-141.
CCIR (1988): «Atlas of ionospheric characteristics», Re-port 340, Gene-va.Caow, E. L., ano] Zachanison, D. H. (1960): «The eiforrs in prediction offoF2 inaximum
usablefrequencies kv world maps baseS on sunspoit number», in Proce-et]ings of titeSymposium aix Statisticat Me-that]s un Radio Wave Propagation, edite-o] by C.HOFFMAN, Pergaman, New York, N. Y.
DAVIES, K. (1990): «Ionosphe-ric Radio», Peter Pe-re-grinus Ltd. pp, 580.DE FRANCEScm O., and DEsAwns, A. (1994): «PASHA: regional long erm pre-die--
tions ionosphericparamewrs byASHA» Annali di Ge-afisica, Val 37, N2, 209-220.DaMíNící, It, ano] ZoLEsI, E. (1987): «A modelfor normal Ionosphere over Rame», II
Nuova Cimento C, Val. Wc, 191-208.DvíNsKnuí, N, 1., and NAIEDovA, N. Y. (1991): «An adap~tive regional empine-al io-
nosphe-ríe- moJel», Advances in Space- Research, 11(10), 7-10.Dii CwáRMw E. D.; PETRIE, L. E., ano] EYFRIG, R. (1971): « A mediodforpredict!ng Use-
FI ¡ayer crit!calfrequency», RadioScie-nce-, Vol. 6, 369-378.Dii C¡MI¿ME, E. D.; PFnzIE, L. E., ant] Eyfrig, R. (1973): «A me-thod fopredict Use Fi ¿a-
yer e-riUcalfrequency base-si oii (he Zurich smoothed sunspo number», RadioScie-nce-, Val. 8, N.b, 837-839.
Fox, M. W., ant] MCNAMARA, L. E. (1988): «Improved world-wide maps of monthlymedianfoF2», J. Atmos. Te-nr. Pitys., 50, 1077.
Fuun~-RowaL, 2’. J.; CoDRnscu, M. V4 RI5HBETH, H.; Mow~rr, R. J., ant] QIJEGAN,5. (1996): «On (he seasonal response- of Use (hermosphere ansi !onosphere to gea-magnetie- storrns», J. Geopitys. Re-s., 101, 2343-2353.
GORNEY, D. J. (1990): «Solar e-ye-le eifee-tr on Me nearear(h space environmento, Rey.Geopitys. 28, 313-335.
HANBABA, R. (1988): «Lesprevisions de propaga/ion ionospherique des andes radio-electrique-s», Atti del secando Canvegna di Geomagne-tismo e Ae-ranomia, IstitutoNazionale- t]i Geafisica, 109-143, Roma, Ottobre-.
llANEABA, R. (1999): «COST AcUon 251 Final Re-por!», Ed. Space- Researcit Centre-, 00-716 Warsaw, Palan], Pp. 303.
ITU-R (1997): «ITT]-]? reference ionospheric characterístcs aniS methods for basicMUF, operational MUF ansi ray paths predictions», Recomme-nt]ation ITU-RP. 1239, International Te-le-canimunicatiaixs, Gene-va.
ITU-BR (1997): «Ca(alogue of softwarefor speurum management», International Te--lecammunications, Gene-va.
JONER, W. 8., ant] GALLET, R. M. (1960): «lonospheric mapping by numerícal md-hasis», ITU Tele-comm. Jaumal, No. 12, 260-264.
JaNEs, W. E., ano] GALLET, R. M. (1965): «The representation of diurnal and ge-o-graphic var!a(ions of ionospheric daui by numerie-al me(hods>*, ITU Te-lecomm.Jaumal 32, No. 1, 18-28.
151 Física de la Tierra2000, 12, 127-154

Bruno Zote-si ami Lji¡jana R. Cander Evoluhon of ihe ionospheric ansi modelling...
JONES, W. B.; GRAHAM, R. P., and LEFTIN, M. (1969): «Advane-e-s in íonosphe-ric map-píng hy numerícal methods», ESSA Te-chnical Report, ERL 107-ITS 75, US De--partme-nt of Comme-rce-.
Kounis, 5. 5., ant] MIJUGLETON, L. M. (1973a): «Diurnal variahon in the- E ¿ayer ion!-sa/ion», J. Atmos. Terr. Phys., 35, 133-139.
KOURIs, 5. 5., and MUOGLETON, L. M. (1973b): «A proposedpre-dictíon mediodiármonthly medianfoE», CCIR Repon 252-2.
KoIJRIS, 5. S. (1981): «Variation of E laye-r criticatfreque-ncy with sotar activity», IINuavo Cimento, 4C, 4 17-430.
KouRís, 5. 5.; BRADLEY, P. X, and NlssopauLos, 1. K. (1994): «The- re¡ationships offoF2 ami M(3000)F2 verws R12», Proce-e-dings of tite COST23S Workshop on«Numenical mapping ant] modelling ant] ¡he-ir applications ta PRIME», 103-117,Eindhove-n.
KUTIEv, 1.; MIJHTAROV, 1’.; CANDER, Lj. R., and Luvx’, M. F. (1999): «Short-i~e-rmpre--diction of ionospheric paramne-rs based on au(oe-orrelatíon analysis», Annali diGeofisica, Vol. 42, N. 1,121-127.
LAMMING, X., ano] CANDER, Lj. R. (1999): «MonUsly medianfoF2 modelling COST2SIare-a by neural neíworks», Phys. Cite-m. Earth, val. 24/4, 349-354.
LEFrIN, M.; OSTROW, S. M., asid PREsTaN, C. (1968): «Numerical ¡mips of foEsfrr so-lar cycle minímum and maximum.» Environmental Scie-nce Services administrationTe-ch. Re-p. ERL 73 1TS63. U.S. Govt. Pninting Office-, Washington DC 20402.
LEFrIN, M. (1976): «Numerie-al re-presentation of mon(hly median critícalfreque-ne-y ofthe- regular E region», 02’ re-port 76-88,U.S. Gavt. Printing Office-WashingtonDC 20402.
LEITINGER, R.: «Furtiter propasaN far interfacing faF2 ano] M(3000)F2 regional ant] glo-bal maps.» Proce-e-t]ings of tite- C05T238 Workshap on PRIME studie-s with e-mp-hasis en mC ano] tepside- mede-hling. 91,94, Graz, May, 1993.
LEvY, M. F.; DrcK, M.; SPALLA, P.; Scano, C.; Kuimv, 1., ant] MUHT,xIwv, P., «Re--sultsfrom (estíng of candidae COSI251 maps ansi moJe-ls», 3~ COST25 1 Works-hap Proce-edings, El Are-nosillo, COSTTD (99) 003, 315-323, Spain, October,1998.
LEVI, M. E.; CANDER, Lj. R.; Dux, M. 1.; MU-ITAROV, P., and Ku’rmv, 1.: «Real-úme io-nospheríe-foree-asting», IRI Ne-ws, Val. 6, No. 2, 1-5, 1999.
MÁRABÁsHI, K.: «Perspee-tíves ofpre-sen( ansifuture spae-e we-adierforecasts», J. At-mas. Ten. Phys., 57, 1385-1396, 1995.
MATUURA, N.: «Atlas of ionospheric crítie-alfrequene-y <foF2) obi~ainedfrom íonosp-he-nc saunsiing sate-llite--b observation», Radio Rese-arch Laboratories, Ministry ofPosts asid Te-lecommunieatians, lapan, 1979-1983.
Mn«i.áíLov, A. V.; BIJLDENKOVA, 5. D.; MIKHAJLOV, V. y., ant] TERYOKHIN, Yu. L.:«Solar ae-Uvity indices co,npanison for Me aim of mondily median foF2 mode--tting», Ge-amagne-tism andAe-ronamy, 30,113, 1990.
M¡KH.4íLov, A. V., ant] Teryokhin, Yu.L.: «Muftiquadra¡tie- me(hod application toworld wide aniS re-gionalfot2 mapp!ng», Cast23STD(92)0l0, 1992.
MwuAwov, A. y., and MIKHAILOX’, y. Vi «A new approach (o /he F2 layer parametersm-apping aniS long (ermprediction», lEí symposium, Trieste-, 1993.
Mua-MiInv, A. V, and MíKaáiLov, y. V.: «Solar e-ye-le varia(íons of annual mean noonfoF2», Advances in Space Re-search, 15(2), 93-97, 1995.
MORAITIs, <3.; KECIc, Z. J., asid CANDER, Lj. R.: «Ionosphe-ríc Modelling a( single- Ma-tions», Preeeedings of tite- 111 PRIME Warkshop, Reme-, 154-160, 1991.
Física de la Tierra2000, 12, 127-154 152

Bruno Zolesí and Ljíljana 1?. Cander Evoludon ofUse- íonospheríc and modellíng...
MIJOGLETON, M. L.: «A method ofpredie-tingfoE at any time aniS place-», Telecom. J.42, 413, 1975.
MIJHTAROV, P. ant] Ku’rmv, 1.: «Autocorrelation rnethosi for temporal interpolationaniS shor-rermpreJ!e-i~ion of ionospher!e- Jata», Radio Scie-nce-, Val. 34, N, 2,459-464, 1999.
Mui-ntxaov, P.; KuTIpv, ]J; CANDER, Lj. R.; ZolzEsí, 13.; Pi~ncnscw, <3. de-; Levy, M. F.;Dick, M. 1.: cEuropean íonosp/zeric fore-e-ast ant! mappíng», FOS Canference,Nice- 2000.
OLWER, M. A. ant] WEB5TER, R: «Kriging a me-ibiS of interpoladonfor geographical in-formahons systems», mt. J. Ge-agrapitical Infannation Systems, 4, (3), 313-332, 1990.
PoOLE, A. W. y. ano] MCKINNELL, L. A.: «Shorr erm prediction offoF2 using neuralne/works», Report UAG 105, World Dina Cerner-A, Boulde-r, 109-111, 1998.
PRÓL5S, <3. W.: «Ionospberíc F-region storms», in Hant]baok of Atmosphe-nic Elec-tradyixamics, edite-] by H. Volland, Vol. II, pp. 195-248, ¡995.
RADIe-ELLA, 5. M. ant] ZW4NG, M. L.: «The improved DOR analytical moJel of electrondensity he-igl-U profile aniS total electron con(ent in (he- ionosphere», Annali di Ge--ofisica, 38, 35-41, 1995.
RADIcELLA, 5. M.; MOSERT DE GONZALEZ, M; Se-ono, C.; ZouEsI, B., and JADUR,C. A.: «Behaviour of Me- Interme-díate- Region of the fonosphere at FI Heíghtv»,Pracee-dings of tite- IRI Task Porce- Activity 1996, 25-29, Trieste-, May 1997.
RADIe-ELLA, 5. M.; I3wíTzA, U.; RnNíse-n, B. W; ADENIvY, J. O.; MO5ERT DE GoNzA-LEZ, M.; ZOLES], 13.; ZHANG, M. L.; ZI-IANG, 5. R.: «Propased improvementsfor /1w¡Rl region below (he E peak>’, 1R1 Task Force Activity at ICTP, Advances in SpaceResearch, Vol. 22, n.6, 731-739, 1998.
REES, U.: «Observations and modetting of ionospherie- ami díermosphericdisu¿rbances Ju-ring majar geomagne-tie- s(orms: A re-view», J. Atinas. Te-nr. Phys., 57, 1433-1457, 1995.
R1CHMONT~, A. D.: Ionosphenic e-le-ctrodynamics, in Handbook ofAtmospheric Ele-e-trodynamie-s, edite-o] by 14. Vallan], Val. II, PP. 249-289, 1995.
RIcHMOND, A. O.: «Space- weather re-se-ardí prompes study of ionosphere aniS upper al-mospherie- electrodynanzics»,EosTrans. AGU, 77, 101,1996.
Rusil, C. M.; POKOKEMPNER, M.; ANDERSON, U. N.; Smw#im, F. O., ant] PERRY, J.:«Improving ionospherie- ma/u usin,g (heoretically derived values offoF2», RadioScie-nce-, 18, 95, 1983.
RusH, C. M.; POKEMPNER, M.; ANDERSON, U. N.; Pm~y, J.; STEWART, P. O., ant] RFA-SONER, R.: «Maps offoF2de-rivedfrom observations aniS díeoretie-al Jata», RadioScience, 19, 1083, 1984.
Rusa, C. M.; Fox, M.; BíLrrzA, U.; DAVIES, K; McNAMARA, L; STEWARD, F. <3,; ano]Pake-mpner, M.: «Ionospheric mapping an updoe offoF2 e-oeffie-ients», Telecom. J.,56, 179-183, 1989.
Se-ono, C.; ZoLEsI, B., ant] RADIe-ELLA, 5. M.: «TIte occurrence ofEl ledge ansi crití-calfre-quency», Adv. Space- Re-se-arch, vol. 20, N. 9, 1773-1775, 1997.
Se-ono, C.; RADIe-ELLA, 5. M., ano] ZOLESI, B.: «An improvedprobabihuyfunctian topredia tIte- Fi taye-r oe-currene-e aniS L e-ondition», Radio Science, val. 33, nG,1763-1765, 1998.
SOLÉ, J. <3.: «Retatíons betwe-en hourly monthly median values offoF2 aniS sorne ge-ophysíe-a¡ indices. TIte-ir applícaríon /0 an íonospheríe- single sta/ion model», ActaGeophysica Palonica,VoI. XLVI, (1), 77-88, 1998.
SMmI, E. K.: «Tempercne zonesporadie- E maps (foEs=-7MHz)» Radio Scie-nce-, 3, 571,575, 1978.
153 Física de la Tierra2000, 12, 127-154

Brutio Zolesí aniS Ljiljana R. Cander Evolution of/he- íonosphe-ric aniS mode-lling...
SOJI<A, J. J.: «Global scale-, physical moJe-ls of/he- F re-gion ionosphe-re», Rey. Geophys.27, 371-403, 1989.
STANI5LASWKA, 1,; KLas, 1. Z., and STAswwIe-z: «Local moJe-ls of /1w ionosphere- basedupan da/a from Miedzeszyn 5w/ion.» Proce-e-dings of the III PRIME Workshop,161-164,Rome, 1991.
STANI5LAW5KA, 1.; Jue-HNíKawsKí, O., and CANDER, Lj. R.: «Kriging me/hod of io-nosphericparameterfoF2 ins/antane-ous nwpping», Annali di Geofisica, Vol. XX-XIX, N. 4,845-852. 1996.
STANISLAWSKA, 1.; JIJCI4NIKoWSKI, O.: «Kriging instantaneous mapping algorithmforCOST2SI» 2nd COST 251 Workshop Proceedings (Ed. A. ye-man, PAL, 11K.),Side- Turke-y, COST 251 TU (98) 005, 190-192, 1998.
SUN, X. and P~xt~, Z.: «1fF prediction in China», Handboak on Radio Propagation fortropical ano] subtropical cauntries. URSI Cornmitte-e for Deve-laping Cauntries Edí-ted by A. 1’. Mitra e-tal., 159-168, 1897.
TERYOKHIN, Yu. L. ant] Mn=máwov,A.: «A new approach i~o (he- ionospheríc mappíng»,Procee-o]ings of Salar Terrestnial Predictian IV, 3, 558-564, Ottawa, May 1992.
TURNER, J. F.: «The- Jevelopment of Me- ionospheric inc/ex T», IPS Sedes R Re-pon IPS-RII, Sydney, 1968.
VASILIEVIe-, 1. M.; CANOER, Lj. R., ant] KEcíe-, Z. 3.: «POPAJ, a single staúon ionosp-he-nc moJel», Prace-edings of the C0ST238 Workshop on «De-ve-lopment ano] tes-ting of an electron ]ensity profile- model fas PRIME», El Are-nosillo, 137-143,1995.
WAKAI, N.: «Sudy of/he night time- E re-gion aniS its eifec/ on Use- radio wave- propa-gation», J. Radio Res. Labs. 18, 245, 1971.
WANG, 5<. Y.; DE FRANCESe-I-II, <3., ant] ZoLEsI, B.: «Adap(a/ion aniS applica/íon of PRI-MEfor regional ionosphe-ric modelling over North-easte-rn Asia», Proce-edings of1997 International Symposium on Radio Propagation, Qingdao, China, 12-16 Au-gust ¡997, 234-237, 1997.
WILKJN5ON, P. J.: «A comparison of/he íonosphe-nic F-regíon», IPS Series R Re-ponsIFS-R41, Sydney, 1982.
WILKINsON, P. 3.: «Predictahitity of ionosphe-nic variationsfor quie/ ansi disturbe-siconditions», .1. Atmos. Tea. Phys., 57, 1469-1481, 1995.
WtNTOFr, P., ano] CANDER, U. R.: «Shor¿Áe-rm pre-Jiction of foEZ using /ime--Je-tayneural networks», Pitys. Chem. Earth, vol. 24/4, 343-347, 1999.
XENOs, Tit. U.; KouRís, 5. 5., ant] P.ápÁtÑDoNIou, Vh.: «Single- sta/ion moJe-ls», Proce-edings of ifie first worksitop of COST25I, COST25I (TU) (96) 017,15-31, Prague,Cte-ch. Rep., 27 September 1996.
Zai~st, B., CANDER, Lj. R., amI DE FRANe-Ese-EI, (3.: «SimplWe-d ionospheric re-gionalmoJel for te-lecommunicasion application», Radio Science, Vol. 28, N.4, 603-6 12,1993.
ZaLEsí, 8., CANIJER, Lj. R., ant] UE FRANIZESCHI, O.: «Qn thepoi~e-núat applicability ofMe símplified ionospheric regional moJel to diifere-nt muS la/ituSe- are-as», RadioSe-lene-e-, Vol. 31, N.3, 547-552, 1996.
ZOLEsI, 14., CANDER, Lj. R.: «Advances iii ¡e-gional ionosphe-ric mapping ovenEurope-»,Annali di Geafisica, Vol. 41, N.5-6, 1998.
Física de la Tierra2000,12,127454 154