Variations of the ionospheric parameters and vertical electron ...
12
Variations of the ionospheric parameters and vertical electron density distribution at the northern edge of the EIA from 2010 to 2015 along 95°E and comparison with the IRI-2012 Bitap Raj Kalita ⇑ , Pradip Kumar Bhuyan Center for Atmospheric Studies and Department of Physics, Dibrugarh, Dibrugarh University, Dibrugarh 786004, Assam, India Received 11 May 2016; received in revised form 22 June 2016; accepted 28 June 2016 Abstract The vertical electron density profiles over Dibrugarh (27.5°N, 95°E, 43° dip) a low mid latitude station normally located at the north- ern edge of the EIA for the period of July 2010 till October 2015 are constructed from the measured bottom side profiles and ionosonde- GPS TEC assisted Topside Sounder Model (TSM) topside profiles. The bottom side density profiles are obtained by using POLAN on the manually scaled ionograms. The topside is constructed by the modified ionosonde assisted TSM model (TaP-TSM assisted by POLAN) which is integrated with POLAN for the first time. The reconstructed vertical profile is compared with the IRI predicted density profile and the electron density profile obtained from the COSMIC/FORMOSAT radio occultation measurements over Dibrugarh. The bottom side density profiles are fitted to the IRI bottom side function to obtain best-fit bottom side thickness parameter B0 and shape parameter B1. The temporal and solar activity variation of the B-parameters over Dibrugarh are investigated and compared to those predicted by IRI-2012 model with ABT-2009 option. The bottom side thickness parameter B0 predicted by the IRI model is found to be similar to the B0 measured over Dibrugarh in the night time and the forenoon hours. Differences are observed in the early morning and the afternoon period. The IRI doesn’t reproduce the morning collapse of B0 and overestimates the B0 over Dibrugarh in the after- noon period, particularly in summer and equinox. The IRI model predictions are closest to the measured B0 in the winter of low solar activity. The B0 over Dibrugarh is found to increase by about 15% with solar activity during the period of study encompassing almost the first half of solar cycle 24 but solar activity effect was not observed in the B1 parameter. The topside profile obtained from TaP profiler is thicker than the IRI topside in equinox from afternoon to sunrise period but is similar to the IRI in summer daytime. The differences in the bottom side may be attributed to the non-inclusion of ground measurements from 90°E to 100°E longitude in the ABT-2009 model while differences in the topside could be due the non-uniform longitudinal distribution of topside sounder profiles data and the stronger fountain effect in this longitude. Ó 2016 COSPAR. Published by Elsevier Ltd. All rights reserved. Keywords: IRI; B0; B1; Density profile; TSM; POLAN 1. Introduction The electron density profile of the ionosphere affects the radio transmission systems and the knowledge of the temporal, spatial and solar cycle variation of the profile is critical for reliable functioning of the communication and navigation systems employing radio transmission. The global experimental data on the ionosphere comes from diverse sources and measurement techniques which requires reliability check and standardization. The empiri- cal model International Reference Ionosphere (IRI), a joint project of International Union of Radio Science (URSI) and Committee on Space Research (COSPAR) is the http://dx.doi.org/10.1016/j.asr.2016.06.041 0273-1177/Ó 2016 COSPAR. Published by Elsevier Ltd. All rights reserved. ⇑ Corresponding author. E-mail address: [email protected] (B.R. Kalita). www.elsevier.com/locate/asr Available online at www.sciencedirect.com ScienceDirect Advances in Space Research xxx (2016) xxx–xxx Please cite this article in press as: Kalita, B.R., Bhuyan, P.K. Variations of the ionospheric parameters and vertical electron density distribution at the northern edge of the EIA from 2010 to 2015 along 95°E and comparison with the IRI-2012. Adv. Space Res. (2016), http://dx.doi.org/ 10.1016/j.asr.2016.06.041
-
Upload
khangminh22 -
Category
Documents
-
view
1 -
download
0
Transcript of Variations of the ionospheric parameters and vertical electron ...

Available online at www.sciencedirect.com
www.elsevier.com/locate/asr
ScienceDirect
Advances in Space Research xxx (2016) xxx–xxx
Variations of the ionospheric parameters and vertical electrondensity distribution at the northern edge of the EIA from 2010
to 2015 along 95�E and comparison with the IRI-2012
Bitap Raj Kalita ⇑, Pradip Kumar Bhuyan
Center for Atmospheric Studies and Department of Physics, Dibrugarh, Dibrugarh University, Dibrugarh 786004, Assam, India
Received 11 May 2016; received in revised form 22 June 2016; accepted 28 June 2016
Abstract
The vertical electron density profiles over Dibrugarh (27.5�N, 95�E, 43� dip) a low mid latitude station normally located at the north-ern edge of the EIA for the period of July 2010 till October 2015 are constructed from the measured bottom side profiles and ionosonde-GPS TEC assisted Topside Sounder Model (TSM) topside profiles. The bottom side density profiles are obtained by using POLAN onthe manually scaled ionograms. The topside is constructed by the modified ionosonde assisted TSM model (TaP-TSM assisted byPOLAN) which is integrated with POLAN for the first time. The reconstructed vertical profile is compared with the IRI predicted densityprofile and the electron density profile obtained from the COSMIC/FORMOSAT radio occultation measurements over Dibrugarh. Thebottom side density profiles are fitted to the IRI bottom side function to obtain best-fit bottom side thickness parameter B0 and shapeparameter B1. The temporal and solar activity variation of the B-parameters over Dibrugarh are investigated and compared to thosepredicted by IRI-2012 model with ABT-2009 option. The bottom side thickness parameter B0 predicted by the IRI model is foundto be similar to the B0 measured over Dibrugarh in the night time and the forenoon hours. Differences are observed in the early morningand the afternoon period. The IRI doesn’t reproduce the morning collapse of B0 and overestimates the B0 over Dibrugarh in the after-noon period, particularly in summer and equinox. The IRI model predictions are closest to the measured B0 in the winter of low solaractivity. The B0 over Dibrugarh is found to increase by about 15% with solar activity during the period of study encompassing almost thefirst half of solar cycle 24 but solar activity effect was not observed in the B1 parameter. The topside profile obtained from TaP profiler isthicker than the IRI topside in equinox from afternoon to sunrise period but is similar to the IRI in summer daytime. The differences inthe bottom side may be attributed to the non-inclusion of ground measurements from 90�E to 100�E longitude in the ABT-2009 modelwhile differences in the topside could be due the non-uniform longitudinal distribution of topside sounder profiles data and the strongerfountain effect in this longitude.� 2016 COSPAR. Published by Elsevier Ltd. All rights reserved.
Keywords: IRI; B0; B1; Density profile; TSM; POLAN
1. Introduction
The electron density profile of the ionosphere affectsthe radio transmission systems and the knowledge of thetemporal, spatial and solar cycle variation of the profile
http://dx.doi.org/10.1016/j.asr.2016.06.041
0273-1177/� 2016 COSPAR. Published by Elsevier Ltd. All rights reserved.
⇑ Corresponding author.E-mail address: [email protected] (B.R. Kalita).
Please cite this article in press as: Kalita, B.R., Bhuyan, P.K. Variations ofthe northern edge of the EIA from 2010 to 2015 along 95�E and compa10.1016/j.asr.2016.06.041
is critical for reliable functioning of the communicationand navigation systems employing radio transmission.The global experimental data on the ionosphere comesfrom diverse sources and measurement techniques whichrequires reliability check and standardization. The empiri-cal model International Reference Ionosphere (IRI), a jointproject of International Union of Radio Science (URSI)and Committee on Space Research (COSPAR) is the
the ionospheric parameters and vertical electron density distribution atrison with the IRI-2012. Adv. Space Res. (2016), http://dx.doi.org/

2 B.R. Kalita, P.K. Bhuyan / Advances in Space Research xxx (2016) xxx–xxx
international standard for ionospheric parameters. TheInternational Reference Ionosphere (IRI) project was initi-ated by COSPAR and URSI in the late sixties with the goalof establishing an international standard for the specifica-tion of ionospheric parameters based on all worldwideavailable data from ground-based as well as satellite obser-vations (Bilitza and Reinisch, 2008). The first version ofIRI was released in 1978 when IRI provided a set of tablesfor typical conditions. The model has been continuouslyupgraded with the addition of new available experimentaldata and modeling approach and resulted in manyimproved version (Bilitza, 1990, 2001a; Bilitza andReinisch, 2008; Bilitza et al., 2014). Currently, the IRI pro-vides monthly mean values of ionospheric parameters aswell as total vertical electron density profile at any locationfor specified solar and magnetic activity. The total verticaldensity profile is generally divided into two parts – theregion up to the maximum density of the F2 layer is calledthe bottom side and the region beyond the height of max-imum is called the top side. The division is mainly becauseof the different physical mechanisms effective in these tworegions. In the IRI, the altitudinal variation of the bottomside electron density of the ionosphere –N(h), particularlyfrom the maximum density of the F2 layer to the F1 layeris described by the following function (Ramakrishnan andRawer, 1972):
NðhÞ ¼ NmF2 expð�xB1ÞCoshðxÞ ; x ¼ hmF2� h
B0ð1Þ
The B1 and B0 are the shape and thickness parametersof the profile which together with the maximum F2 layerdensity NmF2 and the height of the maximum densityhmF2 completely specify the bottom side density profilein the IRI model. Unlike the topside of the ionosphere,where density profile measurements are scarce, the bottomside of the ionosphere is constantly monitored by globalnetwork of ionosondes. The ionograms recorded byionosondes can be inverted by profile inversion techniquesand software (POLAN, NHPC) to obtain the altitudinalvariation of electron density with real height up to the max-imum of the F2 layer. Based on these measurements andmodeling approach, the current version of IRI 2012 pro-vides three options for B1 and B0 values- Gul-1987(Gulyaeva, 1987), Bil-2000 (Bilitza et al., 2000) and ABT-2009 (Altadill et al., 2009). Using these values the bottomside electron density at any location can be estimated fromfunction 1. The large number of studies carried out so farto test and validate the B1 and B0 models have shownthe short comings of the IRI model options Gul-1987and Bil-2000, particularly in the equatorial and low latituderegion (Chen et al., 2006; Blanch et al., 2007; Zhang et al.,2008;Sethi et al., 2009). The ABT-2009, option based onthe work of Altadill et al. (2009) is yet to be investigatedwidely. The model is based on data from 27 ionosonde sta-tions distributed worldwide from high to low latitudes inboth the hemispheres covering most of the longitudes.
Please cite this article in press as: Kalita, B.R., Bhuyan, P.K. Variations ofthe northern edge of the EIA from 2010 to 2015 along 95�E and compa10.1016/j.asr.2016.06.041
The time series consists of almost the entire solar cycle 23from 1998 to 2006. The only data gap in this model is inthe Indian zone as no station to the west of 109�E longitude(in the northern hemisphere) is included. Another weaknessof the model is the ‘‘zero order approximation” which mayhide the longitudinal effect on the variation of the B0/B1parameters (Altadill et al., 2009).
The widely reported longitudinal variation of the equa-torial ionization anomaly (Sagawa et al., 2005; Immelet al., 2006; Luhr et al., 2008; Scherliess et al., 2008) andother ionospheric parameters like vertical E � B drift (Kilet al., 2007), EEJ (England et al., 2006), neutral composi-tion (Oberheide and Forbes, 2008; He et al., 2010) and tem-perature (Shepherd et al., 2012) etc predicts the strongestcrest of the WN4 structure to be along the 90–100�E longi-tude. Liu et al. (2010) have investigated the longitudinalvariation of B0 and B1 parameters using density profilesfrom COSMIC radio occultation measurements andreported a stable peak in the 100�E longitude in all seasons.The B0 estimation is affected by the NmF2 and hmF2 val-ues both of which show longitudinal structure. Bilitza et al.(2012) have found that the IRI underestimates the hmF2 inthe low latitude region during the deep solar minimum of2007–2008 and that more hmF2 data from low latitudesare required to model hmF2 in the IRI. The IRI topsideprovides three options IRI2001, IRI01-Corr and NeQuick.The NeQuick topside model was developed by S. Radicellaand his collaborators (Radicella and Leitinger, 2001;Coisson et al., 2005; Coı̈sson et al., 2006) and is the defaultoption. The model uses an Epstein-layer function with aheight-dependent thickness parameter which provides asmooth transition from an atomic oxygen dominated iono-sphere just above the F2 layer to a lighter ion dominatedionosphere far above it. The model parameters were deter-mined based on fitting the layer function to ISIS 1, 2 andIntercosmos 19 topside sounder profiles (Bilitza andReinisch, 2008). The longitudinal distribution of these top-side sounder profile data is highly non-uniform (Bilitza,2001b; Kutiev et al., 2006) and the coverage of some longi-tude sectors like the Indian zone along 90–100�E is quiteinadequate. In the absence of regular topside sounder dataand scarce topside profiles, efforts have been made to math-ematically model the topside using Chapman, parabolic,Epstein and vary-Chapman functions. The basic approachis to model the parameters-scale height (fixed and variable)and transition height which provide the shape of the elec-tron density profile in terms of the gradient of electron den-sity and the transition height from atomic oxygendominated region to lighter ion dominated upper topsideregion respectively. The work of Reinisch et al. (2004),Stankov and Jakowski (2006), Kutiev et al. (2006),Kutiev and Marinov (2007), Reinisch et al. (2007),Kutiev et al. (2009), Gulyaeva (2011), Nsumei et al.(2012) and many others have significantly improved ourunderstanding of the topside density profile. Recently theelectron density profiles estimated by the radio occultation(RO) measurements onboard low earth orbiting satellites
the ionospheric parameters and vertical electron density distribution atrison with the IRI-2012. Adv. Space Res. (2016), http://dx.doi.org/
B.R. Kalita, P.K. Bhuyan / Advances in Space Research xxx (2016) xxx–xxx 3
like CHAMP, COSMIC, SAC-C and others such missionshave provided an additional data source for vertical densityprofiles and the topside profile and scale height have beenextracted from RO measurements (Stankov andJakowski, 2006; Liu et al., 2010; Xu et al., 2013; Wanget al., 2015). The topside density profile contributes signif-icantly to the total electron content and the correct predic-tion of topside profile is very important for spacecommunication systems like GNSS.
Therefore, ionosonde and GPS receiver TEC measure-ments are used to reconstruct the vertical electron densityprofile over Dibrugarh (27.5�N, 95�E, 43�N dip) a lowmidlatitude station located in the transition region betweenlow and mid latitudes and within the strongest peak(at 90–100�E) of longitudinal WN4 structure. The iono-grams are used to obtain the bottom side real height pro-files by inversion through POLAN (Titheridge, 1985).The NmF2, hmF2 and B0/B1 parameters are derived fromthese profiles and their diurnal, seasonal, solar activityvariations are investigated. The measured B0 and B1 arecompared with the IRI 2012, ABT-2009 option. A modifiedTopside Sounder Model (Kutiev et al., 2009, 2012) is usedto reconstruct the top side density profile. The TSM isassisted by the POLAN (TaP) and is adjusted by the mea-sured TEC data from the co-located GPS receiver. This isthe first time the TSM model is integrated with POLANoutput to estimate the topside profile and it is calledTSM assisted POLAN or TaP. The vertical electron den-sity profile so obtained with POLAN bottom side andTaP topside is compared with the IRI model density profileas well as the density profile derived from RO measure-ments in the FORMOSAT (COSMIC) satellite. The dataperiod is mainly the first half of the solar cycle 24. Solarcycle 24 is marked by very low solar activity as comparedto previous solar cycles as well as a double peak structure.
2. Data and methodology
The Novatel GPS receiver and the Canadian AdvancedDigital Ionosonde (CADI) were installed in Dibrugarh(27.5�N, 95�E, 43� dip) in 2009 and 2010 respectively withthe aim of studying the ionospheric phenomena in the tran-sition region between low and midlatitude at the crest ofthe longitudinal WN4 structure in 90–100�E. The two sys-tems are in continuous operation since then and recordedslant TEC and ionograms for the ascending and maximumcondition of the solar cycle 24. The present study uses theTEC data and the ionograms from the 10 quietest days(Kp < 3) of the month as given in Kyoto University geo-magnetic data service website (http://wdc.kugi.kyoto-u.ac.jp/) for the period of July 2010 till October 2015. Around15,000 ionograms are manually scaled and analyzed usingPOLAN to obtain the critical frequency of the F2 layerfoF2 or the maximum density NmF2, the height of peakdensity hmF2 and the bottom side real height density
Please cite this article in press as: Kalita, B.R., Bhuyan, P.K. Variations ofthe northern edge of the EIA from 2010 to 2015 along 95�E and compa10.1016/j.asr.2016.06.041
profile. This density profile is least square fitted to Eq. (1)between the two anchor points- (NmF2, hmF2) and(NmF1, hmF1) if F1 layer is observed or to(0.2384 � NmF2, h0.2384) if no F1 layer is observed. Thepoint h0.2384 is the height where the density falls to0.2384NmF2. The process provides the best fit B0, B1parameters and fitting error to estimate the fitting quality.The profiles which resulted in fitting error higher than 5%are discarded. The topside profile is reconstructed by usinga modified Topside Sounder Model (Kutiev et al., 2009,2012) which is a combination of the empirical models oftopside scale height and transition height based on theNe profiles measured by the topside sounders onAlouette-1a,-1b,-1c and -2 and ISIS-1, 2 satellites and ratioof these two (Marinov et al., 2004; Kutiev et al., 2006,2009). The TSM assisted by Digisonde (TaD) model wasoriginally developed for Digisonde (Kutiev et al., 2009)and is adapted in this study to take input from POLAN(TaP) which invert CADI ionograms to bottom side realheight density profile. In addition to the NmF2 andhmF2 (obtained from POLAN), the model uses GPS recei-ver measured TEC data to adjust the topside profile(Kutiev et al., 2012) to fit the measured TEC. TheCOSMIC electron density profiles estimated from Abelinversion of RO measurements are obtained fromCOSMIC Data Analysis and Archive Center (CDAAC)by selecting a latitude–longitude cell of (±3�, ±5�) centeredover Dibrugarh. The COSMIC profiles are not exactly ver-tical profiles and therefore, only the portion of the profilesrelevant to the ionosphere over Dibrugarh is considered forcomparison. Manual inspections of the data are also car-ried out to remove poor quality profiles.
The IRI predictions for the monthly mean value (15th ofeach month) of B0 and B1 are downloaded from the IRI2012 web interface (http://omniweb.gsfc.nasa.gov/vitmo/iri2012_vitmo.html). For obtaining the IRI predicted den-sity profile, the following options were used:
1. CCIR model for F2 layer peak density.2. ABT 2009 model for bottom side parameters B0 and B1.3. Scotto-1997 no L model for F1 occurrence probability.4. NeQuick option for topside profile.5. Measured foF2 and hmF2 over Dibrugarh as input.
3. Results and discussion
The solar activity condition for the period of study isshown in Fig. 1 when average solar activity varied from80 sfu (Solar Flux Unit 10�11 W m�2 Hz�1) to around200 sfu at the maximum of solar cycle 24. The variationsof NmF2 (foF2) and hmF2 affect the estimated bottom sideparameter and therefore the diurnal and seasonal variationof foF2 (NmF2) and hmF2 are briefly discussed in Sec-tion 3.1 before presenting the results for the B0 and B1parameters.
the ionospheric parameters and vertical electron density distribution atrison with the IRI-2012. Adv. Space Res. (2016), http://dx.doi.org/

Fig. 1. The daily solar activity proxy F10.7 cm flux from July 2010 toOctober 2015.
4 B.R. Kalita, P.K. Bhuyan / Advances in Space Research xxx (2016) xxx–xxx
3.1. The diurnal and seasonal variation of foF2 and hmF2
and comparison with IRI-2012
The climatology of NmF2 and hmF2 over Dibrugarhfor the period of 2010–2014 has been recently reported
Fig. 2. The seasonal variation of (i) the measured and (ii) the IRI-2012 foFstandard deviation from the mean.
Please cite this article in press as: Kalita, B.R., Bhuyan, P.K. Variations ofthe northern edge of the EIA from 2010 to 2015 along 95�E and compa10.1016/j.asr.2016.06.041
by Kalita et al. (2015). Fig. 2 shows the average seasonalvariation of the diurnal foF2 variations for the period of2010–2015 and the corresponding IRI-2012 model foF2with CCIR option. The diurnal variation with midday peakis observed in summer, autumn and winter whereas a semi-diurnal variation is observed in spring. Except for springequinox and winter solstice, the model foF2 is close tothe seasonal mean of the measured foF2. The model under-estimates the foF2 from afternoon to sunrise period ofspring and the underestimation is as high as 50% duringpost sunset period. The post sunset (2000 LT) peak inspringtime foF2 observed over Dibrugarh in high solaractivity conditions is comparable to the midday peak andmay be related to the Pre Reversal Enhancements (PRE)of zonal electric field at the equator. The enhanced equato-rial fountain due to PRE in vertical drift around sunsetperiod transports ionization to the low latitudes and causesa secondary enhancement in foF2 over Dibrugarh. In win-ter the IRI overestimates the foF2 around midnight. Insummer and autumn, the IRI slightly overestimates themeasured foF2 in the forenoon period as the model predic-tions are on the upper edge of the data scatter.
Fig. 3 shows the comparison of the seasonal variation ofdiurnal hmF2 over Dibrugarh for the period of 2010–2015with IRI 2012 model predictions. The hmF2 exhibits
2 averaged for the years 2010–2015. The vertical error bars indicate the
the ionospheric parameters and vertical electron density distribution atrison with the IRI-2012. Adv. Space Res. (2016), http://dx.doi.org/

B.R. Kalita, P.K. Bhuyan / Advances in Space Research xxx (2016) xxx–xxx 5
complex diurnal variation with sunrise, midday and nighttime peaks. Except for winter, the hmF2 is higher in themidday period than in the night time. The pre-sunrise spikeand subsequent morning collapse is very prominent acrossall seasons. The midday hmF2 is highest in summer andlowest in winter. In winter the higher values of hmF2 inthe night time as compared to the day time is reminiscentof midlatitude behavior (Mikhailov and Marin, 2001;Ratovsky et al., 2009). Dibrugarh being located in the tran-sition region between low and midlatitude regions, thehmF2 is expected to manifest the effect of both electric fieldand thermospheric meridional winds. Further, in winter thefountain generally rises to lower heights and consequentlythe EIA peak forms closer to the equator. The IRI mostlyunderestimates the hmF2 in the midday period. The modelis not able to replicate the pre sunrise peak in the hmF2. Ingeneral, the IRI daytime and night time peaks are compa-rable in all seasons whereas the measured daytime peak ishigher than the night time peak in summer and vis a versain winter.
3.2. The diurnal and seasonal variation of observed B0 andB1 and comparison with IRI 2012
The diurnal and seasonal variation of the thicknessparameter B0 obtained from fitting of measured bottom
Fig. 3. The seasonal variation of (i) the measured and (ii) the IRI-2012 providethe standard deviation from the mean.
Please cite this article in press as: Kalita, B.R., Bhuyan, P.K. Variations ofthe northern edge of the EIA from 2010 to 2015 along 95�E and compa10.1016/j.asr.2016.06.041
side electron density profiles is shown in Fig. 4. The resultsfor the spring and autumn equinox are grouped together asno significant equinoctial asymmetry was observed. Theresults are shown separately for low and high solar activityin Fig. 4a and b respectively. The period of July 2010 tillAugust 2011 is considered as low solar activity (monthlymean F10.7 � 90 sfu) and the period of September 2011 tillOctober 2015 is considered as high solar activity (monthlymean F10.7 � 150 sfu). From Fig. 4, we observe that themeasured B0 at Dibrugarh exhibit significant seasonaland solar cycle variations. The B0 is largest in summer sol-stice in all solar activity conditions and tend to increasewith solar activity. In all seasons midday B0 values arehigher than night time values. In low solar activity periodof summer and equinox, the B0 increases from midnightto sunrise period and then decreases for a brief periodwhereas the B0 in winter decreases from midnight till sun-rise. Subsequently the B0 increases till pre-noon period todecrease again till sunset hours. In the post sunset period,B0 exhibit weak tendency for enhancement and then satu-rate in the midnight period. In all the seasons, the B0 exhi-bit sharp morning and afternoon collapse and the localtime and the magnitude of the collapse depend on the sea-son. The morning collapse is observed earlier in summeraround 0500–0600 LT whereas it is observed around0700 LT in equinox and winter. The morning collapse in
d hmF2 averaged for the years 2010–2015. The vertical error bars indicate
the ionospheric parameters and vertical electron density distribution atrison with the IRI-2012. Adv. Space Res. (2016), http://dx.doi.org/

Fig. 4. The diurnal and seasonal variations of the measured thickness parameter B0 over Dibrugarh and comparison with the IRI 2012-ABT 2009 for (a)low solar activity and (b) high solar activity conditions.
6 B.R. Kalita, P.K. Bhuyan / Advances in Space Research xxx (2016) xxx–xxx
B0 has been reported earlier (Sethi and Mahajan, 2002; Leiet al., 2004; Chen et al., 2006; Chuo, 2012). The morningcollapse of the B0 is closely related to the pre-sunrise heightrise and subsequent decrease in the hmF2 (Fig. 3). Theafternoon collapse starts earlier in summer than other sea-sons and reaches a plateau around 1600 LT and thenresumes again. In summer, the mean B0 increases frommidnight value of around 70–90 km in the sunrise periodand then collapses to around 60 km in the morning. TheB0 increases from morning to pre-noon period anddecreases from noon to evening. The B0 then increasesagain from evening till around midnight. The diurnal max-imum B0 of seasonal mean (145 km) is observed around1000–1100 LT which coincides with the daytime maximumhmF2 (Fig. 3). The pre-noon peak in diurnal variation ofB0 in summer has been reported earlier (Sethi andMahajan, 2002; Lei et al., 2004). In equinox, the meanB0 increases from midnight value of around 77–95 km inthe sunrise period before falling to 75 km around0700 LT. The diurnal maximum of seasonal mean B0(126 km) is reached around 1100 LT. Therefore the localtime of the diurnal maximum B0 value in summer andequinox may be related the vertical E � B drift which peaksaround this local time (Chandra and Rastogi, 1970; Fejeret al., 1995, 2008). The mean B0 in winter decreases from
Please cite this article in press as: Kalita, B.R., Bhuyan, P.K. Variations ofthe northern edge of the EIA from 2010 to 2015 along 95�E and compa10.1016/j.asr.2016.06.041
midnight value of around 90–60 km in the morning andincreases to diurnal maximum of 111 km around 1300 LT.
In high solar activity period (Fig. 4b), the diurnal andseasonal variation trends are similar to those in low solaractivity period with subtle differences. The morning col-lapse of B0 in this period is observed later as comparedto the case of low solar activity period. The mean B0in summer increases from midnight value of around77–92 km in the sunrise period and then collapses toaround 66 km in the morning. The maximum mean B0 of175 km is observed around 1100 LT after which the meanB0 decreases till sunset. Therefore, with increase of solaractivity the daytime peak in summer is delayed by aboutan hour. In high solar activity period of equinox, the meanB0 changes from 80 km at midnight to 147 km at midday(1100–1200 LT). The peak daytime B0 in summer andequinox shows about 15% increase from low solar activitycondition. The lower increase of B0 with solar activityobserved in this study is in line with moderate solaractivity in the maximum of solar cycle 24. In high solaractivity winter, mean night time value is 100 km and daytime maximum is 118 km and therefore the solar activityeffect is insignificant. In winter the difference between nighttime and the day time B0 is least as compared to the othertwo seasons.
the ionospheric parameters and vertical electron density distribution atrison with the IRI-2012. Adv. Space Res. (2016), http://dx.doi.org/
B.R. Kalita, P.K. Bhuyan / Advances in Space Research xxx (2016) xxx–xxx 7
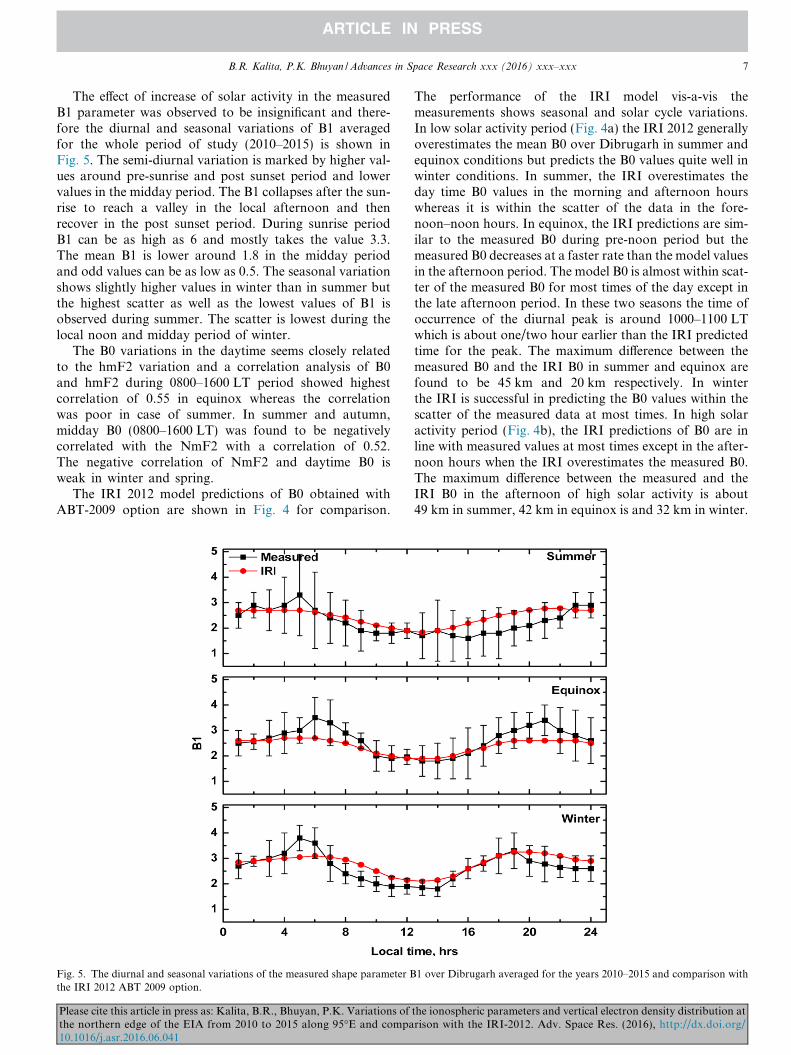
The effect of increase of solar activity in the measuredB1 parameter was observed to be insignificant and there-fore the diurnal and seasonal variations of B1 averagedfor the whole period of study (2010–2015) is shown inFig. 5. The semi-diurnal variation is marked by higher val-ues around pre-sunrise and post sunset period and lowervalues in the midday period. The B1 collapses after the sun-rise to reach a valley in the local afternoon and thenrecover in the post sunset period. During sunrise periodB1 can be as high as 6 and mostly takes the value 3.3.The mean B1 is lower around 1.8 in the midday periodand odd values can be as low as 0.5. The seasonal variationshows slightly higher values in winter than in summer butthe highest scatter as well as the lowest values of B1 isobserved during summer. The scatter is lowest during thelocal noon and midday period of winter.
The B0 variations in the daytime seems closely relatedto the hmF2 variation and a correlation analysis of B0and hmF2 during 0800–1600 LT period showed highestcorrelation of 0.55 in equinox whereas the correlationwas poor in case of summer. In summer and autumn,midday B0 (0800–1600 LT) was found to be negativelycorrelated with the NmF2 with a correlation of 0.52.The negative correlation of NmF2 and daytime B0 isweak in winter and spring.
The IRI 2012 model predictions of B0 obtained withABT-2009 option are shown in Fig. 4 for comparison.
Fig. 5. The diurnal and seasonal variations of the measured shape parameter Bthe IRI 2012 ABT 2009 option.
Please cite this article in press as: Kalita, B.R., Bhuyan, P.K. Variations ofthe northern edge of the EIA from 2010 to 2015 along 95�E and compa10.1016/j.asr.2016.06.041
The performance of the IRI model vis-a-vis themeasurements shows seasonal and solar cycle variations.In low solar activity period (Fig. 4a) the IRI 2012 generallyoverestimates the mean B0 over Dibrugarh in summer andequinox conditions but predicts the B0 values quite well inwinter conditions. In summer, the IRI overestimates theday time B0 values in the morning and afternoon hourswhereas it is within the scatter of the data in the fore-noon–noon hours. In equinox, the IRI predictions are sim-ilar to the measured B0 during pre-noon period but themeasured B0 decreases at a faster rate than the model valuesin the afternoon period. The model B0 is almost within scat-ter of the measured B0 for most times of the day except inthe late afternoon period. In these two seasons the time ofoccurrence of the diurnal peak is around 1000–1100 LTwhich is about one/two hour earlier than the IRI predictedtime for the peak. The maximum difference between themeasured B0 and the IRI B0 in summer and equinox arefound to be 45 km and 20 km respectively. In winterthe IRI is successful in predicting the B0 values within thescatter of the measured data at most times. In high solaractivity period (Fig. 4b), the IRI predictions of B0 are inline with measured values at most times except in the after-noon hours when the IRI overestimates the measured B0.The maximum difference between the measured and theIRI B0 in the afternoon of high solar activity is about49 km in summer, 42 km in equinox is and 32 km in winter.
1 over Dibrugarh averaged for the years 2010–2015 and comparison with
the ionospheric parameters and vertical electron density distribution atrison with the IRI-2012. Adv. Space Res. (2016), http://dx.doi.org/

8 B.R. Kalita, P.K. Bhuyan / Advances in Space Research xxx (2016) xxx–xxx
The IRI 2012 model B1 predictions with ABT-2009option are compared with the measured B1 in Fig. 5. Insummer, the IRI predicted B1 is well within the scatter ofthe measured B1 except in the post sunset period. In equi-nox, the measured B1 is very close to the IRI in the middayperiod but is slightly higher than the IRI in the sunrise per-iod and post sunset period as the measured B1 is consis-tently observed above 2.5. In winter the measured B1 ishigher (lower) than the IRI in the sunrise (forenoon) per-iod. Therefore, the magnitude of the variation of the B1across the sun rise period is very high. The IRI matchesthe measured B1 in the afternoon hours of winter.
The overestimation of the measured B0 by the IRI in theafternoon hours may be related to two factors 1) The ABT-2009 model does not include any low latitude stations inthe Indian zone (77–95�E). The stations closest to Dibru-garh are Wuhan (30.5�N, 114.4�E) and Hainan (19.4�N,109�E) which are to the east of 100�E where Liu et al.(2010) reported a consistent strong peak of midday(1300 ± 2 LT) B0 in the equatorial region which could bedue to the WN4 peak in vertical E � B drift. Many workers(Lin et al., 2007; Liu and Watanabe, 2008; Scherliess et al.,2008; Kalita et al., 2015) have also reported the movementof the longitudinal structure in density, TEC and E � Bdrift etc from the 100�E longitude towards the east in theafternoon period. It may be noted that the magnitude ofthe IRI B0 and the measured B0 are similar in low solaractivity winter when the longitudinal WN4 structure isreported to be weakest (Liu and Watanabe, 2008). There-fore more data from this zone and further study in thisdirection is required to investigate the effect of ionosphericlongitudinal gradient on the B0. 2) The identification of F1layer peak in ionograms by auto scaling software is notreliable and therefore in this study, the profiles in the per-iod of 0800–1700 LT are manually checked for the presenceof F1 layer. The scaled profiles are fitted from the F2 layerpeak to the F1 layer peak for estimating B0 values when-ever the F1 layer exists. This generally results in smallerB0 as compared to the fitting from the F2 layer peak to0.24NmF2 when the profile is normalized to the E layerat 100 km. The presence of F1 ledge over Dibrugarh tilllate afternoon (1600 LT) probably caused the best-fit B0to be smaller than the IRI estimate. This is investigated fur-ther in Section 3.3 by comparing the measured density pro-files with the IRI profiles.
3.3. Comparison of the vertical electron density profile withthe IRI 2012 profile
The vertical electron density profiles reconstructed fromthe POLAN bottom side and the TaP topside were com-pared with those predicted by the IRI with ABT-2009 forbottom side and NeQuick for topside. As the IRI NmF2and hmF2 differs from the measured values at most timesof the day, we provide the measured NmF2 and hmF2from Dibrugarh in the IRI model and the resultant profileis called the IRI-Di (IRI with measured Dibrugarh input)
Please cite this article in press as: Kalita, B.R., Bhuyan, P.K. Variations ofthe northern edge of the EIA from 2010 to 2015 along 95�E and compa10.1016/j.asr.2016.06.041
profile. The comparison of the measured bottom side andTaP topside thickness is more convenient with the IRI-Diprofile.
Fig. 6 shows the results for a sample day in summer con-ditions at four different local times. From the figure, it isobserved that the IRI bottom side profile is similar to themeasured profile in the night time and early morning per-iod but thicker in the midday period. The IRI topside isthicker than the TaP topside in the morning period butthe IRI-Di topside approaches the TaP topside in the day-time. The COSMIC profile in summer is close to the mea-sured bottom side. In equinox (Fig. 7), the IRIunderestimates the NmF2 over Dibrugarh and the IRI-Diis slightly thicker than the measured bottom side in thedaytime. The TaP topside is thicker than the IRI in theafternoon and pre sunrise period. The COSMIC topsidematches the TaP topside in day time but deviates fromTaP topside in the night time. In winter (Fig. 8), the IRI/IRI-Di estimates the bottom side profile correctly at mosttime of the day. The TaP topside is thicker than the IRItopside in the night time but collapses after sunrise and isthinner than the IRI in the morning hours.
Generally the difference between the measured bottomside profile and the IRI profile is observed in the afternoonand the sunrise period. The difference in the afternoon per-iod may be related to the presence of F1 ledge in the mea-sured profile whereas the IRI model for F1 layeroccurrence predicts no F1 ledge or lower hmF1 in the after-noon. It has been previously reported (Lee, 2014) that inIRI-2012 the F1 ledge occurrence probability is lower withScotto-97 no L option and the model height hmF1 is alsolower than the observed values. The TaP profile is generallythicker than the IRI topside except in the morning–fore-noon period when the TaP topside is thinner. The differ-ence between the TaP topside and the IRI in the nighttime shows solar activity variation in summer and equinox(not shown). The TaP topside in the night time is consider-ably thicker than the IRI topside in the low solar activityperiod but the difference is reduced in the high solar activ-ity period. During these hours the TaP topside thickness ishigher than the IRI topside in 90% of the profiles investi-gated whereas in the afternoon hours, the TaP topside isthicker than (same as) the IRI in 60% (40%) of the cases.Marinov et al. (2013) have shown that the empirical scaleheight model of TSM systematically provide lower scaleheight than the Incoherent Scatter Radar model (ISRIM)and therefore predict thicker topside. The relatively thickertopside and significantly higher foF2 (Fig. 2) over Dibru-garh in the afternoon hours hint at the role of the plasmatransport from the equatorial region by the fountain effectdue to stronger E � B drift in the crest region of the longi-tudinal wave structure in vertical E � B drift (Kil et al.,2007). Overall the IRI model profile is closest to theobserved bottom side profile during winter and TaP top-side during summer. The IRI-Di is close to the measuredprofile at most times considering the scatter of the mea-sured profile.
the ionospheric parameters and vertical electron density distribution atrison with the IRI-2012. Adv. Space Res. (2016), http://dx.doi.org/

Fig. 7. The comparison of the vertical electron density profile over Dibrugarh with IRI 2012 (ABT-2009 + NeQuick) and COSMIC in equinox.
Fig. 6. The comparison of the vertical electron density profile over Dibrugarh with IRI 2012 (ABT-2009 + NeQuick) and COSMIC in summer.
B.R. Kalita, P.K. Bhuyan / Advances in Space Research xxx (2016) xxx–xxx 9
Please cite this article in press as: Kalita, B.R., Bhuyan, P.K. Variations of the ionospheric parameters and vertical electron density distribution atthe northern edge of the EIA from 2010 to 2015 along 95�E and comparison with the IRI-2012. Adv. Space Res. (2016), http://dx.doi.org/10.1016/j.asr.2016.06.041

Fig. 8. The comparison of the vertical electron density profile over Dibrugarh with IRI 2012 (ABT-2009 + NeQuick) and COSMIC in winter.
10 B.R. Kalita, P.K. Bhuyan / Advances in Space Research xxx (2016) xxx–xxx
4. Summary and conclusions
The vertical electron density profiles and the bottomside parameters B0/B1 over Dibrugarh a low mid latitudestation for the period of 2010–2015 are presented. Thediurnal, seasonal and solar activity variations of the densityprofile and the B-parameters are compared to those pre-dicted by IRI-2012 and COSMIC radio occultation esti-mated profiles.
The following conclusions can be drawn:
1. The IRI underestimates the foF2 over Dibrugarh fromafternoon to sunrise period of spring equinox. The IRIunderestimates the daytime hmF2 in spring equinoxand summer solstice.
2. The bottom side thickness parameter B0 as predicted bythe ABT-2009 option in IRI 2012 is close to the B0 mea-sured over Dibrugarh only in the night time and theforenoon hours. The IRI overestimates the B0 overDibrugarh in the afternoon hours of summer, equinoxand high solar activity winter. The IRI does not cor-rectly estimate the morning collapse of the hmF2 andB0 observed over Dibrugarh. The IRI model predictionsare closest to the measured B0 in the low solar activitywinter conditions. The COSMIC electron density profilebottom side is nearly same as the ionosonde measuredbottom side.
Please cite this article in press as: Kalita, B.R., Bhuyan, P.K. Variations ofthe northern edge of the EIA from 2010 to 2015 along 95�E and compa10.1016/j.asr.2016.06.041
3. The difference between the model and the measurementsmay be attributed to the lack of data from the Indianzone and 90–100�E longitude in the ABT-2009 model.The role of longitudinal structure in B0 may also be sug-gested and needs to be investigated with multi-stationdata.
4. The measured B0 is found to increase by about 15%from low to moderate solar activity of cycle 24 but solaractivity effect could not be detected in the B1 parameter.
5. The topside density profile is reconstructed with TaPprofiler (TSM assisted by POLAN and adjusted by themeasured TEC data). The TaP topside over Dibrugarhin daytime is generally thicker than the IRI topside inequinox but is almost similar to the IRI in summer. Thiscould be due to dominant role of the fountain effect inthe crest region of WN4 longitudinal structure in verti-cal E � B drift.
6. Overall, the IRI model profile with measured NmF2 andhmF2 input from Dibrugarh approaches the measured-TaP profile.
Further work to fine tune the integration of TSM withPOLAN is being carried out. The measured electron den-sity profile over Dibrugarh may be a useful addition tothe IRI for correct estimation of F2 layer contribution tothe TEC in the low midlatitude region around 100�Elongitude.
the ionospheric parameters and vertical electron density distribution atrison with the IRI-2012. Adv. Space Res. (2016), http://dx.doi.org/

B.R. Kalita, P.K. Bhuyan / Advances in Space Research xxx (2016) xxx–xxx 11
Acknowledgements
The authors would like to thank ISRO for providing thefund for CADI and the Novatel GPS receivers under SSPS.The authors would also like to thank Dr. Pencho Marinovfor providing the TSM model for integration withPOLAN. The authors also thank the CDAAC team forproviding the FORMOSAT-3/COSMIC data.
References
Altadill, D., Torta, J.M., Blanch, E., 2009. Proposal of new models of thebottom-side B0 and B1 parameters for IRI. Adv. Space Res. 43, 1825–1834. http://dx.doi.org/10.1016/j.asr.2008.08.014.
Bilitza, D., 1990. International Reference Ionosphere National SpaceScience Data Center, Report 90-22, Greenbelt, Maryland, USA.
Bilitza, D., 2001a. International reference ionosphere 2000. Radio Sci. 36,261–275. http://dx.doi.org/10.1029/2000RS002432.
Bilitza, D., 2001b. International reference ionosphere (IRI) – Task forceactivity report 2000. IRI News 8 (1/2), 8–15.
Bilitza, D., Reinisch, B.W., 2008. International reference ionosphere 2007:Improvements and new parameters. In: Adv. Space Res 42 (4), 599–609. http://dx.doi.org/10.1016/j.asr.2007.07.048.
Bilitza, D., Radicella, S., Reinisch, B., Adeniyi, J., Mosert, M., Zhang, S.,Obrou, O., 2000. New B0 and B1 models for IRI. Adv. Space Res. 25(1), 89–95.
Bilitza, D., Brown, S.A., Wang, M.Y., Souza, J.R., Roddy, P.A., 2012.Measurements and IRI model predictions during the recent solarminimum. J. Atmos. Solar Terr. Phys. 86, 99–106. http://dx.doi.org/10.1016/j.jastp.2012.06.010, ISSN 1364-6826.
Bilitza, D., Altadill, D., Zhang, Y., Mertens, C., Truhlik, V., et al., 2014.The international reference ionosphere 2012 – A model of interna-tional collaboration. J. Space Weather Space Clim. 4, A07, 2014.
Blanch, E., Arrazola, D., Altadill, D., Buresova, D., Mosert, M., 2007.Improvement of IRI B0, B1 and D1 at mid-latitudes using MARP. In:Adv. Space Res. 39 (5), 701–710, DOI:10.1016/j.asr.2006.08.007..
Chandra, H., Rastogi, E.G., 1970. Daily variation of F-region drifts atThumba. J. Atmos. Terr. Phys. 32 (7), 1309–1311. http://dx.doi.org/10.1016/0021-9169(70)90060-7, ISSN 0021-9169.
Chen, H., Liu, L., Wan, W., Ning, B., Lei, J., 2006. A comparative studyof the bottom side profile parameters over Wuhan with IRI-2001 for1999–2004. Earth Planets Space 58, 601–605.
Chuo, Y.J., 2012. Variations of ionospheric profile parameters duringsolar maximum and comparison with IRI-2007 over Chung-Li,Taiwan. Ann. Geophys. 30, 1249–1257. http://dx.doi.org/10.5194/angeo-30-1249-2012.
Coisson, P., Radicella, S.M., Leitinger, R., Nava, B., 2005. New optionfor IRI topside electron density profile using NeQuick model. IRINewsLetter 12 (1), 2, 2005.
Coı̈sson, P., Radicella, S.M., Leitinger, R., Nava, B., 2006. Topsideelectron density in IRI and NeQuick: features and limitations. Adv.Space Res. 37 (5), 937–942. http://dx.doi.org/10.1016/j.asr.2005.09.015, ISSN 0273-1177.
England, S.L., Maus, S., Immel, T.J., Mende, S.B., 2006. Longitudinalvariation of the E-region electric fields caused by atmospheric tides.Geophys. Res. Lett. 33, L21105. http://dx.doi.org/10.1029/2006GL027465.
Fejer, B.G., de Paula, E.R., Heelis, R.A., Hanson, W.B., 1995. Globalequatorial ionospheric vertical plasma drifts measured by the AE-Esatellite. J. Geophys. Res. 100 (A4), 5769–5776.
Fejer, B.G., Jensen, J.W., Su, S.-Y., 2008. Quiet time equatorial F regionvertical plasma drift model derived from ROCSAT-1 observations. J.Geophys. Res. 113, A05304. http://dx.doi.org/10.1029/2007JA012801.
Gulyaeva, T., 1987. Progress in ionospheric informatics based on electrondensity profile analysis of ionograms. Adv. Space Res. 7 (6), 39–48.
Please cite this article in press as: Kalita, B.R., Bhuyan, P.K. Variations ofthe northern edge of the EIA from 2010 to 2015 along 95�E and compa10.1016/j.asr.2016.06.041
Gulyaeva, T.L., 2011. Storm time behavior of topside scale height inferredfrom the ionosphere–plasmasphere model driven by the F2 layer peakand GPS-TEC observations. Adv. Space Res. 47 (6), 913–920. http://dx.doi.org/10.1016/j.asr.2010.10.025, ISSN 0273-1177.
He, M., Liu, L., Wan, W., Lei, J., Zhao, B., 2010. Longitudinalmodulation of the O/N2column density retrieved from TIMED/GUVImeasurement. Geophys. Res. Lett. 37, L20108. http://dx.doi.org/10.1029/2010GL045105.
Immel, T.J., Sagawa, E., England, S.L., Henderson, S.B., Hagan, M.E.,Mende, S.B., Frey, H.U., Swenson, C.M., Paxton, L.J., 2006. Thecontrol of equatorial ionospheric morphology by atmospheric tides.Geophys. Res. Lett. 33, L15108. http://dx.doi.org/10.1029/2006GL026161.
Kalita, B.R., Bhuyan, P.K., Yoshikawa, A., 2015. NmF2 and hmF2measurements at 95� E and 127� E around the EIA northern crestduring 2010–2014. Earth, Planets and Space 67 (1), 1–22. http://dx.doi.org/10.1186/s40623-015-0355-3.
Kil, H., Oh, S.-J., Kelley, M.C., Paxton, L.J., England, S.L., Talaat, E.,Min, K.-W., Su, S.-Y., 2007. Longitudinal structure of the verticalE� B drift and ion density seen from ROCSAT-1. Geophys. Res. Lett.34, L14110. http://dx.doi.org/10.1029/2007GL030018.
Kutiev, I., Marinov, P., 2007. Topside sounder model of scale height andtransition height characteristics of the ionosphere. Adv. Space Res. 39(5), 759–766. http://dx.doi.org/10.1016/j.asr.2006.06.013, ISSN 0273-1177.
Kutiev, I., Marinov, P.G., Watanabe, S., 2006. Model of topsideionosphere scale height based on topside sounder data. Adv. SpaceRes. 37 (5), 943–950. http://dx.doi.org/10.1016/j.asr.2005.11.021,ISSN 0273-1177.
Kutiev, I., Marinov, P., Belehaki, A., Reinisch, B., Jakowski, N., 2009.Reconstruction of topside density profile by using the topside soundermodel profiler and digisonde data. Adv. Space Res. 43 (11), 1683–1687. http://dx.doi.org/10.1016/j.asr.2008.08.017, ISSN 0273-1177.
Kutiev, I., Marinov, P., Fidanova, S., Belehaki, A., Tsagouri, I., 2012.Adjustments of the TaD electron density reconstruction model withGNSS TEC parameters for operational application purposes. J. SpaceWeather Space Clim. 2, A21.
Lee, C.C., 2014. Observed and predicted characteristics of equatorial F1layer during solar minimum. Ann. Geophys. 32, 571–580. http://dx.doi.org/10.5194/angeo-32-571-2014.
Lei, J., Liu, L., Wan, W., Zhang, S.R., Holt, J.M., 2004. A statistical studyof ionospheric profile parameters derived from Millstone Hill inco-herent scatter radar measurements. Geophys. Res. Lett. 31, L14804.http://dx.doi.org/10.1029/2004GL020578.
Lin, C.H., Hsiao, C.C., Liu, J.Y., Liu, C.H., 2007. Longitudinal structureof the equatorial ionosphere: the evolution of the four peakedstructure. J. Geophys. Res. 112, A12305. http://dx.doi.org/10.1029/2007JA012455.
Liu, H., Watanabe, S., 2008. Seasonal variation of the longitudinalstructure of the equatorial ionosphere: does it reflect tidal influencesfrom below? J. Geophys. Res. 113, A08315. http://dx.doi.org/10.1029/2008JA013027.
Liu, L., Wan, W., Ning, B., Zhang, M., He, M., Yue, X., 2010.Longitudinal behaviors of the IRI-B parameters of the equatorialelectron density profiles retrieved from FORMOSAT-3/COSMICradio occultation measurements. Adv. Space Res. 46 (8), 1064–1069.http://dx.doi.org/10.1016/j.asr.2010.06.005, ISSN 0273-1177.
Luhr, H., Rother, M., Hausler, K., Alken, P., Maus, S., 2008. Influence ofnonmigrating tides on the longitudinal variation of the equatorialelectrojet. J. Geophys. Res. 113, A08313. http://dx.doi.org/10.1029/2008JA013064.
Marinov, P., Kutiev, I., Watanabe, S., 2004. Empirical model of O+–H+
transition height based on topside sounder data. Adv. Space Res. 34(9), 2021–2025. http://dx.doi.org/10.1016/j.asr.2004.07.012, ISSN0273-1177.
Marinov, P., Zhang, S., Kutiev, I., 2013. Comparison of topsideionosphere scale height modeled by the Topside Sounder Model and
the ionospheric parameters and vertical electron density distribution atrison with the IRI-2012. Adv. Space Res. (2016), http://dx.doi.org/

12 B.R. Kalita, P.K. Bhuyan / Advances in Space Research xxx (2016) xxx–xxx
incoherent scatter radar ionospheric model. Adv. Space Res. 52 (10),1717–1725. http://dx.doi.org/10.1016/j.asr.2013.03.008, ISSN 0273-1177.
Mikhailov, A.V., Marin, D., 2001. An interpretation of the foF2 andhmF2 long-term trends in the framework of the geomagnetic controlconcept. Ann. Geophys. 19, 733–748.
Nsumei, P., Reinisch, B.W., Huang, X., Bilitza, D., 2012. New Vary-Chapprofile of the topside ionosphere electron density distribution for usewith the IRI model and the GIRO real time data. Radio Sci. 47,RS0L16. http://dx.doi.org/10.1029/2012RS004989.
Oberheide, J., Forbes, J.M., 2008. Thermospheric nitric oxide variabilityinduced by nonmigrating tides. Geophys. Res. Lett. 35, L16814. http://dx.doi.org/10.1029/2008GL034825.
Radicella, S.M., Leitinger, R., 2001. The evolution of the DGR approachto model electron density profiles. Adv. Space Res. 27 (1), 35–40.
Ramakrishnan, S., Rawer, K., 1972. Model Electron Density Profilesobtained by empirical Procedures, Space Research XZZ. Akademie-Verlag, Berlin, pp. 1253–1261.
Ratovsky, K.G., Oinats, A.V., Medvedev, A.V., 2009. Diurnal andseasonal variations of F2 layer characteristics over Irkutsk during thedecrease in solar activity in 2003–2006: Observations and IRI-2001model predictions. Adv. Space Res. 43, 1806–1811.
Reinisch, B.W., Huang, X.-Q., Belehaki, A., Shi, J.K., Zhang, M.-L.,Ilma, R., 2004. Modeling the IRI topside profile using scale heightsfrom ground-based ionosonde measurements. Adv. Space Res. 34 (9),2026–2031. http://dx.doi.org/10.1016/j.asr.2004.06.012, ISSN 0273-1177.
Reinisch, B.W., Nsumei, P., Huang, X., Bilitza, D.K., 2007. Modeling theF2 topside and plasmasphere for IRI using IMAGE/RPI and ISISdata. Adv. Space Res. 39 (5), 731–738. http://dx.doi.org/10.1016/j.asr.2006.05.032, ISSN 0273-1177.
Sagawa, E., Immel, T.J., Frey, H., Mende, S.B., 2005. Longitudinalstructure of the equatorial anomaly in the nighttime ionosphereobserved by IMAGE/FUV. J. Geophys. Res. 110, A11302. http://dx.doi.org/10.1029/2004JA010848.
Please cite this article in press as: Kalita, B.R., Bhuyan, P.K. Variations ofthe northern edge of the EIA from 2010 to 2015 along 95�E and compa10.1016/j.asr.2016.06.041
Scherliess, L., Thompson, D.C., Schunk, R.W., 2008. Longitudinalvariability of low-latitude total electron content: tidal influences. J.Geophys. Res. 113, A01311. http://dx.doi.org/10.1029/2007JA012480.
Sethi, N.K., Mahajan, K.K., 2002. The bottomside parameters B0, B1obtained from incoherent scatter measurements during a solarmaximum and their comparisons with the IRI-2001 model. Ann.Geophys. 20 (6), 817–822.
Sethi, N.K., Dabas, R.S., Bhawre, P., Sarkar, S.K., 2009. Bottomsideprofile shape parameters during low solar activity and comparisonwith IRI-2007 model. J. Atmos. Sol. Terr. Phys. 71, 1935–1942. http://dx.doi.org/10.1016/j.jastp.2009.08.003.
Shepherd, M.G., Shepherd, G.G., Cho, Y.-M., 2012. Longitudinalvariability of thermospheric temperatures from WINDII O(1S)dayglow. J. Geophys. Res. 117, A10302. http://dx.doi.org/10.1029/2012JA017777.
Stankov, S.M., Jakowski, N., 2006. Topside ionospheric scale heightanalysis and modelling based on radio occultation measurements. J.Atmos. Solar Terr. Phys. 68 (2), 134–162. http://dx.doi.org/10.1016/j.jastp.2005.10.003, ISSN 1364-6826.
Titheridge, J., 1985. Ionogram analysis with the generalized programPOLAN, World Data Center Report, UAG-93, WDC-A-STP, Boul-der, CO, 194.
Wang, S., Huang, S., Fang, H., 2015. Topside ionospheric Vary-Chapscale height retrieved from the COSMIC/FORMOSAT-3 data atmidlatitudes. Adv. Space Res. 56 (5), 893–899. http://dx.doi.org/10.1016/j.asr.2015.04.021, ISSN 0273-1177.
Xu, T.L., Jin, H.L., Xu, X., Guo, P., Wang, Y.B., Ping, J.S., 2013.Statistic analysis of the ionospheric topside scale height based onCOSMIC RO measurements. J. Atmos. Solar Terr. Phys. 104, 29–38.http://dx.doi.org/10.1016/j.jastp.2013.07.012, ISSN 1364-6826.
Zhang, M.-L., Wan, W., Liu, L., Shi, J.K., 2008. Variability of thebehavior of the bottomside (B0, B1) parameters obtained from theground-based ionograms at China’s low latitude station. Adv. SpaceRes. 42 (2), 695–702. http://dx.doi.org/10.1016/j.asr.2007.07.022.
the ionospheric parameters and vertical electron density distribution atrison with the IRI-2012. Adv. Space Res. (2016), http://dx.doi.org/