ENVIRONMENTAL IMPACT ASSESSMENT OF ABUNDANT LEAD LANDFILL ON GROUNDWATER AND SOIL QUALITY
Upload
independentCategory
view
2download
0
PRIMARY RESEARCH PAPER
Phytoplankton seasonal and vertical variations in a tropicalshallow reservoir with abundant macrophytes (NinfeiasPond, Brazil)
Barbara M. Fonseca • Carlos E. de Mattos Bicudo
Received: 30 November 2010 / Revised: 2 February 2011 / Accepted: 6 February 2011 / Published online: 22 February 2011
� Springer Science+Business Media B.V. 2011
Abstract This study aimed at analyzing the envi-
ronmental factors which determine the structure and
dynamic of phytoplankton in a shallow reservoir with
abundant macrophyte flora, Ninfeias Pond (Brazil). It
is hypothesized that, although its shallowness, peri-
odic stratifications play an important role on its
phytoplankton community. Water samples were col-
lected monthly, from January to December 1997, in
four depths (sub-surface, 1 m, 2 m, and bottom) of
pelagic zone (Zmax = 3.6 m). Community seasonal
and vertical variations followed a hot-rainy season
with water column stratification (phase 1; Q index:
medium), alternating with a cool-dry season with
water column mixing (phase 2: Q index: excellent).
Nanoplanktonic flagellates dominated, mainly mixo-
trophic species. During phase 1, Chlamydomonas sp.
(G) was the main species, dominating at the anoxic
and nutrient-rich hypolimnion. At the same time,
richness and diversity were relatively lower. During
phase 2, lower water temperatures and higher
dissolved oxygen concentrations favoured the pry-
mnesiophyte Chrysochromulina cf. breviturrita (X2).
Sequence of functional groups over phases 1 and 2
was: phase 1 = G ? transition = Y/P/E/D/F/W2/
X3 ? phase 2 = X2/Lo/X1; most of these groups
have been associated to oligo-mesotrophic systems.
Seasonal stratifications played a decisive role in
determining the structure and dynamic of phyto-
plankton in the Ninfeias Pond. However, in such a
complex and heterogeneous system, other compart-
ments of the food web (macrophytes, zooplankton,
fishes) may also act as relevant driving forces, in
synergy with the physical and chemical environment.
Keywords Community dynamic and structure �Stratification � Functional groups
Introduction
The search for driving factors of phytoplankton
communities in individual lakes and reservoirs is a
recurrent theme in the literature (Lopes et al., 2005;
Fonseca & Bicudo, 2008; Becker et al., 2010). It is
well recognized that mixing patterns and the avail-
ability of light and nutrients act together providing
the favorable habitat template for different algal
assemblages (Reynolds, 1984).
In the last years, phytoplankton studies have been
improved by functional classification approaches that
could be sensitive to environmental change. The
Handling editor: Luigi Naselli-Flores
B. M. Fonseca (&)
Universidade Catolica de Brasılia, Curso de Ciencias
Biologicas (Sala E-10), QS 07, Lote 1, Aguas Claras,
71966-700 Brasılia, DF, Brazil
e-mail: [email protected]
C. E. de Mattos Bicudo
Instituto de Botanica, Nucleo de Pesquisa em Ecologia,
Caixa Postal 3005, 01061-970, Sao Paulo, SP, Brazil
123
Hydrobiologia (2011) 665:229–245
DOI 10.1007/s10750-011-0626-3

functional groups proposed by Reynolds et al. (2002)
and recently updated by Padisak et al. (2009) have
probably been the most cited, considering their
usefulness in synthesizing phytoplankton relation-
ships with environmental variables (Romo & Villena,
2005; Becker et al., 2009; Fonseca & Bicudo, 2010;
Krasznai et al., 2010). It put together species with
similar morphology, ecology, and physiology into
groups named using alphanumerical codes.
Padisak et al. (2006) used the functional groups
approach as the basis for the Assemblage Index, Q, to
assess ecological status of different lake types in
Europe. It combines the weight of functional groups
relative to total biomass with a factor number for
each assemblage. The index, which ranges from 0
(bad quality) to 5 (excellent quality), has already been
used by Crossetti & Bicudo (2008) and by Becker
et al. (2010) in reservoirs from Brazil and Spain,
respectively.
Frequently, cyanobacterial dominated systems get
more attention in limnological literature because of
the usual great interest in eutrophication process and
its immediate ecological and economical conse-
quences (Bicudo et al., 2007; Jeppensen et al.,
2007b). Nevertheless, researches focusing on shallow
lakes with abundant macrophyte vegetation have
been encouraged since the initial publications on the
alternative stable states theory (Scheffer et al., 1993;
Scheffer, 1998), which stated that these lakes repre-
sent the clear-water state due to the positive feedback
between vegetation and water clarity. Since then, that
theory has expanded, with the suggestion that factors
such as lake size, depth and climate affect the critical
nutrient level toward maintaining a clear state
(Scheffer & van Nes, 2007; Jeppensen et al., 2007a;
Kosten et al., 2009).
Shallow lakes’ metabolism is marked by an intense
water–sediment interaction, independent of the pres-
ence of aquatic vegetation. The most usual criterion for
shallowness is the water body lack of any persistent
vertical density segregation. Padisak & Reynolds
(2003) discussed the role of depth in the ecosystem
function and concluded that shallowness of a lake
should be judged primarily on the basis of its ecological
behavior, associated to the nature and distribution of its
biota. In this sense, lakes could be functionally shallow
or deep, regardless of their absolute depth.
Temporal variation in this functional criterion for
shallowness can occur in one very same lake or
reservoir. Fonseca & Bicudo (2008) described, for
instance, the phytoplankton community of a Brazilian
eutrophic shallow reservoir (Garcas Pond), that
persistently stratifies for a few weeks during spring
and summer and concluded that mixing pattern was a
key factor triggering phytoplankton seasonal varia-
tion. Working in the same drainage area, Lopes et al.
(2005) studied the phytoplankton community of a
shallow oligotrophic reservoir with no macrophytes
that shows similar mixing patterns (IAG Pond). Both
ponds are classified as typical polymictic discontin-
uous and have less than 5 m depth.
Ninfeias Pond, marked by small residence time
and abundant submerged and floating macrophyte
flora, is located near the two systems above men-
tioned. Fonseca & Bicudo (2010) is the only
published work about its phytoplankton community.
However, these authors focused on general phyto-
plankton morpho-functional attributes in a compara-
tive analysis between Ninfeias’ phytoplankton and
the algal flora from a eutrophic shallow lake near
that. They did not aim at detailing the autoecology of
main species neither at analyzing vertical variations
of abiotic and biotic variables, which are specific
objectives of this work. We hypothesized that, despite
its shallowness, periodic stratifications in this small
reservoir play an important role in its phytoplankton
community, being the driving force determining its
structure and dynamic.
Study area
Ninfeias Pond (23�38018.9500S and 46�37016.300W) is
located in the PEFI, Parque Estadual das Fontes do
Ipiranga Biological Reserve (526 ha, 798 m.a.s.l.)
situated in the Municipality of Sao Paulo, southeast-
ern Brazil (Fig. 1). Mean annual precipitation is
1,368 mm, mean air temperature of the coldest month
(July) 15�C, and mean temperature of hottest months
(January–February) 21.4–21.6�C (Santos & Funari,
2002). Climate of the area is tropical of altitude
(Conti & Furlan, 2003). Winds are usually of low
intensity (\2.5 m s-1).
Although locally called Ninfeias Pond, the system
is, in fact, a reservoir (Bicudo et al., 2002a). Its
surface area is 5,433 m2, volume 7,170 m3, mean
depth 1.32 m, maximum depth 3.6 m, mean theoret-
ical residence time 7 days (Bicudo et al., 2002a)
230 Hydrobiologia (2011) 665:229–245
123

and is polymictic according to Lewis’ classification
(Bicudo et al., 2002b). Ninfeias Pond has one outlet
and two tributaries that bring clean water from
springs located in the forest around (Fig. 1).
It has an abundant macrophyte flora, including
Utricularia spp., Mayaca fluviatilis Aubland, Nitella
translucens (Persoon) C. Agardh emend. R.D. Wood,
Cyperus papyrus Linnaeus, Hydrocleis nymphoides
(Willdemann) Buch, Nymphaea elegans Hook, Val-
lisneria spiralis Linnaeus, Salvinia herzogii de la Sota
(Moura, 1997). These plants, nowadays dispersed in
more than 90% of the lake area, have probably been
artificially introduced since the reservoir construction,
80 years ago.
Materials and methods
Samplings were performed monthly from January to
December 1997 in four depths (sub-surface, 1 m, 2 m,
and bottom) at the deepest site of the reservoir (3.6 m)
(Fig. 1). The sampling station had no aquatic
vegetation, but was less than 10 m from the littoral
region with abundant macrophytes, in special
Utricularia spp. and Nymphaea elegans.
Water samples (n = 2) were collected with a van
Dorn sampler. Temperature, pH, and conductivity
were measured in the field at every 10 cm depth
using standard electrodes (Yellow Spring Instru-
ments). Water relative thermal resistance (RTR)
was calculated at every 50 cm depth (Dadon, 1995).
Mixing zone (Zmix) was identified through tempera-
ture profiles considering density gradients greater
than 0.02 kg m-3 m-1 (Reynolds, 1984). Euphotic
zone (Zeu) was calculated as being 2.7 times
the Secchi disk extinction depth (Cole, 1983). The
following variables were also measured on the
sampling day: water transparency (Secchi disk),
alkalinity (Golterman & Clymo, 1971), free CO2,
HCO3-, and CO3
2- (Mackereth et al., 1978), dis-
solved oxygen (Winkler modified by Golterman
et al., 1978), ammonium (N-NH4?) (Solorzano,
1969), nitrate (N-NO3-) and nitrite (N-NO2
-)
(Mackereth et al., 1978), soluble reactive phosphorus
Fig. 1 Ninfeias Pond map
with locations of inflows,
outlet and sampling station
(SS) (Bicudo et al., 2002a, b)
Hydrobiologia (2011) 665:229–245 231
123

(SRP) and total dissolved phosphorus (TDP) (Strick-
land & Parsons, 1965), and soluble reactive silicon
(Golterman et al., 1978). Unfiltered samples were
frozen and used for total nitrogen (TN) and total
phosphorus (TP) determinations (Valderrama, 1981)
within at most 30 days from collection date. Nitro-
gen–ammonium concentrations were added to obtain
final TN levels.
Water for chlorophyll a analysis was filtered on
the sampling day. The filters were then stored in
darkened desiccator and immediately frozen. Chlo-
rophyll a analysis corrected for phaeophytin was
carried out at most within a week from the sampling
day using ethanol 90% as an organic solvent (Sartory
& Grobbelaar, 1984). Phytoplankton quantitative
study was carried out according to Utermohl
(1958). Sedimentation time followed Lund et al.
(1958). The number of settling units counted in each
individual sample varied according to species accu-
mulation curve. The same chamber volume (10 ml)
was used throughout the year and at least 40 fields
were counted for each chamber (Rott, 1981).
Biovolume was obtained by geometric approxi-
mations, multiplying each species’ density by the
mean volume of its cells considering, whenever
possible, the mean dimension of 30 individual
specimens of each species (Sun & Liu, 2003).
Phytoplankton functional groups were defined
according to Reynolds et al. (2002) and Padisak
et al. (2009) from species that contributed with at least
5% of the total biovolume in each sample unit. The
assemblage index, Q, was used to assess the Ninfeias
ecological status over the year considering the
following five degrees classification: 0–1 = bad,
1–2 = tolerable, 2–3 = medium, 3–4 = good,
4–5 = excellent. According to Padisak et al. (2006),
this dimensionless index (Q = Rpi�F) includes the
relative share of functional groups in total biomass
(pi) and a factor number (F) pre-determined according
to the existing typology and knowledge and estab-
lished for the i-th functional group in the given lake.
In this study, the biomass component of the index was
calculated for the water column, after arithmetical
integration of biological data (mm3 m-2) from the
four depths sampled. The F factor determined for each
functional group was according to Crossetti & Bicudo
(2008). These authors used the IAG Pond’s phyto-
plankton as the pristine reference, considering that it
is an oligotrophic system located in the same basin
area of Ninfeias Pond. As an example, functional
groups Lo and X3 had F = 5, which means that they
can be found in pristine conditions and are associated
to an excellent ecological status.
Shannon–Wiener Index (H0 = -Rpi�log2 pi) was
used to estimate diversity (Shannon & Weaver,
1949). Spearman rank correlation was used to test
association between abiotic and biological variables.
Multivariate descriptive analysis was carried out by
applying principal component analysis (PCA) to the
abiotic data and chlorophyll a using a covariance
matrix with data transformed by ranging. The
following 16 variables were included in the PCA:
water temperature, pH, conductivity, turbidity, dis-
solved oxygen, alkalinity, free CO2, ammonium,
nitrate, nitrite, total nitrogen, soluble reactive phos-
phorus, total dissolved phosphorus, total phosphorus,
soluble reactive silicon, and chlorophyll a.
For canonical correspondence analysis (CCA),
functional groups biovolume data were transformed
[ffiffiffiffiffiffiffiffiffiffiffiffiffiffiffi
xþ 0:5p
] and Monte Carlo test with 999 permuta-
tions was used to test the hypothesis of no relation-
ship between functional groups and environmental
data. Software used for transformed data was FIT-
OPAC (Shepherd, 1996). PC-ORD version 4.0 for
Windows (McCune & Mefford, 1997) was used for
the analysis. Results were considered significant
when P \ 0.05.
Results
Abiotic variables
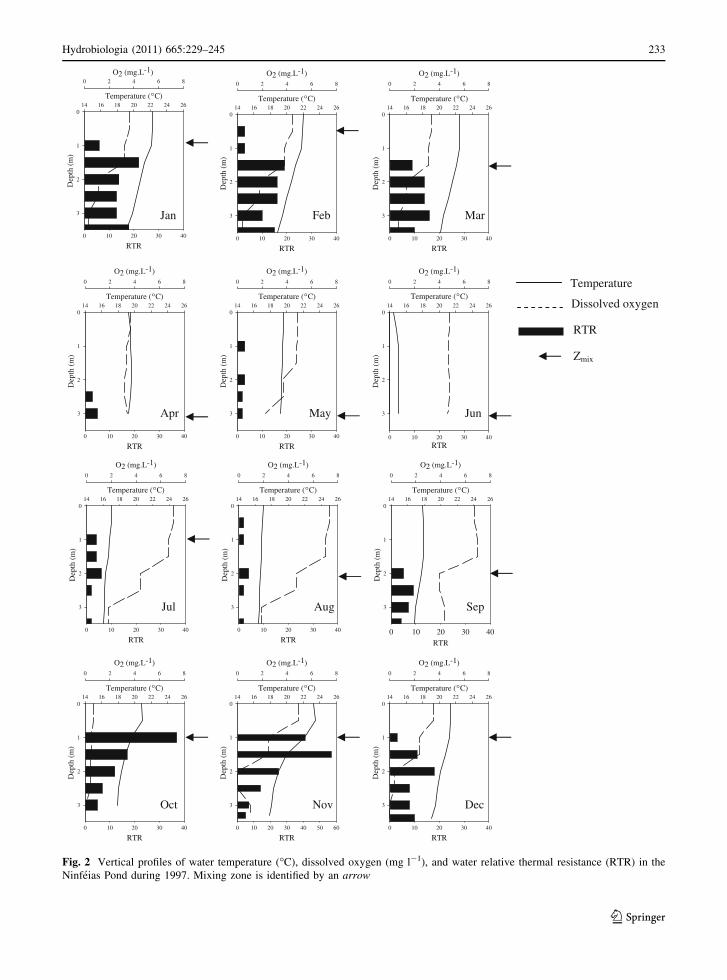
Water column temperature vertical profiles allowed
recognition of two distinct phases during the year:
from January to March and from October to Decem-
ber (phase 1), when Ninfeias Pond often was
thermally stratified, and from April to September,
when vertical profiles tended to be homogenous
(phase 2) (Fig. 2). During phase 1, Zmix was never
greater than 1.0 m and RTR reached its greatest
values. Thermal stratification was accompanied by
chemical stratification mainly for dissolved oxygen,
ammonium, conductivity, alkalinity, and dissolved
inorganic carbon (DIC). At this time, bottom layer
was anoxic and the variables above reached their
highest values, suggesting marked decomposition
(Table 1). During phase 2, Zmix reached up to the
232 Hydrobiologia (2011) 665:229–245
123
Temperature (°C)14 16 18 20 22 24 26
Dep
th (
m)
0
1
2
3
O2 (mg.L-1)0 2 4 6 8
RTR0 10 20 30 40
Jan
14 16 18 20 22 24 26
Dep
th (
m)
0
1
2
3
O2 (mg.L-1)0 2 4 6 8
RTR0 10 20 30 40
Feb
14 16 18 20 22 24 26
Dep
th (
m)
0
1
2
3
O2 (mg.L-1)0 2 4 6 8
RTR0 10 20 30 40
Mar
14 16 18 20 22 24 26
Dep
th (
m)
0
1
2
3
O2 (mg.L-1)0 2 4 6 8
RTR0 10 20 30 40
Apr
14 16 18 20 22 24 26
Dep
th (
m)
0
1
2
3
O2 (mg.L-1)0 2 4 6 8
RTR0 10 20 30 40
May
RTR0 10 20 30 40
Dep
th (
m)
0
1
2
3
14 16 18 20 22 24 26
O2 (mg.L-1)0 2 4 6 8
Jun
14 16 18 20 22 24 26
Dep
th (
m)
0
1
2
3
O2 (mg.L-1)0 2 4 6 8
RTR0 10 20 30 40
Jul
14 16 18 20 22 24 26
Dep
th (
m)
0
1
2
3
O2 (mg.L-1)0 2 4 6 8
RTR0 10 20 30 40
Aug
14 16 18 20 22 24 26
Dep
th (
m)
0
1
2
3
O2 (mg.L-1)0 2 4 6 8
RTR0 10 20 30 40
Sep
14 16 18 20 22 24 26
Dep
th (
m)
0
1
2
3
O2 (mg.L-1)0 2 4 6 8
RTR0 10 20 30 40
Oct
14 16 18 20 22 24 26
Dep
th (
m)
0
1
2
3
O2 (mg.L-1)0 2 4 6 8
RTR0 10 20 30 40 50 60
Nov
14 16 18 20 22 24 26
Dep
th (
m)
0
1
2
3
O2 (mg.L-1)0 2 4 6 8
RTR0 10 20 30 40
Dec
Temperature
RTR
Dissolved oxygen
Zmix
Temperature (°C) Temperature (°C)
Temperature (°C) Temperature (°C) Temperature (°C)
Temperature (°C) Temperature (°C) Temperature (°C)
Temperature (°C) Temperature (°C) Temperature (°C)
Fig. 2 Vertical profiles of water temperature (�C), dissolved oxygen (mg l-1), and water relative thermal resistance (RTR) in the
Ninfeias Pond during 1997. Mixing zone is identified by an arrow
Hydrobiologia (2011) 665:229–245 233
123
bottom from April to June, and the vertical profiles of
abiotic variables were relatively homogeneous
(Fig. 3). From July to September, temperature strat-
ification gradually increased, and dissolved oxygen
profile was clinograde, although hypolimnion was not
yet anaerobic as in phase 1. Secchi disk ranged from
0.55 m (November) to 1.90 m (January). Zeu/Zmix
ratio was C1 all over the year; Zeu did not reach the
bottom only between October and December.
PCA using 15 abiotic variables and chlorophyll
a (Table 1) explained 60% of data variability in the
first two ordination axes (axis 1: 40%; axis 2: 20%)
(Fig. 4). The following variables were among the
most important ones for axis 1 ordination: ammonium
(r = -0.95), free CO2 (r = -0.94), conductivity
(r = -0.94), alkalinity (r = -0.85), dissolved oxy-
gen (DO) (r = 0.73), and soluble reactive phosphorus
(SRP) (r = -0.72). For axis 2, pH (r = -0.89) and
nitrate (r = 0.82) were the variables that contributed
most (Fig. 4).
Vertical variation originated by seasonal mixing
and stratification patterns explained axis 1 ordination.
All samples from phase 1 bottom and 2 m depths
placed at the negative side of axis 1 were associated
to high ammonium, free CO2, conductivity, alkalin-
ity, and SRP. At the positive side of the same axis
were placed all samples from phase 2 and the surface
and 1 m samples from phase 1, associated to high
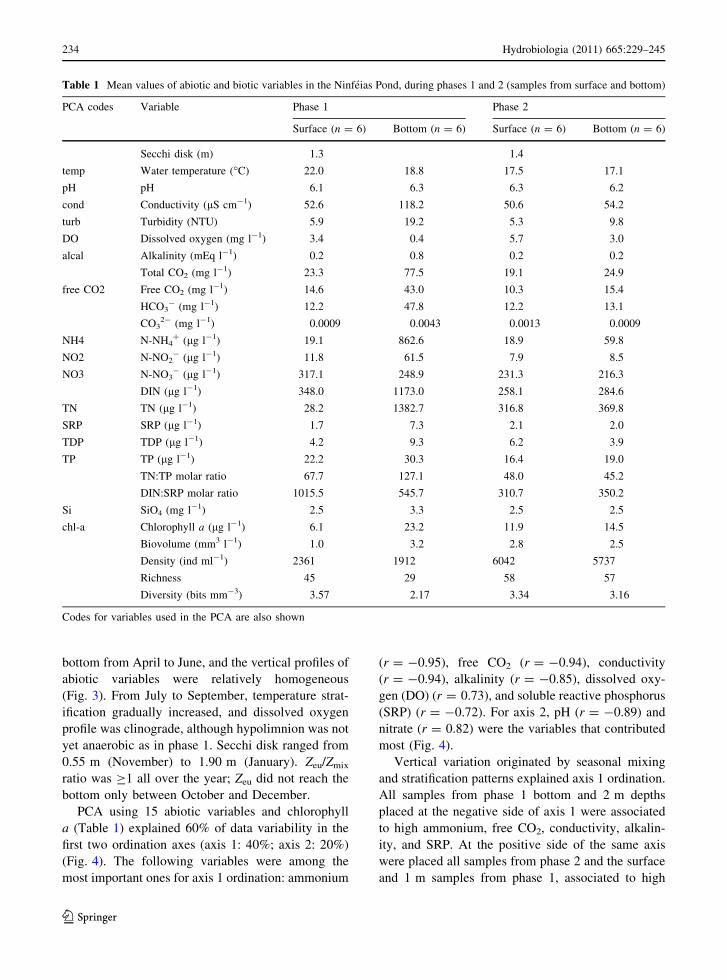
Table 1 Mean values of abiotic and biotic variables in the Ninfeias Pond, during phases 1 and 2 (samples from surface and bottom)
PCA codes Variable Phase 1 Phase 2
Surface (n = 6) Bottom (n = 6) Surface (n = 6) Bottom (n = 6)
Secchi disk (m) 1.3 1.4
temp Water temperature (�C) 22.0 18.8 17.5 17.1
pH pH 6.1 6.3 6.3 6.2
cond Conductivity (lS cm-1) 52.6 118.2 50.6 54.2
turb Turbidity (NTU) 5.9 19.2 5.3 9.8
DO Dissolved oxygen (mg l-1) 3.4 0.4 5.7 3.0
alcal Alkalinity (mEq l-1) 0.2 0.8 0.2 0.2
Total CO2 (mg l-1) 23.3 77.5 19.1 24.9
free CO2 Free CO2 (mg l-1) 14.6 43.0 10.3 15.4
HCO3- (mg l-1) 12.2 47.8 12.2 13.1
CO32- (mg l-1) 0.0009 0.0043 0.0013 0.0009
NH4 N-NH4? (lg l-1) 19.1 862.6 18.9 59.8
NO2 N-NO2- (lg l-1) 11.8 61.5 7.9 8.5
NO3 N-NO3- (lg l-1) 317.1 248.9 231.3 216.3
DIN (lg l-1) 348.0 1173.0 258.1 284.6
TN TN (lg l-1) 28.2 1382.7 316.8 369.8
SRP SRP (lg l-1) 1.7 7.3 2.1 2.0
TDP TDP (lg l-1) 4.2 9.3 6.2 3.9
TP TP (lg l-1) 22.2 30.3 16.4 19.0
TN:TP molar ratio 67.7 127.1 48.0 45.2
DIN:SRP molar ratio 1015.5 545.7 310.7 350.2
Si SiO4 (mg l-1) 2.5 3.3 2.5 2.5
chl-a Chlorophyll a (lg l-1) 6.1 23.2 11.9 14.5
Biovolume (mm3 l-1) 1.0 3.2 2.8 2.5
Density (ind ml-1) 2361 1912 6042 5737
Richness 45 29 58 57
Diversity (bits mm-3) 3.57 2.17 3.34 3.16
Codes for variables used in the PCA are also shown
234 Hydrobiologia (2011) 665:229–245
123

Dep
th (
m)
Dep
th (
m)
S
1
6
12
18
24
30
36
42
48
54
60
2
B
Tot
al p
hosp
horu
s (u
g l-
1)
S
1
100
300
500
700
900
1100
1300
1500
1700
1900
2100
2
B
Tot
al n
itro
gen
(ug
l-1)
S
1
4
6
8
10
12
14
16
18
2
B
SRP
(ug
l-1)
S
1
4
154
304
454
604
754
904
1054
1204
1354
1504
2
BA
mm
oniu
m (u
g l-
1)
Month
S
1
Jan0
8
16
24
32
40
48
56
2
B
Feb Mar Apr May Jun Jul Aug Sep Oct Nov Dec
Free
CO
2 ( m
g l-1
)
Phase 1 Phase 2 Phase 1
Dep
th (
m)
Dep
th (
m)
Dep
th (
m)
(a)
(b)
(c)
(d)
(e)
Fig. 3 Depth-time diagram
of a total phosphorus
(lg l-1), b total nitrogen
(lg l-1), c soluble reactive
phosphorus (lg l-1),
d ammonium (lg l-1), and
e free CO2 (mg l-1) in the
Ninfeias Pond during 1997.
Temporal phases are
indicated by vertical lines
Hydrobiologia (2011) 665:229–245 235
123

DO. Axis 2 ordinated samples according to the high
nitrate concentration reported in February. In general,
samples from phase 1 were situated at the positive
side of the axis 2, near nitrate vector.
Phytoplankton community and Q Index
Altogether, 255 phytoplankton taxa including species
and varieties were identified, which were grouped
into 12 classes. Chlorophyceae was the most repre-
sentative class (n = 77), immediately followed by
Chrysophyceae (n = 45). The most frequent taxa
were Monoraphidium griffithii, M. irregulare, Chrys-
ochromulina cf. breviturrita, Scenedesmus ecornis,
Cryptomonas erosa, and Chlorella vulgaris that were
present in more than 70% of samples studied.
Chlorophyll a and biovolume mean annual values
(n = 48) were 11.5 lg l-1 and 2.2 mm3 l-1, respec-
tively. In general, greatest values of these variables were
reported at the bottom layers, especially in August (chlo-
rophyll a = 20.3 lg l-1; biovolume = 7.8 mm3 l-1)
and March (chlorophyll a = 32.9 lg l-1; biovolume =
8.1 mm3 l-1) (Table 1). Two species were responsible
for this pattern: Chrysochromulina cf. breviturrita
(August) and Chlamydomonas sp. (March) (Fig. 5).
Richness was greatest during phase 2 (annual
mean value 55) coinciding with the great densities
reported between May and September. Lower values
were documented at bottom layers during phase 1.
The same was true for diversity (annual mean value
3.1 bits mm-3) (Table 1).
Eleven functional groups were reported: Lo, X1,
X2, X3, G, W2, Y, P, F, E, and D (Table 2). Group
Lo represented by dinoflagellates dominated during
phase 2 (50.6%), followed by X2 (27.2%) represented
by Chrysochromulina cf. breviturrita. During phase
1, group G represented by Chlamydomonas sp.
contributed most (40.3%) to total biovolume. Other
functional groups reported showed less pronounced
seasonal and vertical variations (Fig. 6).
Chlamydomonas sp. had a restricted seasonal and
vertical distribution, being reported only during phase
1 as mentioned before. Its functional group classifica-
tion was not obvious because it usually dominated
alone, sometimes representing more than 60% of total
biovolume in phase 1 bottom samples (e.g., February
and December). The Ninfeias Pond taxon is relatively
large when compared with other Chlamydomonas
species (GALD = 28 lm; biovolume = 3,301 lm3),
and its biovolume is above the mean value of Ninfeias’
phytoplankton (2,202 lm3). It showed significant
positive correlation with ammonium (rs = 0.71), free
CO2 (rs = 0.69), and conductivity (rs = 0.68). Its
classification in group G will be discussed later.
ja
fe
mr
ap
ma
jn
jl
au
se
oc
no
de
ja
fe
mr
ap
ma
jnjl
ause
oc
no
de
ja
fe
mr
ap
ma
jnjl
au
se
oc
node
ja
fe
mr apma
jn
jl
au
se
oc
no
de
pH
condturb
chl-a
DO
SRPSi
free CO2
alcal
temp
NO2
NO3
NH4-2,0
-1,0
0,10,00,1-
-0,5
0,0
0,5
1,0
Axis 1 (40%)
Axi
s 2
(20%
)
Depths
Subsurface1m2mBottom
Bottom, Phase 1 Surface, Phase 2
Fig. 4 Biplot of PCA for
15 abiotic variables and
chlorophyll a (see Table 1
for codes). Two letters in
sample unit plots represent
month (ja = January,
fe = February, etc.).
Vectors from variables with
r \ 0.5 for the first two-axis
are not shown
236 Hydrobiologia (2011) 665:229–245
123

Considering the Q index, Ninfeias Pond ecolog-
ical status during 1997 ranged from medium to
excellent. The F Factor determined for each func-
tional group can be found in Table 2. Best condi-
tions were reported during phase 2, extending to
October and November, which seem a transition
period between phases 2 and 1. The index reached
its lowest values from January to March and in
December (phase 1), when it pointed to medium
classification.
Integrated analysis of abiotic and phytoplankton
functional groups
CCA eigenvalues for axes 1 and 2 were 0.014 and
0.004, respectively, explaining 56% of total variance
Dep
th (
m)
Dep
th (
m)
S
1
0
4
8
12
16
20
24
28
32
36
2
B
Chl
orop
hyll
a (u
g l-
1)
S
1
0.0
1.0
2.0
3.0
4.0
5.0
6.0
7.0
8.0
2
B Tot
al b
iovo
lum
e (m
m3
l-1)
S
1
0.00.51.01.52.02.53.03.54.04.55.05.56.0
2
B C. b
revi
turr
ita
(mm
3 l-
1)
S
1
0.00.51.01.52.02.53.03.54.04.55.05.56.0
2
B
Chl
amyd
omon
as s
p. (
mm
3 l-
1)
Jan Feb M ar Apr May Jun Jul Aug Sep Oct Nov DecMonth
Phase 1 Phase 2 Phase 1
Dep
th (
m)
Dep
th (
m)
(a)
(b)
(c)
(d)
Fig. 5 Depth-time diagram of a chlorophyll a (lg l-1), b total biovolume (mm3 l-1), c Chrysochromulina cf. breviturrita(mm3 l-1), and d Chlamydomonas sp. (mm3 l-1) in the Ninfeias Pond during 1997
Hydrobiologia (2011) 665:229–245 237
123

on the first two axes. The hypothesis of no relation-
ship between functional groups and environmental
data was rejected (P \ 0.05, according to Monte
Carlo test). Pearson environment-species correlation
for the two significant axes was high ([0.6) (respec-
tively, 0.869 and 0.607), indicating a strong correla-
tion between abiotic variables and the phytoplankton
functional group patterns.
Free CO2, ammonium, and DO were the most
important variables to axis 1 ordination according to
canonical coefficients and intra-set correlations
(Table 3; Fig. 7). Greater free CO2 and ammonium
values were associated to phase 1 bottom samples,
located, in general, at the negative side of the axis 1;
functional group G had the higher negative correlation
with axis 1 (r = -0.70). At axis 1 positive side, were
located all samples from phase 2 associated to high DO,
except in April. Functional groups with higher positive
correlation with axis 1 were X2 (r = 0.61), X1
(r = 0.54), and Lo (r = 0.46), which occurred espe-
cially during phase 2, when the temperature was lower
and water column tended to be mixed. Concentrated in
the center of Fig. 8, representing transitional conditions,
were functional groups W2, Y, P, E, D, F, and X3.
Considering axis 2, pH and temperature were the
most significant variables (Table 3). Greater pH
values were reported at the end of winter (August)
and also in phase 1 bottom layers. Associated to
Table 2 Selected species from Nifeias Pond phytoplankton community based on biovolume higher than 5% in at least one unit
sample and its functional group relative contribution during phases 1 and 2
Taxonomic
class
Species Group % F Factor
Phase 1 Phase 2
dino Dinophyceae sp. Lo 32.9 50.6 5
dino Durinskia sp.
dino Gymnodinium paradoxum Schilling
dino Gymnodinium sp.
dino Peridinium gatunense Nygaard
dino Peridinium umbonatum Stein
chlo Chlorella vulgaris Beijerinck X1 4.2 6.7 4
chlo Golenkiniopsis parvula (Voronichin) Korsikov
chlo Monoraphidium irregulare (G.M. Smith) Komarkova-Legnerova
chlo Tetrastrum triangulare (Chodat) Komarek
prym Chrysochromulina cf. breviturrita Nicholls X2 5.6 27.2 4
chry Bitrichia ollula Fott (Bourrelly) X3 2.0 3.8 5
chry Chromulina sp.
chry Chrysophyceae sp.
chlo Chlamydomonas sp. G 40.3 3.5 2
eugl Trachelomonas volvocinopsis Swirenko W2 3.8 0.9 1
cryp Cryptomonas curvata Ehrenberg emend. Penard Y 6.9 4.3 3
cryp Cryptomonas erosa Ehrenberg
cryp Cryptomonas marssonii Skuja
zygn Closterium cf. jenneri Ralfs P 1.0 0.4 2
zygn Closterium setaceum Ehrenberg ex Ralfs
zygn Teilingia granulata (Roy & Bisset) Bourrelly
chry Dynobrion divergens Imhof var. schawinslandii(Lemmermann) Brunthaler
E 1.0 0.0 5
baci Ulnaria acus (Kutzing) M. Aboal D 1.2 0.4 2
chlo Botryococcus braunii Kutzing F 1.0 2.1 5
Taxonomic classes (dino Dinophyceae, chlo Chlorophyceae, prym Prymnesiophyceae, chry Chrysophyceae, eugl Euglenophyceae,
cryp Cryptophyceae, zygn Zygnemaphyceae, baci Bacillariophyceae) and F factors for Q index calculation are also shown
238 Hydrobiologia (2011) 665:229–245
123

higher pH were functional groups Lo (r = -0.47),
that occurred in phase 2 and G (r = -0.34) in phase
1, as already mentioned.
Discussion
Stratification regime is considered the most important
hydroclimate factor steering biotic processes in
lacustrine environments. Vertical mixing regulates
particles in suspension and ion distribution in the
water column, being a key factor for determining
phytoplankton structure and succession (Reynolds,
1984; Lewis, 1996).
Despite its shallowness, water column stratifica-
tion triggered strong abiotic changes among different
depths during phase 1 in the Ninfeias Pond, when
hypolimnion oxygen was depleted. Anaerobic condi-
tions associated to great DIC, ammonium, and
conductivity values suggest that organic matter
decomposition dominated over photosynthesis.
Fonseca & Bicudo (2008) reported similar seasonal
OthersX3
GW2
YX1
X2LO
0,0
1,0
2,0
3,0
4,0
5,0
6,0
jf
m am
jj
as
on
d
Month
Functional
Bio
volu
me
(mm
3 l-
1)
Groups
Subsurface
Others
X3G
W2Y
X1X2
LO0,0
1,0
2,0
3,0
4,0
5,0
6,0
j fm
am
jj
as
on
d
Month
Functional Groups
Bottom
Bio
volu
me
(mm
3 l-
1)
Fig. 6 Seasonal and
vertical variation of
phytoplankton functional
groups in the Ninfeias Pond
during 1997. To save space,
just subsurface and bottom
data are shown
Hydrobiologia (2011) 665:229–245 239
123

stratification pattern in a shallow eutrophic reservoir
located about 500 m from Ninfeias Pond during the
same year of present work.
Probably this regional pattern has been enhanced in
the Ninfeias Pond by fluctuations in the macrophyte
biomass decomposition. Recent studies reported that
Utricularia coverage in this system ranged from 3%
in the summer, 27% in the autumn, 33% in the winter,
and 98% in the spring (Carla Ferragut, unpublished
data). It is possible to infer that, during phase 1
(summer), macrophytes decomposition in the hypo-
limnion, associated to seasonal water column stratifi-
cation, may have increased biological oxygen demand
near the sediments. From July to September, the small
concentrations of dissolved oxygen near the bottom,
regardless of relatively homogeneous temperature
profile, may also be explained by macrophytes
dynamic in the reservoir.
Phytoplankton dynamic in the Ninfeias Pond was
marked by biomass peaks in the bottom layers in both
phases 1 and 2. Chlorophyll a concentrations at a
given nutrient level are, in general, lower in lakes
with submerged macrophytes than in those without
macrophytes (Schriver et al., 1995; Takamura et al.,
2003), especially because algal growth is suppressed
by nutrient competition (Canfield et al., 1984), and
also by demise in light penetration. However, in the
Ninfeias Pond, other factors seem to influence the
relationship between nutrient concentrations and
phytoplankton biomass.
In fact, chlorophyll a concentration in Ninfeias
Pond can be considered high when compared to
phosphorus and nitrogen concentration. Considering
Table 3 CCA synthesis for data from five abiotic variables
and 11 functional groups (n = 48)
Axis 1 Axis 2
Correlation coefficient
(intra-set)
DO 0.683 -0.107
Temperature -0.532 0.510
Free CO2 -0.913 -0.088
pH 0.443 -0.721
NH4 -0.844 -0.494
Canonical coefficient DO 0.593 -0.065
Temperature -0.462 0.311
Free CO2 -0.793 -0.053
pH -0.385 0.439
NH4 -0.734 -0.301
ja
fe
mrap
ma
jn
jl
au
seoc
de
ja
fe
mrap
ma
jn
jlau
se
oc
no
de
ja
femr
ap
ma
jn
jl au
seoc
no
de
ja
fe
mr
ap
ma
jn
jl
au
se
oc
no
de
Lo
X1
X2
X3
W1
W2 Y P ED
F
DOfree CO2
pH
temp
NH4
-4
-3
202-
-1
1
Axis 1
Axi
s 2
Depths
Subsurface1m2mBottom
G
Phase 1 bottom samples: group G
Phase 2 samples: groups Lo and X2
Fig. 7 Biplot of CCA for
five abiotic variables
(temp = temperature,
DO = dissolved oxygen,
ammonium = NH4, free
CO2, and pH) and 11
phytoplankton functional
groups (filled square) from
four depths in the Ninfeias
Pond during 1997 (n = 48)
240 Hydrobiologia (2011) 665:229–245
123
its chlorophyll a annual mean value (11.5 lg l-1;
n = 48), Ninfeias Pond would be classified eutrophic
according to different trophic classification schemes
(Carlson, 1977; Vollenweider & Kerekes, 1982;
Toledo et al., 1983; Salas & Martino, 1991;
Nurnberg, 1996), whose chlorophyll a threshold for
eutrophy is around 10 lg l-1. During phase 1, bottom
samples chlorophyll a concentrations at Ninfeias
Pond reached 30 lg l-1. Considering TP and TN
(water column mean values), on the other hand,
Ninfeias Pond would, in general, be classified oligo-
mesotrophic using the very same trophic classifica-
tion schemes.
Nevertheless, as was pointed out by Carlson &
Simpson (1996), trophic state indices are based only
on algal biomass. They do not take into account
macrophyte biomass and may, therefore, underesti-
mate the trophic state of macrophyte-dominated
lakes. These authors defined trophic state as ‘‘the
total weight of living biological material (biomass) in
a waterbody at a specific location and time’’. In this
sense, the total phosphorus content of a lake should
be obtained by adding the amount of phosphorus in
the macrophytes to the amount estimated to be in the
water column, and Ninfeias Pond probably would be
classified as eutrophic. This approach, however, has
not been incorporated elsewhere, which hinders
immediate comparisons between Ninfeias Pond and
eutrophic shallow lakes without macrophytes. In fact,
when phytoplankton composition is considered, Nin-
feias Pond is nearer to other oligo or mesotrophic
reservoirs (Lopes et al., 2005) than to other eutrophic
ones (Fonseca & Bicudo, 2008, 2010).
According to Reynolds (2006), unicellular nano-
planktonic forms are collectively common in shallow
lakes with macrophytes, benefiting from C-type
invasive, fast-growth rate strategies. These often
include nanoplanktonic chlorococcals (X1), nano-
planktonic flagellates (X2), cryptomonads (Y), and
small peridinioids. Some euglenoids (W1) and large
green colonies (G) may also be present. Planktonic
diatoms are not generally abundant, save, perhaps, by
smaller species of group D. In the Ninfeias Pond,
sequence of functional groups over phases 1 and 2
resulted from CCA is in agreement with Reynolds’
general observations (phase 1 = G ? transition =
Y/P/E/D/F/W2/X3 ? phase 2 = X2/Lo/X1). Also,
in reservoirs with low residence time, phytoplankton
replication rates may be more relevant than nutrients
supply determining community composition, select-
ing species with high growth rates (Lind et al., 1993).
Such a condition may be particularly relevant at
Ninfeias Pond, whose residence time is very short
(\10 days).
Cyanobacterial groups such as SN or M were never
reported in the Ninfeias Pond, although they had a
great contribution for phytoplankton biomass in
Garcas Pond, a eutrophic system located in the same
basin whose ecological status (Q Index) in 1997
ranged between bad and tolerable (Crossetti &
Bicudo, 2008). During phase 1, even under its highest
nutrient concentrations, Ninfeias Pond’s ecological
status was medium, according to the Q Index. During
phase 2, it was considered excellent.
Ninfeias phytoplankton was marked by flagellated
nanoplanktonic species. Fonseca & Bicudo (2010)
Jan Feb Mar Apr May Jun Jul Aug Sep Oct Nov Dec
Phase1“medium”
↑ Temperature
Stratification
⇓Bottom: ↑nutrients,
↓ dissolved oxygen
Group G
↓ Temperature
Mixing
⇓↓ nutrients
↑ dissolved oxygen
Groups X2 and Lo
Phase1“medium”
↑ Temperature
Stratification
⇓Bottom: ↑nutrients,
↓ dissolved oxygen
Group G
Phase2“excellent”
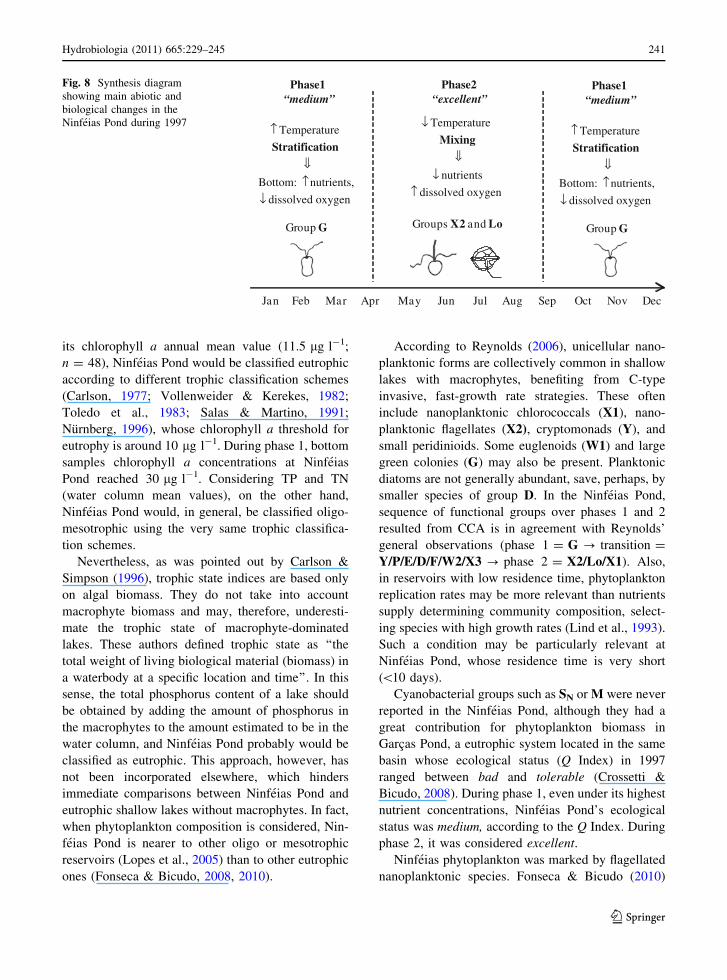
Fig. 8 Synthesis diagram
showing main abiotic and
biological changes in the
Ninfeias Pond during 1997
Hydrobiologia (2011) 665:229–245 241
123

discussed the flagellate’s success in the presence of
macrophytes. In general, due to their motility flagel-
lates are better adapted to explore a heterogeneous
and structured environment in regard to its nutrient
distribution, such as the one created by macrophytes
(Sommer, 1988; Søndergaard & Moss, 1998).
Another explanation is that many flagellates are
mixotrophic and able to use dissolved organic carbon
excreted from macrophytes and their associated
epiphytic environment.
Tittel et al. (2003) argued that mixotrophic grazing
strategy is responsible for deep algal accumulations
in many aquatic environments. Mixotrophy offers a
strategy to circumvent phosphorus competition
between phytoplankton and the bacterial flora,
because mixotrophs can obtain P directly from the
bacteria through phagotrophic ingestion (Jones,
2000).
Gil-Gil (2004) also found greater chlorophyll
a concentration at the Ninfeias Pond hypolimnion
during 2000/2001, which suggested a recurrent event.
Latter author used photoinhibition mechanisms acting
in the surface layers to explain her findings. In fact,
according to literature, Chrysochromulina breviturri-
ta, a representative species for total biovolume during
phase 2, can be sensitive to high irradiance (Nicholls
et al., 1982). Present work reported its biomass peak
during August, near the reservoir bottom. During
stratification months (phase 1), other flagellated
species (Chlamydomonas sp.) migrated to the hypo-
limnion where nutrient was abundant and light was
not limiting, considering that light reached the
reservoir bottom during almost the entire study
period.
According to Nicholls (2003), C. breviturrita
distribution is restricted to neutral acidic lakes of
North America. Individual specimens found during
this study have measures and shapes identical to those
in Nicholls’ C. breviturrita original description
(Nicholls, 1978). However, the species taxonomic
identification was presently performed as ‘‘confera-
tur’’ because its precise identification demands
transmission electronical microscopy, which has not
been done.
Physiological studies conducted by Wehr et al.
(1985) showed that C. breviturrita has an optimal pH
range around 5.5–6.9, being unable to survive under
pH [ 7.0. Also, Wehr & Brown (1985) emphasized
the absolute requirement of selenium (Se) as trace
element by Chrysochromulina species, especially
C. breviturrita. Latter authors suggested that this
taxon could be a primary indicator of lake acidificat-
ion caused by acid rain and vegetal coal burning.
Ninfeias Pond pH values (5.8–6.6) are coherent with
the optimal range reported for C. breviturrita. In
relation to selenium requirements, a steel plant
located less than 1 km from this pond during the
decades of 1980 and 1990 probably emitted sub-
stantial amounts of Se in the atmosphere and
surrounding vegetation (Struffaldi-de-Vuono et al.,
1984).
Reynolds et al. (2002) and Padisak et al. (2009)
included the genus Chrysochromulina in the func-
tional group X2, associated to shallow, clear mixed
layers in meso-eutrophic lakes. Some species not
considered in the literature were fitted here according
to their eco-morphological features and the water
conditions during their dominance period. For exam-
ple, Chlamydomonas spp. are usually accommodated
with other nanoplanktonic flagellated species in
group X3. Fonseca & Bicudo (2010) included the
taxon Chlamydomonas sp. found in the Ninfeias Pond
in group W1, near to the euglenoids that tolerate high
biological oxygen demand (BOD) (Reynolds et al.,
2002), considering its presence under low dissolved
oxygen concentration. However, this study makes an
adjustment, allocating Ninfeias’ taxon in group G.
According to Padisak et al. (2009), this group is
represented by green flagellated algae such as Volvox,
Pandorina, and Carteria in nutrient-rich conditions
in stagnating water columns. Although group W1 is
also found in enriched waters, usually it is associated
to organic matter from husbandry or sewages, which
is not the case in the Ninfeias Pond.
Present paper has tried to elucidate the main
driving factors acting on phytoplankton community
in the Ninfeias Pond, based especially on exogenous
mechanisms, such as physical environment, and
endogenous ones, such as vertical migration and
mixotrophy. However, another important ecological
factor is the role of zooplankton grazers. According
to Piva-Bertoletti (2001), large grazers such as
cladocerans are relatively scarce in the Ninfeias
Pond; zooplankton densities is dominated by rotifers
(in special Polyarthra vulgaris Carlin), some of them
associated to macrophytes presence, such as Dip-
leuchlanis propatula Gosse, Lecane doryssa Harring,
Lecane leontina Turner, Lepadella patella O.F.
242 Hydrobiologia (2011) 665:229–245
123
Muller, Monommata sp., and Trichocerca cf. bidens
Lucks.
In general, the main zooplankton grazers in tropical
shallow lakes are small cladocerans and rotifers,
whose grazing pressure on phytoplankton communi-
ties is relatively small when compared to temperate
shallow lakes (Scheffer & van Nes, 2007). Neverthe-
less, recent studies have reported great adaptability in
the feeding behavior of some rotifers (Pagano, 2008).
Specific studies considering zooplankton biomass and
its relationship with phytoplankton would help to
better understand how important the grazing pressure
is in the Ninfeias Pond.
In summary, seasonal stratifications played a
decisive role in determining the structure and
dynamic of phytoplankton in the Ninfeias Pond,
allowing the recognition of phases 1 and 2 (Fig. 8).
However, in such a complex and heterogeneous
system, other compartments of the food web (mac-
rophytes, zooplankton, fishes) may also act as
relevant driving forces, in synergy with the physical
and chemical environment.
Acknowledgments BMF thanks FAPESP (Fundacao de
Amparo a Pesquisa do Estado de Sao Paulo) for a Doctoral
fellowship, and CEMB for CNPq (Conselho Nacional de
Desenvolvimento Cientıfico e Tecnologico) for Grant no.
303876/2004-2. Both authors appreciate all colleagues’ help
involved in the laboratory and fieldwork, and Dr. Mariangela
Menezes’s (MN/UFRJ) assistance with taxonomic identification
of flagellated taxa.
References
Becker, V., V. L. M. Huszar & L. O. Crossetti, 2009. Responses
of phytoplankton functional groups to the mixing regime in
a deep subtropical reservoir. Hydrobiologia 628: 137–151.
Becker, V., L. Caputo, J. Ordonez, R. Marce, J. Armengol,
L. O. Crossetti & V. L. M. Huszar, 2010. Driving factors
of the phytoplankton functional groups in a deep Medi-
terranean reservoir. Water Research 44: 3345–3354.
Bicudo, C. E. M., C. F. Carmo, D. C. Bicudo, R. Henry, A. C. S.
Piao, C. M. Santos & M. R. M. Lopes, 2002a. Morfologia e
morfometria de tres reservatorios do PEFI. In Bicudo, D. C.,
M. C. Forti & C. E. M. Bicudo (eds), Parque Estadual das
Fontes do Ipiranga: unidade de conservacao que resiste a
urbanizacao de Sao Paulo. Secretaria do Meio Ambiente do
Estado de Sao Paulo, Sao Paulo: 143–160.
Bicudo, D. C., M. C. Forti, C. F. Carmo, C. Bourote, C. E. M.
Bicudo, A. J. Melfi & Y. Lucas, 2002b. A atmosfera, as aguas
superficiais e os reservatorios do PEFI: caracterizacao quı-
mica. In Bicudo, D. C., M. C. Forti & C. E. M. Bicudo (eds),
Parque Estadual das Fontes do Ipiranga: Unidade de
conservacao que resiste a urbanizacao de Sao Paulo. Secre-
taria do Meio Ambiente do Estado de Sao Paulo, Sao Paulo:
161–200.
Bicudo, D. C., B. M. Fonseca, L. M. Bini, L. O. Crossetti, C.
E. M. Bicudo & T. Araujo-Jesus, 2007. Undesirable side-
effects of water hyacinth control in a shallow tropical
reservoir. Freshwater Biology 52: 1120–1133.
Canfield, D. E. Jr., J. V. Shireman, D. E. Colle, W. T. Haller, C.
E. Watkins & M. J. Maceina, 1984. Prediction of chlo-
rophyll a concentrations in Florida lakes: Importance of
aquatic macrophytes. Canadian Journal of Fisheries and
Aquatic Sciences 41: 497–501.
Carlson, R. E., 1977. A trophic state index for lakes. Limnol-
ogy and Oceanography 22: 361–369.
Carlson, R. E. & J. Simpson, 1996. A Coordinator’s Guide to
Volunteer Lake Monitoring Methods. North American
Lake Management Society: 96 pp.
Cole, G., 1983. Textbook of Limnology, 3rd ed. The C.
V. Mosby Co, London.
Conti, J. B. & S. A. Furlan, 2003. Geoecologia: o clima, os
solos e a biota. In Ross, J. L. (org.), Geografia do Brasil.
Editora da Universidade de Sao Paulo, Sao Paulo, 67–207.
Crossetti, L. O. & C. E. M. Bicudo, 2008. Phytoplankton as a
monitoring tool in a tropical urban shallow reservoir
(Garcas Pond): The assemblage ındex application.
Hydrobiologia 610: 161–173.
Dadon, J. R., 1995. Calor y temperatura em cuerpos lenticos. In
Lopretto, E. C. & G. Tell (eds), Ecosistemas de aguas
continentales: metodologıa para su estudio. Ediciones Sur,
Buenos Aires. Vol. 2.
Fonseca, B. M. & C. E. M. Bicudo, 2008. Phytoplankton
seasonal variation in a shallow stratified eutrophic reser-
voir (Garcas Pond, Brazil). Hydrobiologia 600: 267–282.
Fonseca, B. M. & C. E. M. Bicudo, 2010. How important can
the presence/absence of macrophytes be in determining
phytoplankton strategies in two tropical shallow reservoirs
with different trophic status? Journal of Plankton
Research 32: 31–46.
Gil-Gil, F., 2004. Fracionamento da producao primaria em dois
sistemas com diferentes nıveis troficos no Parque Estadual
das Fontes do Ipiranga, Sao Paulo. Doctoral Dissertation.
Universidade de Sao Paulo, Sao Paulo.
Golterman, H. L. & R. S. Clymo, 1971. Methods for Chemical
Analysis of Freshwaters. Blackwell Scientific Publications,
International Biological Programme, Oxford, Edinburg.
Golterman, H. L., R. S. Clymo & M. A. M. Ohmstad, 1978.
Methods for physical and chemical analysis of freshwaters.
Blackwell Scientific Publications, International Biological
Programme, Oxford (IBP Handbook no. 8, 2nd edition).
Jeppensen, E., M. Meerhoff, B. A. Jacobsen, R. S. Hansen, M.
Søndergaard, J. P. Jensen, T. L. Lauridsen, N. Mazzeo &
C. W. C. Branco, 2007a. Restoration of shallow lakes by
nutrient control and biomanipulation: The successful
strategy varies with lake size and climate. Hydrobiologia
581: 269–285.
Jeppensen, E., M. Søndergaard, M. Meerhoff, T. L. Lauridsen
& J. T. Jensen, 2007b. Shallow lakes restoration by
nutrient loading reduction: Some recent findings and
challenges ahead. Hydrobiologia 584: 239–252.
Jones, R. I., 2000. Mixotrophy in planktonic protists: An
overview. Freshwater Biology 45: 219–226.
Hydrobiologia (2011) 665:229–245 243
123
Kosten, S., G. Lacerot, E. Jeppensen, D. M. Marques, E. H. van
Nes, N. Mazzeo & M. Scheffer, 2009. Effects of sub-
merged vegetation on water clarity across climates. Eco-
systems 12: 1117–1129.
Krasznai, E., G. Borics, G. Varbıro, A. Abonyi, J. Padisak, C.
Deak & B. Tothmeresz, 2010. Characteristics of the
pelagic phytoplankton in shallow oxbows. Hydrobiologia
639: 173–184.
Lewis W. M. Jr., 1996. Tropical lakes: How latitude makes a
difference. In Schiemer, F. & K. T. Boland (eds),
Perspectives in Tropical Limnology: 43–64.
Lind, O. T., T. T. Terrell & B. L. Kimmel, 1993. Problems in
reservoir trophic-state classification and implications for
reservoir management. In Straskraba, M. & J. G. Tundisi
(eds), Comparative Reservoir Limnology and Water
Quality Management. Kluwer Academic Publishers,
Dordrecht: 57–67.
Lopes, M. R. M., C. E. M. Bicudo & C. Ferragut, 2005. Short
term and temporal variation of phytoplankton in a shallow
tropical oligotrophic reservoir, southeast Brazil. Hydro-
biologia 542: 235–247.
Lund, J. W. G., C. Kipling & E. D. Le Cren, 1958. The inverted
microscope method of estimating algal numbers and sta-
tistical basis of estimation by counting. Hydrobiologia 11:
143–170.
Mackereth, F. J. H., J. Heron & J. F. Talling, 1978. Water
analysis: Some revised methods for limnologists. Titus
Wilson & Son Ltd., Kendall (Freshwater Biological
Association Scientific Publication no. 36).
McCune, B. & M. J. Mefford, 1997. PC-ORD: Multivariate
Analysis of Ecological Data, Version 3.0. MjM Software
Design, Oregon.
Moura, A. N., 1997. Estrutura e producao primaria da comunidade
perifıtica durante o processo de colonizacao em substrato
artificial no Lago das Ninfeias, Sao Paulo, SP: analise com-
parativa entre perıodos chuvoso e seco. Doctoral Disserta-
tion. Universidade Estadual Paulista, Rio Claro.
Nicholls, K. H., 1978. Chrysochromulina breviturrita sp. nov.,
a new freshwater member of the Prymnesiophyceae.
Journal of Phycology 14: 499–505.
Nicholls, K. H., 2003. Haptophyte algae. In Wehr, J. D. & R.
G. Sheath (eds), Freshwater Algae of North America.
Academic Press, California: 511–522.
Nicholls, K. H., J. L. Beaver & R. H. Estabrook, 1982. Lake
odours in Ontario and New Hampshire caused by Chrys-ochromulina breviturrita Nich. (Prymnesiophyceae).
Hydrobiologia 96: 91–95.
Nurnberg, G. K., 1996. Trophic state of clear and colored, soft-
and hardwater lakes with special considerations of nutri-
ents, anoxia, phytoplankton and fish. Lake and Reservoir
Management 12: 432–447.
Padisak, J. & C. S. Reynolds, 2003. Shallow lakes: The
absolute, the relative, the functional and the pragmatic.
Hydrobiologia 506–509: 1–11.
Padisak, J., G. Borics, I. Grigorszky & E. Soroczki-Pinter, 2006.
Use of phytoplankton assemblages for monitoring ecological
status of lakes within the Water Framework Directive: The
assemblage index. Hydrobiologia 553: 1–14.
Padisak, J., L. O. Crossetti & L. Naselli-Flores, 2009. Use and
misuse in the application of the phytoplankton functional
classification: A critical review with updates. Hydrobio-
logia 621: 1–19.
Pagano, M., 2008. Feeding of tropical cladocerans (Moinamicrura, Diaphanosoma excisum) and rotifer (Brachionuscalyciflorus) on natural phytoplankton: Effect of phyto-
plankton size-structure. Journal of Plankton Research
30(4): 401–414.
Piva-Bertoletti, S. A. E., 2001. Zooplancton dos lagos do
Parque Estadual das Fontes do Ipiranga (SP) e relacoes
entre especies zooplanctonicas e estado trofico em corpos
d’agua do Estado de Sao Paulo. Doctoral Dissertation.
Universidade de Sao Paulo, Sao Paulo.
Reynolds, C. S., 1984. The Ecology of Freshwater Phyto-
plankton. Cambridge University Press, Cambridge.
Reynolds, C. S., 2006. The Ecology of Phytoplankton. Cam-
bridge University Press, Cambridge.
Reynolds, C. S., V. Huszar, C. Kruk, L. Naselli-Flores & S.
Melo, 2002. Towards a functional classification of the
freshwater phytoplankton (review). Journal of Plankton
Research 24: 417–428.
Romo, R. & M.-J. Villena, 2005. Phytoplankton strategies and
diversity under different nutrient levels and planktivorous
fish densities in a shallow Mediterranean lake. Journal of
Plankton Research 27: 1273–1286.
Rott, E., 1981. Some results from phytoplankton counting in-
tercalibrations. Schweizerische Zeitschrift fur Hydrologie
43: 34–62.
Salas, H. J. & P. Martino, 1991. A simplified phosphorus tro-
phic state model for warm-water tropical lakes. Water
Research 25: 341–350.
Santos, P. M. & F. L. Funari, 2002. Clima local. In Bicudo, D.
C., M. C. Forti & C. E. M. Bicudo (eds), Parque Estadual
das Fontes do Ipiranga: unidade de conservacao que res-
iste a urbanizacao de Sao Paulo. Secretaria do Meio
Ambiente do Estado de Sao Paulo, Sao Paulo: 27–46.
Sartory, D. P. & J. U. Grobbelaar, 1984. Extraction of chlo-
rophyll a from freshwater phytoplankton for spectropho-
tometric analysis. Hydrobiologia 114: 177–187.
Scheffer, M., 1998. Ecology of Shallow Lakes. Chapman &
Hall, London.
Scheffer, M. & E. H. van Nes, 2007. Shallow lakes theory revis-
ited: Various alternative regimes driven by climate, nutrients,
depth and lake size. Hydrobiologia 584: 455–466.
Scheffer, M., S. H. Hosper, M.-L. Meijer, B. Moss &
E. Jeppesen, 1993. Alternative equilibria in shallow lakes.
Trends in Ecology and Evolution 8: 275–279.
Schriver, P., J. Bøgestrand, E. Jeppensen & M. Søndergaard,
1995. Impact of submerged macrophytes on fish-zoo-
plankton-phytoplankton interactions: Large-scale enclo-
sure experiments in a shallow eutrophic lakes. Freshwater
Biology 33: 255–270.
Shannon, C. E. & W. Weaver, 1949. The Mathematical Theory
of Communication. The University of Illinois Press,
Urbana, Illinois. 19–27, 82–83, 104–107.
Shepherd, G. J., 1996. Fitopac 1: manual do usuario.
Departamento de Botanica, Universidade Estadual de
Campinas, Campinas.
Solorzano, L., 1969. Determination of ammonia in natural
waters by the phenolhypochlorite method. Limnolology
and Oceanography 14: 799–801.
244 Hydrobiologia (2011) 665:229–245
123

Sommer, U., 1988. Some size relationships in phytoflagellate
motility. Hydrobiologia 161: 125–131.
Søndergaard, M. & B. Moss, 1998. Impact of submerged
macrophytes on phytoplankton in shallow freshwater
lakes. In Jeppensen, E., M. Søndergaard & K. Christof-
fersen (eds), The Structuring Role of Submerged Macro-
phytes in Lakes. Ecological Studies 131. Springer Verlag,
New York: 115–132.
Strickland, J. D. & T. R. Parsons, 1965. A manual of sea water
analysis. Bulletin of the Fisheries Board of Canada 125:
1–185.
Struffaldi-de-Vuono, Y., M. I. Martin-Silveira & L. M. Do-
mingos, 1984. Poluicao atmosferica e elementos toxicos
na Reserva Biologica do Instituto de Botanica, Sao Paulo,
Brasil. Revista Brasileira de Botanica 7: 149–156.
Sun, J. & D. Liu, 2003. Geometric models for calculating cell
biovolume and surface area for phytoplankton. Journal of
Plankton Research 25: 1331–1346.
Takamura, N., Y. Kadono, M. Fukushima, M. Nakagawa & B.
O. Kim, 2003. Effects of aquatic macrophytes on water
quality and phytoplankton communities in shallow lakes.
Ecological Research 18: 381–395.
Tittel, J., V. Bissinger, B. Zippel, U. Gaedke, E. Bell, A. Lorke
& N. Kamjunke, 2003. Mixotrophs combine resource use
to outcompete specialists: Implications for aquatic food
webs. Proceedings of the National Academy of Science
100: 12776–12781.
Toledo Jr., A. P. T., M. Talarico, S. J. Chinez & E. G. Agudo,
1983. A aplicacao de modelos simplificados para a ava-
liacao de processo de eutroficacao em lagos e reservato-
rios tropicais. In Anais do 128 Congresso Brasileiro de
Engenharia Sanitaria e Ambiental, Camboriu.
Utermohl, H., 1958. Zur vervollkommnung der quantitativen
Phytoplankton-methodik. Mitteilungen Internationale
Vereinigung fur Theoretische und Angewandte Limnolo-
gie 9: 1–38.
Valderrama, J. C., 1981. The simultaneous analysis of total
nitrogen and total phosphorus in natural waters. Marine
Chemistry 10: 109–122.
Vollenweider, R. A. & J. Kerekes, 1982. Eutrophication:
Monitoring, Assessment and Control. Organization for
Economic Cooperation and Development, Paris.
Wehr, J. D. & L. M. Brown, 1985. Selenium requirement of a
bloom-forming planktonic alga from softwater and acid-
ified lakes. Canadian Journal of Fisheries and Aquatic
Sciences 42: 1783–1788.
Wehr, J. D., L. M. Brown & K. O’Grady, 1985. Physiological
ecology of the bloom forming alga Chrysochromulinabreviturrita (Prymnesiophyceae) from lakes influenced by
acid precipitation. Canadian Journal of Botany 63:
2231–2239.
Hydrobiologia (2011) 665:229–245 245
123
Copyright © 2022 FDOKUMEN