Intergovernmental Transfers: The Vertical Sharing Dimension
39
Intergovernmental Transfers: The Vertical Sharing Dimension ROY BAHL Andrew Young School of Policy Studies and SALLY WALLACE 1 Andrew Young School of Policy Studies 1. Introduction There are two dimensions to the structure of an intergovernmental transfer: the vertical share and the horizontal share (Bahl and Linn, 1992). The vertical share is the total pool of funds to be allocated to subnational governments, while the horizontal shares are the amounts received by eligible local governments. Most research (and most political attention) is devoted to the latter. The subject of this paper is vertical sharing. We have three goals. The first is a quantitative analysis of trends and cross-country variations in vertical sharing. In particular, we are interested in whether there has been an increase in the importance of intergovernmental fiscal transfers and in the question of what explains the cross-country variations in this importance. The second is a description of the range of the practice in vertical sharing. Finally, we offer some criteria by which the impact of vertical sharing might be evaluated. 2. Determining the Vertical Share 2 How should the total amount of transfers to subnational governments be determined? This is the first question to be answered in designing an intergovernmental transfer system, and it is arguably the most politically charged question. There is no one best way to determine the vertical share. Where you stand on the answer to this question 1 We are grateful to Robynn Cox and Bayar Tumennasan for valuable research assistance. 2 Drawn from Bahl (in process).
Transcript of Intergovernmental Transfers: The Vertical Sharing Dimension

Intergovernmental Transfers: The Vertical Sharing Dimension
ROY BAHL Andrew Young School of Policy Studies
and SALLY WALLACE1
Andrew Young School of Policy Studies
1. Introduction
There are two dimensions to the structure of an intergovernmental transfer: the vertical share and the horizontal share (Bahl and Linn, 1992). The vertical share is the total pool of funds to be allocated to subnational governments, while the horizontal shares are the amounts received by eligible local governments. Most research (and most political attention) is devoted to the latter. The subject of this paper is vertical sharing. We have three goals. The first is a quantitative analysis of trends and cross-country variations in vertical sharing. In particular, we are interested in whether there has been an increase in the importance of intergovernmental fiscal transfers and in the question of what explains the cross-country variations in this importance. The second is a description of the range of the practice in vertical sharing. Finally, we offer some criteria by which the impact of vertical sharing might be evaluated. 2. Determining the Vertical Share2 How should the total amount of transfers to subnational governments be determined? This is the first question to be answered in designing an intergovernmental transfer system, and it is arguably the most politically charged question. There is no one best way to determine the vertical share. Where you stand on the answer to this question 1 We are grateful to Robynn Cox and Bayar Tumennasan for valuable research assistance. 2 Drawn from Bahl (in process).
Challenges in the Design of Fiscal Equalization and Intergovernmental Transfers 2
will depend on where you sit. A central government official is likely to have a very different view than a local government official. However, whether or not the question is explicitly raised or nationally debated, every country makes a decision about vertical sharing. One might begin the search for the “right” approach to vertical sharing by estimating the size of the gap that is to be filled by intergovernmental fiscal transfers. The gap for the local government sector is the difference between (a) the amount it can raise from own revenue sources if it exerts a “normal “ revenue effort, and (b) the amount it must spend to provide a minimum acceptable level of government services. This needs-resources gap (G) might be defined more precisely as
∑ −=i
ii REG )~~( (1)
where iR~ = the revenue raised from own sources at “normal” effort in local government i.
iE~ = the amount of expenditure needed to provide a minimum acceptable level of (assigned) services in local government i.
The total grant fund to be allocated to all local governments, the vertical share (VS), is
equal to
VS = CR
Gα (2)
Where α is the percent of the needs-resources gap that the central government would like to cover with the transfer, and CR is the total amount of revenue (or tax revenue) raised by the central (or state) government. This norm of vertical balance in an intergovernmental system is more easily conceptualized than it is measured. Particularly, the issue of measurement of the cost of providing a minimum level of services is difficult and very subjective. There have been numerous attempts to make such a measurement, but few if any countries have been successful at gaining wide acceptance while using this approach to defining the vertical share3. In addition, the definition of a normal level of tax effort by subnational governments is very hard to establish when tax bases often cannot be measured. The result is that few countries attempt to use a direct, objective measurement of (G) to establish a vertical share. While a vertical share will be arrived at, it is more likely to be
3 The system of expenditure “norms” of the transition countries was theoretically an attempt to estimate needs at all levels of government. However, the expenditure “needs” calculations were increasingly overshadowed over time by budget pressure and were therefore ignored (Bahl, et al 1999, Martinez-Vazquez and Boex, 1999). In some countries such as Japan, and the United Kingdom, more explicit needs calculations are made each year (see Alm, 1999).
Intergovernmental Transfers: The Vertical Dimension
3
determined subjectively than objectively. It is rare for the “gap” to be publicly discussed and announced. A second issue is affordability. Expenditure need is a subjective matter, and desires for local services always far outweigh the capacity (or willingness) to finance these services. So, not only must the central government take the expenditure needs of subnational governments into account, but also it must estimate the extent to which these needs can be covered by available central and local resources. Whatever the true gap between needs and resources at the subnational government level, it is unlikely to be filled completely from central government revenues. Almost always, the vertical share ultimately will be determined by a bargaining over what the subnational governments want and what the central government thinks it can afford.
3. Trends and Measurement
We might take a purely positive approach to the question of whether the importance of intergovernmental transfers has been increasing. This raises the question of how one should measure “importance.” Most often, analysts use transfers to subnational governments (SNGs) as a percent of SNG expenditures as the measure of importance. This tells us about the fiscal dependence of SNGs on transfers from higher level governments, and whether it has be increasing. It cannot tell us, however, if fiscal dependence has increased because local government expenditures were reduced, because the central government increased the level of intergovernmental transfers, or because local governments reduced the rate of their own revenue mobilization.
A second approach would concentrate on the importance of transfers from the vantage point of the higher level (grant-giving) government. Using this approach we might ask the question of whether the central government has increased the level of its intergovernmental transfers as a percent of the taxes it raises. This comes closest to a measure of the vertical share as defined in equation (2). It provides a statement of the priority that central governments give to intergovernmental transfers. The problem with this measure is that it does not distinguish between a higher effort that is due to reduced central government revenue mobilization and a higher effort that is due to discretionary increases in transfers as a percent of total tax revenues raised.
The third approach would focus on the importance of transfers relative to the size of the economy. The measure of importance in this case would be intergovernmental transfers as a percent of GDP. This measure, however, is independent of both the level of central government taxes and the level of sub national government revenues raised. A country could have a very high SNG dependence on transfers, and a very high ratio of taxes to central transfers, but still have a low ratio of intergovernmental transfers to GDP.
There is also the question of how one defines an intergovernmental transfer. Our definition of an intergovernmental transfer will be a grant of funds from the government that raised the funds, to another level of government. We distinguish this from an own source revenue of a local government, which we think is the case where the local
Challenges in the Design of Fiscal Equalization and Intergovernmental Transfers 4
government defines either the tax rate, the tax base, or both. So, for example, we would treat a central government tax that is allocated in part or fully to the local government where collection takes place as an intergovernmental transfer. If a SNG is given some freedom to levy a sur-rate on a central government tax base or central tax collections, we would treat this as a local own source revenue.
We would like to compare the importance of intergovernmental fiscal transfers across countries, using each of these indexes. The only data base that can be used for broad international comparisons of fiscal choices (that we know of) is the IMF compilation, Government Finance Statistics. The IMF uses the term “grant” and defines it as “a noncompulsory transfer from one government unit or international organization to a second government unit or international organization” (“Government Finance Statistics Manual 2001 Companion Material,” 2002). This definition appears to be close to the concept we want, hence we make use of the Government Finance Statistics data base in this comparative analysis. But there are qualifications to this use of the data. It is not clear from so aggregate a definition that each fiscal instrument that we would have identified as a transfer was so identified by the IMF. A comparison of the IMF data against that reported in some case studies, where the definitions appear to be correct, do give approximately the same results. In other cases they may not. Sub National Government Dependence
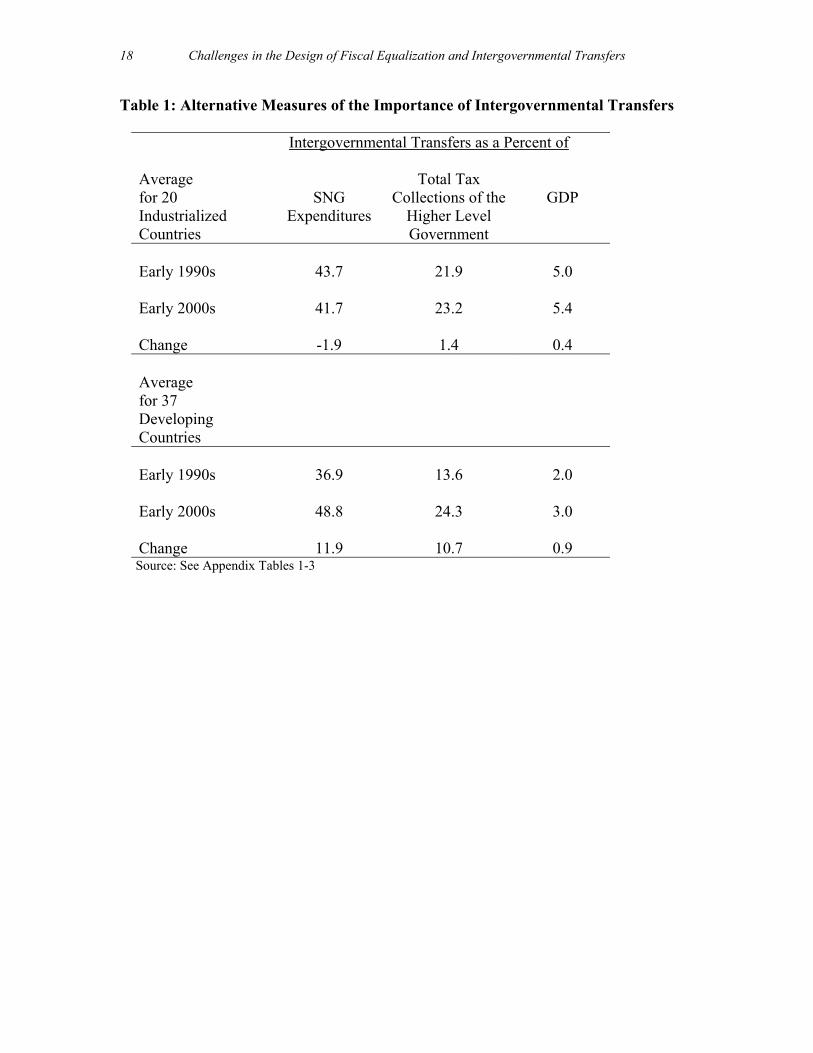
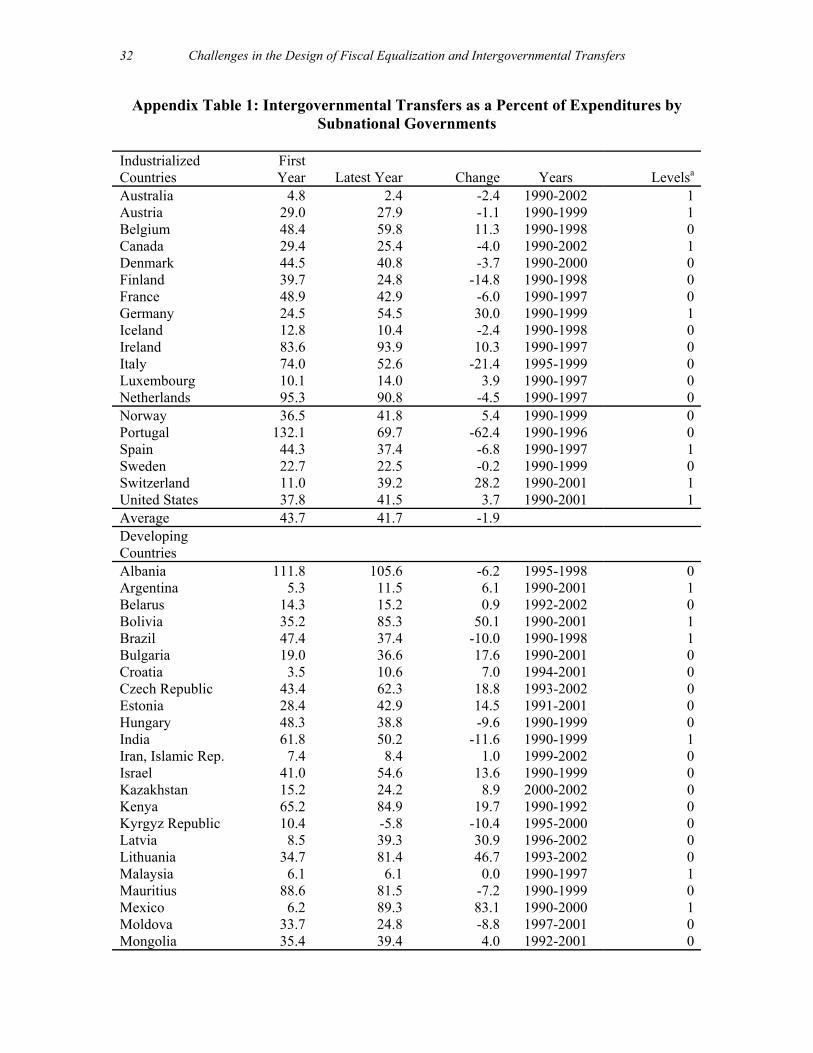
In Table 1, we present the average values for the ratio of intergovernmental transfers to SNG expenditures for all countries for which Government Finance Statistics reported information during the 1990’s. This ratio shows the revenue dependence of SNGs on higher level governments. In general we find that SNGs in most industrialized countries rely on intergovernmental transfers to finance about 40 percent of expenditures. On average, sub national governments in industrialized countries became more self sufficient during the period of the 1990s. Note that the average reliance on grants declined by 2.0 percent. This is not unexpected since the revenue raising powers of local governments tend to be greater in the industrialized countries. There is significant variation among the industrialized countries, as may be seen in Appendix Table 1.
An interesting contrast to this pattern is the case of the United States. Between
1990 and 2001, grants to state and local governments (from higher level governments) increased from 38 percent of state and local government expenditures to 42 percent. During the same period, real per capita expenditures of SNGs increased by 25 percent and real per capita taxes remained approximately constant.
The opposite pattern may be observed for the 36 less developed countries in this sample. The average dependence on intergovernmental transfers increased (Table 1). Transfers were 36.9 percent of SNG expenditures in the early 1990s and rose to 48.8 percent by the beginning of the 2000s. Fiscal dependency increased in 26 of the 36 countries under study (Appendix Table 1). This pattern is underlined by the slow growth in per capita real expenditures by SNGs. For the developing countries in this sample, the average was 7 percent.
Intergovernmental Transfers: The Vertical Dimension
5
Central Government Effort
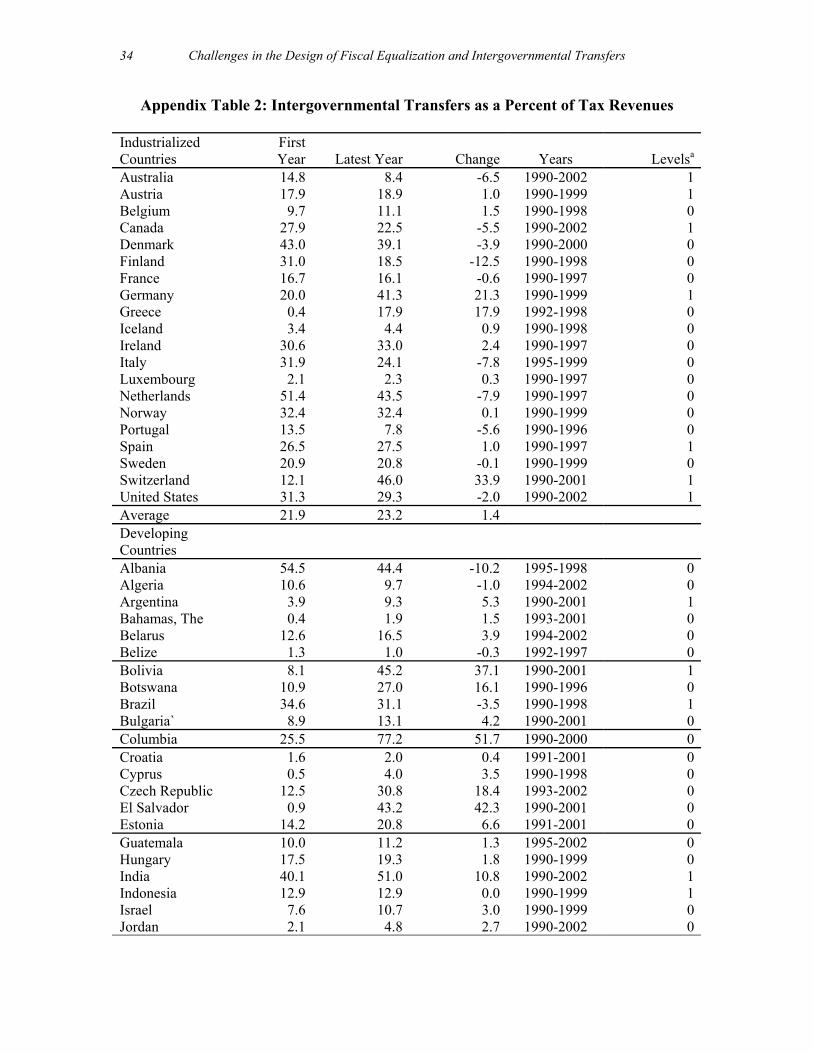
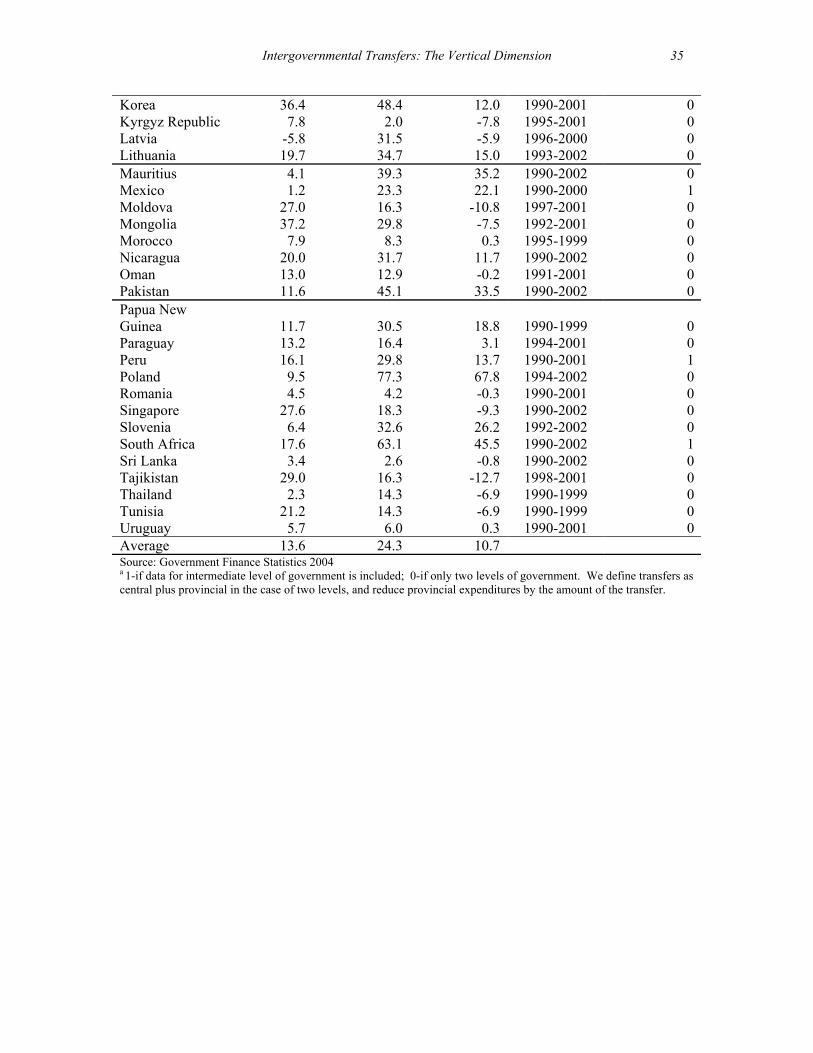
The second measure of importance is taken from the vantage of the government that gives the grant. We present data on intergovernmental transfers as a share of total tax revenue of the granting government in Table 1 and Appendix Table 2. On average, industrialized countries have chosen a vertical share equivalent to about 23 percent of total taxes collected by the granting government. This share is up by about 1.4 percent for the decade. In short, SNGs claim about one fifth of tax revenues collections of higher level governments, and this share appears to be relatively stable. The implication of this statistical trend is that SNGs have stepped up their claim on central government revenues.
For developing countries, the vertical share also is about 24 percent, about the same as that in the industrialized countries. However, there has been a quite significant increase in the less developed countries, up from about 14 percent at the beginning of the decade. The increasing claim of SNGs on central tax revenues suggests a growing importance placed on local government budgetary support. Another view of this finding is that central governments were not willing to relinquish taxing powers to SNGs, but chose instead to finance increased decentralization from centrally raised taxes.
Importance Relative to GDP
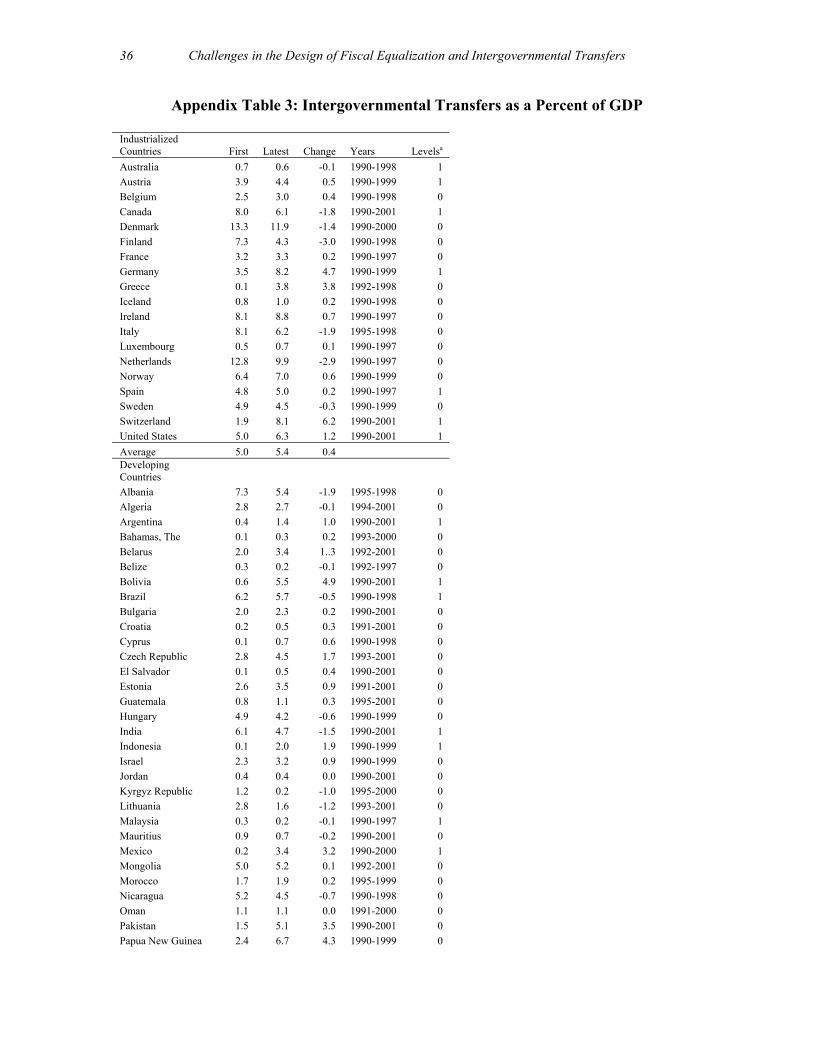
Intergovernmental transfers as a share of GDP measures the importance of transfers in the economy. On average, the share transferred to lower level governments in the industrialized countries has remained risen as a percent of GDP over the past decade. There has been a more substantial increase in the share transferred to lower level governments in developing countries. By the early 2000s, the share transferred in the developing economies had reached a little over one-half the level in the industrialized countries. More detailed data are presented in Appendix table 3.
4. Explaining the Variation
Why do some countries choose larger vertical shares than others? Why have some countries grown their vertical shares more than others? We might take a strictly positive approach to answering these questions. There is a substantial variation across countries in the percent of taxes of higher level governments that are devoted to intergovernmental transfers (See Appendix Table 2). The range for industrialized economies is from 2.3 percent in Luxembourg to 46 percent in Switzerland. For developing countries the range is from less than 1 percent in Ehtiopia to over 60 percent in South Africa.
We use a regression to explain this variation in the ratio of transfers to total
central taxes, i.e., an approximation of the actual vertical share as defined in equation (2). The dependent variable is measured as the average of the 1996-2000 period. Data are available for 20 developed and 51 developing countries.
Challenges in the Design of Fiscal Equalization and Intergovernmental Transfers 6
We expect that the level of expenditure decentralization will drive the level of the vertical share. We treat the expenditure decentralization as an endogenous variable in this two stage least squares estimation. We use several specifications of exogenous variables to explain the variation in the vertical share:4
• A dummy variable to indicate whether a country is less developed (LDC) or industrialized. We would expect that, ceteris paribus., an LDC would allocate a lower share of central taxes to intergovernmental transfers.
• A dummy variable for federal structure, which would be expected to
predict a higher level for the vertical share.
• A higher level of corruption should be related to a greater share of transfers because one might expect that more transfers increases the probability of mischief. However, the distribution of corruption may affect the equity of the distribution among subnational governments and have little overall effect on the total share of transfers.
The results of our analysis are shown below. The percent of transfers to central government taxes is most strongly correlated with the log of expenditure decentralization. Log(transfer/central tax) = -1.32 + 1.22*log(decentralization) + (0.61) (2.06)
0.23*log(corruption) -0.39*federal -0.57*(LDC) (1.00) (0.83) (1.31) pseudo R-sq = 0.25 N = 62
The results suggest that for countries with more decentralization (treated as an endogenous variable), central governments support subnational governments through a larger vertical share. The impact is substantial—a one percent increase in decentralization (measured as subnational expenditures/total expenditures) increases the vertical share by 1.22 percent. We instrumented decentralization using the log of per capita GDP, ethnicity and log of population. The LDC dummy variable is not significant. Among LDCs, we do not see a propensity toward greater use of central government taxes to finance subnational governments. A time-series analysis of the changes in the vertical share as a function of these variables may be more meaningful—due to the very large differences inherent in a cross section as is used here. This will be tested in future analysis.
4 We estimated our regression with other variables including the rate of inflation (which we expect to exert a negative effect, because inherently less stable economies would suggest holding more central tax collections to the central level), lagged structures of GDP, openness of the economy and the like. Our basic results are not sensitive to alternative specifications.
Intergovernmental Transfers: The Vertical Dimension
7
5. The Practice
Countries will typically use several different intergovernmental transfer programs in their system. Sometimes one form is dominant (e.g., shared taxes in Indonesia and the Philippines) but in other cases a mixture of grant types is used. Either way, there is an implicit or explicitly defined vertical share for each type of intergovernmental transfer.
Governments seem to have taken three basic approaches to defining the vertical share of subnational governments. The first is to share a defined percent of revenues (or taxes) of the higher-level government. This is effectively an entitlement for subnational governments, and may or may not bear a relationship to expenditure needs or local taxable capacity. The second is to use an ad hoc approach where the vertical share is defined by a discretionary decision, and may vary from year to year. The third approach is for the higher-level government to agree to cover a portion of “allowable costs.
The Shared Tax
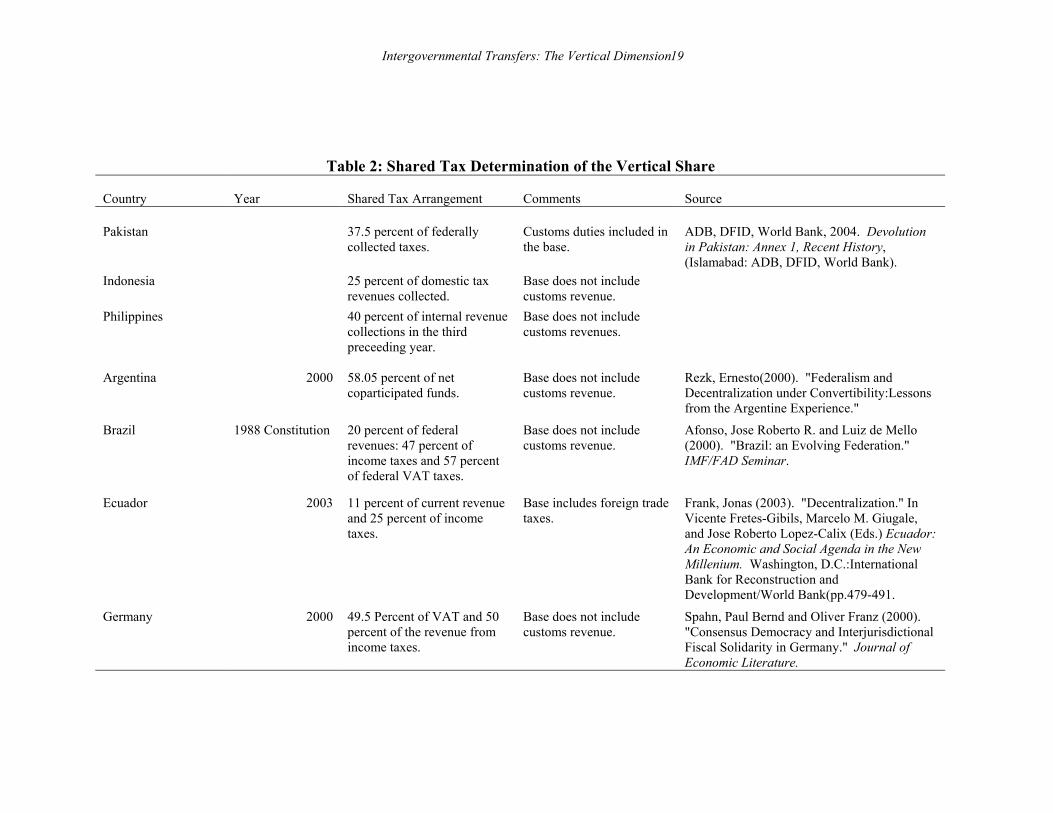
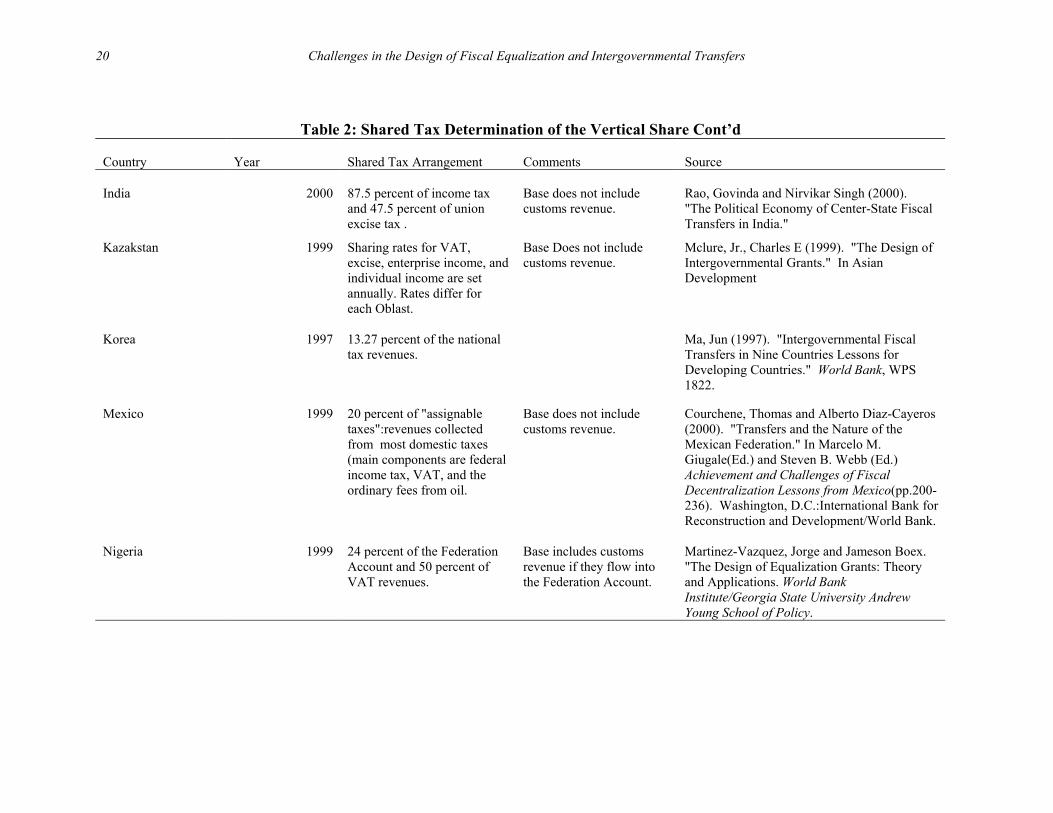
Arguably the form of vertical revenue sharing that is most in step with the goals of fiscal decentralization is the shared tax approach. In this case, the central government allocates a share of national collections of some tax to the provincial/local government sector. As may be seen in Table 2, there are many different versions of tax sharing. Vertical sharing by this method can significantly strengthen the fiscal position of the local government sector. In effect, this gives subnational governments a claim on some share of national revenues and makes them partners in the central tax system. It provides some degree of certainty as to the revenue flow to local governments, and it could give local governments access to broad-based and income-elastic taxes. From the point-of-view of the central government, the shared tax approach could seriously limit its fiscal flexibility. Even in the face of a serious fiscal deficit, the center would be obligated to pass a share of its revenues to support subnational government spending.
Two major design questions arise here: the first is the tax to be shared and the
percentage of collections to be shared. The second is whether the granting government will abide by the tax sharing rules it makes, even when its own budgets are tight.
The choice of a shared tax will depend in part on the commitment of the central government to tax sharing. Countries that are pushing subnational governments to be important players in the public service delivery system might choose major revenue sources with income elastic tax bases. At one extreme, countries may share all tax collections with their local governments. The cornerstone of the Indonesian decentralization program that took effect in 2001 was a 25 percent sharing of all “domestic” revenues. The Philippines allocates 40 percent of the total internal tax collections (in the third preceding year) to local governments. As may be seen in Table 2, this approach is not an uncommon choice for many developing countries.

Challenges in the Design of Fiscal Equalization and Intergovernmental Transfers 8
A middle ground is to share against specific taxes, but to choose those that are revenue productive and elastic. China, for example, designates 100 percent of the enterprise income tax, 60 percent of the individual income tax, and more than 25 percent of the VAT for provincial governments. Latvia earmarks 75 percent of the revenues from the personal income tax for local governments. Russia has changed its sharing rates numerous times, most recently in 2002 when VAT sharing was eliminated.
A third approach is to assign the revenues from less productive central taxes to subnational governments, or to assign only a small percent of collections. The property tax is a central government tax in Indonesia, and is assessed and collected by the central government. All revenues, however, are turned over to the local governments. A similar situation exists in Jamaica, though less than 100 percent of property tax revenues are shared. It is not a big surprise that advocates of fiscal decentralization often advocate shared taxes as the best approach to vertical sharing. It gives subnational governments a fixed claim on central revenues, and perhaps access to an income elastic tax base. Best of all, from the point of view of local politicians, it offers the prospects of seeing increased revenues without having to ask the voters for permission. An added, desirable feature is that shared taxes are very often passed to SNGs as unconditional grants. There are some significant drawbacks to using the shared tax method of determining the vertical share. First, subnational government revenues are directly sensitive to central government tax policy changes, if they take the form of shared taxes. For example, China shares 100 percent of enterprise income tax revenues with the provincial governments on a basis of origin of collection. Second, a high tax sharing rate may dampen the enthusiasm of the central government for vigorous enforcement thereby reducing the revenue flow to local governments. Third, there is the issue of whether the subnational government share is measured against budgeted or actual central government revenue. If the base is actual revenue, and if the central and local FY calendars are the same, there is some degree of uncertainty in the flow and fiscal planning may be compromised. If the base is the budgeted amount, both the central and subnational governments assume some risk, especially in the case of countries that are revenue dependent on export products sold in world markets. The Philippines has taken an interesting approach to this issue by sharing 40 percent to total central revenues collected three years earlier, i.e., 2002 sharing is based on 1999 collections. Finally, tax sharing raises political problems. What happens when the higher level government, who makes the tax sharing rules, runs into a tight fiscal situation? Will it view the sharing rates as an inviolate contract, or will it cut them back to preserve some of its own programs? The record is mixed on this. In some past years, the Philippine government has funded well less than its full commitment to subnational governments. Capuno, Manuel and Salvador (2001) calculate that during the 1995-1999 period, the actual grant allocation averaged only about 12 percent vs. the 40 percent entitlement. The same kind of default on the tax sharing arrangement has occurred in Ecuador, (Frank, 2003). In most industrialized countries, by contrast, the percentage sharing arrangements

Intergovernmental Transfers: The Vertical Dimension
9
seem to have been protected, even in difficult economic times.
The tax sharing approach addresses some issues but not others. It can be used to significantly improve vertical balance in the intergovernmental fiscal system, and if income-elastic taxes are shared, to maintain this new balance. It also has the advantage of giving the subnational governments a vested interest in the revenue performance of the central government tax system. Whether or not this feature can be turned to stimulating collections at the local level is an open question. It is not a good instrument to address the externality issue. For example, if sub national governments as a group are under investing in primary education, then a shared tax is likely to be a less effective remedy than a conditional grant. Nor is it likely to significantly increase the accountability of local politicians to their constituents. The tax sharing approach might produce a larger pool of funds for equalization, but whether or not it leads to more equalization will depend on the method of horizontal sharing that is chosen. Ad Hoc Transfers
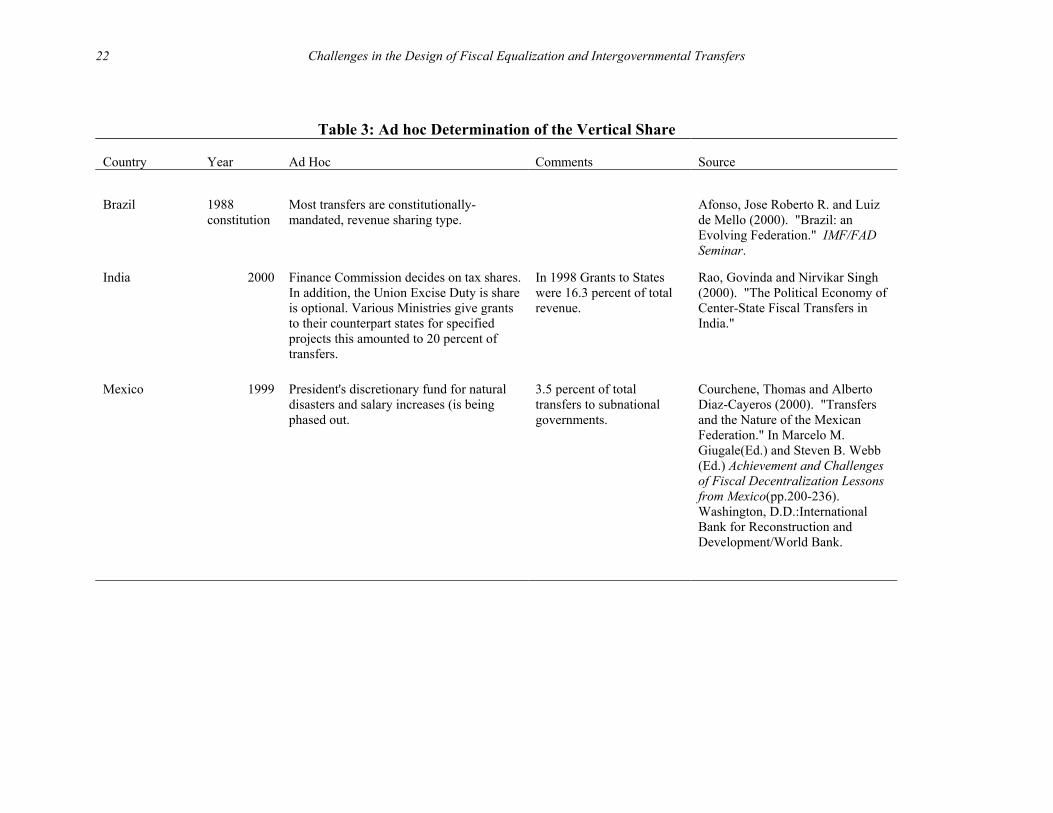
A second approach to vertical sharing is for the central government to decide on the amount of transfers on a discretionary basis. Whereas the shared tax approach gives subnational governments an entitlement, in effect an ownership of some share of central revenues, the ad hoc approach sends an opposite message: the center owns all of its revenues and may or may not choose to grant some share to the local sector. This is a centralizing approach to determining fiscal balance. At one extreme, the Parliament or the President will decide annually on an allocation to the subnational government sector. This approach to determining the vertical share often involves more negotiation and political consideration than subjective analysis, and both the approach taken and the amounts agreed upon, may vary from year-to-year. Hence it might be labeled an “ad hoc approach.”
Obviously, there are great drawbacks to this approach. First, it is not transparent,
and it is quite subject to political manipulation. This leads to uncertainties on the part of the local government sector, as they do not know what they will receive each year. Fiscal planning and effective budgeting are discouraged.
Second, the ad hoc approach makes it easier for the central government to treat
the subnational government sector as a lower priority item. When there is no statute or constitutional mandate for vertical sharing, the central government may view intergovernmental transfers as one other competing expenditure request (just as those from line agencies) and cuts (and expansions) are more easily made than in the case where the vertical share is defined as a percent of central government taxes. In this setting, the reduction in transfers can be another way to offload budget deficits.
Finally, the ad hoc approach makes it easier to deny the link between expenditure responsibilities and revenue resources. While the central government may cut or increase the local revenue share each year, they are less likely to change the expenditure functions assigned to local governments. The result is a growing vertical imbalance that can

Challenges in the Design of Fiscal Equalization and Intergovernmental Transfers 10
produce harmful effects on the level of public services provided. Another result is that subnational governments are likely to be discouraged from increasing efficiency and from becoming self-reliant if all grants are made on an ad hoc basis. Local officials will feel less in control of their budgets, and less accountable to their voters for the level of services provided. It becomes very convenient to blame any service delivery shortfalls on the inadequate resources provided by the center. For this reason, many an elected local government official will look kindly toward the ad hoc approach. On the other hand, the ad hoc approach offers some advantages, particularly in developing and transition economies. First, from the point of view of the central government, it provides maximum flexibility in carrying out macroeconomic fiscal planning. The government can implement a fiscal program with a minimum regard for a fixed committed share to the local government sector. For example, if an infrastructure development program calls for a tax increase of x percent, the increase can be accomplished without having to pay a fixed share of the increment over to the local government sector. If an expenditure austerity program calls for cuts in subnational government spending, the central government can accomplish this by simply reducing the transfer since it is not bound to a guaranteed tax share. A second advantage is that this approach will enable the central government to change national spending priorities without changing the expenditure assignments of each level of government. For example, subnational governments are more likely to spend for consumption than for infrastructure purposes. An ad hoc grant will allow the center to reduce the flow of revenues to the local sector and use the funds directly to spend on central infrastructure or other projects. Third, the ad hoc approach allows an adjustment of the subnational government claim on revenues, as the situation in the country changes. Shared tax provisions, particularly when placed in Constitutions, are not easily changed.
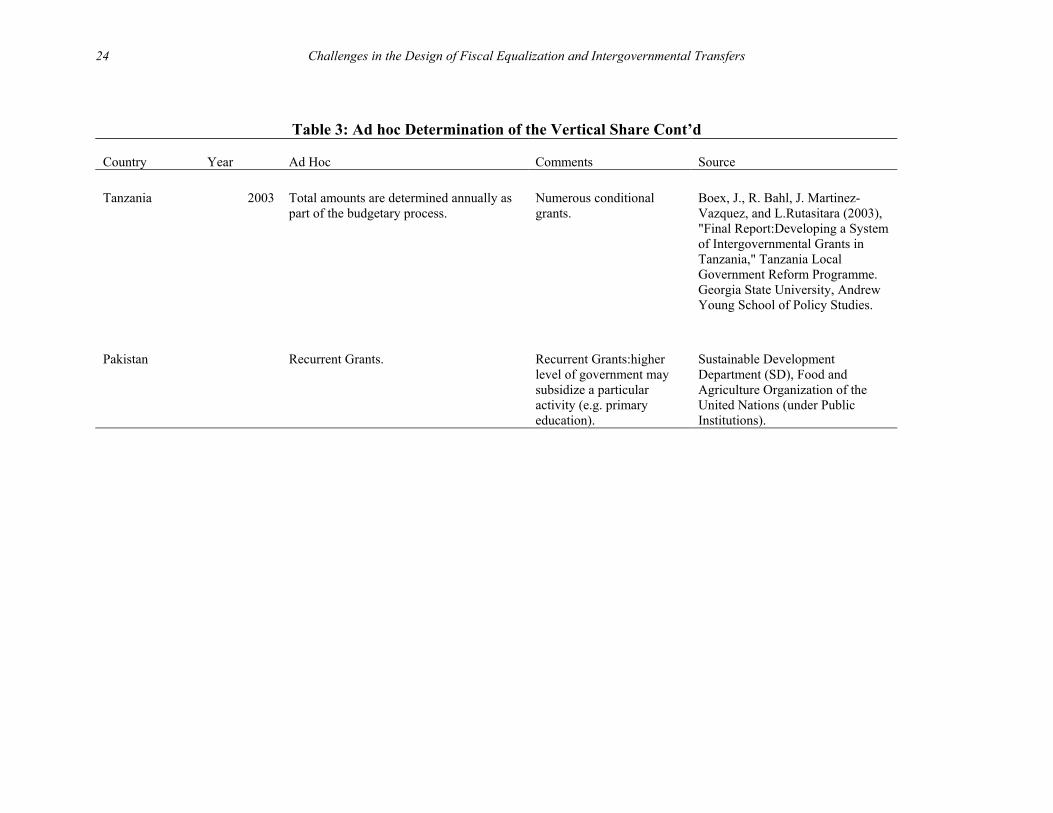
In sum, the ad hoc approach to determining the size of the distributable pool is the most centralizing approach to designing an intergovernmental transfer system. Despite some very apparent flaws, it is widely used, even in some countries that feature decentralization as part of their development plan (Table 3).
Examples abound of the ad hoc approach to vertical sharing. The FFRC, which is
Russia’s premier system of intergovernmental transfers, was in the past stated each year as a percent of central government revenues.5 However, the percent chosen was a central government decision, presumably based on the fiscal position of the central government. The funding rate (as a percent of total tax collections less import duties) was 15 percent in 1996 but had fallen to 13 percent in 1999. Such changes are large enough to compromise the budgetary certainty of local governments.
5 For a good discussion of the Russian FFRC, see Martinez and Boex (1991).
Intergovernmental Transfers: The Vertical Dimension
11
Cost Reimbursement
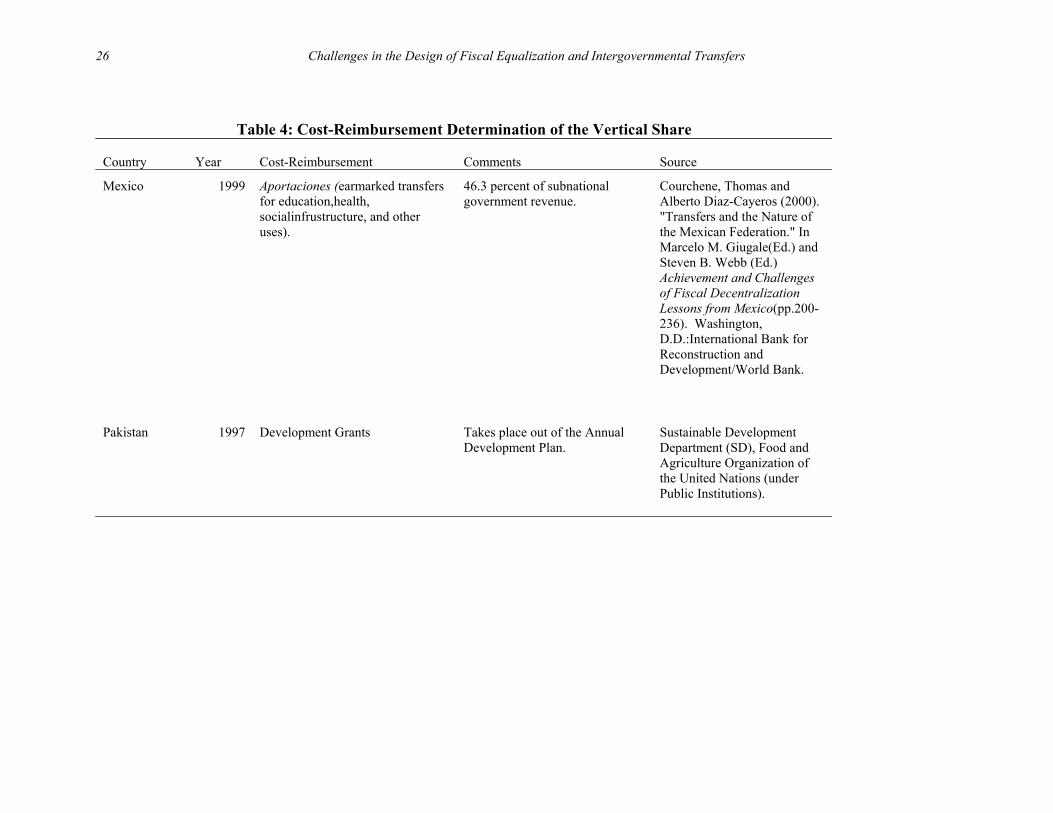
A third approach to determining the size of the revenue pool for distribution to local governments is the cost reimbursement approach. Under this approach, the central government defines a service for which it will guarantee to cover some portion of the cost incurred by local governments in delivering certain services, for example, teachers’ salaries, drugs and dressings, highway construction and maintenance, infrastructure projects, etc. (Table 4). The program could be “open-ended,” i.e., the reimbursement could cover all expenditures on this function made by SNGs. In this case, once the eligibility and reimbursement rules are established, the vertical share may be determined by simply adding up the entitlements of the eligible units. In effect the SNGs determine their horizontal shares and this determines the aggregate vertical share.
Probably the more common approach is to first determine the total amount that will be spent to reimburse costs incurred on this function, probably based on affordability, then “cut the cloth” in terms of reimbursement and eligibility. The grant typically is “closed-ended.” The cost reimbursement approach is likely to involve a large number of conditional grants that are controlled by the line ministries and are continued from year-to-year.
The great advantage, and disadvantage, of the cost reimbursement approach to
vertical sharing is its conditional nature. On the one hand it specifies how much the national (state) government desires to spend on a particular public service area. Thus the cost reimbursement grants can be used to direct investment to high priority national needs. Local governments, left to their own devices, will ignore externalities and underspend on services with regional and national benefits.
The disadvantage of the cost reimbursement approach to determining vertical shares is the compromise of local choice. This can retard true fiscal decentralization because it limits the budgetary discretion of local governments. The true-believer decentralist would much prefer an unconditional grant. Finally, the cost reimbursement approach imposes an administrative cost on the central government, who must monitor the program, and a compliance cost on the local governments who must do significant reporting on their use of funds and their adherence to standards. It is more cumbersome, and more costly to administer, than is either the shared tax or the ad hoc approach.
6. Evaluation of Vertical Sharing
How does a country evaluate its practice of vertical sharing? Are there criteria for a “good” practice that might be used? Are there norms, similar to those used for taxation, that might be applied?
Challenges in the Design of Fiscal Equalization and Intergovernmental Transfers
12
Transfers vs. Local Taxes A primary justification for intergovernmental transfers is to correct vertical imbalance. If SNGs are assigned expenditure responsibilities that require revenues that exceed the potential yield of the revenue sources they have been assigned, then transfers are called on to fill the gap. A first evaluation criteria for the intergovernmental transfer system is whether this gap has been filled according to government goals. This requires two considerations: the extent to which the SNG sector as a whole has adequate resources to provide target levels of service, and whether the right balance has been found between intergovernmental transfers and locally raised revenues. Evaluation of success according to the first criteria might be done with a combination of the quantitative analysis of indicators of public service levels, and perhaps surveys of perceptions. Determination of the right balance between locally raised revenues and transfers is only a little less subjective. In practice, the gap might be filled by increased local revenue raising powers. This solution introduces more accountability at the local level, hence might improve efficiency. The drawback is that it might increase fiscal disparities to unacceptable levels, and it might induce local governments to go on a search for taxes whose burden they might export to other jurisdictions. Since labor is not fully mobile within developing countries, the market may not automatically correct such policy moves by SNGs. The argument to fill the gap by transfers instead of local taxation can be made in terms of the greater efficiency of the central government as a tax collector. There also is the argument made by some that the level of corruption is greater at the sub national government level (Prud’homme, 1995). The problem with these arguments is that they may be a self fulfilling prophesy: if SNGs are not given taxing powers, then it is not clear that they ever will improve their tax administration capabilities. Moreover, it is not clear that the central government is a more efficient collector for all taxes (McLure, 1998). Some may argue that familiarity with the local economy might give an advantage to local governments in the case of property taxes and taxes on small businesses.
Revenue Adequacy
The vertical share should be adequate to provide the desired coverage in the financing gap, as indicated in equation (2). What is “adequate” depends on the commitment of the higher level government to support local services, and on the freedom given to local governments to raise revenues from local bases. These are the vertical balance issues discussed above. Another dimension of revenue adequacy is revenue elasticity, i.e., do transfers grow in step with the increase in SNG expenditure needs? This is an important
Intergovernmental Transfers: The Vertical Dimension
13
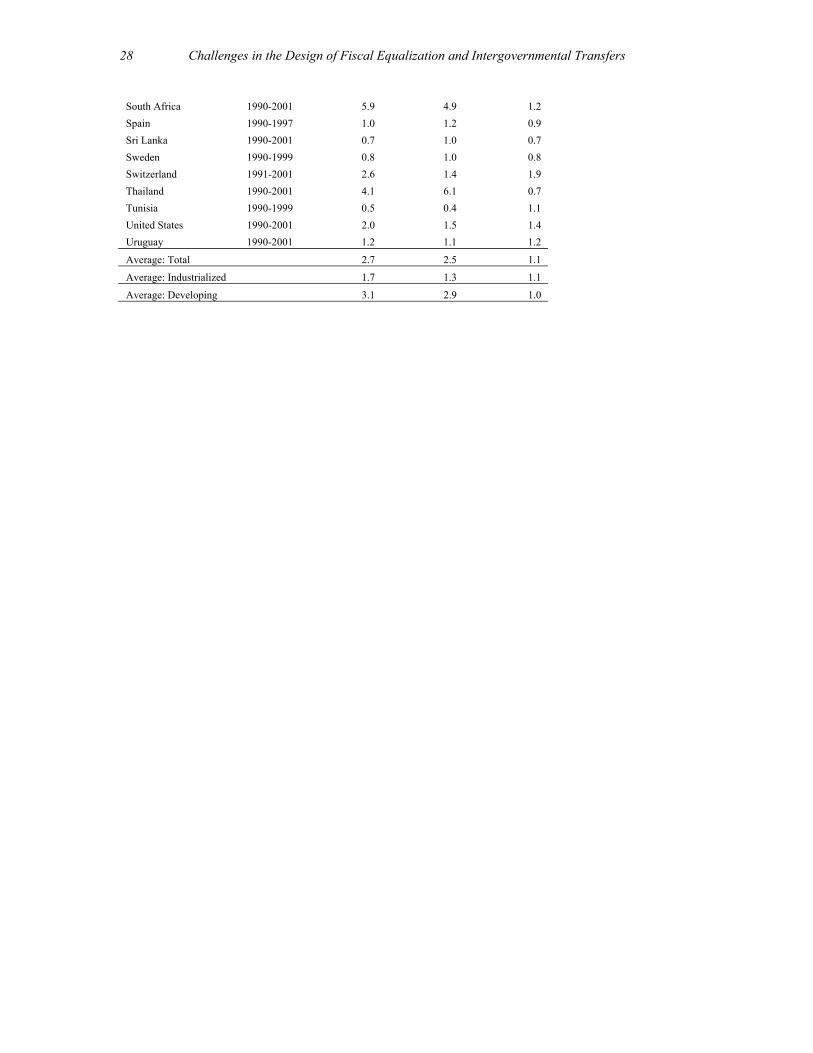
consideration. If transfers do not grow in step with expenditure needs, vertical balance in the system can erode. This has been a problem in many countries. We have calculated the elasticity of intergovernmental transfer revenues with respect to GDP6. As may be seen in Table 5, this elasticity would appear to be greater than unity for most developing countries in the sample. On average, it is 2.7 for a period covering roughly the decade of 1990s. It is, however, significantly higher for developing than for industrialized economies. To better understand the pattern of growth, we might decompose the elasticity of
intergovernmental transfers to GDP )(GDPIGT
•
, into
GDP
TT
IGTGDPIGT
•••
•=
where IGT = intergovernmental transfers
T = tax revenue of the granting government
The variation in the GDP elasticity of intergovernmental transfers may be broken into two components. The first is the elasticity of the share of transfers with respect to the tax revenue of the granting government. We might think of this as a “rate effect”, i.e., a central or state government that increases the share of its tax revenue paid to the distributable pool for local governments might be thought of as increasing the rate of distribution of intergovernmental transfers. This would tend to be the result of discretionary actions such as increasing the tax sharing rate, or increasing the ad hoc allocation of transfers to the distributable pool.
The second component is the elasticity of central government tax revenues with
respect to GDP. We might think of this as a base elasticity. An elasticity greater than unity implies an automatic increase in the effective tax rate, due to some combination of a progressive tax structure, improved administration and the development of easier tax handles. So, a country with a shared tax system that makes no discretionary changes in the sharing rates would see an increase in transfers driven by the increase in GDP.
As we can see from the data presented in Table 5, the elasticity of
intergovernmental transfers with respect to GDP varies widely across countries. The elasticity exceeds unity for 29 of 47 countries in this comparison. This means that the average level of transfers relative to total output has increased for most countries. The implication is that more weight is being placed on financing subnational governments.
6 These are calculated as arc elasticities over the beginning and end period for which data are available.
Challenges in the Design of Fiscal Equalization and Intergovernmental Transfers
14
The (potential) natural growth in transfers, the base elasticity, is shown in column 2 of Table 5. In most countries in the sample, the level of taxation increased in proportion to GDP, or at an even greater rate.
Now we ask the following question: as revenue mobilization was driven up (or
down), how did countries react with respect to the effort they made in allocation intergovernmental transfers?
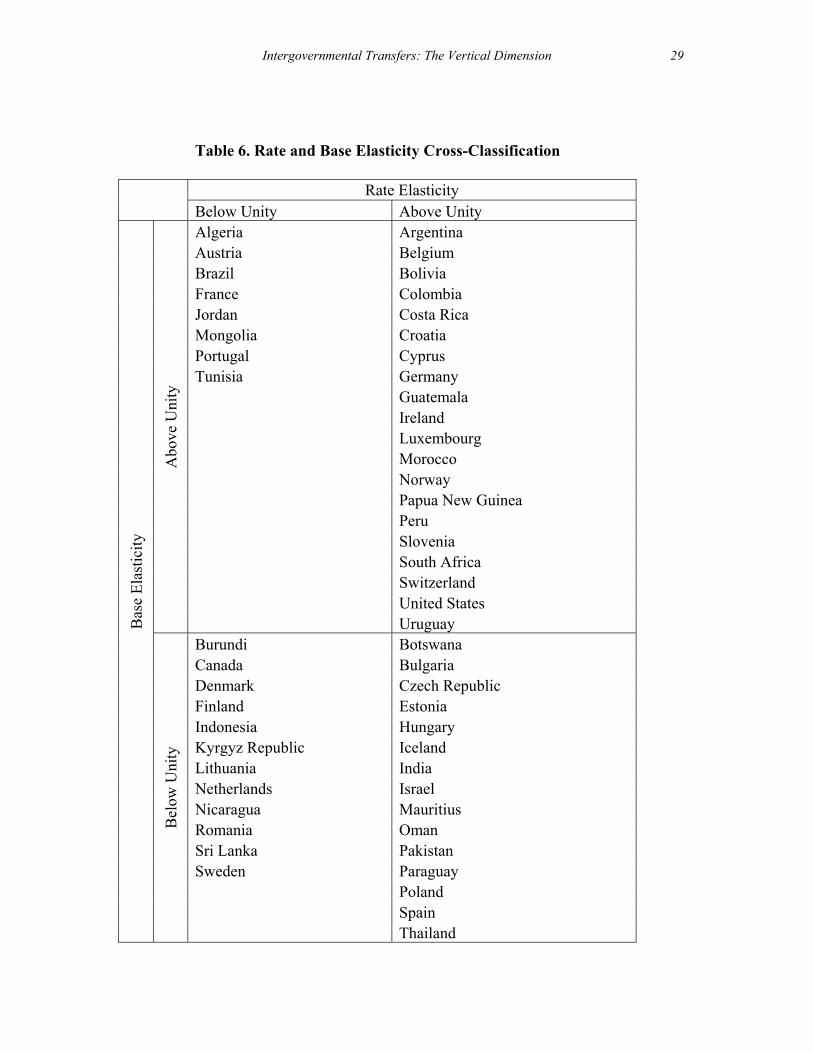
We describe the pattern in Figure 1. Countries might be seen as falling into four groups. Countries in the top right quadrant of Figure 1 had a base and rate elasticity greater than unity. This means that there was automatic growth in tax revenues that was more than proportionate to GDP, and discretionary increase in intergovernmental transfers stimulated decentralization financing even further. Countries in quadrant II compensated for a strong base growth by making discretionary cuts (or attritition cuts) in intergovernmental transfers. Countries in quadrant III de-emphasized decentralization altogether by passing on part of a slow growth in taxes to local governments with a discretionary cut in the sharing rate. Finally, those countries in quadrant IV compensated for a slow growth in the base by increasing the sharing rate.
We have grouped countries according to these four classes, and report this in Table 6. There seems no rhyme to this classification. Neither industrialized nor developing countries cluster in any one category. And there are some anomalies. We can explain the results of Indonesia by noting that these data preceed the big bang decentralization period. In other cases, the results may be colored by the fact that the elasticity is calculated with a denominator of taxes rather than total revenues7.
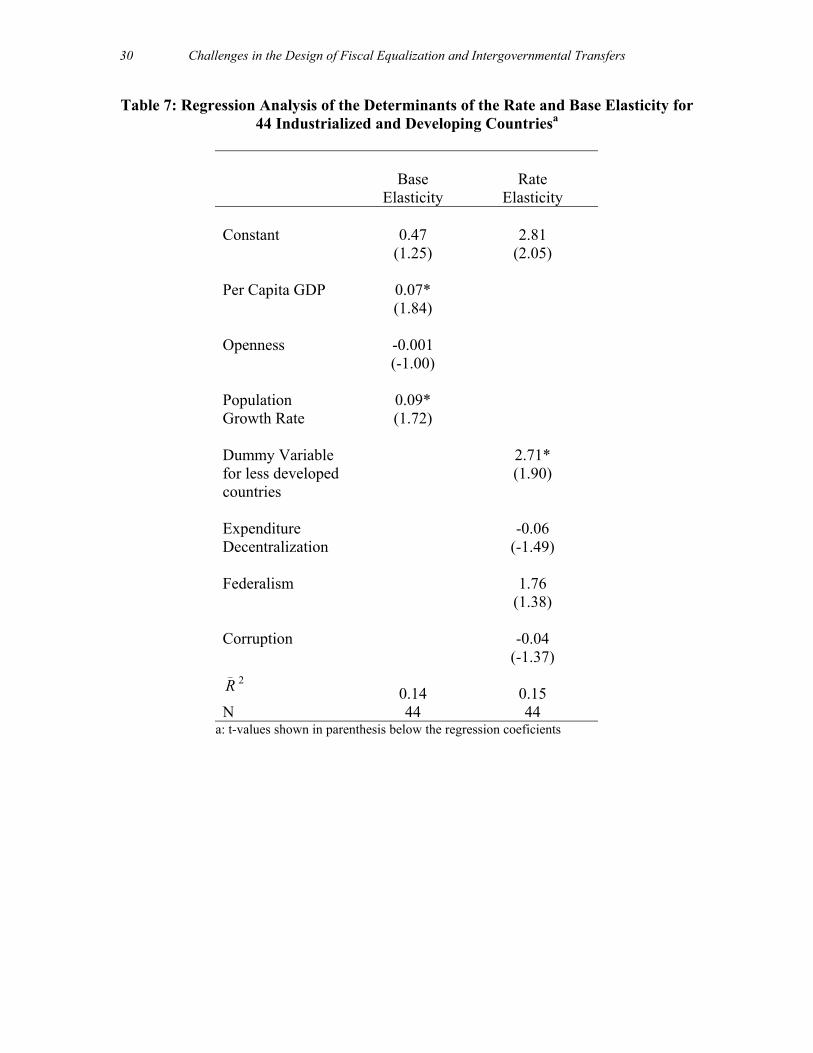
We might take this analysis one step further by attempting to identify the characteristics of countries that had a strong rate and base elasticity. We carry out a regression analysis where the dependent variables are the rate and base elasticity during the 1990s, as described in Table 5. The independent variables are measured as averages for the period of roughly the 1990s.
In the base elasticity equation, we include the standard independent variables for explaining tax revenue mobilization:
• Openness (imports plus exports as a share of GDP) should be positively related to the change in the level of revenue mobilization because it indicates the degree of trade openness and because it might identify easier tax administration for developing countries.
• Per capita GDP (in $US) should be positively related to the tax ratio
because it indicates a higher taxable capacity.
7 We have done this analysis using revenues as the base, instead of taxes, with little change in the results.
Intergovernmental Transfers: The Vertical Dimension
15
• The population growth rate should be negatively related to revenue mobilization because of the longer time period it takes to move the new population into the tax base.
In the base elasticity equation, we use four independent variables:
• A dummy variable for less developed countries. • The expenditure decentralization ratio. • A dummy variable for federal countries. • Corruption as measured by transparency international.
The results of this analysis are presented in Table 7. By these specifications, we
cannot explain the variation in the elasticities across countries. The variation would appear to be random with respect to country characteristics. Neutrality In principle, we often times justify intergovernmental transfers on grounds that the market has failed and there is a need for a correction through a transfer. Most often the market failure is an under-spending on some types of public goods that have significant external benefits. There are a number of other areas where transfers might impact choices made by governments, and some of these might not be efficiency enhancing. Three issues are worth mentioning. First, a shared tax may limit the incentive for the central government to reform the structure of the tax administration, if the central government itself does not receive any of the revenue from the enhancement. The central government property tax in Indonesia is a case in point. The center administers the tax, but the revenues accrue to the local governments. There is little incentive for the center to invest heavily in administrative or structural reform. A similar situation arises for individual and company income taxes in China, and for the individual income tax in Russia8. Second, shared taxes are a tempting target for tax avoidance. If a SNG receives only a partial share of collections within their jurisdiction, then there is incentive to find ways to understate the actual amount of taxes paid. In the case of China, local officials have found creative ways to channel collections to extra budgetary accounts and therefore avoid the tax sharing payments to the center. Some estimates place the revenues from extra budgetary taxation at an amount equivalent to 50 percent of budgetary collections (Bahl, 1999). In Russia, the “dual subordination” of tax administration has resulted in a
8 See Dahlby (1996) and Keen (1998) for a discussion of other potential strategies of subnational governments.
Challenges in the Design of Fiscal Equalization and Intergovernmental Transfers
16
tendency of subnational governments to hold onto shared revenue instead of sending it to Moscow, thus under-minding the central government (Bahl, Martinez-Vazquez, 2003). Third, Keen (1998) makes the point that changes in the centrally controlled tax rate of a shared tax, may induce subnational governments to substitute higher local taxes if central rates fall. In many countries this behavior may not be relevant if subnationals have little revenue autonomy, but it may be relevant in other cases. Keen’s argument does bring into question the impact of tax reform at the central level on the transfer policy. If central tax rates are reduced, is the vertical share reduced as well?9 Administrative Costs Vertical sharing schemes generally do not impose a large administrative cost, though the horizontal sharing can be burdensome in terms of developing and populating formulae, and monitoring conditions laid down in grant programs. Tax sharing schemes impose relatively little administrative cost because the matter is straightforward: the distributable pool receives an earmarked share of collections. Neither is an ad hoc determination of the distributable pool a complicated issue, in that the amount is fixed by political decision as an amount. Conditional, cost reimbursement grants are another matter. If the vertical share is based on an open-ended conditional transfer, it implies a significant administrative cost. Determination of the total amount for the distributable pool in this case would require an estimate of the eligible expenditures for each participating local government. A closed ended conditional transfer would be another matter.
7. Conclusions Empirical studies of fiscal decentralization have reported the somewhat surprising finding that the government expenditure share in less developed countries has not increased for two decades (Bahl and Wallace, 2003). What we show in this study is the surprising finding that the reliance on transfers, and the importance of intergovernmental transfers in the fiscal equation of higher level governments, have both increased over the past decade. We define the importance of intergovernmental transfers in three ways, and track this importance as follows:
• SNGs in industrialized countries rely on intergovernmental transfers to finance about 40 percent of their expenditures, and this share has not changed much over the past decade. The reliance on transfers is closer to 50 percent in developing countries and this share has increased markedly over the past decade.
9 Anderson et. al. (2004) provide an interesting case study of the vertical externality hypothesis for Sweden.
Intergovernmental Transfers: The Vertical Dimension
17
• The share of transfers in total tax collections of the central government is about 20 percent in both developing and industrialized countries, though it has been increasing much faster in the latter group.
• Intergovernmental transfers are equivalent to a little over 5 percent of
GDP in industrialized countries, which is nearly twice the level of developing countries.
The variation across countries in all of these indicators is substantial. We find a significant relationship between the level of decentralization and the share of transfers in total tax revenue of the central government. While that finding is not so surprising, we do find that as decentralization increases, the share of central taxes allocated to transfers increases more than proportionately.
The practice of defining the vertical share is very different from country to county. Countries choose tax sharing, ad hoc determination and cost reimbursement approaches. These institutional arrangements no doubt explain much of the growth or lack of growth in the vertical shares. We estimate the GDP elasticity of intergovernmental transfers and find that most countries increased their transfers as a percent of GDP over the past decade. However, we cannot explain the variation in these elasticities with a regression model, and must attribute it to random variation or to a failure of our specification to capture important institutional factors.
Challenges in the Design of Fiscal Equalization and Intergovernmental Transfers
18
Table 1: Alternative Measures of the Importance of Intergovernmental Transfers
Intergovernmental Transfers as a Percent of
Average for 20 Industrialized Countries
SNG
Expenditures
Total Tax Collections of the
Higher Level Government
GDP
Early 1990s 43.7 21.9
5.0
Early 2000s 41.7 23.2
5.4
Change -1.9 1.4
0.4
Average for 37 Developing Countries
Early 1990s 36.9 13.6
2.0
Early 2000s 48.8 24.3
3.0
Change 11.9 10.7
0.9
Source: See Appendix Tables 1-3
Intergovernmental Transfers: The Vertical Dimension
19
Table 2: Shared Tax Determination of the Vertical Share Country Year Shared Tax Arrangement Comments Source Pakistan
37.5 percent of federally collected taxes.
Customs duties included in the base.
ADB, DFID, World Bank, 2004. Devolution in Pakistan: Annex 1, Recent History, (Islamabad: ADB, DFID, World Bank).
Indonesia
25 percent of domestic tax revenues collected.
Base does not include customs revenue.
Philippines
40 percent of internal revenue collections in the third preceeding year.
Base does not include customs revenues.
Argentina
2000
58.05 percent of net coparticipated funds.
Base does not include customs revenue.
Rezk, Ernesto(2000). "Federalism and Decentralization under Convertibility:Lessons from the Argentine Experience."
Brazil
1988 Constitution
20 percent of federal revenues: 47 percent of income taxes and 57 percent of federal VAT taxes.
Base does not include customs revenue.
Afonso, Jose Roberto R. and Luiz de Mello (2000). "Brazil: an Evolving Federation." IMF/FAD Seminar.
Ecuador
2003
11 percent of current revenue and 25 percent of income taxes.
Base includes foreign trade taxes.
Frank, Jonas (2003). "Decentralization." In Vicente Fretes-Gibils, Marcelo M. Giugale, and Jose Roberto Lopez-Calix (Eds.) Ecuador: An Economic and Social Agenda in the New Millenium. Washington, D.C.:International Bank for Reconstruction and Development/World Bank(pp.479-491.
Germany
2000
49.5 Percent of VAT and 50 percent of the revenue from income taxes.
Base does not include customs revenue.
Spahn, Paul Bernd and Oliver Franz (2000). "Consensus Democracy and Interjurisdictional Fiscal Solidarity in Germany." Journal of Economic Literature.
Challenges in the Design of Fiscal Equalization and Intergovernmental Transfers
20
Table 2: Shared Tax Determination of the Vertical Share Cont’d Country Year Shared Tax Arrangement Comments Source
India
2000
87.5 percent of income tax and 47.5 percent of union excise tax .
Base does not include customs revenue.
Rao, Govinda and Nirvikar Singh (2000). "The Political Economy of Center-State Fiscal Transfers in India."
Kazakstan
1999
Sharing rates for VAT, excise, enterprise income, and individual income are set annually. Rates differ for each Oblast.
Base Does not include customs revenue.
Mclure, Jr., Charles E (1999). "The Design of Intergovernmental Grants." In Asian Development
Korea
1997
13.27 percent of the national tax revenues.
Ma, Jun (1997). "Intergovernmental Fiscal Transfers in Nine Countries Lessons for Developing Countries." World Bank, WPS 1822.
Mexico
1999
20 percent of "assignable taxes":revenues collected from most domestic taxes (main components are federal income tax, VAT, and the ordinary fees from oil.
Base does not include customs revenue.
Courchene, Thomas and Alberto Diaz-Cayeros (2000). "Transfers and the Nature of the Mexican Federation." In Marcelo M. Giugale(Ed.) and Steven B. Webb (Ed.) Achievement and Challenges of Fiscal Decentralization Lessons from Mexico(pp.200-236). Washington, D.C.:International Bank for Reconstruction and Development/World Bank.
Nigeria
1999
24 percent of the Federation Account and 50 percent of VAT revenues.
Base includes customs revenue if they flow into the Federation Account.
Martinez-Vazquez, Jorge and Jameson Boex. "The Design of Equalization Grants: Theory and Applications. World Bank Institute/Georgia State University Andrew Young School of Policy.

Intergovernmental Transfers: The Vertical Dimension
21
Table 2: Shared Tax Determination of the Vertical Share Cont’d Country Year Shared Tax Arrangement Comments Source
Russia
2003
100 percent of VAT federal; Excise and Corporate taxes shared.
Martinez-Vazquez, Jorge, Rider, Mark, and Wallace, Sally. “Tax Reform in the Russian Federation.” MA: Edward Elgar.(forthcoming).
South Africa
2000
Equitable share of nationally collected revenues.
Smoke, Paul (2000). "Fiscal Decentralization in East and Southern Africa:Selective Review of Experience and Thoughts on Moving Forward." IMF:Conference on Fiscal Decentralization.
Switzerland
1992
30 Percent of Federal tax on income and profits, 10 percent of withholding tax, 20 percent of tax on exemption from military.
Does not include customs revenue.
Spahn, Paul Bernd. "Intergovernmental Transfers in Switzerland and Germany." In Ehtisham Ahmad (Ed.) Financing Decentralized Expenditures An Inernational Comparison of Grants. Cheltenham, UK:Edward Elgar.
Challenges in the Design of Fiscal Equalization and Intergovernmental Transfers
22
Table 3: Ad hoc Determination of the Vertical Share Country Year Ad Hoc Comments Source
Brazil
1988 constitution
Most transfers are constitutionally-mandated, revenue sharing type.
Afonso, Jose Roberto R. and Luiz de Mello (2000). "Brazil: an Evolving Federation." IMF/FAD Seminar.
India
2000
Finance Commission decides on tax shares. In addition, the Union Excise Duty is share is optional. Various Ministries give grants to their counterpart states for specified projects this amounted to 20 percent of transfers.
In 1998 Grants to States were 16.3 percent of total revenue.
Rao, Govinda and Nirvikar Singh (2000). "The Political Economy of Center-State Fiscal Transfers in India."
Mexico
1999
President's discretionary fund for natural disasters and salary increases (is being phased out.
3.5 percent of total transfers to subnational governments.
Courchene, Thomas and Alberto Diaz-Cayeros (2000). "Transfers and the Nature of the Mexican Federation." In Marcelo M. Giugale(Ed.) and Steven B. Webb (Ed.) Achievement and Challenges of Fiscal Decentralization Lessons from Mexico(pp.200-236). Washington, D.D.:International Bank for Reconstruction and Development/World Bank.

Intergovernmental Transfers: The Vertical Dimension
23
Table 3: Ad hoc Determination of the Vertical Share Cont’d
Country Year
Ad Hoc
Comments
Source
Nigeria
1999
Discretionary Recurrent Transfers and Discretionary capital transfers.
Discretionary Recurrent Transfers: made to meet specific recurrent needs. Discretionary capital transfers: federal grants given for specific purposes in the context of the national development plan to finance expenditures, or transfers that represent on-lending of borrowing by the federal government.
Mered, Michael (1999). "Nigeria." In Teresa Ter-Minassian (Ed.) Fiscal Federalism in Theory and Practiced (pp.598-611).
Ecuador
Significant discretionary transfers.
Sometimes transfers are actually bailouts.
Frank, Jonas (2003). "Decentralization." In Vicente Fretes-Gibils, Marcelo M. Giugale, and Jose Roberto Lopez-Calix (Eds.) Ecuador: An Economic and Social Agenda in the New Millenium. Washington, D.C.:International Bank for Reconstruction and Development/World Bank(pp.479-491.
Challenges in the Design of Fiscal Equalization and Intergovernmental Transfers
24
Table 3: Ad hoc Determination of the Vertical Share Cont’d Country Year Ad Hoc Comments Source Tanzania
2003
Total amounts are determined annually as part of the budgetary process.
Numerous conditional grants.
Boex, J., R. Bahl, J. Martinez-Vazquez, and L.Rutasitara (2003), "Final Report:Developing a System of Intergovernmental Grants in Tanzania," Tanzania Local Government Reform Programme. Georgia State University, Andrew Young School of Policy Studies.
Pakistan
Recurrent Grants.
Recurrent Grants:higher level of government may subsidize a particular activity (e.g. primary education).
Sustainable Development Department (SD), Food and Agriculture Organization of the United Nations (under Public Institutions).

Intergovernmental Transfers: The Vertical Dimension
25
Table 4: Cost-Reimbursement Determination of the Vertical Share Country Year Cost-Reimbursement Comments Source
Argentina
2000
Earmarked transfers under the form of diverse funds (energy, housing, regional disequilibria, education); as well as transfers for decentralized services, road construction, or provincial social security regimes.
Rezk, Ernesto(2000). "Federalism and Decentralization under Convertibility:Lessons from the Argentine Experience."
Brazil
1988
Most transfers are constitutionally-mandated, revenue sharing type.
Afonso, Jose Roberto R. and Luiz de Mello (2000). "Brazil: an Evolving Federation." IMF/FAD Seminar.
India
2000
Matching transfers from Finance Commission were almost 15% of total state expenditures. Planning Commission makes grants and loans for implementing development plans. National Development Council calculates Planning Commission grants on the basis of the Gadgil formula, which is currently at 30 percent of plan outlay.
In 1998 Grants to States were 16.3 percent of total revenue.
Rao, Govinda and Nirvikar Singh (2000). "The Political Economy of Center-State Fiscal Transfers in India."
Challenges in the Design of Fiscal Equalization and Intergovernmental Transfers
26
Table 4: Cost-Reimbursement Determination of the Vertical Share Country Year Cost-Reimbursement Comments Source
Mexico
1999
Aportaciones (earmarked transfers for education,health, socialinfrustructure, and other uses).
46.3 percent of subnational government revenue.
Courchene, Thomas and Alberto Diaz-Cayeros (2000). "Transfers and the Nature of the Mexican Federation." In Marcelo M. Giugale(Ed.) and Steven B. Webb (Ed.) Achievement and Challenges of Fiscal Decentralization Lessons from Mexico(pp.200-236). Washington, D.D.:International Bank for Reconstruction and Development/World Bank.
Pakistan
1997
Development Grants
Takes place out of the Annual Development Plan.
Sustainable Development Department (SD), Food and Agriculture Organization of the United Nations (under Public Institutions).

Intergovernmental Transfers: The Vertical Dimension
27
Table 5. The Growth of Intergovernmental Transfers as a Percent of GDP:
Rate and Base Effects for Selected Countries
Country Year Total
Elasticity Rate Elasticity Base Elasticity Algeria 1994-2000 0.7 0.4 1.7 Argentina 1990-2001 4.7 2.3 2.0 Austria 1990-1999 1.1 0.8 1.3 Belgium 1990-1998 1.6 1.5 1.1 Bolivia 1990-2001 16.8 8.8 1.9 Botswana 1990-1996 1.6 8.6 0.2 Brazil 1990-1998 0.8 0.8 1.0 Bulgaria 1990-2001 1.1 1.5 0.8 Burundi 1991-1999 -1.1 -1.2 1.0 Canada 1990-2001 0.3 0.3 1.0 Colombia 1990-2000 3.8 3.4 1.1 Costa Rica 1990-2001 18.1 17.3 1.0 Croatia 1991-2001 2.1 1.3 1.7 Cyprus 1990-1998 20.5 15.1 1.4 Czech Republic 1993-2001 2.1 4.2 0.5 Denmark 1990-2000 0.7 0.7 1.0 Estonia 1991-2001 1.4 1.5 0.9 Finland 1990-1998 -0.7 -0.8 0.9 France 1990-1997 1.3 0.9 1.5 Germany 1990-1999 10.9 7.5 1.4 Guatemala 1995-2001 1.8 1.1 1.6 Hungary 1990-1999 0.8 1.1 0.7 Iceland 1990-1998 1.6 1.8 0.9 India 1990-2001 0.9 1.2 0.8 Indonesia 1991-1999 0.4 0.4 1.0 Ireland 1990-1997 1.2 1.2 1.0 Israel 1990-1999 1.5 1.5 1.0 Jordan 1990-2001 0.8 0.8 1.0 Kyrgyz Republic 1995-2001 -0.3 -0.4 0.8 Lithuania 1993-2001 0.4 0.6 0.7 Luxembourg 1990-1997 1.6 1.3 1.3 Mauritius 1990-2001 0.7 1.1 0.7 Mongolia 1992-2001 1.0 0.8 1.3 Morocco 1995-1999 1.7 1.2 1.4 Netherlands 1990-1997 0.2 0.2 0.7 Nicaragua 1990-1998 0.9 0.9 0.9 Norway 1990-1999 1.2 1.0 1.2 Oman 1991-2000 1.0 1.5 0.7 Pakistan 1990-2001 4.0 4.5 0.9 Papua New Guinea 1990-1999 3.8 3.4 1.1 Paraguay 1994-2001 1.5 1.5 1.0 Peru 1990-2001 2.1 1.9 1.1 Poland 1994-2001 3.4 6.3 0.5 Portugal 1990-1996 0.2 0.1 1.3 Romania 1990-2001 0.4 0.9 0.5 Slovenia 1992-2001 7.0 5.7 1.2
Challenges in the Design of Fiscal Equalization and Intergovernmental Transfers
28
South Africa 1990-2001 5.9 4.9 1.2 Spain 1990-1997 1.0 1.2 0.9 Sri Lanka 1990-2001 0.7 1.0 0.7 Sweden 1990-1999 0.8 1.0 0.8 Switzerland 1991-2001 2.6 1.4 1.9 Thailand 1990-2001 4.1 6.1 0.7 Tunisia 1990-1999 0.5 0.4 1.1 United States 1990-2001 2.0 1.5 1.4 Uruguay 1990-2001 1.2 1.1 1.2
Average: Total 2.7 2.5 1.1
Average: Industrialized 1.7 1.3 1.1
Average: Developing 3.1 2.9 1.0
Intergovernmental Transfers: The Vertical Dimension
29
Table 6. Rate and Base Elasticity Cross-Classification Rate Elasticity Below Unity Above Unity
Algeria Argentina Austria Belgium Brazil Bolivia France Colombia Jordan Costa Rica Mongolia Croatia Portugal Cyprus Tunisia Germany Guatemala Ireland Luxembourg Morocco Norway Papua New Guinea Peru Slovenia South Africa Switzerland United States
Abo
ve U
nity
Uruguay Burundi Botswana Canada Bulgaria Denmark Czech Republic Finland Estonia Indonesia Hungary Kyrgyz Republic Iceland Lithuania India Netherlands Israel Nicaragua Mauritius Romania Oman Sri Lanka Pakistan Sweden Paraguay Poland Spain
Bas
e El
astic
ity
Bel
ow U
nity
Thailand
Challenges in the Design of Fiscal Equalization and Intergovernmental Transfers
30
Table 7: Regression Analysis of the Determinants of the Rate and Base Elasticity for 44 Industrialized and Developing Countriesa
Base Elasticity
Rate
Elasticity Constant
0.47
(1.25)
2.81
(2.05) Per Capita GDP
0.07* (1.84)
Openness
-0.001 (-1.00)
Population Growth Rate
0.09* (1.72)
Dummy Variable for less developed countries
2.71* (1.90)
Expenditure Decentralization
-0.06
(-1.49) Federalism
1.76
(1.38) Corruption
-0.04
(-1.37) _R 2
0.14
0.15 N 44 44
a: t-values shown in parenthesis below the regression coeficients

Intergovernmental Transfers: The Vertical Dimension
31
Figure 1. The Interaction of Rate and Base Elasticities
0.0
1.0
2.0
3.0
-10.0 0.0 10.0 20.0
Base Elasticity
Rate
Ela
stici
ty
Challenges in the Design of Fiscal Equalization and Intergovernmental Transfers
32
Appendix Table 1: Intergovernmental Transfers as a Percent of Expenditures by Subnational Governments
Industrialized Countries
First Year Latest Year Change Years Levelsa
Australia 4.8 2.4 -2.4 1990-2002 1Austria 29.0 27.9 -1.1 1990-1999 1Belgium 48.4 59.8 11.3 1990-1998 0Canada 29.4 25.4 -4.0 1990-2002 1Denmark 44.5 40.8 -3.7 1990-2000 0Finland 39.7 24.8 -14.8 1990-1998 0France 48.9 42.9 -6.0 1990-1997 0Germany 24.5 54.5 30.0 1990-1999 1Iceland 12.8 10.4 -2.4 1990-1998 0Ireland 83.6 93.9 10.3 1990-1997 0Italy 74.0 52.6 -21.4 1995-1999 0Luxembourg 10.1 14.0 3.9 1990-1997 0Netherlands 95.3 90.8 -4.5 1990-1997 0Norway 36.5 41.8 5.4 1990-1999 0Portugal 132.1 69.7 -62.4 1990-1996 0Spain 44.3 37.4 -6.8 1990-1997 1Sweden 22.7 22.5 -0.2 1990-1999 0Switzerland 11.0 39.2 28.2 1990-2001 1United States 37.8 41.5 3.7 1990-2001 1Average 43.7 41.7 -1.9 Developing Countries Albania 111.8 105.6 -6.2 1995-1998 0Argentina 5.3 11.5 6.1 1990-2001 1Belarus 14.3 15.2 0.9 1992-2002 0Bolivia 35.2 85.3 50.1 1990-2001 1Brazil 47.4 37.4 -10.0 1990-1998 1Bulgaria 19.0 36.6 17.6 1990-2001 0Croatia 3.5 10.6 7.0 1994-2001 0Czech Republic 43.4 62.3 18.8 1993-2002 0Estonia 28.4 42.9 14.5 1991-2001 0Hungary 48.3 38.8 -9.6 1990-1999 0India 61.8 50.2 -11.6 1990-1999 1Iran, Islamic Rep. 7.4 8.4 1.0 1999-2002 0Israel 41.0 54.6 13.6 1990-1999 0Kazakhstan 15.2 24.2 8.9 2000-2002 0Kenya 65.2 84.9 19.7 1990-1992 0Kyrgyz Republic 10.4 -5.8 -10.4 1995-2000 0Latvia 8.5 39.3 30.9 1996-2002 0Lithuania 34.7 81.4 46.7 1993-2002 0Malaysia 6.1 6.1 0.0 1990-1997 1Mauritius 88.6 81.5 -7.2 1990-1999 0Mexico 6.2 89.3 83.1 1990-2000 1Moldova 33.7 24.8 -8.8 1997-2001 0Mongolia 35.4 39.4 4.0 1992-2001 0

Intergovernmental Transfers: The Vertical Dimension
33
Netherlands Antilles 2.6 6.9 4.3 1990-1995 0Peru 127.5 95.2 -32.3 1990-2001 1Poland 36.5 95.3 58.8 1994-2002 0Romania 18.1 7.9 -10.2 1990-2001 0Russian Federation 11.5 20.3 8.8 1999-2001 0Slovak Republic 8.8 66.7 57.9 1996-2002 0Slovenia 27.3 30.0 2.7 1992-2002 0South Africa 69.7 91.1 21.4 1990-2002 1Tajikistan 29.9 31.6 1.7 1999-2001 0Thailand 58.0 98.2 40.2 1990-2002 0Uganda 103.9 98.5 -5.4 1999-2001 0Ukraine 26.1 32.1 6.0 2000-2001 0Average 36.9 48.8 11.9 Source: Government Finance Statistics 2004
a 1-if data for intermediate level of government is included; 0-if only two levels of government. We define transfers as central plus provincial in the case of two levels, and reduce provincial expenditures by the amount of the transfer.
Challenges in the Design of Fiscal Equalization and Intergovernmental Transfers
34
Appendix Table 2: Intergovernmental Transfers as a Percent of Tax Revenues
Industrialized Countries
First Year Latest Year Change Years Levelsa
Australia 14.8 8.4 -6.5 1990-2002 1Austria 17.9 18.9 1.0 1990-1999 1Belgium 9.7 11.1 1.5 1990-1998 0Canada 27.9 22.5 -5.5 1990-2002 1Denmark 43.0 39.1 -3.9 1990-2000 0Finland 31.0 18.5 -12.5 1990-1998 0France 16.7 16.1 -0.6 1990-1997 0Germany 20.0 41.3 21.3 1990-1999 1Greece 0.4 17.9 17.9 1992-1998 0Iceland 3.4 4.4 0.9 1990-1998 0Ireland 30.6 33.0 2.4 1990-1997 0Italy 31.9 24.1 -7.8 1995-1999 0Luxembourg 2.1 2.3 0.3 1990-1997 0Netherlands 51.4 43.5 -7.9 1990-1997 0Norway 32.4 32.4 0.1 1990-1999 0Portugal 13.5 7.8 -5.6 1990-1996 0Spain 26.5 27.5 1.0 1990-1997 1Sweden 20.9 20.8 -0.1 1990-1999 0Switzerland 12.1 46.0 33.9 1990-2001 1United States 31.3 29.3 -2.0 1990-2002 1Average 21.9 23.2 1.4 Developing Countries Albania 54.5 44.4 -10.2 1995-1998 0Algeria 10.6 9.7 -1.0 1994-2002 0Argentina 3.9 9.3 5.3 1990-2001 1Bahamas, The 0.4 1.9 1.5 1993-2001 0Belarus 12.6 16.5 3.9 1994-2002 0Belize 1.3 1.0 -0.3 1992-1997 0Bolivia 8.1 45.2 37.1 1990-2001 1Botswana 10.9 27.0 16.1 1990-1996 0Brazil 34.6 31.1 -3.5 1990-1998 1Bulgaria` 8.9 13.1 4.2 1990-2001 0Columbia 25.5 77.2 51.7 1990-2000 0Croatia 1.6 2.0 0.4 1991-2001 0Cyprus 0.5 4.0 3.5 1990-1998 0Czech Republic 12.5 30.8 18.4 1993-2002 0El Salvador 0.9 43.2 42.3 1990-2001 0Estonia 14.2 20.8 6.6 1991-2001 0Guatemala 10.0 11.2 1.3 1995-2002 0Hungary 17.5 19.3 1.8 1990-1999 0India 40.1 51.0 10.8 1990-2002 1Indonesia 12.9 12.9 0.0 1990-1999 1Israel 7.6 10.7 3.0 1990-1999 0Jordan 2.1 4.8 2.7 1990-2002 0
Intergovernmental Transfers: The Vertical Dimension
35
Korea 36.4 48.4 12.0 1990-2001 0Kyrgyz Republic 7.8 2.0 -7.8 1995-2001 0Latvia -5.8 31.5 -5.9 1996-2000 0Lithuania 19.7 34.7 15.0 1993-2002 0Mauritius 4.1 39.3 35.2 1990-2002 0Mexico 1.2 23.3 22.1 1990-2000 1Moldova 27.0 16.3 -10.8 1997-2001 0Mongolia 37.2 29.8 -7.5 1992-2001 0Morocco 7.9 8.3 0.3 1995-1999 0Nicaragua 20.0 31.7 11.7 1990-2002 0Oman 13.0 12.9 -0.2 1991-2001 0Pakistan 11.6 45.1 33.5 1990-2002 0Papua New Guinea 11.7 30.5 18.8 1990-1999 0Paraguay 13.2 16.4 3.1 1994-2001 0Peru 16.1 29.8 13.7 1990-2001 1Poland 9.5 77.3 67.8 1994-2002 0Romania 4.5 4.2 -0.3 1990-2001 0Singapore 27.6 18.3 -9.3 1990-2002 0Slovenia 6.4 32.6 26.2 1992-2002 0South Africa 17.6 63.1 45.5 1990-2002 1Sri Lanka 3.4 2.6 -0.8 1990-2002 0Tajikistan 29.0 16.3 -12.7 1998-2001 0Thailand 2.3 14.3 -6.9 1990-1999 0Tunisia 21.2 14.3 -6.9 1990-1999 0Uruguay 5.7 6.0 0.3 1990-2001 0Average 13.6 24.3 10.7 Source: Government Finance Statistics 2004
a 1-if data for intermediate level of government is included; 0-if only two levels of government. We define transfers as central plus provincial in the case of two levels, and reduce provincial expenditures by the amount of the transfer.
Challenges in the Design of Fiscal Equalization and Intergovernmental Transfers
36
Appendix Table 3: Intergovernmental Transfers as a Percent of GDP
Industrialized Countries First Latest Change Years Levelsa Australia 0.7 0.6 -0.1 1990-1998 1 Austria 3.9 4.4 0.5 1990-1999 1 Belgium 2.5 3.0 0.4 1990-1998 0 Canada 8.0 6.1 -1.8 1990-2001 1 Denmark 13.3 11.9 -1.4 1990-2000 0 Finland 7.3 4.3 -3.0 1990-1998 0 France 3.2 3.3 0.2 1990-1997 0 Germany 3.5 8.2 4.7 1990-1999 1 Greece 0.1 3.8 3.8 1992-1998 0 Iceland 0.8 1.0 0.2 1990-1998 0 Ireland 8.1 8.8 0.7 1990-1997 0 Italy 8.1 6.2 -1.9 1995-1998 0 Luxembourg 0.5 0.7 0.1 1990-1997 0 Netherlands 12.8 9.9 -2.9 1990-1997 0 Norway 6.4 7.0 0.6 1990-1999 0 Spain 4.8 5.0 0.2 1990-1997 1 Sweden 4.9 4.5 -0.3 1990-1999 0 Switzerland 1.9 8.1 6.2 1990-2001 1 United States 5.0 6.3 1.2 1990-2001 1 Average 5.0 5.4 0.4 Developing Countries Albania 7.3 5.4 -1.9 1995-1998 0 Algeria 2.8 2.7 -0.1 1994-2001 0 Argentina 0.4 1.4 1.0 1990-2001 1 Bahamas, The 0.1 0.3 0.2 1993-2000 0 Belarus 2.0 3.4 1..3 1992-2001 0 Belize 0.3 0.2 -0.1 1992-1997 0 Bolivia 0.6 5.5 4.9 1990-2001 1 Brazil 6.2 5.7 -0.5 1990-1998 1 Bulgaria 2.0 2.3 0.2 1990-2001 0 Croatia 0.2 0.5 0.3 1991-2001 0 Cyprus 0.1 0.7 0.6 1990-1998 0 Czech Republic 2.8 4.5 1.7 1993-2001 0 El Salvador 0.1 0.5 0.4 1990-2001 0 Estonia 2.6 3.5 0.9 1991-2001 0 Guatemala 0.8 1.1 0.3 1995-2001 0 Hungary 4.9 4.2 -0.6 1990-1999 0 India 6.1 4.7 -1.5 1990-2001 1 Indonesia 0.1 2.0 1.9 1990-1999 1 Israel 2.3 3.2 0.9 1990-1999 0 Jordan 0.4 0.4 0.0 1990-2001 0 Kyrgyz Republic 1.2 0.2 -1.0 1995-2000 0 Lithuania 2.8 1.6 -1.2 1993-2001 0 Malaysia 0.3 0.2 -0.1 1990-1997 1 Mauritius 0.9 0.7 -0.2 1990-2001 0 Mexico 0.2 3.4 3.2 1990-2000 1 Mongolia 5.0 5.2 0.1 1992-2001 0 Morocco 1.7 1.9 0.2 1995-1999 0 Nicaragua 5.2 4.5 -0.7 1990-1998 0 Oman 1.1 1.1 0.0 1991-2000 0 Pakistan 1.5 5.1 3.5 1990-2001 0 Papua New Guinea 2.4 6.7 4.3 1990-1999 0

Intergovernmental Transfers: The Vertical Dimension
37
Paraguay 1.3 1.6 0.3 1994-2001 0 Peru 1.7 3.7 1.9 1990-2001 1 Poland 2.4 6.4 4.0 1994-2001 0 Romania 1.0 0.5 -0.6 1990-2001 0 Singapore 4.2 2.8 -1.4 1990-2001 0 Slovenia 1.2 6.8 5.6 1992-2001 0 South Africa 4.0 15.5 11.5 1990-2001 1 Sri Lanka 0.6 0.5 -0.2 1990-2001 0 Thailand 0.4 1.1 0.7 1990-2001 0 Tunisia 4.2 3.0 -1.2 1990-1999 0 Uruguay 0.8 1.0 0.2 1990-2001 0 Average 2.0 3.0 0.9 Source: Government Finance Statistics 2004 a 1-if data for intermediate level of government is included; 0-if only two levels of government. We define transfers as central plus provincial in the case of two levels, and reduce provincial expenditures by the amount of the transfer.

Challenges in the Design of Fiscal Equalization and Intergovernmental Transfers
38
References
Alm, J. (1999) “International Experience with Expenditure Norms,” Georgia State University, Andrew Young School of Policy Studies Working Paper, Atlanta, GA.
Andersson, L., Aronsson, T., Wikstrom, M. (2004). “Testing for Vertical Fiscal Externalities,” International Tax and Public Finance, Vol. 11, pp. 243-263. Bahl, R. (in process). “Intergovernmental Fiscal Transfers.” ISP, Georgia State
University, Andrew Young School of Policy Studies, Atlanta, GA. Bahl, R.. and Linn J. F. (1992). Urban Public Finance in Developing Countries. World
Bank, Washington, D. C., Oxford University Press. Bahl, Roy. (1999). “Fiscal Policy in China,” 1990 Institute and University of Michigan
Press. Bahl, R., Wallace, S., Mikesell, J., Kourliandskaia, G. (1999). “Leningrad Oblast,”
Georgia State University, Andrew Young School of Policy Studies, International Studies Program Working Paper, 99-4. Atlanta, GA.
Bahl, R., Wallace, S. (2003).“Fiscal Decentralization: The Provincial – Local Dimension” in Public Finance in Developing and Transition Countries: Essays in Honor of
Richard Bird,” Eds: James Alm and Jorge Martinez-Vazquez, Pub: Edward Elgar, MA.
Dahlby, B. (1996). “Fiscal Externalities and the Design of Intergovernmental Grants,”
International Tax and Public Finance, Vol. 3, pp. 397-412. International Monetary Fund. (2003). Government Finance Statistics Yearbook. IMF:
Washington DC.
Keen, M. (1998), "Vertical Tax Externalities,” in the Theory of Fiscal Federalism" Vol. 45, No. 3.
International Monetary Fund (2002, October).“Government Finance Statistics Manual
2001 Companion Material.” IMF, Washington, D.C. Martinez-Vazquez, J. and Boex, F.J. (1999). “Fiscal Decentralization in the Russia
Federation During the Transition,” Georgia State University, Andrew Young School of Policy Studies, International Studies Program Working Paper, 99-3. Atlanta, GA.
McLure, C. E., Jr. (1998). “The Revenue Assignment Problem: Ends, Means and
Constraints,” Public Budgeting, Accounting and Financial Management, (Winter), pp. 652-683.

Intergovernmental Transfers: The Vertical Dimension
39
Oates, W.E. (1972). Fiscal Federalism. Harcourt Brace Jovanovich. New York. Prud’homme, R. (1995). “On the Dangers of Decentralization” World Bank Research
Observer. Rao, G. (1999). “Principles of Intergovernmental Transfers: Have the Finance
Commissions Followed Them?” Institute for Social and Economic Change. Working Pager 47. Bangalore, India.