TEN YEARS OF INTERNATIONAL TRANSFERS
98
TEN YEARS OF INTERNATIONAL TRANSFERS A REPORT ON INTERNATIONAL FOOTBALL TRANSFERS WORLDWIDE 2011-2020
-
Upload
khangminh22 -
Category
Documents
-
view
1 -
download
0
Transcript of TEN YEARS OF INTERNATIONAL TRANSFERS
TEN YEARS OF INTERNATIONAL TRANSFERSA REPORT ON INTERNATIONAL FOOTBALL TRANSFERS WORLDWIDE 2011-2020

2
TEN YEARS OF INTERNATIONAL TRANSFERS
3
TEN YEARS OF INTERNATIONAL TRANSFERS
Foreword 5
A. Overview 6
B. The players 12
1. Top transfers by transfer fee 14
2. Transfers by player age 18
3. Players’ nationality 20
4. Players’ salaries and contract duration 24
5. Loans of players 27
C. The clubs 28
1. Clubs and transfers 30
2. Agents’ commissions 34
3. Top clubs in the transfer market 35
a. Top 30 clubs by spending on transfer fees 36
b. Top 30 clubs by out of contract transfers 37
c. Top 30 clubs by receipts from transfer fees 38
d. Average transfer fees 39
e. Top 30 clubs with positive net balance from transfer fees 40
f. Top 30 clubs releasing players on loan 41
D. The member associations 42
1. Member associations and incoming transfers 44
2. Spending on transfer fees per association 46
3. Development of transfer fee spending by top ten associations 48
4. Member associations and outgoing transfers 50
5. Receipts from transfer fees by association 52
6. Top 30 transfer streams between member associations 54
7. Top 30 transfer fee streams between member associations 55
8. Positive/negative balances of associations in the transfer market 56
9. Agents’ commissions per member association 60
E. Numbers at confederation level 62
1. Transfers, fees and training rewards per confederation 64
F. Top clubs outside Europe 66
1. AFC: Top 20 clubs by spending on transfer fees 68
2. CAF: Top 20 clubs by spending on transfer fees 69
3. CONMEBOL: Top 20 clubs by spending on transfer fees 70
4. Concacaf: Top 20 clubs by spending on transfer fees 71
5. AFC: Top 30 clubs by number of outgoing transfers 72
6. CAF: Top 30 clubs by number of outgoing transfers 73
7. CONMEBOL: Top 30 clubs by number of outgoing transfers 74
8. Concacaf: Top 30 clubs by number of outgoing transfers 75
Overview of all member associations with international transfers 76
Definitions 94
Methodology 96
Contents

4
TEN YEARS OF INTERNATIONAL TRANSFERS
5
TEN YEARS OF INTERNATIONAL TRANSFERS
ForewordIn October 2010, following a long test period, the FIFA Transfer Matching System (TMS) was officially launched as a mandatory tool for all international transfers of male professional football players, and was later used for all such transfers in both the winter and summer transfer windows of 2011. Although the system was initially run by a FIFA subsidiary, FIFA took over the role itself after the change of leadership in February 2016.
Today, the TMS team is an integral and very important part of FIFA operations, having formally been integrated into the Legal & Compliance Division. The TMS system now covers the international transfers of not only male professional players but also of any player (woman or man, professional or amateur, adult or minor) who moves from one member association to another, regardless of the reason. Although the initial system was somewhat limited in scope, it has been significantly enhanced in recent years, especially since 2018. For example, it now records and maintains within a single system data that is vital for the stability of the employment contract between the player and a club, for the training rewards due to the clubs that have contributed to the development of the player, for agreements between clubs for potential future sell-on clauses, etc.
Transfers, especially international ones, are unique in reflecting football’s growth, players’ pathways and salaries, the use of loans, adherence to the principle of contractual stability, how and when agents are involved and, of course, training compensation and solidarity contribution.
All of this information and data from the last decade (2011-2020), which was a period of unprecedented growth for football across the board (in terms of finance, quality of play, attendances, competitions, etc.), has been analysed and is now presented in a report that, for the first time ever, offers an informative yet concise picture of the main data and top performers in different areas (such as transfer fees, employment contracts and training rewards) as well as the median and average numbers in those areas. Detailed tables of data are also included of all 200 member associations that were active in international transfers in the decade.
The report highlights once again the fact that football is the most international sport of all, and thanks to FIFA’s initiatives under President Gianni Infantino to further strengthen its global character through reforms to the transfer system and the implementation of new, technologically advanced tools to support clubs, players and agents, the game is sure to expand around the world from both a sporting and a financial perspective.
However, FIFA’s transfer reforms did not cease at the end of the decade: on the contrary, many considerably more important revisions are now being introduced and will continue to be implemented in the next few years. These reforms will further support and boost the growth of international football as well as strengthen transparency and enhance fairness. They include the FIFA Clearing House, which will be closely connected to the TMS system and become an indispensable tool to ensuring that training rewards are delivered quickly and in the full amount to the clubs that are eligible to receive them. This will revolutionise the support provided to clubs and, as a result, accelerate the development of players and football.
I very much hope you enjoy the report.
Dr Emilio García SilveroChief Legal and Compliance Officer
6
TEN YEARS OF INTERNATIONAL TRANSFERS
A. OVERVIEW
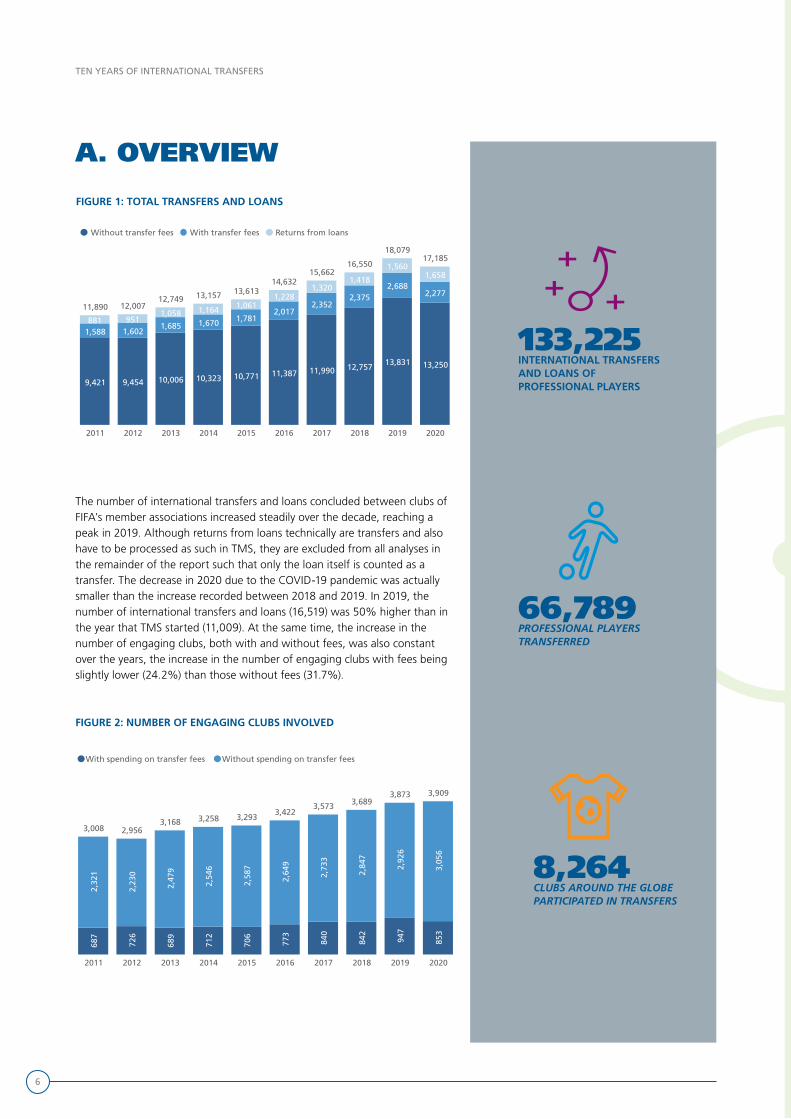
The number of international transfers and loans concluded between clubs of FIFA’s member associations increased steadily over the decade, reaching a peak in 2019. Although returns from loans technically are transfers and also have to be processed as such in TMS, they are excluded from all analyses in the remainder of the report such that only the loan itself is counted as a transfer. The decrease in 2020 due to the COVID-19 pandemic was actually smaller than the increase recorded between 2018 and 2019. In 2019, the number of international transfers and loans (16,519) was 50% higher than in the year that TMS started (11,009). At the same time, the increase in the number of engaging clubs, both with and without fees, was also constant over the years, the increase in the number of engaging clubs with fees being slightly lower (24.2%) than those without fees (31.7%).
Number of engaging clubs involved 2011 - 2020
2011 2012 2013 2014 2015 2016 2017 2018 2019 2020
687
726
689
712
706
773
840
842
947
853
2,32
1
2,23
0
2,47
9
2,54
6
2,58
7
2,64
9
2,73
3
2,84
7
2,92
6
3,05
6
3,008 2,9563,168 3,258 3,293
3,4223,573 3,689
3,873 3,909
With spending on transfer fees Without spending on transfer fees
FIGURE 1: TOTAL TRANSFERS AND LOANS
FIGURE 2: NUMBER OF ENGAGING CLUBS INVOLVED
8,264 CLUBS AROUND THE GLOBE PARTICIPATED IN TRANSFERS
133,225 INTERNATIONAL TRANSFERS AND LOANS OF PROFESSIONAL PLAYERS
66,789 PROFESSIONAL PLAYERS TRANSFERRED
2011 2012 2013 2014 2015 2016 2017 2018 2019 2020
9,421 9,454 10,006 10,323 10,771 11,387 11,990 12,75713,831 13,250
1,588 1,6021,685 1,670 1,781
2,0172,352
2,3752,688
2,277
881 9511,058 1,164 1,061
1,2281,320
1,418
1,5601,658
11,890 12,00712,749 13,157 13,613
14,63215,662
16,550
18,07917,185
Without transfer fees With transfer fees Returns from loans

7
TEN YEARS OF INTERNATIONAL TRANSFERS
2011 2012 2013 2014 2015 2016 2017 2018 2019 2020
2.85bn2.66bn
3.90bn 4.02bn 4.13bn
4.72bn
6.29bn
6.94bn7.35bn
5.63bn
Spending on transfer fees also increased significantly from USD 2.85bn in 2011 to USD 7.35bn in 2019, making the football transfer market an important part of the global economy. Young, talented players moving to different countries and continents are contributing to the development of football and the success of their clubs.
There is no better indicator for the development of football in a member association than having players that clubs from other countries and member associations wish to add to their squads. The map below illustrates football’s global nature and its constant expansion.
(Member associations that did not release players are all small territories with very small populations:
American Samoa, Anguilla, Bahamas, British Virgin Islands, US Virgin Islands, Montserrat,
Liechtenstein, Papua New Guinea, Tonga, Cook Islands and São Tomé and Princípe.)
FIGURE 3: SPENDING ON TRANSFER FEES (USD)
200 MEMBER ASSOCIATIONS RELEASED PLAYERS FOR INTERNATIONAL TRANSFERS
USD 48.5bn WAS SPENT ON TRANSFER FEES BETWEEN CLUBS
FIGURE 4: MEMBER ASSOCIATIONS RELEASING PLAYERS
8
TEN YEARS OF INTERNATIONAL TRANSFERS
Fee range (USD)
>0-500k >500k-1m >1m-5m >5m-10m >10m
11,278
2,277
4,328
1,053 1,099
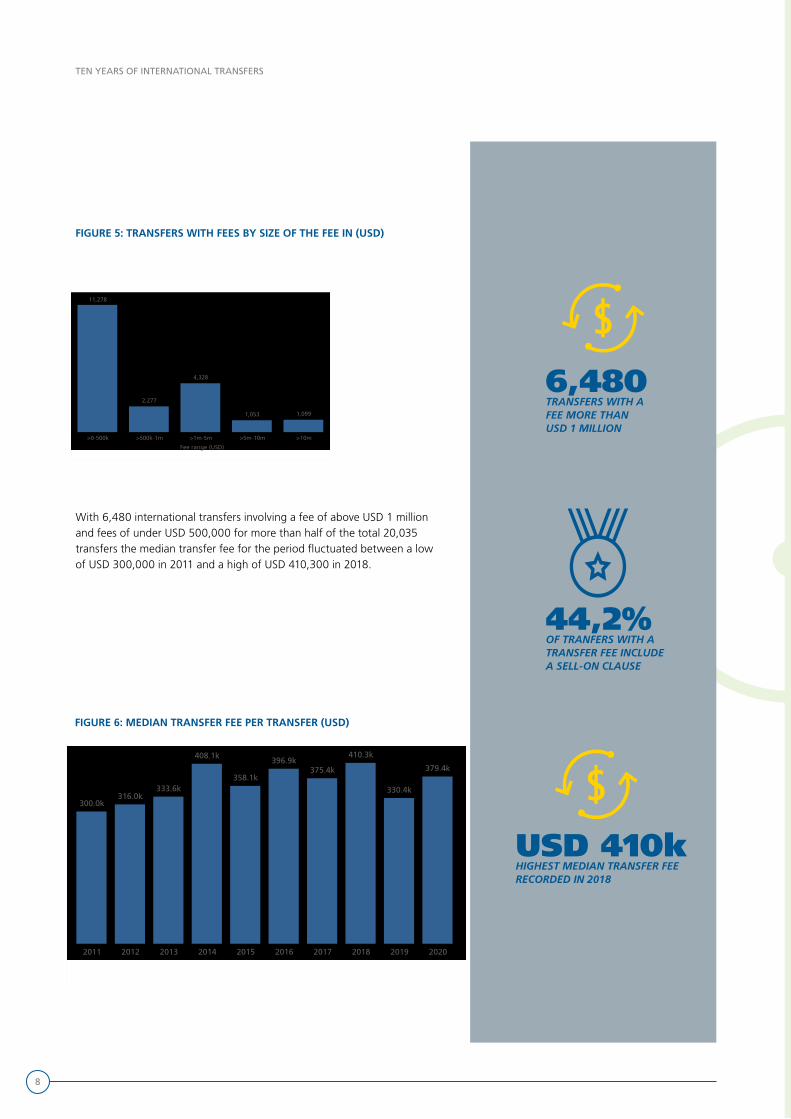
FIGURE 5: TRANSFERS WITH FEES BY SIZE OF THE FEE IN (USD)
With 6,480 international transfers involving a fee of above USD 1 million and fees of under USD 500,000 for more than half of the total 20,035 transfers the median transfer fee for the period fluctuated between a low of USD 300,000 in 2011 and a high of USD 410,300 in 2018.
Median transfer fee per transfer (USD) 2011 - 2020
2011 2012 2013 2014 2015 2016 2017 2018 2019 2020
300.0k316.0k
333.6k
408.1k
358.1k
396.9k375.4k
410.3k
330.4k
379.4k
FIGURE 6: MEDIAN TRANSFER FEE PER TRANSFER (USD)
6,480TRANSFERS WITH A FEE MORE THAN USD 1 MILLION
USD 410kHIGHEST MEDIAN TRANSFER FEE RECORDED IN 2018
44,2%OF TRANFERS WITH A TRANSFER FEE INCLUDE A SELL-ON CLAUSE

9
TEN YEARS OF INTERNATIONAL TRANSFERS
55.8%
44.2%
97.5%
2.5%
Transfers with transfer fees Transfers without transfer fees
Percentage of transfers with sell-on fee with and without transfer fees, 2016 - 2020
Without sell-on feeWith sell-on fee
A club releasing a player to another club may not always require a transfer fee, instead opting to participate in the value that the player it has developed will be helping the new club to achieve. This can be arranged by the inclusion of a sell-on fee in the transfer agreement. Sell-on fees have to be recorded in TMS since late 2015 as they became an integral part of the transfer market, especially when transfer fees were involved, with 44.2% of such transfers including a sell-on-fee clause.
FIGURE 7: PERCENTAGE OF TRANSFERS WITH SELL-ON FEE, 2016- 2020
Distribution of transfer types 2011 - 2020
0%
20%
40%
60%
80%
2011 2012 2013 2014 2015 2016 2017 2018 2019 2020
75.3%
69.4%
74.5%
71.5%73.6%
71.6%72.3%75.0%
70.3%73.9%
13.5%17.8%
13.3% 14.3%14.9% 14.1% 14.9% 15.5%14.5% 14.8%
11.2% 12.8%14.2%11.4%
14.1%11.7%
13.6%12.8%11.5% 11.6%
Out of contract Loan Permanent
FIGURE 8: TYPES OF TRANSFER
There are essentially three types of transfer: (a) the player has no employment contract (out of contract), (b) the player is transferred on loan by his current club, or (c) the player is transferred permanently by his current club.Over the period, out-of-contract transfers were the only type that declined noticeably, from a high of 75.3% in 2011 to 69.4% in 2020, although it still remains the main type of transfer. At the same time, loans fell slightly to 12.8% of total transfers in 2020 after a reaching a peak in 2017 of 14.2%, largely due to the COVID-19 pandemic.
10
TEN YEARS OF INTERNATIONAL TRANSFERS
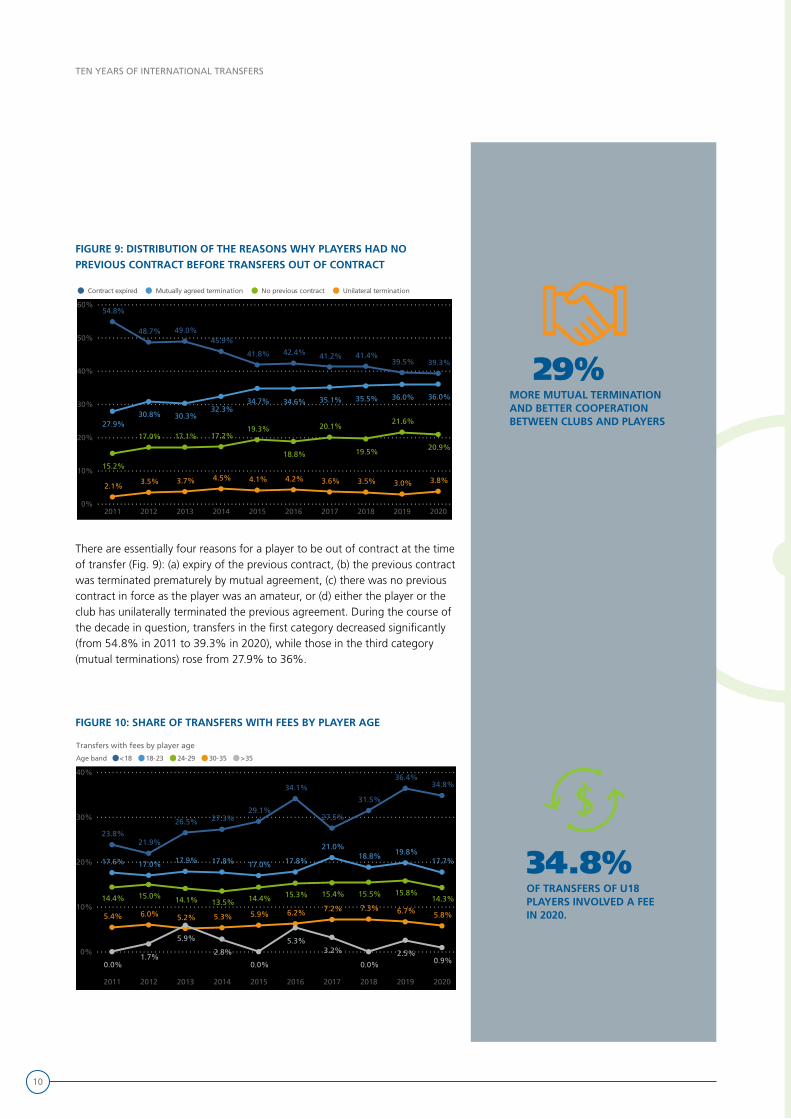
FIGURE 9: DISTRIBUTION OF THE REASONS WHY PLAYERS HAD NO PREVIOUS CONTRACT BEFORE TRANSFERS OUT OF CONTRACT
There are essentially four reasons for a player to be out of contract at the time of transfer (Fig. 9): (a) expiry of the previous contract, (b) the previous contract was terminated prematurely by mutual agreement, (c) there was no previous contract in force as the player was an amateur, or (d) either the player or the club has unilaterally terminated the previous agreement. During the course of the decade in question, transfers in the first category decreased significantly (from 54.8% in 2011 to 39.3% in 2020), while those in the third category (mutual terminations) rose from 27.9% to 36%.
Transfers with fees by player age
0%
10%
20%
30%
40%
2011 2012 2013 2014 2015 2016 2017 2018 2019 2020
23.8%
34.8%36.4%
21.9%
34.1%
27.5%27.3%
31.5%
26.5%29.1%
17.6% 17.7%
21.0%
17.0%18.8% 19.8%
17.9%17.0% 17.8% 17.8%
14.4% 14.3%15.8%
13.5%15.0% 15.4%15.3%
14.1%15.5%14.4%
5.4% 5.8%7.3%
5.2%6.0% 6.2%5.9% 6.7%7.2%5.3%
0.0% 0.9%
5.9%
0.0%
5.3%
0.0%2.5%1.7%
2.8% 3.2%
Age band <18 18-23 24-29 30-35 >35
FIGURE 10: SHARE OF TRANSFERS WITH FEES BY PLAYER AGE
29%MORE MUTUAL TERMINATION AND BETTER COOPERATION BETWEEN CLUBS AND PLAYERS
34.8%OF TRANSFERS OF U18 PLAYERS INVOLVED A FEE IN 2020.
Distribution of the reasons why players had no previous contract before transfers out of contract 2011 - 2020
0%
10%
20%
30%
40%
50%
60%
2011 2012 2013 2014 2015 2016 2017 2018 2019 2020
54.8%
39.3%41.8%
49.0%48.7%
41.4%42.4% 41.2%
45.9%
39.5%
27.9%
36.0%
30.3%
34.7% 34.6%
30.8%
35.5%32.3%
35.1% 36.0%
15.2%
20.9%
21.6%19.3%
19.5%
20.1%
18.8%
17.1%17.0% 17.2%
2.1%3.8%4.5%
3.0%4.2%4.1%3.7% 3.5%3.5% 3.6%
Contract expired Mutually agreed termination No previous contract Unilateral termination
11
TEN YEARS OF INTERNATIONAL TRANSFERS
Share of transfers with sell-on fees by player age 2016 - 2020 (sell-on fees are entered in TMS since late 2015)
0%
5%
10%
15%
20%
25%
30%
2016 2017 2018 2019 2020
24.3% 24.2%
29.6%
16.4%
27.2%
10.1%
15.9%16.0%14.6%
13.2%
5.5%7.4%
7.4%6.9%6.1%
1.1%1.4%1.1% 1.1%
0.0% 0.0%0.8% 0.0%0.0%
Age band <18 18-23 24-29 30-35 >35
Total training rewards declared (USD)
2011 2012 2013 2014 2015 2016 2017 2018 2019 2020
38.0m
38.5m
67.7m
31.2m
42.6m
55.9m
60.8m63.4m
52.7m63.8m
17.2m
13.7m
22.7m
12.2m15.4m
22.4m21.2m 20.7m 20.3m18.3m
Payment type Solidarity contribution Training compensation
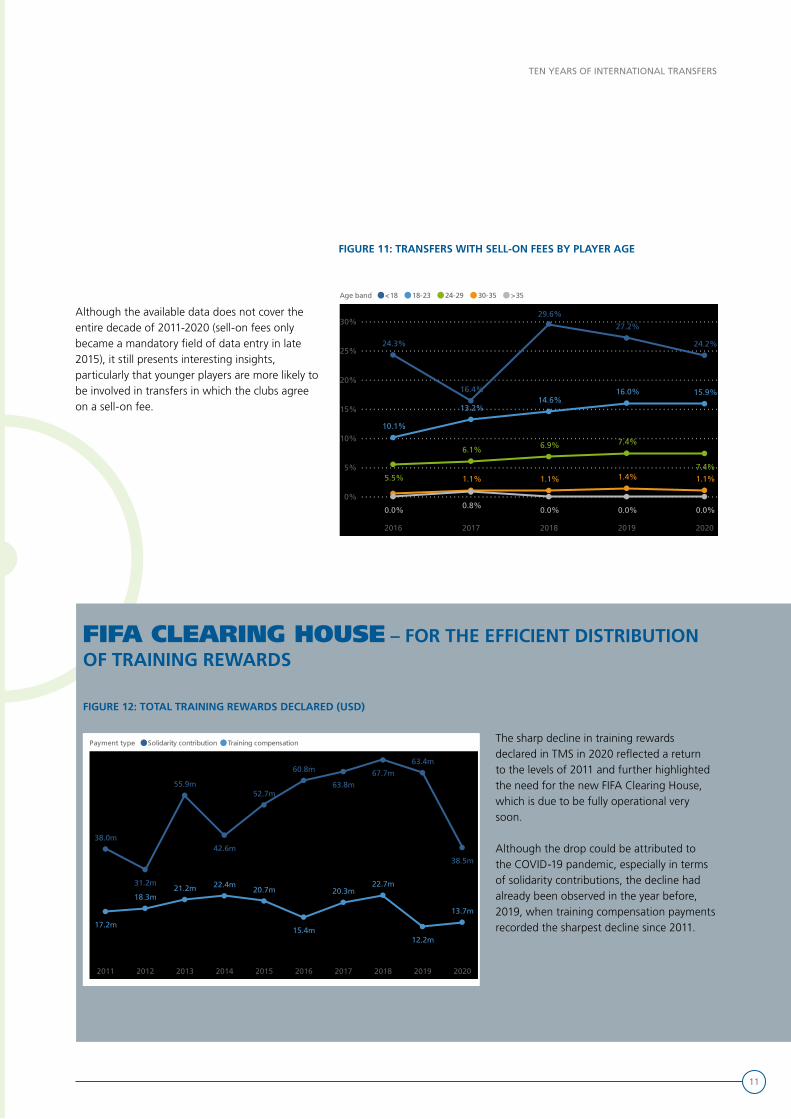
FIGURE 11: TRANSFERS WITH SELL-ON FEES BY PLAYER AGE
FIGURE 12: TOTAL TRAINING REWARDS DECLARED (USD)
Although the available data does not cover the entire decade of 2011-2020 (sell-on fees only became a mandatory field of data entry in late 2015), it still presents interesting insights, particularly that younger players are more likely to be involved in transfers in which the clubs agree on a sell-on fee.
The sharp decline in training rewards declared in TMS in 2020 reflected a return to the levels of 2011 and further highlighted the need for the new FIFA Clearing House, which is due to be fully operational very soon.
Although the drop could be attributed to the COVID-19 pandemic, especially in terms of solidarity contributions, the decline had already been observed in the year before, 2019, when training compensation payments recorded the sharpest decline since 2011.
FIFA CLEARING HOUSE – FOR THE EFFICIENT DISTRIBUTION OF TRAINING REWARDS

12
TEN YEARS OF INTERNATIONAL TRANSFERS
B. THE PLAYERS

13
TEN YEARS OF INTERNATIONAL TRANSFERS
14
TEN YEARS OF INTERNATIONAL TRANSFERS
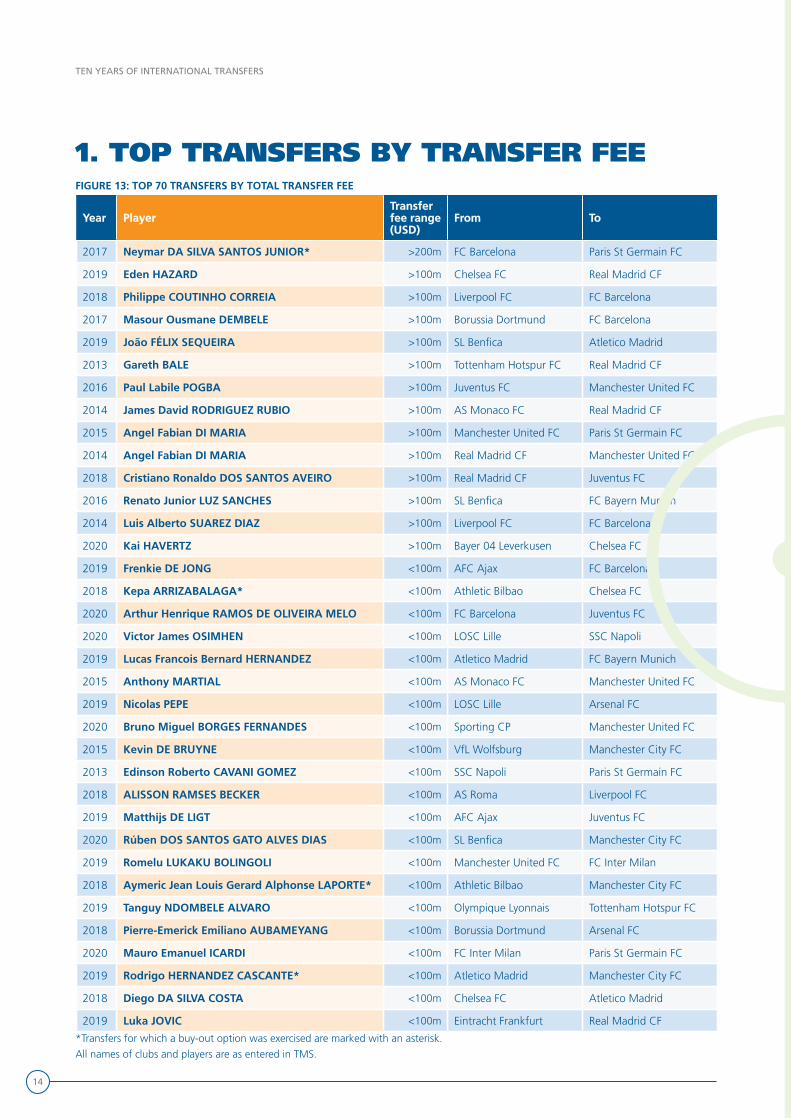
FIGURE 13: TOP 70 TRANSFERS BY TOTAL TRANSFER FEE
YearYear PlayerPlayerTransfer Transfer fee range fee range (USD)(USD)
FromFrom ToTo
2017 Neymar DA SILVA SANTOS JUNIOR* >200m FC Barcelona Paris St Germain FC
2019 Eden HAZARD >100m Chelsea FC Real Madrid CF
2018 Philippe COUTINHO CORREIA >100m Liverpool FC FC Barcelona
2017 Masour Ousmane DEMBELE >100m Borussia Dortmund FC Barcelona
2019 João FÉLIX SEQUEIRA >100m SL Benfica Atletico Madrid
2013 Gareth BALE >100m Tottenham Hotspur FC Real Madrid CF
2016 Paul Labile POGBA >100m Juventus FC Manchester United FC
2014 James David RODRIGUEZ RUBIO >100m AS Monaco FC Real Madrid CF
2015 Angel Fabian DI MARIA >100m Manchester United FC Paris St Germain FC
2014 Angel Fabian DI MARIA >100m Real Madrid CF Manchester United FC
2018 Cristiano Ronaldo DOS SANTOS AVEIRO >100m Real Madrid CF Juventus FC
2016 Renato Junior LUZ SANCHES >100m SL Benfica FC Bayern Munich
2014 Luis Alberto SUAREZ DIAZ >100m Liverpool FC FC Barcelona
2020 Kai HAVERTZ >100m Bayer 04 Leverkusen Chelsea FC
2019 Frenkie DE JONG <100m AFC Ajax FC Barcelona
2018 Kepa ARRIZABALAGA* <100m Athletic Bilbao Chelsea FC
2020 Arthur Henrique RAMOS DE OLIVEIRA MELO <100m FC Barcelona Juventus FC
2020 Victor James OSIMHEN <100m LOSC Lille SSC Napoli
2019 Lucas Francois Bernard HERNANDEZ <100m Atletico Madrid FC Bayern Munich
2015 Anthony MARTIAL <100m AS Monaco FC Manchester United FC
2019 Nicolas PEPE <100m LOSC Lille Arsenal FC
2020 Bruno Miguel BORGES FERNANDES <100m Sporting CP Manchester United FC
2015 Kevin DE BRUYNE <100m VfL Wolfsburg Manchester City FC
2013 Edinson Roberto CAVANI GOMEZ <100m SSC Napoli Paris St Germain FC
2018 ALISSON RAMSES BECKER <100m AS Roma Liverpool FC
2019 Matthijs DE LIGT <100m AFC Ajax Juventus FC
2020 Rúben DOS SANTOS GATO ALVES DIAS <100m SL Benfica Manchester City FC
2019 Romelu LUKAKU BOLINGOLI <100m Manchester United FC FC Inter Milan
2018 Aymeric Jean Louis Gerard Alphonse LAPORTE* <100m Athletic Bilbao Manchester City FC
2019 Tanguy NDOMBELE ALVARO <100m Olympique Lyonnais Tottenham Hotspur FC
2018 Pierre-Emerick Emiliano AUBAMEYANG <100m Borussia Dortmund Arsenal FC
2020 Mauro Emanuel ICARDI <100m FC Inter Milan Paris St Germain FC
2019 Rodrigo HERNANDEZ CASCANTE* <100m Atletico Madrid Manchester City FC
2018 Diego DA SILVA COSTA <100m Chelsea FC Atletico Madrid
2019 Luka JOVIC <100m Eintracht Frankfurt Real Madrid CF
*Transfers for which a buy-out option was exercised are marked with an asterisk.
All names of clubs and players are as entered in TMS.
1. TOP TRANSFERS BY TRANSFER FEE

15
TEN YEARS OF INTERNATIONAL TRANSFERS
YearYear FromFrom ToTo
2013 Santos FC (Brazil) FC Barcelona (Spain)
2012 LOSC Lille (France) Chelsea FC (England)
2010 CR Vasco da Gama (Brazil) FC Inter Milan (Italy)
2016 Stade Rennais FC (France) Borussia Dortmund (Germany)
2019 SL Benfica (Portugal) Atletico Madrid (Spain)
2013 Tottenham Hotspur FC (England) Real Madrid CF (Spain)
2012 Manchester United FC (England) Juventus FC (Italy)
2010 CA Banfield (Argentina) FC Porto (Portugal)
2010 SL Benfica (Portugal) Real Madrid CF (Spain)
2010 SL Benfica (Portugal) Real Madrid CF (Spain)
2018 Real Madrid CF (Spain) Juventus FC (Italy)
2016 SL Benfica (Portugal) FC Bayern Munich (Germany)
2011 AFC Ajax (Netherlands) Liverpool FC (England)
2020 Bayer 04 Leverkusen (Germany) Chelsea FC (England)
2019 AFC Ajax (Netherlands) FC Barcelona (Spain)
2018 Athletic Bilbao (Spain) Chelsea FC (England)
2018 Gremio FBPA (Brazil) FC Barcelona (Spain)
2017 Synergy Ultimate Strikers FC (Nigeria) VfL Wolfsburg (Germany)
2019 Atletico Madrid (Spain) FC Bayern Munich (Germany)
2015 AS Monaco FC (France) Manchester United FC (England)
2019 Lille (France) Arsenal FC (England)
2017 UC Sampdoria (Italy) Sporting CP (Portugal)
2012 KRC Genk (Belgium) Chelsea FC (England)
2013 SSC Napoli (Italy) Paris St Germain FC (France)
2016 SC Internacional (Brazil) AS Roma (Italy)
2019 AFC Ajax (Netherlands) Juventus FC (Italy)
2020 SL Benfica (Portugal) Manchester City FC (England)
2011 RSC Anderlecht (Belgium) Chelsea FC (England)
2018 Athletic Bilbao (Spain) Manchester City FC (England)
2019 Olympique Lyonnais (France) Tottenham Hotspur FC (England)
2010 LOSC Lille (France) AC Milan (Italy)
2011 FC Barcelona (Spain) UC Sampdoria (Italy)
2019 Atletico Madrid (Spain) Manchester City FC (England)
2014 Atletico Madrid (Spain) Chelsea FC (England)
2016 FK Crvena Zvezda (Serbia) Apollon Limassol (Cyprus)
*Data only includes international transfers that were entered in TMS.
Transfers that were concluded before the establishment of TMS are not included.
31 CLUBS RELEASED PLAYERS IN THE TOP 70
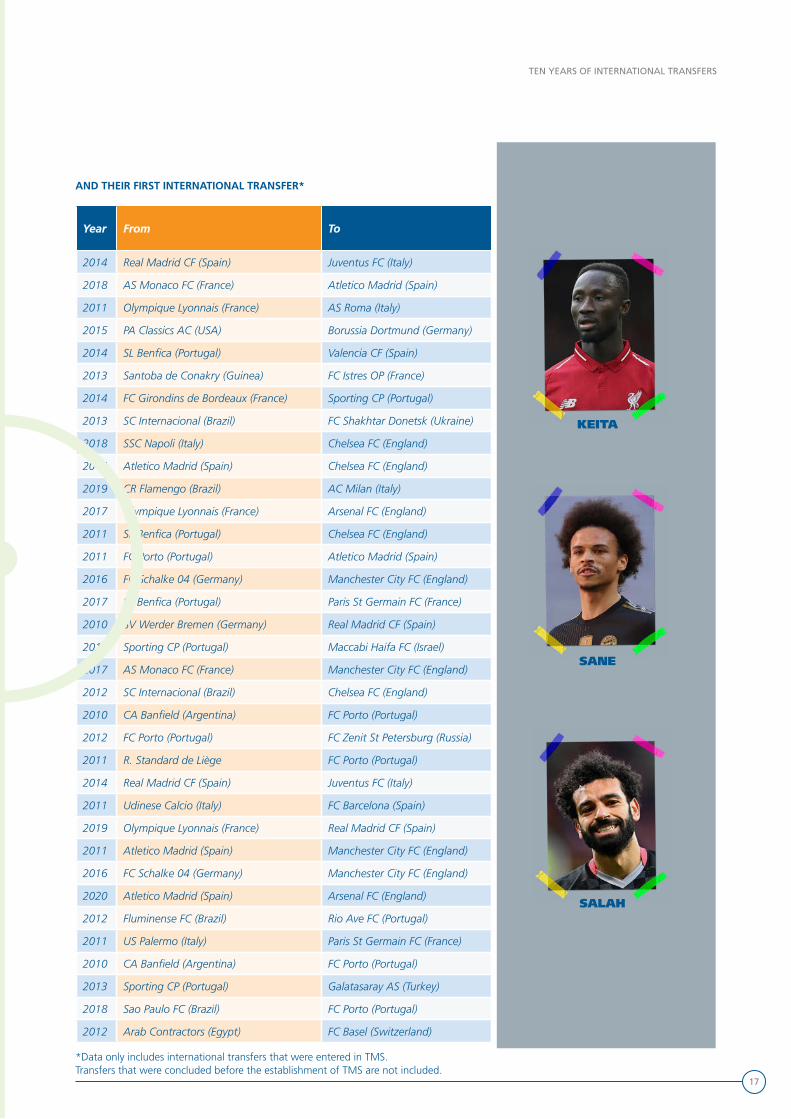
AND THEIR FIRST INTERNATIONAL TRANSFER*
NEYMAR
HAZARD
COUTHINIO

16
TEN YEARS OF INTERNATIONAL TRANSFERS
FIGURE 13: TOP 70 TRANSFERS BY TOTAL TRANSFER FEE (CONTINUED FROM PREVIOUS PAGE)
YearYear PlayerPlayerTransfer Transfer fee range fee range (USD)(USD)
FromFrom ToTo
2017 Alvaro Borja MORATA MARTIN <100m Real Madrid CF Chelsea FC
2018 Thomas LEMAR <100m AS Monaco FC Atletico Madrid
2020 Miralem PJANIC <100m Juventus FC FC Barcelona
2019 Christian Mate PULISIC <100m Borussia Dortmund Chelsea FC
2019 João Pedro CAVACO CANCELO <100m Juventus FC Manchester City FC
2018 Naby KEITA <100m RB Leipzig Liverpool FC
2017 Hadi SACKO <100m Sporting CP Leeds United FC
2018 Frederico RODRIGUES DE PAULA SANTOS <100m FC Shakhtar Donetsk Manchester United FC
2018 Jorge Luiz FRELLO FILHO <100m SSC Napoli Chelsea FC
2018 Diego DA SILVA COSTA <100m Chelsea FC Atletico Madrid
2019 Lucas TOLENTINO COELHO DE LIMA <100m CR Flamengo AC Milan
2017 Alexandre LACAZETTE <100m Olympique Lyonnais Arsenal FC
2014 David Luiz MOREIRA MARINHO <100m Chelsea FC Paris St Germain FC
2011 Radamel Falcao GARCIA ZARATE <100m FC Porto Atletico Madrid
2020 Leroy Aziz SANE <100m Manchester City FC FC Bayern Munich
2018 Gonçalo Manuel GANCHINHO GUEDES <100m Paris St Germain FC Valencia CF
2013 Mesut ÖZIL <100m Real Madrid CF Arsenal FC
2018 Adrien Sebastien PERRUCHET SILVA <100m Sporting CP Leicester City FC
2017 Benjamin MENDY <100m AS Monaco FC Manchester City FC
2017 Oscar DOS SANTOS EMBOABA JUNIOR <100m Chelsea FC Shanghai SIPG FC
2017 James David RODRIGUEZ RUBIO <100m Real Madrid CF FC Bayern Munich
2016 GIVANILDO VIEIRA SOUSA <100m FC Zenit St Petersburg Shanghai SIPG FC
2014 Eliaquim MANGALA <100m FC Porto Manchester City FC
2020 Alvaro Borja MORATA MARTIN <100m Chelsea FC Atletico Madrid
2014 Alexis Alejandro SANCHEZ <100m FC Barcelona Arsenal FC
2019 Ferland MENDY <100m Olympique Lyonnais Real Madrid CF
2011 Sergio Leonel AGÜERO <60m Atletico Madrid Manchester City FC
2016 Leroy Aziz SANE <60m FC Schalke 04 Manchester City FC
2020 Thomas Teye PARTEY* <60m Atletico Madrid Arsenal FC
2018 Fabio Henrique TAVARES <60m AS Monaco FC Liverpool FC
2011 Javier Matias PASTORE <60m US Palermo Paris St Germain FC
2013 James David RODRIGUEZ RUBIO <60m FC Porto AS Monaco FC
2013 Armindo TUÉ NA BANGNA <60m Sporting CP Galatasaray AS
2019 Éder Gabriel MILITÃO <60m FC Porto Real Madrid CF
2017 Mohamed Salah GHALY <60m AS Roma Liverpool FC
*Transfers for which a buy-out option was exercised are marked with an asterisk.All names of clubs and players are as entered in TMS.
17
TEN YEARS OF INTERNATIONAL TRANSFERS
YearYear FromFrom ToTo
2014 Real Madrid CF (Spain) Juventus FC (Italy)
2018 AS Monaco FC (France) Atletico Madrid (Spain)
2011 Olympique Lyonnais (France) AS Roma (Italy)
2015 PA Classics AC (USA) Borussia Dortmund (Germany)
2014 SL Benfica (Portugal) Valencia CF (Spain)
2013 Santoba de Conakry (Guinea) FC Istres OP (France)
2014 FC Girondins de Bordeaux (France) Sporting CP (Portugal)
2013 SC Internacional (Brazil) FC Shakhtar Donetsk (Ukraine)
2018 SSC Napoli (Italy) Chelsea FC (England)
2014 Atletico Madrid (Spain) Chelsea FC (England)
2019 CR Flamengo (Brazil) AC Milan (Italy)
2017 Olympique Lyonnais (France) Arsenal FC (England)
2011 SL Benfica (Portugal) Chelsea FC (England)
2011 FC Porto (Portugal) Atletico Madrid (Spain)
2016 FC Schalke 04 (Germany) Manchester City FC (England)
2017 SL Benfica (Portugal) Paris St Germain FC (France)
2010 SV Werder Bremen (Germany) Real Madrid CF (Spain)
2010 Sporting CP (Portugal) Maccabi Haifa FC (Israel)
2017 AS Monaco FC (France) Manchester City FC (England)
2012 SC Internacional (Brazil) Chelsea FC (England)
2010 CA Banfield (Argentina) FC Porto (Portugal)
2012 FC Porto (Portugal) FC Zenit St Petersburg (Russia)
2011 R. Standard de Liège FC Porto (Portugal)
2014 Real Madrid CF (Spain) Juventus FC (Italy)
2011 Udinese Calcio (Italy) FC Barcelona (Spain)
2019 Olympique Lyonnais (France) Real Madrid CF (Spain)
2011 Atletico Madrid (Spain) Manchester City FC (England)
2016 FC Schalke 04 (Germany) Manchester City FC (England)
2020 Atletico Madrid (Spain) Arsenal FC (England)
2012 Fluminense FC (Brazil) Rio Ave FC (Portugal)
2011 US Palermo (Italy) Paris St Germain FC (France)
2010 CA Banfield (Argentina) FC Porto (Portugal)
2013 Sporting CP (Portugal) Galatasaray AS (Turkey)
2018 Sao Paulo FC (Brazil) FC Porto (Portugal)
2012 Arab Contractors (Egypt) FC Basel (Switzerland)
*Data only includes international transfers that were entered in TMS. Transfers that were concluded before the establishment of TMS are not included.
AND THEIR FIRST INTERNATIONAL TRANSFER*
KEITA
SANE
SALAH

18
TEN YEARS OF INTERNATIONAL TRANSFERS
Number of transfers by player age 2011 - 2020
2011 2012 2013 2014 2015 2016 2017 2018 2019 2020
4.3k6.5k6.8k
4.5k4.6k5.6k5.2k4.3k
6.0k4.9k
4.9k
6.4k6.9k
4.9k
5.9k5.4k
6.5k
5.1k 5.5k6.3k
1.5k
2.3k2.4k
1.9k1.7k
2.1k
1.6k1.9k
2.0k
2.3k
11,009 11,05611,691 11,993
12,55213,404
14,34215,132
16,51915,527
Age band <18 18-23 24-29 30-35 >35
FIGURE 14: NUMBER OF TRANSFERS BY AGE
The majority of players transferred every year were those in the 18-23 and 24-29 age categories, with similar growth patterns. This trend remained constant throughout the period.
Spending on transfers fees (USD) by player age 2011 - 2020
2011 2012 2013 2014 2015 2016 2017 2018 2019 2020
1.3bn
2.6bn
3.8bn
1.2bn 1.6bn
3.0bn 2.9bn
1.7bn2.3bn
1.7bn
1.3bn
2.6bn
3.6bn
2.2bn
2.3bn2.0bn 2.2bn
2.9bn
3.1bn
1.4bn
2.85bn 2.66bn
3.90bn 4.02bn 4.13bn
4.72bn
6.29bn
6.94bn7.35bn
5.63bn
Age band <18 18-23 24-29 30-35 >35
FIGURE 15: SPENDING ON TRANSFER FEES BY PLAYER AGE (USD)
Spending on transfer fees per age group generally follows a similar pattern as the number of transfers per age group, although at its peak in 2019, the amount spent on the younger group (18-23 years old) was almost 25% more than that on the 24-29-year-old group, revealing a higher interest in investing in players that are still being trained and developing.
83%OF PLAYERS TRANSFERRED WERE AGED BETWEEN 18 AND 29
94.1%OF TRANSFER FEES PAID WERE FOR PLAYERS AGED BETWEEN 18 AND 29
2. TRANSFERS BY PLAYER AGE
21.6%OF INTERNATIONAL TRANSFERS OF U-24 PLAYERS ARE LOANS
19
TEN YEARS OF INTERNATIONAL TRANSFERS
INTERNATIONAL TRANSFERS OVER A TEN-YEAR PERIOD
79.7%
10.2%
10.1%
62.1%
21.6%
16.3%
Out of contract
Loan
Permanent
Types of transfer by age
<24 years
≥ 24 years
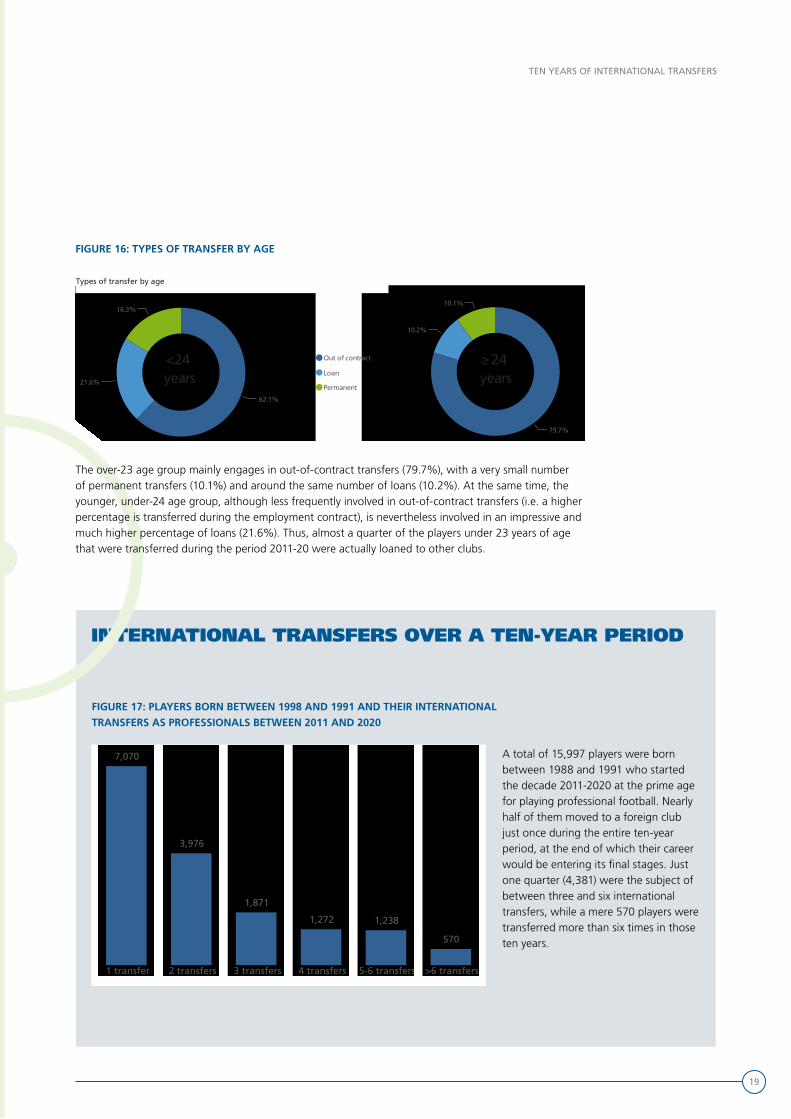
FIGURE 16: TYPES OF TRANSFER BY AGE
The over-23 age group mainly engages in out-of-contract transfers (79.7%), with a very small number of permanent transfers (10.1%) and around the same number of loans (10.2%). At the same time, the younger, under-24 age group, although less frequently involved in out-of-contract transfers (i.e. a higher percentage is transferred during the employment contract), is nevertheless involved in an impressive and much higher percentage of loans (21.6%). Thus, almost a quarter of the players under 23 years of age that were transferred during the period 2011-20 were actually loaned to other clubs.
A total of 15,997 players were born between 1988 and 1991 who started the decade 2011-2020 at the prime age for playing professional football. Nearly half of them moved to a foreign club just once during the entire ten-year period, at the end of which their career would be entering its final stages. Just one quarter (4,381) were the subject of between three and six international transfers, while a mere 570 players were transferred more than six times in those ten years.
1 transfer
7,070
2 transfers
3,976
3 transfers
1,871
4 transfers
1,272
5-6 transfers
1,238
>6 transfers
570
Distribution of players born between 1988 and 1991 by the number of international professional transfers they completed 2011 - 2020
FIGURE 17: PLAYERS BORN BETWEEN 1998 AND 1991 AND THEIR INTERNATIONAL TRANSFERS AS PROFESSIONALS BETWEEN 2011 AND 2020
20
TEN YEARS OF INTERNATIONAL TRANSFERS
Player nationalityPlayer nationality TransfersTransfers
Brazilian 15,128
Argentinian 7,444
British 5,523
French 5,027
Colombian 4,287
Spanish 3,922
Nigerian 3,793
Serbian 3,576
Uruguayan 3,341
Ghanaian 2,848
Croatian 2,663
Portuguese 2,598
Ukrainian 2,282
Dutch 2,230
Russian 2,121
Ivorian 2,055
Cameroonian 1,987
German 1,916
Italian 1,891
USA 1,825
Paraguayan 1,800
Swedish 1,685
Senegalese 1,429
Belgian 1,414
Japanese 1,336
Romanian 1,331
Greek 1,237
Slovakian 1,204
Korea Republic 1,203
Bosnian-Herzegovinian 1,131
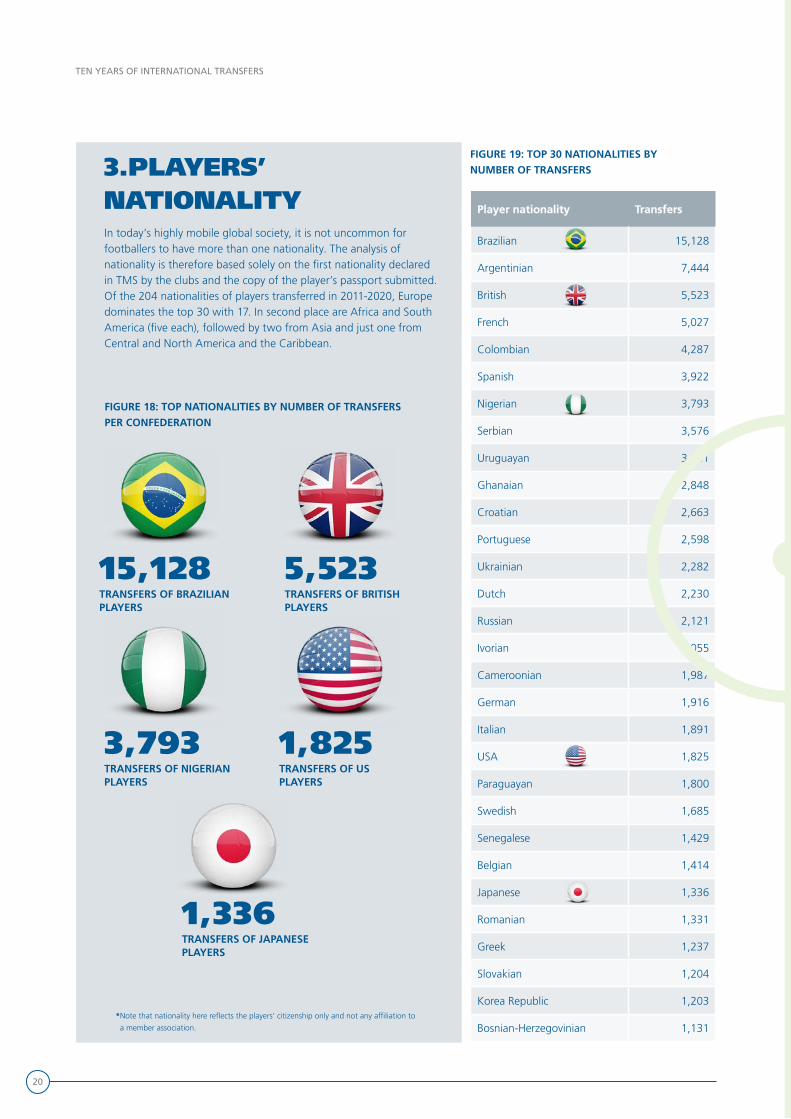
FIGURE 19: TOP 30 NATIONALITIES BY NUMBER OF TRANSFERS
In today’s highly mobile global society, it is not uncommon for footballers to have more than one nationality. The analysis of nationality is therefore based solely on the first nationality declared in TMS by the clubs and the copy of the player’s passport submitted. Of the 204 nationalities of players transferred in 2011-2020, Europe dominates the top 30 with 17. In second place are Africa and South America (five each), followed by two from Asia and just one from Central and North America and the Caribbean.
15,128 TRANSFERS OF BRAZILIAN PLAYERS
3,793 TRANSFERS OF NIGERIAN PLAYERS
5,523TRANSFERS OF BRITISH PLAYERS
1,825TRANSFERS OF US PLAYERS
1,336TRANSFERS OF JAPANESE PLAYERS
FIGURE 18: TOP NATIONALITIES BY NUMBER OF TRANSFERS PER CONFEDERATION
3.PLAYERS’ NATIONALITY
* Note that nationality here reflects the players’ citizenship only and not any affiliation to
a member association.
21
TEN YEARS OF INTERNATIONAL TRANSFERS
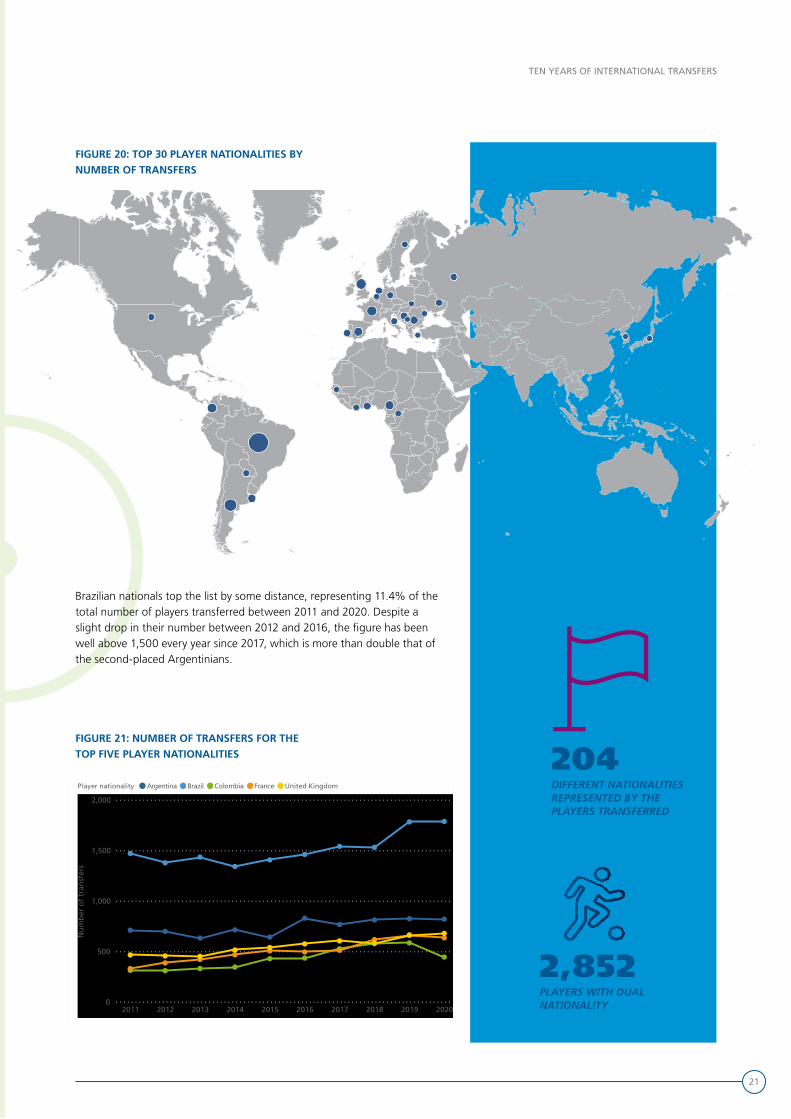
Brazilian nationals top the list by some distance, representing 11.4% of the total number of players transferred between 2011 and 2020. Despite a slight drop in their number between 2012 and 2016, the figure has been well above 1,500 every year since 2017, which is more than double that of the second-placed Argentinians.
Development of the number of transfers for the top five player nationalities by number of transfers 2011 - 2020
0
500
1,000
1,500
2,000
Nu
mb
er o
f tr
ansf
ers
2011 2012 2013 2014 2015 2016 2017 2018 2019 2020
Player nationality Argentina Brazil Colombia France United Kingdom
FIGURE 21: NUMBER OF TRANSFERS FOR THE TOP FIVE PLAYER NATIONALITIES
FIGURE 20: TOP 30 PLAYER NATIONALITIES BY NUMBER OF TRANSFERS
2,852PLAYERS WITH DUALNATIONALITY
204 DIFFERENT NATIONALITIESREPRESENTED BY THE PLAYERS TRANSFERRED
22
TEN YEARS OF INTERNATIONAL TRANSFERS
Player nationalityPlayer nationality Total transfer Total transfer fees (USD)fees (USD)
Brazilian 7,070.5m
French 4,496.8m
Spanish 3,687.2m
Argentinian 3,205.9m
Portuguese 2,855.1m
Dutch 1,921.9m
Belgian 1,739.3m
Colombian 1,684.6m
German 1,440.6m
British 1,298.9m
Italian 1,269.6m
Croatian 1,096.7m
Uruguayan 1,059.1m
Serbian 847.1m
Swiss 745.1m
Nigerian 733.1m
Danish 680.5m
Chilean 562.5m
Ghanaian 561.8m
Ivorian 556.0m
Swedish 543.7m
Senegalese 535.8m
Polish 480.1m
Mexican 454.1m
Norwegian 416.1m
Paraguayan 399.2m
Austrian 374.0m
Cameroonian 351.7m
Turkish 346.6m
Czech 333.4m
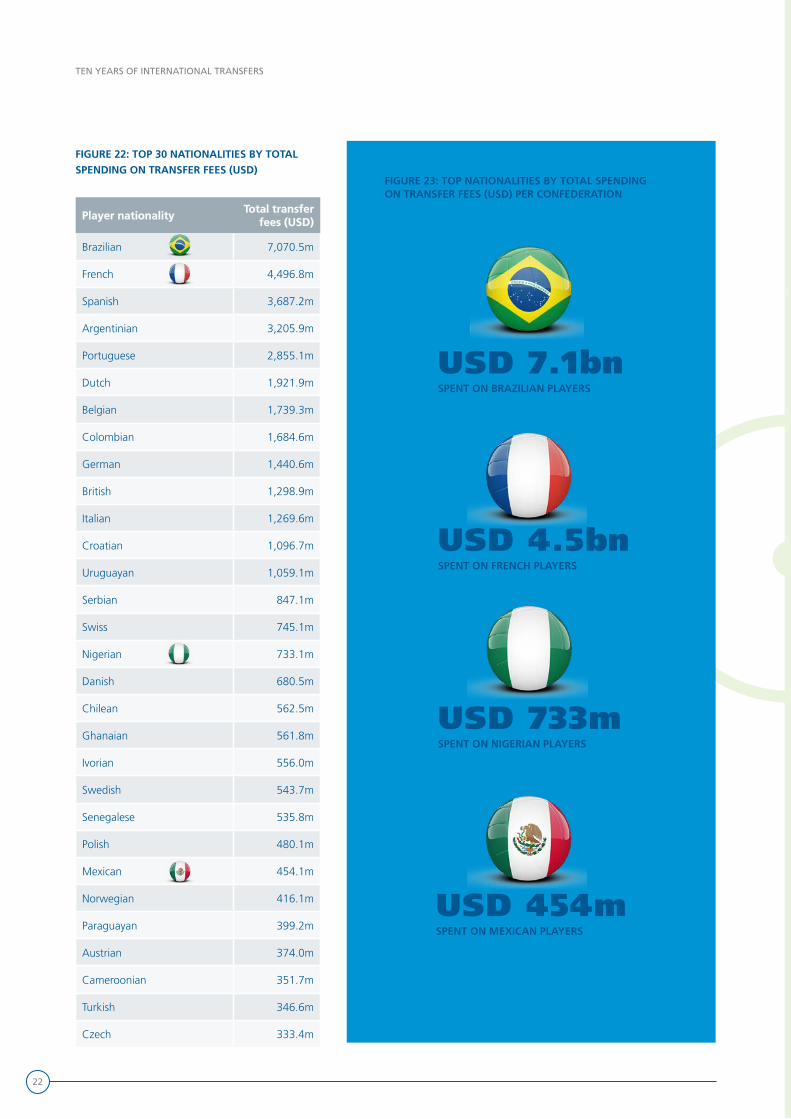
FIGURE 22: TOP 30 NATIONALITIES BY TOTAL SPENDING ON TRANSFER FEES (USD)
USD 7.1bn SPENT ON BRAZILIAN PLAYERS
USD 733m SPENT ON NIGERIAN PLAYERS
USD 4.5bn SPENT ON FRENCH PLAYERS
USD 454m
SPENT ON MEXICAN PLAYERS
FIGURE 23: TOP NATIONALITIES BY TOTAL SPENDING ON TRANSFER FEES (USD) PER CONFEDERATION
23
TEN YEARS OF INTERNATIONAL TRANSFERS
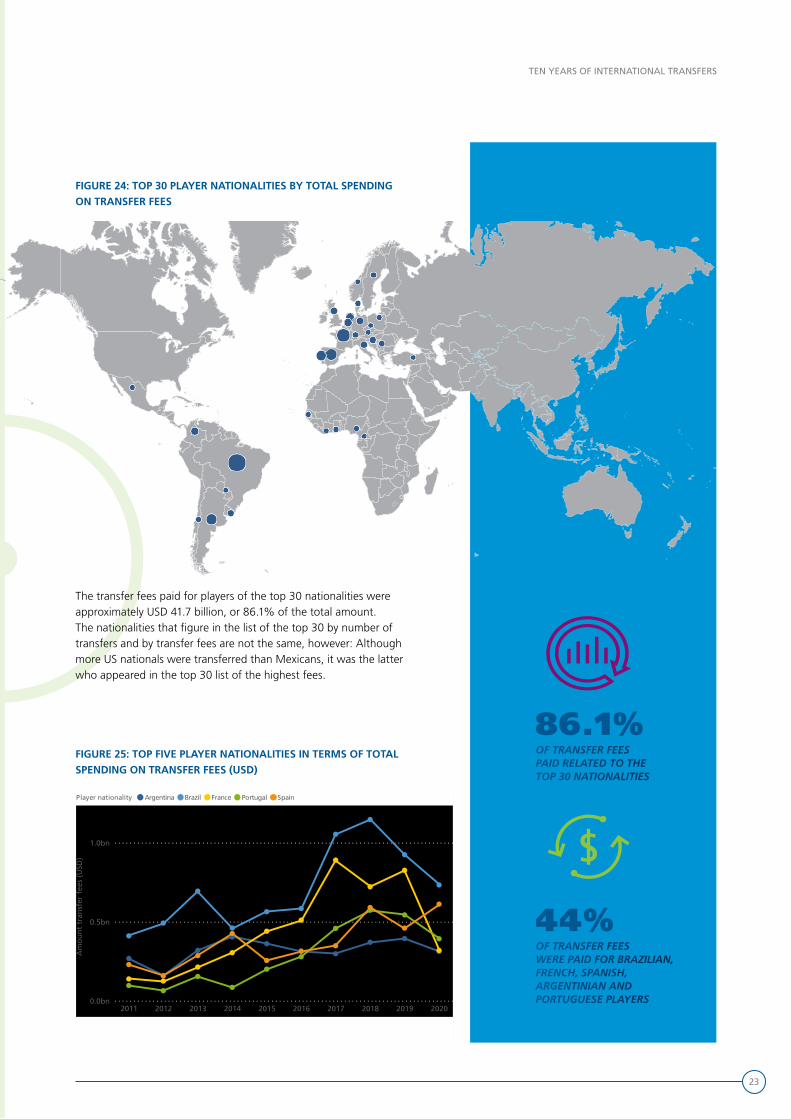
FIGURE 24: TOP 30 PLAYER NATIONALITIES BY TOTAL SPENDING ON TRANSFER FEES
The transfer fees paid for players of the top 30 nationalities were approximately USD 41.7 billion, or 86.1% of the total amount.The nationalities that figure in the list of the top 30 by number of transfers and by transfer fees are not the same, however: Although more US nationals were transferred than Mexicans, it was the latter who appeared in the top 30 list of the highest fees.
Development of the spending on transfer fees (USD) for the top five player nationalities by total spending ontransfer fees 2011 - 2020
0.0bn
0.5bn
1.0bn
Am
ou
nt
tran
sfer
fee
s (U
SD)
2011 2012 2013 2014 2015 2016 2017 2018 2019 2020
Player nationality Argentina Brazil France Portugal Spain
FIGURE 25: TOP FIVE PLAYER NATIONALITIES IN TERMS OF TOTAL SPENDING ON TRANSFER FEES (USD)
44% OF TRANSFER FEES WERE PAID FOR BRAZILIAN, FRENCH, SPANISH, ARGENTINIAN AND PORTUGUESE PLAYERS
86.1%OF TRANSFER FEES PAID RELATED TO THE TOP 30 NATIONALITIES
24
TEN YEARS OF INTERNATIONAL TRANSFERS
Median annual total fixed remuneration (USD) in transfers out of contract by player age 2013 - 2020 (salariesare entered in TMS since late 2012)
0K
20K
40K
2013 2014 2015 2016 2017 2018 2019 2020
10.1k13.1k
10.3k11.9k 12.0k
11.7k
11.2k 11.5k8.7k10.3k
14.1k11.0k 12.2k11.9k 12.0k
10.9k
18.6k
23.7k
31.1k28.8k
27.9k
28.2k26.3k
29.6k30.5k
40.2k
49.1k
45.4k
41.8k 41.4k44.0k 44.4k
Age band <18 18-23 24-29 30-35
Note: players over 35 are not included in this graph due to a lack of sufficient data.
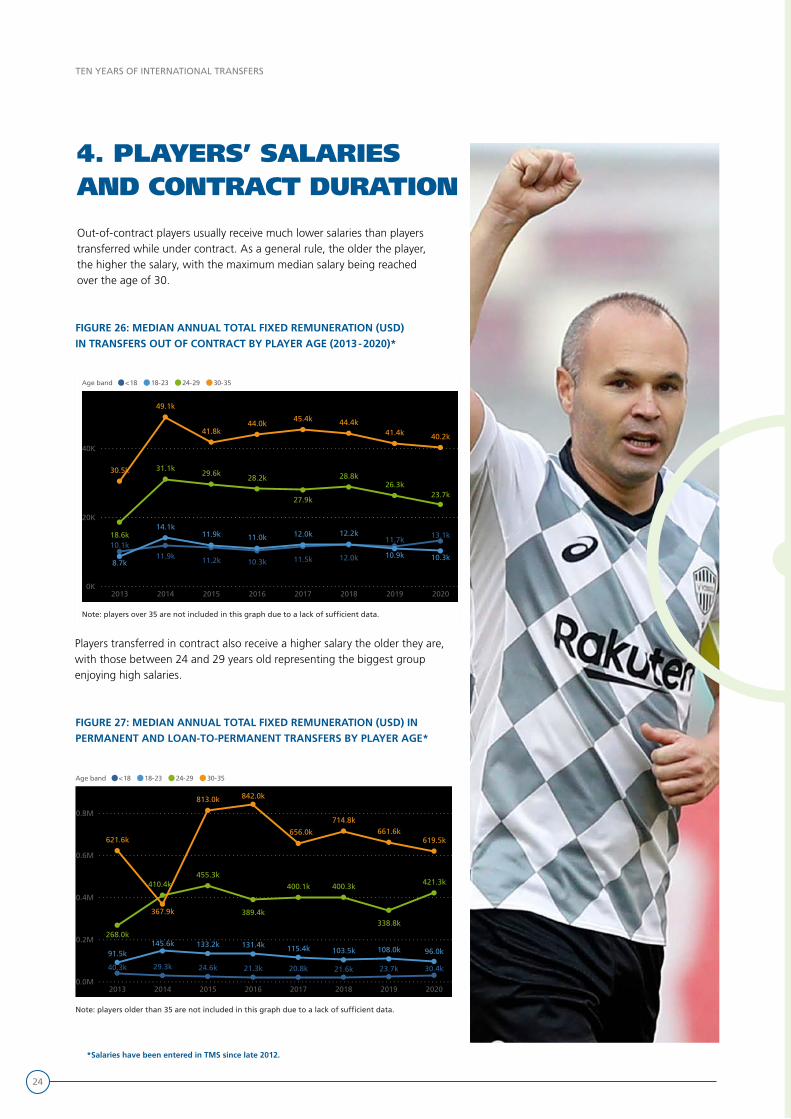
FIGURE 26: MEDIAN ANNUAL TOTAL FIXED REMUNERATION (USD) IN TRANSFERS OUT OF CONTRACT BY PLAYER AGE (2013 - 2020)*
Out-of-contract players usually receive much lower salaries than players transferred while under contract. As a general rule, the older the player, the higher the salary, with the maximum median salary being reached over the age of 30.
Median annual total fixed remuneration (USD) in permanent and loan-to-permanent transfers by player age2013 - 2020 (salaries are entered in TMS since late 2012)
0.0M
0.2M
0.4M
0.6M
0.8M
2013 2014 2015 2016 2017 2018 2019 2020
40.3k 30.4k20.8k24.6k 23.7k29.3k 21.3k 21.6k
91.5k 96.0k145.6k
103.5k 108.0k131.4k133.2k 115.4k
268.0k
421.3k455.3k
338.8k389.4k
400.3k410.4k 400.1k
621.6k 619.5k
842.0k
367.9k
656.0k
714.8k
813.0k
661.6k
Age band <18 18-23 24-29 30-35
Note: players older than 35 are not included in this graph due to a lack of sufficient data.
FIGURE 27: MEDIAN ANNUAL TOTAL FIXED REMUNERATION (USD) IN PERMANENT AND LOAN-TO-PERMANENT TRANSFERS BY PLAYER AGE*
*Salaries have been entered in TMS since late 2012.
4. PLAYERS’ SALARIES AND CONTRACT DURATION
Players transferred in contract also receive a higher salary the older they are, with those between 24 and 29 years old representing the biggest group enjoying high salaries.
25
TEN YEARS OF INTERNATIONAL TRANSFERS
Median annual total fixed remuneration (USD) in transfers (excluding loans) by transfer fee range (USD) 2013 -2020 (salaries are entered in TMS since late 2012)
0M
1M
2M
3M
2013 2014 2015 2016 2017 2018 2019 202014.7k 19.0k26.2k 23.0k21.3k 22.2k 20.3k22.1k
75.4k 94.6k116.8k 93.5k 101.3k103.1k109.7k 108.7k240.2k 319.8k351.8k 282.8k 290.4k326.6k 342.8k291.4k
563.1k 571.4k718.0k 667.9k639.2k690.8k 710.0k 636.0k
2.4m
2.3m
2.9m
2.0m
2.7m
2.4m
2.7m
2.4m
Fee range (USD) No fee >0-500k >500k-1m >1m-5m >5m
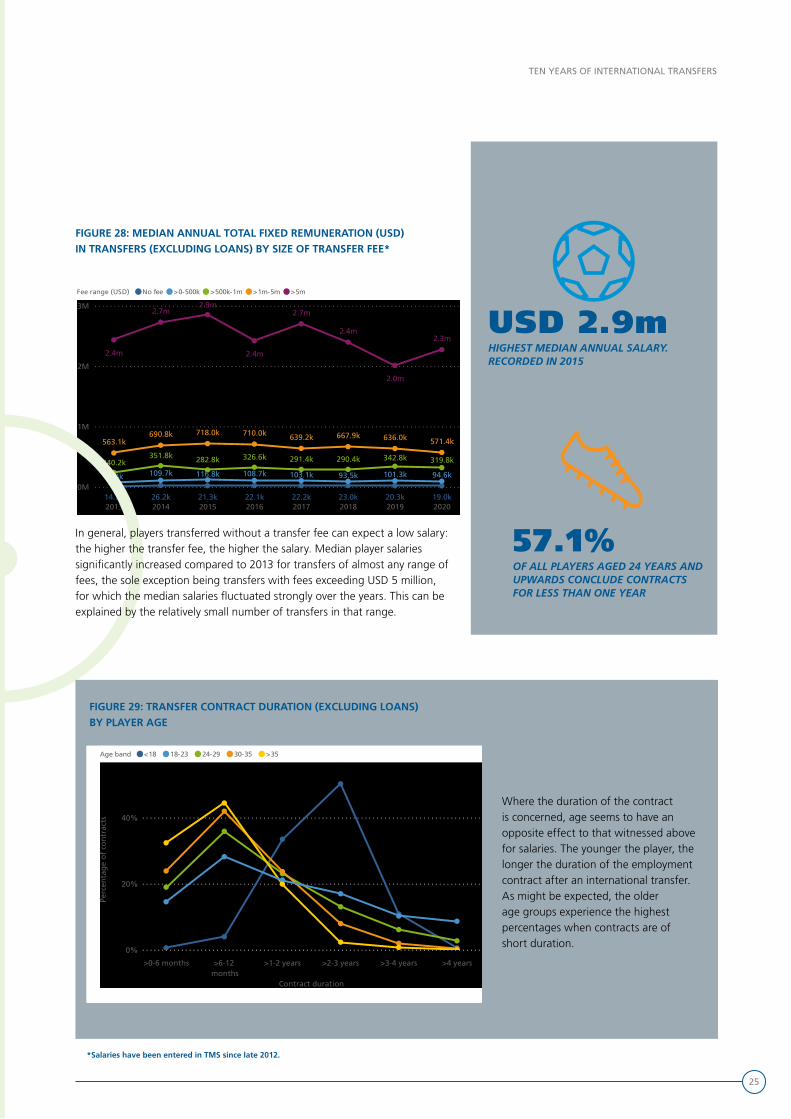
FIGURE 28: MEDIAN ANNUAL TOTAL FIXED REMUNERATION (USD) IN TRANSFERS (EXCLUDING LOANS) BY SIZE OF TRANSFER FEE*
In general, players transferred without a transfer fee can expect a low salary: the higher the transfer fee, the higher the salary. Median player salaries significantly increased compared to 2013 for transfers of almost any range of fees, the sole exception being transfers with fees exceeding USD 5 million, for which the median salaries fluctuated strongly over the years. This can be explained by the relatively small number of transfers in that range.
Distribution of contract duration in transfers (excluding loans) by player age 2011 - 2020
0%
20%
40%
Contract duration
Perc
enta
ge
of
con
trac
ts
>0-6 months >6-12months
>1-2 years >2-3 years >3-4 years >4 years
Age band <18 18-23 24-29 30-35 >35
FIGURE 29: TRANSFER CONTRACT DURATION (EXCLUDING LOANS) BY PLAYER AGE
USD 2.9mHIGHEST MEDIAN ANNUAL SALARY.RECORDED IN 2015
57.1%OF ALL PLAYERS AGED 24 YEARS ANDUPWARDS CONCLUDE CONTRACTS FOR LESS THAN ONE YEAR
*Salaries have been entered in TMS since late 2012.
Where the duration of the contract is concerned, age seems to have an opposite effect to that witnessed above for salaries. The younger the player, the longer the duration of the employment contract after an international transfer. As might be expected, the older age groups experience the highest percentages when contracts are of short duration.
26
TEN YEARS OF INTERNATIONAL TRANSFERS
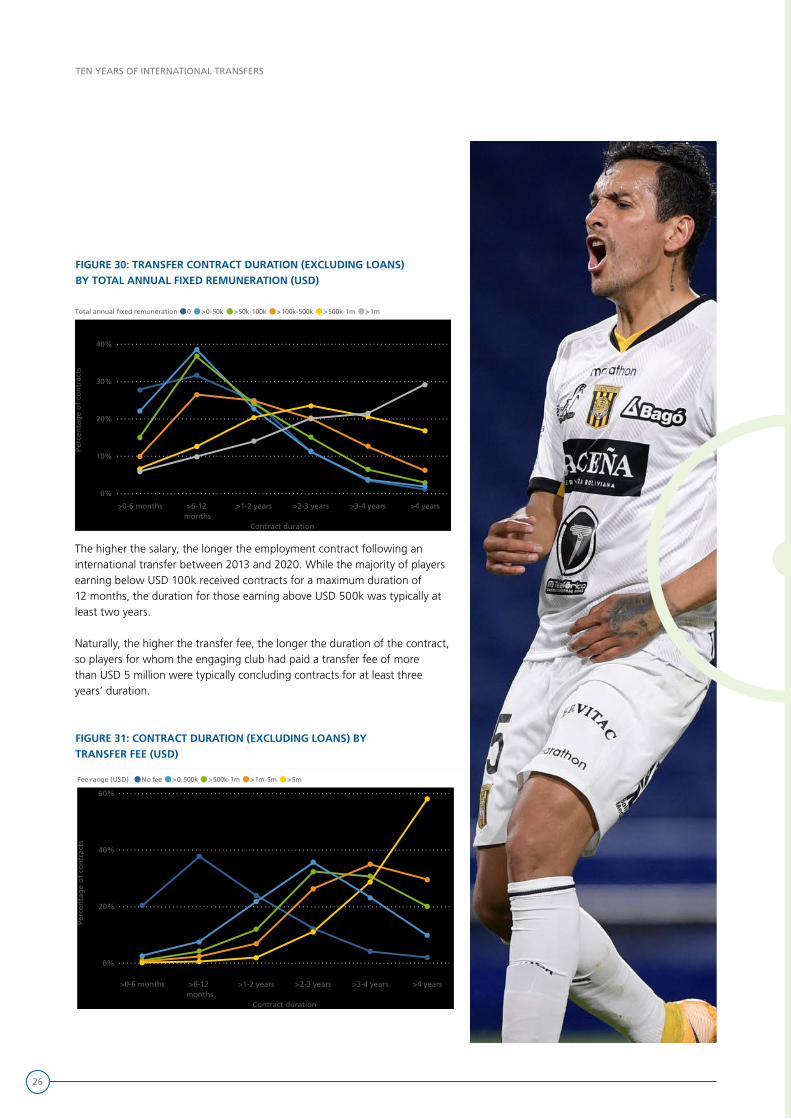
FIGURE 30: TRANSFER CONTRACT DURATION (EXCLUDING LOANS) BY TOTAL ANNUAL FIXED REMUNERATION (USD) Distribution of contract duration in transfers (excluding loans) by yearly total fixed remuneration range (USD)2013 - 2020 (salaries are entered in TMS since late 2012)
0%
10%
20%
30%
40%
Contract duration
Perc
enta
ge
of
con
trac
ts
>0-6 months >6-12months
>1-2 years >2-3 years >3-4 years >4 years
Total annual fixed remuneration 0 >0-50k >50k-100k >100k-500k >500k-1m >1m
Distribution of contract duration in transfers (excluding loans) by transfer fee range (USD) 2011 - 2020
0%
20%
40%
60%
Contract duration
Perc
enta
ge
of
con
trac
ts
>0-6 months >6-12months
>1-2 years >2-3 years >3-4 years >4 years
Fee range (USD) No fee >0-500k >500k-1m >1m-5m >5m
FIGURE 31: CONTRACT DURATION (EXCLUDING LOANS) BY TRANSFER FEE (USD)
The higher the salary, the longer the employment contract following an international transfer between 2013 and 2020. While the majority of players earning below USD 100k received contracts for a maximum duration of 12 months, the duration for those earning above USD 500k was typically at least two years.
Naturally, the higher the transfer fee, the longer the duration of the contract, so players for whom the engaging club had paid a transfer fee of more than USD 5 million were typically concluding contracts for at least three years’ duration.
27
TEN YEARS OF INTERNATIONAL TRANSFERS
Transfers on loan 2011 - 2020
2011 2012 2013 2014 2015 2016 2017 2018 2019 2020
933 9511,179 1,131
1,292 1,389 1,3601,534
1,7462,003
555 520
561 563533
603 685706
822
760
1,488 1,471
1,740 1,6941,825
1,992 2,045
2,240
2,568
2,763
13.5%
17.8%
13.3%
14.3%14.9%
14.1%
14.9%15.5%
14.5% 14.8%
Loans without transfer feeLoans with transfer feeTransfers on loan as % of all transfers
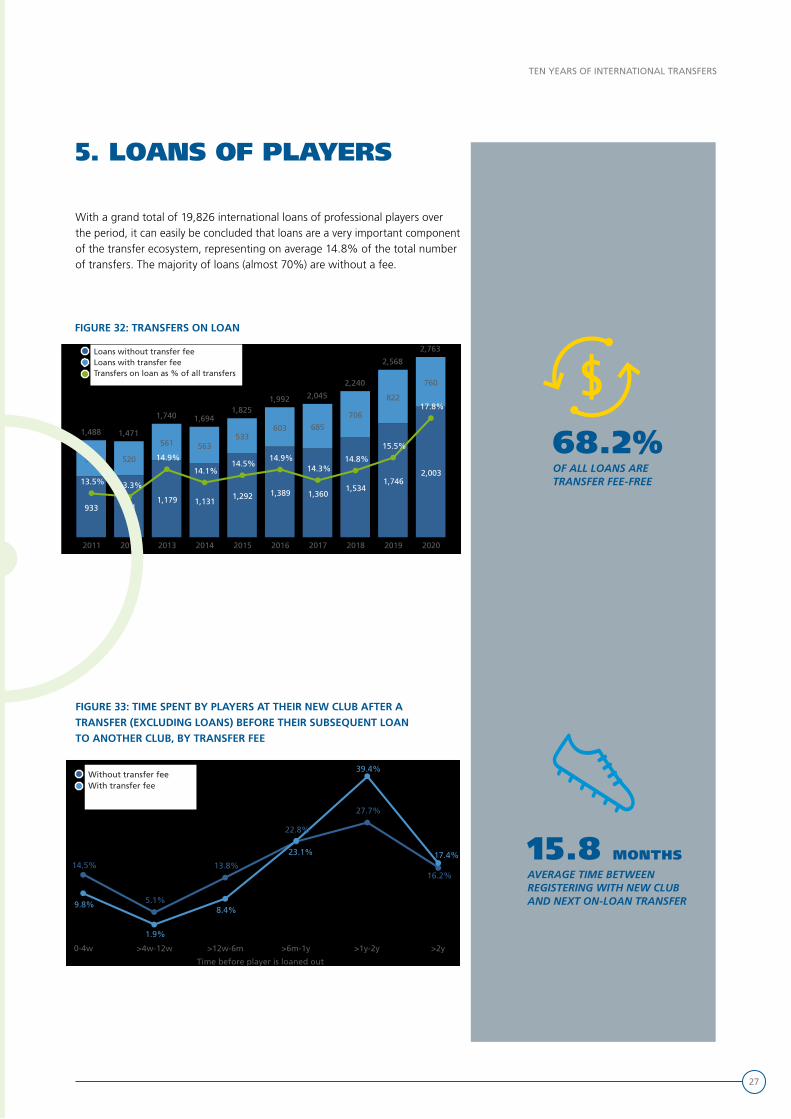
FIGURE 32: TRANSFERS ON LOAN
With a grand total of 19,826 international loans of professional players over the period, it can easily be concluded that loans are a very important component of the transfer ecosystem, representing on average 14.8% of the total number of transfers. The majority of loans (almost 70%) are without a fee.
Distribution of the time players spent at their new club after a transfer (excluding loans) before they weresubsequently laoned out to another club, by transfer fee 2011 - 2020
Time before player is loaned out
0-4w >4w-12w >12w-6m >6m-1y >1y-2y >2y
14.5%16.2%
27.7%
5.1%
22.8%
13.8%
9.8%
17.4%
39.4%
1.9%
23.1%
8.4%
Without transfer feeWith transfer fee
FIGURE 33: TIME SPENT BY PLAYERS AT THEIR NEW CLUB AFTER A TRANSFER (EXCLUDING LOANS) BEFORE THEIR SUBSEQUENT LOAN TO ANOTHER CLUB, BY TRANSFER FEE
5. LOANS OF PLAYERS
68.2% OF ALL LOANS ARETRANSFER FEE-FREE
15.8 MONTHS AVERAGE TIME BETWEEN REGISTERING WITH NEW CLUB AND NEXT ON-LOAN TRANSFER
28
TEN YEARS OF INTERNATIONAL TRANSFERS
C. THE CLUBS

29
TEN YEARS OF INTERNATIONAL TRANSFERS
30
TEN YEARS OF INTERNATIONAL TRANSFERS
FIGURE 34: NUMBER OF CLUBS INVOLVED IN TRANSFERS WITHOUT FEES
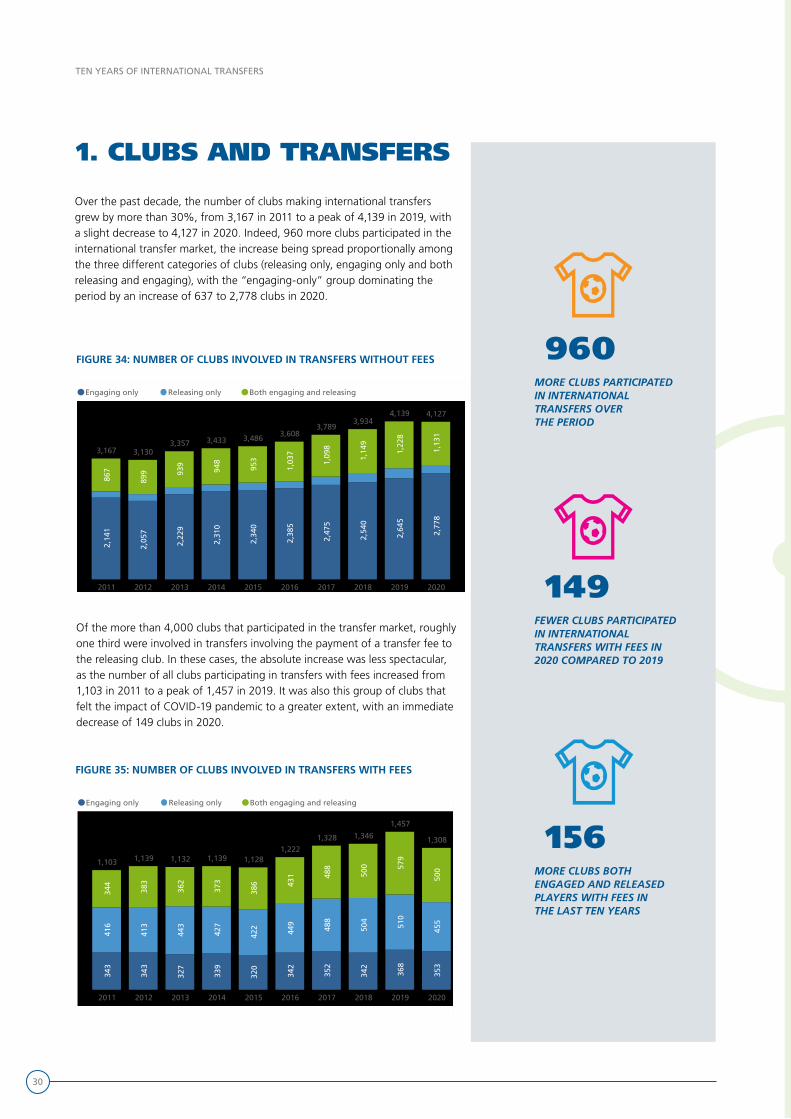
Of the more than 4,000 clubs that participated in the transfer market, roughly one third were involved in transfers involving the payment of a transfer fee to the releasing club. In these cases, the absolute increase was less spectacular, as the number of all clubs participating in transfers with fees increased from 1,103 in 2011 to a peak of 1,457 in 2019. It was also this group of clubs that felt the impact of COVID-19 pandemic to a greater extent, with an immediate decrease of 149 clubs in 2020.
FIGURE 35: NUMBER OF CLUBS INVOLVED IN TRANSFERS WITH FEES
1. CLUBS AND TRANSFERS
Over the past decade, the number of clubs making international transfers grew by more than 30%, from 3,167 in 2011 to a peak of 4,139 in 2019, with a slight decrease to 4,127 in 2020. Indeed, 960 more clubs participated in the international transfer market, the increase being spread proportionally among the three different categories of clubs (releasing only, engaging only and both releasing and engaging), with the “engaging-only” group dominating the period by an increase of 637 to 2,778 clubs in 2020.
960 MORE CLUBS PARTICIPATED IN INTERNATIONAL TRANSFERS OVER THE PERIOD
156 MORE CLUBS BOTH ENGAGED AND RELEASED PLAYERS WITH FEES IN THE LAST TEN YEARS
149 FEWER CLUBS PARTICIPATED IN INTERNATIONAL TRANSFERS WITH FEES IN 2020 COMPARED TO 2019
Number of clubs involved in international transfers 2011 - 2020
2011 2012 2013 2014 2015 2016 2017 2018 2019 2020
2,14
1
2,05
7
2,22
9
2,31
0
2,34
0
2,38
5
2,47
5
2,54
0
2,64
5
2,77
8
867
899 93
9
948
953
1,03
7
1,09
8
1,14
9
1,22
8
1,13
1
3,167 3,1303,357 3,433 3,486 3,608
3,7893,934
4,139 4,127
Engaging only Releasing only Both engaging and releasing
Number of clubs involved in international transfers with fees 2011 - 2020
2011 2012 2013 2014 2015 2016 2017 2018 2019 2020
343
343
327
339
320
342
352
342
368
353
416
413
443
427
422
449
488
504
510
455
344
383
362
373
386 43
1 488
500 57
9
500
1,103 1,139 1,132 1,139 1,1281,222
1,328 1,346
1,457
1,308
Engaging only Releasing only Both engaging and releasing
31
TEN YEARS OF INTERNATIONAL TRANSFERS
Number of clubs by annual spending on transfer fees (USD) 2011 - 2020
Nu
mb
er o
f cl
ub
s
2011 2012 2013 2014 2015 2016 2017 2018 2019 2020
45
64
6967
554854
66
50
60
172181
242
140
200 193177
167
178 177
259 262268
223
261
240247 250238238
145
236
146
177
210205 227
166
188
213
57
82
109
52
77
5459
8671
99
92834
8 152032312721
Annual spending (USD) >0-10k >10k-100k >100k-1m >1m-10m >10m-50m >50m
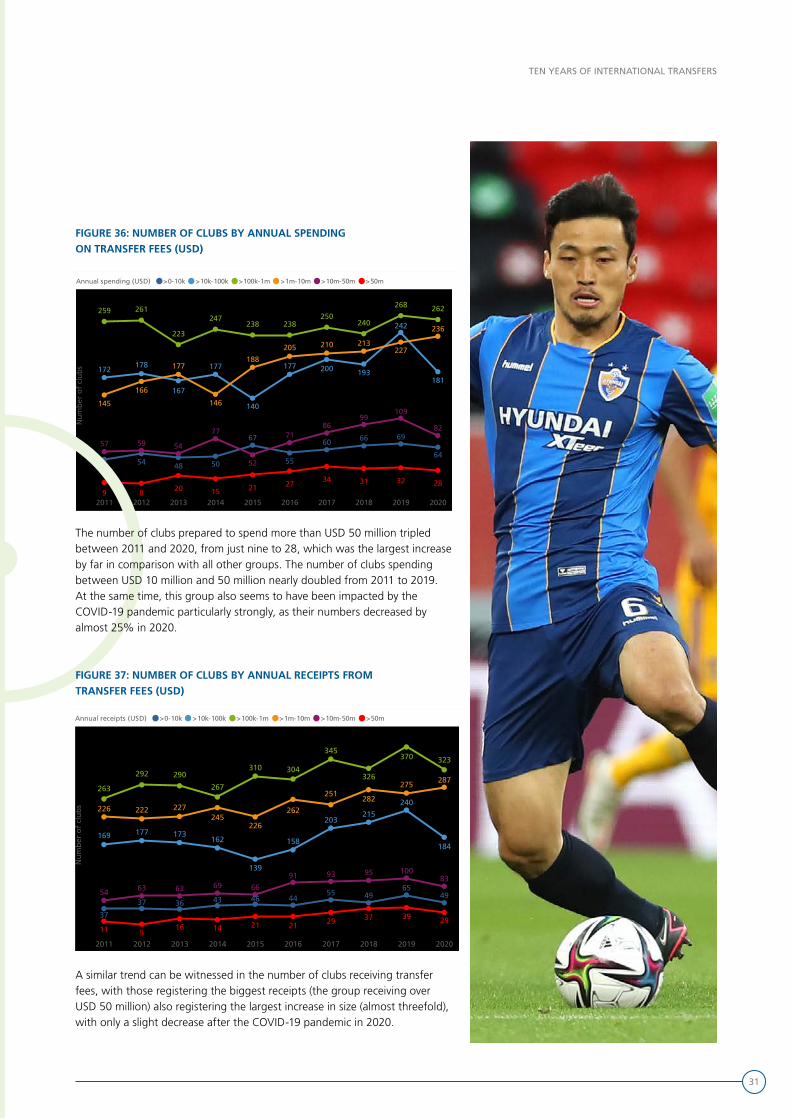
FIGURE 36: NUMBER OF CLUBS BY ANNUAL SPENDING ON TRANSFER FEES (USD)
The number of clubs prepared to spend more than USD 50 million tripled between 2011 and 2020, from just nine to 28, which was the largest increase by far in comparison with all other groups. The number of clubs spending between USD 10 million and 50 million nearly doubled from 2011 to 2019. At the same time, this group also seems to have been impacted by the COVID-19 pandemic particularly strongly, as their numbers decreased by almost 25% in 2020.
Number of clubs by annual receipts from transfer fees (USD) 2011 - 2020
Nu
mb
er o
f cl
ub
s
2011 2012 2013 2014 2015 2016 2017 2018 2019 2020
37
4965
364955
46 4437 43
169184
240
139
177
203
162 158
215
173
263
323370
267
292 326
345
310 304290
226
287
222
226245
262
251282
275
227
54
83100
666993
63
91 95
63
112939
5 1416292121
Annual receipts (USD) >0-10k >10k-100k >100k-1m >1m-10m >10m-50m >50m
37
FIGURE 37: NUMBER OF CLUBS BY ANNUAL RECEIPTS FROM TRANSFER FEES (USD)
A similar trend can be witnessed in the number of clubs receiving transfer fees, with those registering the biggest receipts (the group receiving over USD 50 million) also registering the largest increase in size (almost threefold), with only a slight decrease after the COVID-19 pandemic in 2020.

32
TEN YEARS OF INTERNATIONAL TRANSFERS
FIGURE 38: AVERAGE NUMBER OF INCOMING TRANSFERS PER CLUB
The rise in the number of clubs engaged in international transfers appears to be the main factor in the increase in international transfers themselves, with the average number of incoming transfers for most of the decadebeing between 3.7 and 4.3 transfers per club. The lowest average was recorded in 2011 and the highest in 2019.
FIGURE 39: AVERAGE NUMBER OF INCOMING TRANSERS WITH FEES PER CLUB ENGAGING PLAYERS AGAINST FEES
3.9AVERAGE NUMBER OFTRANSFERS PER CLUB PER YEAR
Average number of incoming transfers per club 2011 - 2020
2011 2012 2013 2014 2015 2016 2017 2018 2019 2020
3.7 3.7
3.7
3.7 3.
8 3.9 4.0 4.1 4.
3
4.0
While the average number of incoming transfers with fees per club is generally lower, the absolute growth followed a similar pattern, increasing from a low of 2.2 transfers with fees in 2012 to 2.8 transfers with fees in 2019.
Average number of incoming transfers with fees completed by clubs engaging players against fees 2011 - 2020
2011 2012 2013 2014 2015 2016 2017 2018 2019 2020
2.3
2.2
2.4
2.3 2.
5 2.6
2.8
2.8
2.8
2.7
2.8HIGHEST AVERAGENUMBER OF TRANSFERS WITH A TRANSFER FEE PER CLUB PER YEAR
33
TEN YEARS OF INTERNATIONAL TRANSFERS
Distribution of clubs by spending on and receipts from transfer fees 2011 - 2020, bubble size represents number of incomingtransfers
0
1
100
10k
1m
100m
Spending on transfer fees (USD)
Rec
eip
ts f
rom
tra
nsf
er f
ees
(USD
)
0 1 100 10k 1m 100m
Confederation AFC CAF Concacaf CONMEBOL OFC UEFA
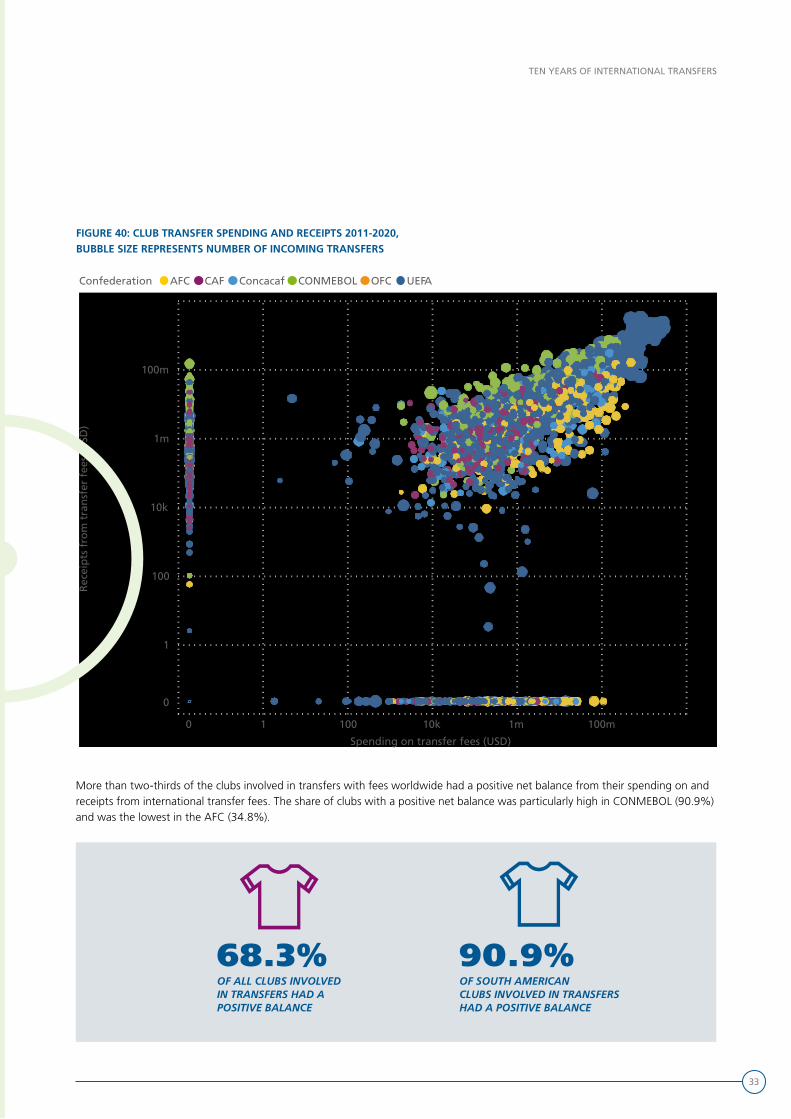
FIGURE 40: CLUB TRANSFER SPENDING AND RECEIPTS 2011-2020, BUBBLE SIZE REPRESENTS NUMBER OF INCOMING TRANSFERS
More than two-thirds of the clubs involved in transfers with fees worldwide had a positive net balance from their spending on and receipts from international transfer fees. The share of clubs with a positive net balance was particularly high in CONMEBOL (90.9%) and was the lowest in the AFC (34.8%).
68.3%OF ALL CLUBS INVOLVED IN TRANSFERS HAD A POSITIVE BALANCE
90.9%OF SOUTH AMERICANCLUBS INVOLVED IN TRANSFERS HAD A POSITIVE BALANCE

34
TEN YEARS OF INTERNATIONAL TRANSFERS
FIGURE 42: TOTAL COMMISSIONS PAID TO CLUB INTERMEDIARIES (USD)
Total commission paid to club intermediaries (USD) 2011 - 2020
2011 2012 2013 2014 2015 2016 2017 2018 2019 2020
131.1m167.6m
214.2m 230.7m
292.9m
380.3m
441.3m
535.9m
640.5m
483.5m
FIGURE 41: TRANSFERS INVOLVING INTERMEDIARIES ENGAGED BY THE CLUB
Players’ agents are an integral part of the transfer market and are increasingly involved in international transfers. From just 5.5% of all transfers in 2011 to 9.3% in 2020, marking an increase of agents’ participation by 69.1%.
The increase in the commissions paid to agents was even more dramatic: from USD 131.1 million in 2011 to USD 640.5 million in 2019. A total of USD 3.5 billion was paid for agents’ commissions in international transfers over the course of the decade.
2. AGENTS’ COMMISSIONS
USD 3.5bn PAID TO CLUB INTERMEDIARIES OVER THE PERIOD
69.1% MORE AGENTS’ INVOLVEMENT OVER THE PERIOD
Transfers involving intermediaries engaged by a club 2011 - 2020
2011 2012 2013 2014 2015 2016 2017 2018 2019 2020
605
735841
950
1,087
1,2611,367 1,370
1,473 1,447
5.5%
9.3%9.5%
8.9%
7.9%7.2%
9.4% 9.1%
6.6%
8.7%
Transfers with club intermediary % of total
35
TEN YEARS OF INTERNATIONAL TRANSFERS
3. TOP CLUBS IN THE
TRANSFER MARKET

36
TEN YEARS OF INTERNATIONAL TRANSFERS
FIGURE 43: TOP 30 CLUBS BY SPENDING ON TRANSFER FEES
ClubClub AssociationAssociationIncoming Incoming transferstransfers
% with fees% with fees
Manchester City FC England 130 59.2%
Chelsea FC England 95 80.0%
FC Barcelona Spain 75 74.7%
Paris St Germain FC France 59 74.6%
Real Madrid CF Spain 55 80.0%
Atletico Madrid Spain 93 64.5%
Manchester United FC England 68 55.9%
Arsenal FC England 76 65.8%
Juventus FC Italy 137 77.4%
Tottenham Hotspur FC England 59 72.9%
FC Bayern Munich Germany 64 64.1%
FC Inter Milan Italy 116 68.1%
AS Monaco FC France 126 65.9%
Liverpool FC England 78 53.8%
AS Roma Italy 131 77.9%
Valencia CF Spain 76 68.4%
Sevilla FC Spain 103 79.6%
SSC Napoli Italy 53 83.0%
AC Milan Italy 95 63.2%
Leicester City FC England 67 62.7%
Southampton FC England 67 64.2%
Borussia Dortmund Germany 70 61.4%
FC Porto Portugal 166 51.8%
SL Benfica Portugal 167 55.7%
Wolverhampton Wanderers FC England 113 46.9%
RB Leipzig Germany 77 67.5%
Everton FC England 67 62.7%
West Ham United FC England 81 55.6%
FC Zenit St Petersburg Russia 48 72.9%
Newcastle United FC England 71 73.2%
12 CLUBSFROM ENGLAND INTOP 30 AND ALL 30 CLUBS ARE FROM EUROPE
167INTERNATIONALTRANSFERS IN TEN YEARS BY SL BENFICA
The list of top 30 clubs in terms of transfer fee spending is dominated exclusively by European clubs from seven member associations: England (12 clubs), Spain and Italy (five each), Germany (three), France and Portugal (two each) and Russia (one). Those 30 clubs alone spent a total of USD 22.8 billion on transfer fees in the period, representing a share of 47% of the global total.
a. TOP 30 CLUBS BY SPENDING ON TRANSFER FEES
TOP CLUB IN TERMS OF SPENDING ON TRANSFER FEES
37
TEN YEARS OF INTERNATIONAL TRANSFERS
b. TOP 30 CLUBS BY OUT OF CONTRACT TRANSFERS
ClubClub AssociationAssociationIncoming Incoming transferstransfers
Albirex Niigata (S) FC Singapore 160
FC Ararat Armenia 130
Doxa Katokopias Cyprus 130
Ermis Aradippou FC Cyprus 112
Mosta FC Malta 111
Enosis Neon Paralimniou FC Cyprus 104
Wrexham AFC Wales 103
Omonoia FC Cyprus 102
FC Zimbru Chisinau Moldova 100
AFC Astra Giurgiu Romania 97
Alashkert FC Armenia 96
CS Luqueño Paraguay 96
Newport County AFC Wales 96
AEL Limassol Cyprus 94
KS Kukesi Albania 93
NK Istra 1961 Croatia 93
Anorthosis Famagusta FC Cyprus 90
Aris Limassol FC Cyprus 89
NEA SALAMINA FAMAGUSTA Cyprus 89
PFC Lokomotiv Plovdiv Bulgaria 87
FC Dinamo Bucuresti Romania 86
Toronto FC Canada 85
FC Koper Slovenia 85
Larissa FC Greece 84
FC Dacia Moldova 84
Buriram United Thailand 84
PAFOS FC. Cyprus 83
CA Atenas Uruguay 83
Ethnikos Achnas FC Cyprus 82
Vancouver Whitecaps FC Canada 81
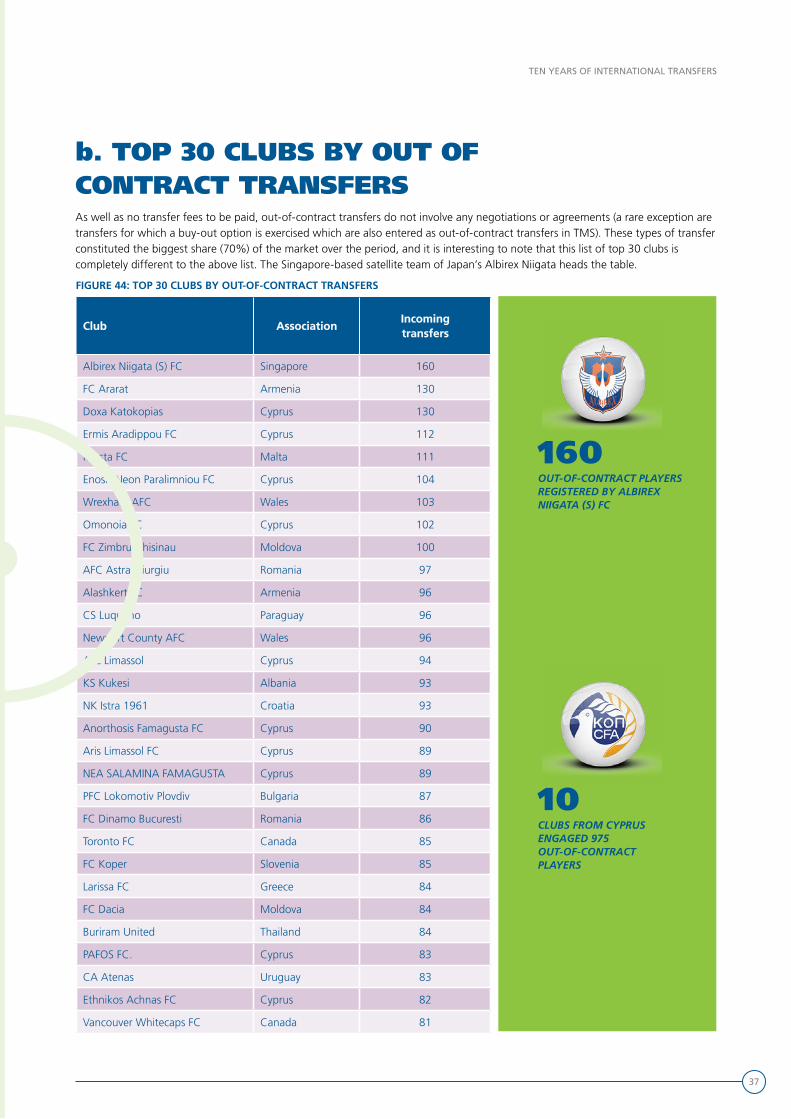
10CLUBS FROM CYPRUSENGAGED 975 OUT-OF-CONTRACT PLAYERS
160OUT-OF-CONTRACT PLAYERSREGISTERED BY ALBIREX NIIGATA (S) FC
As well as no transfer fees to be paid, out-of-contract transfers do not involve any negotiations or agreements (a rare exception are transfers for which a buy-out option is exercised which are also entered as out-of-contract transfers in TMS). These types of transfer constituted the biggest share (70%) of the market over the period, and it is interesting to note that this list of top 30 clubs is completely different to the above list. The Singapore-based satellite team of Japan’s Albirex Niigata heads the table.
FIGURE 44: TOP 30 CLUBS BY OUT-OF-CONTRACT TRANSFERS

38
TEN YEARS OF INTERNATIONAL TRANSFERS
c. TOP 30 CLUBS BY RECEIPTS FROM TRANSFER FEES
ClubClub AssociationAssociationOutgoing Outgoing
transfers and transfers and loansloans
% with fees% with fees
SL Benfica Portugal 311 48.2%
Sporting CP Portugal 226 48.2%
FC Barcelona Spain 106 73.6%
Chelsea FC England 260 47.3%
Atletico Madrid Spain 121 78.5%
Real Madrid CF Spain 90 67.8%
FC Porto Portugal 224 53.1%
AS Monaco FC France 177 49.7%
AFC Ajax Netherlands 100 70.0%
Juventus FC Italy 197 67.0%
Manchester City FC England 307 44.6%
Borussia Dortmund Germany 69 78.3%
AS Roma Italy 141 53.2%
Olympique Lyonnais France 71 73.2%
Sevilla FC Spain 95 76.8%
LOSC Lille France 115 32.2%
Paris St Germain FC France 68 51.5%
Liverpool FC England 127 62.2%
Tottenham Hotspur FC England 91 65.9%
Valencia CF Spain 77 63.6%
Villarreal FC Spain 95 74.7%
Swansea City FC Wales 192 31.8%
FC Inter Milan Italy 137 53.3%
SSC Napoli Italy 68 75.0%
FC Red Bull Salzburg Austria 121 76.9%
FC Shakhtar Donetsk Ukraine 93 53.8%
PSV Eindhoven Netherlands 68 82.4%
Manchester United FC England 78 51.3%
Bayer 04 Leverkusen Germany 40 82.5%
FC Dynamo Kyiv Ukraine 114 86.0%
6 SPANISH CLUBSAMONG THE TOP 30
41.1%OF THE TRANSFER FEESWERE RECEIVED BY THE TOP 30 CLUBS
The top 30 clubs in the list below received 41.1% of the total transfer fees paid globally over the last ten years. A total of 2,634 different clubs received an international transfer fee, of which the top 500 recipients accounted for more than 95%.
FIGURE 45: TOP 30 CLUBS BY RECEIPTS FROM TRANSFER FEES
39
TEN YEARS OF INTERNATIONAL TRANSFERS
Average transfer fee (USD) paid per transfer by the top 30 clubs in terms of spending on transfer fees 2011 -2020
2011 2012 2013 2014 2015 2016 2017 2018 2019 2020
9.5m
7.4m
11.1m 11.0m 10.8m 11.3m
16.1m
17.8m17.1m
14.4m
FIGURE 46: AVERAGE TRANSFER FEE (USD) PAID BY THE TOP 30 CLUBS IN TERMS OF TRANSFER FEE SPENDING
FIGURE 47: AVERAGE TRANSFER FEE (USD) RECEIVED PER TRANSFER BY THE TOP 30 CLUBS IN TERMS OF TRANSFER FEE RECEIPTS
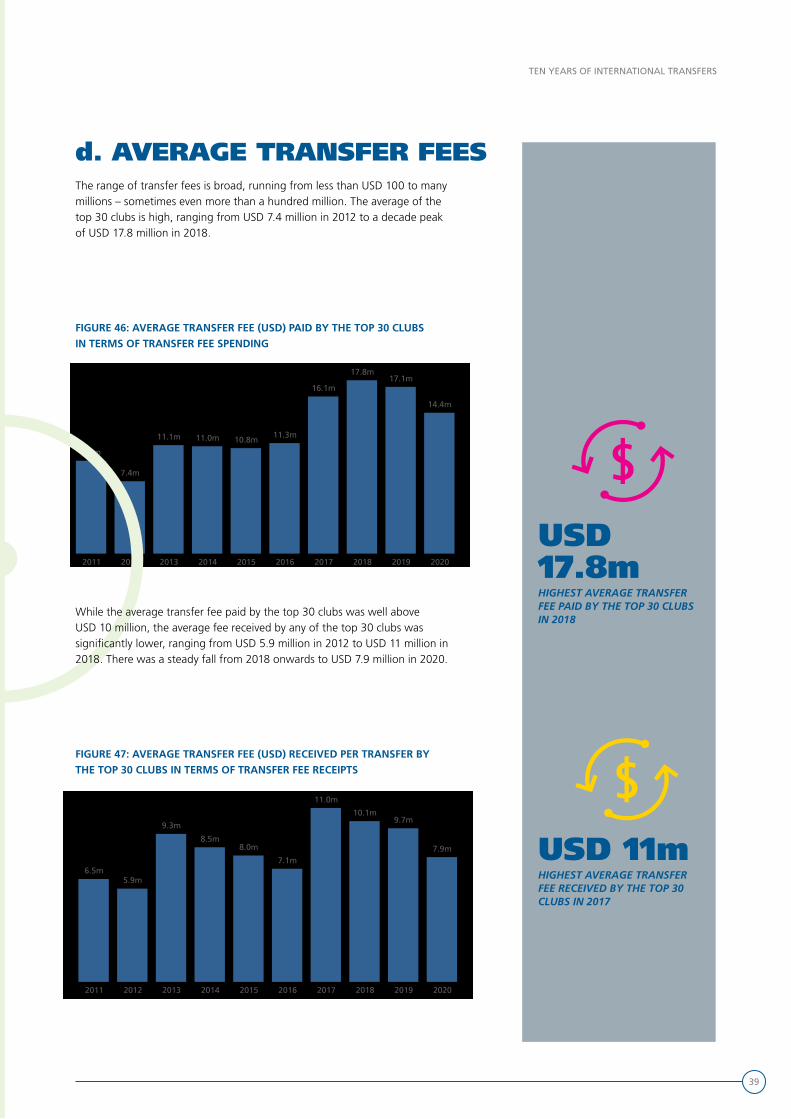
While the average transfer fee paid by the top 30 clubs was well above USD 10 million, the average fee received by any of the top 30 clubs was significantly lower, ranging from USD 5.9 million in 2012 to USD 11 million in 2018. There was a steady fall from 2018 onwards to USD 7.9 million in 2020.
USD 17.8m HIGHEST AVERAGE TRANSFER FEE PAID BY THE TOP 30 CLUBS IN 2018
USD 11m HIGHEST AVERAGE TRANSFER FEE RECEIVED BY THE TOP 30 CLUBS IN 2017
d. AVERAGE TRANSFER FEESThe range of transfer fees is broad, running from less than USD 100 to many millions – sometimes even more than a hundred million. The average of the top 30 clubs is high, ranging from USD 7.4 million in 2012 to a decade peak of USD 17.8 million in 2018.
Average transfer fee (USD) received per transfer by the top 30 clubs in terms of receipts from transfer fees 2011- 2020
2011 2012 2013 2014 2015 2016 2017 2018 2019 2020
6.5m5.9m
9.3m
8.5m8.0m
7.1m
11.0m
10.1m9.7m
7.9m

40
TEN YEARS OF INTERNATIONAL TRANSFERS
ClubClub AssociationAssociationOutgoing Outgoing transferstransfers
% with % with feesfees
Incoming Incoming transferstransfers
% with fees% with fees
Sporting CP Portugal 226 38.4% 147 57.1%
SL Benfica Portugal 311 39.8% 167 55.7%
FC Porto Portugal 224 44.2% 166 51.8%
AFC Ajax Netherlands 100 45.2% 78 65.4%
Olympique Lyonnais France 71 50.0% 51 58.8%
LOSC Lille France 115 23.7% 109 57.8%
Sao Paulo FC Brazil 117 40.5% 63 47.6%
FC Red Bull Salzburg Austria 121 56.0% 110 70.9%
AS Monaco FC France 177 39.6% 126 65.9%
FC Shakhtar Donetsk Ukraine 93 37.6% 28 71.4%
GNK Dinamo - Zagreb Croatia 118 32.0% 100 53.0%
Borussia Dortmund Germany 69 55.1% 70 61.4%
FC Basel Switzerland 77 54.9% 68 79.4%
SC Braga Portugal 154 32.2% 173 35.8%
PSV Eindhoven Netherlands 68 50.0% 88 59.1%
Athletic Bilbao Spain 6 22.7% 4 100.0%
RSC Anderlecht Belgium 135 47.2% 120 72.5%
KRC Genk Belgium 80 51.7% 75 70.7%
CA River Plate Argentina 73 30.7% 43 60.5%
Santos FC Brazil 55 29.9% 51 45.1%
CR Flamengo Brazil 87 34.4% 54 53.7%
FC Dynamo Kyiv Ukraine 114 57.0% 59 57.6%
Corinthians - SP Brazil 89 38.2% 67 34.3%
Fluminense FC Brazil 183 25.7% 65 29.2%
Gremio FBPA Brazil 65 34.7% 61 44.3%
A.Z. N.V. Netherlands 42 42.1% 43 58.1%
AS Saint Etienne France 65 37.5% 71 54.9%
CA Velez Sarsfield Argentina 66 26.1% 36 44.4%
SC Internacional Brazil 74 30.4% 60 45.0%
Olympiacos FC Greece 179 35.3% 146 61.0%
FIGURE 48: TOP 30 CLUBS WITH POSITIVE NET BALANCE FROM TRANSFER FEES
e. TOP 30 CLUBS WITH POSITIVE NET BALANCE FROM TRANSFER FEES
3PORTUGUESE CLUBSOCCUPY THE TOP THREE POSITIONS IN TERMS OF NET PROFIT FROM INTERNATIONAL TRANSFER FEES
7BRAZILIAN CLUBSAMONG THE TOP 30 CLUBS IN TERMS OF NET PROFIT FROM INTERNATIONAL TRANSFER FEES
Most of the clubs (68.3%) involved in transfers with fees in the past decade had a positive net balance from their international transfer activity, although less than 10% of them made any significant profit in excess of USD 10 million.
41
TEN YEARS OF INTERNATIONAL TRANSFERS
FIGURE 49: TOP 30 CLUBS RELEASING PLAYERS ON LOAN
ClubClub AssociationAssociationOutgoing loans and Outgoing loans and
loan extensionsloan extensions
Manchester City FC England 232
Chelsea FC England 207
SL Benfica Portugal 189
Udinese Calcio Italy 166
Swansea City FC Wales 146
Fluminense FC Brazil 141
Juventus FC Italy 139
FC Porto Portugal 135
Sporting CP Portugal 130
Cardiff City FC Wales 126
Gremio Anapolis Brazil 122
Watford FC England 122
CD Maldonado Uruguay 122
AS Monaco FC France 116
Olympiacos FC Greece 114
SC Braga Portugal 103
Granada CF Spain 98
FC Inter Milan Italy 92
CA Boca Juniors Argentina 87
Wolverhampton Wanderers FC England 87
Arsenal FC England 86
FC Dynamo Kyiv Ukraine 85
CA Fenix Uruguay 84
R. Standard de Liège Belgium 83
AS Roma Italy 83
Liverpool FC England 82
Parma FC Italy 75
HNK Rijeka Croatia 74
Tombense FC Brazil 73
ACF Fiorentina Italy 72
RSC Anderlecht Belgium 71
f. TOP 30 CLUBS RELEASING PLAYERS ON LOAN
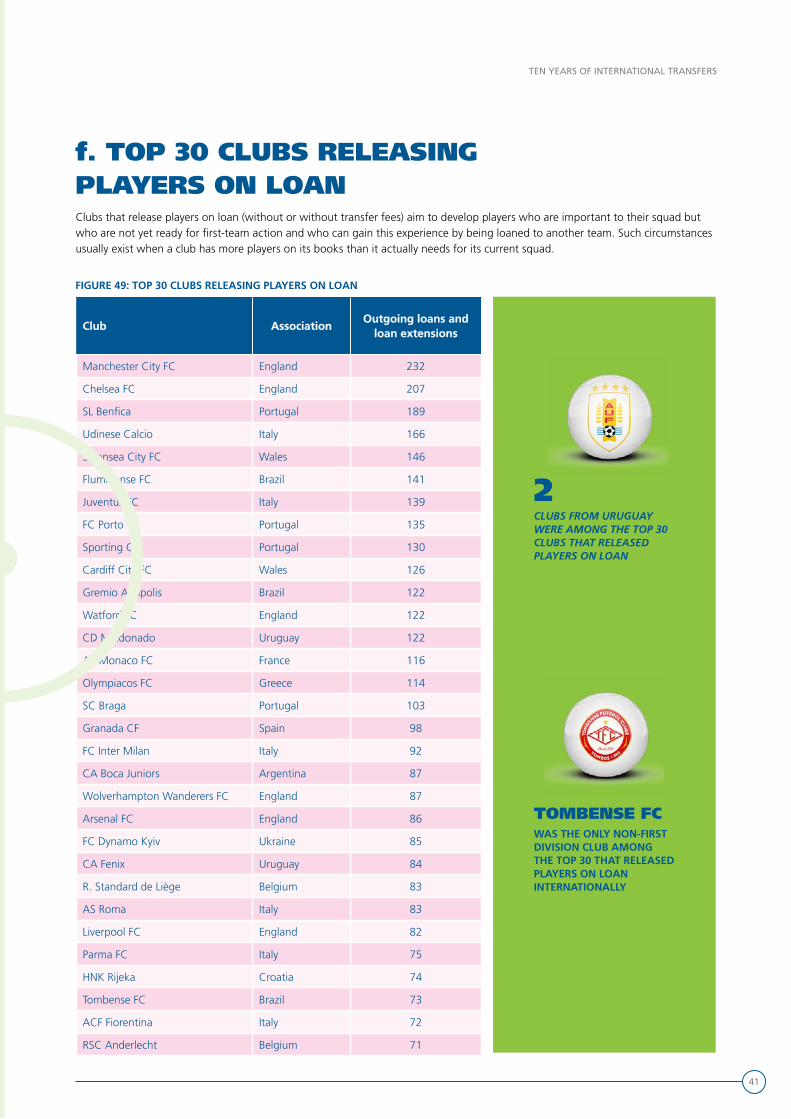
2CLUBS FROM URUGUAY WERE AMONG THE TOP 30 CLUBS THAT RELEASED PLAYERS ON LOAN
TOMBENSE FCWAS THE ONLY NON-FIRST DIVISION CLUB AMONG THE TOP 30 THAT RELEASED PLAYERS ON LOAN INTERNATIONALLY
Clubs that release players on loan (without or without transfer fees) aim to develop players who are important to their squad but who are not yet ready for first-team action and who can gain this experience by being loaned to another team. Such circumstances usually exist when a club has more players on its books than it actually needs for its current squad.

42
TEN YEARS OF INTERNATIONAL TRANSFERS
D. THEMEMBER
ASSOCIATIONS

43
TEN YEARS OF INTERNATIONAL TRANSFERS
44
TEN YEARS OF INTERNATIONAL TRANSFERS
Top 30 associations by the number of incoming transfers 2011 - 2020
Brazil
England
Portugal
Spain
Germany
USA
Argentina
Italy
France
Turkey
Belgium
Greece
Cyprus
Sweden
Romania
Poland
Mexico
Scotland
Netherlands
Uruguay
Chile
Norway
Russia
Colombia
Saudi Arabia
Ukraine
Serbia
Hungary
Finland
Bulgaria
6.2k
4.6k
4.4k
3.9k
3.6k
2.9k
2.8k
2.7k
2.7k
2.6k
2.6k
2.5k
2.3k
2.2k
2.1k
2.1k
2.1k
2.0k
1.8k
1.6k
1.6k
1.6k
1.5k
1.5k
1.4k
1.4k
1.3k
1.3k
1.3k
1.3k
FIGURE 50: TOP 30 ASSOCIATIONS BY NUMBER OF INCOMING TRANSFERS
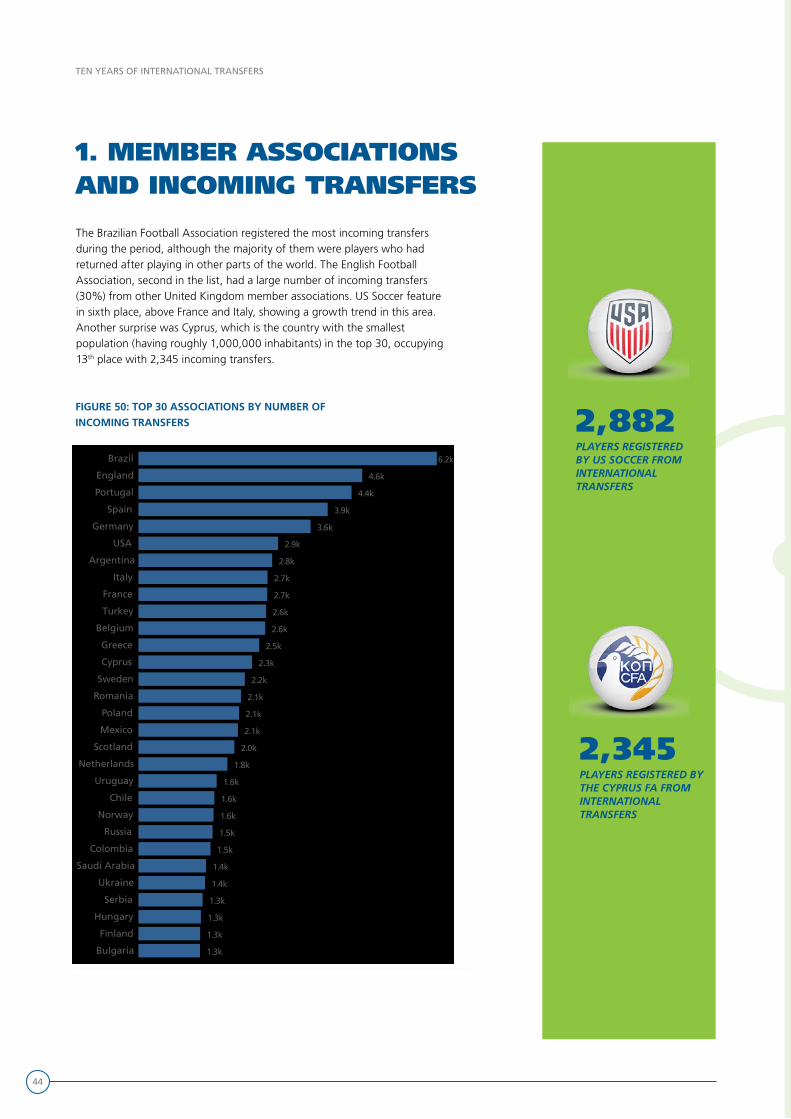
The Brazilian Football Association registered the most incoming transfers during the period, although the majority of them were players who had returned after playing in other parts of the world. The English Football Association, second in the list, had a large number of incoming transfers (30%) from other United Kingdom member associations. US Soccer feature in sixth place, above France and Italy, showing a growth trend in this area. Another surprise was Cyprus, which is the country with the smallest population (having roughly 1,000,000 inhabitants) in the top 30, occupying 13th place with 2,345 incoming transfers.
1. MEMBER ASSOCIATIONS AND INCOMING TRANSFERS
2,345 PLAYERS REGISTERED BY THE CYPRUS FA FROM INTERNATIONALTRANSFERS
2,882 PLAYERS REGISTERED BY US SOCCER FROM INTERNATIONALTRANSFERS
45
TEN YEARS OF INTERNATIONAL TRANSFERS
FIGURE 51: TOP 30 ASSOCIATIONS BY NUMBER OF INCOMING TRANSFERS
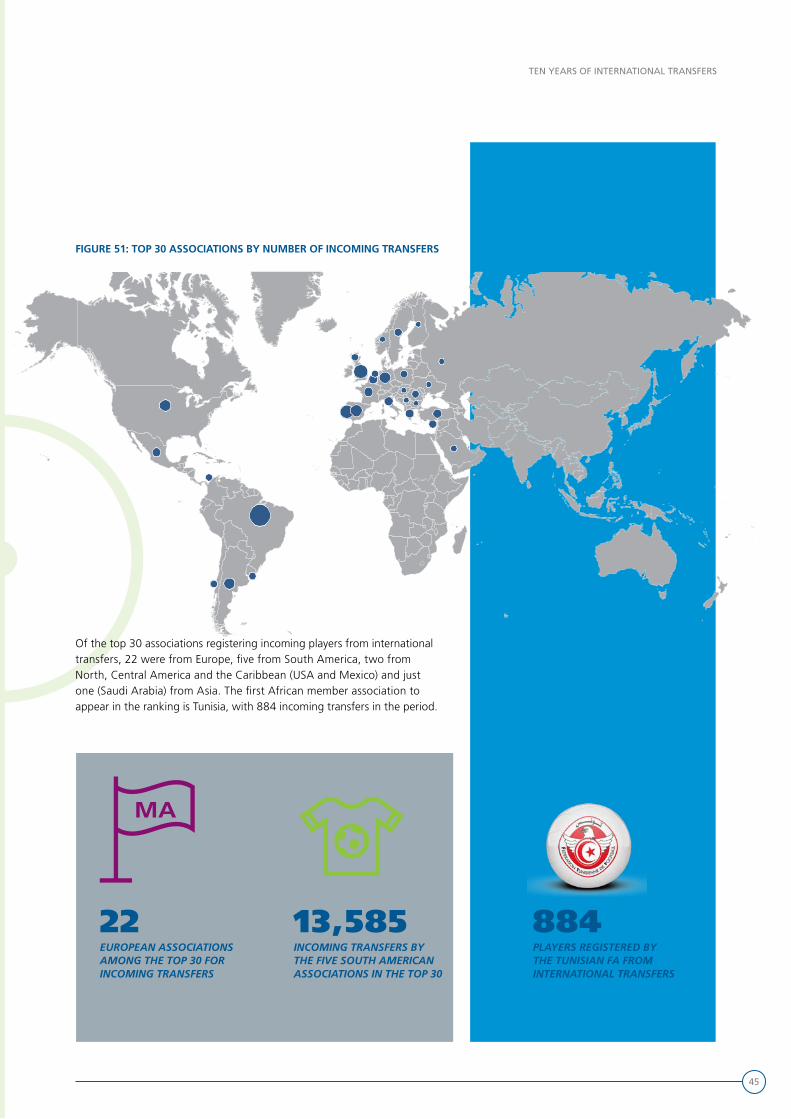
Of the top 30 associations registering incoming players from international transfers, 22 were from Europe, five from South America, two from North, Central America and the Caribbean (USA and Mexico) and just one (Saudi Arabia) from Asia. The first African member association to appear in the ranking is Tunisia, with 884 incoming transfers in the period.
22 EUROPEAN ASSOCIATIONSAMONG THE TOP 30 FOR INCOMING TRANSFERS
884 PLAYERS REGISTERED BY THE TUNISIAN FA FROM INTERNATIONAL TRANSFERS
13,585 INCOMING TRANSFERS BY THE FIVE SOUTH AMERICAN ASSOCIATIONS IN THE TOP 30
46
TEN YEARS OF INTERNATIONAL TRANSFERS
FIGURE 52: TOP 30 ASSOCIATIONS BY TOTAL TRANSFER FEE SPENDING (USD)Top 30 associations by total spending on transfers fees (USD) 2011 - 2020
England
Spain
Italy
Germany
France
Russia
China PR
Portugal
Turkey
Belgium
Brazil
Netherlands
Mexico
Wales
Saudi Arabia
USA
Ukraine
Argentina
United Arab Emirates
Qatar
Greece
Switzerland
Austria
Scotland
Denmark
Japan
Cyprus
Egypt
Serbia
Czech Republic
12.4bn
6.7bn
5.6bn
4.4bn
4.0bn
1.7bn
1.7bn
1.3bn
1.1bn
0.9bn
0.8bn
0.7bn
0.7bn
0.6bn
0.6bn
0.5bn
0.5bn
0.4bn
0.4bn
0.3bn
0.3bn
0.3bn
0.2bn
0.2bn
0.2bn
0.2bn
0.1bn
0.1bn
0.1bn
0.1bn
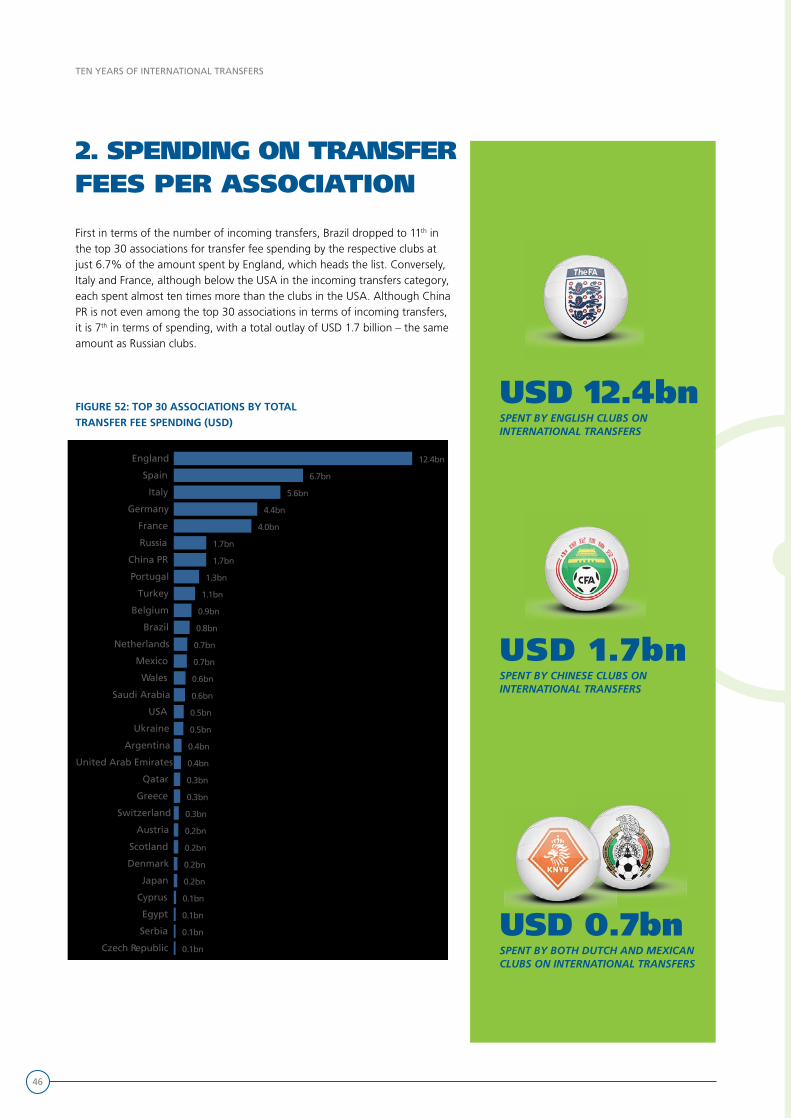
First in terms of the number of incoming transfers, Brazil dropped to 11th in the top 30 associations for transfer fee spending by the respective clubs at just 6.7% of the amount spent by England, which heads the list. Conversely, Italy and France, although below the USA in the incoming transfers category, each spent almost ten times more than the clubs in the USA. Although China PR is not even among the top 30 associations in terms of incoming transfers, it is 7th in terms of spending, with a total outlay of USD 1.7 billion – the same amount as Russian clubs.
2. SPENDING ON TRANSFER FEES PER ASSOCIATION
USD 12.4bn SPENT BY ENGLISH CLUBS ON INTERNATIONAL TRANSFERS
USD 1.7bn SPENT BY CHINESE CLUBS ON INTERNATIONAL TRANSFERS
USD 0.7bn SPENT BY BOTH DUTCH AND MEXICAN CLUBS ON INTERNATIONAL TRANSFERS
47
TEN YEARS OF INTERNATIONAL TRANSFERS
FIGURE 53: TOP 30 ASSOCIATIONS BY TOTAL SPENDING ON TRANSFER FEES
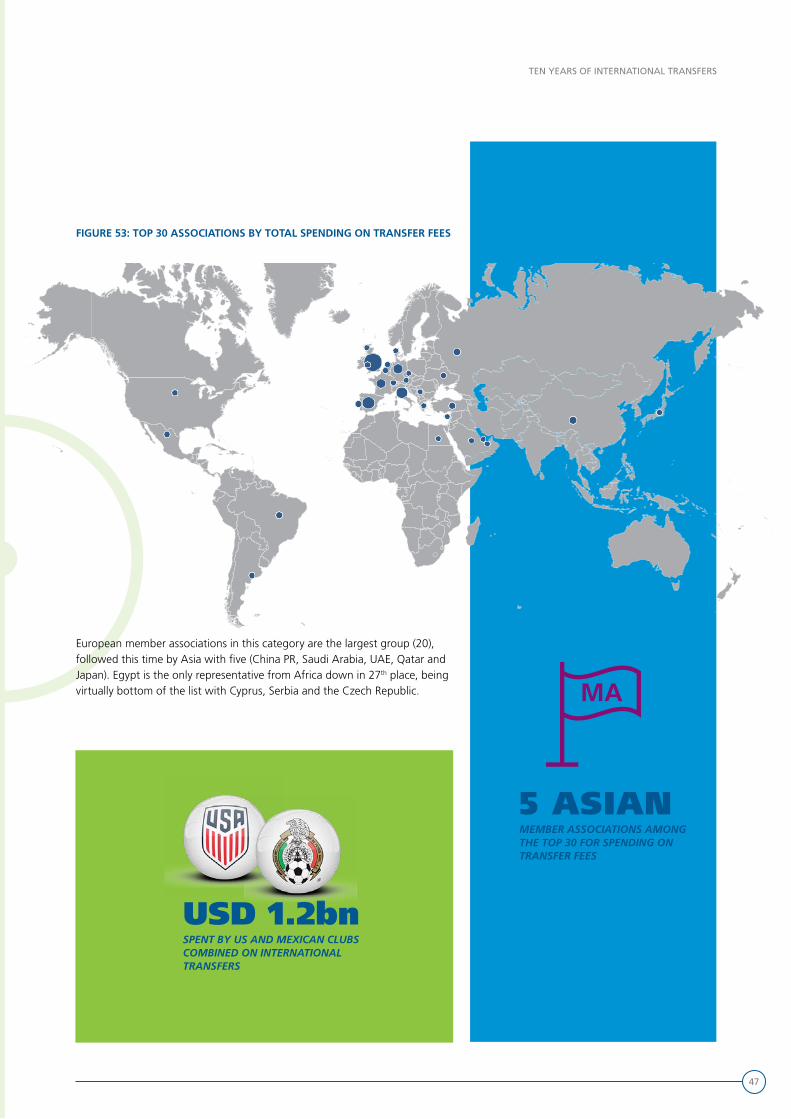
European member associations in this category are the largest group (20), followed this time by Asia with five (China PR, Saudi Arabia, UAE, Qatar and Japan). Egypt is the only representative from Africa down in 27th place, being virtually bottom of the list with Cyprus, Serbia and the Czech Republic.
5 ASIAN MEMBER ASSOCIATIONS AMONGTHE TOP 30 FOR SPENDING ON TRANSFER FEES
USD 1.2bnSPENT BY US AND MEXICAN CLUBS COMBINED ON INTERNATIONAL TRANSFERS
48
TEN YEARS OF INTERNATIONAL TRANSFERS
2011 2012 2013 2014 2015 2016 2017 2018 2019 2020
0.52
bn
0.59
bn 0.
90b
n
1.13
bn
1.23
bn
1.34
bn 1.61
bn 1.
95b
n
1.52
bn
1.63
bn
2011 2012 2013 2014 2015 2016 2017 2018 2019 2020
0.43
bn
0.18
bn 0.37
bn
0.70
bn
0.60
bn
0.50
bn 0.
73b
n
1.34
bn
1.29
bn
0.61
bn
2011 2012 2013 2014 2015 2016 2017 2018 2019 2020
0.39
bn
0.26
bn
0.50
bn
0.30
bn
0.53
bn
0.50
bn 0.64
bn 0.
83b
n
0.87
bn
0.73
bn
2011 2012 2013 2014 2015 2016 2017 2018 2019 2020
0.16
bn
0.24
bn
0.25
bn
0.33
bn
0.36
bn
0.57
bn 0.
72b
n
0.48
bn
0.69
bn
0.55
bn
2011 2012 2013 2014 2015 2016 2017 2018 2019 2020
0.16
bn
0.23
bn 0.
40b
n
0.21
bn
0.31
bn
0.20
bn
0.85
bn
0.46
bn
0.68
bn
0.53
bn
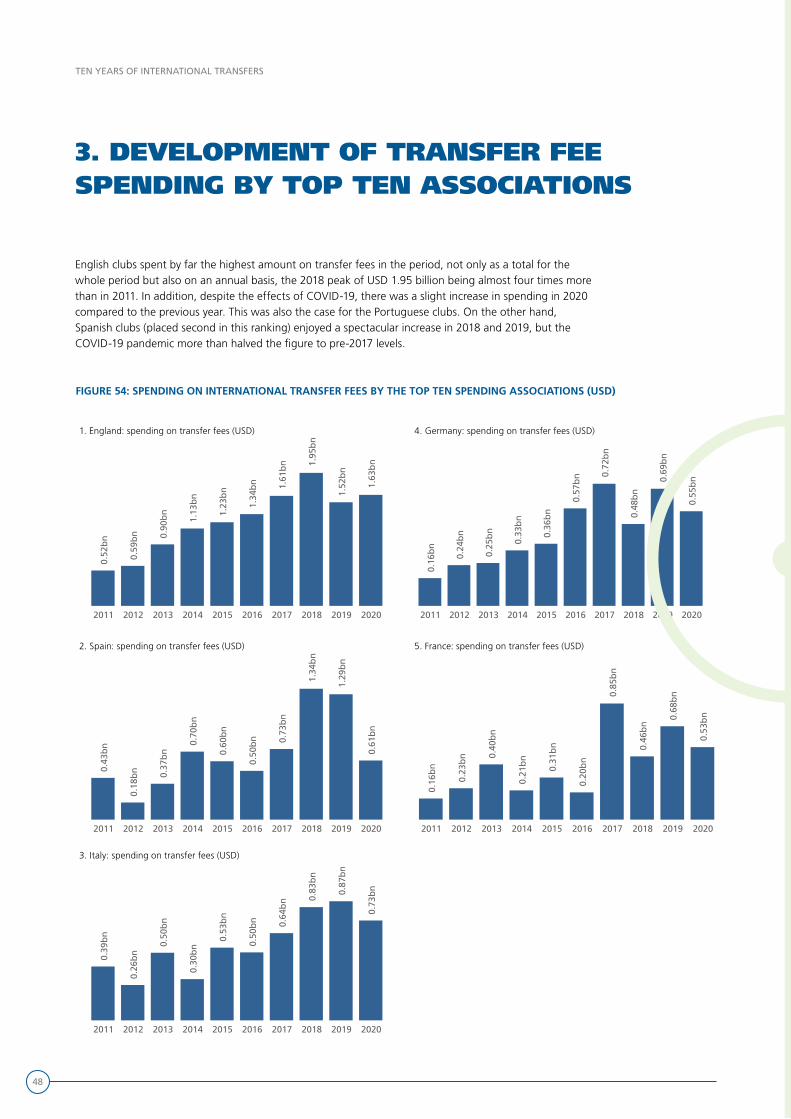
English clubs spent by far the highest amount on transfer fees in the period, not only as a total for the whole period but also on an annual basis, the 2018 peak of USD 1.95 billion being almost four times more than in 2011. In addition, despite the effects of COVID-19, there was a slight increase in spending in 2020 compared to the previous year. This was also the case for the Portuguese clubs. On the other hand, Spanish clubs (placed second in this ranking) enjoyed a spectacular increase in 2018 and 2019, but the COVID-19 pandemic more than halved the figure to pre-2017 levels.
3. DEVELOPMENT OF TRANSFER FEE SPENDING BY TOP TEN ASSOCIATIONS
FIGURE 54: SPENDING ON INTERNATIONAL TRANSFER FEES BY THE TOP TEN SPENDING ASSOCIATIONS (USD)
1. England: spending on transfer fees (USD) 4. Germany: spending on transfer fees (USD)
2. Spain: spending on transfer fees (USD) 5. France: spending on transfer fees (USD)
3. Italy: spending on transfer fees (USD)
49
TEN YEARS OF INTERNATIONAL TRANSFERS
2011 2012 2013 2014 2015 2016 2017 2018 2019 2020
0.28
bn
0.31
bn
0.23
bn
0.11
bn
0.02
bn
0.11
bn
0.15
bn
0.08
bn
0.29
bn
0.12
bn
2011 2012 2013 2014 2015 2016 2017 2018 2019 2020
0.03
bn
0.05
bn
0.03
bn 0.10
bn 0.17
bn
0.45
bn
0.28
bn
0.19
bn
0.30
bn
0.09
bn
2011 2012 2013 2014 2015 2016 2017 2018 2019 2020
126m
85m
116m
146m
83m
177m
95m 11
6m
181m 19
5m
2011 2012 2013 2014 2015 2016 2017 2018 2019 2020
127m
108m
195m
111m
95m
66m
159m
65m
112m
76m
2011 2012 2013 2014 2015 2016 2017 2018 2019 2020
45m
32m 48
m
50m 60
m
96m
127m 14
9m
183m
138m
2011 2012 2013 2014 2015 2016 2017 2018 2019 2020
0.28
bn
0.31
bn
0.23
bn
0.11
bn
0.02
bn
0.11
bn
0.15
bn
0.08
bn
0.29
bn
0.12
bn
2011 2012 2013 2014 2015 2016 2017 2018 2019 2020
0.03
bn
0.05
bn
0.03
bn 0.10
bn 0.17
bn
0.45
bn
0.28
bn
0.19
bn
0.30
bn
0.09
bn
2011 2012 2013 2014 2015 2016 2017 2018 2019 2020
126m
85m
116m
146m
83m
177m
95m 11
6m
181m 19
5m
2011 2012 2013 2014 2015 2016 2017 2018 2019 2020
127m
108m
195m
111m
95m
66m
159m
65m
112m
76m
2011 2012 2013 2014 2015 2016 2017 2018 2019 2020
45m
32m 48
m
50m 60
m
96m
127m 14
9m
183m
138m
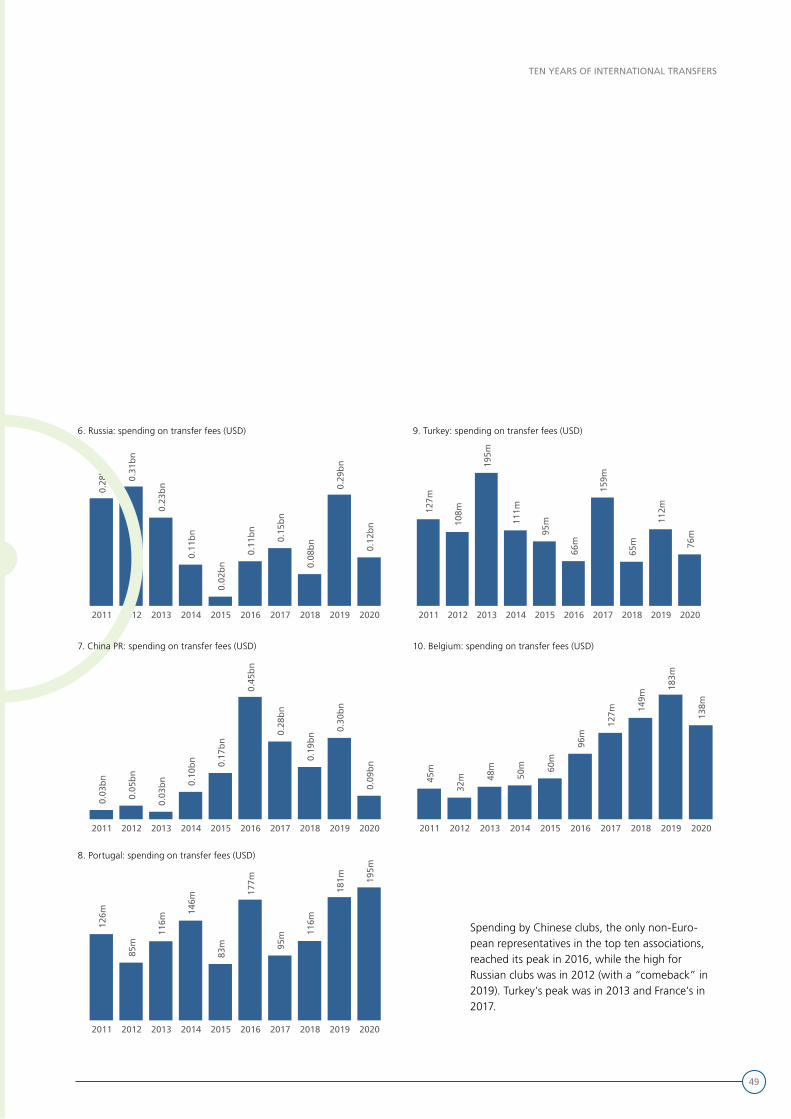
Spending by Chinese clubs, the only non-Euro-pean representatives in the top ten associations, reached its peak in 2016, while the high for Russian clubs was in 2012 (with a “comeback” in 2019). Turkey’s peak was in 2013 and France’s in 2017.
6. Russia: spending on transfer fees (USD) 9. Turkey: spending on transfer fees (USD)
7. China PR: spending on transfer fees (USD) 10. Belgium: spending on transfer fees (USD)
8. Portugal: spending on transfer fees (USD)
2011 2012 2013 2014 2015 2016 2017 2018 2019 2020
0.28
bn
0.31
bn
0.23
bn
0.11
bn
0.02
bn
0.11
bn
0.15
bn
0.08
bn
0.29
bn
0.12
bn
2011 2012 2013 2014 2015 2016 2017 2018 2019 2020
0.03
bn
0.05
bn
0.03
bn 0.10
bn 0.17
bn
0.45
bn
0.28
bn
0.19
bn
0.30
bn
0.09
bn
2011 2012 2013 2014 2015 2016 2017 2018 2019 2020
126m
85m
116m
146m
83m
177m
95m 11
6m
181m 19
5m
2011 2012 2013 2014 2015 2016 2017 2018 2019 2020
127m
108m
195m
111m
95m
66m
159m
65m
112m
76m
2011 2012 2013 2014 2015 2016 2017 2018 2019 2020
45m
32m 48
m
50m 60
m
96m
127m 14
9m
183m
138m
50
TEN YEARS OF INTERNATIONAL TRANSFERS
Top 30 associations by the number of outgoing transfers 2011 - 2020
Brazil
England
Spain
Argentina
Portugal
France
Italy
Germany
Colombia
Belgium
USA
Greece
Uruguay
Russia
Serbia
Netherlands
Nigeria
Ukraine
Mexico
Romania
Sweden
Turkey
Croatia
Ghana
Poland
Cyprus
Denmark
Paraguay
Switzerland
Scotland
7.3k
6.5k
4.4k
4.3k
4.2k
4.0k
3.7k
3.5k
2.8k
2.5k
2.4k
2.4k
2.3k
2.3k
2.2k
2.1k
1.9k
1.9k
1.8k
1.7k
1.7k
1.7k
1.6k
1.5k
1.5k
1.5k
1.3k
1.3k
1.3k
1.3k
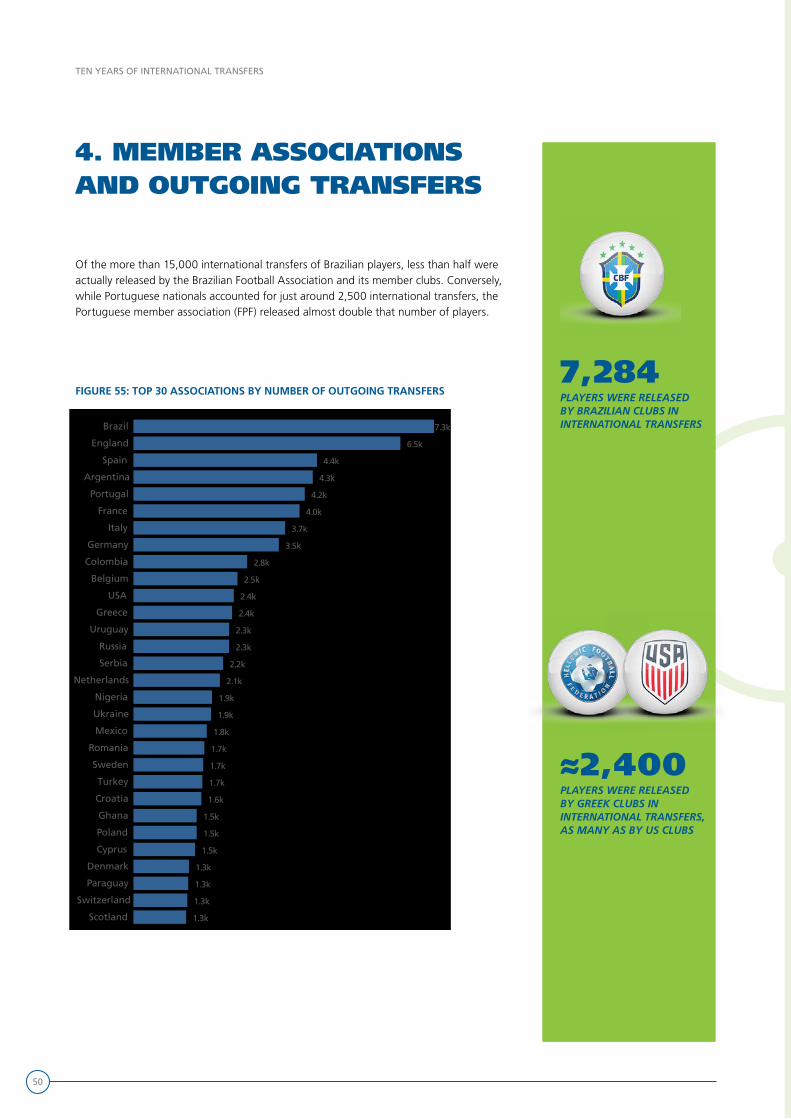
FIGURE 55: TOP 30 ASSOCIATIONS BY NUMBER OF OUTGOING TRANSFERS
4. MEMBER ASSOCIATIONS AND OUTGOING TRANSFERS
Of the more than 15,000 international transfers of Brazilian players, less than half were actually released by the Brazilian Football Association and its member clubs. Conversely, while Portuguese nationals accounted for just around 2,500 international transfers, the Portuguese member association (FPF) released almost double that number of players.
7,284 PLAYERS WERE RELEASEDBY BRAZILIAN CLUBS IN INTERNATIONAL TRANSFERS
≈2,400 PLAYERS WERE RELEASEDBY GREEK CLUBS IN INTERNATIONAL TRANSFERS, AS MANY AS BY US CLUBS
51
TEN YEARS OF INTERNATIONAL TRANSFERS
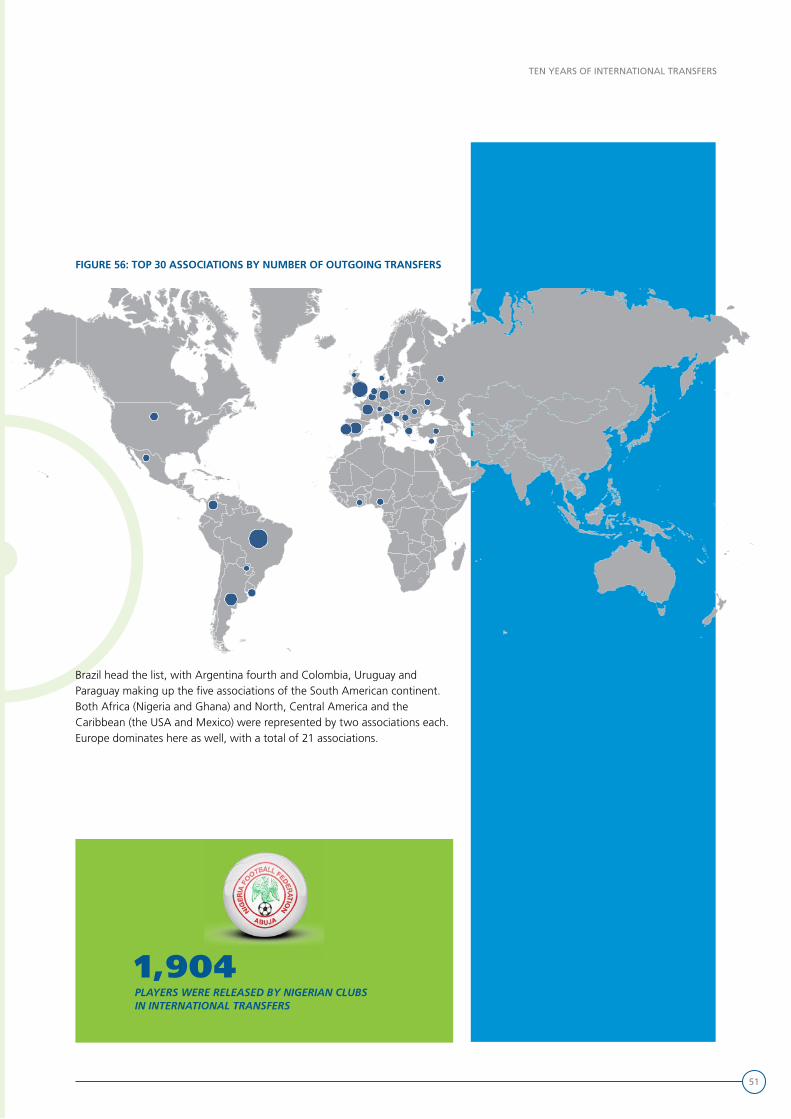
FIGURE 56: TOP 30 ASSOCIATIONS BY NUMBER OF OUTGOING TRANSFERS
Brazil head the list, with Argentina fourth and Colombia, Uruguay and Paraguay making up the five associations of the South American continent. Both Africa (Nigeria and Ghana) and North, Central America and the Caribbean (the USA and Mexico) were represented by two associations each. Europe dominates here as well, with a total of 21 associations.
1,904 PLAYERS WERE RELEASED BY NIGERIAN CLUBS IN INTERNATIONAL TRANSFERS
52
TEN YEARS OF INTERNATIONAL TRANSFERS
FIGURE 57: TOP 30 ASSOCIATIONS BY TOTAL RECEIPTS FROM TRANSFER FEES (USD)Top 30 associations by total receipts from transfer fees (USD) 2011 - 2020
Spain
England
France
Portugal
Italy
Germany
Brazil
Netherlands
Belgium
Argentina
Ukraine
Russia
Turkey
Switzerland
Austria
Uruguay
Mexico
Wales
Denmark
Croatia
Greece
Colombia
Sweden
Serbia
Poland
Scotland
Norway
Czech Republic
Chile
China PR
6.2bn
5.2bn
4.9bn
4.3bn
4.2bn
3.4bn
2.8bn
2.0bn
1.5bn
1.3bn
0.9bn
0.9bn
0.8bn
0.8bn
0.6bn
0.6bn
0.6bn
0.5bn
0.5bn
0.5bn
0.4bn
0.4bn
0.4bn
0.3bn
0.3bn
0.3bn
0.3bn
0.3bn
0.3bn
0.2bn
Although it topped the list in terms of the number of player transfers, the Brazilian Football Association (CBF) is only 7th in respect of receipts from transfers. At USD 2.8 billion, this figure is less than half of the amount earned by Spanish clubs in the period from the international transfers of players.
5. RECEIPTS FROM TRANSFER FEES BY ASSOCIATION
USD 6.2bn
RECEIVED BY SPANISH CLUBS BETWEEN 2011 AND 2020 FOR INTERNATIONAL TRANSFERS
USD 4.3bn RECEIVED BY PORTUGUESE CLUBS FOR INTERNATIONAL TRANSFERS
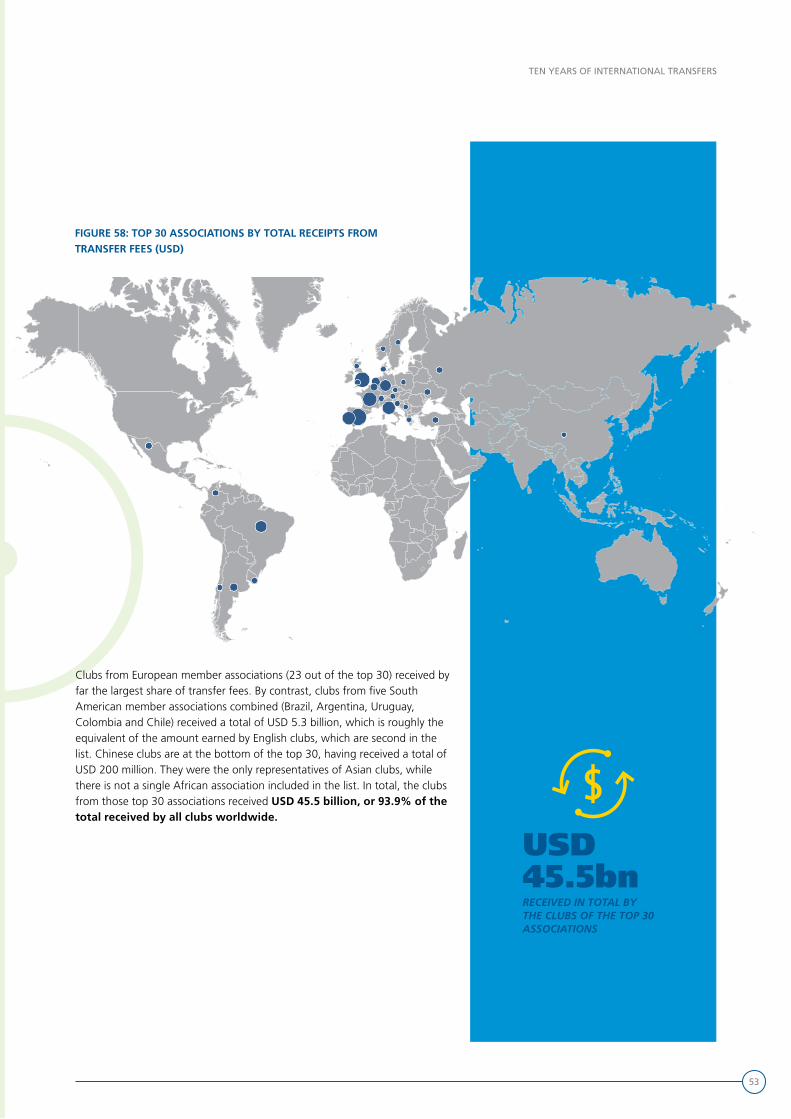
53
TEN YEARS OF INTERNATIONAL TRANSFERS
FIGURE 58: TOP 30 ASSOCIATIONS BY TOTAL RECEIPTS FROM TRANSFER FEES (USD)
Clubs from European member associations (23 out of the top 30) received by far the largest share of transfer fees. By contrast, clubs from five South American member associations combined (Brazil, Argentina, Uruguay, Colombia and Chile) received a total of USD 5.3 billion, which is roughly the equivalent of the amount earned by English clubs, which are second in the list. Chinese clubs are at the bottom of the top 30, having received a total of USD 200 million. They were the only representatives of Asian clubs, while there is not a single African association included in the list. In total, the clubs from those top 30 associations received USD 45.5 billion, or 93.9% of the total received by all clubs worldwide.
USD 45.5bn RECEIVED IN TOTAL BY THE CLUBS OF THE TOP 30 ASSOCIATIONS
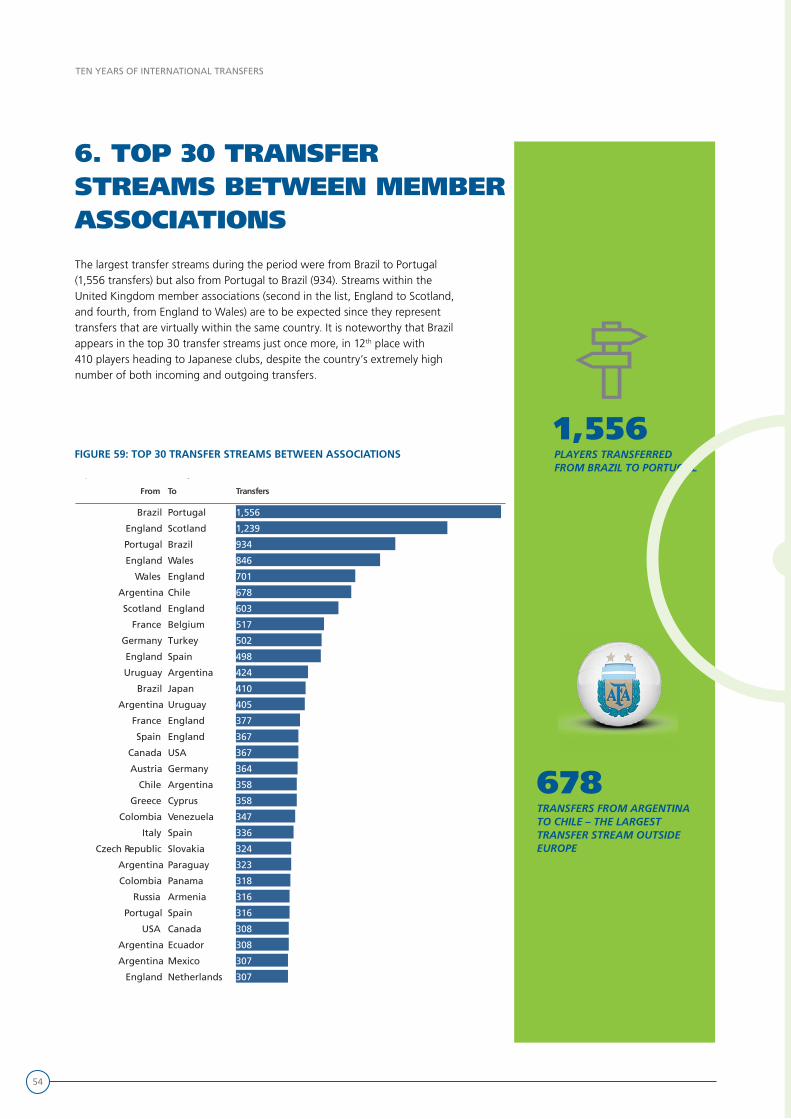
54
TEN YEARS OF INTERNATIONAL TRANSFERS
Top 30 transfer streams by the number of transfers 2011 - 2020
From To Transfers
Brazil
England
Portugal
England
Wales
Argentina
Scotland
France
Germany
England
Uruguay
Brazil
Argentina
France
Spain
Canada
Austria
Chile
Greece
Colombia
Portugal
Scotland
Brazil
Wales
England
Chile
England
Belgium
Turkey
Spain
Argentina
Japan
Uruguay
England
England
USA
Germany
Argentina
Cyprus
Venezuela
1,556
1,239
934
846
701
678
603
517
502
498
424
410
405
377
367
367
364
358
358
347
Italy
Czech Republic
Argentina
Colombia
Russia
Portugal
USA
Argentina
Argentina
England
Spain
Slovakia
Paraguay
Panama
Armenia
Spain
Canada
Ecuador
Mexico
Netherlands
336
324
323
318
316
316
308
308
307
307
FIGURE 59: TOP 30 TRANSFER STREAMS BETWEEN ASSOCIATIONS
The largest transfer streams during the period were from Brazil to Portugal (1,556 transfers) but also from Portugal to Brazil (934). Streams within the United Kingdom member associations (second in the list, England to Scotland, and fourth, from England to Wales) are to be expected since they represent transfers that are virtually within the same country. It is noteworthy that Brazil appears in the top 30 transfer streams just once more, in 12th place with 410 players heading to Japanese clubs, despite the country’s extremely high number of both incoming and outgoing transfers.
6. TOP 30 TRANSFER STREAMS BETWEEN MEMBER ASSOCIATIONS
1,556 PLAYERS TRANSFERRED FROM BRAZIL TO PORTUGAL
678 TRANSFERS FROM ARGENTINA TO CHILE – THE LARGEST TRANSFER STREAM OUTSIDE EUROPE
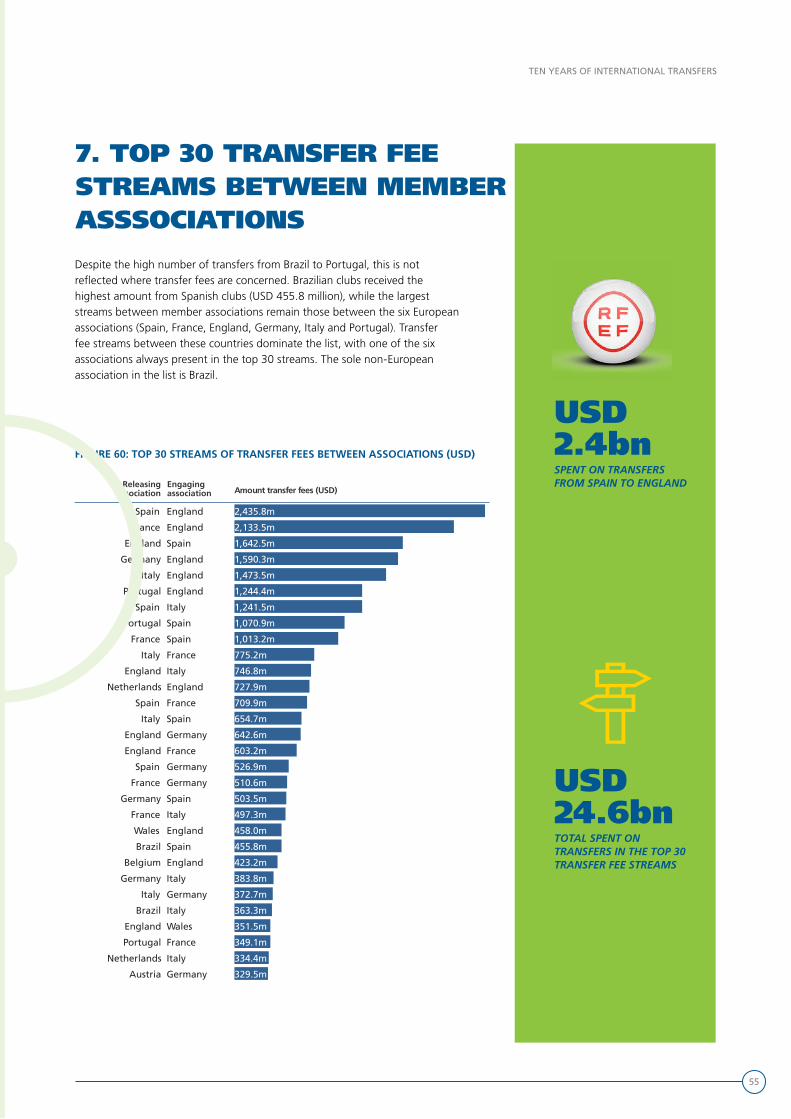
55
TEN YEARS OF INTERNATIONAL TRANSFERS
Top 30 transfer streams by the amount spent on transfer fees 2011 - 2020
Releasingassociation
Engaging association Amount transfer fees (USD)
Spain
France
England
Germany
Italy
Portugal
Spain
Portugal
France
Italy
England
Netherlands
Spain
Italy
England
England
Spain
France
Germany
France
England
England
Spain
England
England
England
Italy
Spain
Spain
France
Italy
England
France
Spain
Germany
France
Germany
Germany
Spain
Italy
2,435.8m
2,133.5m
1,642.5m
1,590.3m
1,473.5m
1,244.4m
1,241.5m
1,070.9m
1,013.2m
775.2m
746.8m
727.9m
709.9m
654.7m
642.6m
603.2m
526.9m
510.6m
503.5m
497.3m
Wales
Brazil
Belgium
Germany
Italy
Brazil
England
Portugal
Netherlands
Austria
England
Spain
England
Italy
Germany
Italy
Wales
France
Italy
Germany
458.0m
455.8m
423.2m
383.8m
372.7m
363.3m
351.5m
349.1m
334.4m
329.5m
FIGURE 60: TOP 30 STREAMS OF TRANSFER FEES BETWEEN ASSOCIATIONS (USD)
Despite the high number of transfers from Brazil to Portugal, this is not reflected where transfer fees are concerned. Brazilian clubs received the highest amount from Spanish clubs (USD 455.8 million), while the largest streams between member associations remain those between the six European associations (Spain, France, England, Germany, Italy and Portugal). Transfer fee streams between these countries dominate the list, with one of the six associations always present in the top 30 streams. The sole non-European association in the list is Brazil.
7. TOP 30 TRANSFER FEE STREAMS BETWEEN MEMBER ASSSOCIATIONS
USD 24.6bn TOTAL SPENT ON TRANSFERS IN THE TOP 30 TRANSFER FEE STREAMS
USD 2.4bn SPENT ON TRANSFERS FROM SPAIN TO ENGLAND
56
TEN YEARS OF INTERNATIONAL TRANSFERS
8. POSITIVE /
NEGATIVE BALANCES
OF ASSOCIATIONS
IN THE TRANSFER
MARKET
57
TEN YEARS OF INTERNATIONAL TRANSFERS

58
TEN YEARS OF INTERNATIONAL TRANSFERS
AssociationAssociation ConfederationConfederationOutgoing Outgoing transferstransfers
% % with feeswith fees
Incoming Incoming transferstransfers
% with % with feesfees
Receipts from Receipts from transfer fees transfer fees
(USD)(USD)
Spending onSpending ontransfer fees transfer fees
(USD(USD)
Net profit fromNet profit fromtransfer fees transfer fees
(USD)(USD)
Portugal UEFA 4,152 19.1% 4,397 16.3% 4,275.5m 1,319.4m 2,956.2m
Brazil CONMEBOL 7,284 16.4% 6,157 6.5% 2,829.8m 827.5m 2,002.3m
Netherlands UEFA 2,095 25.4% 1,836 34.0% 2,003.0m 707.9m 1,295.1m
Argentina CONMEBOL 4,346 11.4% 2,760 13.7% 1,290.6m 407.4m 883.2m
France UEFA 4,025 19.4% 2,658 34.3% 4,871.0m 4,044.8m 826.3m
Belgium UEFA 2,522 25.1% 2,615 33.0% 1,496.1m 925.5m 570.5m
Uruguay CONMEBOL 2,320 19.7% 1,614 3.8% 568.2m 56.0m 512.2m
Switzerland UEFA 1,307 24.2% 1,185 25.5% 754.8m 261.4m 493.3m
Croatia UEFA 1,646 17.2% 1,141 15.9% 528.3m 86.0m 442.3m
Ukraine UEFA 1,882 16.6% 1,374 11.9% 864.0m 500.7m 363.3m
Denmark UEFA 1,344 28.6% 1,184 29.0% 531.2m 193.7m 337.4m
Austria UEFA 1,217 24.6% 1,024 25.9% 573.0m 237.2m 335.8m
Sweden UEFA 1,691 23.5% 2,195 14.0% 364.9m 63.6m 301.3m
Colombia CONMEBOL 2,756 12.0% 1,487 10.4% 378.1m 87.7m 290.4m
Serbia UEFA 2,173 14.7% 1,324 9.3% 312.2m 94.8m 217.4m
Norway UEFA 1,221 26.0% 1,550 24.3% 284.1m 75.8m 208.4m
Chile CONMEBOL 1,220 18.4% 1,567 10.7% 251.7m 44.5m 207.2m
Poland UEFA 1,533 16.4% 2,076 15.4% 297.0m 93.5m 203.5m
Romania UEFA 1,719 12.6% 2,116 6.0% 231.9m 41.0m 190.8m
Czech Republic UEFA 1,256 23.6% 953 24.8% 273.3m 94.5m 178.8m
Paraguay CONMEBOL 1,328 12.9% 1,062 5.8% 163.9m 42.4m 121.4m
Ecuador CONMEBOL 792 14.1% 1,102 8.9% 150.2m 32.7m 117.4m
Greece UEFA 2,391 9.7% 2,492 10.3% 439.6m 337.6m 101.9m
Slovakia UEFA 1,100 20.0% 1,138 16.9% 118.1m 22.4m 95.6m
Slovenia UEFA 750 23.9% 874 6.9% 96.4m 12.1m 84.4m
Korea Republic AFC 1,066 11.3% 773 24.7% 140.3m 61.8m 78.5m
Bulgaria UEFA 1,086 14.1% 1,270 8.2% 108.9m 43.5m 65.4m
Venezuela CONMEBOL 831 14.9% 889 3.7% 51.7m 1.5m 50.1m
Scotland UEFA 1,278 16.0% 1,980 12.4% 284.2m 234.3m 50.0m
Ghana CAF 1,533 19.0% 381 5.8% 50.1M 0.4m 49.6m
FIGURE 61: TOP 30 ASSOCIATIONS WHOSE CLUBS MADE A NET PROFIT FROM INTERNATIONAL TRANSFERS
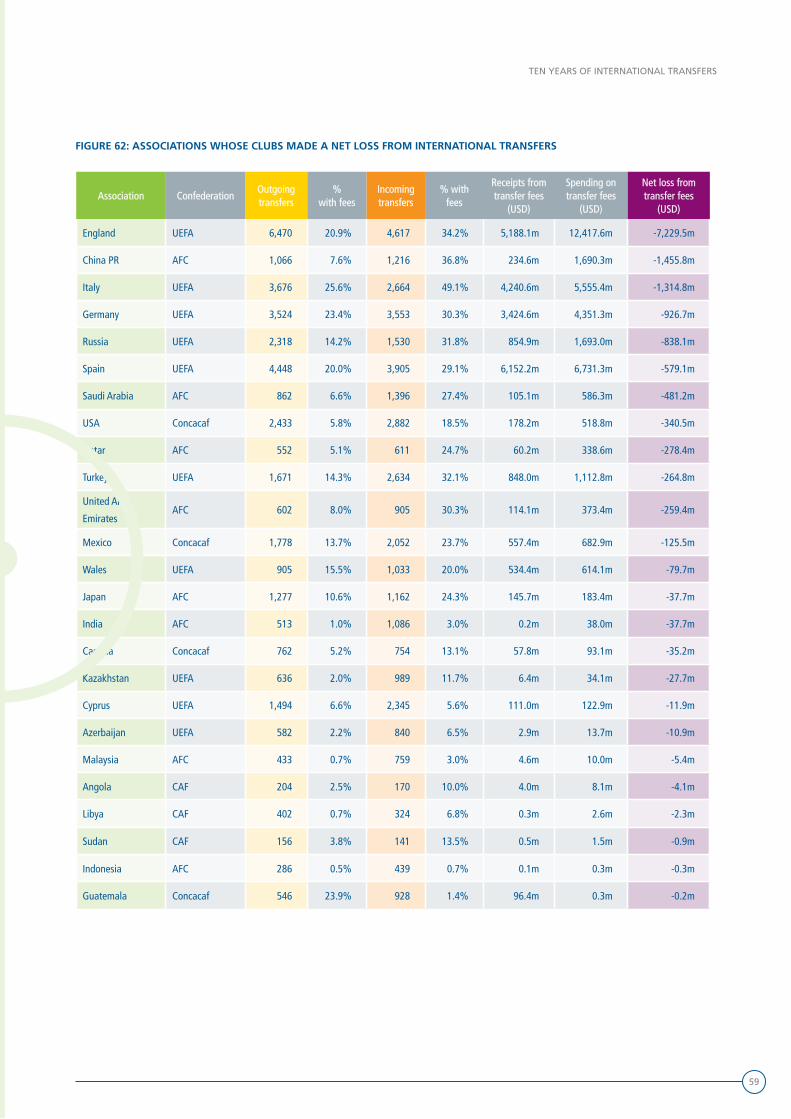
59
TEN YEARS OF INTERNATIONAL TRANSFERS
AssociationAssociation ConfederationConfederationOutgoing Outgoing transferstransfers
% % with feeswith fees
Incoming Incoming transferstransfers
% with % with feesfees
Receipts from Receipts from transfer fees transfer fees
(USD)(USD)
Spending onSpending ontransfer fees transfer fees
(USD(USD)
Net loss fromNet loss fromtransfer fees transfer fees
(USD)(USD)
England UEFA 6,470 20.9% 4,617 34.2% 5,188.1m 12,417.6m -7,229.5m
China PR AFC 1,066 7.6% 1,216 36.8% 234.6m 1,690.3m -1,455.8m
Italy UEFA 3,676 25.6% 2,664 49.1% 4,240.6m 5,555.4m -1,314.8m
Germany UEFA 3,524 23.4% 3,553 30.3% 3,424.6m 4,351.3m -926.7m
Russia UEFA 2,318 14.2% 1,530 31.8% 854.9m 1,693.0m -838.1m
Spain UEFA 4,448 20.0% 3,905 29.1% 6,152.2m 6,731.3m -579.1m
Saudi Arabia AFC 862 6.6% 1,396 27.4% 105.1m 586.3m -481.2m
USA Concacaf 2,433 5.8% 2,882 18.5% 178.2m 518.8m -340.5m
Qatar AFC 552 5.1% 611 24.7% 60.2m 338.6m -278.4m
Turkey UEFA 1,671 14.3% 2,634 32.1% 848.0m 1,112.8m -264.8m
United Arab
EmiratesAFC 602 8.0% 905 30.3% 114.1m 373.4m -259.4m
Mexico Concacaf 1,778 13.7% 2,052 23.7% 557.4m 682.9m -125.5m
Wales UEFA 905 15.5% 1,033 20.0% 534.4m 614.1m -79.7m
Japan AFC 1,277 10.6% 1,162 24.3% 145.7m 183.4m -37.7m
India AFC 513 1.0% 1,086 3.0% 0.2m 38.0m -37.7m
Canada Concacaf 762 5.2% 754 13.1% 57.8m 93.1m -35.2m
Kazakhstan UEFA 636 2.0% 989 11.7% 6.4m 34.1m -27.7m
Cyprus UEFA 1,494 6.6% 2,345 5.6% 111.0m 122.9m -11.9m
Azerbaijan UEFA 582 2.2% 840 6.5% 2.9m 13.7m -10.9m
Malaysia AFC 433 0.7% 759 3.0% 4.6m 10.0m -5.4m
Angola CAF 204 2.5% 170 10.0% 4.0m 8.1m -4.1m
Libya CAF 402 0.7% 324 6.8% 0.3m 2.6m -2.3m
Sudan CAF 156 3.8% 141 13.5% 0.5m 1.5m -0.9m
Indonesia AFC 286 0.5% 439 0.7% 0.1m 0.3m -0.3m
Guatemala Concacaf 546 23.9% 928 1.4% 96.4m 0.3m -0.2m
FIGURE 62: ASSOCIATIONS WHOSE CLUBS MADE A NET LOSS FROM INTERNATIONAL TRANSFERS
60
TEN YEARS OF INTERNATIONAL TRANSFERS
9. AGENTS’
COMMISSIONS
PER MEMBER
ASSOCIATION
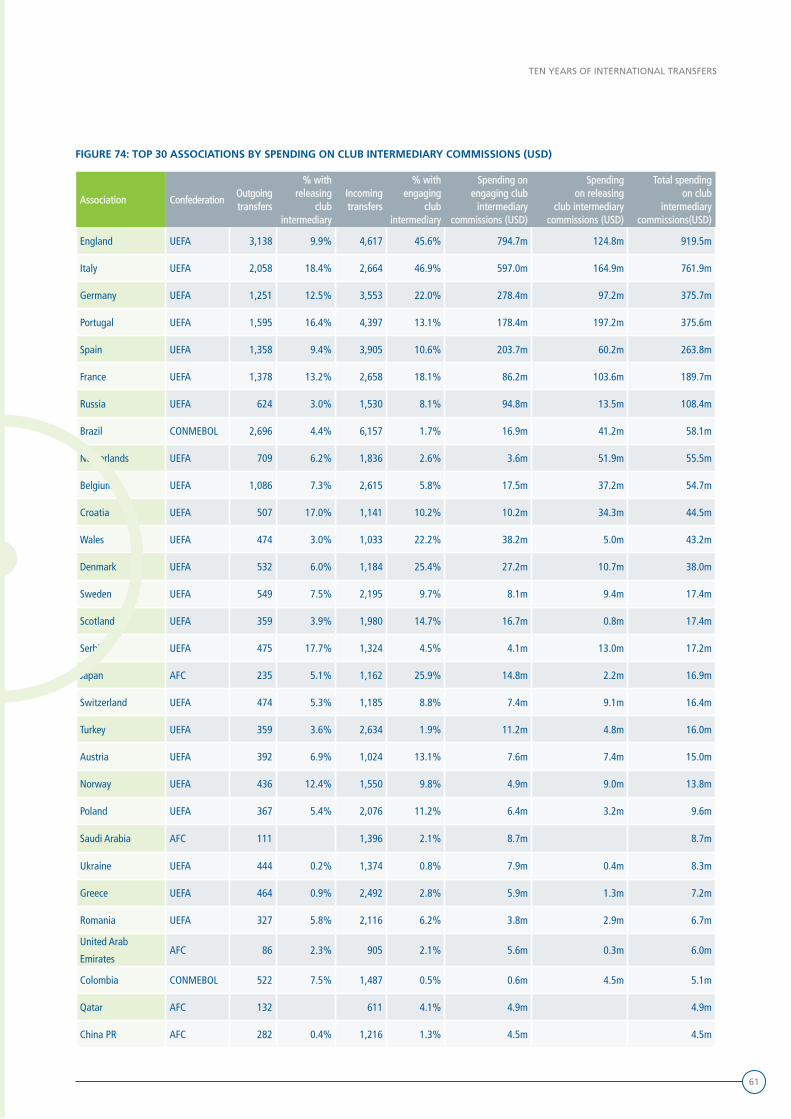
61
TEN YEARS OF INTERNATIONAL TRANSFERS
AssociationAssociation ConfederationConfederationOutgoing Outgoing transferstransfers
% with% withreleasing releasing
clubclubintermediaryintermediary
Incoming Incoming transferstransfers
% with% withengaging engaging
clubclubintermediaryintermediary
Spending on Spending on engaging clubengaging club
intermediaryintermediarycommissions (USD)commissions (USD)
Spending Spending on releasingon releasing
club intermediaryclub intermediarycommissions (USD)commissions (USD)
Total spending Total spending on clubon club
intermediary intermediary commissions(USD)commissions(USD)
England UEFA 3,138 9.9% 4,617 45.6% 794.7m 124.8m 919.5m
Italy UEFA 2,058 18.4% 2,664 46.9% 597.0m 164.9m 761.9m
Germany UEFA 1,251 12.5% 3,553 22.0% 278.4m 97.2m 375.7m
Portugal UEFA 1,595 16.4% 4,397 13.1% 178.4m 197.2m 375.6m
Spain UEFA 1,358 9.4% 3,905 10.6% 203.7m 60.2m 263.8m
France UEFA 1,378 13.2% 2,658 18.1% 86.2m 103.6m 189.7m
Russia UEFA 624 3.0% 1,530 8.1% 94.8m 13.5m 108.4m
Brazil CONMEBOL 2,696 4.4% 6,157 1.7% 16.9m 41.2m 58.1m
Netherlands UEFA 709 6.2% 1,836 2.6% 3.6m 51.9m 55.5m
Belgium UEFA 1,086 7.3% 2,615 5.8% 17.5m 37.2m 54.7m
Croatia UEFA 507 17.0% 1,141 10.2% 10.2m 34.3m 44.5m
Wales UEFA 474 3.0% 1,033 22.2% 38.2m 5.0m 43.2m
Denmark UEFA 532 6.0% 1,184 25.4% 27.2m 10.7m 38.0m
Sweden UEFA 549 7.5% 2,195 9.7% 8.1m 9.4m 17.4m
Scotland UEFA 359 3.9% 1,980 14.7% 16.7m 0.8m 17.4m
Serbia UEFA 475 17.7% 1,324 4.5% 4.1m 13.0m 17.2m
Japan AFC 235 5.1% 1,162 25.9% 14.8m 2.2m 16.9m
Switzerland UEFA 474 5.3% 1,185 8.8% 7.4m 9.1m 16.4m
Turkey UEFA 359 3.6% 2,634 1.9% 11.2m 4.8m 16.0m
Austria UEFA 392 6.9% 1,024 13.1% 7.6m 7.4m 15.0m
Norway UEFA 436 12.4% 1,550 9.8% 4.9m 9.0m 13.8m
Poland UEFA 367 5.4% 2,076 11.2% 6.4m 3.2m 9.6m
Saudi Arabia AFC 111 1,396 2.1% 8.7m 8.7m
Ukraine UEFA 444 0.2% 1,374 0.8% 7.9m 0.4m 8.3m
Greece UEFA 464 0.9% 2,492 2.8% 5.9m 1.3m 7.2m
Romania UEFA 327 5.8% 2,116 6.2% 3.8m 2.9m 6.7m
United Arab
EmiratesAFC 86 2.3% 905 2.1% 5.6m 0.3m 6.0m
Colombia CONMEBOL 522 7.5% 1,487 0.5% 0.6m 4.5m 5.1m
Qatar AFC 132 611 4.1% 4.9m 4.9m
China PR AFC 282 0.4% 1,216 1.3% 4.5m 4.5m
FIGURE 74: TOP 30 ASSOCIATIONS BY SPENDING ON CLUB INTERMEDIARY COMMISSIONS (USD)
62
TEN YEARS OF INTERNATIONAL TRANSFERS
E. NUMBERS ATCONFEDERATION
LEVEL
63
TEN YEARS OF INTERNATIONAL TRANSFERS

64
TEN YEARS OF INTERNATIONAL TRANSFERS
FIGURE 63: TRANSFERS AND TRANSFER FEES BY CONFEDERATION
Outgoing transfers Incoming transfers
Confederation Receipts from transfer fees(USD)
Spending on transfer fees(USD)
Associationsinvolved
Clubsinvolved
73,561
22,087
13,876
15,080
8,396
225
75,720
18,447
18,317
10,480
10,176
85
UEFA
CONMEBOL
AFC
CAF
Concacaf
OFC
40,475.4m
5,722.5m
885.6m
525.5m
860.6m
1.7m
42,168.5m
1,515.1m
3,305.8m
185.7m
1,296.2m
0.1m
54
10
46
53
30
7
3,889
1,151
1,151
1,471
602
2
European clubs made the most transfers – both incoming and outgoing – as well as paying and receiving the largest amounts in transfer fees. With 73,561 outgoing and 75,720 incoming transfers, they were involved in considerably more transfers than the clubs of all other confederations together. Where transfer fees were concerned, their share was 87% of the total amount paid and 83% of the total fees received in the last ten years.
Engaging confederationEngaging confederation
AFCAFC CAFCAF ConcacafConcacaf CONMEBOLCONMEBOL OFCOFC UEFAUEFA
AFC6,932
341.2m1,059 15.4m
300 9.4m
1,872 86.8m
43 -
3,678 432.9m
CAF3,166
104.5m7,525 83.1m
164 6.8m
188 13.6m
0 -
4,037 317.5m
Concacaf406
74.8m62
1.8m3,785
136.2m2,175
153.9m1 -
1,967 493.8m
CONMEBOL2,479
648.5m142
40.5m3,693
670.2m9,485
558.3m1 -
6,287 3,805.0m
OFC77
0.2m9
0.1m31 -
11 -
0 -
89 1.4m
UEFA5,275
2,136.5m1,683 44.8m
2,203 473.6m
4,716 702.5m
22 0.1m
59,662 37,117.9m
Rel
easi
ng
co
nfe
der
atio
nR
elea
sin
g c
on
fed
erat
ion
FIGURE 64: : NUMBER OF INTERNATIONAL TRANSFERS BETWEEN AND WITHIN CONFEDERATIONS AND TOTAL SPENDING ON TRANSFER FEES (USD)
Clubs from five member associations in Central and North America and the Carribean, four from Oceania and one each from Africa and Europe were not involved in any transfers at all over the period.
1. TRANSFERS, FEES AND TRAINING REWARDS PER CONFEDERATION
59,662TRANSFERS BETWEENEUROPEAN CLUBS
9,485TRANSFERS BETWEEN SOUTH AMERICAN CLUBS
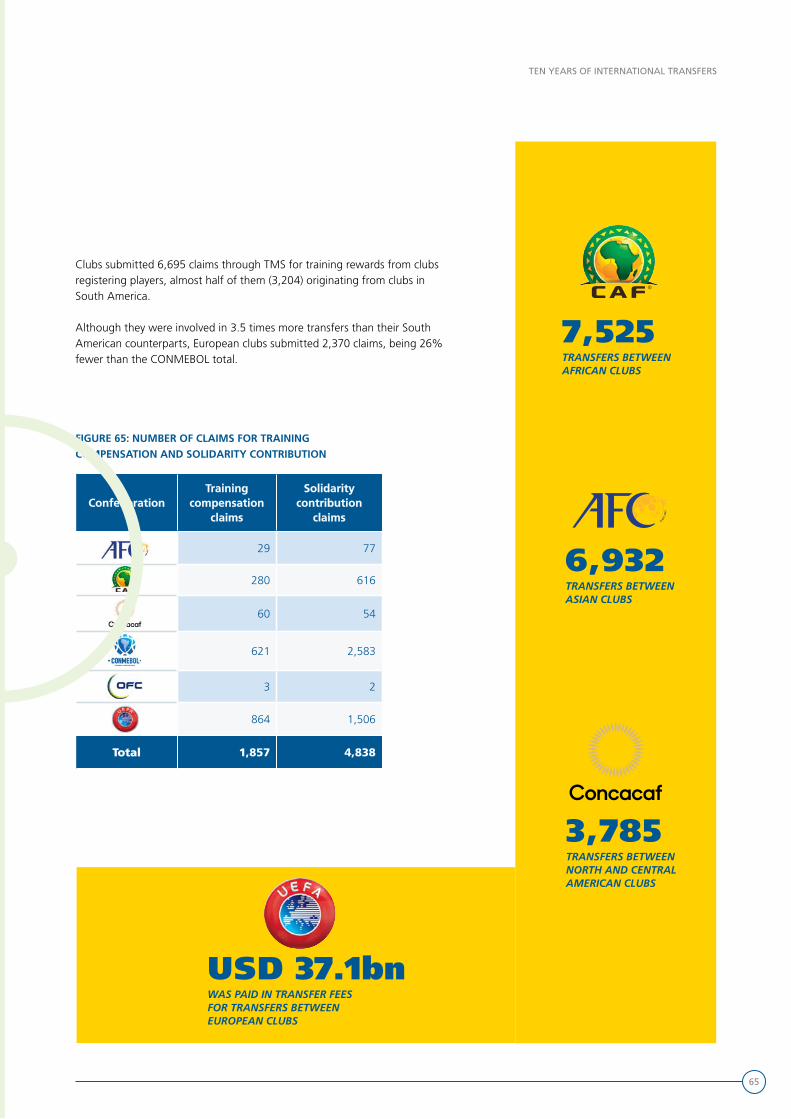
65
TEN YEARS OF INTERNATIONAL TRANSFERS
ConfederationConfederationTraining Training
compensation compensation claimsclaims
SolidaritySolidaritycontributioncontribution
claimsclaims
29 77
280 616
60 54
621 2,583
3 2
864 1,506
TotalTotal 1,857 4,838
Clubs submitted 6,695 claims through TMS for training rewards from clubs registering players, almost half of them (3,204) originating from clubs in South America.
Although they were involved in 3.5 times more transfers than their South American counterparts, European clubs submitted 2,370 claims, being 26% fewer than the CONMEBOL total.
USD 37.1bnWAS PAID IN TRANSFER FEESFOR TRANSFERS BETWEEN EUROPEAN CLUBS
6,932 TRANSFERS BETWEEN ASIAN CLUBS
7,525 TRANSFERS BETWEEN AFRICAN CLUBS
3,785 TRANSFERS BETWEENNORTH AND CENTRALAMERICAN CLUBS
FIGURE 65: NUMBER OF CLAIMS FOR TRAINING COMPENSATION AND SOLIDARITY CONTRIBUTION
66
TEN YEARS OF INTERNATIONAL TRANSFERS
F. TOP CLUBS OUTSIDE EUROPE
67
TEN YEARS OF INTERNATIONAL TRANSFERS
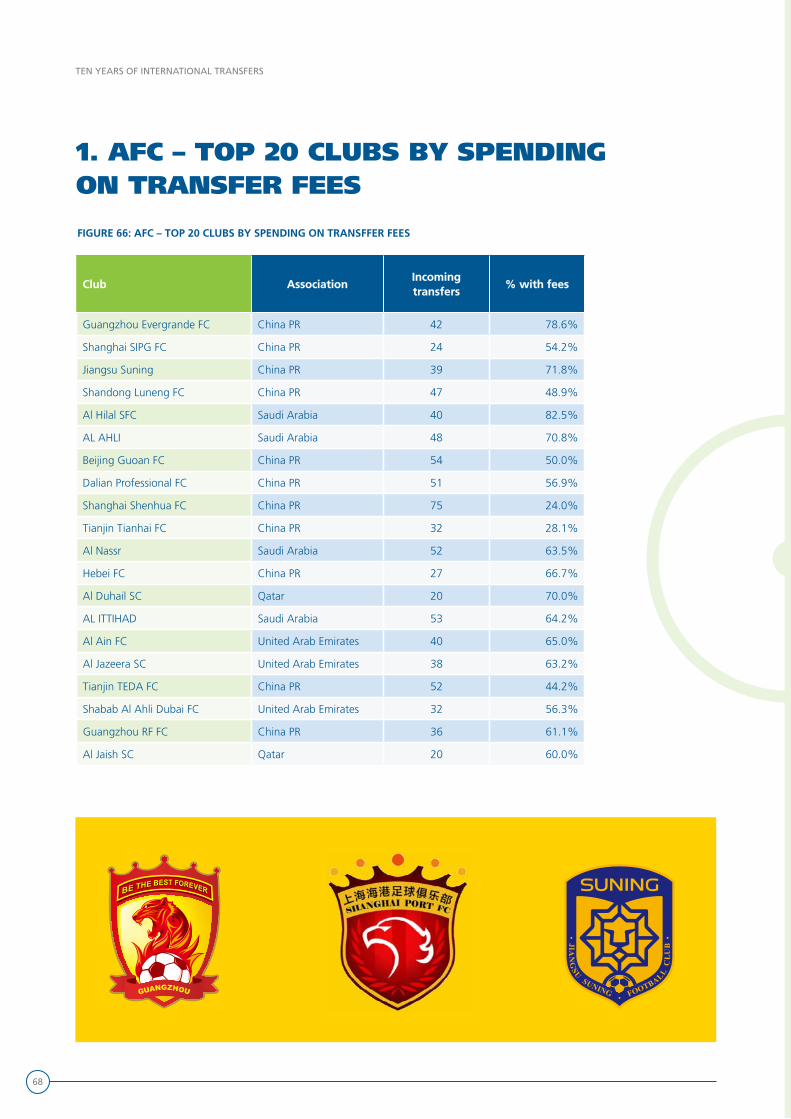
68
TEN YEARS OF INTERNATIONAL TRANSFERS
1. AFC – TOP 20 CLUBS BY SPENDING ON TRANSFER FEES
ClubClub AssociationAssociationIncoming Incoming transferstransfers
% with fees% with fees
Guangzhou Evergrande FC China PR 42 78.6%
Shanghai SIPG FC China PR 24 54.2%
Jiangsu Suning China PR 39 71.8%
Shandong Luneng FC China PR 47 48.9%
Al Hilal SFC Saudi Arabia 40 82.5%
AL AHLI Saudi Arabia 48 70.8%
Beijing Guoan FC China PR 54 50.0%
Dalian Professional FC China PR 51 56.9%
Shanghai Shenhua FC China PR 75 24.0%
Tianjin Tianhai FC China PR 32 28.1%
Al Nassr Saudi Arabia 52 63.5%
Hebei FC China PR 27 66.7%
Al Duhail SC Qatar 20 70.0%
AL ITTIHAD Saudi Arabia 53 64.2%
Al Ain FC United Arab Emirates 40 65.0%
Al Jazeera SC United Arab Emirates 38 63.2%
Tianjin TEDA FC China PR 52 44.2%
Shabab Al Ahli Dubai FC United Arab Emirates 32 56.3%
Guangzhou RF FC China PR 36 61.1%
Al Jaish SC Qatar 20 60.0%
FIGURE 66: AFC – TOP 20 CLUBS BY SPENDING ON TRANSFFER FEES
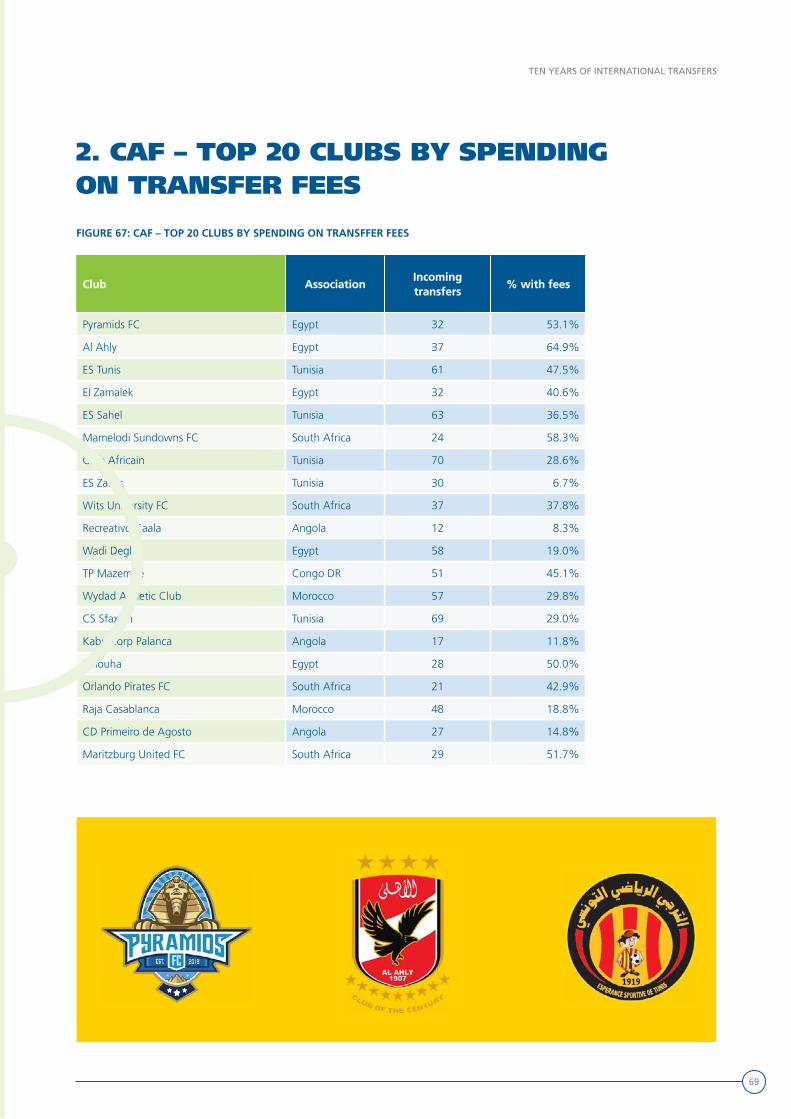
69
TEN YEARS OF INTERNATIONAL TRANSFERS
2. CAF – TOP 20 CLUBS BY SPENDING ON TRANSFER FEES
ClubClub AssociationAssociationIncoming Incoming transferstransfers
% with fees% with fees
Pyramids FC Egypt 32 53.1%
Al Ahly Egypt 37 64.9%
ES Tunis Tunisia 61 47.5%
El Zamalek Egypt 32 40.6%
ES Sahel Tunisia 63 36.5%
Mamelodi Sundowns FC South Africa 24 58.3%
Club Africain Tunisia 70 28.6%
ES Zarzis Tunisia 30 6.7%
Wits University FC South Africa 37 37.8%
Recreativo Caala Angola 12 8.3%
Wadi Degla Egypt 58 19.0%
TP Mazembe Congo DR 51 45.1%
Wydad Athletic Club Morocco 57 29.8%
CS Sfaxien Tunisia 69 29.0%
Kabuscorp Palanca Angola 17 11.8%
Smouha Egypt 28 50.0%
Orlando Pirates FC South Africa 21 42.9%
Raja Casablanca Morocco 48 18.8%
CD Primeiro de Agosto Angola 27 14.8%
Maritzburg United FC South Africa 29 51.7%
FIGURE 67: CAF – TOP 20 CLUBS BY SPENDING ON TRANSFFER FEES
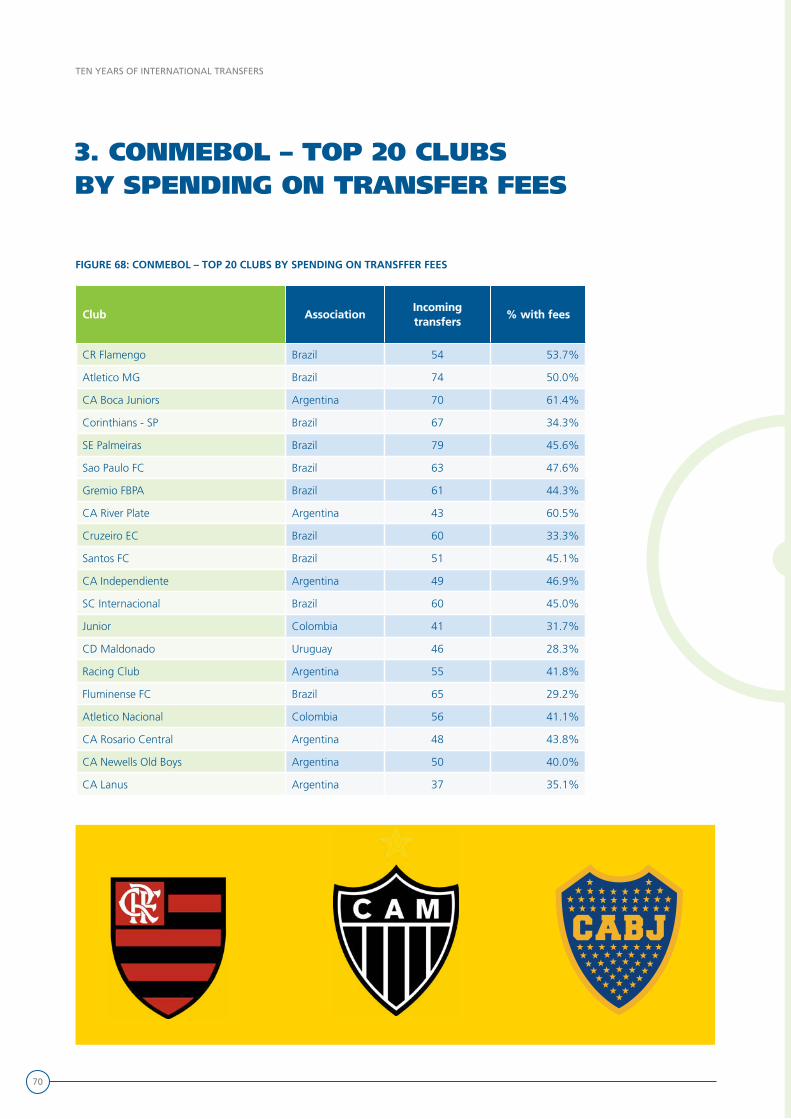
70
TEN YEARS OF INTERNATIONAL TRANSFERS
ClubClub AssociationAssociationIncoming Incoming transferstransfers
% with fees% with fees
CR Flamengo Brazil 54 53.7%
Atletico MG Brazil 74 50.0%
CA Boca Juniors Argentina 70 61.4%
Corinthians - SP Brazil 67 34.3%
SE Palmeiras Brazil 79 45.6%
Sao Paulo FC Brazil 63 47.6%
Gremio FBPA Brazil 61 44.3%
CA River Plate Argentina 43 60.5%
Cruzeiro EC Brazil 60 33.3%
Santos FC Brazil 51 45.1%
CA Independiente Argentina 49 46.9%
SC Internacional Brazil 60 45.0%
Junior Colombia 41 31.7%
CD Maldonado Uruguay 46 28.3%
Racing Club Argentina 55 41.8%
Fluminense FC Brazil 65 29.2%
Atletico Nacional Colombia 56 41.1%
CA Rosario Central Argentina 48 43.8%
CA Newells Old Boys Argentina 50 40.0%
CA Lanus Argentina 37 35.1%
3. CONMEBOL – TOP 20 CLUBS BY SPENDING ON TRANSFER FEES
FIGURE 68: CONMEBOL – TOP 20 CLUBS BY SPENDING ON TRANSFFER FEES
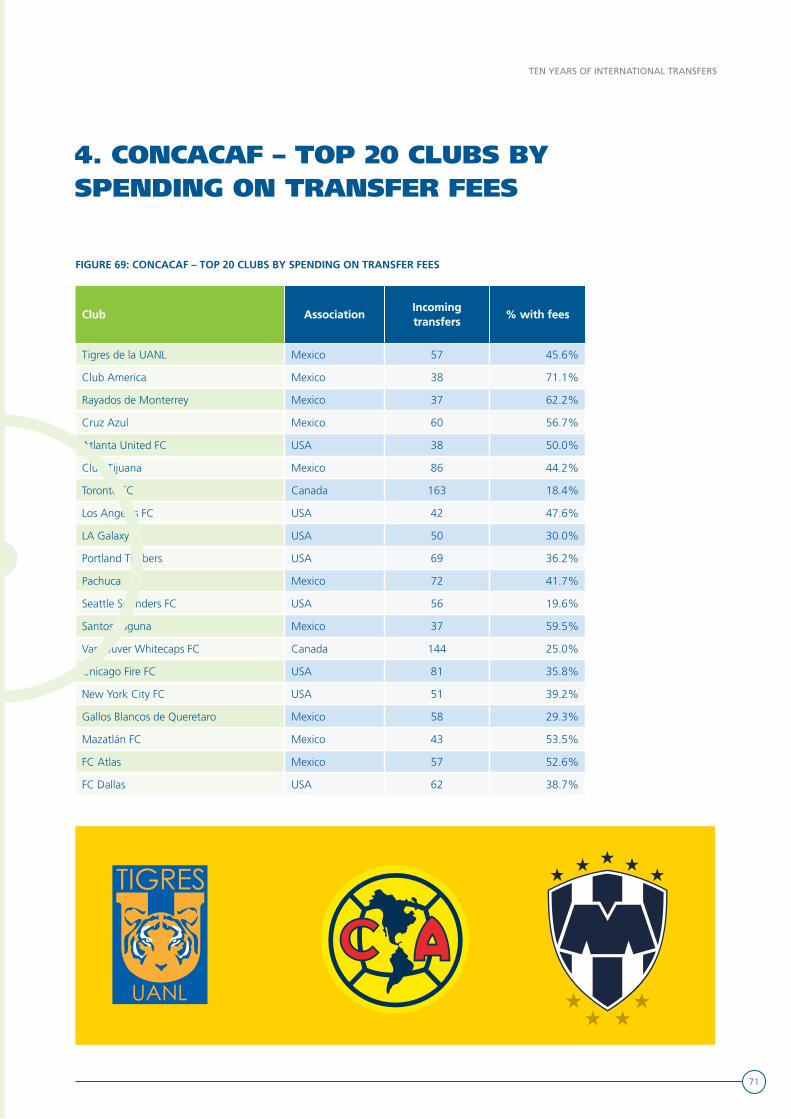
71
TEN YEARS OF INTERNATIONAL TRANSFERS
ClubClub AssociationAssociationIncoming Incoming transferstransfers
% with fees% with fees
Tigres de la UANL Mexico 57 45.6%
Club America Mexico 38 71.1%
Rayados de Monterrey Mexico 37 62.2%
Cruz Azul Mexico 60 56.7%
Atlanta United FC USA 38 50.0%
Club Tijuana Mexico 86 44.2%
Toronto FC Canada 163 18.4%
Los Angeles FC USA 42 47.6%
LA Galaxy USA 50 30.0%
Portland Timbers USA 69 36.2%
Pachuca Mexico 72 41.7%
Seattle Sounders FC USA 56 19.6%
Santos Laguna Mexico 37 59.5%
Vancouver Whitecaps FC Canada 144 25.0%
Chicago Fire FC USA 81 35.8%
New York City FC USA 51 39.2%
Gallos Blancos de Queretaro Mexico 58 29.3%
Mazatlán FC Mexico 43 53.5%
FC Atlas Mexico 57 52.6%
FC Dallas USA 62 38.7%
4. CONCACAF – TOP 20 CLUBS BY SPENDING ON TRANSFER FEES
FIGURE 69: CONCACAF – TOP 20 CLUBS BY SPENDING ON TRANSFER FEES

72
TEN YEARS OF INTERNATIONAL TRANSFERS
Releasing club Releasing club ReleasingReleasing
associationassociationOutgoingOutgoingtransferstransfers
Guangzhou RF FC China PR 60
Shandong Luneng FC China PR 33
Ulsan Hyundai FC Korea Republic 32
Al Duhail SC Qatar 31
Al Hilal SFC Saudi Arabia 30
Guangzhou Evergrande FC China PR 28
Al Sadd SC Qatar 27
Jeonbuk Hyundai Motors FC Korea Republic 24
Central Coast Mariners FC Australia 21
Al Wahda Syria 21
Pakhtakor FC Uzbekistan 20
FC Seoul Korea Republic 19
Al Wathba Syria 19
Adelaide United FC Australia 18
Beijing Guoan FC China PR 18
FC Tokyo Japan 17
Al-Wakrah SC Qatar 17
Al Ain FC United Arab Emirates 17
KASHIWA REYSOL Japan 16
Jeju United FC Korea Republic 16
Al Gharafa SC Qatar 16
AL ITTIHAD Syria 16
Al Majd Syria 16
Hebei FC China PR 15
CEREZO OSAKA Japan 15
Yokohama FC Japan 15
Al Wehdat Jordan 15
SCG Muangthong United Thailand 15
Brisbane Roar FC Australia 14
Melbourne City FC Australia 14
5. AFC – TOP 30 CLUBS BY NUMBER OF OUTGOING TRANSFERS
FIGURE 70: AFC – TOP 30 CLUBS BY NUMBER OF OUTGOING TRANSFERS

73
TEN YEARS OF INTERNATIONAL TRANSFERS
Releasing club Releasing club ReleasingReleasing
associationassociationOutgoingOutgoingtransferstransfers
Inter Allies FC Ghana 64
Wadi Degla Egypt 52
Diambars FC Senegal 46
West African Football Academy FC Ghana 45
ASEC MIMOSAS Côte d'Ivoire 44
Dreams FC Ghana 43
ES Sahel Tunisia 43
TP Mazembe Congo DR 42
LM de Maputo Mozambique 41
RIGHT TO DREAM FC Ghana 37
Liberty Professional Football Club Ghana 36
Real Banjul FC Gambia 33
Al Ahly Egypt 31
AMF Morocco 30
Club Africain Tunisia 30
Super Stars Gambia 29
Berekum Chelsea FC Ghana 28
GEE LEC IFA Nigeria 28
El Zamalek Egypt 26
ASIF Academie Cameroon 25
Rainbow FC Cameroon 25
AS V Club Congo DR 25
Medeama SC Ghana 25
FC Kallon Sierra Leone 25
ES Tunis Tunisia 24
Charity Stars FC Ghana 23
AS Real Mali 23
Kotoko Ghana 22
P Sports Football Academy Nigeria 21
APEJES FA Cameroon 20
6. CAF – TOP 30 CLUBS BY NUMBER OF OUTGOING TRANSFERS
FIGURE 71: CAF – TOP 30 CLUBS BY NUMBER OF OUTGOING TRANSFERS
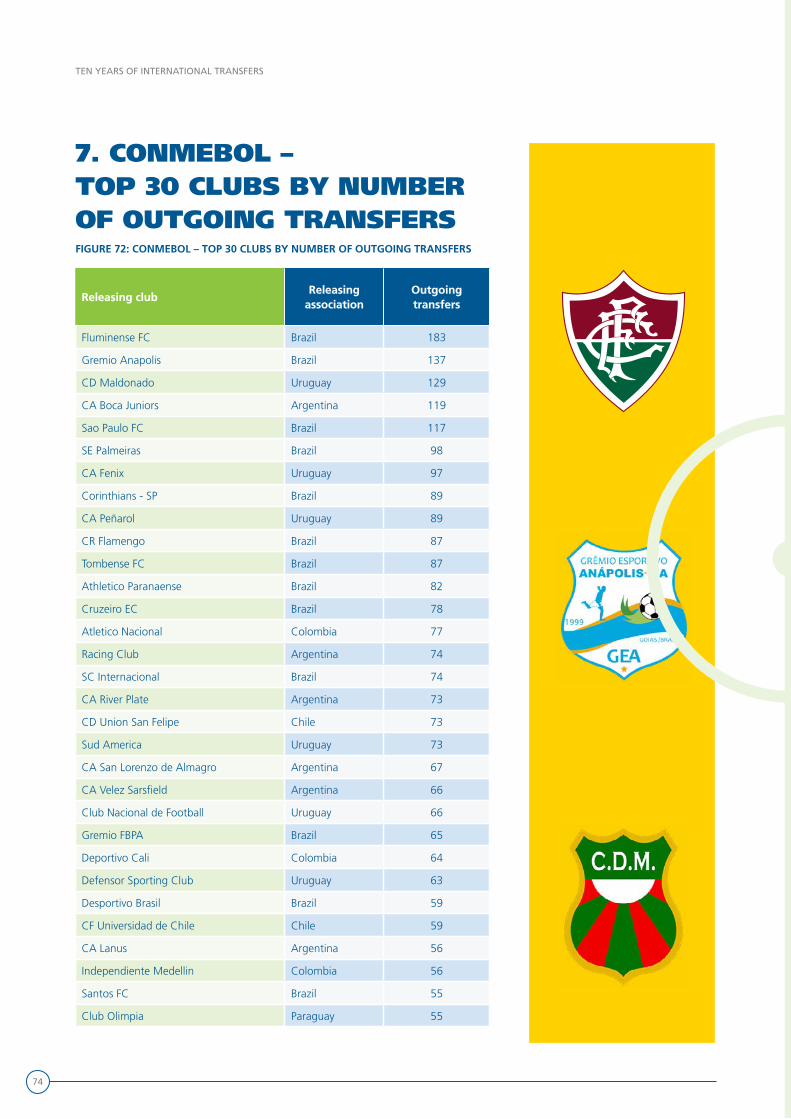
74
TEN YEARS OF INTERNATIONAL TRANSFERS
Releasing club Releasing club ReleasingReleasing
associationassociationOutgoingOutgoingtransferstransfers
Fluminense FC Brazil 183
Gremio Anapolis Brazil 137
CD Maldonado Uruguay 129
CA Boca Juniors Argentina 119
Sao Paulo FC Brazil 117
SE Palmeiras Brazil 98
CA Fenix Uruguay 97
Corinthians - SP Brazil 89
CA Peñarol Uruguay 89
CR Flamengo Brazil 87
Tombense FC Brazil 87
Athletico Paranaense Brazil 82
Cruzeiro EC Brazil 78
Atletico Nacional Colombia 77
Racing Club Argentina 74
SC Internacional Brazil 74
CA River Plate Argentina 73
CD Union San Felipe Chile 73
Sud America Uruguay 73
CA San Lorenzo de Almagro Argentina 67
CA Velez Sarsfield Argentina 66
Club Nacional de Football Uruguay 66
Gremio FBPA Brazil 65
Deportivo Cali Colombia 64
Defensor Sporting Club Uruguay 63
Desportivo Brasil Brazil 59
CF Universidad de Chile Chile 59
CA Lanus Argentina 56
Independiente Medellin Colombia 56
Santos FC Brazil 55
Club Olimpia Paraguay 55
7. CONMEBOL – TOP 30 CLUBS BY NUMBER OF OUTGOING TRANSFERSFIGURE 72: CONMEBOL – TOP 30 CLUBS BY NUMBER OF OUTGOING TRANSFERS
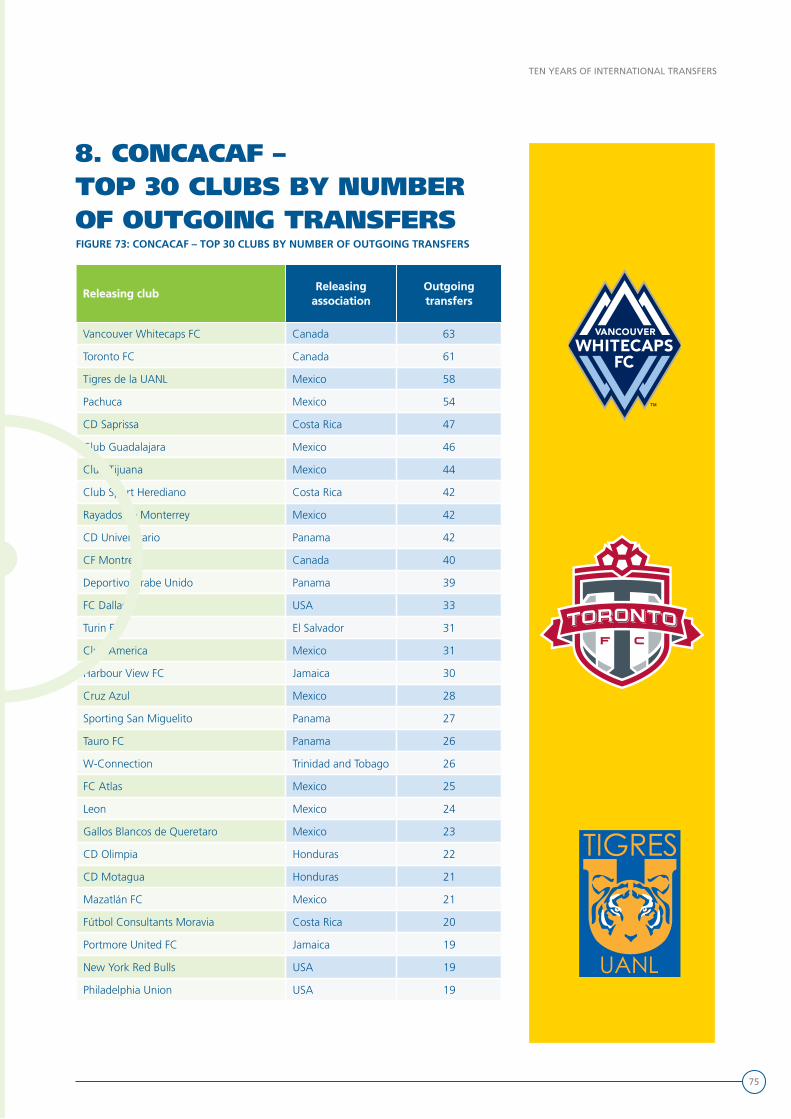
75
TEN YEARS OF INTERNATIONAL TRANSFERS
Releasing club Releasing club ReleasingReleasing
associationassociationOutgoingOutgoingtransferstransfers
Vancouver Whitecaps FC Canada 63
Toronto FC Canada 61
Tigres de la UANL Mexico 58
Pachuca Mexico 54
CD Saprissa Costa Rica 47
Club Guadalajara Mexico 46
Club Tijuana Mexico 44
Club Sport Herediano Costa Rica 42
Rayados de Monterrey Mexico 42
CD Universitario Panama 42
CF Montreal Canada 40
Deportivo Arabe Unido Panama 39
FC Dallas USA 33
Turin FC El Salvador 31
Club America Mexico 31
Harbour View FC Jamaica 30
Cruz Azul Mexico 28
Sporting San Miguelito Panama 27
Tauro FC Panama 26
W-Connection Trinidad and Tobago 26
FC Atlas Mexico 25
Leon Mexico 24
Gallos Blancos de Queretaro Mexico 23
CD Olimpia Honduras 22
CD Motagua Honduras 21
Mazatlán FC Mexico 21
Fútbol Consultants Moravia Costa Rica 20
Portmore United FC Jamaica 19
New York Red Bulls USA 19
Philadelphia Union USA 19
8. CONCACAF – TOP 30 CLUBS BY NUMBER OF OUTGOING TRANSFERSFIGURE 73: CONCACAF – TOP 30 CLUBS BY NUMBER OF OUTGOING TRANSFERS
76
TEN YEARS OF INTERNATIONAL TRANSFERS
OVERVIEW OF ALL
MEMBERASSOCIATIONS
WITH INTERNATIONAL
TRANSFERS
77
TEN YEARS OF INTERNATIONAL TRANSFERS
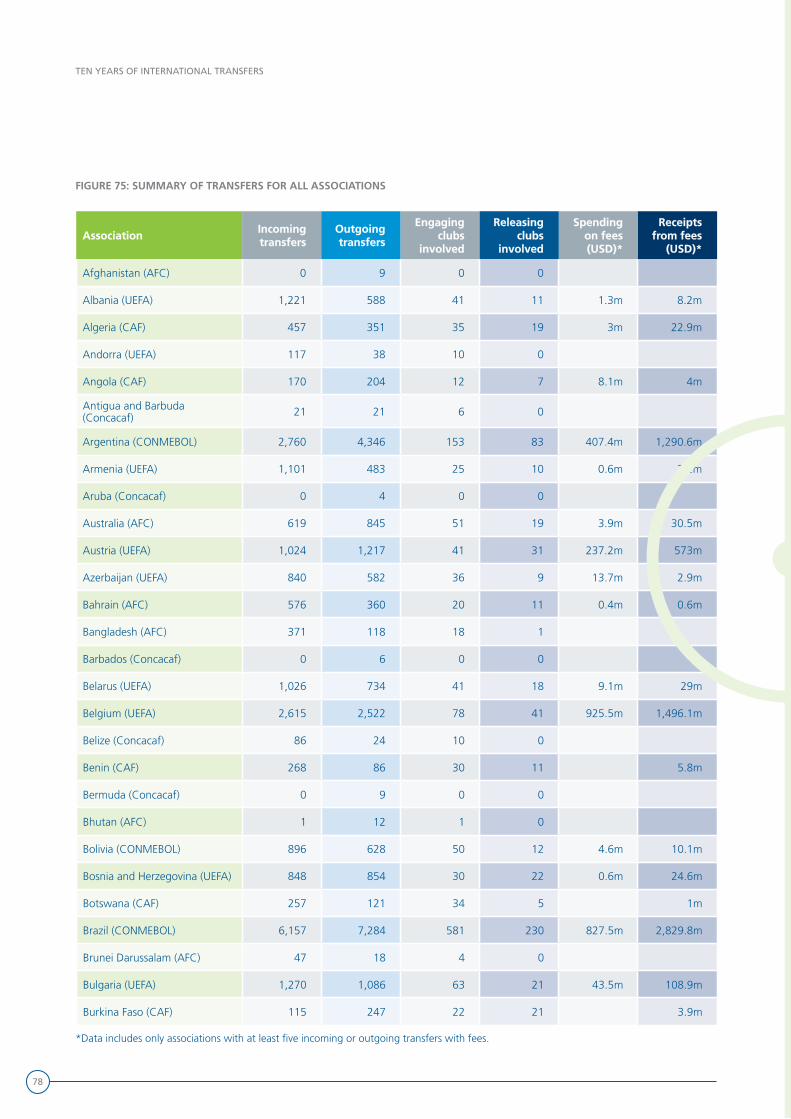
78
TEN YEARS OF INTERNATIONAL TRANSFERS
FIGURE 75: SUMMARY OF TRANSFERS FOR ALL ASSOCIATIONS
AssociationAssociation Incoming Incoming transferstransfers
Outgoing Outgoing transferstransfers
Engaging Engaging clubs clubs
involvedinvolved
Releasing Releasing clubs clubs
involvedinvolved
Spending Spending on fees on fees (USD)(USD)*
Receipts Receipts from fees from fees
(USD)(USD)*
Afghanistan (AFC) 0 9 0 0
Albania (UEFA) 1,221 588 41 11 1.3m 8.2m
Algeria (CAF) 457 351 35 19 3m 22.9m
Andorra (UEFA) 117 38 10 0
Angola (CAF) 170 204 12 7 8.1m 4m
Antigua and Barbuda (Concacaf) 21 21 6 0
Argentina (CONMEBOL) 2,760 4,346 153 83 407.4m 1,290.6m
Armenia (UEFA) 1,101 483 25 10 0.6m 2.2m
Aruba (Concacaf) 0 4 0 0
Australia (AFC) 619 845 51 19 3.9m 30.5m
Austria (UEFA) 1,024 1,217 41 31 237.2m 573m
Azerbaijan (UEFA) 840 582 36 9 13.7m 2.9m
Bahrain (AFC) 576 360 20 11 0.4m 0.6m
Bangladesh (AFC) 371 118 18 1
Barbados (Concacaf) 0 6 0 0
Belarus (UEFA) 1,026 734 41 18 9.1m 29m
Belgium (UEFA) 2,615 2,522 78 41 925.5m 1,496.1m
Belize (Concacaf) 86 24 10 0
Benin (CAF) 268 86 30 11 5.8m
Bermuda (Concacaf) 0 9 0 0
Bhutan (AFC) 1 12 1 0
Bolivia (CONMEBOL) 896 628 50 12 4.6m 10.1m
Bosnia and Herzegovina (UEFA) 848 854 30 22 0.6m 24.6m
Botswana (CAF) 257 121 34 5 1m
Brazil (CONMEBOL) 6,157 7,284 581 230 827.5m 2,829.8m
Brunei Darussalam (AFC) 47 18 4 0
Bulgaria (UEFA) 1,270 1,086 63 21 43.5m 108.9m
Burkina Faso (CAF) 115 247 22 21 3.9m
*Data includes only associations with at least five incoming or outgoing transfers with fees.
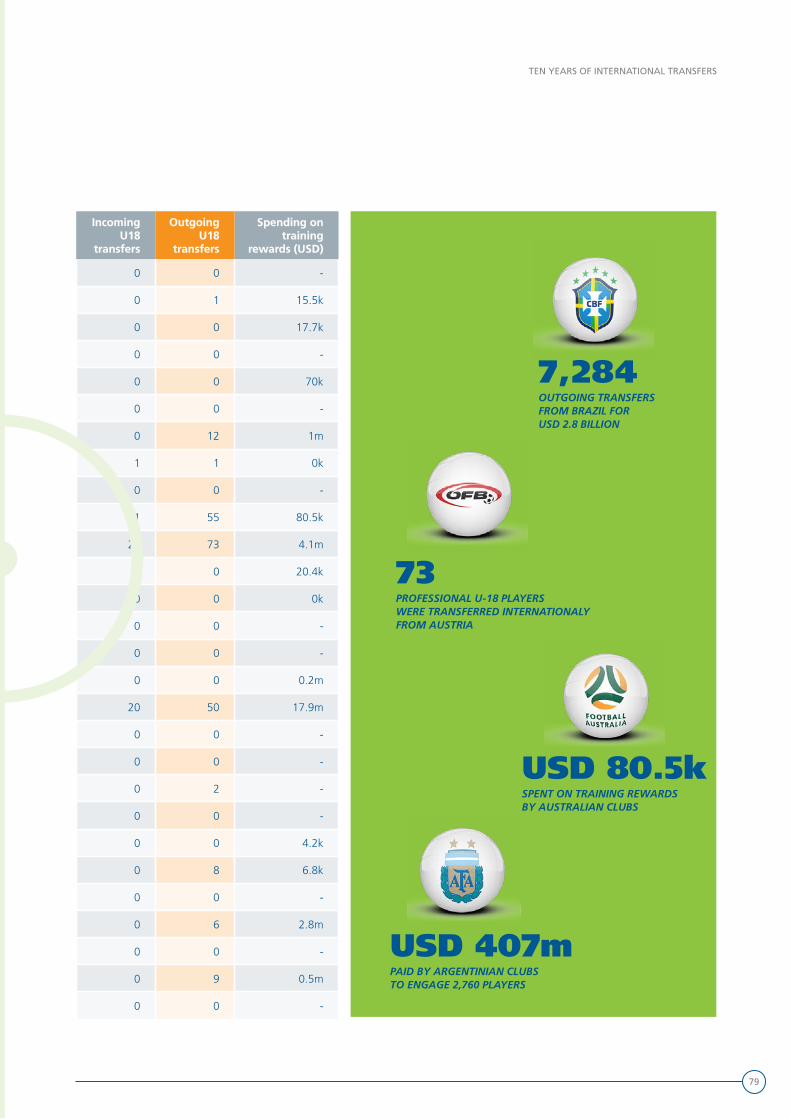
79
TEN YEARS OF INTERNATIONAL TRANSFERS
Incoming Incoming U18 U18
transferstransfers
Outgoing Outgoing U18 U18
transferstransfers
Spending on Spending on training training
rewards (USD)rewards (USD)
0 0 -
0 1 15.5k
0 0 17.7k
0 0 -
0 0 70k
0 0 -
0 12 1m
1 1 0k
0 0 -
1 55 80.5k
28 73 4.1m
0 0 20.4k
0 0 0k
0 0 -
0 0 -
0 0 0.2m
20 50 17.9m
0 0 -
0 0 -
0 2 -
0 0 -
0 0 4.2k
0 8 6.8k
0 0 -
0 6 2.8m
0 0 -
0 9 0.5m
0 0 -
USD 80.5k SPENT ON TRAINING REWARDS BY AUSTRALIAN CLUBS
7,284 OUTGOING TRANSFERSFROM BRAZIL FOR USD 2.8 BILLION
73 PROFESSIONAL U-18 PLAYERS WERE TRANSFERRED INTERNATIONALY FROM AUSTRIA
USD 407m PAID BY ARGENTINIAN CLUBSTO ENGAGE 2,760 PLAYERS
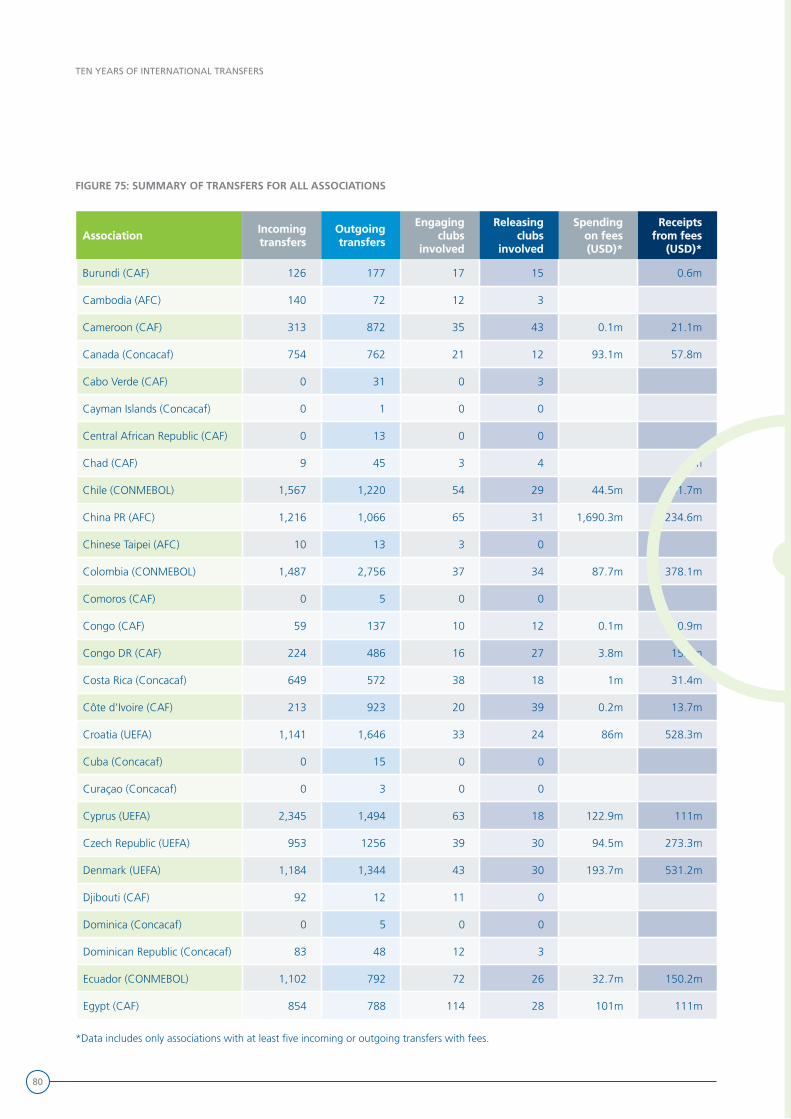
80
TEN YEARS OF INTERNATIONAL TRANSFERS
FIGURE 75: SUMMARY OF TRANSFERS FOR ALL ASSOCIATIONS
AssociationAssociation Incoming Incoming transferstransfers
Outgoing Outgoing transferstransfers
Engaging Engaging clubs clubs
involvedinvolved
Releasing Releasing clubs clubs
involvedinvolved
Spending Spending on fees on fees (USD)(USD)*
Receipts Receipts from fees from fees
(USD)(USD)*
Burundi (CAF) 126 177 17 15 0.6m
Cambodia (AFC) 140 72 12 3
Cameroon (CAF) 313 872 35 43 0.1m 21.1m
Canada (Concacaf) 754 762 21 12 93.1m 57.8m
Cabo Verde (CAF) 0 31 0 3
Cayman Islands (Concacaf) 0 1 0 0
Central African Republic (CAF) 0 13 0 0
Chad (CAF) 9 45 3 4 0m
Chile (CONMEBOL) 1,567 1,220 54 29 44.5m 251.7m
China PR (AFC) 1,216 1,066 65 31 1,690.3m 234.6m
Chinese Taipei (AFC) 10 13 3 0
Colombia (CONMEBOL) 1,487 2,756 37 34 87.7m 378.1m
Comoros (CAF) 0 5 0 0
Congo (CAF) 59 137 10 12 0.1m 0.9m
Congo DR (CAF) 224 486 16 27 3.8m 15.2m
Costa Rica (Concacaf) 649 572 38 18 1m 31.4m
Côte d'Ivoire (CAF) 213 923 20 39 0.2m 13.7m
Croatia (UEFA) 1,141 1,646 33 24 86m 528.3m
Cuba (Concacaf) 0 15 0 0
Curaçao (Concacaf) 0 3 0 0
Cyprus (UEFA) 2,345 1,494 63 18 122.9m 111m
Czech Republic (UEFA) 953 1256 39 30 94.5m 273.3m
Denmark (UEFA) 1,184 1,344 43 30 193.7m 531.2m
Djibouti (CAF) 92 12 11 0
Dominica (Concacaf) 0 5 0 0
Dominican Republic (Concacaf) 83 48 12 3
Ecuador (CONMEBOL) 1,102 792 72 26 32.7m 150.2m
Egypt (CAF) 854 788 114 28 101m 111m
*Data includes only associations with at least five incoming or outgoing transfers with fees.
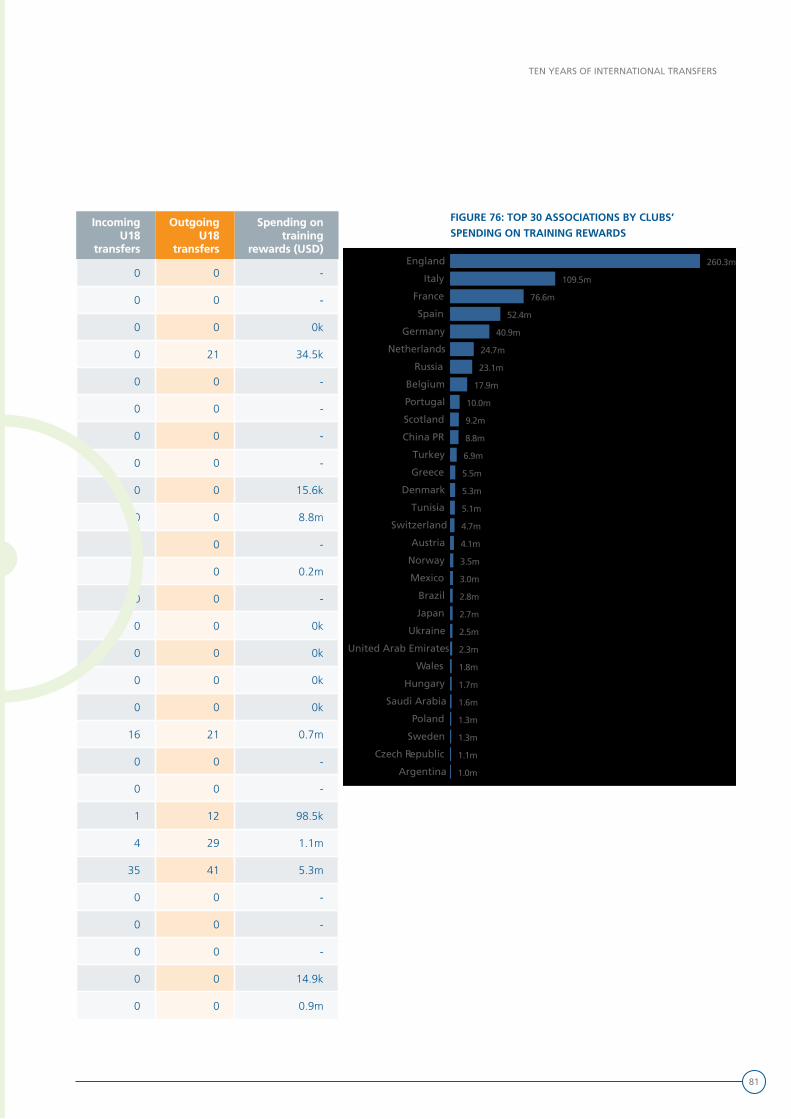
81
TEN YEARS OF INTERNATIONAL TRANSFERS
Incoming Incoming U18 U18
transferstransfers
Outgoing Outgoing U18 U18
transferstransfers
Spending on Spending on training training
rewards (USD)rewards (USD)
0 0 -
0 0 -
0 0 0k
0 21 34.5k
0 0 -
0 0 -
0 0 -
0 0 -
0 0 15.6k
0 0 8.8m
0 0 -
0 0 0.2m
0 0 -
0 0 0k
0 0 0k
0 0 0k
0 0 0k
16 21 0.7m
0 0 -
0 0 -
1 12 98.5k
4 29 1.1m
35 41 5.3m
0 0 -
0 0 -
0 0 -
0 0 14.9k
0 0 0.9m
FIGURE 76: TOP 30 ASSOCIATIONS BY CLUBS’ SPENDING ON TRAINING REWARDSTop 30 associations by total spending on training rewards (USD) 2011 - 2020
England
Italy
France
Spain
Germany
Netherlands
Russia
Belgium
Portugal
Scotland
China PR
Turkey
Greece
Denmark
Tunisia
Switzerland
Austria
Norway
Mexico
Brazil
Japan
Ukraine
United Arab Emirates
Wales
Hungary
Saudi Arabia
Poland
Sweden
Czech Republic
Argentina
260.3m
109.5m
76.6m
52.4m
40.9m
24.7m
23.1m
17.9m
10.0m
9.2m
8.8m
6.9m
5.5m
5.3m
5.1m
4.7m
4.1m
3.5m
3.0m
2.8m
2.7m
2.5m
2.3m
1.8m
1.7m
1.6m
1.3m
1.3m
1.1m
1.0m
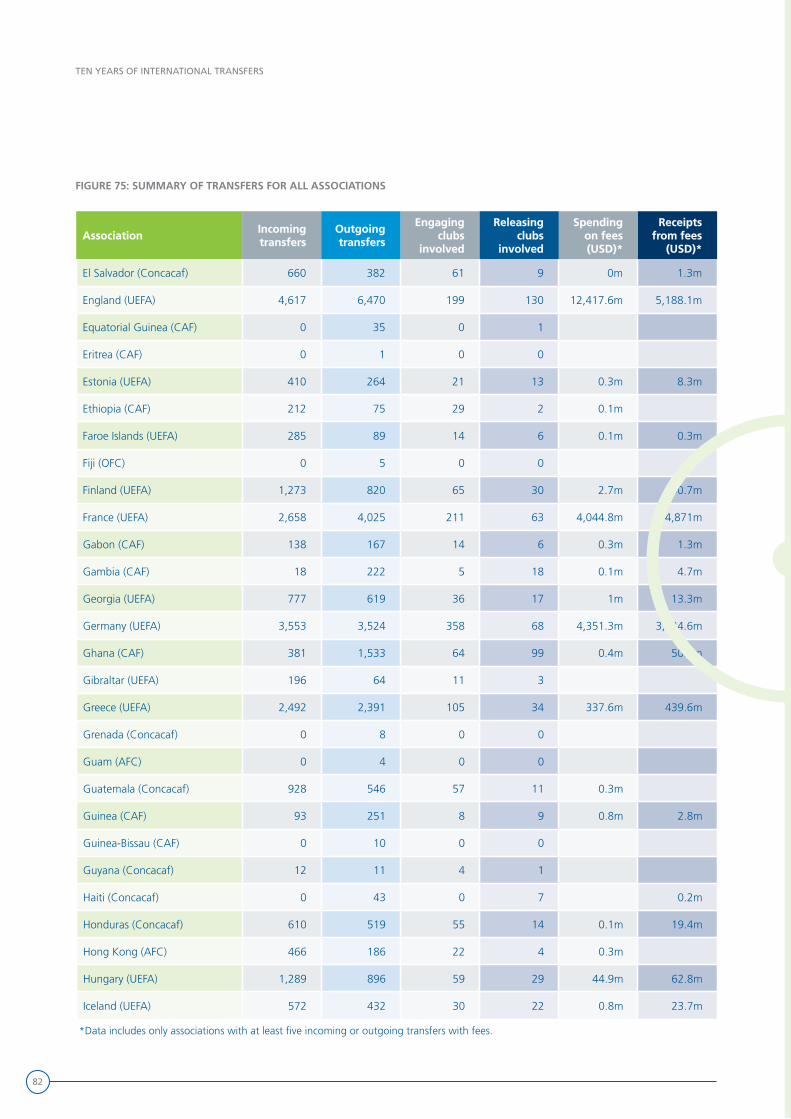
82
TEN YEARS OF INTERNATIONAL TRANSFERS
FIGURE 75: SUMMARY OF TRANSFERS FOR ALL ASSOCIATIONS
AssociationAssociation Incoming Incoming transferstransfers
Outgoing Outgoing transferstransfers
Engaging Engaging clubs clubs
involvedinvolved
Releasing Releasing clubs clubs
involvedinvolved
Spending Spending on fees on fees (USD)(USD)*
Receipts Receipts from fees from fees
(USD)(USD)*
El Salvador (Concacaf) 660 382 61 9 0m 1.3m
England (UEFA) 4,617 6,470 199 130 12,417.6m 5,188.1m
Equatorial Guinea (CAF) 0 35 0 1
Eritrea (CAF) 0 1 0 0
Estonia (UEFA) 410 264 21 13 0.3m 8.3m
Ethiopia (CAF) 212 75 29 2 0.1m
Faroe Islands (UEFA) 285 89 14 6 0.1m 0.3m
Fiji (OFC) 0 5 0 0
Finland (UEFA) 1,273 820 65 30 2.7m 30.7m
France (UEFA) 2,658 4,025 211 63 4,044.8m 4,871m
Gabon (CAF) 138 167 14 6 0.3m 1.3m
Gambia (CAF) 18 222 5 18 0.1m 4.7m
Georgia (UEFA) 777 619 36 17 1m 13.3m
Germany (UEFA) 3,553 3,524 358 68 4,351.3m 3,424.6m
Ghana (CAF) 381 1,533 64 99 0.4m 50.1m
Gibraltar (UEFA) 196 64 11 3
Greece (UEFA) 2,492 2,391 105 34 337.6m 439.6m
Grenada (Concacaf) 0 8 0 0
Guam (AFC) 0 4 0 0
Guatemala (Concacaf) 928 546 57 11 0.3m
Guinea (CAF) 93 251 8 9 0.8m 2.8m
Guinea-Bissau (CAF) 0 10 0 0
Guyana (Concacaf) 12 11 4 1
Haiti (Concacaf) 0 43 0 7 0.2m
Honduras (Concacaf) 610 519 55 14 0.1m 19.4m
Hong Kong (AFC) 466 186 22 4 0.3m
Hungary (UEFA) 1,289 896 59 29 44.9m 62.8m
Iceland (UEFA) 572 432 30 22 0.8m 23.7m
*Data includes only associations with at least five incoming or outgoing transfers with fees.

83
TEN YEARS OF INTERNATIONAL TRANSFERS
Incoming Incoming U18 U18
transferstransfers
Outgoing Outgoing U18 U18
transferstransfers
Spending on Spending on training training
rewards (USD)rewards (USD)
2 0 0k
824 113 260.3m
0 0 -
0 0 -
1 8 6.8k
0 0 0k
0 5 0k
0 0 -
2 48 44.6k
54 118 76.6m
0 0 0k
0 0 0k
0 3 0k
219 28 40.9m
0 2 9.7k
0 0 -
4 19 5.5m
0 0 -
0 0 -
0 0 0k
0 1 0k
0 0 -
0 0 -
0 0 -
0 0 0k
0 0 0k
0 35 1.7m
2 54 4.1k
824 INCOMING INTERNATIONALTRANSFERS OF PROFESSIONALU-18 PLAYERS WERE REGISTERED BY ENGLISH CLUBS
USD 12.4bn SPENT BY ENGLISH CLUBS ON ENGAGING INTERNATIONAL TRANSFERS
USD 3,400 AVERAGE TRANSFER FEE FOR THE382 PLAYERS TRANSFERRED FROM EL SALVADOR
USD 50m RECEIVED BY GHANAIAN CLUBS FOR 1,533 OUTGOING TRANSFERS
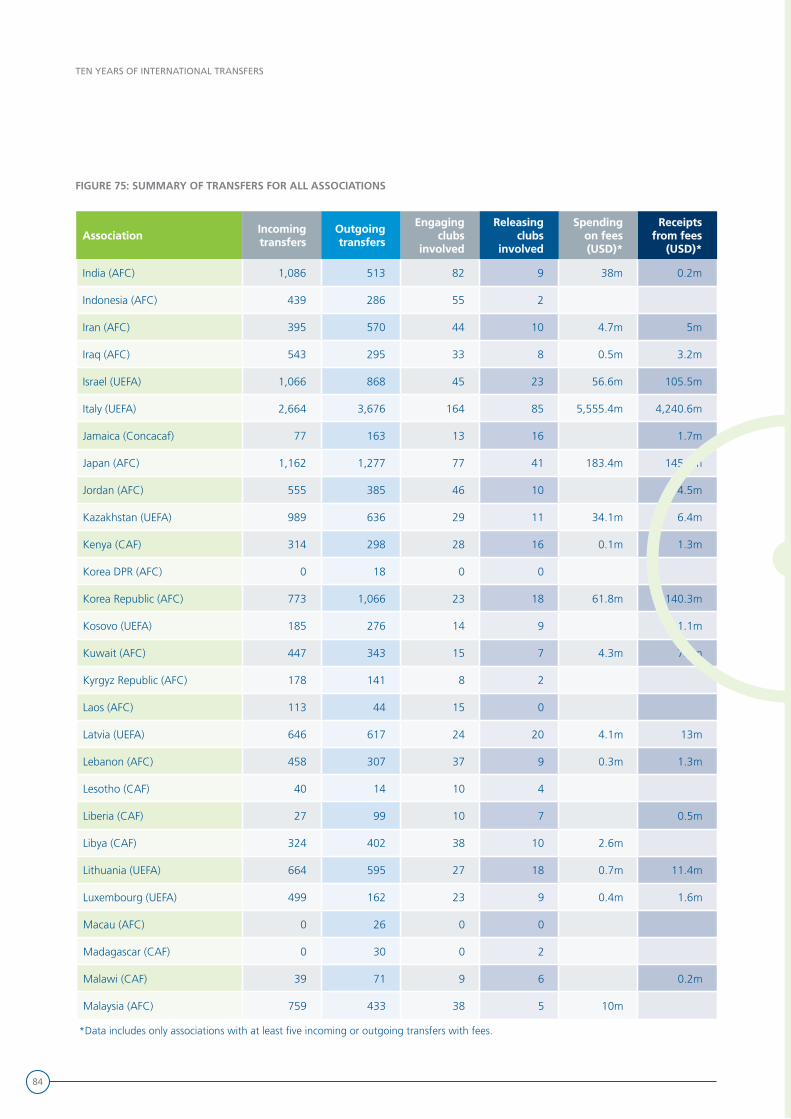
84
TEN YEARS OF INTERNATIONAL TRANSFERS
FIGURE 75: SUMMARY OF TRANSFERS FOR ALL ASSOCIATIONS
AssociationAssociation Incoming Incoming transferstransfers
Outgoing Outgoing transferstransfers
Engaging Engaging clubs clubs
involvedinvolved
Releasing Releasing clubs clubs
involvedinvolved
Spending Spending on fees on fees (USD)(USD)*
Receipts Receipts from fees from fees
(USD)(USD)*
India (AFC) 1,086 513 82 9 38m 0.2m
Indonesia (AFC) 439 286 55 2
Iran (AFC) 395 570 44 10 4.7m 5m
Iraq (AFC) 543 295 33 8 0.5m 3.2m
Israel (UEFA) 1,066 868 45 23 56.6m 105.5m
Italy (UEFA) 2,664 3,676 164 85 5,555.4m 4,240.6m
Jamaica (Concacaf) 77 163 13 16 1.7m
Japan (AFC) 1,162 1,277 77 41 183.4m 145.7m
Jordan (AFC) 555 385 46 10 4.5m
Kazakhstan (UEFA) 989 636 29 11 34.1m 6.4m
Kenya (CAF) 314 298 28 16 0.1m 1.3m
Korea DPR (AFC) 0 18 0 0
Korea Republic (AFC) 773 1,066 23 18 61.8m 140.3m
Kosovo (UEFA) 185 276 14 9 1.1m
Kuwait (AFC) 447 343 15 7 4.3m 7.6m
Kyrgyz Republic (AFC) 178 141 8 2
Laos (AFC) 113 44 15 0
Latvia (UEFA) 646 617 24 20 4.1m 13m
Lebanon (AFC) 458 307 37 9 0.3m 1.3m
Lesotho (CAF) 40 14 10 4
Liberia (CAF) 27 99 10 7 0.5m
Libya (CAF) 324 402 38 10 2.6m
Lithuania (UEFA) 664 595 27 18 0.7m 11.4m
Luxembourg (UEFA) 499 162 23 9 0.4m 1.6m
Macau (AFC) 0 26 0 0
Madagascar (CAF) 0 30 0 2
Malawi (CAF) 39 71 9 6 0.2m
Malaysia (AFC) 759 433 38 5 10m
*Data includes only associations with at least five incoming or outgoing transfers with fees.
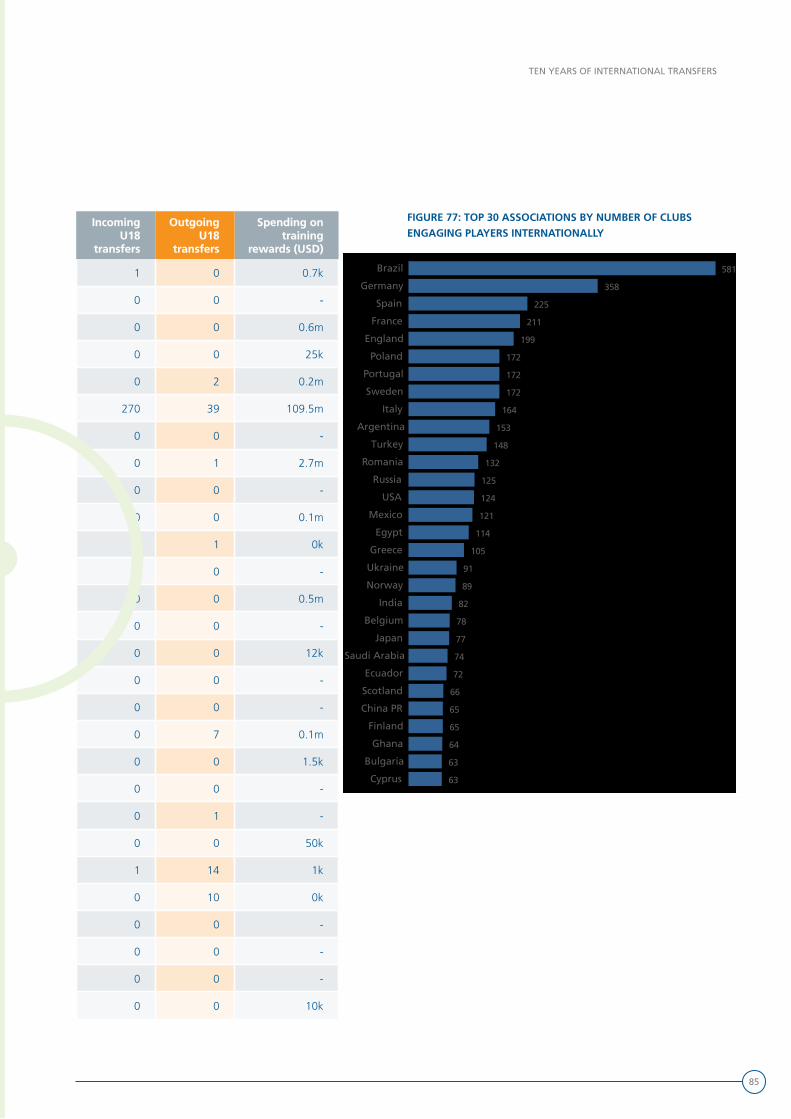
85
TEN YEARS OF INTERNATIONAL TRANSFERS
Incoming Incoming U18 U18
transferstransfers
Outgoing Outgoing U18 U18
transferstransfers
Spending on Spending on training training
rewards (USD)rewards (USD)
1 0 0.7k
0 0 -
0 0 0.6m
0 0 25k
0 2 0.2m
270 39 109.5m
0 0 -
0 1 2.7m
0 0 -
0 0 0.1m
0 1 0k
0 0 -
0 0 0.5m
0 0 -
0 0 12k
0 0 -
0 0 -
0 7 0.1m
0 0 1.5k
0 0 -
0 1 -
0 0 50k
1 14 1k
0 10 0k
0 0 -
0 0 -
0 0 -
0 0 10k
FIGURE 77: TOP 30 ASSOCIATIONS BY NUMBER OF CLUBS ENGAGING PLAYERS INTERNATIONALLY Top 30 associations by the number of clubs engaging players internationally 2011 - 2020
Brazil
Germany
Spain
France
England
Poland
Portugal
Sweden
Italy
Argentina
Turkey
Romania
Russia
USA
Mexico
Egypt
Greece
Ukraine
Norway
India
Belgium
Japan
Saudi Arabia
Ecuador
Scotland
China PR
Finland
Ghana
Bulgaria
Cyprus
581
358
225
211
199
172
172
172
164
153
148
132
125
124
121
114
105
91
89
82
78
77
74
72
66
65
65
64
63
63

86
TEN YEARS OF INTERNATIONAL TRANSFERS
FIGURE 75: SUMMARY OF TRANSFERS FOR ALL ASSOCIATIONS
AssociationAssociation Incoming Incoming transferstransfers
Outgoing Outgoing transferstransfers
Engaging Engaging clubs clubs
involvedinvolved
Releasing Releasing clubs clubs
involvedinvolved
Spending Spending on fees on fees (USD)(USD)*
Receipts Receipts from fees from fees
(USD)(USD)*
Maldives (AFC) 207 104 17 1
Mali (CAF) 5 373 3 22 35.5m
Malta (UEFA) 1,240 542 54 16 0.5m 2.6m
Mauritania (CAF) 34 68 5 2
Mauritius (CAF) 191 19 23 3
Mexico (Concacaf) 2,052 1,778 121 35 682.9m 557.4m
Moldova (UEFA) 903 694 30 10 7m 13.6m
Mongolia (AFC) 73 36 12 0
Montenegro (UEFA) 518 477 23 11 21.5m
Morocco (CAF) 846 654 61 19 9.3m 51.7m
Mozambique (CAF) 250 163 29 10 0.2m 3.1m
Myanmar (AFC) 274 132 23 3
Namibia (CAF) 111 91 17 11 0.8m
Nepal (AFC) 186 38 20 0
Netherlands (UEFA) 1,836 2,095 57 36 707.9m 2,003m
New Caledonia (OFC) 0 2 0 0
New Zealand (OFC) 85 208 1 2 1.7m
Nicaragua (Concacaf) 386 210 18 2
Niger (CAF) 84 86 13 6 0.2m
Nigeria (CAF) 291 1,903 55 127 0.1m 35.1m
Northern Ireland (UEFA) 306 241 19 12 0.2m 5.2m
Norway (UEFA) 1,550 1,221 89 39 75.8m 284.1m
Oman (AFC) 1,127 572 45 11 0.2m 1m
Pakistan (AFC) 0 10 0 0
Palestine (AFC) 93 64 16 4
Panama (Concacaf) 684 500 29 13 11.6m
Paraguay (CONMEBOL) 1,062 1,328 41 32 42.4m 163.9m
Peru (CONMEBOL) 913 582 55 15 10.6m 28.3m
*Data includes only associations with at least five incoming or outgoing transfers with fees.
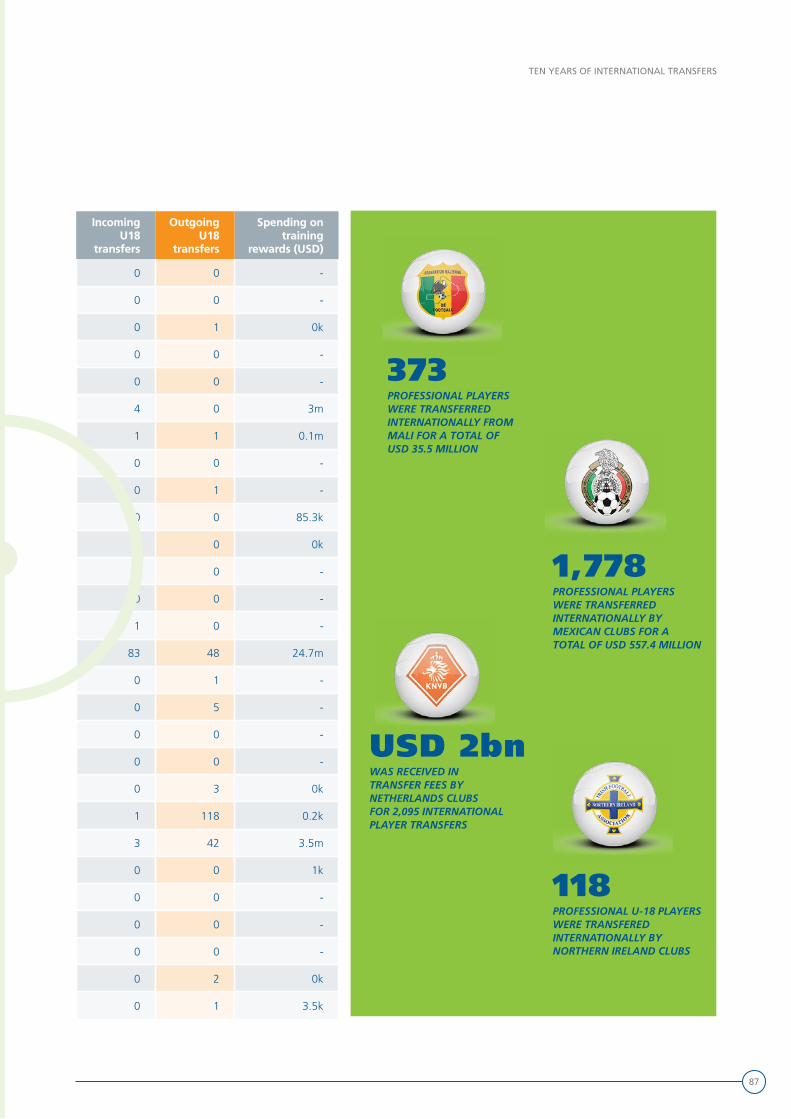
87
TEN YEARS OF INTERNATIONAL TRANSFERS
Incoming Incoming U18 U18
transferstransfers
Outgoing Outgoing U18 U18
transferstransfers
Spending on Spending on training training
rewards (USD)rewards (USD)
0 0 -
0 0 -
0 1 0k
0 0 -
0 0 -
4 0 3m
1 1 0.1m
0 0 -
0 1 -
0 0 85.3k
0 0 0k
0 0 -
0 0 -
1 0 -
83 48 24.7m
0 1 -
0 5 -
0 0 -
0 0 -
0 3 0k
1 118 0.2k
3 42 3.5m
0 0 1k
0 0 -
0 0 -
0 0 -
0 2 0k
0 1 3.5k
373 PROFESSIONAL PLAYERSWERE TRANSFERRED INTERNATIONALLY FROM MALI FOR A TOTAL OF USD 35.5 MILLION
USD 2bn WAS RECEIVED IN TRANSFER FEES BY NETHERLANDS CLUBS FOR 2,095 INTERNATIONAL PLAYER TRANSFERS
1,778 PROFESSIONAL PLAYERSWERE TRANSFERRED INTERNATIONALLY BY MEXICAN CLUBS FOR A TOTAL OF USD 557.4 MILLION
118 PROFESSIONAL U-18 PLAYERSWERE TRANSFERED INTERNATIONALLY BY NORTHERN IRELAND CLUBS
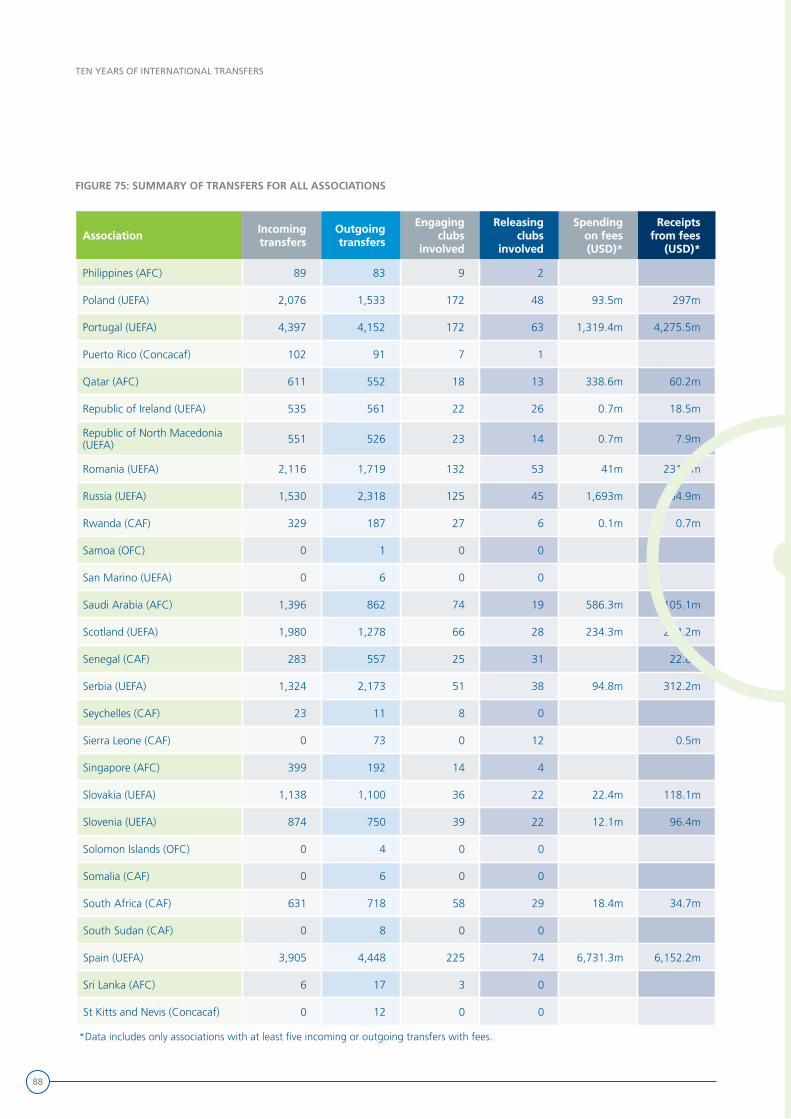
88
TEN YEARS OF INTERNATIONAL TRANSFERS
FIGURE 75: SUMMARY OF TRANSFERS FOR ALL ASSOCIATIONS
AssociationAssociation Incoming Incoming transferstransfers
Outgoing Outgoing transferstransfers
Engaging Engaging clubs clubs
involvedinvolved
Releasing Releasing clubs clubs
involvedinvolved
Spending Spending on fees on fees (USD)(USD)*
Receipts Receipts from fees from fees
(USD)(USD)*
Philippines (AFC) 89 83 9 2
Poland (UEFA) 2,076 1,533 172 48 93.5m 297m
Portugal (UEFA) 4,397 4,152 172 63 1,319.4m 4,275.5m
Puerto Rico (Concacaf) 102 91 7 1
Qatar (AFC) 611 552 18 13 338.6m 60.2m
Republic of Ireland (UEFA) 535 561 22 26 0.7m 18.5m
Republic of North Macedonia (UEFA) 551 526 23 14 0.7m 7.9m
Romania (UEFA) 2,116 1,719 132 53 41m 231.9m
Russia (UEFA) 1,530 2,318 125 45 1,693m 854.9m
Rwanda (CAF) 329 187 27 6 0.1m 0.7m
Samoa (OFC) 0 1 0 0
San Marino (UEFA) 0 6 0 0
Saudi Arabia (AFC) 1,396 862 74 19 586.3m 105.1m
Scotland (UEFA) 1,980 1,278 66 28 234.3m 284.2m
Senegal (CAF) 283 557 25 31 22.8m
Serbia (UEFA) 1,324 2,173 51 38 94.8m 312.2m
Seychelles (CAF) 23 11 8 0
Sierra Leone (CAF) 0 73 0 12 0.5m
Singapore (AFC) 399 192 14 4
Slovakia (UEFA) 1,138 1,100 36 22 22.4m 118.1m
Slovenia (UEFA) 874 750 39 22 12.1m 96.4m
Solomon Islands (OFC) 0 4 0 0
Somalia (CAF) 0 6 0 0
South Africa (CAF) 631 718 58 29 18.4m 34.7m
South Sudan (CAF) 0 8 0 0
Spain (UEFA) 3,905 4,448 225 74 6,731.3m 6,152.2m
Sri Lanka (AFC) 6 17 3 0
St Kitts and Nevis (Concacaf) 0 12 0 0
*Data includes only associations with at least five incoming or outgoing transfers with fees.

89
TEN YEARS OF INTERNATIONAL TRANSFERS
Incoming Incoming U18 U18
transferstransfers
Outgoing Outgoing U18 U18
transferstransfers
Spending on Spending on training training
rewards (USD)rewards (USD)
0 0 -
6 59 1.3m
36 55 10m
0 0 -
0 0 0.4m
2 188 1.8k
0 2 72.5k
5 35 0.3m
1 1 23.1m
1 0 20k
0 0 -
0 0 -
0 0 1.6m
73 37 9.2m
1 0 -
0 5 0.6m
0 0 -
0 0 -
0 1 -
2 28 0.2m
5 34 0.4m
0 0 -
0 0 -
0 1 0.2m
0 0 -
29 81 52.4m
0 0 -
0 0 -
Top 30 associations by the number of clubs releasing players internationally 2011 - 2020
Brazil
England
Nigeria
Ghana
Italy
Argentina
Spain
Germany
Sweden
France
Portugal
Romania
USA
Poland
Russia
Cameroon
Belgium
Japan
Côte d'Ivoire
Norway
Turkey
Serbia
Netherlands
Mexico
Colombia
Greece
Paraguay
Uruguay
Austria
China PR
Senegal
230
130
127
99
85
83
74
68
65
63
63
53
52
48
45
43
41
41
39
39
39
38
36
35
34
34
32
32
31
31
31
FIGURE 78: TOP 30 ASSOCIATIONS BY NUMBER OF CLUBS RELEASING PLAYERS INTERNATIONALLY
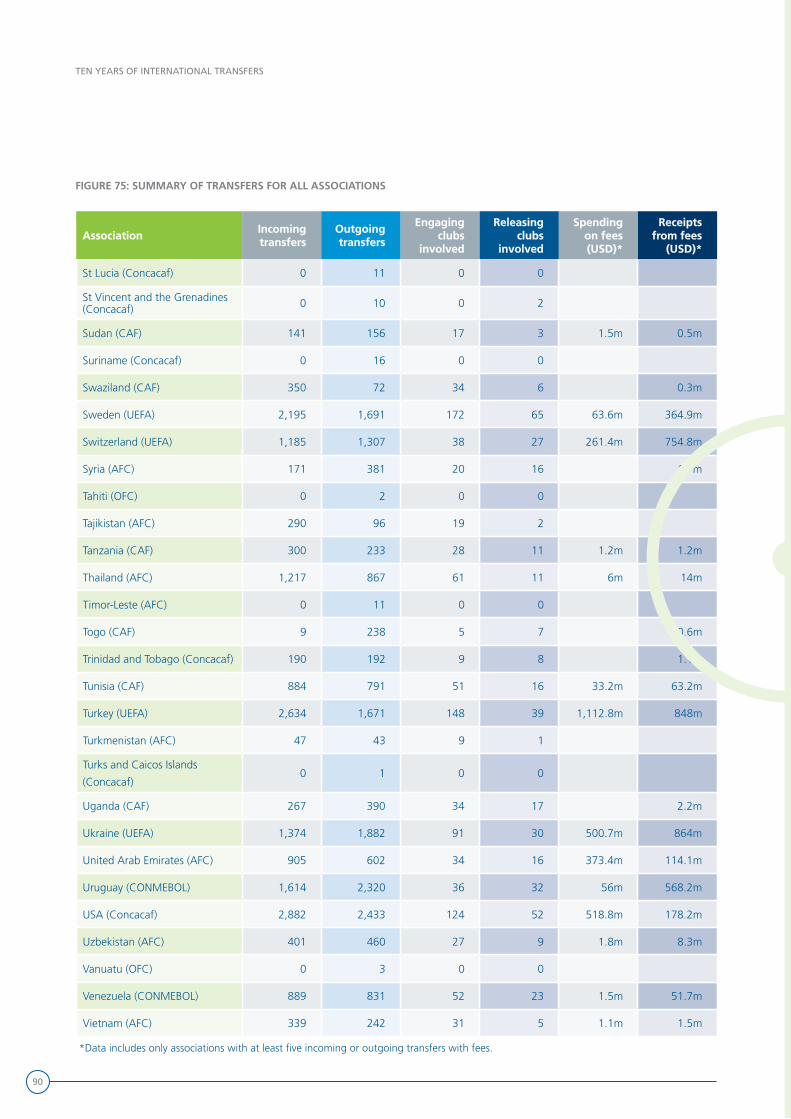
90
TEN YEARS OF INTERNATIONAL TRANSFERS
FIGURE 75: SUMMARY OF TRANSFERS FOR ALL ASSOCIATIONS
AssociationAssociation Incoming Incoming transferstransfers
Outgoing Outgoing transferstransfers
Engaging Engaging clubs clubs
involvedinvolved
Releasing Releasing clubs clubs
involvedinvolved
Spending Spending on fees on fees (USD)(USD)*
Receipts Receipts from fees from fees
(USD)(USD)*
St Lucia (Concacaf) 0 11 0 0
St Vincent and the Grenadines (Concacaf) 0 10 0 2
Sudan (CAF) 141 156 17 3 1.5m 0.5m
Suriname (Concacaf) 0 16 0 0
Swaziland (CAF) 350 72 34 6 0.3m
Sweden (UEFA) 2,195 1,691 172 65 63.6m 364.9m
Switzerland (UEFA) 1,185 1,307 38 27 261.4m 754.8m
Syria (AFC) 171 381 20 16 1.7m
Tahiti (OFC) 0 2 0 0
Tajikistan (AFC) 290 96 19 2
Tanzania (CAF) 300 233 28 11 1.2m 1.2m
Thailand (AFC) 1,217 867 61 11 6m 14m
Timor-Leste (AFC) 0 11 0 0
Togo (CAF) 9 238 5 7 0.6m
Trinidad and Tobago (Concacaf) 190 192 9 8 1.1m
Tunisia (CAF) 884 791 51 16 33.2m 63.2m
Turkey (UEFA) 2,634 1,671 148 39 1,112.8m 848m
Turkmenistan (AFC) 47 43 9 1
Turks and Caicos Islands
(Concacaf)0 1 0 0
Uganda (CAF) 267 390 34 17 2.2m
Ukraine (UEFA) 1,374 1,882 91 30 500.7m 864m
United Arab Emirates (AFC) 905 602 34 16 373.4m 114.1m
Uruguay (CONMEBOL) 1,614 2,320 36 32 56m 568.2m
USA (Concacaf) 2,882 2,433 124 52 518.8m 178.2m
Uzbekistan (AFC) 401 460 27 9 1.8m 8.3m
Vanuatu (OFC) 0 3 0 0
Venezuela (CONMEBOL) 889 831 52 23 1.5m 51.7m
Vietnam (AFC) 339 242 31 5 1.1m 1.5m
*Data includes only associations with at least five incoming or outgoing transfers with fees.
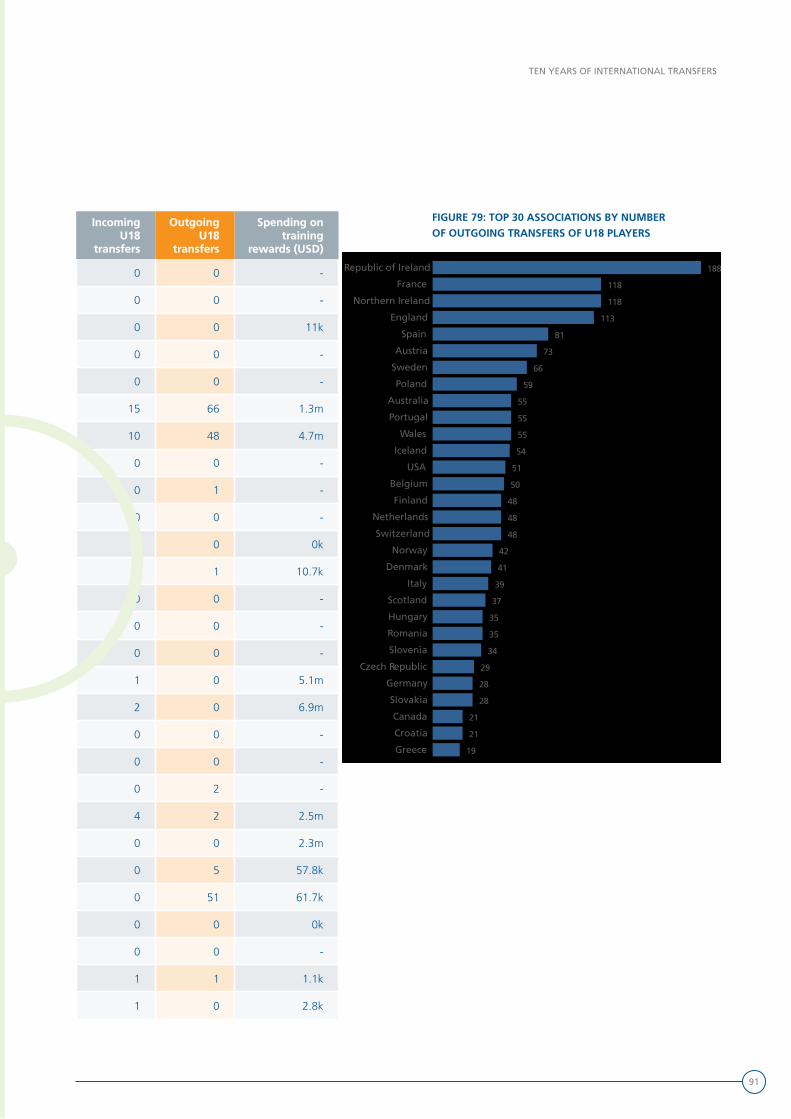
91
TEN YEARS OF INTERNATIONAL TRANSFERS
Incoming Incoming U18 U18
transferstransfers
Outgoing Outgoing U18 U18
transferstransfers
Spending on Spending on training training
rewards (USD)rewards (USD)
0 0 -
0 0 -
0 0 11k
0 0 -
0 0 -
15 66 1.3m
10 48 4.7m
0 0 -
0 1 -
0 0 -
0 0 0k
0 1 10.7k
0 0 -
0 0 -
0 0 -
1 0 5.1m
2 0 6.9m
0 0 -
0 0 -
0 2 -
4 2 2.5m
0 0 2.3m
0 5 57.8k
0 51 61.7k
0 0 0k
0 0 -
1 1 1.1k
1 0 2.8k
FIGURE 79: TOP 30 ASSOCIATIONS BY NUMBER OF OUTGOING TRANSFERS OF U18 PLAYERS
Top 30 associations by the number of outgoing professional transfers of players under18 years old 2011 - 2020
Republic of Ireland
France
Northern Ireland
England
Spain
Austria
Sweden
Poland
Australia
Portugal
Wales
Iceland
USA
Belgium
Finland
Netherlands
Switzerland
Norway
Denmark
Italy
Scotland
Hungary
Romania
Slovenia
Czech Republic
Germany
Slovakia
Canada
Croatia
Greece
188
118
118
113
81
73
66
59
55
55
55
54
51
50
48
48
48
42
41
39
37
35
35
34
29
28
28
21
21
19
ties broken at random!
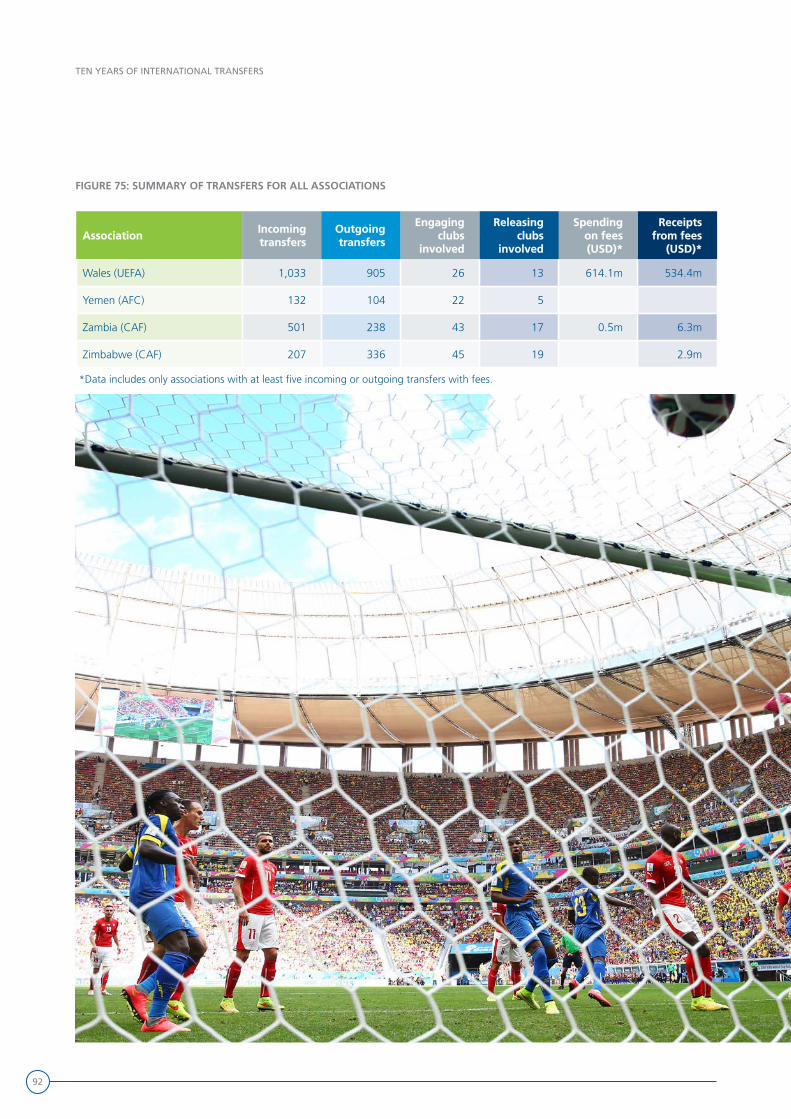
92
TEN YEARS OF INTERNATIONAL TRANSFERS
FIGURE 75: SUMMARY OF TRANSFERS FOR ALL ASSOCIATIONS
AssociationAssociation Incoming Incoming transferstransfers
Outgoing Outgoing transferstransfers
Engaging Engaging clubs clubs
involvedinvolved
Releasing Releasing clubs clubs
involvedinvolved
Spending Spending on fees on fees (USD)*(USD)*
Receipts Receipts from fees from fees
(USD)*(USD)*
Wales (UEFA) 1,033 905 26 13 614.1m 534.4m
Yemen (AFC) 132 104 22 5
Zambia (CAF) 501 238 43 17 0.5m 6.3m
Zimbabwe (CAF) 207 336 45 19 2.9m
*Data includes only associations with at least five incoming or outgoing transfers with fees.

93
TEN YEARS OF INTERNATIONAL TRANSFERS
Incoming Incoming U18 U18
transferstransfers
Outgoing Outgoing U18 U18
transferstransfers
Spending on Spending on training training
rewards (USD)rewards (USD)
58 55 1.8m
0 0 -
0 0 0k
0 0 -
94
TEN YEARS OF INTERNATIONAL TRANSFERS
Definitions AssociationSee “Member association”.ClubA member of an association (that is a member association of FIFA) or a member of a league recognised by a member association that enters at least one team in a competition.Conditional transfer feeThe amount payable by the new club to the former club if certain conditions are fulfilled, e.g. if the player scores ten goals or makes 20 first-team appearances.ConfederationA group of associations recognised by FIFA that belong to the same continent (or assimilable geographical region). Confederations are the umbrella organisations of the member associations in each continent:• AFC – Asian Football Confederation• CAF – Confédération Africaine de Football• Concacaf – Confederation of North, Central American and Caribbean Association Football• CONMEBOL – Confederación Sudamericana de Fútbol• OFC – Oceania Football Confederation• UEFA – Union des Associations Européennes de FootballFixed transfer feeThe unconditional payment amount for the transfer of the player.ITC (international transfer certificate)The official document that allows the international transfer of a player’s registration from oneassociation to another (cf. art. 9 of the RSTP).LoanThe type of transfer conducted when a professional player is temporarily engaged by a new club on the basis of agreement during the term of his employment contract with the former club.Loan extensionThe instruction type entered when a loan is being extended by the new club (where the player is currently on loan) for an additional period of time, with the agreement of the former club and the player.Loan to permanentThe instruction type entered when the new club (where the player is currently on loan) wishes to engage the player permanently, with the agreement of the former club.Member associationA football association recognised as such by FIFA. A total of 211 member associations are currentlyaffiliated to FIFA.Out of contract (transfer)The type of transfer conducted when a player signs for a new club when he is not contractually bound to any former club and no transfer agreement exists. There are four possible reasons for the player’s previous contract termination: the contract with the former club has expired; the contract with the former club was terminated unilaterally; the player mutually agreed an early termination with his former club; and the player was not under contract with his former club, i.e. he was an amateur.Permanent transfer (with transfer agreement)The type of transfer conducted when a player is permanently engaged by a new club and a transfer agreement is signed by the new club and the former club.Professional playerA player who has a written contract with a club and is paid more for his football activity than the expenses he effectively incurs (cf. art. 2 par. 2 of the RSTP).ReceiptsThe sum of the value of transfer fees of outgoing transfers.
95
TEN YEARS OF INTERNATIONAL TRANSFERS
Release (buyout) feeAny fee paid in execution of a clause in the player‘s contract with his former club providing for compensation for termination of the relevant contract.Return from loanThe instruction type entered when a player who was loaned to another club returns to his club of origin after termination of the loan.RSTPThe FIFA Regulations on the Status and Transfer of Players: global and binding rules concerning the status of players, their eligibility to participate in organised football, and their transfer between clubs belonging to different associations.Sell-on feeThe percentage of a future transfer fee agreed between the two clubs involved in a transfer. This means that if the new club transfers the player to a third club, the former club is entitled to a percentage of the new transfer fee.Solidarity contributionIf a professional player moves before the expiry of his contract, 5% of any compensation (not including training compensation paid to his former club) shall be distributed between the clubs that have contributed to his education. This solidarity contribution reflects the number of years the player was registered with the relevant club(s) between the seasons of his 12th and 23rd birthdays (cf. Annexe 5 of the RSTP).SpendingThe sum of the value of transfer fees of incoming transfers.TMSThe Transfer Matching System: a web-based data information system with the primary objective of simplifying the process of international player transfers as well as improving transparency and the flow of information.Total transfer feeThe sum of the fixed transfer fee, conditional transfer fee and release (buyout) fee.Training compensationThe sum paid to the player’s training club(s): (1) when a player signs his first contract as a professional, and (2) each time the professional is transferred until the end of the season of his 23rd birthday (cf. art. 20 of the RSTP).Training rewardsSee “Solidarity contribution” and “Training compensation”.Transfer feeFinancial compensation agreed to be paid between clubs in the course of a player transfer. In this report, “transfer fees” include fixed transfer fees, conditional transfer fees and release (buyout) fees. Transfer with feesA transfer where at least one of the fixed transfer fee, conditional transfer fee or release (buyout) fee is greater than zero.
96
TEN YEARS OF INTERNATIONAL TRANSFERS
Methodology The report includes data on international transfers of male professional football players within the scope of 11-a-side football completed between 1 January 2011 and 31 December 2020. The data was extracted from TMS on 6 May 2021.
All information on transfer fees is automatically converted into US dollars on the basis of conversion rates on the day when the transfer instruction is created in TMS.
Numbers in the report are rounded. All names of clubs and players in this report are as entered in TMS.
Unless explicitly stated otherwise, transfers in this report include transfers of the following types:• Permanent transfers• Out-of-contract transfers• Loans• Loan extensions• Loan-to-permanent transfers
Note: returns from loans are excluded. Only the loan itself is counted as a transfer in this report.
The report was drafted, prepared and produced by the Reports Unit of the Legal Strategic Projects Subdivison

97
TEN YEARS OF INTERNATIONAL TRANSFERS