the last ten years in the british education system - CORE
356
UNIVERSIDAD DE MÁLAGA Facultad de Filosofía y Letras Doctorado “Lecturas Contemporáneas de la Literatura y la Cultura Inglesa” TESIS DOCTORAL THE LAST TEN YEARS IN THE BRITISH EDUCATION SYSTEM Juan Antonio Rodríguez Rico. Málaga 2015
-
Upload
khangminh22 -
Category
Documents
-
view
2 -
download
0
Transcript of the last ten years in the british education system - CORE

I
UNIVERSIDAD DE MÁLAGA Facultad de Filosofía y Letras Doctorado “Lecturas Contemporáneas de la Literatura y la Cultura Inglesa” TESIS DOCTORAL
THE LAST TEN YEARS IN THE BRITISH EDUCATION SYSTEM
Juan Antonio Rodríguez Rico.
Málaga 2015

II
THE LAST TEN YEARS IN THE BRITISH EDUCATION SYSTEM
Supervisor: Dra. Maria Isabel Romero Ruiz

AUTOR: Juan Antonio Rodríguez Rico
http://orcid.org/0000-0002-8890-2142
EDITA: Publicaciones y Divulgación Científica. Universidad de Málaga
Esta obra está bajo una licencia de Creative Commons Reconocimiento-NoComercial-SinObraDerivada 4.0 Internacional: http://creativecommons.org/licenses/by-nc-nd/4.0/legalcodeCualquier parte de esta obra se puede reproducir sin autorización pero con el reconocimiento y atribución de los autores.No se puede hacer uso comercial de la obra y no se puede alterar, transformar o hacer obras derivadas.
Esta Tesis Doctoral está depositada en el Repositorio Institucional de la Universidad de Málaga (RIUMA): riuma.uma.es

iii

iv

v
To my family
and
my supporting friends

vi

vii
Acknowledgements
The completion of this dissertation would not have been possible without the co-
operation and support of a number of individuals.
First of all, I am very grateful to Dr. Blanca Krauel Heredia and Dr. María Isabel
Romero Ruiz for undertking to supervise this dissertation. Their guidance,
constructive comments and support have been invaluable in completing it.
Furthermore, I want to thank all the Málaga University lectures on the “Lecturas
Contemporáneas de la Literatura y la Cultura Inglesa” for the guidance and
assistance.
Secondly, my appreciation goes to Antonio Ariza, Paula O'Callaghan and
Michelle O’Brien for their support and encouragement.
Finally, I am indebted to all those whose support and encouragement have
been source of stimulation.

viii

ix
Abstract
After World War II, Britain was aware of its shortage of qualified workers. The
main problem was how to encourage young people to pursue their education as
every one of them was an important cog in the mechanism of rebuilding British
national pride and its international image.
The social situation of the UK during these years changed sharply. Racial
beliefs and Social Darwinism helped to create the idea that the white British had
economic, moral and intellectual superiority over the arrivals from colonial
countries; as a result the notion that different social and racial groups could be
designated as more or less intelligent cast a long shadow into the 21st century.
Politicians did not expect the current economic crisis, certain massive political
corruption, students’ apathy about their own future and the enormous efforts the
government have to make to fight against an inherited “doctored” education
system as well as to build a cohesive society. The flexible mobility of people
within the European frontiers has originated in a huge uncontrolled influx of
subject members resulting in unprecedented issues of cultures and races.
National Identity is no longer viable because of the mixture of different
background British born children. Besides, globalization has brought about
similar educational problems all across EU.
White and Green Papers, Codes of Practice and Regulations and Education
Acts have continued to be passed on a regular basis in order to fit the 21st
century societal needs
The implications of all the most relevant education documentations will be
studied in the eleven chapters that build this dissertation

x
Key words
Children welfare ♦ Education Acts ♦National Curriculum ♦ White and Green
papers ♦Vocational Training ♦ Ethnic Minority ♦ Teacher standards ♦
Background♦ Heritage♦ Music Education

xi
Abbreviations
ABRSM: Associated Board of the Royal Schools of Music.
ACE: Academy of Creative Education.
ALB: Arm's Length Body Reform.
BAME: Black and Asian Minority Ethnic.
BIS: Department of Business, Innovation and Skills.
BSF: Building Schools for the Future programme.
CAT: Centres for Advanced Training.
CEP : Creative Employment Programme
CEPG: Cultural Education Partnership Group.
CMPO: Centre for Market and Public Organisation.
CPD: Continuous Professional Development.
DCMS: Department for Culture, Media and Sport.
DCSF: Department for Children, Schools and Families.
DDA : Disability Discrimination Act .
DfE: Department of Education.
EACEA: Education, Audiovisual and Culture Executive Agency.
EDC: Learning Transforms Lives.
EMU: Economic and Monetary Union.
EYFS: Early Years Foundation Stages,
FSM: Free School Meals
GDP: Gross Domestic Product.
HSE: Health and Safety Executive.
ITT: Initial Teacher Training.

xii
LEA: Local Education Authority.
LSC: Learning and Skills Council.
NAfME: National Association of Music Educators.
MfA: Music for All
MIA: Music Industries Associations.
MDS: Music and Dance Scheme.
MFY: Music For Youth.
NAS: National Apprenticeships Service.
NASUWT: National Association of Schoolmasters Union of Women Teachers.
NEC: National Extension College ( Adult Education).
NCPC: National Coalition for the Prevention of Children.
NCVQ: National Council for Vocational Qualifications.
NICE: National Institute for Health and Clinical Excellence
NPO: National Portfolio Organisation.
NYMO: National Youth Music Organisation.
NYCGB: National Youth Choirs Great Britain.
OFSTED: Office for Standards in Education.
PLASC: Pupil Level Annual Schools Census.
SCITT : School Centred Initial Teacher Training.
SGP: Stability and Growth Pact.
SSLP: Sure Start Local Programmes.
TSAs: Teaching School Alliances.
WRC: Welsh Refugee Council.
UASC: Unaccompanied asylum seeking children

xiii
Contents
Introduction 1-14
Chapter 1:Building Brighter Futures.
1. Introduction 15
2. Families 17
3. Children’s work development 22
4. Sure Start Children’s Centres 28
5. Building Schools for the Future 31
6. Parent Know-How Helpline …………….. 33
7. Conclusion …. 37
Chapter 2: The National Curriculum.
1. Introduction 39
2. The Structure of the School Curriculum 44
3. Primary Curriculum 46
4. Secondary Curriculum 51
5. National Curriculum Review Delayed 53
6. Conclusion 56
Chapter 3: Vocational Training.
1. Introduction 59
2. Structure of NVQs 63
3. Apprenticeships 67
4. Train to gain 70
5. Achievements 73
6. Conclusion 80

xiv
Chapter 4: University.
1. Introduction 83
2. Widening University participation 86
3. Raising aspirations and attainment 88
4. The student finance plan 92
5. Post-Study Work visa 95
6. BAME students 98
7. BME staff 101
8. Disability 103
9. Conclusion 105
Chapter 5: Teaching Recruitment.
1. Introduction 107
2. Teacher training 109
3. Teaching standards 112
4. Teachers workforce 114
5. Teachers’ Pay 119
6. Conclusion 123
Chapter 6: Academies.
1. Introduction 125
2. The converter chain landscape 127
3. The sponsored academy chain landscape 131
4. The impact of academy chains 134
5. The organisation and management of academy chains 136

xv
6. Sponsorship and governance of academy chains 139
7. The future growth and development of academy chains 141
8. Conclusion 143
Chapter 7:Bullying.
1. Introduction 145
2. Who is Affected? 148
3. Cyberbullying 156
4. Homophobic bullying 161
5. Teachers bullied 164
6. Conclusion 167
Chapter 8: Multicultural classroom.
1. Introduction 169
2. Schools can make the difference. 173
3. Primary, Middle and Secondary Diversity. 177
4. English as minority language. 181
5. Shared Futures 183
6. Conclusion 186
Chapter 9: Budgeting.
1. Introduction 189
2. Components of education spending 194
3. Changes to school funding 197
4. The British budgeting landscape 201
5. Conclusion 206

xvi
Chapter 10: Cultural Education.
1. Introduction 209
2. Reasons for cultural education 213
3. Cultural Education in the Curriculum 214
4. The Heritage Schools programme 217
5. National Bridge 219
6. The WWI programme 222
7. Read for My School 225
8. Conclusion 227
Chapter 11: The Importance of Music.
1. Introduction 229
2. Progression 233
3. ABRSM 235
4. Music For Youth 239
5. The Music Industries Association. 242
6. National Association of Music Educators 244
7. Choir Schools’ Association. 248
8. Conclusion 251
Conclusion. 253
Appendix 1: British-Spanish educational system 265
Appendix 2:The NQV structure 266
Appendix 3: Chronology of Acts 267
Works cited 289
Resumen 315

xvii
List of figures
Chapter 1: Building Brighter Futures.
Figure 1 : Number of children of divorced couples: by age groups. 22
Figure 2: School building projects stopped by constituency. 32
Figure 3: Issues more demanded in the helplines. 36
Figure 4: Satisfaction with the helpline year 2008. 36
Chapter 2: The National Curriculum.
Figure 1: The School Curriculum. 45
Figure 2: Framework for the primary curriculum. 48
Figure 3: The independent review. 49
Figure 4: Attainment in reading, writing and mathematics. 55
Chapter 3: Vocational Training.
Figure 1: Employees' job-related training: by sex and occupation. 61
Figure 2:Occupational shift.2001-2009. 62
Figure 3: Study of Young People studying NVQs in England. 65
Figure 4: Apprenticeships by age groupings. 67
Figure 5: Employment rate by highest level of qualification. 68
Figure 6: Routes to contact with Train to Gain programme. 71
Figure 7: Business benefits of Train to Gain. 72
Figure 8: NVQ achievements by SSA. 74
Figure 9: NVQ achievements by level. 74
Figure 10: VRQs achievements by SSA . 75
Figure 11: VRQ achievements by level. 76
Figure 12: QCF achievements by SSA. 77
Figure 13: QCF achievements by level. 78
Figure 14: QCF achievements by size. 78
Figure 15: OQ achievements by level. 79
Figure 16: Achievement of NVQs, VRQs and QCFs in the UK. 80
Figure 17: Occupations by skill level. 81

xviii
Chapter 4: University.
Figure 1: Income of UK HE institutions, 2010-11. 84
Figure 2:Different widening participation activities by HE providers. 91
Figure 3: Participation rates of young people. 92
Figure 4: Fee , Grant and Loan eligibility: Full support students. 93
Figure 5: Students’ loans. 94
Figure 6: Subjects of study. HESA. 2008. 100
Figure 7: BME academic staff. 102
Chapter 5 : Teaching Recruitment.
Figure 1: Professional standards. 113
Figure 2: School workforce by gender. 116
Figure 3: Age of Head teachers and teachers 117
Figure 4: Ethnicity of school workforce. 118
Figure 5: Average salaries of qualified teachers. 120
Figure 6: Teacher’s pay. Different countries. 120
Chapter.6 : Academies.
Figure 1: Number of academies converting by phase. 127
Figure 2: Structure of a multi-academy trust. 128
Figure 3: Structure of an umbrella trust. DfE. 129
Figure 4: Structure of a collaborative partnership. 130
Figure 5: Number of sponsored academy chains by size. 131
Figure 6: Primary converter academies. 2012-13 academic year. 132
Figure 7: Secondary converter academies.2012-13 academic year. .. 133
Figure 8: Absence in academies from 2001 to 2009. 134
Figure 9: Academies-schools. Five A*‑C grades at GCSE. 135
Figure 10:Ppercentage by academies in sponsored academy chains. .. 136
Figure 11: Funding arrangements. CED survey. 137
Figure 12: Centrally employed non-education staff. CEO survey. 138
Figure 13:Academies by category of sponsor. 139
Figure 14: Proportions of governor types. 140
Figure 15: Projected growth .Primary schools. 141

xix
Figure 16 : Projected growth .Secondary schools. 142
Chapter 7: Bullying.
Figure 1:Range of Young people's technology use on a daily basis. 146
Figure 2: Young people reporting bullying by type of bullying and age. 151
Figure 3: Proportion of bullying reported to University. 152
Figure 4: Forms of cyberbullying experienced by young people (%). 159
Figure 5: Expected moment in time that cyberbullying happens (%). 160
Figure 6: Type of bullying faced by gay students. 161
Figure 7: Places where bullying takes places. 162
Chapter 8: Multicultural Classroom.
Figure 1: The percentage of ethnic minority pupils 170
Figure 2: Number of each ethnic group. Primary. 179
Figure 3: Number of each ethnic group. Middle. 179
Figure 4: Number of each ethnic group. Secondary. 180
Figure 5: 2008 Unaccompanied asylum seekers' countries. 183
Figure 6: Unaccompanied asylum seekers' age. 184
Figure 7: Openness cycle. 186
Chapter 9 : Budgeting.
Figure 1: Real GPD growth rate.EU-27, 2000-2013. 190
Figure 2: Changes in budgets. in 2013 compared to 2012. 193
Figure 3: Spending per student. 196
Figure 4: Change in school funding levels by region. 199
Figure 5: Changes in school funding levels for 2014-15. 200
Figure 6: Education spending. 201
Figure 7: Education spending II . 202
Figure 8: Spending breakdown for 2016. 206

xx
Chapter 10: Cultural Education. Figure 1: Artsmark schools in England. 221
Chapter 11: The importance of Music Figure 1: Quality roadmap.2010-2015. 233
Figure 2: Progression in music education.2011. 234
Figure 3: MFY festivals 241
Figure 4 : Decline in musical instruments 2005-07. 242
Figure 5: 2010 Instrument choice by gender 244
Figure 6: Influences of home and school. 245
Figure 7: Roles of musicians 247
xxi
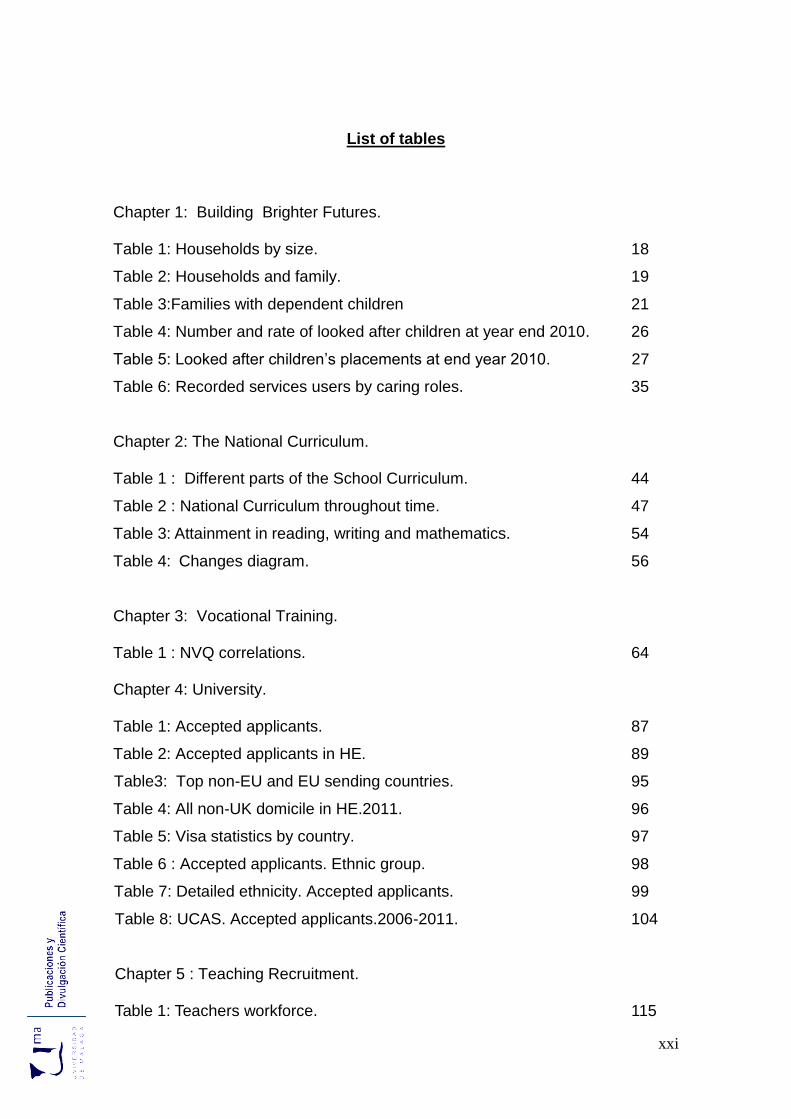
List of tables
Chapter 1: Building Brighter Futures.
Table 1: Households by size. 18
Table 2: Households and family. 19
Table 3:Families with dependent children 21
Table 4: Number and rate of looked after children at year end 2010. 26
Table 5: Looked after children’s placements at end year 2010. …….. 27
Table 6: Recorded services users by caring roles. 35
Chapter 2: The National Curriculum.
Table 1 : Different parts of the School Curriculum. 44
Table 2 : National Curriculum throughout time. 47
Table 3: Attainment in reading, writing and mathematics. 54
Table 4: Changes diagram. 56
Chapter 3: Vocational Training.
Table 1 : NVQ correlations. 64
Chapter 4: University.
Table 1: Accepted applicants. 87
Table 2: Accepted applicants in HE. 89
Table3: Top non-EU and EU sending countries. 95
Table 4: All non-UK domicile in HE.2011. 96
Table 5: Visa statistics by country. 97
Table 6 : Accepted applicants. Ethnic group. 98
Table 7: Detailed ethnicity. Accepted applicants. 99
Table 8: UCAS. Accepted applicants.2006-2011. 104
Chapter 5 : Teaching Recruitment.
Table 1: Teachers workforce. 115

xxii
Table 2: September 2012 Scales. 121
Table 3: Payments for Teaching and Learning responsibilities. 122
Table 4: Teachers who applied to cross the pay threshold. 122
Chapter 7: Bullying.
Table 1 : Overview of factors found to be associated with bullying. 154
Table 2: Teachers bullied at work. 165
Table 3: Sex of persons bullied. 165
Table 4: Teachers bullied consequences. 166
Table 5: Teacher's suicide rate. ………. 166
Chapter 8: Multicultural Classroom.
Table 1: Percentage of pupils in schools. 178
Chapter 9 : Budgeting.
Table 1: Budget deficits/surplus as percentage of GDP, 2007-2011. 191
Table 2: Gross debt ratio as percentage of GDP,2007-2011. 192
Table 3: Increases in various components of public spending. 195
Table 4: The UK total public spending in billion pounds. 203
Table 5: Spending breakdown. The UK. 204
Table 6: Spending breakdown. By countries. 205
Chapter 10: Cultural Education.
Table1: Funding available for training. 213
Chapter 11: The importance of Music Table 1: ABRSM diplomas by results.. 236
Table 2 : ABRSM diplomas by results.. 237
Table 3: ABRSM practical assessment by grade 237
Table 4: ABRSM theory assessment by grade. 238
Table 5: Individual music programme sessions. 246
Table 6: Increase in worship in October 2013. 251

1
Introduction
The Second World War ended with the overwhelming victory of the Allies over
Germany and Japan in 1945. It left the political and social structures of the
world completely destroyed. The postwar mentality was featured by a serious
desire to attain an economic recovery and a political integration through
international cooperation in order to prevent future conflicts.
Britain was determined to take care of all its citizens. The creation of a welfare
state was the first step so as to eradicate the class-ridden pre-war society. The
government wanted to give a fresh start to everyone as a complimentary reward
for the hardship Britons had lived through ( Pugh,213).
During the 1950s, United Kingdom was still bearing the scars of World War II.
People had to produce identity cards and housewives had to queue nursing
their ration books. Churchill, hero of the war, gave new hope to all citizens
when he was re-elected to power under the Conservatives ( Fashion-era.com).
Churchill’s first action was to look at the austere diet of the country. He wanted
to see just what the people really had to eat. The entire rations for one week
were what were expected to be eaten at one breakfast. Unable to abolish food
rationing, he abolished the personal identity card as a token of extra personal
freedom and eventually all food rationing ended in Britain on 4 July 1954 (
Gabb, 5).
Women were encouraged to stay at home as housewives to let men be in full
employment. It was not that women had never worked before but the general
attitude was that men deserved jobs more after fighting in the war and women
would be child bearers to refuel the population. However, thanks to American

2
Marshall Plan, which helped Europe to restore the consumer society, the
situation improved and the Affluent Society came along. Expensive items such
as carpets and lavishly upholstered suites, along with labour saving electrical
equipment were paid for with a hire purchase agreement. The demand for the
latest labour saving device and nicer homes became higher and higher resulting
in the incorporation of women in the workforce ("Welfare, Affluence and
Consensus,1945-1970", 229).
Freedom came fast. Television became the main source of entertainment as
well as other activities. All these changes influenced the educational system
which was not suitable for a devastated population whose schooling was
extremely class and gender biased. Economic segregation was firmly settled
assisting the wealthy and the powerful to reach elite tuitions resulting in a
selective hoarding of all chances. Society had to be substantiated from the very
roots. In order to perform the societal extreme make over, a profound change in
the schooling layout was due; first needs were to be covered, such as being
sure that every child was properly nourished. ("Welfare, Affluence and
Consensus,1945-1970", 231).
Besides, a tripartite system was devised so as to wipe out any kind of
segregation. Teacher’s training was to be adapted, the “11 Plus” examination
needed to be redesigned, Higher Education required to be more accessible and
a new problem had to be faced, the massive arrival of Commonwealth subjects
after the splitting of the British Empire.
All decisions made during this period have to be framed in a context where
welfare and well-being were the most serious pillars to be constructed and hard
work was essentially as well as voluntary compelled. A true desire to give a

3
second chance to all of the population was the ultimate drive but the outcome in
the following years would turn out to be a disastrous maze of an educational
system tailored by political and economic viewpoints.
During the 1960s, The Conservative Prime Minister Harold Macmillan witnessed
a difficult economic crisis. Growth continued to struggle, at about only half the
rate of other leading European countries’. The Labour Party under Harold
Wilson from 1964–1970 was forced to devalue the Pound in 1967 in order to
find a solution to the economy. The decline of Britain’s economy made the
trade unions begin to strike (Educationengland.org.uk).
Britain's relatively low growth was due to a lack of competition in some sectors
of the economy, especially in the nationalised industries; poor industrial
relations and vocational training. This was a period of government failure
caused by poor understanding of economic theory, short-termism ad a failure to
confront interest groups (Educationengland.org.uk).
Both political parties had come to the conclusion that Britain needed to revive its
economy because trade with the Commonwealth halved in the period 1945–
1965 to around 25%. The UK needed to enter the European Economic
Community (EEU).This decision came after establishing a European Free Trade
Association (EFTA) but the best results came with the trade with the EEC which
had doubled during the same period. In 1973 the Conservative Prime Minister,
Edward Heath, led Britain into the EEC (" Biritain and Colonization of Africa,
Imperialism in Asia", 3).
By the mid 1960s, almost the whole British Empire had been dissolved and the
problem of Ireland, The Ulster in 1969, was not yet resolved.Socially speaking,
the Underground was a countercultural movement associated with cannabis

4
and other drug use and a strong socio-political revolutionary agenda to create
an alternative society. It was linked to the hippie phenomenon. Its primary focus
was in London and then the rest of the country. The Beatles appeared as the
ultimate expression of a new wave of freedom ( Worldlibrary.org). A different
concept of liberty and experimentation ruled the young generations, which
somehow influenced the educational system in which every child counted for
the development of the country and thus a more informal, child-centred
education was on the way. Qualified workforce was urgently demanded in all
the fields and both manual and non-manual jobs; a better university infra-
structure was to be built in order to produce the future “brains” of Britain as
stated in the Robbins Report (74).
Society was becoming more and more cosmopolitan but on the other side of
this mixed race society, xenophobia was being rooted deeply as new deplorable
thoughts were breaking in, relating intelligence to social or racial groups;
freedom plus a highly believed individuality made social struggle and
recognition of one’s right the crusade of the epoch.
This decade was characterized by a will of betterment smeared by a sense of
superiority of races, which would harm the soil of the UK; instead of piecing
together a highly diverse society, this divergence headed towards an up-coming
segregation, which would be part of the intangible heritage of a country divided
into individual progress and the price of a heritage paying its toll in every
stepping-stone to success.
During the 1970s, as a consequence of the Arab-Israeli conflict, the Arab
countries reduced their petroleum production and raised prices as revenge
against the occidental help to Israel. Many countries with petroleum based

5
economy and without any other alternative energy resource, were highly
affected by the price rise. The most affected areas were Western Europe and
Japan, which lacked “black gold” reserves (BBC.co.uk).
The consequences of this was the bankruptcy of many enterprises, the rise of
unemployment, the slope of inflation and the appearance of new economic
actions such as the underground economies plus the failure of the welfare state
(BBC.co.uk).
Neoliberalism came along as the solution. It is a market-driven approach to
economic and social policy based on neoclassical theories of economics that
maximise the role of the private business sector in determining the political and
economic priorities of the state. Reagan in the USA, Thatcher in the UK or
Helmut Schmidt in the then RFA applied those principles. The main ones are as
follow: (Abovetopsecret.com)
Privatization of state enterprises: Promoting market provision of
goods and services which the government cannot provide as
effectively or efficiently, such as telecommunications, where
having many service providers promotes choice and competition.
Redirection of public spending from subsidies and other
spending neoliberals deem wasteful toward broad-based
provision of key pro-growth, pro-poor services like primary
education, primary health care and infrastructure investment.
Freezing salaries and liberalisation of employment to facilitate
investments and creation of new jobs.

6
The positive effects of these economic principles in the UK were the growth of
production, the increase in consuming and the stopping of rising inflation; the
negative ones were the cut in social spending leading to a much poorer UK. .
Education was molded into a consumer orientation in order to equalize the
system but it made things worse because selective grammar schools were still
in operation alongside with the comprehensive system. Teacher training
suffered a change to make specialist-teachers and eventually the curriculum
integrated multicultural issues; immigrants were now regarded as ethnic
minorities as an attempt to turn British society into a cohesive community.
Even though the issue of a multicultural society was openly recognized,
discussed and dealt with, no one was apparently prepared or qualified to take
care of the matter. Those calling themselves “experts” on the subject had many
ideas but few of them effective ones resulting in an annoying endless
bureaucratic paper filling-in process.
During the 1980s, a regressive focus back to Victorian values highlighted the
fact that individuals were expected to accept a hierarchical understanding of
their class, gender and racial position; those who did not help themselves by
making the right choices, were unworthy of state help. Values of competitive
individualism, separation and exclusion were to be extolled as a commodity for
private consumption (35).
The industrial restructuring carried out by Thatcher was implemented by strict,
hard and sometimes cruel decisions. The Black countries had to be competitive
and not polluting so as to reduce the costs of raw materials. Thousands of
people were sacked; riots and social distress broke out ( Gouiffes, 15).

7
Even with her bad reputation, swimming against the tide, Thatcher was able to
redirect the country out of the oil crisis; her solid bond with the USA was highly
criticized as the UK was already an ECC member but she did not pay much
attention to it (Gouiffes,20).
The overall aim of Margaret Thatcher’s education policies was to convert the
national schools system from a public service into a market. To reduce
education costs and to control teachers’ practices was the link to industrial
requirements. This ideology was originated in Stuart Sexton’s 1977 Black Paper
called Evolution by choice. He set out to design a new secondary education
system based on an absolute freedom of choice by application
(Educationengland.org.uk). Government was having more and more control in
the whole process of teaching and learning and therefore the centralization of
education was stronger and stronger. Freedom of choice by application became
a curse rather than an advantage since all parents chose the same group of
good schools, which was understood as schools with the minimum ethnic
minority students as possible. Problems arose with British-born second
generation, who wanted their place in society as any other British citizen and
again the issue of multicultural and multiracial Britain reared as something to
solve once and for all.
This epoch was contradictory as the government was heading towards selection
and segregation meanwhile society was demanding rights and justice. The
bureaucratic system became unbearable and even when some policies were
acted upon in order to promote equal opportunities and rights, they had little
effect since a strong sense of Britishness was gliding over working class people

8
who saw their rights jeopardized by “aliens”; this attitude was fuelled by
Thatcher’s own stance.
During the 1990s, John Major, Prime Minister from 1990 to 1997, inherited from
Margaret Thatcher an education system which had suffered a massive decline
in investment and a vast increase in inequality; schools faced huge problems
caused by increasing social imbalance (Educationengland.org.uk).
The general pattern of increases in social equality during the 1970s was
followed by rising inequality in the 1980s and 1990s. Both poor and wealthy
households became more and more geographically segregated from the rest of
society and thus causing the development of ghettos, with the disadvantage of
schooling venues featured by the economic circumstances of the area; four
measures of poor and wealthy households were labelled so as to better
understand the social complexity which inevitably had a reflection in the
academic results of the children coming from a specific background
(Thomas, 290).
The polarisation was an aspect to be seriously taken into account as state
schools with large numbers of children from poor households were by far the
worst performers at GCSE. The situation was chaotic. Right–wing succeeded in
preventing issues of race, culture, religion, spatial segregation, discrimination
and inequalities from being more openly discussed. As a result of market
forces, schools were encouraged to get rid of SEN children in order to keep the
schooling venue open since resources were demanded but never granted and
league tables were to be published sorting schools into popular and unpopular
ones. Parental choice gained more power and schooling ghettos appeared

9
everywhere. Teacher’s performance and competence were scrutinized leading
to serious teacher shortages (Nadeem, 2011: 222).
Education was given a different connotation as a means for people to contribute
to the economy. The creation of H.E loans tried to boost student participation.
The reformed vocational education system plus the Education Maintenance
Allowance offered a promising way of raising the participation of school leavers
but had little impact.
All changes, reforms and conversions in the educational system in this period
tried to disguise the deep rooted white power beliefs of the Prime Minister, John
Major. However, the economic ambiance made politicians rethink some aspects
of the system so as to track Britain back in a sound national economy as well as
an international competitive country (the Budges Group.com).
This project will analyze the different trends in education throughout time, taking
as a starting point the 21st century until the present time. Education is a
reflection of not only a political way of thinking but also a mentality ruling a
society which is featured by economic trends.
How people adapt themselves to new economic situations is covered in the
following pages of the project; how new generations have to deal with new and
unexpected circumstances as the world changes dramatically and how
immigration draws a new society.
Many of the education changes carried out have been due to a specific political
inclination. Some disasters have been caused just because of a rivalry among
political parties in office without taking into account what was best for the
population or even the opposite effect, when changes have been made with a
good motivation but the results were disastrous.

10
Most of the primary resources, I have made use of in this Phd thesis are official
documents and Parliamentary papers such as White and Green Papers, Codes
of Practice Regulations, Acts, Bills and Reports .Reading through them has
been a hard task, but has led to the acknowledgement of the changes in
practice in the British education system.
All the official documentation have continued to be passed on a regular basis in
order to fit the current new societal needs as market commodity, consumer
demands, market competition between schools, fuelled by league tables, school
choice, specialist schools and failing schools.
Regarding to secondary resources, there is a massive repertoire of literature,
which has been fundamental in the development of my work.The two most
relevant sources for this analysis are the on-line educational databases,
newspapers articles and reviews; as an example BBC News and The Guardian
and books mainly printed but increasingly available on the Internet.
The existence of websites specialized in the subject has been an invaluable
assistance; a clear example is the Department for Education
(www.education.gov.uk.)
In terms of gathering of data on one hand , qualitative research involves the
collection of data that are open to interpretation. The information classified so
has been gathered mostly through the interpretation of a diversity of historical
reviews, which constitutes the body of my study.
On the other hand, quantitative research involves the collection of information
that is quantifiable and is not open to the same level of interpretation as
qualitative research. The use of this data has been limited. However, this kind of
data has not only been utilised as a means of clarification but also as a means
11
of backing up information. The figures and tables used throughout the
investigation have assisted to have a far clearer view of the old and current
trends together with defining concepts with an understanding explanation in
order to dissipate any poorly explained notion.
The implications of all the most relevant education documentations will be
studied in the eleven chapters that build this dissertation covering children's
education, the National Curriculum, vocational training courses, universities,
teacher recruitment, academies, school bullying , multicultural classroom,
budgeting, cultural education and the importance of music. The reading and the
reflection on the most relevant documentations have been done in order to get
a satisfactory advancement of my dissertation. Finally, linking and re-evaluation
have been often done in the different stages of the elaboration of the chapters
of my dissertation.
As an outcome of such a methodology, the development of the topics for every
chapter can be summarised as follows:
In chapter 1, I intend to fully define the different aspects related to the education
of children so as to know better what is involved in their education. It is widely
agreed that not only do younger people need to have a safe environment but
they also need to look after their well-being and health in order to perform well.
Both the latter and the former are covered in this chapter.
In chapter 2, I look at the most relevant changes in the structure of the National
Curriculum for primary and secondary schools. The amendments are due to the
theoretical approaches used at a particular time or just political interests of the

12
party in office. Eventually, it sets standards for each subject, targets and
assessment methods. This chapter finishes with the conclusion that states the
NC as a generally recognized learning and teaching guide.
In chapter 3, I attempt to explain the relevance of giving a chance through
Vocational Training Education to those non-academic students who are lost in
the traditional learning process. Only then could this potential workforce find its
place in the labour market and help in the economic success of the country. The
structure of NVQs and apprenticeships are well covered.
In chapter 4, I look in detail at Higher Education as a manner to contribute to the
growth of national income and individual earnings. Universities are truly
regarded as knowledge factories which play a crucial role in generating wealth.
How this affects the economy and the social structure has been a point to study.
In chapter 5, I see to some of the most significant teaching recruitment features.
Teachers certainly have an important mark on people's development; thus, their
training, their standards, their workforce characteristics and pay are fully
developed. Education is a basic human right which never could be possible
without them.
In chapter 6, I thoroughly explain the birth of a new way of education. The
landscape of the secondary education has undergone a transformation by the
so-called Academies. Its main aim is to address the problem of failure within

13
English schools, although a significant level of risk in its expansion is looming
over because of different factors completely studied in the chapter.
In chapter 7, I describe the phenomenon of bullying. Some misconceptions
have been clarified and a new approach has been set due to the fact that
schoolchildren and teachers are part of this harassment as bullies, victims or
bystanders. Ethnicity and gender are studied carefully since they are a lever to
worsen the situation.
In chapter 8, I interpret how immigration has built a new society in Great Britain
resulting in a British-born second generation of students whose background is
other than British. Multiculturalism and antiracism are the key to promote unity
among different ethnic groups in the classroom. Integration is the way to
achieve success in this area.
In chapter 9, I aim to discern how the British school funding programmes are
developed in order to make Education one of the most relevant assets for the
economic recovery. Education is the only tool to make population an active
workforce and its investment is the object of analysis.
In chapter 10, the purpose of this chapter is to understand how the British
heritage is kept, saved and handed down to a British-born population with non-
British background. The sense of national identity among its multi-cultural
subjects is the target of study.

14
In chapter 11, the aim of this chapter is to give an overview of the different
musical programmes as Music is essential for the learning and emotional
development of children. The cultural economy is also an important source of
income for the British economy.
15
Chapter 1: Building Brighter Futures
Children are the future workforce of a country. As a group they share some
relevant features. There are several definitions of generation .Kupperschmidt
defines a generation as an identifiable group, or cohort, which shares birth
years, age, location, and significant life events at critical developmental stages
(The Health Care Manager, 2000:66) Palese, Pantali, and Saiani categorize
generations as those born within the same historical timeframe and culture
( The Health Care Manager, 2006: 182). Crumpacker and Crumpacker add
that birth rate, along with historical events, defines each generation (Public
Personnel Management, 2007: 350). These groups develop a unique pattern
of behaviour based on these common experiences.
Let's have a look at how the British government try to care for its most important
asset: its children..
1.1 Introduction
According to The Children and Young Persons Act 1989, it is the general duty
of the Secretary of State to promote the well-being of children in England (5).
Since ratification of the United Nations Committee on the Rights of the Child in
1991, the government has pursued the improvement of the situation of the
British young through different programmes, such as the Children Act 1989 and
the Human Rights Act 1998 including Every Child Matters, the Ten Year Youth
Strategy and Every Parent Matters (The United Nations Conventions on the
Rights of the Child, 4).

16
In 2007, the Department of Children, Schools and Families (DCSF) was created
in order to highlight the concern of the British government surrounding children
and young people’s issues. As the concept of family has changed into different
groupings: married, lone parents and cohabiting couples, parents were
overwhelmed with the rapid changes in the world; they demanded support in the
up-bringing of their children to be able to balance work and family. Thus, a new
kind of relationship in which government committed itself to working close
partnership with families at every level was on the way ( DCSF Second Report
of Session 2007-8,7-10).
The new targets of providing children and parents with all the means to success
were set out in the Children’s Plan, whose aim was to assist all families in the
learning, education and wellbeing of their children. Therefore, six strategic
objectives resulted as guidelines: ("The Children's Pan: Building brighter
futures",5)
Secure the health and wellbeing of children and young people.
Safeguard the young and vulnerable.
Achieve world-class standards.
Close the gap for children from disadvantaged backgrounds.
Ensure young people are participating and achieving their potential.
Keep children and young people on the path to success.
17
The way to ensure that families reminded that they were the bedrock of society
and the place for nurturing happy, capable and resilient children was through a
better understanding of the lives they lead (6). Safe environments for children
and young people to enjoy their childhoods and early adulthood were proposed.
In education, individual progress had to reach world class standards and
achievements improved ensuring that young people were participating up to 18
and beyond (53). All this took place through an array of policies, acts, strategies
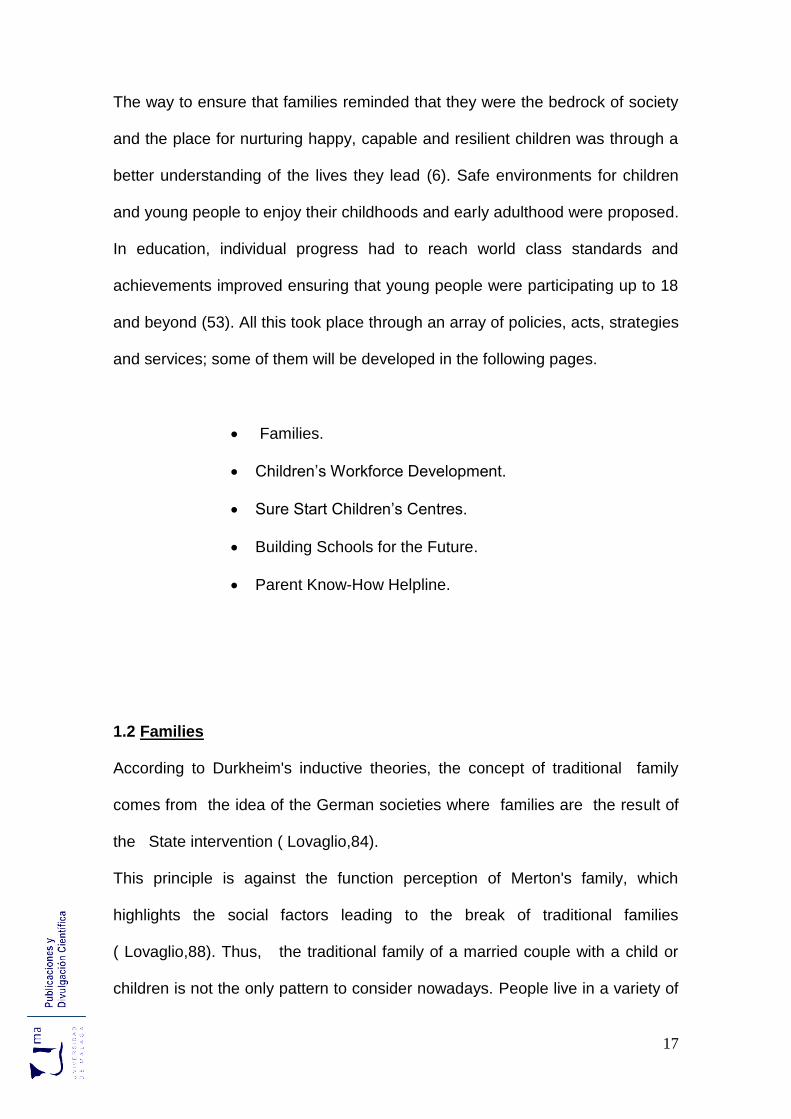
and services; some of them will be developed in the following pages.
Families.
Children’s Workforce Development.
Sure Start Children’s Centres.
Building Schools for the Future.
Parent Know-How Helpline.
1.2 Families
According to Durkheim's inductive theories, the concept of traditional family
comes from the idea of the German societies where families are the result of
the State intervention ( Lovaglio,84).
This principle is against the function perception of Merton's family, which
highlights the social factors leading to the break of traditional families
( Lovaglio,88). Thus, the traditional family of a married couple with a child or
children is not the only pattern to consider nowadays. People live in a variety of

18
household types over their lifetime. They may leave their parental home, form
partnerships, marry, experience separation, divorce and lone-parenthood
leading to the formation of new households and second families ( Morgan, 85).
As a consequence, the trend towards smaller families has contributed to the
number of households increasing faster than the population and hence an
increased demand for housing. According to the Department for Communities
and Local Government, the number of households in England will increase from
21.1 million in 2004 to 26.6 million in 2026 and over 27 million by the end of the
decade ( Pretty, 9).
Table 1: Households by size.
Source: Beaumont, Jen. Household and Families. Social Trends 41.Naional Statistics. 3.Print.
From 1961 to 2010, the average household size fell over from 3.1 to 2.4 people
due to the decrease in more lone-parent families, smaller family sizes and an
increase in one-person households as a result of the rise in the number of
people below state pension age living alone.

19
As an outcome of the collapse of Parson´s sexual-oriented performance which
establishes the different roles in the family, Merton advocates for the no
distinction among the roles, being the family grouping the cultural emitter
( Lovaglio,90).
The proportion of households which consisted of one family with children
decreased from 54 per cent to 37 per cent between 1961 and 2010. On the
other hand, households containing couples with one or two dependent children
went down from 30 per cent to 18 per cent (from about 4.9 million to 4.6 million
households). A remarkable 5 per cent increase in lone parents with dependent
children can be appreciated reaching 7 per cent in 2010 ( from 0.5 to 1.1
millions households).
Table 2: Households and family.
Source: Beaumont, Jen. Household and Families. Social Trends 41.Naional Statistics. 4.Print.

20
Malthusian theory of populations is articulated in the sense that human
populations grow exponentially while food productions grows at an arithmetic
rate (CCGGE). On the contrary, during the post-war period, Diane Macunovich
associated the parents' affluent income to the increase in the birth rates; yet,
William Butz and Michael Ward imply that fertility actually moves in counter
cyclical patterns and economic prosperity results in low fertility rates (Brown ,
R,11-16).
Because of the combination of Macunovich's and Ward's school of thoughts, as
table 3 shows, of all dependent children living in families, 63.0 per cent (8.4
million) lived in a married couple family in 2010 a decrease from 68.0 per cent
(9.0 million) in 2001. The proportion living in cohabiting couple families
increased from 10.1 per cent (1.3 million) in 2001 to 13.4 per cent (1.8million) in
2010. Over the same time period the proportion of dependent children living in
one parent families increased from 21.9 per cent to 23.6 per cent (2.9 million to
3.1 million).
Families with one dependent child were the most common, comprising 46.3 per
cent of all families with dependent children, an increase from 42.5 per cent in
2001. Over half of all cohabiting couples and lone parent families had a single
dependent child. However, for married couple families the most frequent
number of dependent children was two.
The proportion of all families with three or more dependent children decreased
from 16.7 per cent in 2001 to 14.8 per cent in 2010, an indicator of the decrease
in family size for families with dependent children.

21
Table 3:Families with dependent children.
Source: Beaumont, Jen. Household and Families. Social Trends 41.Naional Statistics. 8.Print.
In accordance to the Family System Theory, families are systems of
interconnected and interdependent individuals. To understand the individual,
the family has to be understood; nevertheless, Crisis theory assumes divorce
to be an isolated traumatic event with different phases of shock contradicting
the divorce-stress-adjustment perspective which does not regard divorce as
an isolated event (Ängarme-Lindberg, 9-14).
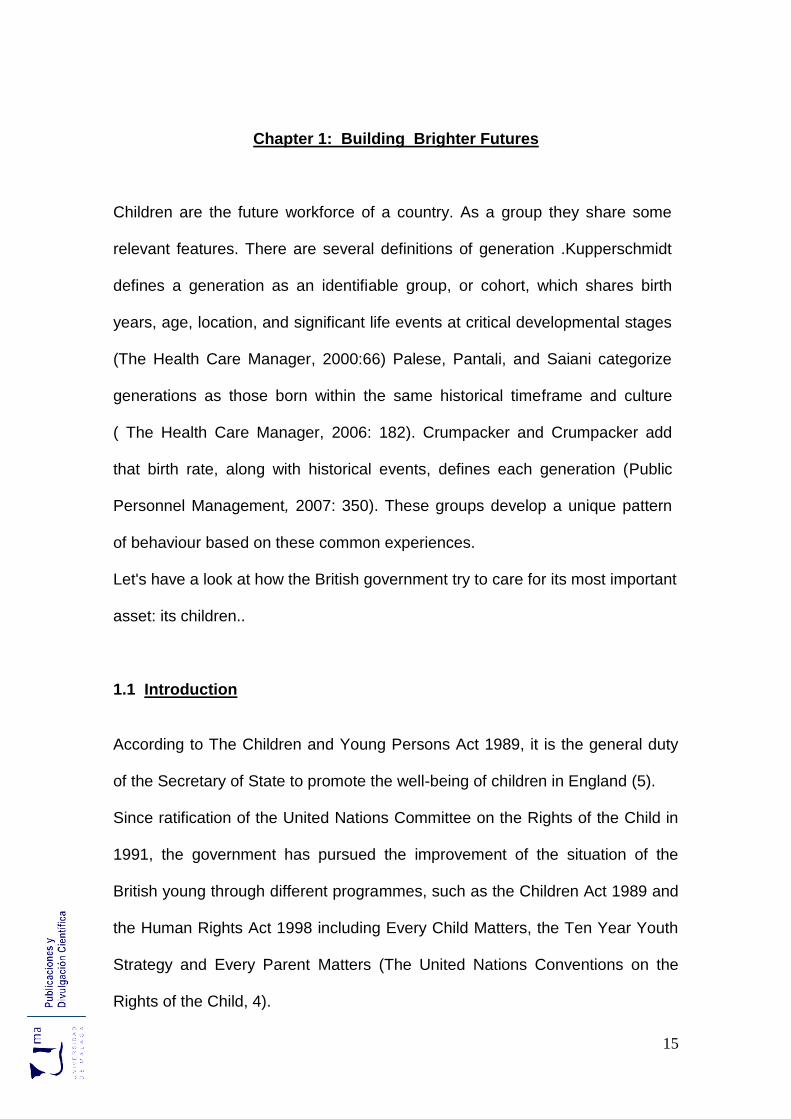
Hence, the number of children of divorced couples, not only was there a
decrease, but there was a change in the ages at which children were affected
by divorce. This is particularly noticeable for children aged 0 to 4, where, after
an increase to about 55,500 in 1993, numbers fell in each year to reach 20,800
in 2009. By 2004, the highest number of children who were affected by divorce
22
were those aged 16 and over. From 2004 onwards numbers in each of the age
groups decreased in line with the decrease in the overall number of divorces.
Figure 1 : Number of children of divorced couples: by age groups.
Source: Beaumont, Jen. Household and Families. Social Trends 41.Naional Statistics. 14.Print.
Depending on the family situation, children are to have more o less chances to
be successful in the future labour life, it is the government's obligation to look
after every single child so as to strengthen the well-being of the country. Let's
have a look at the concept of Looked-after Child.
1.3 Children’s work development
Since the adoption of the UN Convention on the Rights of the Child in 1989,
Article 12 – the provision that children have a right to express their views and
have them taken seriously in accordance with their age and maturity – has
proved one of the most challenging to implement ( Lansdown, 3).

23
As a result of the enquiry into the death of Victoria Climbié, aged 8, by her
guardians in February 2000, the government published a green paper called
Every Child Matters 2003. It made a series of proposals for reform of the
system in place for safeguarding children in England. Every Child Matters
introduced a vision for the outcomes that mattered most for children: Be healthy,
Stay safe, Enjoy and achieve, Make a positive contribution and Achieve
economic well-being.
Furthermore, the Children's Workforce Development Council (CWDC) was set
up in 2005 in order to support the implementation of the government's Every
Child Matters 2003 strategy and the Children Act 2004, which identified the
dangers of services split into different categories without any in-depth
collaboration or information sharing among them.
Therefore, the need to develop such a workforce was due to the following
factors ( Munby, 3-4 ) :
• Economic pressures: more children needing pre-school, before and after
school care.
• Shortage in suitably qualified workers: an improvement of the quality of the
vocational training courses was regarded in the Skills Strategy.
• Better understanding of dangers faced by children.
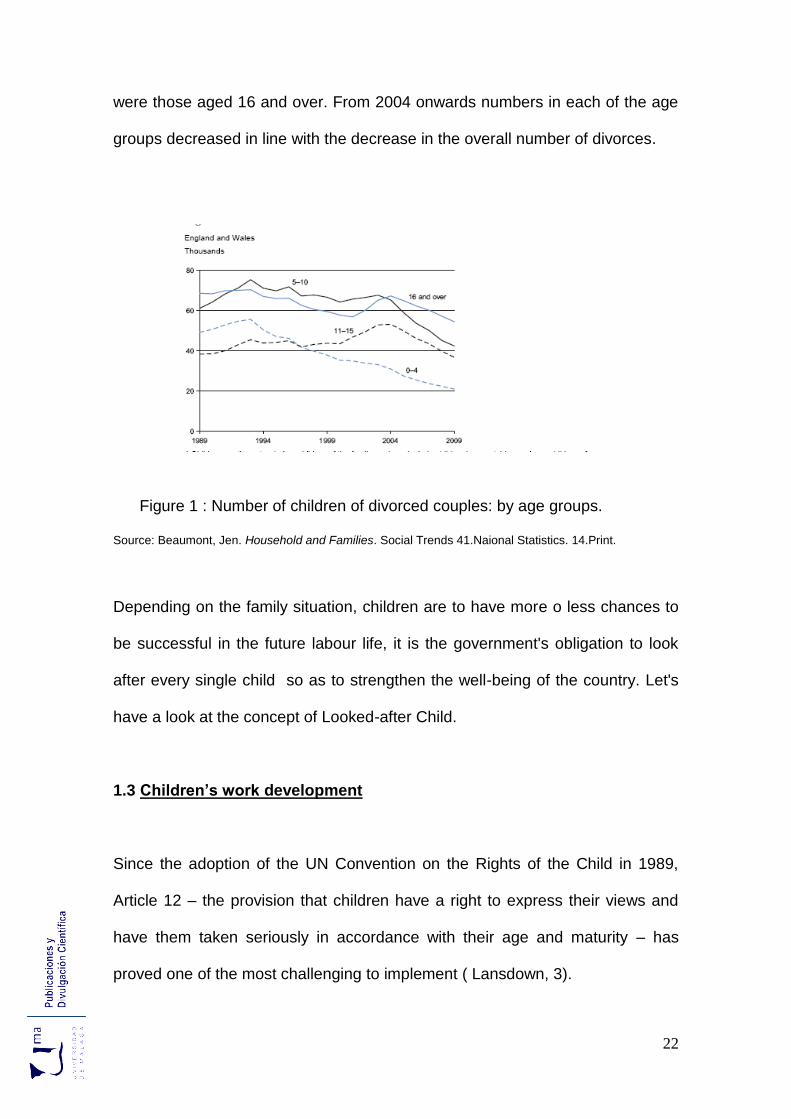
The factors mentioned above resulted in the underpinning of seven induction
standards for all children’s organisation to follow ( Munby,6 ):
24
Standard 1: Understand the principles and values essential for working
with children and young people.
Standard 2: Understand your role as a worker (employed/self employed).
Standard 3: Understand health and safety.
Standard 4: Know how to communicate effectively.
Standard 5: Understand the development of children and young people.
Standard 6: Safeguard children (keep them safe from harm).
Standard 7: Develop yourself.
Aside from this, Mary Baginsky in her Summative Report on the Qualitative
Evaluation on the Eleven Remodelling Social Work Pilots ,enumerated five
factors that contributed to have a positive impact by the professional and
service users, sometimes in isolation but usually in combination (8) :
1. Time: relationships need time and attention to develop, social workers
needed the opportunity to use their skills and experience to engage with
service users.
2. Skill: early intervention confirms that the skills to assess and manage
risks are very meaningful and appreciated by families.
3. Flexibility: supporting staff or families, in a tailored manner, meant that
more effective and intensive support could be provided.

25
4. Access: bringing social workers closer to those who would benefit from
a service rather than in an environment that they found challenging and
even hostile.
5. Trust: Trust is central to social work; it has been pushed to the front.
However, the main aim of the children’s workforce is to look after children.
Definitions of looked after children include a combination of children voluntarily
placed away from home and those on legal orders as explained in the Children
Act 1989 (England and Wales); some amendments were carried out in the
definition in 2007 in Children and Families Services: Definition of a Looked
After Child. All the cases are listed below as follow (1):
All children who are subject to a care order (section 31, Children Act.
1989), interim care order (section 38,C A.1989) or emergency protection
order (section 44, C.A.1989) are looked after regardless of where they
live since the local authority has acquired parental responsibility for that
child.
Children under a (criminal law) supervision order with a residence
requirement to live in local authority accommodation.
For children who have appeared in court and have been bailed to reside
where the local authority directs - they are looked after if they are being
provided with a local authority funded placement. They are not looked
after if the decision is that they should remain living at home.
Children who are remanded to the local authority where release on bail
has not been granted are looked after regardless of whether they are
living at home with their parents.

26
Children under a court ordered secure remand and held in council
funded accommodation (Crime and Disorder Act 1998, section 97; as
amended by the Criminal Justice and Police Act 2001).
There are also a relatively small number of children who are subject to a
secure accommodation order (section 25 Children Act 1989). These
children are looked after if the local authority is funding the cost of the
secure placement.
The main difference between the legislation for England and Wales and that of
Scotland is that in Scotland where a child or young person is subject to
Supervision Requirements, the child remains at home; these children are still
classified as looked after (Munro , 14).
Taking into account, the definitions of a looked-after Child, table 4 shows
64,000 looked after children in England compared to between 15,892 in
Scotland and 5,162 in Wales and 2,606 in Northern Ireland (Munro, 15).
Table 4: Number and rate of looked after children at year end 2010.
Source: Munro, Emily. Safeguarding children Statistics.. Sheffield: CWRC,2011 .15 .Print.

27
In terms of children and young people’s placements. table 5 shows that foster
care is the most common placement type across the UK accounting for 73% in
England, 50% in Scotland, 78% in Wales and 65% in N. Ireland of all
placements. In connection with “placed with prospective adopters”, it accounts
for 4% in England, 2% in Scotland , 4 % in Wales and 0% in Northern
Ireland.(Munro, 16)
Table 5: Looked after children’s placements at end year 2010.
Source: : Munro, Emily. Safeguarding children Statistics. Sheffield: CWRC,2011 .16 .Print.
All the data in this section are vital for the development of the different social
programmes carried out by the government in order to assure an effective
future. Children are the most relevant asset for a country and therefore, next
sections cover the effort to accomplish new services to improve children's
outcomes.

28
1.4 Sure Start Children’s Centres
In the late 1990s, Norman Glass, the Treasury official brought about the new
idea that bettering services for very young children could improve life outcomes
and reduce public spending in the long term. The creation of Sure Start
Children’s Centres was preceded by several distinct early years initiatives:
At first, the policy response was Sure Start Local Programmes. In the 1998
Comprehensive Spending Review, the Government announced funding of £450
million over the years 1999–2002 to set up 250 projects in areas with very high
concentrations of children under four living in poverty ( Sure Start Children's
Centres, 14).
Service providers in the country’s 20% most deprived wards were invited to
form partnerships, nominate lead agencies, and submit bids. The first 60 Sure
Start Local Programmes were announced in 1999, managed by a Sure Start
Unit within the then Department for Education and Employment. Expansion of
the initiative was announced in 2000, and by 2003, there were 524 centres
(National Evaluation of Sure Start Local Programmes, July 2011, n.p).
SSLPs were strategically situated in areas of high deprivation and they
represented an innovative intervention unlike almost any other aiming to
enhance the life prospects of young children in disadvantaged families and
communities. One distinguishing characteristic was that the programme was
area based, with all children under five years of age and their families living in a
prescribed area serving as the “targets” of intervention. From 2005 to 2006,
fundamental changes were made in SSLPs, as they came under the control of
Local Authorities. (The impact of Sure Start Local Programmes, 5)

29
Next, Early Excellence Centres were established in the late 1990s. They were
an innovative development for young children and their parents and carers,
bringing an integrated approach to education, day care, social support and adult
learning (Children at the Centre, 5).
Then, The Neighbourhood Nurseries Initiative was launched in 2001. It was
aimed to tackle child poverty and reduce unemployment by providing high
quality affordable childcare in deprived neighbourhoods. The original target of
45,000 new childcare places for 0-4 year olds in disadvantaged neighbourhoods
in England was achieved by August 2004, with approximately 1,400
neighbourhood nurseries in place. The intention was to offer full daycare for
children from birth to school age, ideally alongside early education and other
forms of family support such as family learning or health services (Smith,
Teresa,3).
Finally, in 2004 the creation and rollout of Sure Start Children’s Centres was
announced. The launch of the Children’s Centres ‘brand’ was intended to
rationalise and mainstream the preceding initiatives, incorporating new
approaches. All Sure Start Local Programmes, Early Excellence Centres, and
most Neighbourhood Nurseries became Sure Start Children’s Centres in the
first two phases of the rollout ( Sure Start Children's Centres, 16).

30
Sure Start Local Programmes.
Early Excellence Centres
The Neighbourhood Nurseries Initiative
Sure Start Children’s Centres
In contrast, partnerships between education and care, health services,
voluntary sector organisations and other services supporting families are at the
heart of the Children’s Centre approach and they are believed not to work well
in many places.
What’s more, in January 2011, 250 Sure Start children's centres in England
closed, 2,000 would provide a reduced service, 3,100 could have a lower
budget and staff at 1,000 centres have been issued with “at risk of redundancy”
notices ( The Guardian, 28 January 2011).
Centres have been managing to do more for less for a number of years,
meeting increased demand with greatly reduced resources. An “undercurrent
threat of closures” across the Centre network was identified in 2013 and this
trend could begin to increase; as many as 112 Centres expect to close over the
forthcoming year ( Sure Start Children's Centres Census 2014, 20).
Nevertheless, let's a look at how secondary programmes are doing .

31
1.5 Building Schools for the Future
The Department for Children, Schools and Families wanted Building Schools
for the Future Programme to improve educational attainment and the life
chances available to children by providing educational, recreational and social
environments that support modern teaching and learning methods. It wanted
the buildings to be used by local communities and to respond to developing
needs. And it wanted BSF to support local reorganisation of secondary schools
to reflect demographic needs and a greater diversity of provision (Building
Schools for the Future, 27th Report of session 2008-09,7).
The BSF was intended to renew all 3,500 English secondary schools, by
rebuilding half of them, structurally remodelling 35%, refurbishing 15% and
providing all of them with new information communication technology
equipment, at an estimated capital cost of £52–£55 billion (Parliament,
Parliamentary business).
Not only were pupils to be provided with inspirational buildings that made them
feel valued and worthwhile, but they were to be given access to new ways of
learning fit for the 21st Century. In 2004, Tony Blair announced the biggest
school building programme budget about £55bn (BBC NEWS, Education &
Family,14 June 2011).
Rebuilding numerous schools in an area, sometimes reshaping the educational
provision in the process, was a hard task to pull off and consequently by the
end of the second year of the programme, some 72 local authorities had joined
the scheme, but only five had reached the position where they could start
building ( BBC NEWS, Education & Family,14 June 2011).

32
In 2007 the programme was complemented by the announcement of a Primary
Capital Programme, with £1.9 billion to spend on 675 building projects
for primary schools in England over three years (The Guardian).
On 5 July 2010 the Secretary of State for Education, Michael Gove, announced
that following a review, the Building Schools for the Future programme was to
be scrapped. BSF projects which had not achieved the status of 'financial close'
would not proceed, meaning that 731 school revamps already signed up to the
scheme would not now go ahead. He also announced that a further 123
academy schemes were to be reviewed on a case-by-case basis ( Richardson
Hannah, BBC NEWS).
Figure 2 School building projects stopped by constituency.
Source: The Guardian. School building projects scrapped by constituency. July 2010.
As a result, more than £160m of taxpayers' money were wasted on paperwork
and preparation for new buildings ( Neha-Tamara, The Guardian).
However, There is a programme that seems to be working satisfactorily. Let's
analyse it in the following section.

33
1.6 Parent Know-How Helpline
Parent Know How was designed to provide information, help and support for
children and parents. It was funded in 2007 by the Department for Children,
Schools and Families (DCSF).It was broken down in seven different lines; they
are as follow (Hall ,3):
Advisory Centre for Education helpline (ACE) :provides free, independent
and legally accurate advice on the whole range of education issues:
school exclusions, special educational needs, school admission and
choice, bullying, attendance issues and disputes or discrimination. It
covers children in state funded education aged 5-16.
Children’s Legal Centre helpline (CLC): gives free legal advice and
information on all aspects of law and policy affecting children.
Contact a Family helpline (CAF): offers advice and information on any
aspect of caring for a disabled child. It covers all disabilities, including the
rarest conditions.
Family Rights Group helpline (FRG): supports parents and other family
members whose children are involved with, or need, social care services.
This service is a source of specialist information about families’ legal
rights and what they can expect of the social care system.
Gingerbread helpline (GB): aims to offer information and help that lone
parents can trust and to provide follow up support and advice to those
who need it.
Parentline Plus helpline (PLP) : gives immediate help via a helpline to
parents from a volunteer parent support worker 24 hours a day, seven
34
days a week. They offer support on a wide range of issues, from
problems coping with babies and toddlers, to teenage issues such as
anti-social or risky behaviour, as well as bullying, discipline and the
impact of divorce.
Young Minds helpline (YM): provides help to anyone who has concerns
about a child or young person’s mental health or emotional wellbeing.
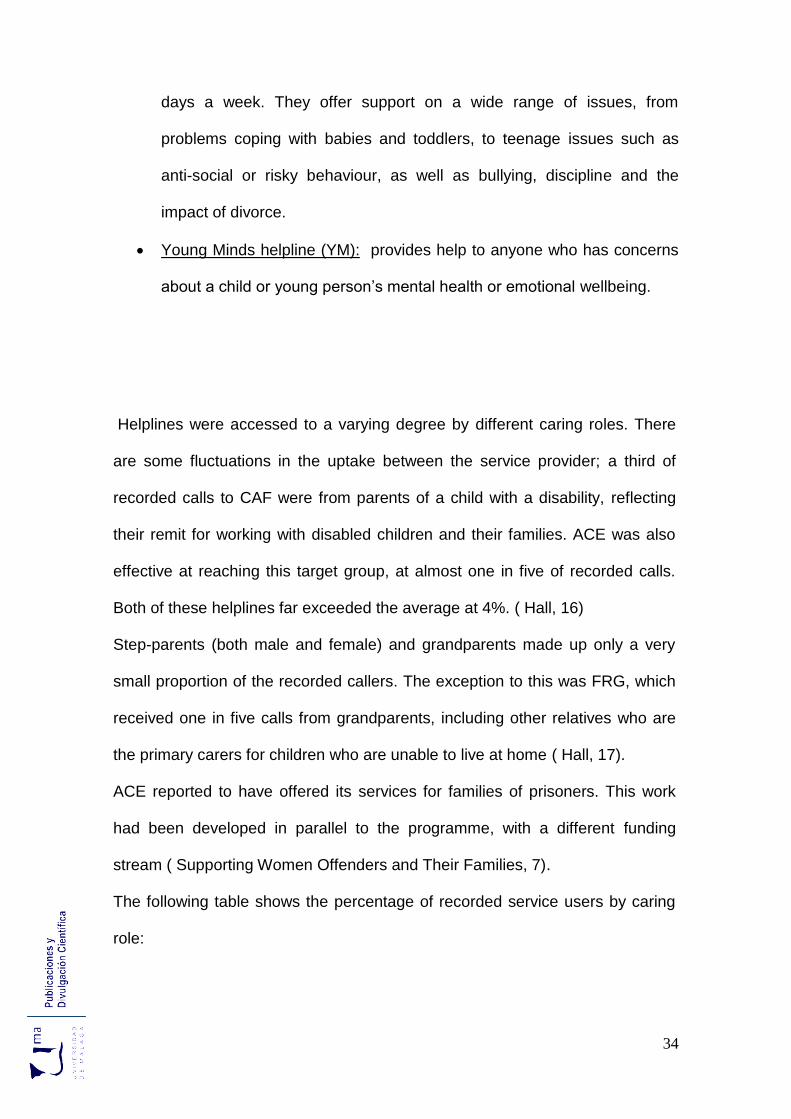
Helplines were accessed to a varying degree by different caring roles. There
are some fluctuations in the uptake between the service provider; a third of
recorded calls to CAF were from parents of a child with a disability, reflecting
their remit for working with disabled children and their families. ACE was also
effective at reaching this target group, at almost one in five of recorded calls.
Both of these helplines far exceeded the average at 4%. ( Hall, 16)
Step-parents (both male and female) and grandparents made up only a very
small proportion of the recorded callers. The exception to this was FRG, which
received one in five calls from grandparents, including other relatives who are
the primary carers for children who are unable to live at home ( Hall, 17).
ACE reported to have offered its services for families of prisoners. This work
had been developed in parallel to the programme, with a different funding
stream ( Supporting Women Offenders and Their Families, 7).
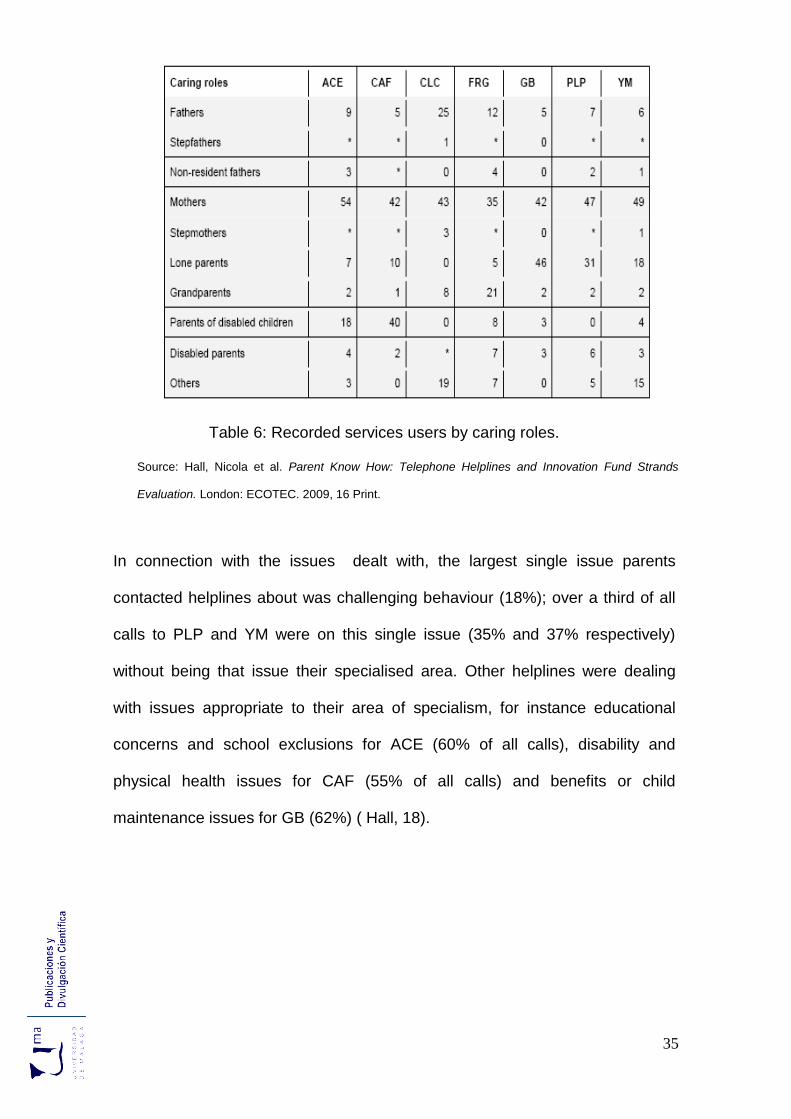
The following table shows the percentage of recorded service users by caring
role:
35
Table 6: Recorded services users by caring roles.
Source: Hall, Nicola et al. Parent Know How: Telephone Helplines and Innovation Fund Strands
Evaluation. London: ECOTEC. 2009, 16 Print.
In connection with the issues dealt with, the largest single issue parents
contacted helplines about was challenging behaviour (18%); over a third of all
calls to PLP and YM were on this single issue (35% and 37% respectively)
without being that issue their specialised area. Other helplines were dealing
with issues appropriate to their area of specialism, for instance educational
concerns and school exclusions for ACE (60% of all calls), disability and
physical health issues for CAF (55% of all calls) and benefits or child
maintenance issues for GB (62%) ( Hall, 18).

36
Figure 3: Issues more demanded in the helplines.
Source: Hall, Nicola et al. Parent Know How: Telephone Helplines and Innovation Fund Strands
Evaluation. London: ECOTEC. 2009, 18 .Print.
Finally, the satisfaction of the users indicated that 47% were satisfied with their
experience of the service and around 7% were very dissatisfied as the figure 4
shows.
Figure 4: Satisfaction with the helpline year 2008.
Source: Hall, Nicola et al. Parent Know How: Telephone Helplines and Innovation Fund Strands
Evaluation. London: ECOTEC. 2009, 37.Print.
It cannot be forgotten that apart from helplines, there are three more channels
within Parents Know How programme: Innovation fund, syndicated print
content and online directory parenting services.

37
1.7 Conclusion
As it can be understood throughout this chapter, the British government is
seriously concerned with everything connected to its younger generations of
citizens.
Tajfel stated that social identity ‘‘is a part of an individual’s self concept which
derives from his knowledge of his membership of a social group (or groups)
together with the emotional significance attached to that membership" ( Nezlek,
2007: 244). Thus, all programmes ,developed in the last years , are aimed to
comprehend the new features and difficulties of the British-born children who
will be the leaders of the future.
Children and young people spend many hours at school and it is there where all
efforts have to be carried out in order to provide a sensible frame of identity
plus reasonable labour advice.

38

39
Chapter 2: The National Curriculum
Different approaches on the learning process have been developed throughout
time; three learning theories can be regarded as the three main pillars of the
creation and following amendments of the National Curriculum.
Cognitivism focuses on the inner mental activities; mental processes such as
thinking, memory knowing and problem-solving need to be explored and
understood; Humanism believes that it is necessary to study the person as a
whole, especially as an individual grows and develops over the lifespan and
finally 21st Century Skills which supports the idea that digital literacy, traditional
literacy, content knowledge, media literacy and learning skills are essential to
experience school and life success in an increasingly digital and connected age
(Learning-Theories.com).
Let's have a glimpse at how the National Curriculum has been modified in order
to take the best advantage in the learning process for the industry's sake.
2.1 Introduction In 1976, James Callaghan, then Labour Prime Minister, in a speech at Ruskin
College , Oxford University, related the country's economic decline to a decline
of education standards (Smith, H ,2014: 36). Nigel Lawson, then Chancellor of
the Exchequer, was heavily influenced by the idea that the decline in British
power during the 20th century was due to the failure of education
(Whetton,2009 : 139 ).

40
Following the 1988 Education Reform Act, Mr Kenneth Baker, secretary of
state for Education and Science, introduced the National Curriculum into the
United Kingdom as a nationwide curriculum for primary and secondary state
schools .He stated in December 1987:
Raising the quality of education in our schools is the most important task
for this Parliament.[...] .It was a previous Conservative Prime Minister,
Disraeli, who said, speaking in this House in 1874: Upon the education of
the people of this country the fate of this country depends. Our education
system has operated over the past 40 years on the basis of the
framework laid down by Rob Butler's 1944 Act, which in turn built on
the Balfour Act of 1902. It has not proved sensitive to the demands
for change that have become ever more urgent over the past 10 years.
. ( Education Reform Bill 1987 , vol 123, 771)
The government promoted the centralization and control of education, together
with managerial and market models of organization. It had also alienated
teachers and removed the historic partnership between government, local
authorities and teachers ( Tomlinson, 45).
The educational policies were drawn up to reinstate selection and move away
from a comprehensive system. This meant a continuation of an academic-
vocational divide and aimed to maximize class advantage for some groups
while minimizing the prospects for groups already disadvantaged. The
competitive market between schools was about to exacerbate this.

41
The 1988 Education “Reform” Act was the most important Education Act since
1944. The Act, sometimes referred as The Baker Act, after secretary of state
Kenneth Baker, was about individualism, entrepreneurism and competitiveness,
achieved through bringing education into the marketplace by consumer choice.
The major feature was the parental rights to choose schools and financial
management of budgets by schools. LEAs could no longer fix admission limits
and schools were to publish examination results. This was intended to ensure
that popular schools would expand and unpopular schools close. Thus, the Act
was to punish the teacher unions, kill off LEAs and wipe out comprehensive
schools by stealth (Tomlinson, 52).
The main sections in the 1988 Education Act are as follows ( Tomlinson, 55):
National Curriculum and assessment. All maintained schools to
provide a broad and balanced curriculum for pupils 5-16 which
includes the National Curriculum (NC) and religious; attainment
targets, programmes of study and assessment. Information on the
curriculum and assessment.
Open enrolment .School admission procedures changed to
ensure that schools enroll pupils up to a relevant standard number.
LEAs or governors could fix higher limits.
Local management of schools. Schools to be delegated their
total budget through a formula worked out by each LEA and
approved by the secretary of state. Governors given powers to
manage the school budget and hire staff.

42
Grant-maintained schools financed directly by central
government; parents' right to be held to decide whether the school
should opt out of LEA control.
City technology colleges. The secretary of state to be given
powers to enter agreement with sponsors of CTCs and colleges for
arts and technology.
Higher and further education. Polytechnics and some large
colleges of higher education removed from local authority control. A
Universities Funding Council and a Polytechnic and Colleges
Funding Council set up.
Abolition of ILEA. The Inner London Education Authority to be
abolished by April 1990 and local control of education to pass to
twelve new LEAs and the City of London.
Miscellaneous. A number of other provisions included a
redefinition of free education to payment for school extras were
clarified and permission given for voluntary contributions to schools.
In the three years following the Act an avalanche of curriculum documentation,
guidance, circulars and regulations descended on primary and secondary
schools. Schools were overwhelmed by these powerful accountability
measures, even when a curriculum was to be flexible, slippage toward a

43
standardized homogeneous curriculum was inevitable (Smith,H.,2014:36).
Teachers were forced to put in place market-oriented strategies; high levels of
stress and illness, lower teacher morale, early retirement and recruitment
problems were the levers for the loss of prestige for teaching posts during the
1990s (Tomlinson, 62).
From the 1990s onwards, the different educational bills have dramatically
downgraded teaching; all of them have been developed from the 1988
Educational Reform. All this took place through an array of policies, acts,
strategies and services; some of them will be developed in the following pages.
The Structure of the School Curriculum.
Primary Curriculum.
Secondary Curriculum.
National Curriculum Review Delayed.

44
2.2 The Structure of the School Curriculum
In the 1988 Education Reform Act, it is established by law that there should be
a national curriculum and provided that, as an integral element of this, there
should be " arrangements for assessing pupils at or near the end of each key
stage for the purpose of ascertaining what they have achieved in relation to the
attainment targets for that stage" ( "Education Reform Act",1 2:2).
The school curriculum is the sum of the National, Basic and Local curricula.
This is illustrated in the following diagram.
Figure 1: The School Curriculum.
Source: The Framework for the National Curriculum. N.p: DfE, 2009. 18.Print.
The National Curriculum put forth two basic aims. "The school curriculum
should aim to provide opportunities pupils to learn and to achieve" ("The
National Curriculum 200"4,10) plus " promote pupils' spiritual, moral, social and
cultural development and prepare all pupils for the opportunities, responsibilities
and experiences of life" ("The National Curriculum 2004",11). It makes clear
that these two aims reinforce each other. Development in both areas is
essential to raising standards of attainment for all pupils ("The National
Curriculum 2004",12).
However, the implementation of the aims seems to be a hard task. Schools
subjects are grouped in two categories; statutory subjects which teachers are

45
legally bound to enforce by law and non-statutory subjects which teach if they
can afford the time to do so (Chatzifotiou,2002:290) . In other words, the
statutory part of the curriculum is interested in promoting information-based
knowledge (traditional subjects), while the non-statutory part in value-based
issues (spiritual, cultural, social and moral subjects).
The Basic Curriculum describes the statuary requirements for curricular
provision in addition to the National Curriculum. These are compulsory
requirements but schools are able to determine for themselves the specific
nature of this provision. Schools are currently free to complement the National
and the Basic Curricula with other curricular elements that are determined at
school or community level. Local Curriculum is termed to describe this
additional part of the school curriculum. The table below summarises the
different parts of the school curriculum.
Table 1 : Different parts of the School Curriculum.
Source: The Framework for the National Curriculum. N.p: DfE, 2009. 19.Print.
46
On top of that , the ample array of terminology to refer to the school subjects is
endless .There is not a very clear distinction between core subjects, non-core
subjects, foundation subjects and other compulsory requirements; according to
Tim Oates, expert panel chair of the 2011 National Curriculum review, core
subjects should be specified for each key stage through detailed Programmes
of Study and Attainment Targets and foundation subjects should be specified
for each relevant key stage through significant but refined and condensed
specifications (20). Nevertheless, the NC ensures that pupil's acquisition of
knowledge is monitored at every step and that all pupils are receiving that
knowledge; thus, it gives priority to statutory subjects (Chatzifotiou.,2002: 294);
due to the fact that pupils are regarded as future workers and citizens who need
to deal with the " continued globalisation of the economy and society, with new
work and leisure patterns and with the rapid expansion of communication
technology" ("The National Curriculum 2004",10).
2.3 Primary Curriculum
The National Curriculum determines the content of what will be taught, and sets
attainment targets for learning as well as it gives teachers, pupils, parents,
employers and their wider community a clear and shared understanding of the
skills and knowledge that young people will gain at school. ("The National
Curriculum 2004", 3)
However, historian Richard Aldrich claimed that the 1988 National Curriculum
was little different from its 1904 Board of Education predecessor. In figure 1, the

47
1904 regulations are included plus the curriculum specified in the 1967 Plowden
report as well as the National Curriculum as it stood in 2009 (Alexander,12).
Table 2 : National Curriculum throughout time.
Source: Alexander , R J .Towards a new Primary Curriculum. Cambridge: U of Cambridge, 2009. 13.Print
The overprescription and overcrowded content of the National Curriculum is
also underlined as a real setback ("Independent Review of the Primary
Curriculum",37). "The National Curriculum acted as a straitjacket, not a
framework" (Cowley,1998:81). Besides, teachers faced with not only the
pressures of league tables but also with the competition for places as a
consequence of parental choice, leaving them with insufficient time to enable
children to engage adequately with subjects required by law (Cowley, 1998: 82).
With such a concern, there was a widespread support from schools for a
revised primary curriculum. Also, continuity and progression in learning from the
age 5 to 11 was a focus for the worthwhile knowledge, skills and understanding
for a broad and balanced education ("Independent Review of Primary

48
Curriculum",39); in addition, schools to be successful were to have a flexibility
model rather than an overprescriptive one providing national curricula
guidelines with localized interpretation and implementation( Cowley,1998:91).
Six areas of learning, English communication and language, Mathematics,
Science and Technology, History and Geography, Arts and Physical
Development, Health and Wellbeing, as figure 2 depicts, was strongly
recommended, which would provide powerful opportunities for children to use
and apply their knowledge and skills across subjects. In this manner, rather
than delaying the start of subjects in the curriculum, there were groupings
closely related subjects into areas of learning and reducing the amount of
prescribed content ( "Independent Review of the Primary Curriculum", 16).
Figure 2: Framework for the primary curriculum. Final Report.2009.
Source: Independent Review of the Primary Curriculum. Nottingham: DCSF Publications, 2009.46 Print.
With similar concern for mood and dynamics rather than structure, others
argued that the standards drive had turned children off school learning and
the fun and excitement should be injected into the curriculum to ward off
disengagement (Alexander, 40). In this sense, a very controversial Student-

49
centred curriculum integration appeared; students were to be involved in
classroom decisions and curriculum planning (Brough,2012:345). On the
other hand, within the subject-centred model, the concern with literacy and
numeracy was brought up. The National Literacy Strategy, NLS was
incorporated into the Primary National Strategy as a means of raising
standards ( Beard , 5).What’s more, the curricular progression set out for the
early primary phase builds on prior learning and experience from the Early
Years Foundation Stages (EYFS). This would provide children with a
smoother transition from the EYFS areas of learning and development to a
primary curriculum also based on the six areas of learning. In figure 3,a
curricular progression from 0 to14 is shown ( "Independent Review", 43).
Figure 3: The independent review. Final Report.2009.
Source: Independent Review of the Primary Curriculum. Nottingham: DCSF Publications, 2009.45 Print.
In November 2011, the Secretary of State for Education, Michael Gove,
announced a major review of the National Curriculum in England. He said:
50
We have sunk in international league tables and the National Curriculum is
substandard. Meanwhile the pace of economic and technological change is
accelerating and our children are being left behind. The previous curriculum
failed to prepare us for the future. We must change course. Our review will
examine the best school systems in the world and give us a world-class
curriculum that will help teachers, parents and children know what children
should learn at what age ("National Curriculum Review Launch", Nov
2011,Press release).
The Government’s ambition was to reduce unnecessary prescription,
bureaucracy and central control throughout the education system meaning
taking a new approach to the curriculum. (National Curriculum Review Launch,
Nov 2011,Press release). The implemented curriculum, the process of teaching
as interpreted by its users plus the attained curriculum, the learning experiences
by learners, broke in ( De Groot-Reuvekamp, 2014: 489). Thus, the National
Curriculum is to allow teachers to decide how to teach in the most effective
manner the essential knowledge all children should acquire and to design a
wider school curriculum that best meets the needs of their pupils.
Therefore, the current syllabus at primary school is the following: Literacy and
Maths, which are currently compulsory including Science, Design and
Technology (ICT),History , Geography, Art and Design, one Modern Language.
Music, Physical Education, Religious Education (parents have the right to
withdraw children from these lessons if they choose).In addition, schools are
encouraged to teach: PSHE (personal, social and health education),
Citizenship, Sex education - every primary school must have a written policy on

51
this available to parents and pupils; also parents can withdraw their children
from sex education classes if they choose (BBC Schools).
Consequently, it can be comprehended that Equality of opportunity is one of a
broad set of common values and purposes which underpin the school
curriculum and the work of schools ( "The National Curriculum", 4).
2.4 Secondary Curriculum
The relevance of the curriculum in preparing young people for their adult lives is
supported by the idea of "promoting freedom and independence of thought, of
enrichment of the life of every individual in a society, regardless of class, race or
creed" ( Byrne ,2004: 336).
Taking the Primary Curriculum as a resource, a new set of aim was the starting
point for all the changes to the secondary curriculum, which should enable all
young people to become: ("Primary Curriculum Review", 3)
Successful learners who enjoy learning, make progress and achieve.
Confident individuals who are able to live safe, healthy and fulfilling lives.
Responsible citizens who make a positive contribution to society.
The reform is aimed at changing the way the 14 to 19-year-old students learn.
The concept of competence-based curricula (CBC) appeared as the best tool to
prepare all students for the constant changes of human knowledge and
understanding ( Byrne,2004: 338). Advocates of such a curriculum considered
abroad and enlightened education as essential element of students' experience
to prepare them for the modern workplace (Downey,2012: 327).Hence, the

52
curriculum should have twofold objectives, maintaining the level of challenge in
order to continue to raise the standards and providing opportunity for schools to
personalise learning to meet individual pupil needs (BBC-Schools).
On the one hand, lifelong learning opportunities are to be offered to teachers as
well as to students and "learning to learn" is viewed as vital for learner
autonomy, since it enables learners to identify "where they are in the learning,
where they are going and how they will get there" ( Harris ,2008:256).
Furthermore, " the government is also committed to slimming down the National
Curriculum so that it properly reflects the body of essential knowledge which all
pupils should learn" ("Review of the NC in England 2011", 5).
The issue of skill shortage is constantly highlighted; a decline in
competitiveness and a diminished economic growth would take place if skills
weren’t increased by 2020 ("World Class Skills", 14). "The government wants to
avoid prescribing pedagogy through the National Curriculum so that teachers
are given greater professional freedom over how they teach their
pupils"("Review of the NC in England 2011", 5).
As a consequence the new programmes of study lay out in a common format,
which makes it easier to share key concepts and develop opportunities for the
following cross-curricular dimensions: Healthy lifestyles, Enterprise, Global
dimension, Sustainable development, Identity and cultural diversity, Community
participation, Technology and the media and Creativity and critical thinking.
Children are taught the same subjects as at primary school, plus a modern
foreign language and Citizenship plus new Diplomas and alternative route to
GCSEs and A levels are central to the 14 to 19 reforms (BBC-Schools).

53
The Secondary curriculum review is an important step in modernising the
curriculum for children aged 11 and above.
2.5 National Curriculum Review
The new curriculum for all subjects was introduced in 2014. Teachers are
expected to be assessment literate but assessment literacy is a complex and
multi-faceted concept (Poskitt ,2014:542);criterion-referenced as well as norm-
referenced assessment were left behind for more pragmatic goals. Both
formative and summative assessments were chosen for a period but the
government recommendations focused on a return to non-referenced
assessment for summative assessment purposes; in other words, a statistical
approach to maintain the proportion of awarded candidates within a formal
progress of the pupil ( NFER,2-3).
National curriculum standards have been designed so that most pupils will
progress by approximately one level every two years. The tests are designed to
show what pupils have achieved in selected parts of a subject at the end of
each key stage. In 2014, there were statutory externally marked tests.
( Middlemas, 2).
Let's analyse some statistics at key stage 2.There have been improvements in
attainment in reading, writing and mathematics combined at all levels in 2014.
Attainment at level 4 or above increased by 31 percentage points to 79% and at
level 4b or above by 4 percentage points to 67%. The improvement in
attainment at level 5 or above was slightly less – an increase of 2 percentage
points to 24%.( Middlemas, 3).

54
Table 3: Attainment in reading, writing and mathematics.
Source: Middlemas, Jayme.National Curriculum Assessment at key stage 2 in England, 2014. DfE, 3. Print.
The improvement of the attainment for both boys and girls is revealed in figure
4 and the gender gap at level 4 or above has narrowed slightly from 7
percentage points to 6 percentage points. The gender gaps for higher
attainment remain unchanged at 4 (level 4b or above) and 7 (level 5 or above)
percentage points.
Girls continue to outperform boys at all levels - 82% achieved level 4 or above
compared to 76% of boys, 69% achieved level 4b or above compared to 65% of
boys and 27% of girls achieved level 5 or above compared to 20% of boys.

55
Figure 4: Attainment in reading, writing and mathematics.
Source: Middlemas, Jayme, National Curriculum Assessment at key stage 2 in England, 2014. DfE,6.Print.
Yet, as part of the reforms to the national curriculum, the current system of
‘levels’ used to report children’s attainment and progress will be removed from
September 2014 and will not be replaced. By removing levels teachers are
allowed to have greater flexibility in the way that they plan and assess pupils’
learning ( NC and assessment from September 2014:information for schools).
The national curriculum tests and teacher assessment at the end of key stages
1 and 2 will be reported in levels for the last time in summer 2015, as pupils in
Year 2 and Year 6 that year will not have been taught the new national
curriculum; better explanation in table 4.
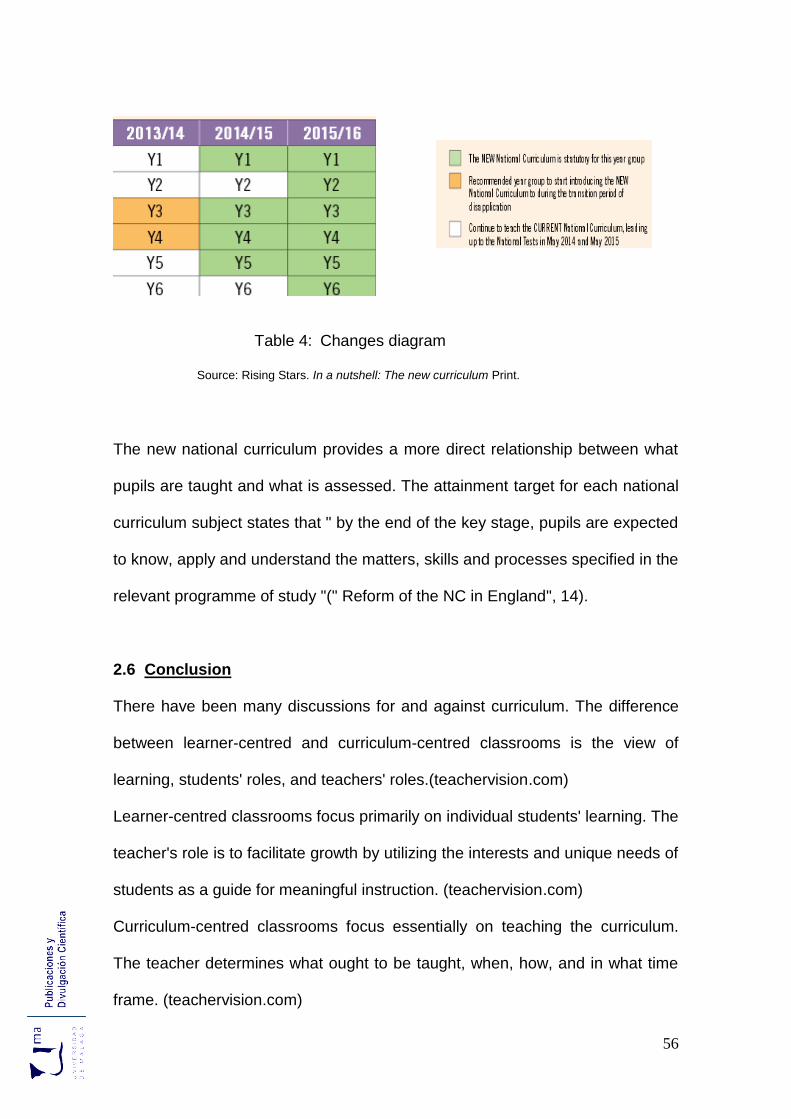
56
Table 4: Changes diagram
Source: Rising Stars. In a nutshell: The new curriculum Print.
The new national curriculum provides a more direct relationship between what
pupils are taught and what is assessed. The attainment target for each national
curriculum subject states that " by the end of the key stage, pupils are expected
to know, apply and understand the matters, skills and processes specified in the
relevant programme of study "(" Reform of the NC in England", 14).
2.6 Conclusion
There have been many discussions for and against curriculum. The difference
between learner-centred and curriculum-centred classrooms is the view of
learning, students' roles, and teachers' roles.(teachervision.com)
Learner-centred classrooms focus primarily on individual students' learning. The
teacher's role is to facilitate growth by utilizing the interests and unique needs of
students as a guide for meaningful instruction. (teachervision.com)
Curriculum-centred classrooms focus essentially on teaching the curriculum.
The teacher determines what ought to be taught, when, how, and in what time
frame. (teachervision.com)

57
Nevertheless, many teachers fall somewhere in the middle of this continuum.
They are neither strictly learner-centred nor only curriculum-centred. Teachers
use what works for them based on their fundamental belief structures.
The objective of the National Curriculum is to be the agenda for teaching and
learning in schools. It also sets standards for each subject, outlining targets that
children should be encouraged to achieve. Additionally, the National
Curriculum determines the assessment methods that are used to measure
children’s progress. The UK government is determined to hold up National
Curriculum as learning and teaching guide.

58

59
Chapter 3: Vocational Training
Economic success depends on the supply and utilisation of well-trained
employees. Young people depend on the quality of training to prepare them for
work and responsible adulthood. Vocational training Education was created in
order to give a chance to those non-academic students who were lost in the
traditional learning process; in doing so , this potential workforce could find its
place in the labour market.
Qualifications achieved at school are increasingly supplemented by further
education and job-related training to equip people with the skills required by a
modern labour market ( 21st Century Challenges.com)
UK public expenditure on education and training has doubled in real terms over
the last 24 year ; from £43 billion in 1987/88 to a planned spend of £87 billion in
2010/11 (Barnes, 5).
Let's have an insight of the vocational training education in the UK.
3.1 Introduction
Since Prince Albert established the Royal Commission in 1851 policy-makers
have struggled to provide young people with a proper technical and practical
education; the first system of vocational education initially developed
independently of the government, with bodies such as the Royal Society of Arts
and City & Guilds setting examinations for technical subjects. ( "The Wolf
Report", 4)
As the future prosperity of a country depends on building an advanced economy
founded on high-level technical skills, no young people should be in education

60
or training programme which denies them the chance to progress. The
Education Act 1944 was the first to contribute to the spiritual, moral and
physical development of the community playing emphasis on preparing
students for adult and working life and on providing a skilled workforce (4).
Ironically, education and training have been heavily segregated along gender
lines, usually in favour of boys and young men. The 1975 Sex Discrimination
Act marked an end to support for the traditional and male-oriented patterns and
practices within employment and education ("The Curriculum Journal",1999:
209). The Business and Technology Education Council was founded to confer
further and higher education awards, particularly to further education colleges in
the United Kingdom. In the following decade, in 1986, the Working Group
consultancy reported the Review of Vocational Qualifications as a
recommendation to introduce National Vocational Qualifications (NVQs) in order
to address weaknesses in the then current system. The Equal Opportunities
Commission engaged in a range of curriculum development work to build
equality into all teaching and learning opportunities. ("The Curriculum
Journal",1999: 210).
The solution proposed was that a clear, coherent and comprehensive system
was to be relevant to the needs of employment and thus the national vocational
qualifications should mirror as: "statement of competence clearly relevant to
work and intended to facilitate entry, or progression in, employment, further
learning" ( Cloonan, 55).
As an outcome, the publication of the 1986 White Paper Working Together:
Education and Training caused the set-up of the National Council for Vocational

61
Qualifications (NCVQ). It tried to ensure that the transition across the school-
work interface provided accessible and appropriate routeways for each
individual, irrespective of their gender ("The Curriculum Journal",1999: 212).
Figure 1: Employees' job-related training: by sex and occupation, 2010.
Source: Barnes, Louise. Education and Training: Social Trends 41. N S: South Wales, 2011.20 .Print
Figure 1 shows that training varies by occupation. The proportions receiving
training are lower for those in skilled trades, working with process plant and
machines and in elementary occupations. In 2010,men were more likely than
women to have had training in sales and customer services (13.8 per cent
compared with 9.7 per cent) and in administrative and secretarial occupations
(11.8 per cent compared with 9.1 per cent). More than one in five women (23.1
per cent) in professional and associate professional and technical occupations
(21.2 per cent) had received job-related training (Barnes, 21).

62
In parallel, the Industry Training Organisations were funded. Its main objective
was to evolve the occupational standards, working alongside with the
Qualifications and Credit Framework. Both underlined the importance of
employers’ criteria in the design of the qualifications so as to produce a more
appropriately skilled workforce (Businessball.com).
Besides, the workforce has to adapt itself to the different economic and social
trends due to the constant change of the labour market. The Labour Force
Survey table below shows how different the market needs were in 2001 and
2009 and thus the preparation of the employees.
Figure 2:Occupational shift.2001-2009.
Source: Office for National Statistics. < http://www.ons.gov.uk/>.
In order to promote equality and a better adaptation to labour market needs
,some of the policies, acts, strategies and services will be developed in the
following pages.
The Structure of NVQs.
Apprenticeships.
Train to Gain.
Achievements.

63
3.2 Structure of NVQs
Nowadays, there is no formal definition of “vocational education” in England. In
terms of structures of education and training systems, the National Curriculum
does not apply in post-compulsory education. Students choose courses of study
from the range offered by the school or further education college.
However, no one can predict the precise nature of employment opportunities
likely to be on offer at any one time. As a result, it is not clear the form a
vocational preparation should take (Halliday,2010: 160). Vocational education
has been subject to rapid and repeated change over the years and an
increasingly wide range of academic and vocational qualification is available.
The most important ones are as follows ( Wenchap, 10) :
GCEs or A-levels in applied subjects: are intended to offer a
preparation for employment as well as a route to higher-level
qualifications.
Diplomas: combining theoretical study with experience There are
available at three different levels: Foundation (equivalent to three
GCSEs), Higher (equivalent to seven GCSEs) and Advanced (equivalent
to three and a half A-levels)
Key skills qualifications are available in the individual key skills of
communication, application of number and information technology.
National Vocational Qualifications (NVQs) enable students as well as
employees to gain recognized qualifications for specific occupations.
They recognize work-based competences.

64
Apprenticeship programmes are the schemes for young people. There
are at several different levels:
Young Apprenticeships (YAs) for 14 to 16-year-olds provide an
opportunity to send students up to two days a week in the workplace.
Entry to Employment (E2E or Pre-Apprenticeships) for young people
aged 16 to 18,to prepare them for apprenticeships and employment.
Apprenticeships are a work-based training option for young people and
employers and are based on NVQs.
Advanced Apprenticeships are largely intended for school leavers aged
16+ but are also open to more mature trainees. Most advanced modern
apprentices have employed status and are paid a salary by their
employer
The following table provides a useful view of NVQs compared to other
qualifications.
Table 1 : NVQ correlations.
Source: Health Impacts of Education Rewiew. IPH:2008,11.Print.

65
But the worst fear was the uncontrolled situation of too many children leaving
school too early and unskilled causing a very high youth unemployment among
14-19 year olds due to the fact that employers value the right skills for the
workplace rather than the knowledge acquired in the classroom (Vignoles, 10-
12).
In order to shift the situation, there are two major policies in relation to attempts
to raise participation in post-compulsory schooling. The first is the qualification
reform designed to enhance the attractiveness and labour market value of
vocational qualifications. The second was the introduction of an Education
Maintenance Allowance (EMA).
Figure 3: Study of Young People studying NVQs in England.
Source: Skills for Sustainable Growth.Full Report.BIS.2010,30.Print

66
Figure 3 shows the proportion of young people studying vocational
qualifications by socio-economic background. Those at 16, higher professional
background students represent 6 per cent in contrast with lower supervisory
students which are 13 per cent , being the latter the maximum expression at
this age. At 17, higher professional background again represent the lowest
percentage , 8 per cent, meanwhile lower supervisory students are the highest
percentage, 18 per cent. At 18, the highest percentage is on lower
supervisory students, 27 per cent, meanwhile lower professional background
students are the lowest percentage, 18 per cent.
What’s more, the EMA scheme was closed to new applicants on 1 January
2011. The 16-19 Bursary Fund replaced it. It is new scheme intended to help
the most vulnerable 16-19 year olds in full-time education. The scheme is made
up of two parts: a payment of £1,200 to the most vulnerable young people
(young people in care, care leavers, in receipt of Income Support, in receipt of
both Disability Living Allowance and Employment Support Allowance); and a
discretionary fund directly to providers or to the local authority ("The 16-19
Bursary", 4).
On top of that, Raising the Participation Age (RPA) came into effect from
summer 2013. The law has changed to increase the age at which students are
required to participate in education or training; if a student is in Year 10, he/she
will have to continue in education or training until the end of the school year in
which he/she turns 17 and If he/she is in Year 9 or below, he/she will have to
continue until his/her 18th birthday (" Important information for Parents leaflet").

67
3.3 Apprenticeships
Apprenticeships can offer a highly valuable and valued pathway into
employment. Major efforts have been made to increase numbers in recent
years, after a steep decline in the 1980s ( "The Wolf Report", 26).The emphasis
on providing a skilled workforce was underlined in the Leitch Review of Skills; it
stated the need to raise skills levels and recommended increasing adult skills
at all levels, and strengthening employers’ and investment in skills (3).
Additionally, there has been a commitment to improve the quality of
apprenticeships and the volume of training since the introduction of the
Apprenticeship, Skills, Children and Learning Act in 2010 ( Gambin, 2015 :22).
Figure 4: Apprenticeships by age groupings
Source: The Wolf Report. 164.Print
Numbers have grown, but it is proving much more difficult to find openings for
young people than for older apprentices. Consequently, an estimate of 2.5
million people are trapped in a cycle of low-skilled, poorly-paid, often short-term

68
employment with few training opportunities and dependence on public support.
Many of those who are registered as unemployed frequently move between
work and claiming benefits and lone parents need more help to acquire the
skills they need to get into and get on in work (" World Class Skills",22).
Logically, those without qualification are far more likely to be out of the labour
market. As figure 4 below shows, 75 per cent of those with a level 2 qualification
(equivalent to 5 GCSEs) are in employment compared with under half of those
with no qualifications; 77 per cent of those with a level 3 qualification (equivalent
to two A levels) find a job in contrast with those with a level 4 and above
qualification (equivalent to a certificate in higher education, foundation degree
or honours degree) who reach 86 per cent and 89 per cent respectively.
Figure 5: Employment rate by highest level of qualification
Source: World Class Skills. DIUS. 2006,23.Print.

69
However, the major issue in Apprenticeships affects completion rates since the
introduction of minimum levels of performance, MLP, in the early 2000s.The
factors for dropping out are as follows (Gambin,2015, 19):
Poor provision of training.
Badly paid training.
Apprentices' personal circumstances.
The implications of non-completion are significant. For non-completers, it results
on lower skill acquisition, preventing individuals from working in particular
sectors or sends a negative signal to potential employers. For employers , they
lose their investment in the apprentice incurring further recruitment costs to
replace an apprentice and they experience skills shortages as a result of
dropping out ( Gambin,2015:13).
Thus, the next few years will be of critical importance as to whether
Apprenticeships can become an attractive vocational alternative to the
academic pathway. There is a need to deliver high-quality learning and training
providing apprentices with the chance to progress to higher levels of education
and training leading to the disappearance of the stigma attached to it of being
regarded as a second-best alternative to the academic pathway ( Hogarth,2011:
46).

70
3.4 Train to Gain The Train to Gain service was introduced in April 2006 to support employers in
improving the skills of their employees, and to contribute to improved business
performance. It sought to encourage private investment in training by fully
funding lower level qualifications to give individuals the skills they needed to be
employable, personally fulfilled and able to progress to higher level learning that
employers may be more willing to fund. It comprised ( 13):
A skills brokerage service to advise employers on identifying training
needs and sourcing training.
Flexible training, for example delivered in the workplace and at a
convenient time
Full public funding of training for eligible employees taking specified
courses and qualifications, and contributions to some other training paid
for by employers.
The Department for Business, Innovation and Skills had the responsibility for
the further education and skills sector and for the strategy and policy design of
Train to Gain. However, a joint Policy and Performance Board managed its
performance and strategic directions meanwhile a joint Executive Group was
responsible for meeting objectives and targets (22).
Figure 9 illustrates the two main routes for employer contacts with the
programme. It is derived from National Audit Office table
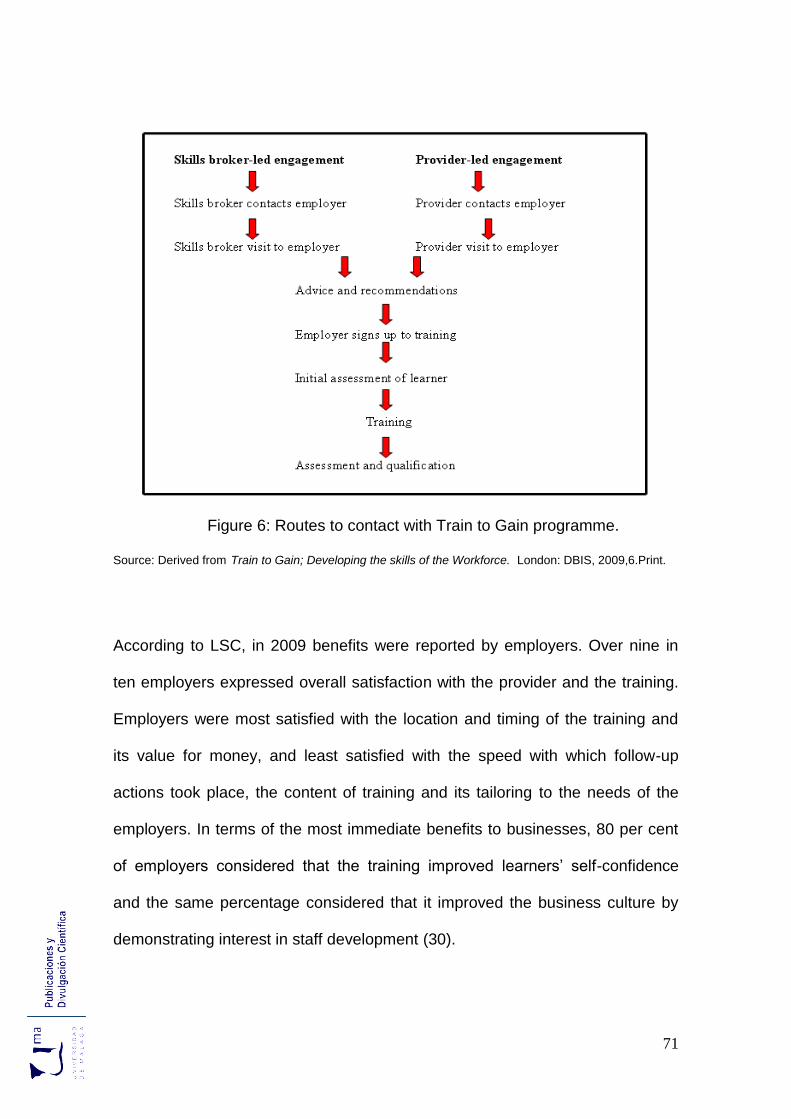
71
Figure 6: Routes to contact with Train to Gain programme.
Source: Derived from Train to Gain; Developing the skills of the Workforce. London: DBIS, 2009,6.Print.
According to LSC, in 2009 benefits were reported by employers. Over nine in
ten employers expressed overall satisfaction with the provider and the training.
Employers were most satisfied with the location and timing of the training and
its value for money, and least satisfied with the speed with which follow-up
actions took place, the content of training and its tailoring to the needs of the
employers. In terms of the most immediate benefits to businesses, 80 per cent
of employers considered that the training improved learners’ self-confidence
and the same percentage considered that it improved the business culture by
demonstrating interest in staff development (30).

72
Figure 7: Business benefits of Train to Gain.
Source: Train to Gain; Developing the skills of the Workforce. London: DBIS, 2009,22.Print.
In connection with learners, gaining a qualification was very important to them.
76 per cent of new learners plus 72 per cent of “old” learners were extremely or
very satisfied with the quality of the training overall. They also benefited through
improved work, self-confidence, attitude and self-esteem.
Unfortunately, after the success and the benefits produced by the programme,
the government announced on 24 May 2010 a £200 million reduction in this
programme as part of its planned £6.2 billion reduction in expenditure in the
2010-11 government financial year ( The Guardian), making the likelihood of
achieving the 2020 target of 400,000 apprenticeship places in England an
impossibility ( Trainingzone.co.uk).

73
3.5 Achievements
The Office of Qualifications and Examinations Regulation (Ofqual), which is a
non-ministerial government department that regulates qualifications, exams and
tests, covers all National Vocational Qualifications (NVQ), Vocationally Related
qualifications (VRQ), Qualifications and Credit Framework (QCF) qualifications,
and Operational qualifications (OQ), at all levels ( GOV.UK)
3.5.1 NVQs The NVQs are work-related, competence-based qualifications which cover a
broad range of occupations and are delivered in a workplace setting. NVQs are
made up of units taken from the National Occupational Standards (NOS), which
define the knowledge, understanding and competence required to perform a
particular job. The standards for NVQs are designed and set by the appropriate
sector skills council or sector body ( "Statistics Bulletin", 11).
From July to September 2011, 124,250 NVQ achievements were recorded at
all levels meaning a decrease of 64 per cent, which partly reflects the
restructuring of some qualifications. These achievements covered 911 different
qualifications ("Statistics Bulletin", 2).
In terms of Subject Sector Area (SSA), Health, Public services and Care
recorded the highest number of achievements, with 38,850 achievements,
representing 31 per cent. The second largest area was engineering and
manufacturing technologies with 35,250 achievements, representing 28 per
cent. Figure 8 gives a better idea of the NVQ achievements by SSA.

74
In terms of level, the majority of NVQ achievements were at level 2, with 71,650
achievements, representing 58%. However, all SSAs have declined in
achievements since the previous year. Figure 9 illustrates the achievements at
all levels.
Figure 8: NVQ achievements by SSA. Source: Statistics Bulletin.Vocational Qualifications Quartely.July to September 2011,16.Print.
Figure 9: NVQ achievements by level. Source: Statistics Bulletin.Vocational Qualifications Quartely.July to September 2011,17.Print.

75
3.5.2 VRQs
The VRQs are work-related, competence-based qualifications designed to
provide learners with the skills and knowledge needed to do a job. They are
related to employment but, unlike NVQs, do not necessarily require a work
placement and are not purely based on the National Occupation Standards
(Canterbury College.ac.uk).
From July to September 2011, 561,950 VRQ achievements were recorded at all
levels, a decrease of 48%, which also reflects the restructuring of some
qualifications. These achievements covered 1,206 different qualifications
offered by 76 different awarding organisations (Statistics Bulletin ,18).
In terms of SSA, ICT recorded the highest number of achievements, with
153,350 achievements, representing 27% as oppose to Health, Public Services
and Care which was the largest sector in 2010; due to the fact that many of the
qualifications have moved onto QCF.
Figure 10: VRQs achievements by SSA.
Source: Statistics Bulletin.Vocational Qualifications Quartely.July to September 2011,23.Print.

76
In terms of level, the majority of VRQ achievements were at level 2, with
373,200 achievements, representing 66 per cent of VRQ achievements.
Figure 11: VRQ achievements by level.
Source: Statistics Bulletin.Vocational Qualifications Quartely.July to September 2011,25.Print.
3.5.3 QCFs
The QCF is a credit-based framework which enables learners to accumulate
and transfer credit towards a regulated qualification. It is designed to give
learners, learning providers and employers an inclusive and flexible regulated
qualifications framework containing units and qualifications that recognise the
widest possible range of quality-assured learner achievements ("Qualification
and Credit Framework", 4).
The QCF introduces a standard currency for learner achievement across the
qualifications systems through the award of credit. One credit is equivalent to
ten hours of learning. There are three sizes of QCF qualification: award,

77
certificate or Diploma. Awards consist of 1–12 credits, certificates 13–36 credits,
and diplomas 37 credits or more ("Statistics Bulletin" ,26).
From July to September 2011, 1,393,650 QCF achievements were recorded,
an increase of 67 per cent reflecting the restructuring of many qualifications,
which have then been put onto the QCF. These achievements covered 4,161
different qualifications offered by 98 different awarding organisations.
("Statistics Bulletin",26).
In terms of SSA, Retail and Commercial Enterprise recorded the greatest
number of achievements with 231,900 achievements, representing 17% in
contrast with Languages as well as History with just 2 per cent.
Figure 12: QCF achievements by SSA.
Source: Statistics Bulletin.Vocational Qualifications Quartely.July to September 2011,29.Print.
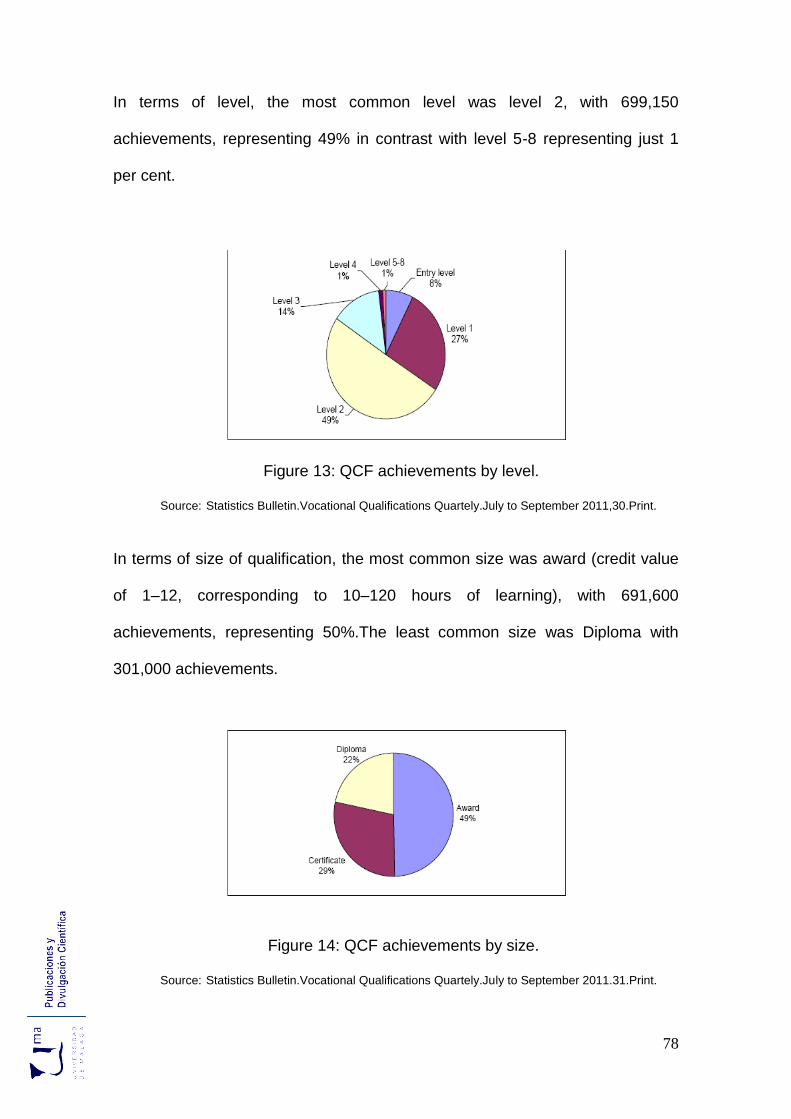
78
In terms of level, the most common level was level 2, with 699,150
achievements, representing 49% in contrast with level 5-8 representing just 1
per cent.
Figure 13: QCF achievements by level.
Source: Statistics Bulletin.Vocational Qualifications Quartely.July to September 2011,30.Print.
In terms of size of qualification, the most common size was award (credit value
of 1–12, corresponding to 10–120 hours of learning), with 691,600
achievements, representing 50%.The least common size was Diploma with
301,000 achievements.
Figure 14: QCF achievements by size.
Source: Statistics Bulletin.Vocational Qualifications Quartely.July to September 2011.31.Print.

79
3.5.4 OQs
OQs, (Operational Qualifications) develop the skills and capabilities needed for
a particular occupation or job. Skills are developed to an industry standard and
to a level of competence needed in a workplace. OQs are assessed in a
workplace environment but are not NVQs. (Qualification & Credit Framework,
10).From July to September 2011, 3,600 OQ achievements were recorded at all
levels, a decrease of 44% .These achievements covered 60 different
qualifications ("Statistics Bulletin ",32).
In terms of SSA, Education and Training was the highest number of
achievements recorded with 2,800 achievements, representing 78%.Both
Agriculture, Horticulture and Animal Care, and Arts, Media and Publishing had
400 achievements. Health, Public Services and Care, Preparation for Life and
Work, and Business, Administration and Law had less than five achievements
each. In terms of level, the majority achievements were at level 3, with 2,500
achievements, representing 69% in contrast with level 2 representing 11 per
cent with 398 achievements.
Figure 15: OQ achievements by level.
Source: Statistics Bulletin.Vocational Qualifications Quartely.July to September 2011,34.Print.

80
3.6 Conclusion
The number of NVQs/SVQs achieved in the UK has decreased sharply over the
last three years from 1.0 million in 2009/10 to 65,000 in 2012/13, a decrease of
94%.The reduction in the number of NVQs and VRQs achieved can be directly
attributed to the introduction of QCF qualifications from September 2009 as all
newly regulated qualifications are now approved by OfQual as QCF
qualifications ( Figure 16).
Figure 16: Achievement of NVQs, VRQs and QCFs in the UK.
Source: . Evans, Jessie. Vocational Qualifications. DfBIS. March 2014. Print.
In terms of occupations by skill level, in 2013, there was a similar percentage of
men and women working in the lowest skill category, consisting of the
elementary occupations, as figure 17 shows; the main differences between men
and women were in the two middle skilled groups of upper middle and lower
middle. On the other hand, 37% of men were employed in the upper middle
skilled roles compared with 18% of women and conversely 46% of women were
employed in lower middle skilled roles compared with 24% of men.

81
Figure 17: Occupations by skill level.
Source: Full Report-Women in the labour market. 2013. National Statistics.Print.
The UK government is trying to make all its population able to find a job as well
as to minimise the gap between men and women in the workplace. Many new
and improved old educational programmes have been offered; unfortunately,
the financial crisis has been a sharp setback in their development; the years to
come are the only hope to see if the situation changes for better.

82

83
Chapter 4: University Education contributes to the growth of national income and individual earnings.
While land was the main source of wealth and income in agricultural societies,
capital and machinery became important in industrial societies. In today’s
information societies, knowledge drives economic growth and development.
Higher education is the main source of that knowledge ("International Institute
for Educational Planning", Vol.XXV, N 1, 3).
Knowledge is a source of economic growth, It ensures better employment,
higher salaries and a greater ability to consume and save. In all modern
societies, universities are considered the ‘knowledge factories’. They play a
crucial role in generating new ideas.
Let's have a closer look at what the British Government do to make Universities
be the mirror of its society.
4.1 Introduction University campuses were one of the planned environments featured in the
implementation of the utopian ideals, resulting from the optimism and
determination to wipe out the appalling aftermath of post-war Britain
(Cullingworth, 18). A massive expansion of higher education took place driven
by a desire for cultural and intellectual renewal embraced by the development of
a young democracy across Europe.
Universities were the main centres for scientific and technological research and
development. Their expansion was directed towards a range of progressive
thoughts and principles, reflected in the interdependency between the
universities and the rest of society; in this sense, the Barlow Report (1946)

84
demonstrated the links between industry, educational and national prosperity
together with the advantages of urban concentrations, proximity to market
demands, reduction of transport costs and availability of a supply of suitable
labour.
Higher Education, (HE), helps to create the knowledge, skills and value that
underpin a civilised society which transforms individuals' lives as they are more
likely to be employed ( "Securing a sustainable Future",14); following this idea,
Macfarlane establishes that many universities have been founded to meet
"vocational" needs in the sense of being responsive to industrial interests
leading to a more hands-on approach for market-like activity
(2015:111),driving motivation and economic transformation as economic growth
is produced into the national prosperity.
It has been estimated that HE generated £27.6 billion in the 2010-11 academic
year due to the fact that the UK as a whole has a leading system of higher
education turning it into the second most popular destination for international
students. Figure 1 illustrates the different sections of the institution income.
Figure 1: Income of UK HE institutions, 2010-11.
Source: HE in Facts and Figures: Summer 2012 London: Universities UK,2012, 18.Print.

85
However, the challenge of raising levels of participation and remaining globally
competitive is becoming a real hurdle as in a social democracy higher education
policy should be tailored in a way to enhance equal chance at success since HE
is seen as a public good that ought to be provided by the government
( Seungchan,2015: 59).
In order to promote equality and a better adaptation ,some of the policies, acts,
strategies and services will be developed in the following pages.
Widening university participation.
Raising aspirations and attainment.
The student finance plan.
Post-Study Work visa.
BAME students.
BME staff.
Disability.

86
4.2 Widening university participation Discrepancies in the take-up of higher education opportunities between different
social groups are well known and widely recognised as unacceptable in a just
society. Half a century ago, only 6% of young people went on to higher
education; those who benefited were generally from higher income
backgrounds and generally went on to good jobs with high salaries ( Harris ,9).
In 1963, Lord Robbins suggested that universities ought to be open to all who
had the aptitude and desire to go. Therefore, three years later, the Robbins
report was issued in order to highlight the relevance of HE as compensator for
social disadvantage ("Securing a Sustainable Future for Higher Education", 18).
Against this widening participation approach, public investment in the field did
not keep up with the demand due to the laissez-faire ideology which consider
any inequality natural and necessary for the economy to run effectively
(Greenbank, 2006: 144). in 1997 Lord Dearing's report recommended that
graduates made a contribution to their tuition leading to the cessation of the era
of universal free higher education (Greenbank, 2006: 147).
So in 1998, for the first time ever in the UK, some students had to pay upfront
fees to attend university. Flat-rate tuition fees were introduced, replacing
Dearing's means-tested grants (Greenbank, 2006: 150).
By 2003 , The " Future of HE" paper set out the debate over the introduction of
variable tuition fees. This paper became the Higher Education Act in 2004;
participation increased significantly, but the Government became again
concerned that participation from the working class had not risen enough; as a
consequence, the Higher Education Funding Council for England, (HEFCE),
gave universities a Widening Participation allocation as part of their main

87
teaching grant. This was conditional on the production of a Widening
Participation Strategic Assessment, WPSA ( Dearden,4-12).
As a result, Trends in Young Participation in Higher Education core results for
England report from HEFCE shows that there has been a modest but steady
progress in the proportion of young people from most disadvantaged groups
entering HE since the mid-2000s ( Harris, 9).
Table 1: Accepted applicants.
Source: UCAS. < http://www.ucas.com/data-resources/data-tables/>.
The causes of this progress are likely to be complex and social changes cannot
be isolated from this environment. Policies, such as the improvement in GCSE
attainments, the introduction of the Educational Maintenance Allowance to
encourage individuals to continue into further education and the national Aim
Higher programme as well as the expansion of universities’ own activities have
played an important role in helping both to raise attainment and convert those
increases into entry to higher education.

88
4.3 Raising aspirations and attainment Academic attainment and aspirations of pupils are highly connected with their
background and with the schools they attend, thus limiting the likelihood of their
applying to or entering a selective course or university ( Harris, 27).
The perception that the professions and the selective universities that lead to
them, are for others, has a damaging effect on aspiration and attainment.
Selective universities are not the only route into professions but it is true to say
that graduates from the most selective institutions predominate with the most
sought-after and influential careers, and in general, command higher salaries,
earning significantly more over their lifetime than other graduates (Harris, 28).
The 2012 Milburn report makes clear that the professions are key to opening
new opportunities for second great wave of social mobility in the years ahead .
….I say that around 83% of all new jobs that are going to be created
in the next decade will be professional jobs and as a consequence
the proportion of employment in the professions will rise from around
42% to 46%, so there's a big potential here, providing there's an
equal opportunity for all of those with ability and aptitude and
aspiration to get on the professional career ladder… ( Sparrow, "
Alan Milburn's social mobility report" .The Guardian. May 2012)
However, social mobility into professional careers is believed to have slowed
down. So the goal of fair access to highly selective universities can be seen as
not just worthwhile itself but also as a means of recreating that upward social

89
mobility. Table 2 shows a decrease in all accepted applications in HE except for
Other sector , which has an improvement from 22.0 % to 25.8%.
Table 2: Accepted applicants in HE. Source: UCAS. < http://www.ucas.com/data-resources/data-tables/>.
In order to better the social mobility, all HE institutions have established their
own institutional financial support for students from lower income backgrounds
as well as information, advice and guidance programmes. These schemes have
been shown significantly to improve participants’ likelihood. The Higher
Education Progression Framework Guide published in 2008 is regarded as a
valuable resource to fall back on in this kind of matters. Here some examples
follow:
The University of Leeds runs a Reach for Excellence programme
providing support over a two year period for local, highly able 16-year-

90
olds from disadvantaged backgrounds. This programme includes
advice sessions, university visits, lectures, individual mentoring and a
summer school. 85% of success has been reported.(University of
Leeds)
The Universities of Manchester, Birmingham and Nottingham are
running a year-long Academic Enrichment Programme for year 12
students whose parents have not been to university and who are not
in professional occupations. 97% of students on this programme
applied to a research-led university. ( Guide to Widening Access
Schemes, 25)
The Step Easter scheme at the University of Cambridge targets
state school students whose schools don’t offer support for their Sixth
Term Examination Paper and who already have a conditional offer to
study Maths at Cambridge. It offers a four day residential course in
the Easter break during which the students receive extra tuition. 80%
of success is expected. ( UC. Faculty of Mathematics)
Figure 2 shows the most widespread activities take place at higher education
providers, schools, colleges and in the community. Individual activities last from
an evening to a week and series of activities may extend over longer periods.

91
Figure 2:different widening participation activities by HE providers.
Source: Widening participation in HE in England. HC 485.Session 2001-2002:18 Jan 2002.16.Print.
On the other hand, there has been an increase in mobility of the highly-skilled
from the UK to another European country. Mobility is strongly desired to add
new complimentary skills and better individual employability, but it is also
considered as a threat of losing the best-educated graduates resulting in
" brain drain" due to the labour market situation. It has been suggested that the
mobile graduates might be part of a new European élite, the so called highly-
skilled " Eurostars" ( Behle, 2014 :292).

92
4.4 The student finance plan
The expansion of H.E. appears to have actually acted to increase educational
inequalities during the last fifteen years; although disadvantaged background
students were more likely to go on to higher education this never caught up with
the advantaged background peers. This situation is still a major problem in the
UK because more able children from less advantageous economic backgrounds
are missing out ( Machin, 14).
Figure 3: Participation rates of young people.
Source Students at the Heart of the System. London: BIS, June 2011,56.Print.
Thus, the relative chance of people from low-income backgrounds studying at
the most selective third of universities has worsened. The most advantaged 20
per cent of the young population were around six times more likely to attend a
selective university in the mid-1990s but seven times more likely by the mid-
2000s ( Harris, 17).
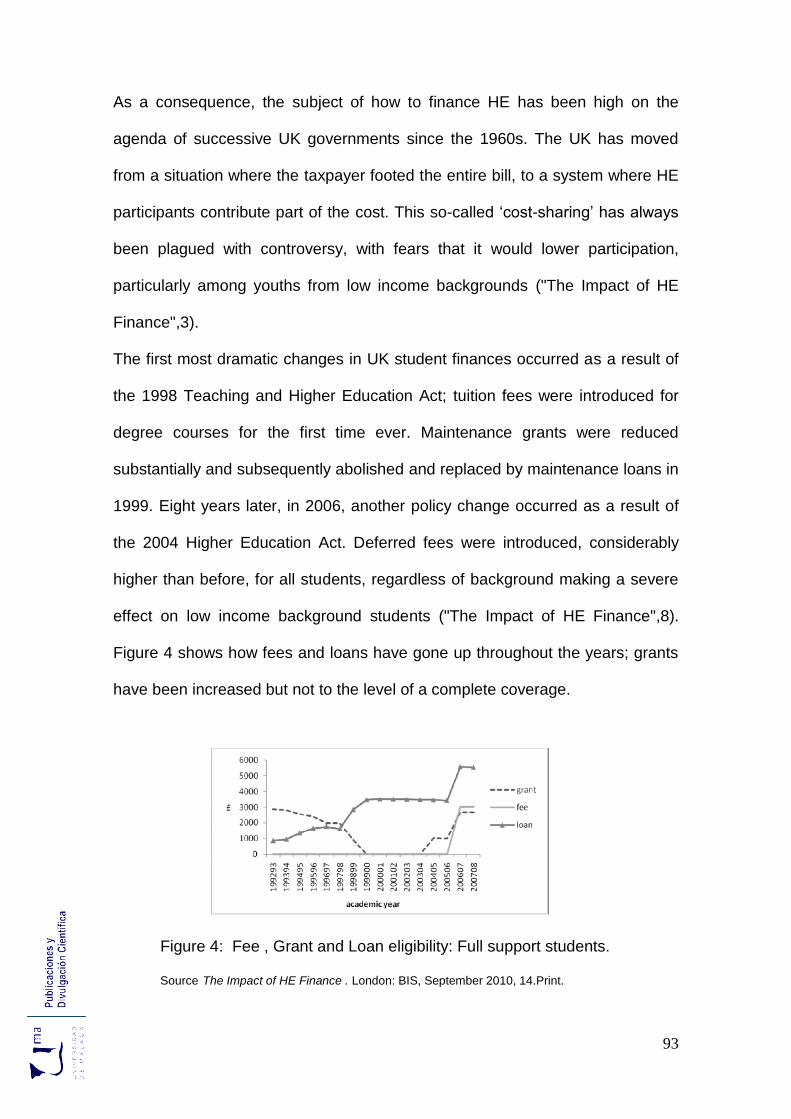
93
As a consequence, the subject of how to finance HE has been high on the
agenda of successive UK governments since the 1960s. The UK has moved
from a situation where the taxpayer footed the entire bill, to a system where HE
participants contribute part of the cost. This so-called ‘cost-sharing’ has always
been plagued with controversy, with fears that it would lower participation,
particularly among youths from low income backgrounds ("The Impact of HE
Finance",3).
The first most dramatic changes in UK student finances occurred as a result of
the 1998 Teaching and Higher Education Act; tuition fees were introduced for
degree courses for the first time ever. Maintenance grants were reduced
substantially and subsequently abolished and replaced by maintenance loans in
1999. Eight years later, in 2006, another policy change occurred as a result of
the 2004 Higher Education Act. Deferred fees were introduced, considerably
higher than before, for all students, regardless of background making a severe
effect on low income background students ("The Impact of HE Finance",8).
Figure 4 shows how fees and loans have gone up throughout the years; grants
have been increased but not to the level of a complete coverage.
Figure 4: Fee , Grant and Loan eligibility: Full support students.
Source The Impact of HE Finance . London: BIS, September 2010, 14.Print.

94
On top of that, many students, their families and in some cases their school or
college-based advisors were not aware of the level of bursaries for poorer
students. Financial packages were not widely explored until students had
accepted an offer or even arrived at university ( Harris, 67).
Hence, additional advice and guidance to ensure that choices are well-informed
and suited to the individual’s needs, interests and goals were set up. The
Realising Opportunities Scheme and the Extended Project Qualifications were
created in order to widely publicise the availability of higher bursaries
(Harris, 59).
For this reason, advocates of widening participation strongly opposed the
introduction of tuition fees and the replacement of grants with loans. According
to BIS, by the end of 2010-11 there were around £3.2 million income contingent
student loan borrowers with outstanding loans of around £35 billion and it is
expected to increase rapidly in the coming years to almost £70 billion by the
start of 2017-18 as figure 5 depicts.
Figure 5: Students’ loans.
Source Students at the Heart of the System. London: BIS, June 2011.,23.Print.

95
4.5 Post-Study Work visa.
The International students are academic, cultural and economic assets to the
UK. The UK’s universities are international organisations and depend on
international mobility of students and staff to deliver teaching, research and
knowledge exchange of the highest quality ("Response to The student
Immigration system",6).
In 2010/11, according to UK Council for International Students Affairs, there
were 428,225 international students at UK higher education institutions within a
total student population of 2,396,051; 214,540 students were on undergraduate
programmes, 171,270 students on postgraduate taught programmes and
42,415 students on postgraduate research programmes. This can be better
understood in the tables below:
Table3: Top non-EU and EU sending countries.
Source: UK Council for International Student Affairs. < http://www.ukcisa.org.uk/>.

96
Table 4: All non-UK domicile in HE.2011.
Source: UK Council for International Student Affairs. < http://www.ukcisa.org.uk/>.
The contribution of these students is significant to the British local economies.
For example, in the north east the total revenue of higher education was £967
million in 2007/8. International revenue amounted to nearly £123 million which,
together with the estimated off-campus expenditure of international students,
£111 million, represented a total of £234 million of export earnings. Universities
in the region provided £13,715 full-time equivalent jobs across a range of
occupations ( "Making an economic impact", 6).
However, the Government is to apply overly restrictions on immigration as visa
abuse is to be cracked down. The Tier 1 (Post-Study Work without the need of
a sponsor) visa category aims to retain the most able international graduates
who have studied in the United Kingdom. Successful applicants are free to seek
employment but Tier 1 visa "leave to remain" is to be closed to all applicants on
6th April 2012 since it is used as a way to enter and stay in the UK where they
then apply for dependants and ask for benefit rights. However, other Tier 1
categories can be applied, only if he/ she has an exceptional talent ( 75 points
All non-UK domicile in HE Full time Part time Total
Postgraduate research 35,805 6,610 42,415
Postgraduate taught 137,795 21,970 159,755
Postgraduate other 4,320 7,285 11,515
First degree 175,315 9,12 184,440
Other undergraduate 11,910 181,190 30,100
Total non-UK 365,045 63,180 428,225

97
under the points-based system) or self-employed (£50,000 - £200,000
investment required) or highly skilled ( points based on qualification, English
language skills, UK experience, age, previous earnings and maintenance ("Tier
1 Policy Guidance", 8).
Besides, minimum English language competence levels are to be prescribed
undermining the UK’s success as a destination for English language study and
the English language sector.
Table 5: Visa statistics by country.
Source: UK Council for International Student Affairs. < http://www.ukcisa.org.uk/>.
The effects of public funding cuts mean that income from international students
is critical to institutions’ financial health. Traditional institutions expect
international mobile students to fit into their educational system but they find it
difficult to adjust . Thus, a more internationalized curriculum is also expected to
be prepared for a more effectively global culture (Kelly, 2012: 25).

98
4.6 BAME students
In January 2009, Race for Opportunity, part of Business in the Community
agency, published Race to the Top. This report identified that ethnic minorities
was not in line with their representation in the overall UK population. To
challenge this, people from minority backgrounds need to ensure they progress
to higher education, with one fifth of the emerging workforce and children in
primary and secondary education being BAME, Black, Asian or Minority Ethnic
(3).
As a public body, Universities have an extra duty to promote equality, known as
the Equality Duty. Most Universities Executive Boards have established an
Equality Executive Group with responsibilities for reviewing and making
recommendations to the Board on the development of equality and diversity
within the University ("Equality Scheme 2011-2015",9).
The Equality Schemes build on the achievements and identify what further
actions can be taken in order to give an equal chance to all students ( Equality
Scheme 2011-2015,5).
Table 6 : Accepted applicants. Ethnic group.
Source: UCAS. < http://www.ucas.com/data-resources/data-tables/>.

99
Ethnic minorities are under-represented in the British HE system. White ethnic
origin students make up 77.3%, 333,198 accepted applicants out of 447,206
applicants in 2011, while black ethnic origin, in general, just 6.9%, 29,688
accepted applicants out of 48,780; Asians represent 10%, 43,211 out of
59,081.Table 7 shows the percentage of accepted applicants in detailed
ethnicity from 2008 to 2011.
Table 7: Detailed ethnicity. Accepted applicants.
Source: UCAS. < http://www.ucas.com/data-resources/data-tables/>.
In relation to subjects of study, as figure 6 shows, Race into Higher Education
report establish that some 16.7% of ethnic minorities studied business and
administrative studies compared with 12.5% of white students. BAME groups
are favouring more entrepreneurial subjects while, perhaps more BAME
graduates become self-employed than White ones.

100
Figure 6: Subjects of study. HESA. 2008
Source Race into Higher Education. London: n.p, January 2010.,11.Print
Education has emerged as the fifth most popular subject for BAME women in
2007-08 with 4.7% of BAME women choosing this option. But they have some
way to go before they equal the 8.3% of their white female counterparts.
Subjects allied to medicine have zoomed up to the top of the table for ethnic
minority women. Law is the third most popular subject for both British Pakistanis
at 11.1% and British Bangladeshis at 8.8%, yet does not feature in the top five
for British Indians who prefer medicine and dentistry. Both Black British
Caribbeans and Black British Africans are most likely to study subjects allied to
medicine,15.8% and 25.7% respectively.
Another concern is the small proportion of ethnic minority graduates who take
research higher degrees, which means that a small amount from which to
recruit future higher education staff ( Wakeling, 2009: 89).

101
4.7 BME staff
A university where the academic staff are open to other individuals' values
guarantees the tolerance for differences in opinions, world view and cultural
behaviours ( Selmer, 2013: 138).
The Race Relations (Amendment) Act 2001 introduced a statutory general duty
upon public authorities, including HEIs, to promote race equality. The intention
was to help HEIs provide fair and accessible services and to improve equality of
opportunity for people of different racial groups. The Race Relations
(Amendment) Act has been repealed and replaced by the Equality Act 2010,
which continues the positive duty that HEIs have with regard to race ( Hey, 3).
Unfortunately, the current financial climate and the effects of the new fees and
funding system, have led to some restructuring, redundancies and reduction in
services. These may have a greater negative effect on minority ethnic people.
Anyway, BME students are believed to want a more representative workforce,
diverse teaching practices and more BME role models. Many institutions have
therefore demonstrated a strong policy commitment to race equality.
Yet, despite this, BME staff is underrepresented at senior levels in HEIs and the
significant disparity between universities’ policy commitments and the
experiences of BME staff suggests ongoing institutional barriers and
discriminatory practices in the higher education sector ( Hey, 4).
Figure 7 below shows clearly the disparity among the different ethnic groups in
academic staff at UK HEIs. In 2010/11, 10% of all staff in higher education were
BME (5% unknown). 7% of UK national and 30% of non-UK national staff were
BME. 7% of UK academic and research staff (combined) were BME, compared

102
with 28% of non-UK. 7% of UK national professional and support staff were
BME, compared with 36% of non-UK. (Equality Report 2012/13, 21)
Figure 7: BME academic staff.
Source: Equality Report 2012/13, 22.Print.
The increase of BME university staff is being achieved very slowly in the recent
years. One of the reasons is that BME students hardly reach HE and therefore ,
it is very complex to have a representation of the ethnic minorities within the
campuses. The government is doing its best to reverse this tendency.

103
4.8 Disability
The growing empowerment of disabled people has made a shift in policy
making about disability, resulting in the acceptance of disabled people as part of
human diversity. Thereby , the perception of disability is as " a social creation,
and a problem created by institutions, organisations and processes that
constitute society in its totality" ( O'Connor ,1999: 90).
Students who are disabled were under-represented in HE as education was not
covered by the 1995 Disability Discrimination Act (DDA). which was replaced by
the 2010 Equality Act. This puts higher education providers under a duty to
make reasonable adjustments for all disabled students applying for and
attending their institutions (European-agency.org).
As a consequence, universities and colleges are required to make reasonable
adjustments to their services to ensure that disabled students are not placed at
a substantial disadvantage. This means that they must not discriminate against
disabled students in areas such as enrolment and admissions and in the
provision of student services.
On top of that, due to the complexity of different kinds of disability, the legal
definition of disability was designed to be as broad as possible. There is a wide
variety of conditions and impairments that are covered, but in general reads as
follows: ‘ a person has a disability if he/she has a physical or mental impairment
and the impairment has a substantial and long term adverse effect on P's ability
to carry out normal day-to-day activities’ (DIDA,4).
As table 8 shows, in 2011, students with learning difficulties make up 3.7 %,
16,111 accepted applications out of 22,234; students with mobility problems
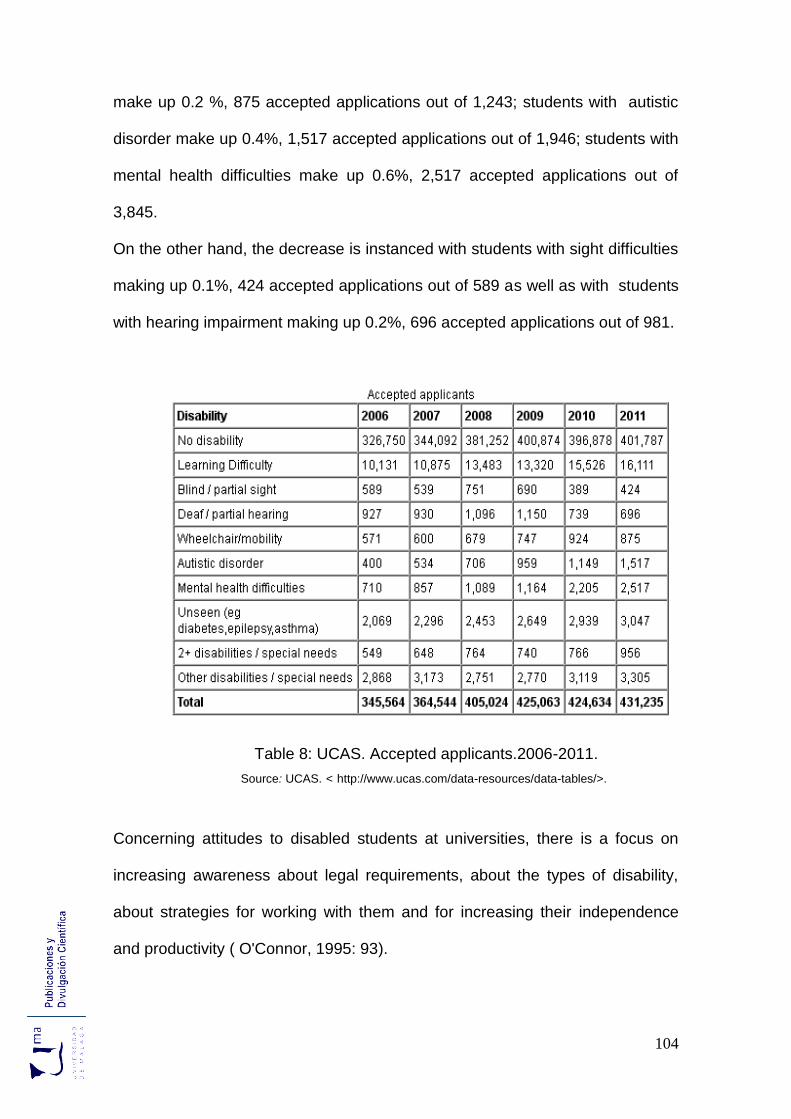
104
make up 0.2 %, 875 accepted applications out of 1,243; students with autistic
disorder make up 0.4%, 1,517 accepted applications out of 1,946; students with
mental health difficulties make up 0.6%, 2,517 accepted applications out of
3,845.
On the other hand, the decrease is instanced with students with sight difficulties
making up 0.1%, 424 accepted applications out of 589 as well as with students
with hearing impairment making up 0.2%, 696 accepted applications out of 981.
Table 8: UCAS. Accepted applicants.2006-2011.
Source: UCAS. < http://www.ucas.com/data-resources/data-tables/>.
Concerning attitudes to disabled students at universities, there is a focus on
increasing awareness about legal requirements, about the types of disability,
about strategies for working with them and for increasing their independence
and productivity ( O'Connor, 1995: 93).
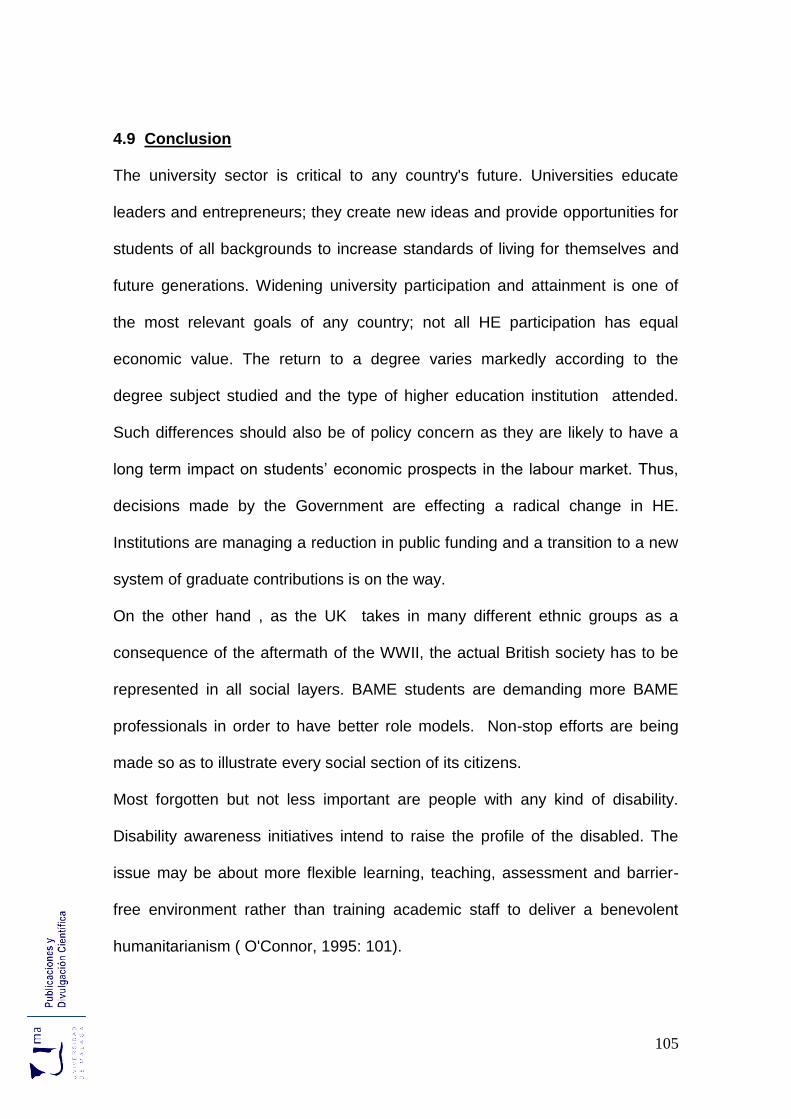
105
4.9 Conclusion
The university sector is critical to any country's future. Universities educate
leaders and entrepreneurs; they create new ideas and provide opportunities for
students of all backgrounds to increase standards of living for themselves and
future generations. Widening university participation and attainment is one of
the most relevant goals of any country; not all HE participation has equal
economic value. The return to a degree varies markedly according to the
degree subject studied and the type of higher education institution attended.
Such differences should also be of policy concern as they are likely to have a
long term impact on students’ economic prospects in the labour market. Thus,
decisions made by the Government are effecting a radical change in HE.
Institutions are managing a reduction in public funding and a transition to a new
system of graduate contributions is on the way.
On the other hand , as the UK takes in many different ethnic groups as a
consequence of the aftermath of the WWII, the actual British society has to be
represented in all social layers. BAME students are demanding more BAME
professionals in order to have better role models. Non-stop efforts are being
made so as to illustrate every social section of its citizens.
Most forgotten but not less important are people with any kind of disability.
Disability awareness initiatives intend to raise the profile of the disabled. The
issue may be about more flexible learning, teaching, assessment and barrier-
free environment rather than training academic staff to deliver a benevolent
humanitarianism ( O'Connor, 1995: 101).

106
It cannot be forgotten that every single student is essential for a country. As
Alan Turing once said "Sometimes it's the people no one imagines of who do
the things no one can imagine" (The Imitation Game film).

107
Chapter 5 : Teaching Recruitment Teachers are the people who educate the youth of society who in turn become
the leaders of the next generation of people.
So, teachers certainly have a significant mark on the development of young
children and even older children alike, as they are teaching them and helping
them develop their knowledge so that they can go on in life and be responsible
and productive members of society.
Thus no education system can be better than the quality of its teachers.
Practice must be at the core of teachers' preparation (Loewenberg, 2009:
497).The most successful countries are those where teaching has the highest
status as a profession.
Let's have a closer look. at what the British Government do to make this
happen.
5.1 Introduction
Teachers are our society’s most valuable asset. There is no profession more
vital and no service more important than teaching. They are the means by which
every child will become the adult they aspire to be ( "The Importance of
Teaching White Paper 2010",7).
Student learning has been proved to depend most of all on the knowledge and
skills of teachers .According to the Key Data on Education in Europe 2012
report ,primary school teachers in the UK are outnumbered by pupils 19.9 to
one, the highest of any country in the EU and well above the average of 14.5
and only two per cent of the top graduates opt to train as teachers compared to
ten per cent in Finland and five per cent in South Korea - both of which are

108
recognised as having world-leading education systems (26).
In view of increased expectations for quality teachers and demands for more
teachers, if the UK is expected to have one of the best education systems in
the world then it needsto have the best teachers. Thus, it is vitally important that
public policies make teaching a more attractive profession in order to achieve
more complex and ambitious goals. The aim is to prepare youth for the
demands of the 21st century (Loewenberg, 2009: 497).
Despite the compelling nature of this situation, policies and countless bills
indicate that state and local employment and benefit policies often work against
this priority. They restrict employment opportunities for experienced teachers
and for new recruits.
As a result, many good teachers leave the profession prematurely and similarly,
many talented individuals are discouraged from considering teaching as a
career ("Teacher Recruitment Staffing Classrooms with Quality Teachers",1-7 )
In order to build the best educational system ,some of the policies, acts,
strategies and services will be developed in the following pages.
Teacher training.
Teaching standards.
Teacher workforce.
Teachers' pay.

109
5.2 Teacher training
So far, the most common focus for recruitment has been on academic
credentials and cognitive ability. However, there has been found little
relationship between teachers' academic credentials and student achievements.
Thus, a persistent disagreement over whether to prioritize recruitment or
preparation has been a serious issue ( Ronfeldt, 2013: 320).
To make things a bit more difficult, in October 2010, the Minister for the Cabinet
Office, Francis Maude, announced a serious financial reform of all public
bodies. In response, the Department for Education has implemented a huge
change programme, with several of its bodies closing and others becoming part
of the Department. As a result, there are now four new executive agencies
responsible for key delivery functions – the Standards & Testing Agency, the
Teaching Agency, the National College and the Education Funding Agency. The
Standards & Testing Agency opened on 1st October 2011; the other three
agencies on 1st April 2012 ("The National Archives", ALB).
Under the Training and Development Agency for Schools ( TDA) and its
predecessor, the Teacher Training Agency, England has developed new routes
into teaching. It now has the largest range of training options as well as the
commitment of recruiting more males and more racial-minority teachers (
Ronfeldt, 2013: 321).
The nature of the new teacher training options are described further down
(Training of Teachers Report, 13-14) :
Undergraduate-level training options include the three- or four-year
Bachelor of Education degree or the three- or four-year Bachelor of

110
Arts/Bachelor of Science with Qualified Teacher Status degree—though
these programmes can be completed in two years.
Postgraduate options include the one-year Postgraduate Certificate in
Education(PGCE), which confers masters-level credits, and the
Professional Certificate in Education (PgCE). There are extended, 18-
month, versions of the PgCE/PGCE targeted at potential mathematics
and science teachers, as well as part-time and distance learning options.
School-centred initial teacher training involves training in at least two
schools. These trainees typically complete a PgCE/PGCE through a
higher education institution as part of their training.
Employment-based initial teacher training involves training as a teacher
while working in a school. Trainees are employed in schools as
unqualified teachers. There are a number of different employment-based
options: the two-year undergraduate Registered Teacher Programme;
the one-year postgraduate Graduate Teacher Programme; and the one-
year Overseas Trained Teacher Programme. The salary and training
costs are covered by the TDA.
Return to Teach Programme for those who simply need to qualify to
teach in England, or to refresh their training.
‘Transition to Teaching’ scheme, for career changers interested in
teaching ICT, mathematics or science. It also funds subject knowledge
enhancement courses of three or six months’ duration for those
interested in teaching mathematics, chemistry or physics.

111
Training Options1:
Undergraduate Postgraduate •School-centred Employment-based Other
3-4 year Bachelor of Education. 3-4 year Bachelor of Arts/Science
Qualified Teacher Status degree
1 Derived from HC275-I. Training of Teachers: Fourth Report Session 2009-10.

112
5.3 Teaching Standards
The idea of standards for the teaching profession has been circulating for much
of the latter part of the 1990s.Since then, the main aim has been to improve
educational performance as well as the practices in the classroom. Thus,
standards define what teachers should be able to do and what they should
know ( Sachs, 2010: 175).
Due to the difficulty in defining what standards should be, amendments to the
definition have been constantly made. As a result, the concept of standards as
quality assurance set in so as to elevate the status of the teaching profession in
the eyes of the general public. Even sometimes, the term professional
standards is used interchangeably with professional certification and licensing (
Sachs, 2010: 177).
Another weak point to mention is the use of the word " knowledge"; teachers
are viewed as holders of knowledge to be imparted, they are supposed to
profess " secure" subject knowledge and understanding although little is said
about the nature of such knowledge ( Stevens, 2010:189).
Apart from teaching, personal and professional conduct is also covered by the
standards; among other obligations, teachers are asked to maintain high
standards of ethics and behaviour within and outside school ("Teachers'
Standands",5).
The new Teachers’ Standards, published in September 2012, replaced the
existing standards for Qualified Teacher Status (QTS) and the Core professional
standards, previously published by the Training and Development Agency for
Schools ("Teachers' Standands",3).

113
The QTS standards comprise 33 separate entities, divided into three sections
professional attributes (nine standards), professional knowledge and
understanding , and professional skills (each containing 12 standards);
additionally, the length, detail and breadth of each standard varies considerably
( Stevens, 2010. 188).
The new standards are to be applied to all teachers regardless of their career
stage, and define the minimum level of practice expected of teachers. They
affect to all of those who begin their training for QTS on or after 1 September
2012. Where programmes have started before 1 September 2012 and are due
to finish after 1 September 2012, the relevant accredited providers will need to
ensure that programme design and delivery, and the assessment of trainee
teachers ( "Teachers' Standands",3).
Therefore, teachers and trainers are dual professionals; they are both subject
and vocational specialists and experts in teaching and learning.
Figure 1: Professional standards.
Source: Professional Standards for Teachers and Trainers .ET Foundation.co.uk

114
In 2014, almost three-quarters of teachers reported feeling moderate or extreme
pressure from administrators to improve test scores and even they have
considered leaving their post because of standardized testing
( Lancasteronline.com).
5.4 Teachers workforce
Despite the expansion of higher education in the UK, the teaching profession
has experienced significant shortages. Recruitment in this profession, especially
teaching in the state maintained sector has received considerable policy
attention in recent years.
Various financial incentives have been devised to try to attract graduates into
teaching. In 1998, new teachers in shortage subjects (mathematics, science
and modern language teachers) were given an initial lump sum payment of
£4,000 under the ‘Golden Hello’ scheme introduced by the Government. The
latest incentives include a package which pays off the student loans of newly
qualified teachers working in shortage subjects in England and Wales as well as
a housing loan scheme was devised in October 2003, under which teachers in
London are eligible for an interest-free home loan of up to £50,000 (Dolton, 89).
Additionally, the advertising “Use your head. Teach” campaign, costing around
£12 million, was a great effort to recruit and retain teachers. However, the
decrease has taken place as figures show in the number of full-time equivalent
school staff in local authority maintained schools and Academy schools in
England table. (TES.com)

115
Table 1: Teachers workforce.
Source: Statistical First Release. School Workforce in England: November 2011.DfE.
The school workforce has seen substantial increases in the numbers of school
support staff employed in recent years; between spring 2000 and November
2011 the numbers of full-time equivalent teachers in service has increased by
32,200 from 405,800 to 438,000. This represents an increase of 7.9%.
However, it remained relatively flat from spring 2011 to November 2010, making
up 2%, from 439,300 in 2007 to 448,100 in November 2010. It fell by 10,000,
2%, between November 2010 and November 2011.
In comparison, the numbers of teaching assistants has increased by almost
threefold from 79,000 in spring 2000 to 219,800 in November 2011 with the rate
of growth slowing between 2007 and 2011. Similarly, the numbers of other
school support staff have increased by over 50,000 between spring 2000 and
November 2011. In connection to the school auxiliary staff (school maintenance
and ground staff and dinner ladies etc.) of which there were 84,200 employed in
schools in November 2011 ("2012 Statistical First Release")
Spring
2000
Spring
2007
Spring
2009
Spring
2010
November
2010
November
2011
Teachers 405.8 439.3 441.1 442.6 448.1 438.0
Teaching
assistants
79.0 163.8 177.0 183.7 213.9 219.8
Non-
classroom
based school
support staff
83.0 144.4 149.6 162.2 - 133.9
Auxiliary
staff
- - - - - 84.2
Total 567.8 747.5 767.7 788.5 662 875.9

116
The characteristics of the school workforce as from November 2011 are as
follow:
- Gender :
Figure 2: School workforce by gender.
Source: Derived from the 2010 school workforce census. Report DFE-RR151
In connection with gender, there is an imbalance between male and female
professionals; as in 2012, 65.2 per cent of headteachers were women in
contrast with 34.8 per cent for the male sector; in regard to teachers and
support staff , 73.2 per cent and 93.8 per cent were women leaving just 26.8
and 16.2 per cent for men respectively; finally, the most striking figure
corresponds to teaching assistants , 93.4 per cent are women whereas just a
6.6 per cent are men. Women dominate the teaching sector.
0
20
40
60
80
100
Post
Re
pre
se
nta
tio
n (
%)
Fenale
Male
Fenale 65,2 73,2 93,4 83,8
Male 34,8 26,8 6,6 16,2
Head
teacherTeacher
Teaching
assistant
Support
staff

117
Headteachers
0% 11%
34%50%
5%
<30
30-39
40-49
50-59
60+
Head teachers
0% 11%
34%50%
5%
<30
30-39
40-49
50-59
60+
-Age:
Figure 3: Age of Head teachers and teachers
Source: Derived from the 2010 school workforce census. Report DFE-RR151
In connection with age, professionals younger than 30 years old are not
existent in the managerial section; although, teachers make up 26 per cent in
the same age bracket.; for 30-39 year olds, head teachers make up 11 per cent
in this age group meanwhile teachers almost double up the percentage to 32
per cent.
The next section up in age, the 40-49 bracket, head teachers cover 34 percent
in contrast with teachers which are 21 per cent of the workforce; for the 50-59
year olds, headteachers dominate this age bracket being 50 per cent whereas
teachers are 21 per cent; and finally, for the most senior ones, 60 plus, there is
a very small representation in both professional categories; head teachers just
5 per cent and teachers 2 per cent of the professional workers.
Teachers
26%
32%
21%
19%
2%
<30
30-39
40-49
50-59
60+
Teachers
26%
32%
21%
19%
2%
<30
30-39
40-49
50-59
60+

118
Teachers
White 93,7%
Asian 3%
Black Caribbean 1,8%
Mixed 0,9%
Other 0,7%
-Ethnicity:
Figure 4: Ethnicity of school workforce.
Source: Derived from the 2010 school workforce census. Report DFE-RR151
In regard to ethnic background, 93.7 per cent of teachers in service were
recorded in the White ethnic groups. Of the non-White ethnic groups, Asian
teachers made up the next largest group with 3.0 per cent of those in service.
Black Afro-Caribbean teachers made up 1.8 per cent of those in service
followed by Mixed White/Other, 0.9 per cent, and the final 0.7 per cent of
teachers in service came from other ethnic backgrounds;97.6 per cent of head
teachers were recorded in the White ethnic groups.91.9 per cent of teaching
97,6
91,9
89
90
91
92
93
94
95
96
97
98
Head teachers Teaching assitants
White
97,6
91,9
89
90
91
92
93
94
95
96
97
98
Head teachers Teaching assitants
White

119
assistants and all other support staff were recorded in the White ethnic
groups.Traditionally , teaching has been a career geared towards women . It is
neither a high-prestige nor a high-salary profession which seems to be the main
reasons why men do not apply as seen figure 1 shows; in relation to teachers'
age, figure 2 shows that most teachers are in the younger age bracket,
possibly because the younger the professional , the more stamina they have
to put up with everyday life in the classroom; as professionals get older they
opt for more managerial . Figure 3 shows that the dominant ethnic group is
white due to its dominant culture compared to the others.
5.5 Teachers’ Pay
The School Teachers’ Pay and Conditions Document (STPCD), published
annually, contains statutory provisions on teachers’ pay. It requires every
governing body to have a written school pay policy, setting out the decision-
making structure for all pay decisions, including annual pay assessments,
discretionary decisions and appeals procedures, and the criteria to be applied in
taking decisions on pay. All decisions should be taken in accordance with the
pay policy, which should be reviewed annually (in consultation with teachers
and union representatives) and kept up to date. The school pay policy should
also affirm the governing body’s commitment to fairness, openness,
consultation and accountability ( "School Teacher's Pay 2012/13 Guide").
The average salary for qualified nursery/primary and secondary teachers in the
maintained sector shows an overall upward trend, but the first two decades
tended to see a sharp upturn ; as figure 5 indicates the upturns are due to the
fact that salaries did not keep up with inflation , the downturns are due to budget
freeze or cuts as a result of economic crisis ( "2008 Teacher's Pay Statistics").

120
Figure 5: Average salaries of qualified teachers.
Source: 2008 Teacher's Pay Statistics. House of Common, England. Print.
In September 2012, a newly qualified teacher in England and Wales can expect
to start on £21,588 a year. For primary school teachers with at least 15 years of
experience, salaries average £28,000. For lower secondary school teachers
with at least 15 years of experience average, it is £27,500. Lower and upper
secondary school teachers in England earn 109% more than similarly-educated
workers in other professions.
Figure 6: Teacher’s pay. Different countries.
Source: The Guardian DataBlog Facts are sacred. September 2012.

121
However, for the first few years of a teacher’s career, the teacher can find
him/herself progressing to a leadership pay scale, or even a headship pay
scale. These pay scales include: advanced skills teacher pay scale, excellent
teacher pay scheme , leadership group pay scale, and head teacher pay scale .
The scales will depend on position, experience and location, as well as on the
school. To have an overview of the mentioned scales, here is an example:
Table 2: September 2012 Scales
Source: 2008 Teacher's Pay Statistics. House of Common, England. Print.
There can be an additional payment to a teacher for taking on sustained
additional responsibilities for which the teacher is accountable. It is known as
Teaching and Learning Responsibility payment: Special educational needs
allowance is also provided with an incentive.

122
Table 3: Payments for Teaching and Learning responsibilities.
Source: Teacher's Pay 2013-2014 Guide. Print.
Besides, the introduction of a Performance Threshold in 2000 let teachers at the
top of the existing salary scale be eligible to apply to cross this threshold by
making an application showing their proficiency in each of five areas. If
successful, they are awarded a £2,500 a year salary increase ( Wragg, 16).
The Threshold assessment is open to all qualified teachers who, at the time
when they apply, are employed as a teacher by a local authority or a governing
body of a local authority maintained school. It operates on the basis of annual
application “rounds” which determine the dates by which applications must be
made and assessed and the dates on which successful teachers progress to
the Upper Pay Scale.
Table 4:Teachers who applied to cross the pay threshold
Source: Wragg, T et al . Performance-related Pay. Exeter. U of Exteter, n.d Print.

123
Also, teachers may be eligible to join home ownership schemes for help buying
a home. There are 3 types of scheme: first Buy equity loans, shared ownership
and new buy ("Qualify Teaching Staff". GOV.UK).
5.6 Conclusion
Education is a basic human right and a significant factor in the development of
communities. It is also one of the most important investments a country can
make in its people and its future, and it is critical to reducing poverty and
inequality.
However, the situation in the UK is a bit different. Teachers, especially new
teachers, are leaving the profession for a multitude of different reasons. A
career in teaching doesn’t offer promotions. aises based on merit are non-
existent and bonuses are few and far between plus keeping up with the
standards, the pressure of testing, crowded schedules and classes, all of which
add to the challenges facing today's teachers.
On the other hand, the challenge of providing quality minority teachers
continues to be the number one issue; programme plans for minority teacher
recruitment have been implemented (Kearney, 4). But they seem not to have
attracted enough new professionals due to the fear of potential racial from
abuse fellow-teachers, parents and local communities plus the feeling that the
national curriculum hampers the cultural and social significance of their
communities ( Cunningham, 3).
In 2014 more than 4,000 teachers a month left the profession because of the
workload and the increasing expectation to take part in out-of-school hour's
activities (The Guardian.com).

124
By 2050, the UK will require 53, 000 new recruits in order to have a workforce of
more than 507,000 qualified teachers to support the demands of its growing
population. In order to secure this long-term workforce, the number of teachers
working in the UK needs to increase by more than 1,600 per year from 2008
(Randstad.co.uk)
The different programmes described in this section correspond to the real need
of teacher supply in the UK. The teaching profession has not been well dealt
with for years; so attractive incentives have been designed to attract the
attention of a possible workforce to ensure the well-doing of new generations.

125
Chapter 6 : Academies The launch of the Academies Programme in 2000 was something dramatically
different in order to make significant and necessary improvements to the
prevision of education in urban areas (Gunter, 2014: 301).
Thus, the landscape of secondary education has undergone a transformation
since then, with a rapid expansion of independent academies. The Government
introduced the Academies Bill at the end of May 2010. The Academies Act 2010
came into force in time to allow the first converter academies to start in
September 2010 (Bolton, 1).
Academies are all-ability state schools which, unlike maintained schools, are
run by private companies with charitable status and funded directly by central
government via a legally binding ( West, 2013 : 138).
Let's have a closer look at this new concept.
6.1 Introduction
In 1979, when the Conservative Government was first elected into office, the
school system in England was a national system, locally delivered. Major
education reforms were implemented including the introduction of market
principles into school-based education. As part of these reforms, City
Technology Colleges, CTCs, were introduced focusing on science and
technology education (West, 2013: 139).
Initially, they were intended to address the problem of failure within English
schools with low academic achievement, or schools situated in communities
with few or no academic aspirations. Often these schools have been placed in
"special measures" after an OFSTED inspection, a term denoting a school that

126
is "failing or likely to fail to give its pupils an acceptable standard of education"
( "Education Act 2002", 45-47).
Due to the Education Reform Act 1988, CTCs were allowed to operate outside
local education authorities. CTCs became "technology colleges" and were
known as so in 1993 because of the White Paper which proposed the creation
of such a term (West, 2013: 142).
In 1997, more changes to education policy followed the election of the Labour
Government. The specialist schools programme was re-launched. This type of
school was initiated in 2000 and known as a city academy. They were legally
created by the Learning and Skills Act 2000, which amended the section of the
Education Act 1996 relating to City Technology Colleges.
But the term was changed to academy by an amendment in the Education Act
2002. Academies were proving successful results and the Academies Act
2010 was passed. The White Paper The Importance of Teaching expressed the
desire for the academies programme to be extended.
In order to have a better understanding of the development of academies , the
following pages will be dealing with:
The converter chain landscape.
The sponsored academy chain landscape.
The impact of academy chains.
The organisation and management of academy chains.
Sponsorship and governance of academy chains.
The future development of academy chains.

127
6.2 The converter chain landscape
The growth in school autonomy has been a distinctive feature of the English
education system over the past 25 years. Academisation is used to describe a
range of structural changes( Gunter, 2014: 303) Academies – and converter
academies in particular – are the most recent manifestation of this policy.
According to National College for School Leadership, at the beginning of 2012
around a quarter of the 1,775 schools that had either converted to or applied for
academy status had done so as part of a chain. The DfE had been notified of
122 converter chains, 68 secondary-to-secondary chains, 27 primary-to-primary
chains and 27 cross-phase chains. In addition, 93 converting academies had
become part of a sponsored chain by themselves becoming sponsors of
academies, by joining an existing chain or by converting as part of a school
improvement initiative. Figure 1 shows the number of converter academies in
these different types of chain.
Figure 1: Number of academies converting by phase.
Source: Hill, R, et al. The growth of academy chains: implications. Nottingham: NCL, 2012.13..Print

128
There are three main types of converter academy chain:
●Multi-academy trusts has a master funding agreement with the secretary of
state for education and a supplementary funding agreement for each academy
within it. The trust has responsibility for the performance of all the academies
within it. As Figure 2 shows, the governance of the trust operates at two levels:
foundation members who constitute the charitable trust and the board
responsible for the operation and performance of the trust’s academies.
Alternatively, the trust can set up an advisory body for each academy with no
delegated powers.
Figure 2: Structure of a multi-academy trust.
Source: Hill, R, et al. The growth of academy chains: implications. Nottingham: NCL, 2012. 14..Print

129
So, for example the Academy Federation of North Bedfordshire. brings together
four academies: Sharnbrook Upper School (13-19); Lincroft School (9 to 13);
Harrold Priory Middle School (9-13); and, Margaret Beaufort Middle School(9-
13). The schools have been federated under one Governing Body since
September 2009 but In 2011 it became part of a multi-academy trust ( TES
NEWS.co.uk. North Bedfordshire Schools, letter from the Chair of Governors).
●Umbrella trusts sets up an overarching charitable trust. This trust in turn
establishes individual or multi-academy trusts to run the schools coming under
the umbrella of the overarching trust. Each of the individual academy trusts
within the umbrella has a separate funding agreement with, and articles of
association approved by, the secretary of state. As Figure 3 describes, the
umbrella trust can choose how much control it exercises over the trusts within
the umbrella, according to either how well a school is performing or how far it
wants to determine the relationship it has with an academy.
Figure 3: Structure of an umbrella trust.
Source: Hill, R, et al. The growth of academy chains: implications. Nottingham: NCL, 2012.16.Print

130
An example of a faith-based academy trust working within an umbrella trust is
the Becket School in Nottingham along with its partner primary schools ,Blessed
Robert Widmerpool, Our Lady and St Edward’s and St Edmund Campion. The
Trust works in close partnership with the Nottingham Roman Catholic Diocesan
Education Service and with local community schools ( "2013 South Nottingham
Catholic Academy Trust Report",6).
● Collaborative partnerships : In this model the heads or principals of converting
academies agree to work together in areas where they see some mutual
benefit. With this model the secretary of state enters into a separate funding
agreement with each academy. There is no need for shared governance
arrangements between the academies involved and in these cases the
partnership is much looser than the others , as Figure 4 illustrates.
Figure 4: Structure of a collaborative partnership.
Source: Hill, R, et al. The growth of academy chains: implications. Nottingham: NCL, 2012. 18.Print
In July 2010, 63% of Bromley schools either converted to academy status or
were actively exploring conversion to academy status. They jointly procured the

131
legal services necessary to facilitate academy conversion to form a
collaborative ‘chain’. Bromley continues to have one of the highest numbers of
academy conversions in the London area ( "2013 Bromley Academy
Programme & Free School Update", 1-3).
6.3 The sponsored academy chain landscape
The first academies opened in September 2002. These were sponsored
academies which replaced former failing schools. The Academies Act 2010
made it easier for all schools (including primary and special schools) to become
academies. This led to a rapid expansion of the academies programme and, as
of January 2014, there are 3, 613 academies open in England. Of these,2,509
are mainstream converter academies and the rapid expansion in their numbers
means that there is considerable interest in their performance. ( "Performance
of converter academies: an analysis of inspection outcomes 2012 to 2013",5)
Figure 5: Number of sponsored academy chains by size.
Source: Hill, R, et al. The growth of academy chains: implications. Nottingham: NCL, 2012.10..Print
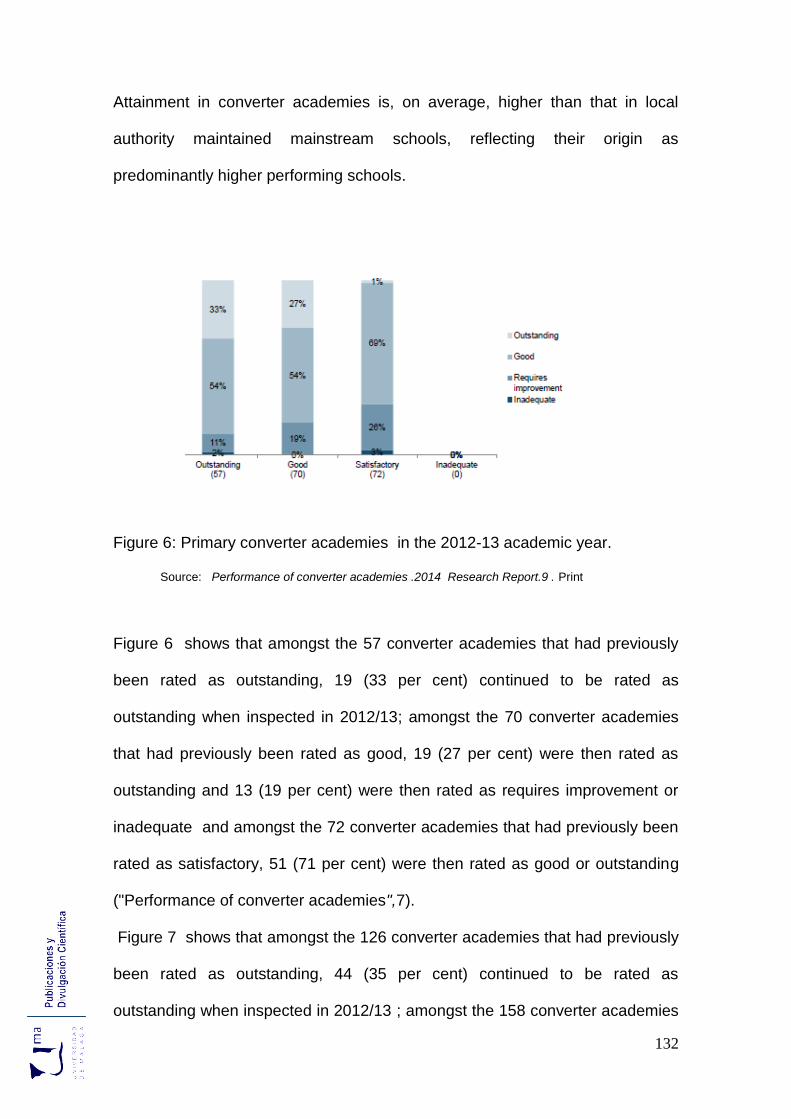
132
Attainment in converter academies is, on average, higher than that in local
authority maintained mainstream schools, reflecting their origin as
predominantly higher performing schools.
Figure 6: Primary converter academies in the 2012-13 academic year.
Source: Performance of converter academies .2014 Research Report.9 . Print
Figure 6 shows that amongst the 57 converter academies that had previously
been rated as outstanding, 19 (33 per cent) continued to be rated as
outstanding when inspected in 2012/13; amongst the 70 converter academies
that had previously been rated as good, 19 (27 per cent) were then rated as
outstanding and 13 (19 per cent) were then rated as requires improvement or
inadequate and amongst the 72 converter academies that had previously been
rated as satisfactory, 51 (71 per cent) were then rated as good or outstanding
("Performance of converter academies",7).
Figure 7 shows that amongst the 126 converter academies that had previously
been rated as outstanding, 44 (35 per cent) continued to be rated as
outstanding when inspected in 2012/13 ; amongst the 158 converter academies

133
that had previously been rated as good, 26 (16 per cent) were then rated as
outstanding and 44 (28 per cent) were then rated as requires improvement or
inadequate and amongst the 109 converter academies that had previously been
rated as satisfactory, 57 (52 per cent) were then rated as good or outstanding
("Performance of converter academies",8).
Figure 7: Secondary converter academies in the 2012-13 academic year.
Source: Performance of converter academies .2014 Research Report.9 . Print

134
6.4 The impact of academy chains
In 2010 the NAO analysed the GCSE results for academies from 2003/04 to
2007/08. It found that while academies had some way to go to match the
national average for the percentage of pupils achieving five or more A*‑C
grades at GCSE, or equivalent, they were nonetheless making good progress
against comparable maintained schools
However, some academies were performing exceptionally well and others
making little progress; this wide variation cannot be fully explained by either
relative local deprivation levels or pupils’ prior attainment.
In connection with attendance and educational achievement, as figure 8
reflects , academies had higher absence rates than the maintained-sector
average, but rates were falling faster than in other schools.
Figure 8: Absence in academies from 2001 to 2009.
Source: The Academies Programme NAO. 22. Print

135
Increasing the staying-on rates for pupils after 16 is an important measure of
educational success. Most academies were keen to develop sixth forms, both to
help raise pupils’ aspirations and to attract and retain quality teaching staff. By
2009-10, 174 of the 203 academies had established a sixth form ( "The
Academies Programme", 30).
Figure 9 shows that between 2008/09 and 2010/11 secondary academies on
average improved at a faster rate than that for all secondary schools in
England. Thus, the gap between the average performance of academies and all
secondary schools has narrowed from 13.4 to 10.1 percentage points.
Figure 9: Academies-schools. Five A*‑C grades at GCSE
Source: Hill, R, et al. The growth of academy chains Nottingham: Implications. NCL, 2012. .23. Print
No specific features of academies have been identified to be associated with
particular rates of improvement. Nevertheless, some academies are believed to

136
have rejected inner school applications but welcomed those from leafy suburb
in order to better the outcomes.( Bates, 2013: 288).
6.5 The organisation and management of academy chains
The development of academy chains is taking place against the backdrop of an
unprecedented squeeze in public finances. Schools face considerable financial
pressures.
Some sponsored academy chains contribute 3 per cent or less of their general
annual grant, GAG, to the chain to cover central running cost. In more than
three quarters the contribution is 4.5 per cent or less and there are only two
academy chains where the contribution is higher than 6 per cent. The two
chains with the highest percentage are both smaller chains, figure 10. To put
these figures in context a 1 per cent contribution might on average equate to
around £50,000.
Figure 10: GAG percentage by academies in sponsored academy chains
Source: Hill, R, et al. The growth of academy chains Nottingham: Implications. NCL, 2012.79. Print

137
The GAG is the base of the funding of three-quarters of the academies in
sponsored chains. However, the per capita funding for academies within a chain
can vary significantly according to their pupil profile and the local authority in
which they are located. A minority of academy chains have decided to smooth
some of these differences according to the specific needs and circumstances as
a consequence of the backdrop of the unprecedented squeeze in public
finances. Figure 11 shows the arrangements to solve the funding discrepancies.
Figure 11: Funding arrangements.
Source: Hill, R, et al. The growth of academy chains Nottingham: Implications. NCL, 2012.78. Print
On the other hand, in several cross-phase federations, secondary schools are
opening up their finance, HR, payroll and other services to primary academies
in the chain and to other local primary schools. This builds on the work of
National College programmes aimed at developing the use of business
managers across clusters of schools

138
Building up central services is seen by some chains as a challenge. In one
chain, an umbrella trust, no arrangements for providing shared support services
are yet in place. It is intended that schools in the chain will buy into a service
level agreement for a range of services such as HR, payroll and executive
headship.
Unsurprisingly, larger chains employ more non-education support service staff
than smaller chains, figure 12. The chain employing the largest number of staff
is a chain whose support services were set up around a central model. The
chain is working to a different approach from most other chains that to a degree
use more school-based staff for some functions.
Figure 12: Centrally employed non-education staff.
Source: Hill, R, et al. The growth of academy chains Nottingham: Implications. NCL, 2012..Print .77. Print
Authorities have to determine whether, on what basis and for which services it
is still viable to provide central support.

139
6.6 Sponsorship and governance of academy chains
The National Audit Office in its 2010 report on academies identified eight
different types of academy sponsor: non-faith-based charitable organisation,
faith-based charitable organisation, successful school, corporate, local authority
co-sponsor, philanthropic, higher education and further education (33).
The different categories of sponsor with chains of three or more academies is
displayed in figure 13. The successful school is made up by more than 20
sponsored academies; the charitable non-faith based organisation is made up
of roughly more than 10 sponsored academies; the charitable faith-based
organisation is made up of more than 6 sponsored academies; philanthropic
individuals is made up of 5 sponsored academies; further education college,
higher education and corporate institutions are made up of less than 5
sponsored academies. Thus, successful schools are increasingly the
sponsorship engine in the growth of school chains ( Smith, 9).
Figure 13:Academies by category of sponsor.
Source: Hill, R, et al. The growth of academy chains Nottingham: Implications. NCL, 2012.44. Print
0 5 10 15 20 25
Sucessful schools
Charitable non-faith-based org
Charitable faith-based org.
Philanthropic individual
Further education college
Higher education institution
Corporate
Number of academy chains

140
The role of sponsors covers differing values, motivations and notions of
accountability, educational skills/knowledge and experience. The emphasis
upon the need for such skills are recommended in Carmichael and Wild’s 2012
report on the creation of a ‘more professional approach’ to governing ( "Stronger
Boards Better Education", 6). This prospect has significant implications for the
principle of ‘stakeholder’ governance of schools. This principle is regarded as
the firm basis for children’s learning (Smith, 10).
However, the directors have the duty to intervene as and when necessary in the
governance of an individual academy, and they may remove any or all of the
delegated functions, including those for the budget and staffing, from a
governing body if this is in the best interests of the students and staff at a
particular academy (Hill, 47). See figure 15 below for different types of
governing bodies.
Figure 14: Proportions of governor types.
Source: The Academies Programme NAO. 39. Print
141
The array of different types of governing bodies for academies seems to be a bit
confusing because of the nuances in governor's duties. Efforts are being made
to simplify it in order to make it flow and work more effectively.
6.7 The future development of academy chains
In relation to the primary sector, there are ambitious plans for the expansion,
figure 15; a particular feature of that planned expansion is that chains are
contemplating taking on clusters of six or more primary schools at the same
time. Therefore, a number of chains are in discussions with the DfE and local
authorities about taking on clusters of primary schools since primary schools
are incorporated into chains in this way it could in certain areas raise the issue
of choice for parents.
Figure 15: Projected growth .Primary schools. by 2014.
Source: Hill, R, et al. The growth of academy chains Nottingham: Implications. NCL, 2012.29.Print
In terms of further expansion, there is one constraint which may be the DfE’s
ability to provide a sufficient secondary school suitable for academy

142
sponsorship. Some smaller sponsored chains expressed their inability to grow
due to the fact that the DfE may be ’running out’ of secondary schools to steer
towards sponsored academy status. However, Figure 16 shows that there are
only two smaller chains that have really ambitious plans to incorporate more
secondary schools into their chain, with one chain aiming to add 16‑20
secondary academies by 2014. The rest are looking to add between three and
five secondary schools a year.
Figure 16 : Projected growth .Secondary schools. by 2014.
Source: Hill, R, et al. The growth of academy chains Nottingham: Implications. NCL, 2012.29.Print
However, some academy chains are claimed to be too managerial overlooking
the learning process; thus, 14 chains have been banned from taking on new
schools.

143
Education minister Edward Timpson said " When we do have concerns about
the performance of academy sponsors , we act quickly by stopping them from
taking on new projects, so that they focus on their existing schools and ensure
that pupils receive a good education". (TES News.co.uk)
A new turn in Education is about to be launched as academy results are not
exactly what were expected; a new reconsideration of the academy system is to
be organized in order to lead them back into the right path of excellent learning.
6.8 Conclusion
The pace of expansion is considered to be too fast and a significant level of risk
can be created alongside. On the contrary, Michael Gove, secretary of state
confirmed that pace of chain formation and expansion was adequate and
manageable and that chains would be granted with the capacity to deliver each
new project ( Hill, 94).
However, the future of the chains are still to be seen just because new
economic problems , logistic structures and unexpected outcomes have to be
considered; a new approach is being planned out in order to keep back the
original reason of the chains , that was to improve academic achievements
leading to a better qualified population.
The majority of sponsored academy chains mostly comprise secondary schools.
The primary sector is still relatively uninvolved in either the chains’ or
academies’ agenda.
In connection with the development of collaborative chains, it poses challenges
at two levels. First, the terminology, the academies in collaborative partnerships

144
do not see themselves as chains; thus, new concepts are to be developed
(Hill, 100).
The second challenge is that some schools, that would not qualify for academy
status under the DfE criterion, are being approved to become academies
because they have been linked with another academy that has a higher Ofsted
rating. Some doubts have been raised on the effectiveness of those schools in
the improvement strategy.
A key part of the government’s strategy on raising the performance of schools is
to make publicly available data on schools’ activities, outputs and outcomes.
The DfE indicated that academies performing below the government’s minimum
targets would be addressed. However, it can take time for the full impact of
chains and federations to take effect.
With respect to the challenges that converter academy chains are facing in
incorporating voluntary aided schools into their chain, many diocesan church
bodies are steering those church schools minded to convert to academy status
within an umbrella trust comprising same-faith schools, so a chain has to
safeguard the religious character, education and practice of the school.
Nevertheless, little attention has been paid to the many local campaigns against
academies. This neglect creates a lot of problems for strategies and discourses
of social justice ( Hatcher, 2010 :330).

145
Chapter 7: Bullying Bullying among schoolchildren is certainly a very old phenomenon. The fact that
some children are frequently harassed has been described in early literary
works School bullying has been of a serious concern in the UK since 1989,
when the government's Elton Report on discipline appeared.
A much-used definition of bullying or victimisation is :" A student is being bullied
or victimised when he or she is exposed, repeatedly and over time , to negative
actions on the part of one or more other students" ( Olweus, 62).
Nevertheless, this definition has to be expanded to a new participant; teachers
are also bullied and the problem now goes to either way.
The aim of this chapter is to raise awareness of the efforts made by all the parts
involved in giving a real solution to this disruptive behaviour.
Let's have a closer analysis.
7.1 Introduction
Bullying has often been excused or ignored within schools as a normal part of
growing up , as a rite of passage in childhood, or an example of " boys being
boys" and " kids being kids" ( Theriot, 2008, 80).
However, Bullying damages the physical, social, and emotional well-being of
its victims. It also hurts the children who bully, as well as those who watch it
happen. In fact, bullying creates a climate of fear, callousness, and disrespect
for everyone involved.
Bullying begins in the preschool years, peaks in early adolescence, and
continues, but with less frequency, into the high school years. Members of the
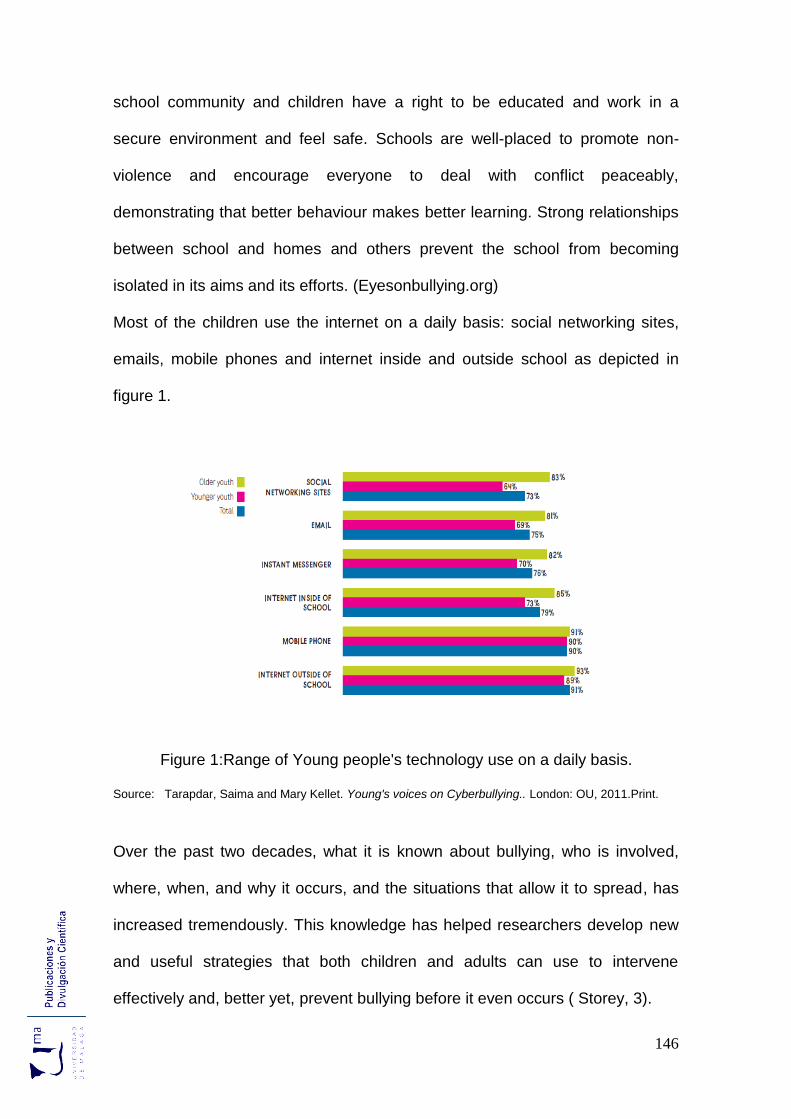
146
school community and children have a right to be educated and work in a
secure environment and feel safe. Schools are well-placed to promote non-
violence and encourage everyone to deal with conflict peaceably,
demonstrating that better behaviour makes better learning. Strong relationships
between school and homes and others prevent the school from becoming
isolated in its aims and its efforts. (Eyesonbullying.org)
Most of the children use the internet on a daily basis: social networking sites,
emails, mobile phones and internet inside and outside school as depicted in
figure 1.
Figure 1:Range of Young people's technology use on a daily basis.
Source: Tarapdar, Saima and Mary Kellet. Young's voices on Cyberbullying.. London: OU, 2011.Print.
Over the past two decades, what it is known about bullying, who is involved,
where, when, and why it occurs, and the situations that allow it to spread, has
increased tremendously. This knowledge has helped researchers develop new
and useful strategies that both children and adults can use to intervene
effectively and, better yet, prevent bullying before it even occurs ( Storey, 3).

147
Violence-prevention can be a central feature of a school’s ethos; it can be
brought into the whole curriculum and serve as a basis for the promotion of self-
esteem and personal development. For some children, only the school
represents security in an uncertain, rapidly changing and often hostile world.
Although children are subject to powerful influences in the wider world, a school
must equip its students with the skills to avoid violence and face conflict with
confidence and restraint ( Varnava, 3).
Violence is a learned behaviour. Its roots lie in childhood. The most reliable
predictor of violence in adulthood is exposure to violence in childhood.
Approximately 60% of males who bullied others had at least one criminal
conviction by the age of 24 (Theriot, 2008, 80). It is not inevitable, but, any
particular child who grows up to be violent, even high-risk children, given
support, can be diverted from violence.
In order to have a better understanding of bullying , the following pages will be
dealing with .
Who is affected?: the Bully, the victim and the bystander.
Cyberbullying.
Homophobic bullying.
Teachers bullied.

148
7.2 Who is Affected?
The act of bullying is most often carried out by a boy or a group of boys rather
than by a girl or groups of girls; usually bullies victimize peers their own age
who are physically or emotionally weaker than them ( Safran , 2008: 48).
There are many variations on the precise definition of bullying. Until recently,
the assessment of bullying behaviour has been focused on the physical
aggression of bullies and its extreme ends, such as the middle and high school
shooting throughout the USA (Safran , 2008: 45). A definition of bullying,
outlined by Simpson, in Reducing bullying amongst the worst affected,
highlights the following four aspects:: repetitive and persistent, intentionally
harmful , involving an imbalance of power and causing feelings of distress, fear,
loneliness or lack of confidence ( 6).
Let's have a closer look at those four aspects:
Intention to harm: a person teasing another with the intention to
deliberately upset his/her is bullying.
Direct or indirect acts: bullying can involve direct aggression, such as
hitting someone, as well as indirect acts, such as spreading rumours.
Repetition: bullying involves repeated acts of aggression.
Unequal power: bullying involves the abuse of power by one or several
persons who are (perceived as) more powerful, often due to their age,
physical strength, or psychological resilience.
Nevertheless, a culture of silence often surrounds bullying because many
students consider bullies to be part of the school community or they lack the
necessary skills for reporting or they are convinced that nothing will be done

149
( Safran , 2008: 47). Thus, many children who are bullied never tell anyone.
Most bullying is not reported because children ( Storey, 6) :
1. Don’t recognize it as bullying.
2. Are embarrassed.
3. Don’t want to appear weak.
4. Believe they deserve it.
5. Don’t know how to talk about it.
6. Don’t have a trusted adult to confide in.
7. Think adults won’t understand.
8. Think nothing can be done about it.
There is much evidence to suggest that there are certain sections of the
population likely to experience bullying more frequently than is typical. But it is
also true that bullying is a regular experience for the majority of English
children, either as the victims of it or as bystanders. But just because children
don’t talk about it, it doesn’t mean bullying isn’t happening. Even when children
fail to report bullying, they often show warning signs ( Storey, 8) :
Unexplained damage or loss of clothing and other personal items.
Evidence of physical abuse, such as bruises and scratches.
Loss of friends; changes in friends.
Reluctance to participate in activities with peers.
Loss of interest in favourite activities.
Unusually sad, moody, anxious, lonely, or depressed.

150
Problems with eating, sleeping, bed-wetting.
Headaches, stomachaches, or other physical complaints.
Decline in school achievement.
Thoughts of suicide.
A 2010 Ofsted survey of 253,755 children and young people in England in
years 6, 8 and 10 found bullying to be widespread (Anti-Bullying
Alliance.org.uk).
25% of children and young people said they worried about bullying.
46% of children and young people said they had been bullied at some
point whilst at school.
Of those who have been bullied at some point, 29% had been bullied in
the last year.
A majority of school age children and young people in England are
bystanders.
66% claimed to have seen bullying at their school.
Figure 2 shows the frequency of different bullying types at different age groups.
This shows that both physical and non-physical bullying are comparably
common. While non-physical bullying (eg teasing, name calling, being ignored
or excluded) was slightly more common than physical bullying amongst girls,
the reverse is true amongst boys. The least common form of bullying was
extortion ,the handing over of money and possessions (Green,R. 7-8).
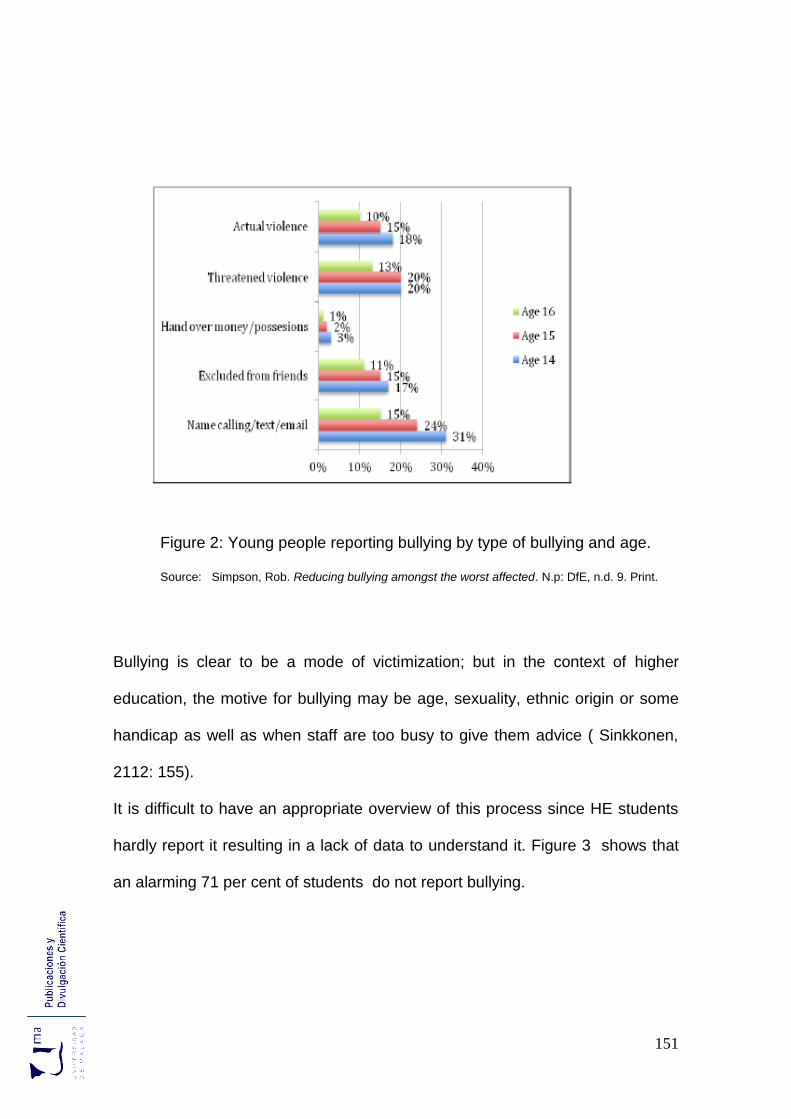
151
Figure 2: Young people reporting bullying by type of bullying and age.
Source: Simpson, Rob. Reducing bullying amongst the worst affected. N.p: DfE, n.d. 9. Print.
Bullying is clear to be a mode of victimization; but in the context of higher
education, the motive for bullying may be age, sexuality, ethnic origin or some
handicap as well as when staff are too busy to give them advice ( Sinkkonen,
2112: 155).
It is difficult to have an appropriate overview of this process since HE students
hardly report it resulting in a lack of data to understand it. Figure 3 shows that
an alarming 71 per cent of students do not report bullying.
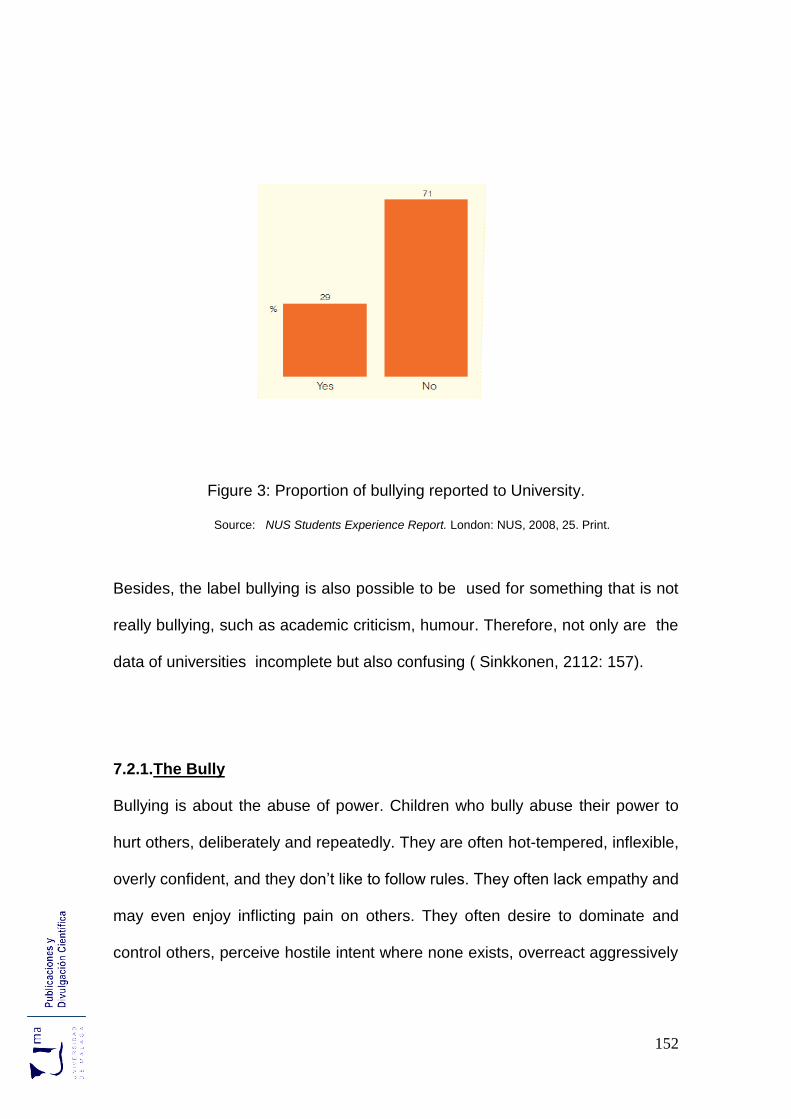
152
Figure 3: Proportion of bullying reported to University.
Source: NUS Students Experience Report. London: NUS, 2008, 25. Print.
Besides, the label bullying is also possible to be used for something that is not
really bullying, such as academic criticism, humour. Therefore, not only are the
data of universities incomplete but also confusing ( Sinkkonen, 2112: 157).
7.2.1.The Bully
Bullying is about the abuse of power. Children who bully abuse their power to
hurt others, deliberately and repeatedly. They are often hot-tempered, inflexible,
overly confident, and they don’t like to follow rules. They often lack empathy and
may even enjoy inflicting pain on others. They often desire to dominate and
control others, perceive hostile intent where none exists, overreact aggressively

153
to ambiguous situations, and hold beliefs that support violence
(Eyesonbullying.org).
Bullies typically come from homes that are physically abusive, lack positive role
modelling and offer wrong parental attention. In the cases where it is carried out
by minors it does not make them less than criminals (Borgwald, 2012: 152).
In the preschool years, bullies often rely on direct verbal bullying and physical
power to control material objects or territory. They may lack the skills to interact
in more socially appropriate ways.
In the elementary school years, bullies are more likely to use threats and
physical force, combined with direct verbal bullying, to make victims do things
against their will. At this age, some children begin to use indirect bullying to
exclude peers from their social circle.
In the middle and high school years, bullies rely on direct verbal bullying such
as name-calling and making threatening remarks, as well as physical bullying
such as pushing and hitting. Although both boys and girls engage in physical
bullying, girls are more likely to participate in indirect, relational bullying, such as
rumour-spreading and social exclusion (EDC.org).
In the college years, bullying can be vertical when someone bullies another
who is subordinate to him or her or it can also be when it occurs between two
equal persons ( Sinkkonen, 2112: 155).
To assist a bully to change his or her behaviour, the bully must be taught how to
interact with others. He or she needs to feel empathy for the victim in order to
repair his or her self-image. Empathy training and inclusion seem to be the right
strategies for addressing bully-stigmatization (Borgwald, 2012: 155).

154
7.2.2 The Victim
Victims of bullying include girls and boys of all ages, sizes, and backgrounds.
But some children are more likely than others to be victimized because they
appear small, weak, insecure, sensitive, or different from their peers.
Some children can reduce their risk of being bullied by dressing or acting in
ways that make it easier for them to fit in. Yet, every child’s individuality should
be appreciated for the value it brings to the group, rather than suppressed to
reduce the risk of victimization. Furthermore, not all children are able to alter
personal characteristics that may place them at increased risk.
Victims tend to share these characteristics:
Table 1 : Overview of factors found to be associated with bullying.
Source: Green , Rosie, et al. Characteristics of bullying victims in schools. the UK: DfE, 2010.34 Print

155
Children who are repeatedly bullied tend to be passive. The main
characteristics are: being female, having a special education need, having a
disability, living in a single parent family or step family, having care
responsibilities, having been in care, having changed school, attending a school
with more pupils with SEN. Potential victims can reduce their risk of being
bullied by learning how to: exhibit self-confidence, respond with assertiveness,
avoid the bully’s tactics and obtain support from others (PSUSD.us).
7.2.3 The Bystander
Bullying situations usually involve more than the bully and the victim. They also
involve bystanders—those who watch bullying happen or hear about it.
An important new strategy for bullying prevention focuses on the powerful role
of the bystander. Depending on how bystanders respond, they can either
contribute to the problem or the solution. Bystanders rarely play a completely
neutral role, although they may think they do ( "Stand Up Against Bullying:
Guide for Students and Parents pamphlet ").
There are four categories depending on the bystander's attitude. Outsiders, who
do not experience bullying among their peers; defenders, who are likely to help
the victims; guilty bystanders, who do nothing to help bullied peers but they felt
guilty about it and unconcerned bystanders, who witness peers being bullied,
without feeling responsible ( Obermann, 2011 : 239).
All children can be empowered to become helpful bystanders. Adults can
prepare children for this role by discussing with them the different ways

156
bystanders can make a difference, and by letting them know that adults will
support them, if and when they step forward. Adults can also provide examples
of how helpful bystanders have shown courage and made a difference in real-
life situations and in their own experiences (Gordon, Sherri.2012).
Nevertheless, there are at least three reasons that explain why bystanders
rarely intervene. First, the fact that most bullying episodes have multiple
witnesses, intervention becomes less likely as children witnessing it may expect
others to take action. Second, the fact that bullies are often perceived as
popular and powerful, thus it may take a lot of courage to stand up against
them. Third, bystanders' attitude toward the victims, viewing them as subhuman
creatures ( Obermann, 2011 : 240).
In terms of teachers' reaction, teachers often hold misconceptions about
bullying. They believe that helping victims will make it worse and they regard
victims as responsible for the situation. Also, it has been reported that teachers
are generally less likely to discipline bullies of a different ethnicity than of their
own and more willing to discipline victims if their gender matched the gender of
the victims (Yoon, 2014: 2).
On the contrary, the majority of teachers have reported to need additional
training regarding how to intervene effectively in all forms of bullying.
7.3 Cyberbullying
Young people are using the Internet more than ever and most have Internet
access from home. For many children, the Internet is not simply a convenient
way to research or a fun afterschool activity - it is a big part of their social life.

157
Emailing and chatting with friends are children's most common online activities,
after studying and playing games. (NCPC.org). Despite the many advantages,
one negative aspect has been the promoter of cyberbullying. which has become
a worldwide phenomenon ( Baek, 2013 :226).
Cyberbullying is similar to other types of bullying, except it takes place online
and through text messages sent to mobile phones. The severity of its impact , in
comparison with traditional forms of bullying, is perceived as equally harmful
(Langos. 2014: 111). Cyberbullies can be classmates, online acquaintances,
and even anonymous users, but most often they do know their victims.
Some examples of ways kids bully online are ( "USA Department of Health and
Human"):
Sending mean, vulgar, or threatening messages or images.
Posting sensitive, private information about another person.
Pretending to be someone else in order to make that person look
bad.
Intentionally excluding someone from an online group.
Both boys and girls sometimes bully online and just as in face-to-face bullying,
tend to do so in different ways. Boys more commonly bully by sending
messages of a sexual nature or by threatening to fight or hurt someone. Girls
more often bully by spreading rumours and by sending messages that make fun
of someone or exclude others. They also tell secrets ("Stopcyberbullying
pamphlet").
158
Victims of cyberbullying, which takes place in the virtual world, experience many
of the effects in the real world such as drop in grades, low self-esteem, a
change in interests, depression or suicide (Baek,2013:228). However,
cyberbullying can seem more extreme to its victims because of several factors
( Mcafee, 14) :
It occurs in the child's home. Being bullied at home can take away the
place children feel most safe.
It can be harsher. Often kids say things online that they would not say in
person, mainly because they cannot see the other person's reaction.
It can be far reaching. Kids can send emails making fun of someone to
their entire class or school with a few clicks, or post them on a website for
the whole world to see.
It can be anonymous. Cyberbullies often hide behind screen names and
email addresses that do not identify who they are. Not knowing who is
responsible for bullying messages can add to a victim's insecurity.
It may seem easy to get away from a cyberbully by just getting offline, but
for some kids not going online takes away one of the major places they
socialize.
Cyberbullying can be a complicated issue, especially for adults who are not as
familiar with using the Internet, instant messenger, or chat rooms as kids. But
like more typical forms of bullying, it can be prevented when kids know how to
protect themselves and parents are available to help.

159
According to Saima Tarapdar, Young voices' on Cyberbullying, the most
accessible forms of technology became the most used methods of bullying.
‘Abusive emails’ ,26%, were the most popular, followed closely by ‘abusive
texts’,24%, and ‘prank and silent calls’ ,19% (22).
Figure 4: Forms of cyberbullying experienced by young people (%).
Source: Tarapdar, S. Young's voices on Cyberbullying. London: OU, 2011. 20 Print.
In term of how many forms are used, 48 % of victims were bullied using one
method .On the contrary, a total of 52% of young people were bullied with
numerous tools ,25% through two methods and 27% using three or more
( Tarapder, 20) .
In connection with the moment in time that cyberbullying happens, figure
4,periods away from school became the primary location of concern, 56%, felt
stalked within ‘the home’, and 15% ‘whilst travelling’, even in the company of
other peers and friends (Figure 5). The main problem in this issue is the gap in

160
knowledge of technology between parents and their children. Some of them see
the need to strike a balance between providing freedom of use, applying
conditions of use and being taught about the responsibility of usage, without
creating a form of censorship. Thus, parents could become more involved in
protecting and monitoring their children’s activity both directly and indirectly
( Tarapder, 25).
Figure 5: Expected moment in time that cyberbullying happens (%).
Source: Tarapdar, S. Young's voices on Cyberbullying. London: OU, 2011. 25 Print.

161
7.4 Homophobic bullying
Adolescent bullying has indicated that lesbian, gay, bisexual and transgender
(LGBT) youths are at an increased risk for victimization as well as an increased
risk for a range of mental health problems (Beckerman, 2014:196).
On the other hand, School bullying has largely neglected to explore how sexual
minority youth responds to homophobic victimization due to the fact that white
male victims are disproportionately portrayed in the media, which leads to the
belief that sexual minority youth of colour do not experience homophobic
bullying ( Panfit, 2013: 82).
Among the different type of bullying faced by LGBT youth, according to figure 6,
the most common ones are verbal abuse , 53 % , malicious gossip, 46% and
intimidating looks , 33% . The least common types are threatened with a
weapon and sexual assault, 3 % respectively.
Figure 6: Type of bullying faced by gay students.
Source: Guasp, April. The School Report. Cambridge: Stonewall, 2012.12. Print

162
Among the different places where LGBT students have been bullied, figure 6,
the most usual ones are in the corridors, 42%; in the school grounds, 46% and
during the lessons, 35%.
Figure 7: Places where bullying takes places.
Source: Source: Guasp, April. The School Report. Cambridge: Stonewall, 2012.14. Print
There is substantial evidence to indicate that homophobic bullying causes long-
term damage to young people The characteristic symptoms of posttraumatic
stress disorder, PSTD, are serious emotional distress and mental health
challenges, often enduring into early adulthood. Profound depression, anxiety,
low self-esteem and patterns of self-harm have been identified. The more
bullied, the higher the level of PSTD is .(Beckerman, 2014:198).
According to April Guasp's 2012 research, The Teacher's Report, revealed that
the main consequences of being bullied at school are as follows (25):

163
Attainment and aspiration:
More than two in five (43 %) lesbian, gay and bisexual pupils who experience
homophobic bullying and even one in three (35 %) gay pupils who haven’t
been bullied don’t feel that they are achieving their best at school.
Skipping school :
Seven in ten (70 %) lesbian, gay and bisexual pupils skip school at some point.
One in seven (13 %) bullied pupils skip school more than six times. Almost a
third (29 %) of gay pupils who are bullied say they’re likely to miss school in the
future.
Mental health :
One in four (26 %) lesbian, gay and bisexual young people who are bullied say
they feel guilty about it. Three in five (61%) feel embarrassed and more than
two in five (42 %) say they feel ashamed.
Self-harm:
More than half (56 per cent) of gay young people deliberately harm themselves,
which can include cutting or burning themselves. However lesbians and
bisexual girls are twice as likely as gay and bisexual boys to self-harm.
Depression:
Rates of depression among lesbian, gay and bisexual pupils are high. On this
basis, almost half (46 per cent) of gay pupils who experience homophobic
bullying have depression.
Suicide :
Nearly one in four (23 %) lesbian, gay and bisexual young people have tried to
take their own life at some point. Seven in ten (71 %) lesbian and bisexual girls
and almost six in ten (57 %) gay and bisexual boys have thought about taking

164
their own life, with boys who are black or ethnic minority at particular risk of
suicidal thoughts at 76 per cent.
The percentage above mentioned illustrates how serious the problem can be;
students are being bullied with grave consequences in their well-being and
psychological welfare.
7.5 Teachers bullied
Poor working conditions are the main reasons for workplace bullying which
emphasizes the responsibility of the employer to provide better working
conditions (Notelaers, 2009:488).
At any schooling venue, the role of teachers has to be reinforced as the
ultimate authority; when this role is broken , teachers may become the victims
of bullying in a variety of ways. Disruptive classroom behaviour is one way in
which students seize power in class and use it to distress a teacher. When the
bullies are black boys, teachers feel very intimidated and they are unsure of
how to discipline them (Panfit, 2013: 82) .Vandalism, such as keying cars and
causing flat tires, and theft of teachers' property, as well as verbal abuse are
other ways in which students abuse teachers as well as physical attacks.
While teacher bullying by students may pass onto school discipline, student
bullying by teachers may pass without any consequence. Web postings in
which anyone can say anything about any teacher and sharing video filmed
during class are two ways to defame teachers. Another form of bullying is false
reports about teachers given by the students to the school or the school board.

165
Teachers may also be the victims of bullying by other teachers, by the school
administration, and by the school board. ( Bullyinginstatistics.org)
Table 2: Teachers bullied at work.
Source: NASUWIT. Workplace Bullying in Schools and Colleges. Birmingham: TU., 2012. 10.Print.
With regard to the frequency of bullying by other member of staff in the
workplace, adult workplace bullying appears to be more prevalent in 2011 than
in 1995, as Table 2 above shows In 1995, adult workplace bullying as rare or
none was just 50%. The equivalent figure in 2011 is 34%. The increase comes
with the sometimes/ frequent category as 50% in 1995 and 66% in 2011.
In connection with the sex of victims, an increase of 10 % in the proportion of
women bullying has been reached making female teachers more vulnerable
than ever.
Table 3: Sex of persons bullied.
Source: NASUWIT. Workplace Bullying in Schools and Colleges. Birmingham: TU., 2012. 12.Print.

166
The consequences of adult workplace bullying on the person being bullied have
also been taken into account. The most serious consequences, as table 4
shows, are loss of confidence, 21%, for both in 1995 and 2011, dread of going
to work reaching 18% in 2011 and sleepless nights reaching 17% in 2011.
Table 4: Teachers bullied consequences.
Source: NASUWIT. Workplace Bullying in Schools and Colleges. Birmingham: TU., 2012. 13-14.Print.
Even, worst cases have led to the extreme decision of committing suicide
among teachers. The table below shows how serious is the subject as 3.95 %
of teachers in the same number of population committed suicide in 2008.
Table 5: Teacher's suicide rate.
Source: NUT Health and Safety Unit.. Teacher Stress in Context. Sept 2008.
2011 1995
Loss of confidence 21% 21%
Dread of going to work 18% 16%
Sleepless nights 17% 15%
Damaging effect on family 8% 8%
Panic attack 6% 8%
Left job 6% 5%
Extended absence 5% 5%
Some other socio/medical symptom 5% 6%
Frequent absence 4% 5%
Surrender of post responsibility 2% 3%
Smoking/drinking/drugs 2% 5%
Suicide rate in England and Wales per 100,000 population 10.25
Suicide rate per 100,000 teachers in England and Wales 14.20
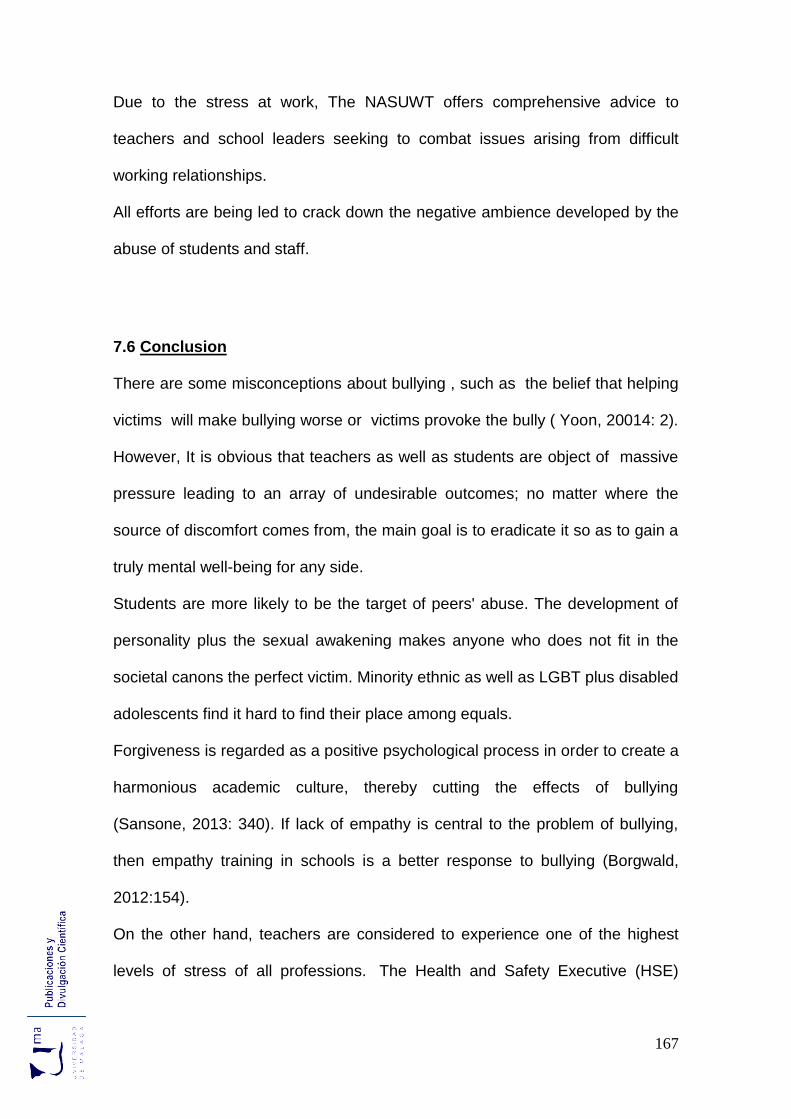
167
Due to the stress at work, The NASUWT offers comprehensive advice to
teachers and school leaders seeking to combat issues arising from difficult
working relationships.
All efforts are being led to crack down the negative ambience developed by the
abuse of students and staff.
7.6 Conclusion
There are some misconceptions about bullying , such as the belief that helping
victims will make bullying worse or victims provoke the bully ( Yoon, 20014: 2).
However, It is obvious that teachers as well as students are object of massive
pressure leading to an array of undesirable outcomes; no matter where the
source of discomfort comes from, the main goal is to eradicate it so as to gain a
truly mental well-being for any side.
Students are more likely to be the target of peers' abuse. The development of
personality plus the sexual awakening makes anyone who does not fit in the
societal canons the perfect victim. Minority ethnic as well as LGBT plus disabled
adolescents find it hard to find their place among equals.
Forgiveness is regarded as a positive psychological process in order to create a
harmonious academic culture, thereby cutting the effects of bullying
(Sansone, 2013: 340). If lack of empathy is central to the problem of bullying,
then empathy training in schools is a better response to bullying (Borgwald,
2012:154).
On the other hand, teachers are considered to experience one of the highest
levels of stress of all professions. The Health and Safety Executive (HSE)

168
estimates that job-related stress, anxiety or depression affects 36,000 UK
teachers annually (Teacher Support Network.info).
Awareness of the situation is already settled down in society. Thus, the main
objective has been reached. Progress has been achieved in this sense ,
however there is yet a long way to go to make things work smoothly; agencies,
staff , students, parents are all really involved in this issue; there is only hard-
work and hope to make it reverse for the sake's of all of us.

169
Chapter 8: Multicultural Classroom.
The concept of diversity has come to represent cultural, ethnic, racial and
religious differences. (D'Cruz, 2007 : 35). Immigration to the United Kingdom is
likely to continue at relatively high rates. A substantial new generation is
emerging from current and future influxes. Already, more than half of London’s
school-age pupils are the children of immigrants (Saggar,2).
In 2008 there were 4,285 applications for asylum from unaccompanied children:
They are entitled to receive legal aid, regardless of age (Rice, 5).
It is vital to fight against racism in order to maintain social harmony. Thus,
promoting multiculturalism plus conventional antiracism is the key to keep the
unity of the nation (Cole, 1998: 37).
The aim of this chapter is to appreciate the governmental efforts to make new
comers or British-born new generation part of the same society.
Let's have a closer look.
8.1 Introduction
Until 1999 anti-racism was widely portrayed in Britain as a dangerous and
extreme political ideology, associated to socialist councils who took issues such
as race and gender equity seriously ( Gillborn, 2007; 12).
Traditionally, multicultural education was perceived as teaching children about
other cultures and how to respect them while at the same time improving the
self-image of ethnic minority or immigrant children. There exists a general
agreement that for multicultural education to be implemented successfully,
changes must be made at an institutional level.
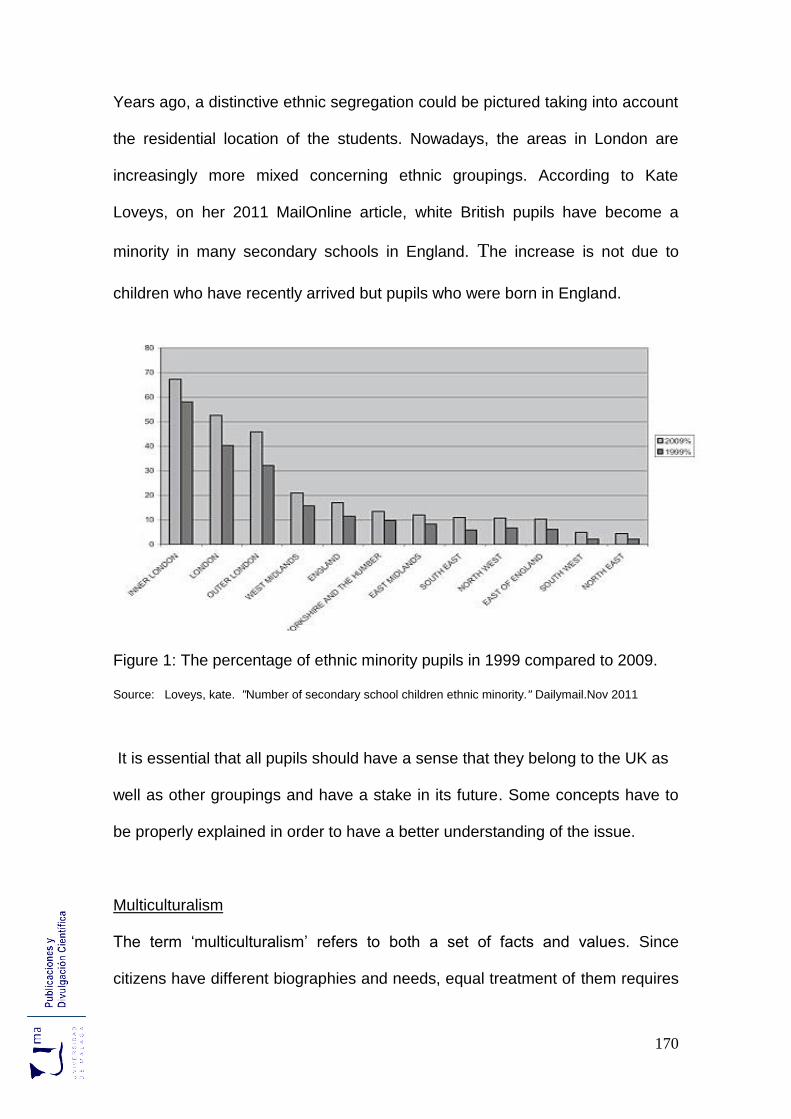
170
Years ago, a distinctive ethnic segregation could be pictured taking into account
the residential location of the students. Nowadays, the areas in London are
increasingly more mixed concerning ethnic groupings. According to Kate
Loveys, on her 2011 MailOnline article, white British pupils have become a
minority in many secondary schools in England. The increase is not due to
children who have recently arrived but pupils who were born in England.
Figure 1: The percentage of ethnic minority pupils in 1999 compared to 2009.
Source: Loveys, kate. "Number of secondary school children ethnic minority." Dailymail.Nov 2011
It is essential that all pupils should have a sense that they belong to the UK as
well as other groupings and have a stake in its future. Some concepts have to
be properly explained in order to have a better understanding of the issue.
Multiculturalism
The term ‘multiculturalism’ refers to both a set of facts and values. Since
citizens have different biographies and needs, equal treatment of them requires

171
full account to be taken of their differences. When equality ignores relevant
differences and insists on uniformity of treatment, it leads to injustice and
inequality; when differences ignore the demands of equality, they result in
discrimination. Equality must be defined in a culturally sensitive way and applied
in a discriminating but not discriminatory manner ( "The Parekh Repor"t, 4).
Every society needs a broadly shared body of values, there is a risk of defining
these so narrowly that their further development is ruled out.
Identity
The concept of personal, ethnic and national identity is a well- discussed topic.
All human beings share the same basic humanity that we should all be treated
equally; Anne Frank in her diary in 1944 wrote "The time will come ‘when we will
be people again and not just Jews" ( Frank, 261). She longed to be recognised
and treated as a human being.
However, the concept of shared humanity is an essential component in
education. Thus, being different from others, in terms of where we belong, is
also a fundamental and inescapable part of being human. To be human is to be
different (Richardson, 21).
Multiple identities
No single individual is just one thing. The Russian dolls, with one component
existing neatly inside another, helps illustrate this point, although the various
components of our identities, each formed by belonging to a particular
community, do not always live in sweet harmony with each other. Whilst they
can happily co-exist they can also be divisive and often people choose a loyalty

172
according to context and circumstance. The challenge for teachers, therefore, is
to aid young people in managing the conflicts and tensions within themselves.
Just as each individual is a mixture so is each group, community, culture,
society or civilisation. All communities change and all are complex, with internal
diversity and disagreements. Neither ‘minority’ nor ‘majority’ communities are
static; they change in response to their own internal dynamics and as a result of
the interactions and overlaps that they have with each other
(New2Teaching.org.uk)
Britishness and belonging
Most of the pupils currently in British schools might spend the rest of their lives
in Britain. In this sense "Britishness" should be an important part, though not the
only part, of their identity. All pupils need to be comfortable with terms such as
"Black British", "British Muslim" and "White British" and with the fact that there
have always been several ways of being British. Pupils also need to feel
comfortable with the fact that "Britishness" is continually evolving
( Richardson, 22).
In order to have a better understanding of the development of multiculturalism,
the following pages will be dealing with:
Schools can make the difference.
Primary, Middle and Secondary Diversity.
English as a minority language.
Shared Futures.

173
8.2 Schools can make the difference
Until 1999 anti-racism was widely portrayed in Britain as a dangerous and
extreme political ideology. Anti-racism is a familiar term in most educational
systems. Many attempts have been made to confront the complexity of life in
school, where social class, sexism and able-ism interact in an unpredictable
and sometimes deadly combination of oppressions ( Gillborn, 2007: 13).
An essential component of promoting race equality in schools is closing the gap
between the performance of certain communities and national averages, at all
key stages. The key ingredients of success are summarised below.
Leadership
Leadership is crucial to raising standards and aspirations and thus , well-led
schools provide the best educational experience and the highest standards for
their pupils. These skills are embedded in the National Standards, which set out
the knowledge, understanding, skills and attributes that good headteachers
must develop
New multicultural education has appeared. It avoids controversial aspects of
other people's cultures as cultural racism is emerging in contrast with traditional
racism based on genetic inferiority ( Cole, 1998. 38); so as to eradicate it,
education is the main tool to provide students with.
In order to make this happen , from April 2003, the Leadership Incentive Grant
was made available to secondary schools in some of the most challenging
areas and circumstances across the country (" Aiming High", 14).

174
Listening and empathy
Staff at all levels know the attractions of peer culture, youth culture and street
culture; they should make time to listen to and learn about the feelings,
perceptions, stories and concerns of the communities represented in the school
and show by their words and actions that they have empathy with them.
Furthermore, they understand the ways in which racism is expressed on the
streets, and negative stereotypes in the media, demoralise and demotivate
many young people as they grow towards adulthood and thus they should help
young people navigate their way between school, home, community and the
street (Kahn et al,3).
Monitoring and records
Schools should ensure that relevant information on ethnicity, gender, special
educational needs, socio-economic background, attainment in each curriculum
subject, and sanctions, including permanent and fixed-term exclusions is
gathered. They analyse the data to identify trends and take action to rectify
whatever inequalities they find ( "Race and Equality", 27).
Contact with complementary schools
Schools should establish and maintain good links with supplementary schools,
which are believed to have a positive impact in raising students' achievements.
In the 2005 Schools White Paper, new measures were shortlisted in order to
make the data flow more easily among the different departments involved
resulting in the creation of the Supplementary Schools' Coordination Project,

175
which has been established in response to the need to extend the support of
the sector ( "Developing Effective Partnerships", 37).
Primary/secondary transfer
The importance of effective and appropriate arrangements for the transfer of
pupils from primary to secondary schools as a means of ensuring curriculum
continuity and progression in pupils’ education is now widely recognised as a
crucial factor in school improvement.
" Narrowing the Gap" project is an example of the effort to pave the way to a
students' transition and to make sure all conditions are settled to reach good
academic achievements ( Powell et al, 2).
Conflict resolution
The 2002 Education Act requires each School Council to establish a procedure
for resolving disputes within the school community. In addition, the House of
Commons Education and Skills Committee has strongly recommended that
every school should be required to have a school council ( Whitty, 15).
As a consequence, there is a never-ending need to construct, review and
uphold rules, laws, customs and systems that all people accept as reasonable
and fair.
Furthermore, pupils themselves are to be trained in skills and techniques for
reducing, defusing and resolving conflict. (new2teaching.org.uk)

176
The language of the curriculum
English as an additional language (EAL) refers to pupils where the mother
language at home is not English. The school’s aims, objectives and strategies
should meet the needs of EAL pupils and help them to achieve the highest
possible standards
The development of academic English is not left to chance and focused
attention is paid by subject and class teachers, as well as by EAL specialists, to
this matter involving much use of structured oral work ("EAL policy Review
2013", n.p).
Inclusive curriculum
Inclusive teaching means recognising, accommodating and meeting the
learning needs of all students (Incurriculum.org.uk). All subjects are involved in
teaching ideas and concepts to break down barriers to learning by providing a
range of teaching and assessment methods, thus allowing all students to work
to their strengths (TCD.ie).
Besides, staff should be confident of no contradiction between striving for high
standards and striving to teach a multicultural curriculum.
Discussion and collaboration skills
In all curriculum subjects there is a focus on the teaching and practising of
discussion skills: listening, talking reflectively, summarising, affirming others,
taking turns, keeping to the point, using examples and anecdotes sensitively
and giving a fair hearing to others and their points of view ( "Race and Equality",
28).
Taking into account the above points, a new contemporary approach to diversity
towards an emphasis on economic benefits of ethnic, language, religious and

177
cultural differences is being settled down and known as productive diversity.
Everyone has something valuable to share in society ( D'Cruz,2007: 36).
8.3 Primary, Middle and Secondary Diversity
The term multicultural describes the cultural diverse nature of human society. It
not only refers to elements of ethnic or national culture, but also includes
linguistic, religious and socio-economic diversity ("UNESCO guidelines one
multiculturalism", 17)
Antiracist policies effort to achieve equality of opportunity; for that reason it is
relevant to have an idea of the nationality background of the students in order to
kmow the real needs of the members of a society.
The Pupil Level Annual Schools Census (PLASC) group ethnicity into 8
categories; White British, Black Caribbean, Black African, Indian, Pakistani,
Bangladeshi, Chinese, "Other" and "Missing", which represents all cases where
ethnicity of the pupil is unknown (GOV.UK/nationalpupildatabase).
The statistic is calculated by phase of education (primary, middle, or secondary
school). Unfortunately, not all ethnic groups in England have been included; just
the largest ethnic groups; therefore, groups which make up a small proportion of
an LA are not included.
Table 1 shows the percentage of schools in which white students are in
minority. The dominant ethnic groups in primary are Bangladesh 62.96%,
Pakistani 58.19% and Black Caribbean 45.39% ,White being just 0,98% ; in
middle schools the groups are Black African 42.44% and Indian 36.47% and
Pakistani 32.53% ,White being just 0.58% ; in secondary schools the groups

178
are Bangladesh 49.9%, Pakistani 38.50% and Black African 33.73%, White
being just 0.63% (measuring diversity.com).
Table 1: Percentage of pupils in schools. Source: www.measuringdiversity.org.uk.
In 2009 ,in terms of percentages of each group, Figure 2 shows that 32 per
cent of pupils in primary schools in England were White which is a dramatic
decrease from 45 per cent in 2002. The two most striking increases are Black
Caribbean going up from 21 per cent in 2002 to 29 per cent in 2009 and the
group regarded as Missing from 3 per cent in 2002 to 8 per cent in 2009.
England 2007
Group
Primary Middle Secondary
White 0.98% 0.58% 0.63%
Black Caribbean 45.39% 31.02% 32.44%
Black African 44.74% 42.44% 33.73%
Indian 41.82% 36.47% 32.02%
Pakistani 58.19% 32.53% 38.50%
Bangladesh 62.96% 21.45% 49.68%
Chinese 11.10% 8.10% 6.44%
Other 22.38% 20.00% 16.45%
Missing 10.55% 7.30% 7.14%
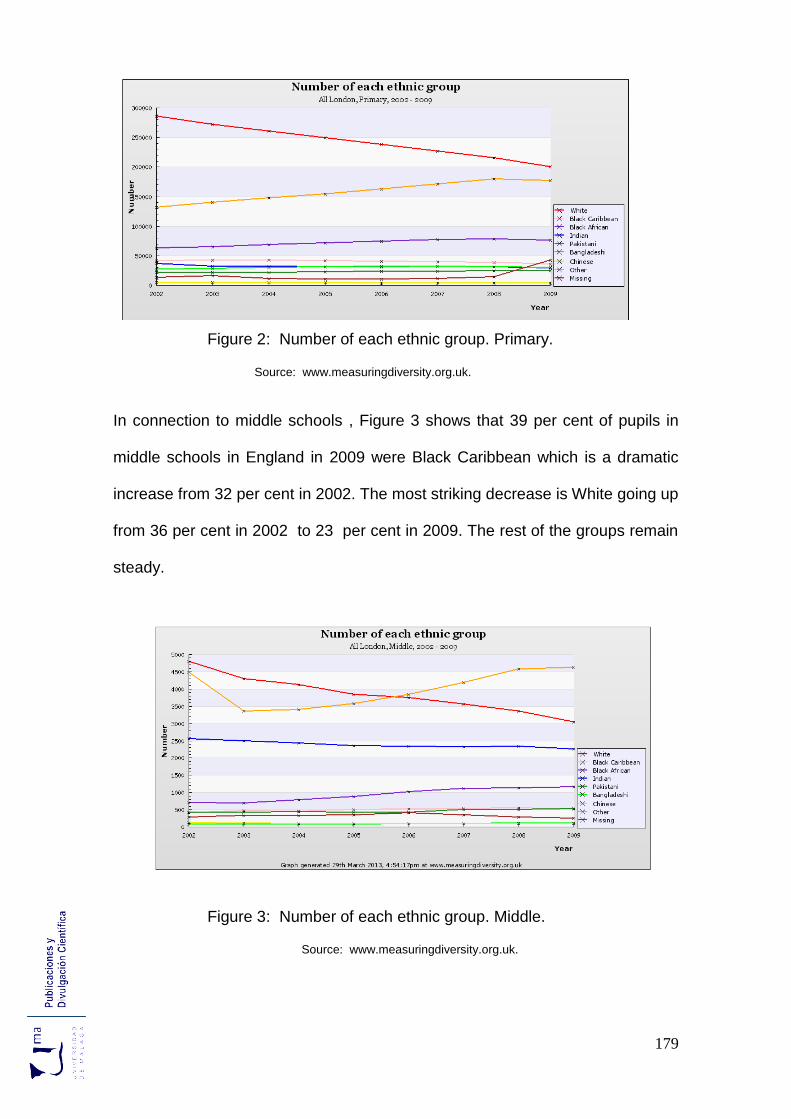
179
Figure 2: Number of each ethnic group. Primary. Source: www.measuringdiversity.org.uk.
In connection to middle schools , Figure 3 shows that 39 per cent of pupils in
middle schools in England in 2009 were Black Caribbean which is a dramatic
increase from 32 per cent in 2002. The most striking decrease is White going up
from 36 per cent in 2002 to 23 per cent in 2009. The rest of the groups remain
steady.
Figure 3: Number of each ethnic group. Middle. Source: www.measuringdiversity.org.uk.
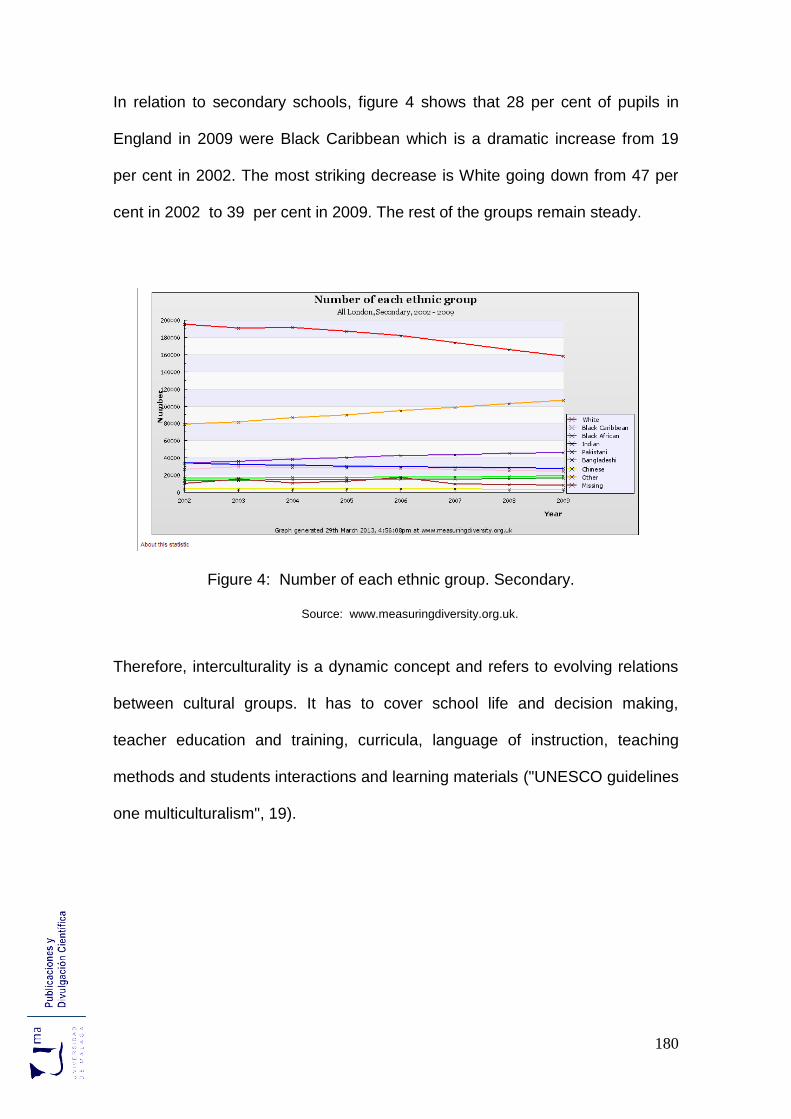
180
In relation to secondary schools, figure 4 shows that 28 per cent of pupils in
England in 2009 were Black Caribbean which is a dramatic increase from 19
per cent in 2002. The most striking decrease is White going down from 47 per
cent in 2002 to 39 per cent in 2009. The rest of the groups remain steady.
Figure 4: Number of each ethnic group. Secondary. Source: www.measuringdiversity.org.uk.
Therefore, interculturality is a dynamic concept and refers to evolving relations
between cultural groups. It has to cover school life and decision making,
teacher education and training, curricula, language of instruction, teaching
methods and students interactions and learning materials ("UNESCO guidelines
one multiculturalism", 19).

181
8.4 English as a minority language2.
The 1950s represents a significant time for Britain as its migrant population
began to dramatically increase. Classrooms were becoming home to a number
of students for whom English was not their mother tongue; at this point , it was
considered that students would pick up English in a natural manner ( Costley,
2013 :278).
However, the large number of EAL students arriving at different times through
the year began to create serious educational difficulties, which represented a
threat to the maintenance of academic standards. The idea of teaching English
as quick as possible was essential; nevertheless, teaching of EAL has never
been given subject status and the situation was never really solved (Costley,
2013 :284).
In 1997, when Tony Blair first came to power, there were 866 schools in
England where more than 50 per cent of the pupils had English as a second
language In 2012 ,The number of children who count English as their mother
tongue are in the minority at more than 1,600 schools across England resulting
in almost one million children who now attend schools in England not having
English as their first language at home.
Punjabi was found to be the most frequently spoken language among pupils
who did not have English as a first language followed by Urdu, Bengali,
Gujarati, Somali, Polish, Arabic, Portuguese, Turkish and Tamil; also, schools
have to cope with sizable populations of pupils who speak Albanian from
Albania and Kosovo, Ibo from southeast Nigeria, Luganda from Uganda,
Shindala from Sri Lanka and Amharic from Ethiopia.
2 Derived from Hills, Suzanneh ." English as minority language" . The Mail. November 2012.

182
It is estimated that ,In the 14 boroughs that comprise Inner London, there are
98,000 schoolchildren whose first language is not English, compared with just
79,000 who speak English at home.
Within the London boroughs, Newham had the highest amount with 79 schools,
followed by Tower Hamlets with 70, Brent with 57 and Ealing with 55 schools.
London was followed by Birmingham with 117 schools where more than 50 per
cent of pupils do not have English as their first language, Bradford came next
with 59 schools followed by Leicester with 40 schools. Manchester has 35
schools, while Lancashire has 30 schools and Kirklees has 27, Luton has 22
schools and Slough 19.
The local authority areas with the smallest proportion of pupils who have
English as a second language are Halton with 0.9 per cent and Redcar and
Cleveland also with 0.9 per cent. They are closely followed by Derbyshire with
1.3 per cent, Rutland 1.5 with per cent, St Helens with 1.5 per cent, and
Cornwall with 1.6 per cent.
Due to the actual multilinguistic educational background in England, the 1988
Swan Report was given back its importance as it highlighted the relevance of
creating comprehensive programmes of language education for all children; as
a consequence, the current Teacher Standards requires new teachers to have
" a clear understanding of those with English as an additional language" among
their other duties ( Costley, 2013 :288).
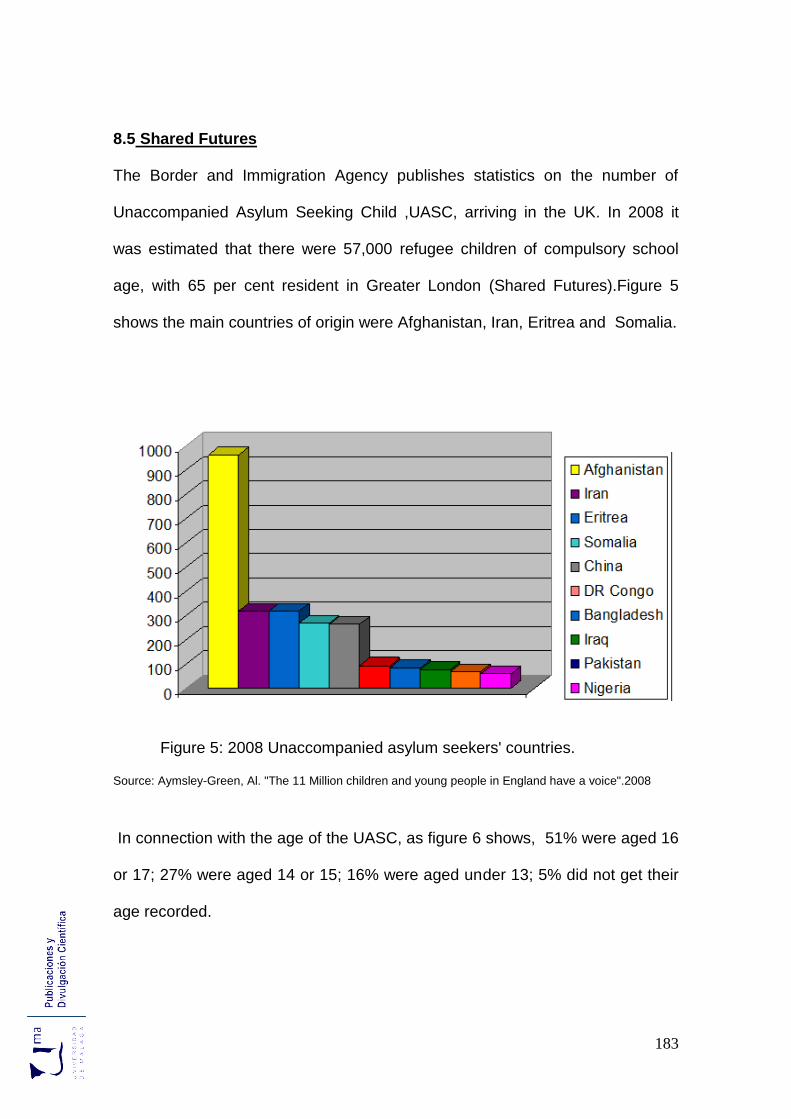
183
8.5 Shared Futures
The Border and Immigration Agency publishes statistics on the number of
Unaccompanied Asylum Seeking Child ,UASC, arriving in the UK. In 2008 it
was estimated that there were 57,000 refugee children of compulsory school
age, with 65 per cent resident in Greater London (Shared Futures).Figure 5
shows the main countries of origin were Afghanistan, Iran, Eritrea and Somalia.
Figure 5: 2008 Unaccompanied asylum seekers' countries. Source: Aymsley-Green, Al. "The 11 Million children and young people in England have a voice".2008
In connection with the age of the UASC, as figure 6 shows, 51% were aged 16
or 17; 27% were aged 14 or 15; 16% were aged under 13; 5% did not get their
age recorded.
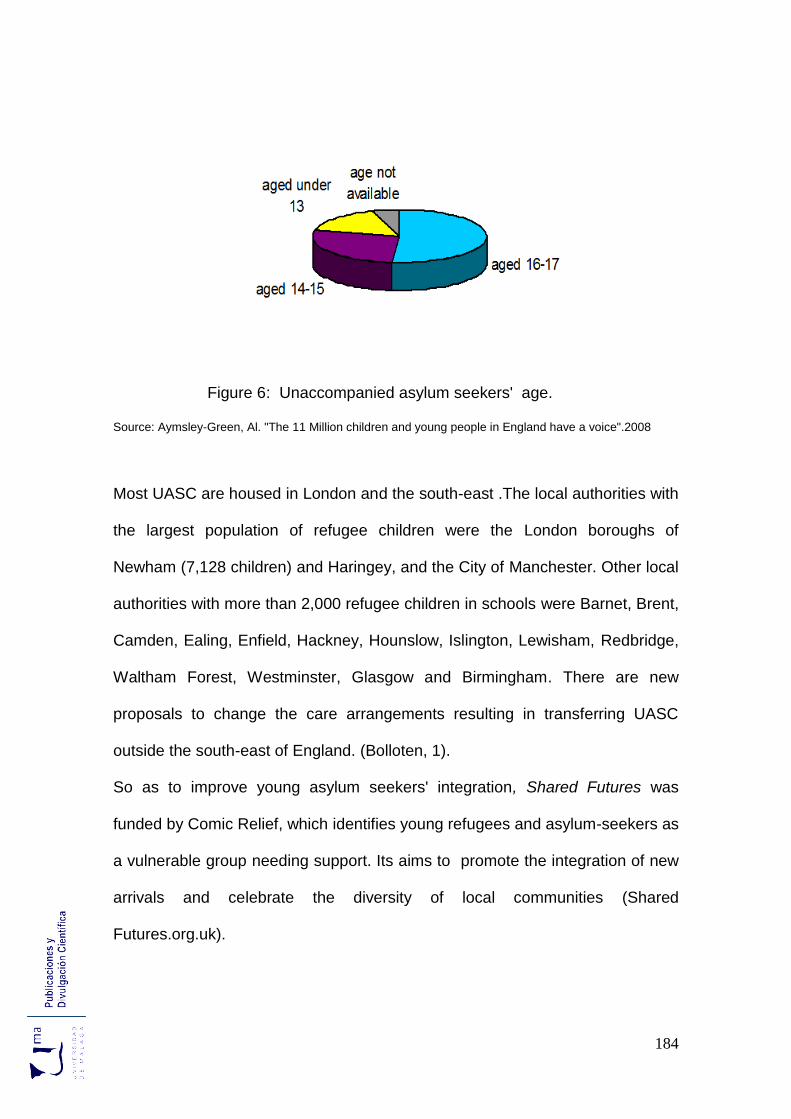
184
Figure 6: Unaccompanied asylum seekers' age. Source: Aymsley-Green, Al. "The 11 Million children and young people in England have a voice".2008
Most UASC are housed in London and the south-east .The local authorities with
the largest population of refugee children were the London boroughs of
Newham (7,128 children) and Haringey, and the City of Manchester. Other local
authorities with more than 2,000 refugee children in schools were Barnet, Brent,
Camden, Ealing, Enfield, Hackney, Hounslow, Islington, Lewisham, Redbridge,
Waltham Forest, Westminster, Glasgow and Birmingham. There are new
proposals to change the care arrangements resulting in transferring UASC
outside the south-east of England. (Bolloten, 1).
So as to improve young asylum seekers' integration, Shared Futures was
funded by Comic Relief, which identifies young refugees and asylum-seekers as
a vulnerable group needing support. Its aims to promote the integration of new
arrivals and celebrate the diversity of local communities (Shared
Futures.org.uk).

185
In 2009 and 2010, Shared Futures built on the work by schools and other
settings showcased in its DVD and assisted schools, community organisations
and youth work settings to develop new creative and innovative projects in
different cities such as Bristol, Kent, and Newport among others (Shared
Futures.org.uk).
Bristol: Bristol City Academy and Young Bristol took part in the creation
of a DVD about young people's lives in Bristol and welcoming new
people to their city. It enriches people's understanding of Bristol's
diversity ( Bristol City Council).
Kent: Myriad Adventures was helped to extend the country camping and
activity weekends they provide for unaccompanied asylum-seeker
children so that many more can benefit. The training day and weekend
activities were filmed ( Shared Futures.org.uk).
Newport : The Children’s unit at the Welsh Refugee Council provides a
range of child-centred services for asylum seeking and refugee children
throughout Wales, including advocacy services for separated children
and young people whose age is disputed, policy advice, guidance and
training, and specialist play sessions ( Clarke, 4).
British government is doing its best to try to integrate all children into its society
in order to accommodate the multicultural needs of an ever-changing
population. The main goal is to unite different people under the same feeling of
country.
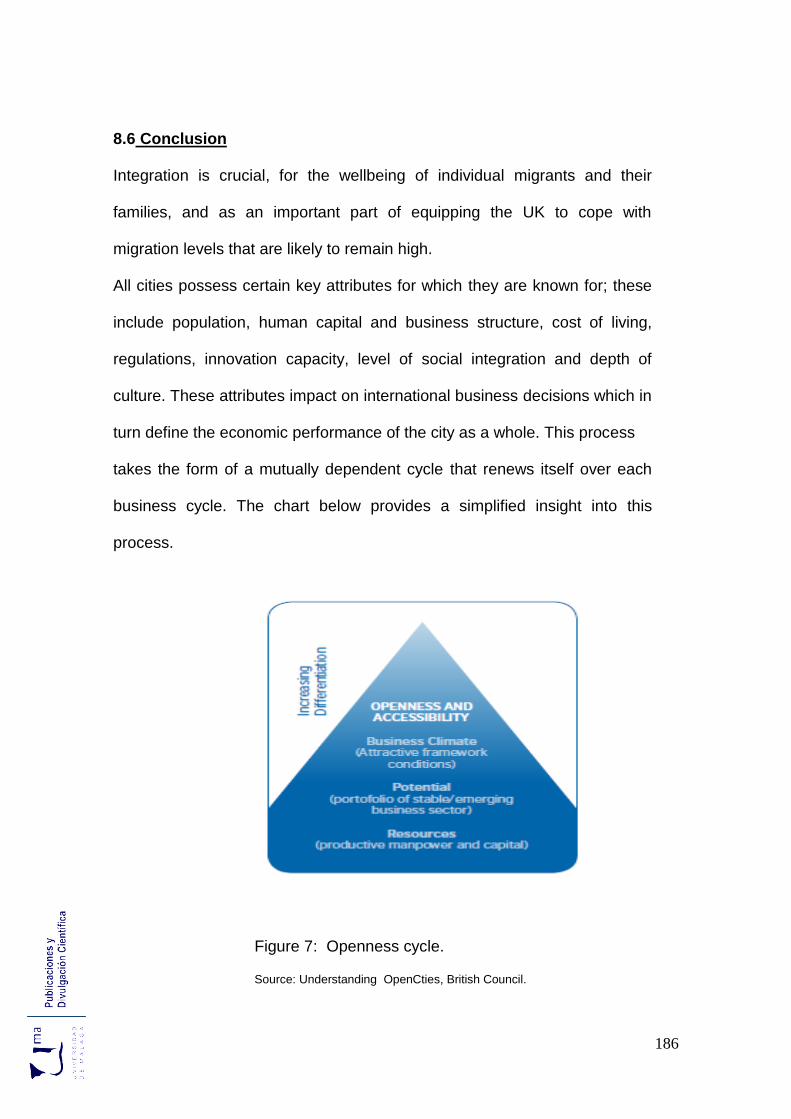
186
8.6 Conclusion
Integration is crucial, for the wellbeing of individual migrants and their
families, and as an important part of equipping the UK to cope with
migration levels that are likely to remain high.
All cities possess certain key attributes for which they are known for; these
include population, human capital and business structure, cost of living,
regulations, innovation capacity, level of social integration and depth of
culture. These attributes impact on international business decisions which in
turn define the economic performance of the city as a whole. This process
takes the form of a mutually dependent cycle that renews itself over each
business cycle. The chart below provides a simplified insight into this
process.
Figure 7: Openness cycle. Source: Understanding OpenCties, British Council.
187
Globalisation and recent migration processes change the role and nature of
contemporary cities. In some of them local authorities are facing a shortage of
working force, in others – the economic and social integration of the migrant
groups is the main issue.
The integration of new comers, especially children, is the most relevant tool
to make a country competitive in order to achieve which is necessary to
make the population live in harmony.
Headteachers have been found to hold the most positive attitudes to
integration, followed by special education teachers, with classroom teachers
having the most negative attitudes ( Avramidis, 132).
Nevertheless, this attitude is changing due to different programmes for
students and the fast-changing social scenarios.

188

189
Chapter 9 : Budgeting
The aim of this chapter is to understand how the British school funding
programmes are planned in order to make Education one of the most relevant
assets for the economic recovery.
Governments apply the basic HRM principles in connection with staffing
,obtaining people with appropriate skills, abilities , knowledge and experience
to fill jobs in the work organisation and with employee development analysing
training requirements to ensure that employees possess the knowledge and
skills to perform satisfactorily in their jobs or to advance in the organisation
( Bratton, 14).
Education is the only tool to make population an active workforce and this is
what the British and other governments have perfectly understood in their
policies
Let's have a closer look how the investment in Education is put into practice.
9.1 Introduction
The financial crisis of 2007-2008 and the consequent economic downturn have
had a huge impact on public finances in all European Union countries over the
last five years. Increasing public deficits and the level of public debt raised fears
about the sustainability of public finance in the European Union ( "Funding of
Education in Europe", 16).
This situation led the European Commission and Member States to take strong
action to stabilise and then consolidate their fiscal situation, including a decision
to strengthen governance through closer economic and budgetary coordination.

190
The reinforced Stability and Growth Pact (SGP) requires Member States to
‘make significant progress towards medium-term budgetary objectives for their
budgetary balances’ ( Ec.europa.eu). Member states need to limit public debt to
3 % of GDP (gross domestic product, thus ensuring the long-term sustainability
of public finances.
The forecasts of slow economic recovery, and the commitment of Member
States to foster budgetary discipline, require strong action on public spending to
lower government budget deficits and public indebtedness. In this context, all
areas of government, including education, would potentially be affected by
budget cuts ( "Funding of Education in Europe", 17).
The financial crisis has led to what is now considered as the worst economic
crisis to affect European economies since World War II, as figure 1 shows. The
real GDP declined over the 2008-2011 period in several Member States
(Denmark, Estonia, Spain, France, Italy, Luxembourg, Romania, Sweden and
the United Kingdom) as well as in Iceland and Croatia.
Figure 1: Real GPD growth rate.EU-27, 2000-2013.
Source: Eurostat. National accounts statistics. December 2012.

191
A deterioration of the fiscal situation occurred in all European countries;
countries that had the most solid fiscal position at the beginning of the crisis
were better likely to manage keeping the deficits around the 3 % of GDP limit.
The fiscal deficit stood at a two-digit level during two consecutive years (2009
and 2010) in Greece and the United Kingdom as table 1 shows. Ireland
recorded a two-digit government deficit during three consecutive years with a
peak in 2010 representing 31 % of the GDP. The best country to keep the
deficit down was Luxembourg reaching a -0.3 % of GDP limit ( "Eurydice
Report", 18).
Table 1: Budget deficits/surplus as percentage of GDP, 2007-2011
Source: ec.europa.eu/eurostat. National accounts statistics. December 2012
In nearly all European countries, the financial and economic crises have
worsened public indebtedness: France, the United Kingdom and Iceland had
gross debt ratios higher than the EU-27 average in 2011 as table 2 shows..

192
Table 2: Gross debt ratio as percentage of GDP,2007-2011.
Source ec.europa.eu/eurostat . National accounts statistics. December 2012
On the contrary, many countries have kept their education budgets stable
despite the crisis and declare that a shift in priorities towards a more efficient
use of resources has been carried out. This was one of the main goals for DfE
chaired by Chancellor George Osborne as announced in his plans for a fairer
funding formula ( BBC.com).
Budget priorities for education in 2013 for the United Kingdom, as figure 2
shows, aim to eliminate unnecessary bureaucracy and duplication, in order to
maximise the resources directed to actual teaching in the classroom plus
increasing the number of apprenticeships to help the young unemployed as well
as to implement the new curriculum for school education, which is intended to
provide young people with the skills and behaviours needed for tomorrow's
economy.

193
Figure 2: Changes in budgets. in 2013 compared to 2012.
Source: Noorani, S, et al. National Sheets on Education in Europe 2013. Luxembourg: EU., n.p. Print.
In order to have a better understanding about schooling funding , the following
pages will be dealing with:
Components of education spending.
Changes to school funding.
The British budgeting landscape.

194
9.2 Components of education spending
Education spending includes spending on the early years, schools spending,
further education (post-16 education outside of schools) and higher education.
There is also a distinction between current or day-to-day spending (e.g. teacher
pay and consumables) and capital spending (e.g. investment in new buildings
and ICT)( Chowdry, 5).
School finances are affected by funding changes resulting in the keep-on of
staff pay freezes and the fall in different educational projects. Around two-
thirds of primary schools and 80% of secondary schools have experienced
budget cuts over a three-year period; about half of primary and over 60% of
secondary schools are likely to see decreases of 5% or more. However ,to
make matters a bit better, on September 2013 the current two-year pay freeze
ended , thus schools started to fund a rise in staff salaries
( Sutcliffe.theguardian.com).
In order to illustrate how priorities have changed in recent years, table 3 shows
the average growth across these components of education spending between
April 1998 and March 2009 (for England only). Schools spending is broken
down into current and capital spending, and current spending is detailed
separately for under-5s, primary schools and secondary schools.
5s is the name of a workplace organisation method that uses Sort, Straighten,
Shine, Standardize and Sustain. It describes how to organize a work place for
efficiency and effectiveness ( Learnmanufacturingtools.com).

195
Table 3: Increases in various components of public spending.
Source: Chowdry , H and L. Sibleta. Trends in education and schools spending.N.p: ESRC, 2011, 6.Print
The components above that saw the fastest growth were schools capital
spending (12.9% per year) and further education spending (7.7% per year).
Day-to-day under-5s spending (6.1% per year), ‘other’ education spending
(5.6% per year) and day-to-day secondary school spending (5.0% per year)
have each grown at a similar rate (5.2% per year). Average growth in day-to-
day primary school spending has been slightly lower, at 3.9% per year.
However, higher education spending experienced the lowest growth over this
period (2.3% per year).
It is also important to examine trends in measures of spending per head across
different education sectors as student numbers have not been constant. Figure
3 shows the level of day to day public spending per head in schools, further
education and higher education over time. It makes clear the extent to which

196
growth in spending per student has been faster for schools than for other areas
of education spending.
Figure 3: Spending per student across different education sectors (1997-2011)
Source: Chowdry , H and L. Sibleta. Trends in education and schools spending.N.p: ESRC, 2011, 7.Print
Schools spending per pupil grew strongly, at about 5% per year. Further
education spending per student also grew, at about 2.7% per year on average,
leading to a standstill at just under £5,900 in 2010–11.Further education
spending per student was greater than schools spending per pupil in 2010–11,
but, due to higher growth in schools spending per pupil, the difference is much
smaller than it was in 1997–98.
In contrast, average growth in higher education spending per student has been
much lower, at 0.7% per year. This means that in 2010–11, higher education
spending per pupil was over £1,000 lower. This could be because of the
responsibility-centred budgeting which highlights value-centred management,
cost-centred and profit-centred budgeting (Zierdt, 2009: 348). However, while

197
spending on higher education grew, so did the total number of students in
higher education – at a much faster rate than in schools or further education.
9.3 Changes to school funding
Financial resources to schools is a subject of policy. " School finance is the
vehicle through which society makes its critical decisions about investment in
education" ( BenDavid-Hadar,2014:271).
Nowadays, a number of government departments are responsible for education
spending. The DfE is responsible for spending on the early years, schools and
further education in England. The Department for Business, Innovation and
Skills (BIS) is responsible for higher education and adult skills spending in
England. Education spending outside of England is the responsibility of the
devolved administrations ( GOV.uk).
Previously, schools received a large number of specific grants from central
government, such as the School Standards Grant. which rolled into the
Dedicated Schools Grant to simplify the school funding system in 2011-12
onwards. Local authorities are allowed to take account of schools’ previous
specific grant allocations when determining their funding, which could prevent
some schools from losing large amounts of funding (Chowdry, 16).
The main changes introduced in 2011–12 were streamlining of specific grants
and the introduction of a Pupil Premium, which is to provide schools with a fixed
extra amount of money for each deprived or otherwise disadvantaged pupil. In
the long run, the government stated that the Pupil Premium should become the
primary mechanism for distributing all deprivation funding to schools, and would
therefore replace all current deprivation funding.

198
The Pupil Premium was originally set at £430 for each pupil eligible for free
school meals (FSM), £430 for each child in care and £200 for children in service
families ( Jarret,3) These levels assumed substantial growth in the numbers of
pupils registered as eligible for FSM (15% total growth between January 2010
and January 2011). The force for this growth was the clear financial incentive
for schools to ensure that all pupils eligible for FSM are registered as such. This
allowance was made to ensure that actual spending did not exceed the budget
of £625 million in 2011–12. However, the actual growth in the number of pupils
registered as eligible for FSM was much lower (4.5% at primary schools and
2.1% at secondary schools) ("Schools, pupils and their characteristics,
Statistical First Release",1). In response, the government has recently chosen
to increase the level of the Pupil Premium this year to £488 for pupils eligible for
FSM and each child in care. Looking ahead, the Pupil Premium will be gradually
expanded over time, with a total budget of £2.5 billion available in 2014–15 as
set out in the 2010 Spending Review (Chowdry, 2).
To have a better understanding of the average change in funding per pupil
across different regions of England (separating the inner and outer London
regions), figure 2 depicts the fluctuations in the shifts The relative increase in
funding is actually highest for schools in inner London, because they have the
highest proportion of children eligible for FSM. At the other end of the scale, the
South East, South West and East of England have the lowest proportions of
children eligible for FSM and the lowest median increases. The increase in
funding across primary schools and secondary schools is below economy-wide
inflation in all regions (apart from primary schools in inner London).

199
However, primary schools across London, the North East, the North West and
the West Midlands, and secondary schools in inner London, are all expected to
see increases in funding that exceed the schools-specific cost inflation. All other
regions are expected to see increases in funding as figure 4 shows.
Figure 4: Change in school funding levels in 2011-12 by region.
Source:Chowdry , H and L. Sibleta. Trends in education and schools spending.N.p: ESRC, 2011, 21.Print
Any changes in the pupil composition of schools would also mean further
changes in budgets as a result of local authority fair-funding formulae.
Moreover, the government has chosen to retain the Minimum Funding
Guarantee, which is set at –1.5% per pupil, meaning that no school can see a
further reduction. ("2011 Cabinet Member Report", 1) Therefore, it is assumed
that the total amount spent on the Pupil Premium will be £2.5 billion, as set out
in the 2010 Spending Review. This equates to £1,900 for each pupil eligible for

200
FSM in 2014–15,leaving £110 million for an expanded Pupil Premium for
children in care or in service families. ("School funding: Pupil Premium",3)
Figure 5: Changes in school funding levels for 2014-15.
Source:Chowdry , H and L. Sibleta. Trends in education and schools spending.N.p: ESRC, 2011,18.Print
Figure 5 shows that nearly three-quarters of primary schools are estimated to
see an increase in funding below economy-wide inflation. Around two-thirds of
primary schools and over 80% of secondary schools will see cuts. However,
there will be some schools that see budget increases significantly above
economy-wide inflation as a result of the Pupil Premium. About 3% of
secondary schools will see increases 5 % as well as an over 10% of primary
schools ( Sutcliffe.theguardian.com).

201
9.4 The British budgeting landscape
From the mid-1970s through to the mid-1980s, education spending was largely
constant. This was then followed by growth up until the late 1990s. However,
over the period from the mid- 1970s through to the late 1990s, there was a
gradual decline in education spending as a share of national income, so that it
reached around 4.5% of national income by the late 1990s ( Chowdry,3).
There are two notable exceptions to this pattern: during the recessions of the
early 1980s and early 1990s, as figure 6 shows, education spending temporarily
rose as a share of national income as a direct result of the reductions in national
income.
Figure 6: Education spending.
Source: UK public Spending. February 2013. <http://www.ukpublicspending.co.uk/>.

202
Since the late 1990s, education spending had risen substantially. Between
1999–2000 and 2009–10, education spending rose from 4.5% to 6.4% of
national income; them it fell back weakly to 6.2% of national income in 2010–11
( Chowdry,4).During recent recessions, there was a remarkable increase in
education spending as a share of national income resulting from the sharp drop
in national income, but it also reflects continued growth in the level of education
spending as figure 7 shows.
Figure 7: Education spending.
Source: UK public Spending. February 2013. <http://www.ukpublicspending.co.uk/>.
Besides, the state-funded school population in England is expected to grow to
7.14 million children by 2014–15 (Chowdry, 5). Furthermore, the education
leaving age would gradually increase from 16 to 18 starting in 2013; this would
eventually require students to stay in some form of full-time or part-time
education or training as a result, the declines in education spending over the

203
next few years will be spread over an increasing population, so that resources
will probably decline by even more than total spending.
In summary, education spending experienced relatively robust growth during
the 2000s. By the end of the decade, education spending as a share of national
income stood close to its highest level for at least fifty years. However, over the
next four years, almost all of this growth will be reversed. Having grown quickly
during the 2000s, it is now set to grow very slowly during the early 2010s as
table 4 shows
2010 2011 2012 2013 2014 2015
Public pensions 115 119 127 138 145 150
NHC 118 121 121 126 130 133
Education 88 92 92 97 99 103
Defence 43 46 46 46 45 44
Social Security 111 114 116 117 115 116
State Protection 34 33 32 32 31 30
Transport 23 21 20 19 19 20
General Government 19 18 17 18 17 17
Other Public Services 60 50 46 25 49 50
Public Sector Interest 30 45 47 45 46 54
Balance 28 31 29 21 26 18
Total Spending 670 689 695 684 722 735
Table 4: The UK total public spending in billion pounds..
Source: UK public Spending. February 2013. <http://www.ukpublicspending.co.uk/>.

204
A breakdown of features of the public spending in Education can be seen in
table 5. The economic analysis covers from 2010 to 2015, displaying an
estimate budget for the years to come. (Education n.e.c stands for national
extension college which is adult education)
Table 5: Spending breakdown. The UK.
Source: UK public Spending. February 2013. <http://www.ukpublicspending.co.uk/>.
The only PESA data available on the breakdown of the public spending in
Education by country covers just the 2010-2012 period . This can be seen in
table 6 below.

205
Table 6: Spending breakdown. By countries.
Source: UK public Spending. February 2013. <http://www.ukpublicspending.co.uk/>.
England 2010 2012
Pre-primary and primary 25.0 26.0
Secondary 32.1 33.1
Post-secondary 0.4 0.4
Education programmes 10.4 11.6
Subsidiary services 3.4 3.4
Education n.e.c 0.3 0.4
Total 71.6 74.8
Scotland 2010 2012
Pre-primary and primary 2.8 3.4
Secondary 2.7 2.5
Post-secondary 0.1 0.1
Education programmes 2.5 2.0
Subsidiary services 0.2 0.2
Education n.e.c 0.2 0.1
Total 8.5 8.3
Wales 2010 2012
Pre-primary and primary 2.5 1.5
Secondary 1.6 1.5
Post-secondary 0.5 0.6
Education programmes 0.3 0.3
Subsidiary services 0.4 0.4
Education n.e.c 0.1 0.1
Total 5.3 4.4
North Ireland 2010 2012
Pre-primary and primary 1.6 0.6
Secondary 1.0 1.1
Post-secondary 0.0 0.1
Education programmes 0.2 0.2
Subsidiary services 0.2 0.2
Education n.e.c 0.2 0.1
Total 3.2 2.3

206
It seems that England is the only country to have an increase in its budget from
£71.6 to £74.8 billion. However, this growing trend for the years to come will
meet cuts as the crisis develops.
9.5 Conclusion
The seriousness of the financial crisis was undervalued and the budget
estimates were done in an over optimistic manner which did not mirror the
reality. Due to extra costs of teachers' pensions, national insurance
contributions and wage increases, the reduction in spending could be closer to
12% .Besides, pupil numbers are expected to grow by 7% between January
2016 and January 2020, as a result, the overall level of school spending could
grow by similar amounts under the different proposals. However, all these
proposals imply cuts in spending per pupil ( BBC.com).
The estimate budget for 2014 was £ 90.2 billion instead of the expected £99.3
billion from table 5 and for 2015 is £ 90.1 billion instead of the expected
£ 102.7 billion; for 2016 the education budget will be around £ 92 billion
(Ukpublicspending.co.uk)
Figure 8: Spending breakdown for 2016.
Source: UK public Spending. May 2015. <http://www.ukpublicspending.co.uk/>.

207
Pensions 21%, health care 18%, welfare15% and education 12% are the four
most important social segments to cover by the government as figure 8 shows.
It can only be hoped that when the financial crisis comes to an end, investment
will go back into Education.

208

209
Chapter 10: Cultural Education
The aim of this chapter is to understand how the British government are trying
to keep, save and hand down their heritage to a British-born population with
non-British background in order to banish the concept of " the Other" amongst
them.
Individuals need to belong to a group that provides protection and confidence
as well as inclusion into a system of social relationships ( Korostelina, 18); thus,
there are times when individuals see themselves wholly in terms of a group and
embody the group's perspective as their own (Abrams and Hogg, 147).
However, immigration with its economic inequalities, political strife, wars and
famine plus the effect of diasporas( Brah, 178); maintaining the original culture
in a host country makes the latter's identity crumble.
Let's have a closer look at the British government's strategies to guard a solid
sense of national identity among its multi-cultural subjects.
10.1 Introduction
The arts are the highest form of human achievement. Through art we not only
make sense of ourselves and the world, we also make our lives enchanted. Art
allows us to celebrate our common humanity and communicate across
boundaries. The best cultural education can change a young person’s sense of
the wider world around them, opening up possibilities for their future.3
3 The Rt Hon Michael Gove MP. Education Questions. 16th January 2012.

210
The recent Schools White Paper The Importance of Teaching, published by the
Department for Education, stated that "Children should expect to be given a rich
menu of cultural experiences" (47).
For many young people, cultural activities form a vital part of their everyday
lives. These activities are academically, physically and socially enriching,
whether they take place in-school or out-of-school. Cultural Education includes:
archaeology, architecture and the built environment, archives, craft, dance,
design, digital arts, drama and theatre, film and cinemas, galleries, heritage,
libraries, literature, live performance, museums, music, poetry and the visual
arts (Henley,3, par 1.5).
Children in England can claim to have one of the richest cultural heritages
available to any generation. In this sense the relationship between the individual
and the state is emphasised as well as the community and individual
responsibility (Jerome, 2012; 19) The idea is to ensure that all of them have the
opportunity to rejoice in it and demonstrate a stronger commitment to
excellence in music, film and the arts. These commitments will be backed by
£292 million of funding for cultural education activity over three years to March
2015 as expressed in Cultural Education: a Summary of programmes and
opportunities (9). This funding sits alongside investment by individual schools,
local authorities as well as support from other sources
Thus, there is a wealth of Cultural Education being offered to children and
young people across England. The world of Cultural Education is driven by
partnership, with government departments, non-departmental government
bodies, the National Lottery, local authorities, schools, cultural organisations,
211
voluntary organisations, the creative and cultural industries, conservation
practitioners, business sponsors, charities and philanthropists.
In this sense, Local Authorities have an important role to play in ensuring the
cultural activities; although the demands on Local Authority funding are
currently under pressure due to the financial crisis plus the fact that many
schools are now moving out of direct Local Authority funding to become
Academies or Free Schools.
On the other hand, the role of voluntary organisations and volunteers in
providing aspects of Cultural Education is a vital part of human relationships.
Many voluntary groups give children and young people the opportunity to
perform, to create and to learn about a variety of aspects of culture, which takes
place in more informal youth settings, such as youth clubs.
Finally, charities, such as the Clore Duffield Foundation, have distributed more
than £50 million to charitable purposes over the past decade
(Cloreduffield.com) , and the Paul Hamlyn Foundation, granted with a £10m
endowment in May 2007 for its activities ( BBC News.com), both perform an
important role as well as philanthropists in providing funding for education
projects.
However, Schools remain the single most important place where children learn
about Cultural Education. This takes the form of structured curriculum lessons
in subjects such as history, English literature, art and design, design
technology, drama, dance, film studies and music, alongside programmes of
after school activities for children who wish to pursue a passion for a particular
art form.
212
It is also worth mentioning the English Heritage Angel Awards, which were
founded by Andrew Lloyd Webber to reward the efforts of local people in saving
their heritage ( English-Heritage.org.uk)
In order to have a better understanding of cultural education , the following
pages will be dealing with:
Reasons for cultural education.
Cultural Education in the Curriculum.
The Heritage Schools programme.
National Bridge.
The WWI programme.
Read for My School.

213
10.2 Reasons for cultural education
There are a myriad of different reasons why every child in England should
receive the best possible Cultural Education. The Minister for Culture,
Communications and Creative Industries, Ed Vaizey MP, wrote
Government recognises the important contribution that our great
cultural institutions make to education and intends to support
access to and appreciation of the arts and culture and [...] Public
funding should be used primarily to meet the government
priorities of every child having a solid cultural education
(Henley, 12)
To make it happen, from February 2013, DfE is funding 10 Teaching School
Alliances (TSAs) to develop a broad package of Continuous Professional
Development (CPD) resources and activities for cultural education subjects
designed to support schools in improving their planning and delivery of a
coherent and high-quality cultural education. The department is providing
£395,000 over three years as part of this work (GOV.UK.)
As a result, a sound Cultural Education should allow children to gain knowledge
through the learning of facts; understanding through the development of their
critical faculties and skills through the opportunity to practise specific art forms;
whether as a participant or actively experiencing an event or place.
However, there is no agreement of how to teach British values among
professionals; as those with a high sense of national identity seem to be more

214
likely to have stronger links to patriotism and are therefore less receptive to
multicultural notions; on the contrary, Britishness is sometimes associated with
the understanding and respect of minority ethnic groups making up today's UK,
leaving aside the white British culture (Jerome, 2012; 22).
This leads to the Initial Teacher Training (ITT) to recruit and train the next
generation of teachers in a manner that they can ensure that future teachers
are equipped with the right skills and capabilities.
10.3 Cultural Education in the Curriculum
The new National Curriculum sets out the essential knowledge that all children
and young people should have between the ages of 5 and 14 (5). The
programmes of study of art and design, music, design and technology and PE
have all been significantly slimmed down so that unnecessary prescription
about how to teach has been removed. Teachers will be better able to use their
creativity and judgement in teaching these subjects.
The new National Curriculum is to be in schools in autumn to be taught for the
first time in 2014. Creating a slimmer, high-quality curriculum improves cultural
education as schools and teachers use their new freedoms to design and adapt
their provision to match the needs and interests of their pupils. A high quality
cultural education should ensure that all pupils have the chance to read books,
sing, make music, film or animation, dance, draw, design, perform and be given
opportunities to attend art galleries, museums, see film including world cinema,
and go to theatre and concert performances.
In addition to reforming the national curriculum, pupils will have access to
qualifications that set expectations which match and exceed those in the
215
highest performing jurisdictions. GCSEs are to be comprehensively reformed
with more challenging subject content and more rigorous assessment
structures.
The Creative Employment Programme (CEP) is a collaboration between ACE
and Creative and Cultural Skills Sector Skills Council which provides
employment-based opportunities for young people. The CEP aims to get 6,500
young people into the creative industries via work experience, paid internships
and 2,900 Apprenticeships. ACE is investing up to £15 million in the CEP
(Creative-employment.co.uk) The programme offers attractive incentives for
employers to take on young people.
The CEP also receives investment from the National Apprenticeships Service
via "Apprenticeship Grants for Employers (16-24)". These are grants of £1,500,
which are designed to support smaller employers with up to 1,000 employees
taking on apprentices aged 16-24, who have not taken on an apprentice in the
previous 12 months. Employers can claim for up to 10 new apprentices
(GOV.UK.)
The amount of funding for an Apprenticeship depends on the job role and the
age of the apprentice. The table below summarises the amount of funding
available for different age groups. The table was last updated in November
2013.

216
Table1: Funding available for training.
Source : The NAS. Employers. What support is available?
Besides, the National Skills Academy is the national delivery partner for the
programme, working in collaboration with the National Apprenticeship Service
and the Job Centre Plus network to make sure that young people and
employers across England can get involved in the programme.
There are also opportunities in the creative digital sector. Ahead of London
Fashion Week, the sector marked the opening of applications for Creative
Skillset’s new Higher Level Apprenticeship. in Fashion and Textiles and there is
also a Higher Apprenticeship in Advertising and Marketing Communications.
Each apprenticeship is a Level 4 qualifications (equivalent to the first year of
university). Advanced Apprenticeships in Creative & Digital Media, Fashion &
Textiles, Set Crafts and Photo Imaging. Each apprenticeship is a Level 3
qualifications (equivalent to Diploma) and Level 4.
Also, as the creative industries have been identified as a growth sector in the
industrial strategy, some local authorities and Local Enterprise Partnerships are
offering higher wage subsidies to creative sector businesses to take on
apprentices.

217
Thus, all programmes above explained have been set up in order to boost and
strengthen the possibility that students have a hands-on experience in
preserving roots and creating new forms of cultural expressions mirroring new
interests.
10.4 The Heritage Schools programme
Environmental psychologists have highlighted the importance of how children
bond emotionally with places as they grow; thus, local knowledge, sentiment
and action have been the main drivers for the 2011 Localism Act , which
provides communities with a right to bid for assets considered to be of
community value (Gentry, 2013:515).
Before March 2015, £2.7 million would be allotted to English Heritage which is
working with schools to help them make effective use of their local historic
environment and bring the curriculum alive ("English Heritage Annual Report
and Accounts 2011-2012", 1). Two thousand teachers will participate in training
programmes to support their development, across 190 schools.
Pupils are to spend more time learning outside the classroom, making use of
heritage resources like local history societies and archives as well as their local
museums. Schools are also to receive additional funding to ensure that pupils
who are least likely to visit heritage sites have the chance to do so. The
programme aspires to ensure that ("Cultural Education", 48):
children are proud of where they live.
children understand their local heritage and relate it to the national story.

218
teachers are more confident in making effective use of local heritage
resources in delivering the curriculum.
heritage providers are more connected to the needs of local schools.
communities are more deeply involved in the life of the school.
In addition to working directly with schools, the programme will also support
heritage organisations to make their work accessible to teachers and pupils.
The programme is producing materials and support for teachers so that the
model can be disseminated to all schools. These materials will provide practical
ideas for teachers in any part of the country to make better use of the heritage
on their doorstep. An example of the heritage activity follows below ("Cultural
Education", 49).
Frome Vale Academy, a primary academy in Bristol, began working with
the Heritage Schools project in September 2012. After just three terms,
they felt ready to develop new local history enquiries across the whole
school which have had significant impacts on the staff, pupils and the
local community.
They began term four with an inspirational day of interactive theatre
provided by the acclaimed Desperate Men theatre company which acted
as a stimulus for a series of enquiries throughout the school. Reception
pupils looked at what play was like a long time ago and involved families
in exploring all sorts of play from the past.
Years 1 and 2 pupils asked ‘When did our school begin?’ and invited
past pupils and staff members to explore the area around the school .

219
Years 3 and 4 pupils looked at the story of the estate on which the
school is situated. They had a visit from a local historian and the local
Architecture Centre and worked with a local photographer to record the
estate today.
Years 5 and 6 pupils explored how reporting of events has changed
since a notorious air crash near the school in the 1950s.
The above example illustrates how not only the staff but also the students took
part in getting to know their school and town surroundings. The experience of
searching for information and getting involved in the discovery of the facts
concerning the history of their school and their home town resulted in an
acquisition of a piece of local heritage which would strengthen the bond among
the participants. The programme was carried out by tailoring the tasks to the
students' age so as to level off the difficulty with their learning process; in doing
so every child grasped a part of the heritage they were able to.
10.5 National Bridge
The Arts Council England supports art and arts organisations that work with
children and young people in order to improve access and increase
participation. In November 2010 Arts Council published its 10-year strategic
framework, Achieving Great Art for Everyone, which included the goal that
"Every child and young person should experience the richness of the arts" (12).
This goal has two priorities to improve the delivery of art opportunities in a more
coherent way; and to raise the standard of art being produced for, with and by
children and young people. To help achieve this, Arts Council England have

220
invested in 10 organisations to create a network of Bridge organisations.
Between them, they received £10m in 2012/13 and in each of the subsequent
years of this funding round as stated in Arts Council Bridge Organisations
Briefing Their purpose is to make a step in improving the delivery of arts
opportunities for children and young people, acting as a bridge between the arts
and education sectors (1).
In addition to the Bridge organisations, there are some 460 arts organisations in
ACE’s new "National Portfolio" (approximately 65%) that have indicated they
will play a significant role in the delivery of great art for children and young
people over the next four years (" Cultural Education", 58)
They have a strong track record of working in partnership with schools. In fact,
National Portfolio Organisations (NPOs) represent one of the biggest groups of
organisations, other than schools themselves, which deliver the national
curriculum.
Their offer can be enhanced by bringing a wide range of skills and expertise
that may bring the curriculum to life – and beyond this, they are able to offer
avenues for children and young people to develop skills outside of school.
The curriculum also opens up opportunities for NPOs to work with schools to
add value to ensure a rich, broad and balanced programme of study. They also
play a major role in the local cultural offer for young people and respond to the
needs of local schools, children and families.
In relation to this educational network and following the February 2012
publication of Cultural Education: An Independent Review, Arts Council
England, the Heritage Lottery Fund, the British Film Institute and English
Heritage have come together as the Cultural Education Partnership Group (30).

221
They aim to use their respective resources to maximise the number of high-
quality cultural education opportunities for children and young people, both in
and out of school. A significant first step is to deliver a standard in which film
and heritage opportunities will be available to young people as part of the
Artsmark programme. Schools awarded with the Artsmark status are nationally
recognised in excellence in arts and cultural provision. Students will end up with
a portfolio or arts log that shows off their creativity and gives them a recognised
national qualification or award ( Artsmark.org).
In 2012, 13% of schools in England held Artsmark status. Below is a breakdown
of Artsmark schools by region. Artsmark status is valid for three years, the data
below shows all schools that achieved Artsmark between 2010 and 2012
Figure 1: Artsmark schools in England.
Source: Schools by region with Artsmark. Trinity College London.2012.

222
10.6 The WWI programme
One of the most significant events in British history is the First World War. In
commemoration of its centenary, a lasting educational legacy in remembrance
is being planned. The £5.3 million project was announced by the Prime Minister,
David Cameron and is designed to provide the opportunity to visit battlefields on
the Western Front between 2014-19 (IOE.ac.uk).
Professor Stuart Foster, Executive Director, The First World War Centenary
Battlefield Tours Programme, said :
Our aim is to develop an innovative and engaging First World War
education programme for all schools in England with visits to the
battlefield sites at the centre. The programme is founded on 2 key
ideas. First, that schools and pupils actively engage in genuine
historical enquiries about different aspects of the war. Second, that
pupils develop a deeper understanding and personal connection to
those affected by the war. (Paton, Graeme, The Telegraph)
The project - part of the government’s centenary education programme - will
allow secondary school pupils to learn at first hand about the sacrifices made by
the troops and the personal stories of those involved in the war effort. World
War I features in the new history curriculum for 11- to 14-year-olds and can also
be taught at primary school. The programme entitles to each participating
school to send at least 2 pupils and a teacher on a 4-day tour to see some of
the great battlefields and other notable sites, and to take part in remembrance
ceremonies on the western front. The opening tour started on 4 August 2014.

223
Pupils would learn about the sacrifices made and the personal stories of those
involved. More than 1,000 schools have already signed up to give their pupils
the chance to visit the First World War battlefields under a centenary scheme
set up by Education Secretary Michael Gove. ( "October 2013 First World War
Centenary Press Release").
Children who do not visit will also benefit when pupils and teachers who have
taken part in the project pass on what they have learnt from their experience.
This could involve establishing commemoration projects, uncovering local
stories, and sharing the results of genuine historical enquiries with their schools
and local communities.
Pupils at 25 schools have already visited as part of pilot tours around Ypres and
the Somme (Schoolimprovement.com). Sites on the tour include the Memorial
Museum at Passchendaele, the ceremony of the Last Post at the Menin Gate in
Ypres, the site of the battle of Vimy Ridge, Sheffield Memorial Park on the
Somme battlefield and Flanders Field Museum.
Future tours will take place in other sites, including the Indian Memorial at
Neuve Chapelle which commemorates more than 4,700 Indian soldiers and
labourers who died on the Western Front and have no known graves.
A range of other activities is planned as part of the commemoration, many
delivered through the organisations in the Cultural Education Partnership
Group. For example ("Cultural Education", 50):
From BFI, a selection of films from First World War is to be sorted out.
Heritage Schools project, which aims to ensure that school children
develop an understanding of their local heritage, will focus on heritage

224
sites with connections to the First World War so pupils can learn the
stories of how the war affected local communities.
the Imperial War Museum (IWM) is playing a leading role in the
commemoration and will co-ordinate a programme of activities from 2013
to 2019 in the UK and internationally ( Dellow, 3).
the Heritage Lottery Fund (HLF) commits over £200m a year in grant
funding towards heritage projects involving new museums, parks and
historic places to archaeology, the natural environment and cultural
traditions ( English-Heritage.org.uk).
the Commonwealth War Graves Commission is developing a complete
digital record of both world wars. As part of this it will review its
educational materials to make them more accessible.
ACE is working closely with IWM and HLF to support a range of museum
and arts activities, and a potential children’s competition linked to the
centenary.
the War Memorial Trust is supporting communities to photograph
memorials as part of a legacy programme. They are also engaging with
young people to explain the importance and history of local memorials.

225
10.7 Read for My School
There is overwhelming evidence that literacy has a significant relationship to
people's life chances.
UNESCO defines literacy as:
The ability to identify, understand, interpret, create, communicate
and compute, using printed and written materials associated with
varying contexts. Literacy involves a continuum of learning in
enabling individuals to achieve their goals, to develop their
knowledge and potential, and to participate fully in their community
and wider society (18).
Huge challenges in encouraging the rising generation to engage positively with
reading are to be faced. Society pays a big price if this is not achieved
(Reading Agency.org.uk).
Children and young people who do not achieve expected levels of
literacy are likely to be from disadvantaged backgrounds.
14% of children in lower income homes rarely or never read books for
pleasure.
Parents are the most important reading role models for children and
young people.
Only 1 in 5 parents easily find the opportunity to read to their children.
10 to 16 year-olds who read for pleasure do better at school.
226
Reading for pleasure is more important for children's cognitive
development than their parents' level of education.
Thus, it is vital that children enjoy reading - motivation is essential for acquiring
literacy skills. Reading for pleasure is more important as an indicator of success
at school; only 40% of England's children have a positive attitude to reading
which revealed that large numbers of them are embarrassed to be seen reading
(Clark, Reading for Pleasure, 9) and 70% of pupils permanently excluded from
school have difficulties in basic literacy skills (Clark, Literacy Changes Lives,6).
In October 2013, at the Telegraph-sponsored Bath Festival Of Children's
Literature, a major new initiative was launched Read For My School; it is a
completely free national reading competition for schools in England. The
competition will run in the spring term of 2014 and is open to all children in
Primary School, Years 3 – 6, and Secondary School, Years 7 and 8.
Almost 100,000 pupils from more than 3,600 schools across England have
taken part (Chilton, The Telegraph). Children would be challenged to read as
many books as they can over a two month period from January to March 2013,
and may opt to submit a written piece around the power of reading and giving.
By 100,000 Pearson and Penguin books are to be distributed in prizes to
individual children and whole schools. This will be matched by a further
donation of at least 100,000 books to charitable programmes worldwide.
An example of a literature and local history event is the Chalke Valley History
Festival. It was set up in 2011 to support enjoyment and understanding of the
rich and varied local history, with all profits going to the Chalke Valley History
Trust, which was established to promote the understanding and importance of
history to all ages and, in particular, to school children. The Festival combines
227
literature with "living history" displays, and plays host to high-profile guest
speakers. The Festival will run a new schools programme featuring a wide
range of curriculum based subjects (Cultural Education, 53)
In connection with this section ,it is worth mentioning the bicentenary of the birth
of Charles Dickens. On February 2012, the Minister of State for Schools, Nick
Gibb MP, took the opportunity to speak to staff and pupils at Stockwell Park
High School about the joy of reading
Dickens was an author who read voraciously and he would be delighted to
know his books are being read, re-read, shared, enjoyed and annotated until
their pages yellow. The great irony of course, is that when Dickens was writing,
few were reading. Fewer than half of children attended early Victorian schools,
industrial revolution brought terrible poverty and hardship. Literacy was a gift for
the few ( "200th anniversary of the birth of Charles Dickens speech", 2012).
10.8 Conclusion
Sociopsychology tries to understand the nature and the reasons for individual
behaviour and reflects upon social situations (Baaron, 5); festivals, visits,
cultural weeks and programmes are a sensible manner to elaborate an
intangible image of what is viewed as " British" resulting in a more cohesive
society where every member is related to its peer. This chapter has been
developed in order to display the great concern of the British government in
keeping its subjects united by a sense of nation, carried out from the most
relevant social pillar, Education. At schools, new generations are provided with
the right tools to feel they belong to the same country no matter what their

228
background is; this leads to the goal of building a solid collective identity which
is on the way to being achieved.

229
Chapter 11: The importance of Music The aim of this chapter is to give an overview of the different musical
programmes the British government is promoting in order to bring together the
many different aspects of music education..
" Enculturation" or immersion in the music and musical practices of one's
environment is a fundamental factor for children’s learning and development in
emotional intelligence and social skills.( Green, 5).
Music is a universal language that embodies one of the highest forms of
creativity. Thus, music education underpins and creates the workforce and
audience for the creative and cultural economy which is central to the British
economy.
Let's have a closer look at the British government's strategies to protect and
develop the national musical arts.
11.1 Introduction England has produced some of the world’s best music throughout history.
Since its earliest days, English music has been particularly diverse and
culturally relevant. It was made up of religious music, folk music, classical music
and many other styles. There were styles designed for the wealthy and elite and
others for the working class and the poor, which was particularly influenced by
European movements. However, there are also many trends and styles that
originated from within the country itself, such as the Celtic chants and the
medieval carols ( Englandforever.org).

230
Much of the credit for this success goes to the highly committed and highly
professional teachers, who instil in young people a passion for music, the skills
to perform and compose, and an understanding of the dedication and hard work
necessary to achieve meaningful success in this subject (The Importance of
Music, 3).
In 1983 Howard Gardner, psychology professor at Harvard University,
presented his Multiple Intelligence theory based upon many years of research.
Promoting the concept that " intelligence is the ability to solve problems, or to
create products, that are valued within one or more cultural settings"( Frames
of Minds, introduction); being recognized six (though there may be more) forms
of intelligence: linguistic, logical-mathematical, musical, spatial, bodily-
kinesthetic and personal.
Development of the musical intelligence can be greatly aided by the use of
music throughout the curriculum. " In addition to learning about musical
elements and how to create music, the musical intelligence involves developing
an ability to respond to musical sound and the ability to use music effectively in
one's life" ( Brewer,1995, n.p).
Most children will have their first experience of music at school. It is important
that music education of high quality is available to as many of them as possible.
Music helps bind pupils into the wider life of the school. Thus, great music
education is a partnership between classroom teachers, specialist teachers,
professional performers and a host of other organisations, including those from
the arts, charity and voluntary sectors. As Plato stated once: "Music is a moral

231
law. It gives soul to the universe, wings to the mind, and life to everything…
Without music, life would be an error." (Dictionary of musical quotations,45).
In order to boost music, DfE will continue to fund music education at significant
levels during difficult economic times: £77m/£65m/£60m is to be available in
the three years from April 2012 ( National Plan for Music Education, 4).
Funds for music education hubs will be awarded following an open application
process run by Arts Council England; moving towards a per-pupil national
funding formula which will ensure thatevery child aged 5-18 has the opportunity
to sing and learn a musical instrument and to perform ( Arts Council).
As part of this DfE investment, National Youth Music Organisations (such as
the National Youth Orchestra and National Youth Brass Band) will continue to
be funded to support pupils from lower income families to join elite ensembles;
and further funding will support the expansion of the In Harmony, Sistema
England programme, inspired by the success of the Venezuelan El Sistema
model, whose aims are to improve the life chances, health and wellbeing,
academic achievement and aspirations of children and young people in
communities facing many long term and complex challenges ( In Harmony,
Liverpool philharmonic, n.p).
In summer 2012, the Teaching Agency developed a teacher training module to
boost new teachers’ skills and confidence in teaching music. The Arts Council
facilitated development of a music educator qualification by 2013, ensuring the
wider music workforce is more professionalised.
232
In order to have a better understanding of the importance of music , the
following pages will be dealing with:
Progression.
ABRSM.
Music For Youth.
The Music Industries Association.
National Association of Music Educators.
Choir Schools’ Association.

233
11.2 Progression According to the 2011 National Plan for Music Education, schools and hubs
have an important role to ensure equality of access to opportunities by
undertaking a regular needs analysis across all children and all kind of state
schools in their area (17).
It is obvious that students' abilities and level of engagement will be different.
Thus, hubs are to consider how to engage and foster their interests as well as
stretch their boundaries so as to experience a range of musical genres and
activities which they might not otherwise have explored.
Figure 1: Quality roadmap.2010-2015.
Source: Sprott H.Introducing the Certificate for Music Educators. England: Arts Council.,2012. N. p. Print.

234
In addition, barriers are to be broken down through innovative approaches to
teaching and making music in order to reach all children. On top of that, a
funding module, entitled the Youth Music Programme, was launched on
November 2011 focusing on children in challenging circumstances including
those who are NEET, in the youth justice system, in pupil referral units, or who
are looked after (YouthMusic.org) .
Further below, a progression in music education is displayed for a better
understanding of the education path .
Figure 2: Progression in music education.2011.
Source: The Importance of Music: A National Plan for Music Education. England: DfE, 2011. 18.Print.
The National Youth Music Organisations (NYMOs, which include the National
Youth Orchestra, the National Youth Brass Band, and the National Youth Choir)
and those that operate the Music and Dance Scheme (MDS) act as an
important pinnacle of musical achievement.
DfE’s MDS pays bursaries; the scheme provides means-tested fee support and
grants at eight independent specialist schools, 15 Centres for Advanced

235
Training (CATs) and 6 Conservatoires for children aged 8 to 18 (11 to 19 for
dance) who have outstanding potential to train for a career in dance or music.
For aided boarding pupils, any pupil whose parents have a relevant income of
around £12,620 (2012/13) or less is entitled to a free place. For aided day
pupils, the threshold is around £15,965, below which the pupil receives a free
place. Grants for pupils attending a CAT are also means-tested £3577 a year as
full amount from September 2013 (DfE).
11.3 ABRSM
ABRSM is the exam board of the Royal Schools of Music, delivering over
650,000 exams every year in over 90 countries It is a registered charity
established by the Royal Academy of Music, the Royal College of Music, the
Royal Northern College of Music and the Royal Conservatoire of Scotland. The
four Royal Schools are themselves also registered charities. ABRSM is the
leading authority on musical assessment ("Music Education Council 2011-12
Annual Report",4).
The Associated Board of the Royal Schools of Music’ was founded in 1889 in
response to a proposition by Sir Alexander MacKenzie, principal of the Royal
Academy of Music, to Sir George Grove, director of the Royal College of Music,
that their two pre-eminent musical training institutions would be united to create
an examining body ( ABRSM.org).
Throughout 2011 ABRSM continued to focus on professional development for
teachers worldwide through innovative courses and online learning resources
and a range of short workshops and seminars. ABRSM held over 30 workshops
for teachers, including a series of 10 Continuing Professional Development

236
workshops which took place in Manchester and London, focussing on topics
including the Art of Accompaniment and Preparing for Performance, and a
series of Introduction to Instrumental and Vocal Teaching workshops which took
place across the UK ( "The Annual Review 2011",21).
Throughout 2012, online learning has proved to be popular with Being an
Effective Teacher course which has been taken by more than 200 teachers
around the world since its launch in 2010, another popular course is CT ABRSM
Plus which has run as well in Hong Kong, Singapore since 2012 ("Inspiring
Musical Achievement",12-15 ).
.Below, some statistics related to diplomas by results can be found: DipABRSM:
Diploma of ABRSM; LRSM: Licentiate of the Royal Schools of Music; FRSM:
Fellowship of the Royal Schools of Music
UK & Ireland, 2012
Fail Pass Distinction Total
DipABRSM 376 463 90 929
LRSM 44 60 14 118
FRSM 10 11 --- 21
Table 1: ABRSM diplomas by results. 2012.
Source: ABRSM. <http://us.abrsm.org/es/press/exam-statistics/diplomas-by-result/>.

237
Table 2 : ABRSM diplomas by results. 2012.
Source: ABRSM. <http://us.abrsm.org/es/press/exam-statistics/diplomas-by-result/>.
UK and Ireland, practical, 2012
Grade Fail Pass Merit Distinction Total
Grade 1 1,217 28,980 29,294 16,043 75,534
Grade 2 1,685 26,466 19,443 8,433 56,027
Grade 3 1,447 22,365 16,565 6,447 46,824
Grade 4 1,384 17,344 11,197 4,118 34,094
Grade 5 1,842 45,181 9,586 4,118 30,727
Grade 6 708 5,693 3,668 2,081 12,480
Grade 7 708 4,149 3,016 1,958 9,831
Grade 8 716 3,110 2,904 3,070 9,800
Table 3: ABRSM practical assessment by grade. 2012
Source: ABRSM.< http://us.abrsm.org/es/press/exam-statistics/graded-music-exams-by-result-practical/>.
Rest of World, 2012
Fail Pass Distinction Total
DipABRSM 963 543 66 1,572
LRSM 98 109 32 239
FRSM 20 13 --- 33

238
UK and Ireland, theory,2012
Grade Fail Pass Merit Distinction Total
Grade 1 255 776 1,817 3,903 6,751
Grade 2 147 588 1,414 2,261 4,410
Grade 3 523 1,461 1,607 730 4,321
Grade 4 166 621 846 636 2,269
Grade 5 3,036 7,285 7,474 3,772 21,567
Grade 6 235 398 152 27 802
Grade 7 21 100 81 11 213
Grade 8 97 139 65 11 312
Table 4: ABRSM theory assessment by grade. 2012
Source: ABRSM.< http://us.abrsm.org/es/press/exam-statistics/graded-music-exams-by-result-theory/# />.
Taking into account all the data expressed in the tables above, in terms of
diplomas by results, in the UK and Ireland, for Dip ABRSM there is a 49.8% of
passes in contrast to 34.5% for the rest of the world, whereas for fails there is
a 40.4% for the UK and Ireland and 61.2% for the rest of the world out of 929
and 1,572 entries respectively; for LRSM, 50.8% and 45.6% for passes
meanwhile there is a 37.2% and 41% for fails out of 118 and 239 entries
respectively; for FRSM, there is a 52.3% and 39.3% for passes and 47.6% and
60% for fails out of 21 and 33 entries respectively.
In terms of practical and theory assessments in the UK and Ireland, in grade 1,
98.3% and 96% for passes and 0.1% and 0.3% for fails out of 75,534 and 6,751
respectively; in grade 2, 96.9% and 96% for passes and 0.3% for fails in both
categories out of 56,027 and 4.410 entries; in grade 3, 96.9% and 87% for

239
passes and 0.3% and 1.2% for fails out of 46,824 and 4,321 entries
respectively; in grade 4, 95.9% and 81% for passes and 0.4% 0.7% for fails out
of 34,094 and 2,569 entries; in grade 5, 94% and 85% for passes and 0.5%
and 1.4% for fails out of 30,727 and 21,567 entries respectively; in grade 6,
94.3% and 70% for passes and 0.5% and 2.9% for fails out of 9,831 and 802
entries respectively; in grade 7, 92.7% and 90% for passes and 0.7% and 0.9%
for fails out of 9,831 and 213 entries respectively and finally in grade 8, 92.6%
and 68.9% for passes and 0.7% and 3.1% out of 9,800 and 312 entries
respectively.
11.4 Music For Youth
Deciding what music to listen to is a significant part of deciding and announcing
to people not just who you want to be but who you are. Thus, music can be
used as a tool of self-presentation, a device for mood regulation and a means
for communication with others (Patti, 2010: 370).
MFY offers young people the opportunity to perform live in music festivals
across the UK, celebrating the breadth of music-making by young people both
in and out of school. The MFY season is designed to inspire musicians at every
level of experience, in a supportive environment ( "MFY guidelines").
It was founded in 1970, the first event staged was the National Festival on 10
and 11 July 1971 at the Lyceum on The Strand. Following this, a nationwide
series of Regional Festivals were introduced and there was a large increase in
entries for the second National Festival in Fairfield Halls, Croydon in 1972. The
National Festival moved to London's South Bank Centre in 1981 and to
Birmingham in 2005 (MFY.org.uk).

240
MFY encourages a festival atmosphere at all its events. There are, however,
stages of progression within the season between the Regional Festival Series,
National Festivals and Schools Prom through a carefully considered selection
process. Typically, in any one year, 1,900 groups (45,000 young musicians)
take part in the Regional Festival Series, with up to 300 groups then being
invited to perform at the National Festivals in Birmingham and Scotland, and a
final 40 groups in our annual Schools Prom concerts at London’s Royal Albert
Hall (" MFY guidelines").
The gateway to the MFY Season, the Regional Festival series, as figure 3
shows, comprised 74 festivals which took place in 62 venues across the UK.
These Festivals are a great opportunity for groups of all experience,
background and genre to perform to new audiences, listen to other groups from
their local area and get valuable feedback from the MFY Music Mentors ("Music
Education Annual Report", 17).
Following the 2011 Regional Festivals, the week-long National Festival took
place in Birmingham from 4-9 July, celebrating the enormous diversity and
enthusiasm of youth music making from across the UK. 345 groups performed
on the main stages of the festival and took part in inspirational workshops and
activities throughout the week.
The culmination of the MFY Season is the Schools Prom concerts at the Royal
Albert Hall. The concerts celebrate some of the most talented young music
ensembles in the UK and aims to foster the creation of powerful new music
which stretches young people's potential as performers, innovators, creative
collaborators, composers and leaders. The 2011 concerts involved close to
3,000 performers, aged 7- 21 ( MFY.org.uk).

241
Figure 3: MFY festivals. 2011.
Source: MFY.< http://www.mfy.org.uk/aboutmfy/whatismfy />.
With this programme it can be seen that children and young people are the
government's focus in order to build a common affinity from the most important
early stages in the cognitive development; in doing so, these musicians can
easily relate to each other and thus a more cohesive society is the expected
outcome. A rapport amongst them is what will unite them as one country with a
wide cultural variety within it.

242
0,00%
5,00%
10,00%
15,00%
20,00%
25,00%
30,00%
Violin
Acc
oustic g
uita
r
Key
board
Flute
Cla
rinet
Reco
rder
Trumpet
Cello
Voice
2005
2007
11.5 The Music Industries Association.
The Music Industries Association (MIA) is the UK trade association that
represents the musical instrument industry, representing over 350
manufacturers, distributors, retailers, publishers and educators, which
collectively generates annual sales of over £600 million of instruments and
associated products. It has the mission of “Creating and Encouraging Music
Making" ( MIA.org).
The reaction to the decline of the number of children learning traditional musical
instruments, as figure 4 shows, resulted in the creation of different programmes
based on analysing academic and medical research work from all around the
world.
Figure 4 : Decline in musical instruments 2005-07.
Source: Paton, G. "Traditional musical instruments in decline". The Telegraph. News.22 Nov.2007.Print.

243
This has led to the creation of promotional campaigns such as "Get Alive!" a
promotion that showcased all the beneficial aspects of music making on health,
education and longevity.
This campaign was successfully piloted in Surrey and has now been rolled out
UK wide in association with Classic fm.
The association launched into the industry charity, in 2008, Music for All,(MfA)
which helps people of all ages and backgrounds to be able to start playing an
instrument. School-age children are a particular focus. It especially helps those
who are not fortunate enough to be able to access musical instruments and the
lessons with which to learn. It has the mission of “Making More Musicians”
(Musicforall.org).
Adolescents who have qualities that vary from social norms or participate in
activities that cross gender stereotypes are likely to be the object of
harassment; boys who play instruments that are typically played by girls and
vice versa are aware of gender association which can lead to bullying or loss of
popularity in school ( Abeles, 2014: 347). As figure 5 shows, the number of
pupils learning an instrument has risen; by September 2010 the statistics
mirrored that boys were most likely to learn the guitar (17%), the keyboard (8%)
and the drums (7%), while girls were more likely to choose the recorder (11%),
followed by the guitar, piano and keyboard (all 9%) (BBC News, 2012 poll).

244
0%
2%
4%
6%
8%
10%
12%
14%
16%
18%
Guitar Keyboard Drums Recorder Piano
Boys
Girls
Figure 5: 2010 Instrument choice by gender.
Source :BBC News. "Music tuition falling: 2010 poll".<http://www.bbc.co.uk/news/mobile/education-
11179448/>.
11.6 National Association of Music Educators
National Association for Music Education (NAfME), among the world’s largest
arts education organizations, is the only association that addresses all aspects
of music education. NAfME advocates at the local, state, and national levels; it
provides resources for teachers, parents, and administrators.
The point of departure was when music was part of the National Curriculum in
1988 ; then in the late 1990s, the English curricula were revised and there was
a shift from " school music " towards " music in school" (RJE, 2010:62).
NAfME’s activities and resources have been largely responsible for the
establishment of music education as a profession, for the promotion and
guidance of music study as an integral part of the school curriculum, and for the
development of the National Standards for Arts Education ( NAfME.org).

245
The ‘Musical Pathways’ project is making an important step in spreading the
idea that school musical experiences influence long-term engagement in
music. Yet, as figure 6 shows, the influences of home and school are vital in the
nurture of musical interest; therefore, parents are highly valued as encouragers
( 42%) as well as providers, supporting instrumental learning financially and
practically ( 32 %); in connection to the school influence, school performing
opportunities (51%) plus inspiring instrumental teachers (34%) are the two
most relevant factors to make students keep on their musical career
( "NAME Magazine Autumn 2011",34, 8-11) .
Figure 6: Influences of home and school.
Source :Pitts, S. " Changes and Choice :Exploring the impact of Music Education". NAME magazine
Autumn 2011. 34.8-11. Print.
Another significant programme within the Musical Pathways is the programme
for young offenders .All the 2011 music programmes for young people aged 13-
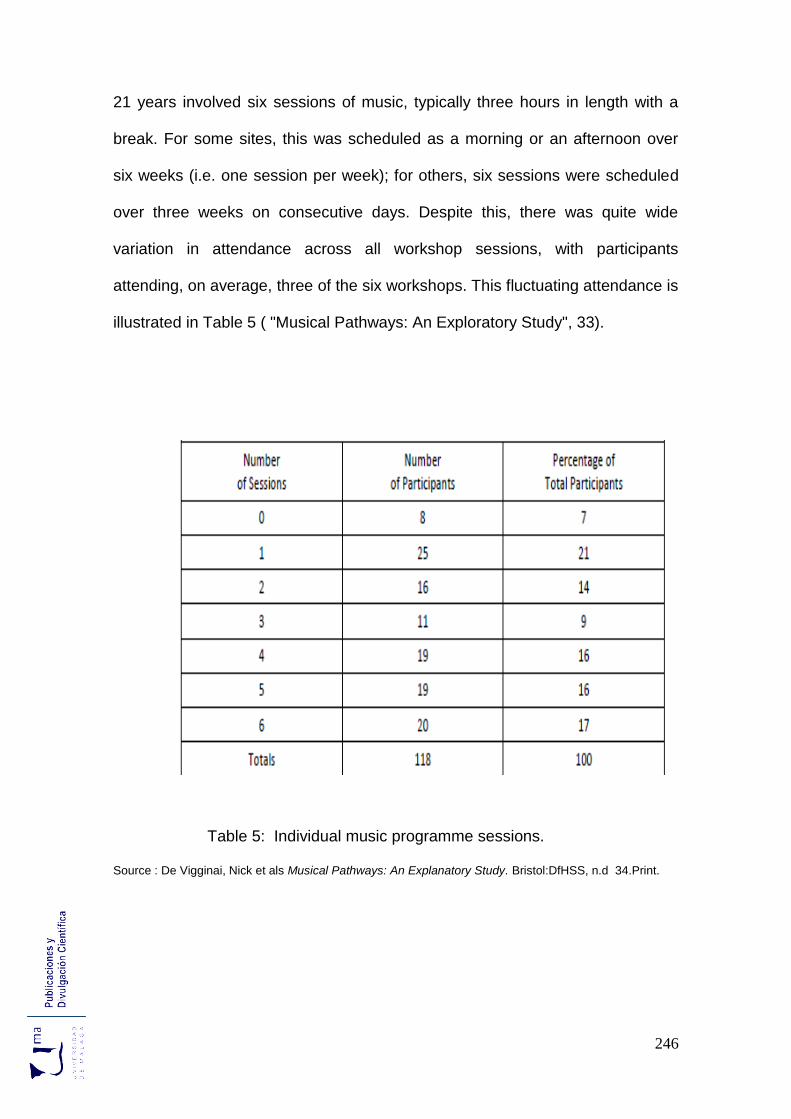
246
21 years involved six sessions of music, typically three hours in length with a
break. For some sites, this was scheduled as a morning or an afternoon over
six weeks (i.e. one session per week); for others, six sessions were scheduled
over three weeks on consecutive days. Despite this, there was quite wide
variation in attendance across all workshop sessions, with participants
attending, on average, three of the six workshops. This fluctuating attendance is
illustrated in Table 5 ( "Musical Pathways: An Exploratory Study", 33).
Table 5: Individual music programme sessions.
Source : De Vigginai, Nick et als Musical Pathways: An Explanatory Study. Bristol:DfHSS, n.d 34.Print.

247
It can be seen that Music provides an important means of connecting with
family and friends and thus supplement social skills. One of the objectives of
the different programmes within Musical Pathways is to reinforce the
progression of the musical experience beyond the school age in order to
advance music education by encouraging the study and making of music. On
the other hand, “Musician and Teacher” is a research project which was aimed
at understanding employment priorities for music educators providing a valuable
insight into the many and varied pathways followed by a wide range of
musicians and educators.
Figure 7: Roles musicians are most identified with / earn money from.
Source : The Musicians' Union. The Working Musicians. England: DHA Communications, 2012. 21.Print

248
On the previous page, figure 7 gives out a clear awareness of the divide
between the job musicians do for a living and the role they are most identified
with , which do not mirror ; It can be appreciated the imbalance between what
they do and what makes them feel accomplished with examples such as 81% of
musicians are involved in performing but only 58% out of it are happy with their
current jobs; 60% are involved in teaching but only 20% out of it are satisfied
with their jobs.
11.7 Choir Schools’ Association
A number of studies on the benefits of community singing have provided
evidence on a range of social, psychological, and health benefits associated
with singing; among all the benefits, the three most relevant ones are as follows
( Cliff, 80) :
Enhanced emotional and physical well being.
Performing to an audience encouraged a sense of personal worth.
Singing is mentally demanding, and required to concentrate and learn
new material in order to perform.
Thus, the Choir Schools’ Association was created in order to provide children
and young people with the chance to sing and better their wellbeing.It
represents 46 schools attached to cathedrals, churches and college chapels

249
educating some 25,000 children. A further 13 cathedral foundations, who draw
their choristers from local schools, hold associate membership. In total CSA
members look after nearly 1700 boy and girl choristers. (Choir Schools'
Association.org.uk).
Some schools cater for children up to 13.Others are junior schools attached to
senior schools through to 18. Many are Church of England but the Roman
Catholic, Scottish and Welsh churches are all represented. Most choir schools
are independent but five of the country’s finest maintained schools are CSA
members.
In 1991 the Conservative Government established a “modest grant scheme of
£20,000 ” for choristers at CSA schools. The late Dame Angela Rumbold, then
Minister of State at the Department of Education and Science (DES), was
persuaded that there should be similar arrangements for choristers as they
existed to help very promising young instrumentalists and dancers. The need to
maintain Britain’s choral heritage was clearly understood. In recent years the
MSD has also enabled talented youngsters to attend 21 regional centres for
CATs ( "Reaching Out", 4).
The National Youth Choirs of Great Britain launched a new musicianship
programme in the spring of 2011, starting with the four junior choirs and now
expanding to include all NYCGB choirs. The aim of the programme is to
develop their ears and improve their sightsinging skills. Originally set up as a
single choir of 100 of the best young singers in Britain, NYCGB now consists of
eight choirs, around 750 young people aged 9-24.( NYCGB.org.uk) :

250
Boys’ Choir is for trebles in school years 5-10 and Cambiata Voices, for
boys undergoing voice change in school years 6-10; these choirs train
together.
Girls' Choirs Junior and Senior, for girls in school years 6-10, which also
train together.
Training Choirs North and South, which are girls and boys mixed in
school years 9-13.
The National Youth Choir, for mixed voices in school years 11 to age 22
Chamber Choir for young professionals and those studying to become
professional singers up to age 25.
Apart from the academic benefits of the choir programmes, it has to be
mentioned that the third main reason for the increase of attendance in the
church is the existence of a choir. The table below displays the attendance
increase in some parishes:
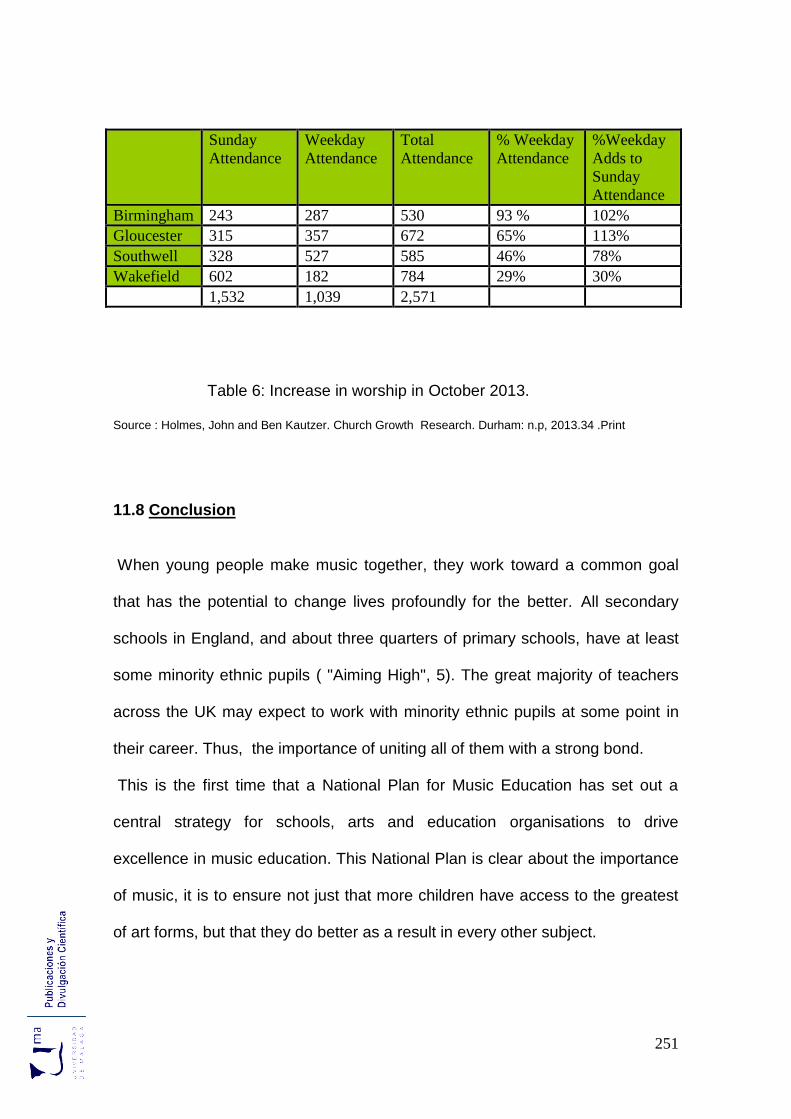
251
Table 6: Increase in worship in October 2013.
Source : Holmes, John and Ben Kautzer. Church Growth Research. Durham: n.p, 2013.34 .Print
11.8 Conclusion
When young people make music together, they work toward a common goal
that has the potential to change lives profoundly for the better. All secondary
schools in England, and about three quarters of primary schools, have at least
some minority ethnic pupils ( "Aiming High", 5). The great majority of teachers
across the UK may expect to work with minority ethnic pupils at some point in
their career. Thus, the importance of uniting all of them with a strong bond.
This is the first time that a National Plan for Music Education has set out a
central strategy for schools, arts and education organisations to drive
excellence in music education. This National Plan is clear about the importance
of music, it is to ensure not just that more children have access to the greatest
of art forms, but that they do better as a result in every other subject.
Sunday
Attendance
Weekday
Attendance
Total
Attendance
% Weekday
Attendance
%Weekday
Adds to
Sunday
Attendance
Birmingham 243 287 530 93 % 102%
Gloucester 315 357 672 65% 113%
Southwell 328 527 585 46% 78%
Wakefield 602 182 784 29% 30%
1,532 1,039 2,571

252

253
Conclusion Undoubtedly, the world is changing; society is evolving. My curiosity to know
how younger generations were being prepared for the near future triggered my
interest. So, when I started this dissertation, my objective was to understand
where Education was heading since societal trends always reflect upon
Education.
This thesis has tried to analyze the evolution and the implication of the most
relevant educational policies throughout a period of 10 years. Policy making has
been carried out based on the different and new needs of society in a specific
time span. The most significant drive for White and Green Papers, Codes of
Practices and Regulations and Education Acts has been the economic and
human flow into the UK; this has been made following the ruling political trend.
Traditionally Education has been more pre-occupied with the pressures of the
present rather than the anticipation of the future. A new context is being
unfolded , in which changes have to be carried out in order to meet the new
needs of individuals and ever modifying societies .
Technology has been transforming human life. The mechanization of agriculture
transformed the labour market in the first half of the 20th century; more recently,
in the computer age, the pace of technological changes is very rapid, combined
with demographic, political and economic trends; it has altered work and social
lives in manners that have significantly modified today's people ( Jerald,1)
Among general trends, it can be highlighted, between positive ones, a
knowledge explosion and a quest for better quality of life; on the other hand,
between the negative ones, it can be highlighted an environmental degradation,
population growth and a crisis of human values ( Singh, IX).

254
Nowadays, children and young people who are in school will be manning the
work places in the near future; Education has to leave behind its old role of
transmitting the past and reinvent itself with strategies to effect changes
( Singh, 4).
British government is determined to create a sense of unity among children and
young people, addressing the whole child, the whole person plus providing
them with the right tools for a successful labour livelihood. Education is not only
a human right in itself, but also an important vehicle for a wider and fuller
achievement of human rights (Quennerstedt, 2013:116)
One of the most clear instances of attempting to unify a population is found in
the USA, where the national flag is raised everywhere to remind its citizens that
they belong to the same country, due to its profound immigration history, as well
as an array of educational programmes for those who need to fit in, the so
called " melting pot" drift . The UK does not need to raise its flag, although the
Scottish have recently, in 2014, opted to stay with the UK. Nevertheless, great
effort is made to reach a point where all its citizens see themselves as British.
This is only achieved through Education. Children are the foundation and the
most relevant asset of a country , thus the British government is on the right
path but it cannot be forgotten that it is not an easy objective to pull off and new
areas of conflicts, tensions and confrontations might arise.
The future of Education then may be viewed as a series of issues of choices. In
this time, the process of developing educational goals is an important element
of policy-making and planning. There is the universalized education reaching
out to whole populations within the " knowledge-based society" (Singh, 43). This
kind of education takes place in an institutional structure that has grown in

255
complexity since it has to cover individual empowerment and development
without leaving aside the cultivation and the nurturing of social commitment.
Many countries are responding to global changes by establishing curricular
reforms in order to keep up with the new societal trends (Kyunghee, 2013: 1)
All changes in the National Curriculum are not valid without the commitment of
the students. Many of the problems in delivering knowledge are the waning
effort of the students to get involved. No matter how attractive a teacher can
make his or her subject, if the student does not want to take part in the process.
Effort, sacrifice and study are concepts which are no longer politically correct
since they are related to the old days but not everything from the old days
should be banned just for the future's sake.
Another 21st century problem is the radical changes in the world of work as a
consequence of the technological development together with the forces of
globalisation. There is a mismatch between the skills imparted by the education
system and those demanded by the workplace. Besides, globalisation means
that workers have greater mobility across borders, yet opportunities are not
uniform from one country to another. The days of a lifetime job, typical in the
post WWII Japan, are over; those days are being replaced by a context where
flexibility and adaptability of skills are essential ( Balcar,10)
Vocational education and training system enables a relatively successful
transition from school to work and ensures low youth unemployment
(Beicht,2014:248). Many would-be students dismiss promising careers simply
because of the stigma attached to technical and vocational occupations.
Germany is always taken as an example of how well Vocational Training
Education works; it is a system very well- planned and structured alongside with
256
a very important industry which has devised extremely useful work placement
programmes in order to give students a real insight of the workplace, the well-
known dual system. As long as industry is not strong and powerful, which
comes along with a solid economy, there is nothing to do to better the social
conception and the labour usefulness of Vocational Training Education.
On the other end of the schooling ladder, in the prestigious HE, according to
Altbach et al ,an academic revolution has taken place marked by
unprecedented transformation in scope and diversity due to a greater social
mobility, new patterns of funding and increasingly diversified education
systems. The Bologna Process and Lisbon Strategy in Europe are the clearest
examples of international engagement, an estimate of 8 million students will be
studying outside their home countries by 2020 ( 7); besides, another setback is
the cost barrier to access because even when tuition is free, students have to
bear indirect costs. This can be put down to the neoliberal idea that HE is
regarded as a private good and thus to be paid by the "users"
( Marxistleftreview.org)
Since the presence of international students in British universities is a reality,
English has become the dominant language of scientific communication,
making mobility of students and staff much easier. To meet the increasing
social demand for HE, governments must seek alternatives sources for such an
expansion ( Lee ,2008:189). Yet, the 11S terrorist attack on the World Trade
Centre in New York in 2001 and the aftermath global despair made VISA
applications harder to obtain. British government still has to fight against
dishonest applicants whose only intention is to stay illegally in the country.
Therefore, many students must compete for scarce places in universities plus

257
the fact that they have to enrol as full fee-paying internationals. On top of that,
HE faces the demand of BAME students who strongly request more BAME
professors and lecturers.
It is true that many education systems face a real challenge in taking on
teachers and retaining them once they are hired. 27 million teachers will be
needed around the world by 2030(Unesco.org). Thus, many countries have
transformed the organization in their schools in order to set them free from
feeling overloaded with administrative work, high number of classes or large
class sizes plus a wide range of incentive measures have been introduced..
The difficulty of providing properly qualified teachers in certain subjects is a fact
(Barmby, 2007:248) Large numbers of professionals abandon their careers
because of work-related issues. Besides, BAME teachers are not willing to take
the risks since they are afraid of being the target of discrimination from
administration, parents and students.
In order to reverse that situation, teachers' status has to be restored in society.
They educate the future of a country and their contribution seems not to be well-
regarded; in countries such as Finland, teachers are extremely respected
besides the fact that the profession gives them social status; another example,
in Japan, teachers are the only subjects who do not need to bow in front of the
Emperor; a more valued conception of teaching is specially needed so as to
attract more people into the profession. Until then, the difficulty of recruitment
will never cease.
Another difficulty is the attainments of goals, the UK Government meant all
students in England to score A* to C in the five core GCSE subjects; academies
were thought to be the solution; nevertheless, in 2010 only one in six students
258
actually achieved it, in more than half of state secondary schools less than 10%
accomplished it and in 270 schools there were no students success
(Hampson,5). Students themselves may feel successful when they get a job
and start living a life independently from their parents. However the number of
unemployed young people has increased dramatically these last years (The
impact of long-term Youth Unemployment, 2)
Thus, the transformation of secondary education in order to improve students'
academic results is on its way. Although, the complexity of the different
organisations within academies as well as the funding problems plus the
diversion from the main goals made the institution crumble. But, on the
contrary, this failure cannot play down the government effort in trying to find out
and devise new formulas to make the best of each student.
When today's students graduate, they will be competing globally for their jobs.
Businesses are demanding so-called "higher-order" skills such as decision-
making, prioritizing, strategizing and collaborative problem solving ( "Teaching
Higher-Order Thinking", 53); as victims of the achievement gap, students need
to master these new skills in order to have an even chance. We are in a period
of uncertainty and evolution where the objectives of target are clear but the way
to achieve them is still on trial because teachers have to deliver new skills which
have never been academically taught to them before.
Nowadays, schooling venues are finding harder and harder to keep up with
social trends ;In terms of behaviour, bullying has always been an issue within
schools; adolescents use technological devices not only for communication but
also for humiliating peers and staff. Bullying was considered as a rite of
passage but there are more serious consequences behind that old conception.

259
Bullying is to be eradicated in all its forms because it is just an unacceptable
conduct which cannot be permitted.
Agencies, staff, students, parents are all involved in the solution of this
situation. Society is aware of the fact and in this sense, a great advancement
has been achieved. Humans are likely to be in confrontations, as it is our
nature, we have to try hard to respect others and be respected in such a
manner that we are not hurt and we do not hurt anyone. It is a question which
will take a lot of time and good will from all the participants but Education is the
key. Thus, the education system is doing its part to contribute to erase this
attitude from school which will later on reflect in society.
Society is diversity; in 2013 it was estimated that 232 million people live outside
their country of birth (Rica, 5); between January and December 2013, there
were approximately 4.9 million people with non-British nationality living in the
UK and 7.8 million people who were born abroad (Hawkins, 16). Multicultural
education is the bridge for constructive dialogue on issues regarding race,
gender, class, sexual orientation, citizenship and religion, which offers students
and educators the opportunity to explore the construction of cultural identity
( Hyde, 2014: 241)
The enlargement of EU in 2004, including Czech Republic, Estonia, Cyprus,
Latvia, Lithuania, Hungary, Malta, Poland, Slovakia and Slovenia, was the
largest single enlargement in terms of people and number of countries; in 2007,
Bulgaria and Romania joined in and in 2013 Croatia joined in (Europa.eu).
Today, the EU consists of 28 member countries with free movement of its
citizens. As Europe is borderless, Europeans are free to settle down anywhere
without any restriction, on top of that, asylum seekers and subjects from the
260
Commonwealth have to be borne in mind in the British case. Thus, we are
unavoidably facing a multicultural population. The British government is doing
its best to try to make a solid society within its territories; however, " try and fail
but do not fail to try " proverb is the best motto for British government in the
accomplishment of this extraordinary complex situation.
But, to accomplish any kind of situation, a sound budget is needed and DfE
faces a large budget shortfall after 2015. There will be more people of school
age ,projections show that there will be 7,2 million pupils in 2015 and 7.9 million
by 2020; increased teacher pay and pension contributions will be of a rate of
16.4% as well as a rise in schools, colleges and new universities from 14.1% to
16.4% from September 2015 onwards and costs associated with new policies; it
is estimated that a shortfall of £600 million in 2015-16, rising to £4.6 billion by
2018-19 ( Gravatt,11)
The investment in Education is not going to be an easy task. Most countries
have been hard-hit by the financial crisis since the end of 2008. Hoping to
reverse fiscal deficits, the UK reduced public spending resulting in slashed
budgets, lowered salaries, redundancies and hiring freezes within education
sector.( "Education and Global Economic Crisis",2). Although, investing in
education, training and lifelong learning supports the development of human
capital (Zagordo,2) However, there is a projection that teaching staff and
venues will be in shortage in the years to come and thus, a greater investment
is meant to be applied. In order to cope with it, investment in Education must
be restored as soon as fiscal consolidation is re-established.
Culture is one of the pillars to invest on. Cultural education and heritage can
build cohesiveness. Cultural heritage can provide a solid sense of belonging

261
within a group and allows people to better understand previous generations and
the history of where they come from. It is made up of buildings, townscapes,
archaeological remains, books, artefacts, objects, pictures, photographs, art,
and oral tradition (Cultivatingculture.com). The UK government is very serious
about handing down traditions to the new generations in order to build a
collective identity, no matter what the background is.
Unfortunately, identity is not clear-cut anymore. Today's wave of conflicts in the
Far East , especially in Libya due to the extreme Islamic group ISIS, the
demographic pressure, the unceasingly ethnic wars in Africa, the human
trafficking and the economic immigration from the Balkans make Europe live
through a human crisis without precedents. This huge flow of people fleeing
their countries has to be accommodated and integrated in the society of the
host country. "Culture should be regarded as the set of distinctive spiritual,
material , intellectual and emotional features of society or a social group"
( "Universal Declaration on Cultural Diversity", 4); it is extremely relevant that
the host culture and heritage is exposed to the new arrivals in order to secure
their fully integration, although to fit in is not always easy.
Music is part of those intellectual and emotional features of societies, everyday
life and behaviour and its importance seems to be strongly related to its
powerfully educative effects on the personal and academic development. This
power has been known to all major civilizations where music was considered to
be the most important of the sciences, the most important path to religious
enlightenment and the very basis of government and the character of men.
Plato wrote " I would teach children music, physics, and philosophy; but most

262
importantly music for in the pattern of music and all the arts are the keys to
learning " ( Lierse, 8)
The National Plan for Music Education is to ensure not just that more children
have access to the greatest of art forms, but that they do better in every other
aspect of life as a result .A person's development as a human being needs
more than academic data , arts in general is the food for the soul and nurturing
this aspect is essential for a sound building of character. Music is used as a
therapeutic tool for increasing student's knowledge of self and others ( Amir,
2011:1); also music remains as an important cultural sphere in which identities
are affirmed, challenged , taken apart and reconstructed ( Worldpopmusic.com).
Thus, it is significant for the individual and the group.
As a conclusion, Education can be said to be turning into a new path which is
unclear ; all changes made have been for the need to fit into a new system
highly devised by social trends; globalisation, financial status, technology,
immigration and ethnic minorities are main actors in its reorganisation.
Teachers are preparing students for a borderless future. Not only are they
providing them with the necessary skills but they are also helping them to build
a common identity in order to feel closer to others in a multicultural society. This
dissertation shows the different approaches the UK government has taken in
Education.
From a postcolonial perspective, the decline of the British Empire and the
creation of the Commonwealth offered false hopes. The immigrants moved to
the motherland with the expectation of living a better life , leaving behind the
hardships in their country of origin. However, the UK population was not really
prepared to accept people from other cultures leading to an incomplete

263
integration of the new arrivals; these subjects' dreams were shattered as they
had to live through another hardship ,discrimination . Ethnic superiority has
always been a reason for conflicts and wars. The interaction of ethnic minorities
as a group different to others and the mixture of its members is vital for a
society. Since those days up to now, the situation has been improved but not
been erased.
From an anthropological standpoint, it is clear that the behaviour of the Britons
has changed throughout time in order to cope with a new reality The adaptation
to new needs and the acceptance of social changes takes time; those inevitable
changes are enforced by papers, bills and acts, which have been developed to
guide them towards the evolution of the country.
In this approach, labour integration is essential. Survival in terms of work, food
and shelter is necessary for humans. The key to access to decent human
conditions is through work which is obtained with a solid academic formation.
Families, schooling venues and the government are interconnected. Using the
organismic analogy from a sociological point of view, society is regarded as a
human body ( Livesay ,2), all society aspects work as vital human organs
which have to work together and function well in order to make a society
successful. This can only be accomplished by reaching people's conscience
through Education.
For myself, this dissertation has been a journey into a new way of
understanding where Education is going to. I did not know what I was heading
for. I just accept what I have found along the way The evolution of the system
as something malleable is necessary since the changes and adaptations in
Education must be made according to social, political and economic trends. It is

264
uncertain what the future holds, thus an open mind of what is yet to come
reflects the ability to better the system.
I do believe that my dissertation is a platform for future research. As societies
are ever changing, new amendments will be required. It would be very
interesting to have a look at all the different educational programmes covered in
the previous pages in 10 years' time. In doing so, we could be certain about the
efficiency of the British government in its goal to prepare a society for a new
world.

265
Appendix 1: British-Spanish educational system.
UNIVERSITY UNIVERSIDAD
BA/BSC degree..................................... grado
Master's degree........................................ máster
PHD............................................... doctorado
Vocational courses / apprenticeship:
level 1 (without or GCSE grades D-U).............................Formación profesional básica
level 2 ( 5 good GCSE grades A+-C)...............................Ciclo formativo grado medio.
level 3 ( 2 A-levels)..........................................................Ciclo formativo grado superior.
level 4/5 : awarded with Higher National Diploma (HND)
level 6 : access to University.
KEY STAGE
1
Nursery 4 years old INFANTIL (0-6)
Reception 5 years old
Year 1 6 years old
Year 2 7 1 PRIMARIA
KEY STAGE
2
Year 3 8 2
Year 4 9 3
Year 5 10 4
Year 6 11 5
KEY STAGE
3
Year 7 12 6
Year 8 13 1 ESO
Year 9 14 vocational
courses level1
2 ESO
KEY STAGE
4
Year 10 15 3 ESO
Year 11 16 4 ESO
GCSE
KEY STAGE
5
Year 12 17 1BACHILLERATO
2 Year 13 18
A-LEVELS SELECTIVIDAD

266
Appendix 2: the NVQ structure.
source: Canterbury College. <www.cant-col.ac.uk/apply/qualifications-and-levels>

267
Appendix 3: Chronology of Acts.
1948 British Nationality Act distinguishes between citizens of
independent Commonwealth countries (mainly white) and those in
colonies and dependent territories. Empire Windrush brings 492
workers from Jamaica.
1958 Race riots in Nottingham and Notting Hill. West Indians attacked
by white people.
1959 Conservatives elected for the third time since 1951.
1960-1 Proposed immigration restrictions lead to beat-the-ban immigration
from the Indian sub-continent. Birmingham Education Department
sets up the first Department for teaching English as a second
language. Birmingham Immigration Control Association and South
Residents Association set up and oppose immigration of “New
Commonwealth” (non-white) citizens.
1962 Conservatives Immigration Control Act. Commonwealth
Immigrants Advisory Council set up to advise the Home Secretary.
1962 Certificate of Secondary Education (CSE) established. Association
for Teachers of English to Pupils from Overseas (ATEPO) set up.
1963 HM inspectors produce · English for immigrants” and set up short
courses for English as a second language. Edge Hill College,
Lancashire introduces first teacher training course for teaching
immigrants children. Protest by white parents in Southall. London,
against a school with 60 per cent immigrant children. Education
Minister Edward Boyle rejects the idea of segregated education.

268
1964 Voucher system produce restricts immigration. Labour elected.
Conservative wins Smethwick, West Midlands, using the slogan
“If you want a nigger neighbor, vote Labour”. Campaign Against
Racial Discrimination set up (CARD) and a Commonwealth
Immigrants Advisory Council recommends the school dispersal of
immigrant children.
1964 Ministry of Education becomes Department for Education and
Science (DES).
1965 The DES recommends in Circular 7/65 that no school have more
than 30 per cent immigrant children. Several LEAs adopt
dispersal by bussing. The North London West Indian Association
worries about children referred to ESN (educationally subnormal)
schools. The first Race Relations Act passed in October,
education not mentioned. A Race Relations Board and a National
Committee for Commonwealth Immigrants set up ( Chaired by
Archbishop of Canterbury).
1965 Circular 10/65 requests all schools to reorganize on
comprehensive principles. Home office produces a White Paper,
Immigration from the Commonwealth.
1966 Labour re-elected, Smethwick regained and the new MP declares
“we have buried the race issue”. Home Secretary Roy Jenkins
envisages a society based on cultural diversity, mutual tolerance
and equal opportunity.
1966 Local Government Act, via Section 11, in which the Home Office
provided a 50 per cent rate support grant for staff in high

269
immigrant areas. DES arranges for first collection of statistics of
New Commonwealth children. Leeds project to develop English
teaching materials set up. Census shows “coloured population” of
UK as being 924,000, mainly from India, Pakistan, Jamaica and
other Caribbean countries.
1967 Enoch Powell suggests that coloured immigrants, especially from
Kenya, be kept out of England. Plowden report on Children and
their Primary Schools includes a chapter on immigrant children.
1968 Home Secretary James Callaghan introduces a Commonwealth
Immigration Act ( passed in a week). Those who are partials with a
father or grandfather born in UK have priority. Powell proposes a
Ministry of Repatriation and on 20 April makes an anti-immigration
speech, pro-Powell marches take place in London and other
towns. Black Peoples Alliance set up at a conference in
Leamington Spa.
1968 Second Race Relations Act passed. Education not mentioned.
Parliamentary Select Committee on Race Relations and
Immigration set up. Prime Minister Wilson sets up an Urban Aid
fund which includes help for New Commonwealth children.
1969 House of Commons Select Committee on Race Relations and
Immigration report on The Problems of Coloured Schools Leavers.
North London West Indian Association lodges a complaint of racial
discrimination over ESN schooling. Arthur Jensen publishes “How
much can we boost IQ and scholastic ability” in the Harvard

270
Educational Review. Rose et al. publish Colour and Citizenship: a
report on British Race Relations.
1970 Bernard Coard galvanizes lack parents with a speech and
subsequent publication on How the West Indian Child is made
ESN in the British School System.
1970 Conservatives elected. Circular 7/70 cancels the expectation that
all secondary schools will become comprehensive.
1971 Immigration Act further restricts immigration. Right of abode
limited to partials, others to obtain a work permit and register with
the police. UK Immigrants Advisory Service in operation. Home
Office sets up Race Relations Research Unit.
1971 Julia McNeal and Margaret Rogers publish The Multiracial School,
with chapters written by teachers. Eysenck publishes Race,
Education and Intelligence suggesting that blacks and the Irish
have lower IQs than other groups.
1971 DES Survey 10, Potential and Progress in a Second Culture, and
Survey 13, The Education of Immigrants, outline policy objectives.
Townsend publishes a survey of LEA responses to Immigrant
Pupils in England.
1972 DES discontinues the collection of statistics on immigrant pupils.
(With 3.3 per cent-280,000-recorded as immigrant.) School leaving
age raised to 16.
1972 David Lane, Conservative Minister for Race Relations says Britain
is an overcrowded island and no more immigrants should come.

271
Expulsion of Ugandan Asians by Idi Amin. Enoch Powell predicts a
national catastrophe if more immigrants arrive. 27,000 arrive from
Uganda and 21,000 pass through “camps”. Leicester city council
reports that “Leicester is full” and urges migrants to go elsewhere.
1973 Select Committee on Race Relations and Immigration produces a
report on education, making 24 recommendations. Trevor
McDonald becomes ITN’s first black newsreader. ( He retired in
2005).
1973 West Bromwich by-election. National Front candidate comes third,
ahead of the Liberal Party. War in the Asian subcontinent.
Pakistan secedes from the Commonwealth. Bangladesh now a
separate country.
1974 DES produces Educational Disadvantage and the Needs of
Immigrants. Centre for Disadvantage set up in Manchester (closed
1980). Community Relations Commission (CRC) produces a
pamphlet on the educational needs of minority group children with
12 recommendations. National Association for Multiracial
Education set up (NAME).
1974 Second PSI report into Racial Disadvantage in Britain ( Smith
1977) introduces the concept of indirect discrimination, taken up in
1976 Race Relations Act.
1974 Labour forms a minority government after a General Election. Roy
Jenkins (Home Secretary again) announces an amnesty for illegal
immigrants.
272
1975 Black parents and students movement set up in north London.
Home Office White Paper on Racial Discrimination and Lord
Bullock’s report on A Language for Life published.
1976 Third Race Relations Act. Education is mentioned under sections
17-20, 36 and 71. Commission for Racial Equality (CRE) set up.
Working party of Chief Education Officers seek alternative funding
to Section 11 grants. Prime Minister Callaghan makes speech at
Ruskin College attacking education as failing to prepare a
workforce properly.
1977 EEC Directives on The Education of Children of Migrant Workers.
1977 Select Committee on Race Relations and Immigration reports on
The West Indian Community, makes eight recommendations on
education and a call for an inquiry into the education of West
Indian children. A DES Consultative Paper, Education in Schools ,
stresses that “ we are a multiracial and multicultural country”. The
Inner London Education Authority produces the first LEA policy on
multicultural education. Black Paper 5 (Cox and Boyson attacks
comprehensive educational and “Marxist infiltration” in education.
1977 National Front marches in London and Birmingham. In the
Stechford and Ladywood by-elections in Birmingham, Liberals
again beaten into third place by the National Front. Strikes by
Asian workers at Grunwick. Laboratories in London. OPCS census
reports 1.77 million “coloured population” (3.3 per cent of total
population)

273
1978 Home Office replies to the Select Committee report on the West
Indian Community, paras 17-24 on education. The government
accepts the need for an inquiry into black school achievement,
The Warnock Committee reports on Special Education Needs-no
mention of black parents and their concerns over special
education. Viv Anderson becomes first black footballer to play for
England.
1979 Rampton Committee set up to inquire into the education of
children from ethnic minority groups. Conservatives win the
General Election. Mrs Thatcher reluctantly allows the committee to
continue.
1980 Education Act and a Framework for the School Curriculum (DES).
1980 Conservatives Education Act introduces first attempts at a market
in schooling by allowing parents to express a preference of school.
Comprehensive schooling declared to be no longer national policy.
1981 Rampton interim report on West Indian Children in our Schools
(DES 1981a) makes 81 recommendations. Sir Anthony Rampton
resigns and is replaced y Lord Swann. A Schools Council survey
makes 58 recommendations on multi-ethnic education.
1981 British Nationality Act further excludes Commonwealth citizens
from entering the UK. (96,000 settled minorities apply for British
citizenship in 1982).
1981 White Paper The New Training Initiative (D. of Employment).
1981 Special Education Act. Categories of Handicap abolished to be
replaced by the concept of Special Educational Needs (SEN).

274
1982 Approximately 20 LEAs have written multicultural education
policies. Home office issues new guidelines for claiming Section
11 funding. Around 40 black supplementary schools known to be
in operation. Falklands War against Argentina.
1982 Technical and Vocational Education Initiative (TVE I) introduced;
Scarman Report on the Brixton Disorders.
1983 Conservatives re-elected. Schools Council for the Curriculum and
Examinations abolished, replaced by School Curriculum and
Development Committee and Schools Examination Council.
1983 White Paper Teaching Quality (DES.)
1984 Population with New Commonwealth origins recorded as 2.2
million.
1984 Council for the Accreditation of Teacher Education (CATE) set up,
and all courses are required to include training for a multicultural
society; Education (Grant and Awards) Act and Green Paper
Parental Influence at School (DES).
1985 Swann Report Education for All published, with ten pages of
recommendations, stressing that all those involved in education
should share in developing a democratic pluralistic society with
equal opportunities.
1985 White Paper on Better Schools published (DES 1985b) stressing
that pupils are to be given an understanding of the (unspecified)
traditions and values of British society.
1986 Parliament ratifies the Single European Act which allows free
movement of EC nationals between member states.
275
1986 Education Act abolished corporal punishment in schools. O levels
replaced by GCSEs.
1986 Campaign for Real Education to support British culture and the
Christian religion in schools and Social Security Act.
1986 City Technology colleges (CTCs) set up; National Council for
Vocational Qualifications (NCVQ) set up; White Paper Education
and Training: Working Together (DES).
1987 Teachers’ Pay and Conditions Act and Coservatives re-elected for
a third term of office.
1988 Education Reform Act introduces a National Curriculum.
1989 Labour Party issues Multicultural Education: Labour’s Policy for
Schools.
1988 National Curriculum Council (NCC) and School Examinations and
Assessment Council (SEAC) set up.
1989 Children Act and Elton Report Discipline in Schools.
1990 Education (Student Loans) Act and Training and Enterprise
Councils set up.
1991 Teacher’s Pay and Conditions Act and Parent’s Charter You and
Your Child’s Education (DES).
1991 General National Vocational Qualifications (GNVQs) to be
introduced and White Paper Education and Training for the 21st
Century (DES/DoE).
1992 Transfer of Functions Orders: Department of Education and
Science (DES) to become Department for Education (DfE);
Further and Higher Education Act.

276
1992 Conservatives re-elected for a fourth term of office.
1992 White Paper Choice and Diversity (DfE); Office for Standards in
Education (Ofsted) set up and League tables of GCSE results first
published in newspapers.
1993 Education Act and National Commission on Education Report
Learning to Succeed.
1993 NCC and SEAC replaced by School Curriculum and Assessment
Authority (SCAA); Dearing Report The National Curriculum and its
Assessment.
1994 Updated Parents’ Charter Our Children’s Education (DfE); Code of
Practice for Special Education Needs and Teacher Training
Agency (TTA) set up.
1994 Education Act.
1995 Diversity and Excellence:A New Partnership for schools;
Performance in City Schools and Department for Education
merged with Department of Employment to become Department
for Education and Employment( DfEE).
1995 Disability Discrimination Act; Excellence for Everyone: Labour’s
Crusade to Raise Standards and National targets for education
and training revised.
1996 Education and Training for 14-19 Year Olds; Dearing Report
Review of Qualifications for 16-19 Years Olds and Ofsted Report
The Implementation of the Code of Practice for Pupils with Special
Education Needs.

277
1996 Aiming Higher:Labour’s Proposals for the Reforms of the 14-19
Curriculum; Education Student Loans Act; Nursery and Grant-
Maintained Schools Act and Early Excellence: A Headstart for
Every Child.
1996 Education Schools Acts; Education Schools Inspection Act and
Learning to Compete:Education and Training for 14-19 Years
Olds.
1996 White Paper Self Government for Schools; Education Bill and
National Literacy Project proposed.
1997 Education Act; Labour government elected; cabinet sets up
Welfare to Work Committee; Standards and Effectiveness Unit set
up in the DfEE.
1997 Launch of New Deal for unemployed young people 18-25; summer
literacy schools initiative announced; Education Act, abolition of
assisted places scheme and nursery vouchers.
1997 White Paper Excellence in Schools; National Literacy Strategy
announced; a literary hour to be in place in all primary schools by
September 1998.
1997 Committee on Computers in Schools set up; Green Paper
Excellence for All Children: Meeting Special Education Needs;
School Standards and framework Bill; Social Exclusion Unit set up
in Cabinet Office; Muslim schools given state funding as voluntary
aided schools;

278
1998 Standards Fund set up; Ethnic Minority Achievement Grant
(EMAG) to replace Section 11 of Local Government Act 1996
(EMTAG-the additional T referring to Travelling pupils from 2000).
1998 House of Commons Education and Employment Committee Fifth
Report Disaffected Children; National Childcare Strategy
launched; Education Action Zones: first 25 announced; interim
guidance on schools admissions published by DfEE.
1998 School Standards and Framework Act; Teaching and Higher
Education Act; New Opportunities Fund set up; Plans for a
University for Industry (Ufi); Expansion of Specialist Schools
initiative beacon schools to be identified.
1998 National Grid for Learning to be set up; Guidance on national
children strategy and early years development and childcare
partnerships; Literacy hour in all primary schools advised;
Numeracy Task Force set up.
1998 National Year of Reading launched; Crick Report Education for
Citizenship and the Teaching of Democracy in School; DfEE
published homework guidelines; plans announced for a network of
school study centres in Extending Opportunity: A National
Framework for Study Support.
1998 Supporting Families: A Consultation Document; Meeting Special
Education Needs: A Programme for Action; consultation on a
revised code of practice for SEN; Green Paper Teachers. Meeting
the Challenge of Change.

279
1999 Sure Start: A guide for Trailblazers: programmes for 0-3 year olds
in areas of deprivation; Blair and Blunkett announce action plan for
inner city education, including an expansion of specialist and
beacon schools and a new approach for gifted children;
Excellence in Cities; Revised National Curriculum put out for
consultation; report on creative and cultural education: All Our
Futures.
1999 White Paper learning to Succeed; Numeracy strategy suggested
for all primary schools; National Curriculum published; A “Black”
Seventh Day Adventist school and a Sikh school given state
funding. Learning and Skills Bill.
2000 Blunkett announced tests for 12 year olds, summer camps for 16
year olds and changes to enrolment in specialist schools; Blair
reiterated commitment to specialist schools; Commission on
Childcare set up; Blunkett announced creation of centrally funded
city academies modeled on USA charter schools.
2000 Comprehensive Spending Review promised an extra £5 billion for
education over three years; Statuary code of admission for all
maintained schools .
2001 DfES the education department was renamed the Department for
Education and Skills;White Paper Schools - achieving success
proposed large increase in number of schools run by religious
organizations
2002 Education Act implemented the proposals in the 2001 white
paper. City academies the first 3 opened;Languages for all:
280
languages for life the government's strategy for the teaching of
foreign languages.
2003 City academies 9 more opened; Workforce remodelling a
government initiative aimed at reducing teachers' workload by
employing more unqualified classroom assistants; Green paper
Every Child Matters led to the 2004 Children Act.
2004 University top-up fees MPs voted - by a small majority - to allow
universities to charge variable fees. Building schools for the future
a massive school rebuilding programme; The Children Act based
on the 2003 green paper Every Child Matters.
2004 Five year strategy for children and learners formed the basis for
the 2005 white paper Higher standards, better schools for all;
Academies (the 'City' had now been dropped). 5 more opened;
Tomlinson Report 14-19 Curriculum and Qualifications Reform
report of the working group chaired by former chief inspector Mike
Tomlinson.
2005 White paper 14-19 Education and Skills rejected most of 2004
Tomlinson Report's recommendations; White Paper Higher
standards, better schools for all proposed independent trust
schools led to 2006 Education and Inspections Bill.
2006 Education and Inspections Act passed only with Tory support;
University top-up fees UCAS revealed that 15,000 fewer students
had started university compared with the previous year; Primary
Review (independent of government) sponsored by the Esmée
Fairbairn Foundation and led by Professor Robin Alexander.

281
2007 Teaching 2020 a paper setting out the government's vision for
schooling in the future; School leaving age the government
announced its intention to raise the SLA to 18, possibly in 2013.
2007 GTC called for all national school tests for 7, 11 and 14 year olds
to be scrapped.
2007 Green Paper Raising Expectations: staying in education and
training post-16 argued that all young people should stay in
education or training up to the age of 18.
2007 Diversity and Citizenship report pupils should have the skills to
'participate in an active and inclusive democracy, appreciating and
understanding difference'.
2007 Education department split in two: Department for Children,
Schools and Families (DCSF) and Department of Innovation,
Universities and Skills (DIUS).
2007 Faith in the System: faith schools agreed to 'promote social
cohesion'.
2007 Further Education and Training Act 2007 new arrangements
relating to further education and the Learning and Skills Council
for England.
2007 The Children's Plan ambitious plan for all future government policy
relating to children, families and schools.
2008 Sale of Student Loans Act 2008 allowed the government to sell off
student loans.

282
2008 Special Educational Needs (Information) Act 2008 amended the
1996 Education Act in relation to the provision and publication of
information about children with special educational needs.
2008 Children and Young Persons Act 2008 new arrangements for the
provision of social work services.
2008 Education and Skills Act 2008 raised the education leaving age to
18; Key Stage 3 SATs effectively abolished.
2008 Education for All: final report of the Nuffield Review of 14-19
education and training.
2008 Testing and Assessment report by the House of Commons
Children, Schools and Families Committee (CSFC).
2008 NUT members staged one-day strike over pay (24 April).
2008 Ofqual (Office of the Qualifications and Examinations Regulator):
launched on 16 May, led by Kathleen Tattersall.
2008 National Challenge launched by Balls: targeted 638 'failing' state
secondary schools.
2008 SATs fiasco: widespread IT problems; delayed and inaccurate
results; QCA chief executive Ken Boston resigned.
2008 Academies: 51 opened in September.
2008 Tories' free schools policy announced by Michael Gove (shadow
education secretary).
2008 IRPC Interim Report Interim Report of the Independent Review of
the Primary Curriculum
2008 School Admissions Code: revised version published in December.

283
2009 Cambridge Primary Review Towards a New Primary Curriculum
Past and Present and The Future
2009 Homophobic bullying in Britain's schools: report by Stonewall.
2009 CSFC Report National Curriculum report by the House of
Commons Children, Schools and Families Committee.
2009 IRPC Final Report Final Report of the Independent Review of the
Primary Curriculum
2009 Learning Behaviour: Lessons Learned report follow-up to the
Steer committee's first report Learning Behaviour (2005).
2009 Macdonald Report Independent Review of the proposal to make
Personal, Social, Health and Economic (PSHE) education
statutory
2009 SATs: boycott proposed by NUT and NAHT.
2009 DIUS abolished after just two years: responsibilities transferred to
new Department of Business, Innovation and Skills (BIS).
2009 Eleven plus abolished in Northern Ireland, but grammar schools
(mostly Roman Catholic) vow to set their own tests.
2009 Apprenticeships, Skills, Children and Learning Act 2009 created a
statutory framework for apprenticeships.
2009 White Paper Your child, your schools, our future wide-ranging
proposals including the removal of central government prescription
of teaching methods and reduction in the use of the private
consultants to improve schools.
2009 A New Framework for Higher Education (Department of Business,
Innovation and Skills): set out ten to fifteen year strategy.

284
2010 Cambridge Primary Review Children, their World, their Education:
final report.
2010 Steer Report Behaviour and the role of Home-School Agreements
advice on implementing changes to home-school agreements as
specified in the Children, Schools and Families Bill.
2010 Child Poverty Act 2010 targets and provisions.
2010 Children, Schools and Families Act 2010 based on 2009 white
paper but much reduced because of the impending election.
2010 Equality Act 2010 wide-ranging Act which replaced nine major
Acts of Parliament and almost a hundred sets of regulations which
had been introduced over several decades.
2010 SATs: a quarter of all primary schools boycotted the tests.
2010 Academies Act 2010 provided for massive and rapid expansion of
academies.
2010 Budget cuts: government proposed cuts of up to £3.5bn in the
schools budget.
2010 IRPC primary curriculum proposals: scrapped.
2010 School sports partnerships: Cameron called for a review of the
decision to scrap the scheme.
2010 Diplomas: Labour's flagship policy scrapped.
2010 QCDA: scrapped.
2010 Extension of free school meals: pilot schemes mostly scrapped.
2010 Building Schools for the Future: scrapped.
285
2010 Browne Report Securing a Sustainable Future for Higher
Education recommendations mostly ignored.
2010 Higher education: fewer places and vastly increased tuition fees,
the latter despite Liberal Democrat pre-election promises.
2010 White paper The Importance of Teaching wide-ranging document
covering teaching, leadership, behaviour, new schools,
accountability etc.
2011 Education Act 2011 increased schools' powers relating to pupil
behaviour and exclusions, further diminished the role of local
authorities, further expansion of academies etc.
2011 Tickell Report The Early Years: Foundations for life, health and
learning made recommendations relating to the EarlyYears
Foundation Stage.
2011 Bew Report Independent Review of Key Stage 2 testing,
assessment and accountability recommended that published test
results should be more comprehensive and seen as a part of a
bigger picture.
2011 DfE The Framework for the National Curriculum a report by the
Expert Panel for the National Curriculum review.
2011 All-Party Parliamentary Group for Education Report of the Inquiry
into Overcoming the Barriers to Literacy
2011 HCEC Report Participation by 16-19 year olds in education and
training a report by the House of Commons Education Committee.
2011 HCEC Report Behaviour and Discipline in Schools a report by
the House of Commons Education Committee.
286
2011 HCEC Report The English,a report by the House of Commons
Education Committee.
2011 Green Paper Support and aspiration: A new approach to special
educational needs and disability
2011 White Paper Higher Education: Students at the Heart of the
System .
2011 Training our next generation of outstanding teachers discussion
document from the DfE.
2011 Wolf Report Review of Vocational Education
2011 Henley Report Music Education in England and also the
government's response to the review
2011 DfE/DCMS The Importance of Music: A National Plan for Music
Education
2011 Training our next generation of outstanding teachers
implementation plan from the DfE.
2012 Equality Act 2010: Advice for school leaders, staff, governors and
local authorities non statutory advice from the DfE.
2012 Admissions Code: Admissions Code , Admission Appeals Code
2012 Ofsted Report Moving English forward action to raise standards in
English.
2012 Lingfield Report Professionalism in Further Education the interim
report of the Independent Review Panel.
2012 HCEC Report Great teachers: attracting, training and retaining the
best a report by the House of Commons Education Committee.

287
2012 White Paper Reform of provision for children and young people
with Special Educational Needs
2012 Henley Report Cultural Education in England an independent
review for the Department for Education and the Department for
Culture, Media and Sport.
2012 Lingfield Report Professionalism in Further Education the final
report of the Independent Review Panel.
2012 Statutory Framework for the EYFS: Setting the standards for
learning, development and care for children from birth to five
2013 EYFS Profile Handbook published by the Standards and Testing
Agency.
2013 Revision of the National Curriculum.
2014 Children and Families Act 2014 covering adoption, family justice,
special educational needs and disabilities, childcare, welfare of
children.
2014 Sense and Instability examining how changing government
policies have affected the skills landscape over the past three
decades.
2015 Academies and free schools report ; academies and free schools
had had little or no effect on improving standards.
2015 Warwick Commission Enriching Britain: Culture, Creativity and
Growth: argued that creativity, culture and the arts were being
systematically removed from the education system.

288

289
Works cited.
"A Profile of Teachers in England from the 2010 School Workforce Census "
.Research Report DFE-RR 151.Np: DfE, 2011.Print.
Abeles, Harold et al. " Musicians crossing musical instrument gender
stereotypes : a study of computer-mediated communication". Music Education
Research 16:3 ( 2014): 346-366.
ABRSM. January 2013. < http://us.abrsm.org/en/home/>.
---. Celebrating Success :the Annual Review 2011. England: ABRSM, n.d. Print.
---.Diplomas by result. February 2014. < http://us.abrsm.org/es/press/exam-
statistics/diplomas-by-result/>
---. Inspiring musical achievement: the Annual Review 2012. England: ABRSM,
n.d. Print.
Abovetopsecret. August 2015.
<http://www.abovetopsecret.com/forum/thread57/>
Abrams, D. and Michael A. Hogg. "Collective Identity: Group Membership and
Self-conception ".Self and Social Identity. Ed. Marilynn B.Brrewer and Miles
Hewstone. Cornwall: Blackwell Publishing,2004:146-181.Print.
Altbach, Philip et al. Trends in Global Higher Education: Tracking an Academic
Revolution. France: UNESCO 2009.
Amir, Dorit. " My music is me: Musical Presentation as a way of forming and
sharing identity in music therapy group". Nordic Journal of Music 21:2 (2013):
176-193.
Ängarme-Lindberg. Teresia, Grown-up Children of Divorce. Sweden: Linköping
U, 201. Print.
Anti-Bullying Alliance. July 2014. < http://www.anti-bullyingalliance.org.uk />.
290
Apprenticeships. November 2013. < http://www.apprenticeship.org.uk/
employers/apprenticeships-for-small-business/what-support-is-available.aspx/>.
Arts Council. November 2011- 2013. < http://www.artscouncil.org.uk/>.
---. Achieving Great Art for Everyone: a Strategy Framework for the Arts.
London: Arts Council England,2010.Print.
-- .Bridge organisations Briefing.N.p:n.p, n.d. Print.
---." Who are the bridge organisations?". Bridge Organisations in Arts
Council.Jan. 2014 <http://www.artscouncil.org.uk/what-we-do/our-priorities-
2011-15/children-and-young-people/bridge-organisations/>.
---.Music Education Hubs. February 2014.
<http://www.artscouncil.org.uk/funding/apply-funding/funding-
programmes/music-education-hubs/>.
Artsmark Awards. December 2013.< http://www.artsmark.org.uk/>.
---. " What is Arts awards?. < http://www.artsaward.org.uk/site/?id=64 />.
Avramidis, Elias and Brahm Norwich. " Teachers' attitudes towards integration/
inclusion: a review of the literature, European Journal of Special Need
Education". London: European Journal of Special Needs Education,
2002.17:2, 129-147.Print.
Aymsley-Green, et Al. "The 11 Million children and young people in England
have a voice". England: Children's Commissioner for England., 2007.Print
Baaron,Robert and Donn Byrne. Social Psychology. 10th Ed. Madrid :Top
Printer Plus, 2005.Print.
Bailey, B.A., & Davidson, J.W. Effects of group singing and performance for
marginalized and middle‐class singers. Psychology of Music: 2005,
269‐303. Print.

291
Baginsky, M, et al. A summative Report on the Qualitative Evaluation on the
Eleven Remodelling Social Work Pilots 2088-11(September
2011).Leeds:CWDC, 2012.Print
Balcar, Jirí et al. Transferability of Skills across Economic Sector. Belgium:
European Commission, 2011. Print
Barnes, Louise. Education and Training: Social Trends 41.Office for National
Statistics: south Wales, 2011. Print
Barmby, Patrick. "Improving teacher recruitment and retentions: the importance
of workload and pupil behaviour". Educational Research 48:3 ( 2007) 247-265.
Bates, Richard. " Academies! Academies! Academies!". Journal of Education
Administration and History 45:3 ( 2013) 286-297.
Bathmaker, Ann-Marie. " Standardising teaching: the introduction of the
national standards for teaching and supporting learning in further education in
England and Wales". Journal of In-Service Education 26:1 ( 2006): 9-23
Beckerman, Nacy. " PSTD as aftermath for bullied LGBT adolescents: the
case for comprehensive assessment". Social Work in Mental Health 12:3 (
2014): 195-211.
Beicht, Ursula and Günter Walden ." How socially selective is the German
system of initial vocational education and training? Transition into initial
vocational training and the influence of social background". Journal of
Vocational Education & Training 67:2 ( 2014): 235-255.
BenDavid-Hadar, Iris. " Analysing School Finance Policy: Beyond a
Quantitative Approach". International Journal of Public Adiministration.37:5
(2014) :271-280.

292
Behle, Heike. " European Mobility of United Kingdom Educational
Graduates.Who Stays , Who Goes". Higher Education Quarterly. Volume 69.
No 3 (2014): 288-304.
Bolloten, Bill and Tim Spafford. Refugee and asylum seeker children in UK
schools. England: Naldic, 2011. Print
Borgwald , K. " Bullying the bully: Why zero-tolerance policies get a failing
grade". Social Influence. 8:2-3 (2012) : 149-160.
Bolton, Paul. Converter Academies: Statistics, House of Common, 2012.Print
Brah, Avtar. Cartographies of Diaspora: Contesting Identities. New
York:Routledge,2003. Print
Britain and the Colonization of Africa, Imperialism in Asia. Np: np.:nd
Brough, Chris Jane. "Implementing the democratic principles and practices of
student-centred curriculum integration in primary schools". The Curriculum
Journal.23:3 ( 2012) :345-369.
BBC News." £10m pledged to Royal Opera House" . 9th May 2007
<http://news.bbc.co.uk/2/hi/entertainment/6638245.stm />
---."Music tuition falling poll".<http://www.bbc.co.uk/news/mobile/education-
11179448/>. 10th Sep. 2012.
---."School spending stays protected from budget cuts" 26 June 2013.
<http://www.bbc.com/news/education-23063018/>
--- " Subjects taught in schools in England. Nov 2014.
"<http://www.bbc.co.uk/schools/parents/subjects_taught/printSubjects taught in
schools in England/>.
---."School heads warn of budget "snatched back on pensions". March 2014.
<http://www.bbc.com/news/education-26576723# />.

293
Beard, R. National Literacy Strategy. Leeds: U of Leeds, 2000.Print.
Beaumont, Jen. Household and Families. Social Trends 41.Naional
Statistics.Print.
Beckford, M. "250 Sure Start centres could close in a year". The Telegraph.
January 2011.N.pag.Print.
Bratton J and Gold. Human Resource Management, Theory and Practice. Avon:
The Bath Press,1999. Print.
Brewer, C. B. Music and Learning: Integrating Music in the Classroom. Music
and Learning. 1995.< http://www.newhorizons.org/strategies/arts/brewer.htm>.
Bristol City Council, Supplementary Schools in Bristol :their Contribution to
Raising Attainment. Bristol: n.p., 2005. Print.
---.< http://www.bristol.gov.uk>. July 2014.
British Council. August 2011.< http://www.britishcouncil.org/>.
The Brown Report. October 2010.
Bullying Statistics. June 2012.<http://www.bullyingstatistics.org/>.
Cabinet Member Report, Allocation Formula for 2011/12.
Cambridge Primary Review .Interim Reports. Towards a new Primary
Curriculum. Part I: Past and Present. Cambridge: U of Cambridge, 2009.Print.
Chatzifotiou, Athanasia. " AN imperfect match? The structure of the National
Curriculum and education for sustainable development". The Curriculum
Journal.13:3 (2002), 289-301).
Chowdry , H and Luke Sibleta. Trends in education and schools spending.N.p:
ESRC, 2011. Print
Center for Global Geography Education. Nov 2014. .<http://cgge.aag.org/>.
294
Children and Families Services: Definition of a Looked after Child. Kent: KCC,
2010.Print.
Children and Young persons Act 1989. Print.
Children and Young Persons Act 2008.,Print.
The Children's Pan: Building brighter futures. Department for children, Schools
and Families. Norwich: DfCSF, December 2007.Print.
Chilton, M . "Read for My School scheme is a winner " The Telegraph. January
2013. N. pag. Print.
Clarke,Sarah. Young Lives in Limbo. Wales: WRC, 2011. Print.
Choir Schools' Association. Feb 2014. <http://www.choirschools.org.uk/>.
---. Reaching out: a celebration of the work of the Choir Schools' Association.
N.p: n.p, n.d.Print.
Clark, Christina and Kate Rumbold. Reading for Pleasure: a research overview
.London: National Literacy Trust, 2006. Print.
Clark, Christina and George Dugdale. Literacy Changes Lives.
London:National Literacy Trust, 2008.Print.
Clift, S and Hancox, G. The Significance of Choral Singing for Sustaining
Psychological Wellbeing. N.p: MPR, 2010.Print
Cloonan, M. and R. Canning. Completion Rates of Scottish Vocational
Qualification (SVQ) Courses: A Research Study. Scotland: n.p,n.d. Print.
Cloreduffield. About the foundation. <http://www.cloreduffield.org.uk/>.
November 2013.
Cole, Mike. "Racism, Reconstructed Multiculturalism and Antiracist Education".
Cambridge Journal of Education 28:1 ( 1998) :37-48.

295
Cowley, Trudy and John Williamson. " A Recipe for Success? Localized
implentation of a (flexible) National Curriculum". The Curriculum Journal 9:1
(1998): 79-94..
Creative Skills set. < http://www.creativeskillset.org>. November 2013.
Croxson, B. The Implementation of the Threshold in UK Secondary Schools.
CMPO working paper series no 01/44. Bristol: U of Bristol, 2001.Print.
Crumpacker, M., & Crumpacker, J. D. "Succession planning and generational
stereotypes: Should HR consider age-based values and attitudes a relevant
factor or a passing fad? ".Public Personnel Management, 36.4(2007): 349–69.
Cullingworth, Barry and Vincent Nadin. Town and Country Planning in the UK.
USA: Routledge, 2006. Print
Cunningham, Mark et al. Minority Ethnic Teachers' Professional Experiences:
Evidence from the teacher Status Project. DfE: UCP, 2007. Print
Cultivating culture. August 2015. < http://www.cultivatingculture.com/>.
D'Cruz, Heather. " Working with Diverse Bodies, Diverse Identities: an
approach to professional education about diversity" 11:1 ( 2007): 35-37
De Groot-Reuvekamp, M.J et al. " The understanding of historical time in the
primary history curriculum in England and the Netherlands". Journal of
Curriculum Studies.46:4 (2014): 487-514.
Dellow, Nina. "IWM annonunces the First World War Centenary Partnership
Programme". London: IWM, 2013. Print.
De Vigginai, Nick et als Musical Pathways: An Explanatory Study.
Bristol:DfHSS, n.d .Print.
Department of Education. November 2011. <http://www.education.gov.uk/>.

296
---.Aiming High: Understanding the Educational Ethnic Pupils in Mainly White
Schools. Nottimgham: DfES Publications, 2003.Print
---. Cultural Education. A summary of programmes and
opportunities,2013.Print.
---. First World War Centenary press release.
<https://www.gov.uk/government/news/thousands-of-pupils-to-visit-first-world-
war-battlefields/>.
---. In Harmony. Liverpool Philharmonic. Liverpool .N.p , n.d. N.pag. Print.
---.The Importance of Music: A National Plan for Music Education. England:
DfE, 2011.Print.
---. The Academies Programme. Norwich: NAO, 2010 . Print
---. The National Curriculum. Handbook for secondary teachers in England.
Revised 2004.London: DES,2004.Print.
---.Music and Dance Scheme Update,2013.
<http://www.education.gov.uk/schools/toolsandinitiatives/b0068711/mds/>.
---.Schools, pupils and their characteristics : Statistical First Release. January
2011.
Department for Culture, Media & Sport. Supporting vibrant and sustainable
arts and culture. 24 August 2012. Print.
Disability and the Equality Act 2010.
EAL policy Review 2013.
EDC. July 2014. < http://www.edc.org/newsroom/articles/standing_bullying />.
Education and the Global Economic Crisis. n.p : Educational International
,2010. Print

297
Education, Audiovisual and Cultural Executive Agency. May 2014.
<http://eacea.ec.europa.eu/education/eurydice/index_en.php/>.
Economic and Social Research Council, shaping Society. Oct 2012.
<http://www.measuringdiversity.org.uk/>.
The Education Act 1944.
Education Funding Agency. September 2011<http://www.ypla.gov.uk />.
Education.com. February 2014. < http://www.education.com/>.
Education and Learning. June 2011 <http: //www.direct.gov.uk />.
England. February 2014. <http: //www.england.org.za />.
English Heritage. Annual Report and Accounts 2011-2012.Print.
--Award categories, Jan 2014.<http://www.englishheritage.org.uk/caring/angel-
awards/>.
Equality Act 2010.
--Heritage Lottery Funding. February 2014 <http://www.english-
heritage.org.uk/professional/advice/hpg/assistanceforowners/hlf//>.
Equality Scheme 2011-2015. Promoting Equality Celebrating Diversity. U of
Birmingham.
Ethical work and life learning. May 2012.<http://www.businessballs.com/>.
Europe 2020:UK National Reform Programme 2012. HM Government. N.p:
n.p, 2012. Print
European Agency for Development in Special Needs Education. July 2011.
<http://www.european-agency.org/>.
European Neighbourhood Policy and Enlargement Negotiations. August 2015.
<http://ec.europa.eu/enlargement/index_en.htm/>.

298
Eurydice Report: Funding Education in Europe. The Impact of the Economic
Crisis. Luxembourg: Publications Office of the European Union,2013.Print.
Evans, Jessie. Vocational Qualifications. DfBIS. March 2014. Print.
Eyesonbullying.July 2014. < http://www.eyesonbullying.org/>.
The Experience of Black and Minority Ethnic Staff in Higher Education in
England. London: ECU, 2011.Print.
Frank, Anne. The diary of a Young Girl: The definitive Edition .Peguin
Books.London 2012
Fashion-era. Aug. 20015.<http://www.fashionera.com/1950s/>.
The Framework for the National Curriculum: a Report by the Expert Panel for
the National Curriculum Review. N.p: DfE, 2009.Print.
Full Report-Women in the labour market. 2013. National Statistics. Print.
Gardner, Howard. Frames of Minds: The Theory of Multiple Intelligences. New
York: Basic Books, 1983, Print.
Gentry, Kyan. " History, heritage and localism". Policy Studies 34:5-6 ( 2013)
508-522.
Gillborn, David. " Critical Race Theory and Education: Racism and anti-racism
in educational theory and praxis". Discourse: Studies in the Cultural Politics of
Education 27:1 ( 2007) : 11-32.
Gordon, Sherri." How Empowering Bystanders can prevent Bullying". July
2012.
Gov. Uk. April 2013. <http://www.businesslink.gov.uk />.
Gabb, Sean. A Libertarian Conservative Case Against Identity Cards.London:
Libertarian Alliance, 1994. Print

299
Gambin, Lynn and Terence Hogart. " Factor affecting completion of
apprenticeship training in England". Journal of Education and Work. 10.1080
(2015) 1-24.
Gravatt, Julian. The Department for Education Budget after 2015. London:
AoC, 2014. Print
Green, Lucy. Music, Informal Learning and the School: A New Classroom
Pedagogy. England: Ashgate. 2008. Print.
Green , Rosie et al. Characteristics of bullying victims in schools. the UK: DfE,
2010. Print
Greenback, Paul. " The Evolution of Government Policy on Widening
Participation". Higher Education Quarterly. Volume 60. No 2, 141-166.
Guasp, April. The School Report. Cambridge: Stonewall, 2012. Print.
---. The Teachers' Report. Cambridge: Stonewall, 2012. Print.
Gunter, Helen & Ruth McGinity. " The politics of the Academies Proggrammes:
natality and pluralism in education policy-making". Research Papers in
Education 29:3 (2014) : 300-314.
Haddon, leslie et al. EU Kids Online: National perspectives. EU: n.p,2012.Print.
Hall, Nicola et al. Parent Know How: Telephone Helplines and Innovation Fund
Strands Evaluation. London: ECOTEC. 2009. Print.
Halliday, John. " Critical thinking and the academic vocational divide". The
Curriculum Journal 11:2 ( 2010) : 159-175.
Hampson, Martha et al. 10 schools for the 21st century. London : Innovation
Unit: n.p. Print.
The Harris Report. April 2010. Print.

300
Harris, Vee. " A cross-curricular approach to " learning to learn" languages:
government policy and school practice". The Curriculum Journal. 19:4 (2008):
255-268.
Hatcher, Richard. " Researching Resisitance: Campaigns against Academies
in England". British Journal of Educational Studies. 54:3 (2010):329-351.
Hawkins, Oliver. Migration Statistics. London: House of Commons, 2013. Print
Higher Education in Facts and Figures. London: Imperial College
Union,2011.Print
Higher Education Statistics Agency . October 2011.<http://www.hesa.ac.uk/>.
Hill, R, et al. The growth of academy chains: implications for leaders and
leadership. Nottingham: National College for leadership, 2012..Print
Hills, Suzanneh. " English as minority language". The Mail. November 2012.
Holmes, J. and B. Kautzer. Church Growth Research. Durham: n.p, 2013.Print
Hopkins, Johns. School of education. January 2014. <
http://education.jhu.edu/>.
Hogarth, Terence et al. " Apprenticeships in England: What next?". Journal of
Vocational Education and Training. 64:1 ( 2011) 41-55.
House of Common: Children, Schools and Families Committee, Sure Start
Children's Centres .Fifth report of session 2009-10.Volume I. London: The
Stationary Office, 2010. Print
Hyde, Cheryl et al. " Multicultural Content and Class Participation ". Journal of
Social Work Education.38:2 ( 2014) 241-256.
The Impact of Higher Education Finance on University Participation in the UK.
London: BIS, September 2010.Print.

301
Incurriculum. June 2014. < http://www.incurriculum.org.uk/main/the-
project/what-is-an-inclusive-curriculum />.
Independent Review of HE Funding and Student Finance. Browne
Report.October 2010.
Independent Review of the Primary Curriculum: Final Report. Nottingham:
DCSF Publications, 2009. Print.
Institute of Education. November 2013. <http://www.ioe.ac.uk />.
--- Centenary battle Tours . < http://www.ioe.ac.uk/research/87073.html/>.
International Institute for Educational Planning. Vol XXV, n 1,Janunary-March
2007.
Isaacs, Robert. NYCGB Musicianship Programme. N.p: NYCGB, 2013..Print
Jarrett, Tim. School Funding: Pupil Premium. London: House of
Common,2013.Print
Jerald, Craig. Defining a 21st century Education. N p: The center for Public
Education, 2009. Print.
Jerome. Lee and Gary Clemitshaw. " Teaching (about) Britishness?An
investigation into trainee teachers' understanding of Britishness in relation to
citizenship and the discourse of civic nationalism" . The Curriculum Journal
23:1 ( 2012) 19-41.
Kahn, Abby et al. Engaging Youth in their Turf. Healthy Teen Network. N.p:
n.p.,n.d.Print
Kearny-Gissendaner, Janet. Minority Teacher Recruitment and Retention
Strategies. New York: Eye on Education. 2010. Print.

302
Kelly, Philip and John Moores. " Culture Shock and Higher Education
Performance: Implication for Teaching". Higher Education Quarterly. Volume
66. No 1 ( 2012) : 24-46.
Kirkup. G. "Women and men in Science, Engineering and Technology": The
UK Statistics guide 2010. The UK Research Centre,2010. Print.
Karostelina, K. Social Identity and Conflict: Structures, Dynamics and
Implications. New York: Palgrave Macmillan,2007.Print.
Kupperschmidt, B. "Multigeneration employees: Strategies for effective
management".The Health Care Manager 19 (2000): 65–76. Print.
Kyunghee, So et al . " The idea of cosmopolitanism in Korea's national
curriculum".Asia pacific Journal of Education 34:1 ( 2013): 1-4.
Langos, Collette. " Cyberbullying: The Shades of Harm". Psichiatry, Psychology
and Law 22:1 ( 2014) : 106-123.
Lansdown, Gerison. Every Child's Right to Be Heard. London: UNICEF, 2011.
Print.
Lee, Molly. " Restructuring Higher Education: Public-Private Partnership".
Journal of Asia Public policy 1:2 (2008) 188-198.
Leitch Review of Skills. N.p: The National Archives, 2006.Print.
Learning-theories.com. Nov 2014. <http://www.learning-theories.com/>.
Lierse, Anne." The secret of power of music education".Lidership in focus.
Australia: n.p, 2012. Print.
Livesey, Chris. Sociological Perspective: Introduction to the Nature of Social
Thought. London: Sociology Centre. 2009. Print.
Loewenberg, Deborah. " The work of Teaching and the Challenge for Teacher
Education". Journal of Teacher Education. 60:5 ( 2009):497-511.

303
Lovaglio, Ricardo. La familia como objeto de estudio: sociólogico académico y
teorías critico-marxistas. Colombia: U de Cuyo, 2011. Print.
Macfarlane, B. " Dualism in Higher Education: a Critique of Their Influence and
Effect". Higher Education Quarterly. Volume 6, No 1 (2005) :1001-118
Making an Economic Impact: Higher Education and the English Regions.
London: U. of London, July 2012.Print.
Marxistleftreview. August 2015. < http://marxistleftreview.org/index.php/no6-
winter-2013/94-the-neoliberal-transformation-of-higher-education/>
Measuring Diversity. October 2012. <http://www.measuringdiversity.org.uk/>.
MIA. Music Industries Association. Feb. 2014. <http://www.mia.org.uk/whois/>.
Morgan, P. The War between the State and the Family: How Government
divides and Impoverishes. USA: Transaction Publishers, 2008. Print.
Middlemas, Jayme, National Curriculum Assessment at key stage 2 in
England, 2014. DfE.Print.
Music Education Council. Annual Report 2011. Print.
Music Education Council. Education Council Annual Report 2011/12. N.p:
MSC, 2012. Print.
Music for All. March 2014. <http://www.musicforall.org.uk/index.php/>.
Music For Youth. February 2014. <http://www.mfy.org.uk/>.
---.MFY Season Guidelines.2011. Print.
The Musicians' Union. The Working Musicians. England: DHA
Communications, 2012.Print
The National Curriculum in England. July 2013.Print.
Munby, Z.A Beginner's guide to Children & Families' Workforce Development.
England: NCVCCO, 2005. Print.

304
Munro, Emily. Safeguarding children Statistics: The Availability and
Comparability of data in the UK. Sheffield: CWRC, September 2011.Print.
Nezlek, John and Veronica Smith. " Social Identity in Daily Social Interaction".
Self and Identity. 4:3 ( 2007): 243-261.
NASUWIT. Workplace Bullying in Schools and Colleges. Birmingham: The
teachers' Union., 2012. Print.
The National Archives. Aug 2014.
<http://webarchive.nationalarchives.gov.uk/>.
National Association of Music Educators. April 2011.
<http://musiced.nafme.org/>.
The National Centre for Languages. December 2012.<http://www.cilt.org.uk/>.
National Colleges. August 2014.< http://www.nationalcollege.org.uk />.
National Crime Prevention Council. April 2011.<http://www.ncpc.org/>.
National Numeracy . April2012.<http://www.nationalnumeracy.org.uk />.
Nationalpupildatabase. Feb2014
<http://nationalpupildatabase.wikispaces.com/>.
National Youth Choirs Great Britain. Feb 2014. < http://www.nycgb.net/about-
nycgb />.
NFER. Where have all the level gone?. Berks: NFER, 2013.Print.
Neha-Tamara, Patel. " Gove under fire for £160m wasted on scrapped school
buildings" The Guardian. 13. July 2010. < http://www.theguardian.com />.
New2teaching. June 2013.
<http://www.new2teaching.org.uk/tzone/education/yourteaching/Diversity.asp/>
.

305
Newton, B, et al. Young Apprenticeships. Equal Opportunities. Report 428.
N.p: DfES, 2006.Print.
Noorani, S et al. National Sheets on Education in Europe 2013. Luxembourg:
Publications Office of the European Union,n.p.Print.
Notelaers, Guy et al. " A job characteristics approach to explain workplace
bullying". European Journal of Work and Organizational Psychology 19: 24
( 2009): 487-504.
NUS Students Experience Report. London: NUS, 2008. Print.
NUT Guidance on the Teachers' pay structure for 2012/13. N.p: National
Union of Teachers , 2012.Print.
---. Teacher Stress in Context. Sept 2008.
Obermann, Marie-Louise. " Moral Disengagement among Bystanders to
School Bullying". Journal of School Violence 10:3 ( 2011), 239-257.
O'Connor, Una. " Accession or Exclusion? University and the Disable Srudent:
A Case Study of Policy and Practice". Higher Education Quarterly.53:1 ( 1999):
88-103.
Oliver , Michael and Hugh Pemberton. UK economic policy in the 1960s and
1970s and the challenge to learning. Helsinki: IEHC. 2006.Print
Olweus, Dan. " Bully/victim problems in school". Bullying and Emotional Abuse
in the Workplace .Ed. Stale Einarsen et al.NY: Taylor & Francis, 2003.62-78.
Print.
OpenCities. July 2014.<http://www.opencities.eu />.
OPenCities local Action Plan. City of Cardiff. Cardiff: n.p, 2009. Print.
OpenCities Baseline Report Summary-February 2009.Openness and the
Competitive Advantage of Diversity. Belfast City Council.Print.

306
Panfil, Vanessa. " Gay gang-and crime -involved men's experiences with
homophobic bullying and harassment in schools". Journal of Crime and Justice
37: 1 ( 2013) : 79-103.
Palese, A., Pantali, G., & Saiani, L.. "The management of a multigenerational
nursing team with different qualifications". The Health Care Manager, 25.2
( 2006): 173–193.
Palm Springs. July 2014. < http://www.psusd.us />..
Patti, H & Sidsel Karlsen. " Recoceptualising musical learning : new media ,
identity and community in music education". Music Education Research 12:3 (
2010) 369-382.
Paton, Graeme. "Schoolchildren to visit WW1 Battlefields under Government
Scheme" The Telegraph. Education News, 21 Oct 2013. Print.
---. "Traditional musical instruments in decline". The Telagraph.UK News.22
Nov.2007.Print.
Parliament. November 2014. < http://www.publications.parliament.uk />..
Performance of converter academies .2014 Research Report.9 . Print
Poskitt, Jenny. "Transforming professional learning and practice in assessment
for learning". The Curriculum Journal 25:4 (2014): 542-566.
Powell, Robat et al. Transition from Primary to Secondary School. Wales:
NFER,2006.Print.
Preparing for the Future. Secondary Curriculum Review Explained. N.p: SecEd
& Qualification and Curriculum Authority, n.d. Print.
Pretty David et als. Mind the Gap-housing supply in a cold climate. London:
TCPA, 2009. Print.

307
Prezi. August 2015. < https://prezi.com/t5k1_8wnsoz8/the-economic-
development-for-uk/>.
Public Expenditure Statistical Analyses 2012. HM Treasure. Print
Qualifications and Credit Framework. Guidance for developing rules of
combination for the Qualifications and Credit Framework. Version 4.Coventry:
QCDA, 2010.Print.
Quennerstedt, Ann and M Quennerstedt. " Reaching children's rights in
education: sociology of childhood encountering educational theory". British
Journal of Sociology of Education 35:1 (2013): 115-132.
Race into Higher Education. Today's diverse generation into tomorrow's
workforce. London: n.p, January 2010. Print.
Ramesh, R and A. Gentleman. " Cuts will force 250 Sure Start centres to
close, say charities". The Guardian. 28 January 2011.
Randstad. Feb 2014. < https://www.randstad.co.uk/workforce360/archives/the-
uk-requires-53000-more-teachers-by-2050_389/ >.
The Reading Agency. November 2013. < http://www.readingagency.org.uk
/>.
Review of Cultural Education. April 2012. Print.
Richardson, H. " Closure Threat to 250 children's centres". BBC News.
January 2011.
--- "Hundreds of playgrounds schemes mothballed" .BBC News. August 2011.
Richardson, Robin. Race Equality and Education. A Practical Resource for the
School Workforce. London: ATL publications, 2005.Print.
--- Journeys to and from curriculum English.London:n.p. n.d. Print.

308
Rica, Sara et al. Immigration in Europe: Trends , Policies and Empirical
Evidence. Bonn: IZA, 2013. Print.
Rice, Linda and Sarah Poppleton. Policies on Reception, Return, Integration
arrangements for, and number of , unaccompanied minors-UK Report for an
EU comparative study. The UK: UK Border Agency,n.d.Print
RJE Staslhammar, Bo. " Music Teaching and Young People's Own Musical
Experience". Music Education Research 5:1 ( 2010) : 61-58.
Rising Stars. In a nutshell: the new curriculum Print.
Ronfeldt, Matthew et al.. " Recruitment or Preparation? Investing the effects of
Teacher Characteristics and Students Teaching. Journal of Teacher Education
44:4 (2013): 319-337.
Sachs, Judyth. " Teacher Professional Standards: Controlling or developing
teacher?". Teacher and Teaching: Theory and Practice.9:2 (2010): 175-186.
Safran, Elysa. " Bullying Behavior, Bullying Prevention Programs, and
Gender". Journal of Emotional Abuse 7:4 (2008): 43-47.
Sagger, Shamir and Will Somerville. Building a British Model of Integration in
an Era of Immigration: Policy Lessons for Government. Sussex: MPI. 2012.
Print.
Selmer, Jan. " Academic Staff Involvement and Openness to Diversity in
International Education Organisations. Is There a Moderating Effect pf Shared
Language?". Higher Education Quarterly. 67: 2 ( 2013). 135-156.
Seungchan, Choi. " Meritocratic Epistemic Communities: An Alternative Policy
Paradigm for Higher Education". Volume 69, No 1 ( 2015): 58-78.

309
Sparrow, Andrew. " Alan Milburn's social mobility report" .The Guardian. May
2012. <http://www.theguardian.com/politics/blog/2012/may/30/milburn-social-
mobility-politics-live-blog/>.
The Royal Albert Hall. February 2012. <http://www.royalalberthall.com/>.
Sansone, Randy et al. " The status of forgiveness among those bullied in
childhood". Mental Health, Religion and Culture 17:4 ( 2013), 339-344.
Schools Improvement Net. Nov 2013. <www.schoolsimprovement.net/>.
School Workforce in England. London: Statistics First Release, April 2012.
Print.
Shared futures. Mars 2012. <http: //www.sharedfutures.org.uk/>.
Simon, R. " Class size, teacher's pay and spending. which countries spend the
most and pay the least in education?". The Guardian.2012.
Simpson, Rob. Reducing bullying amongst the worst affected. N.p: DfE, n.d.
Print.
Singh, Raja R. Education for the Twenty-first Century: Asia-Pacific
Perspective. Bangkok: UNESCO, 1991.Print.
Sinkkonen, Hanna-Maihja et al. Bullying at a university: students' experiences
of bullying . Studies in Higher Education 39:1 ( 2012) , 152-165.
Social Trends. No 41. Office for National Statistics, 2010.
Smith, Heather. " A National Curriculum for All: A Cautionary Tale". Journal of
Curriculum and Pedagogy.11:1 ( 2014): 35-37.
Smith, Penny and Ian Abbot. Government Arrangements: new types of
schooling. The UK: BELMAS, 2013. Print.
Skills for Sustainable Growth. Strategy document. London: Department of
Business, Innovation & Skills, 2010..Print

310
Social Mobility Report. 2011.Print.
Sprott, H and Richard Crozier. Introducing the Certificate for Music Educators.
England: Arts Council.,2012. N. pag. Print.
Statistics Bulletin: Vocational Qualifications Quarterly: July to September 2011.
Coventry: OFQUAL, 2011.Print
Strauss Esmay Asssociates, LLP. Characteristic of Bullies & Targets. The
USA: NJ. 2011.Print
Stevens, David. "A Freirean critique of the competence model of teacher
education, focusing on the standards for qualified teacher status in England".
Journal of Education for Teaching 36:2 (2010) : 187-196.
Storey, Kim et al. Eyes on Bullying: What can you do?. USA: Education
Development Centre, 2008.Print.
Students at the heart of the System. London: BIS, June 2011.Print.
The Student Immigration System: A Consultation. Universities UK. February
2011.Print
Sutcliffe, Jeremy. "Balancing the budget :five key issues that could put you
school in the red" Guardian Professional.20 October 2012.
Tarapdar, Saima and Mary Kellet. Young's voices on Cyberbullying: What can
age comparison tell us?. London: OU, 2011.Print.
TCD. June 2014< https://www.tcd.ie/CAPSL/TIC/about/what/>.
Teacher Support Network. March 2013. < http://teachersupport.info/>.
TeacherVision. Nov 2014. <https://www.teachervision.com/>.
Teacher Recruitment Staffing Classrooms with Quality Teachers. State Higher
Education Executive Officers.2001
TES Connect. August 2014. <http://news.tes.co.uk />.
311
Teachers' Standards. DfE. 2012. Print
Teacher Support. January 2012.< http://www.teachersupport.info />.
Theriot, Matthew et al. " The Criminal Bully-Linking Criminal Peer Bullying
Behaviour in Schools to a Continuum of Deliquency". Journal of Evidence-
Based Social Work 1:2-3 ( 2008) : 77-99.
Thomas, Bethan and Daniel Dorling.Identity in Britain: a cradle-to-grave atlas.
Bristol: The Policy Press, 2007. Print
Tomlinson, Sally. Education in a post-welfare Society. Berkshire:
CIP.2005.Print
The Rt Hon Michael Gove MP. Education Questions. 16th January 2012.
Trends in Education and Schools Spending. Briefing Note BN 121.
Tier 1 ( Post-Study Work) of the Points based system. Policy Guidance.UK
Border Agency. N.p : n.p, April 2012.Print.
Train to Gain; Developing the skills of the Workforce. London: Department of
Business, Innovation and Skills, 2009.Print.
Training of Teachers. Fourth report of session 2009-10. HC 275-I.Volume I.
House of Commons. London: The Stationary Office Limited, 2010.Print.
Trainingzone . June 2014. <http://www.trainingzone.co.uk//>.
Understanding OpenCities. British Council. N.P: n.p.Print.
Unesco. The Global literacy Challenge. Paris: Unesco, 2008. Print.
---Guidelines on Intercultural Education. Paris: Unesco.2006. Print
--- Universal Declaration on Cultural Diversity. Johannesburg: Unesco.2002. Print
Universities & Colleges Admissions Service.Feb 2012.<http://www.ucas.com/>.
The United Nations Conventions on the Rights of the Child. How legislation
underpins implementation in England. March 2010. Print.

312
UK Council for International Student Affairs. Jan 2012.<http://www.ukcisa.org.uk/>.
UNESCO. August 2015. <http://www.uis.unesco.org/Education/Pages/global-teacher-
shortage.aspx/>.
University of Cambridge. Faculty of Mathematics. May 2013.
<http://www.maths.cam.ac.uk/about/community/step.html/>.
University of Leeds. May 2013. < http://www.leeds.ac.uk />.
UK public Spending. February 2013. <http://www.ukpublicspending.co.uk/>.
Varnava, George. Checkpoints for schools: Towards a non-violent society.
London: NSPCC, n.d. Print.
Vignoles,A. and S.Machin. Education Policy in the UK.Centre for the
Econimocs of Education. 2006. Print.
Wakeling, Paul. " Are Ethnic Minorities Underrepresented n UK Postgraduate
Study?. Higher Education Quarterly. Volume 63, N0 1 ( 2009): 86-111.
Watson, Derek. Dictionary of Musical Quotations. England: Wordsworth
Edition, 1991. Print
Wenchao Jin et al. Subjects and courses choices at ages 14 and 16 amongst
young people in England: Insights from behavioural economics.
DfE..2010.Print.
Guide to Widening Access Schemes. BMA House. London.2010.
West, Anne & Elizabeth Bailey. "The Development of Academies Programme.
" Privatising" School-Based Education in England 1986-2013". British Journal
of Education Studies 61:2 ( 2013): 137-159.
Whitson, Signe. " 6 Reasons Why Bystanders choose not to intervene to stop
Bullying". The Blog.Nov 2013 Print..

313
Whetton, Chris. " A brief history of a testing time: national curriculum
assessment in England 1989-2008".Educational Research 51:2 (2009): 137-
159.
Whitty, Geoff and Emma Wisby. Real Decision Making? School Councils in
Action. London: DfE.2007
Widening participation in Higher Education in England. London: BIS , August
2012.Print.
Widening participation in HE in England. HC 485.Session 2001-2002:18 Jan
2002..Print.
World Class Skills: Implementing the Leitch Review of Skills in England.
Norwich: DfIUS, July 2007.Print.
Workplace Bullying in Schools and Colleges Report. Birmingham: The
Teacher's Union, 2012.Print.
Wragg, T et al . Performance-related Pay. Exeter. U of Exteter, n.d Print.
U.S. Department of Health and Human Services. Cyberbullying. US: n.p, n.d.
Print.
Worldpopmusic. August 2015. < https://worldpopmusics.wordpress.com/>
Wragg, T. et al. Performance-related Pay. Exeter: U of Exeter, n.d. Print.
Yoon, Jina et al. " Teachers' Responses to Bullying Incidents: Effect of
Teacher Characteristics and Contexs". Journal of School Violence N.p ( 2014)
: 1-23.
Young People's Learning Agency. The new 16-19 Bursary
Youth Music. January 2013. <http://www.youthmusic.org.uk/>
Zagordo, Michele.National Sheets on Education Budgets in Europe. N.p: EU,
2014. Print.

314
Zierdt, Ginger. " Responsibility-centred budgeting: an emerging trend in higher
education budget reform". Journal of Higher Education Policy and
Management 31:4 ( 2009): 345-353.
The Robbins Report.
The 2013 South Nottingham Catholic Academy Trust Report. Nottingham:
Chartered Accountants, 2013. Print.
The 2013 Bromley Academy Programme & Free School Update. Briefing
ED13066.
21st Century Challenges. Oct 2014. <http://www.21stcenturychallenges.org/>

315
Resumen La Segunda Guerra mundial terminó con la victoria aplastante de los aliados,
sobre Alemania y Japón en 1945. Las estructuras, tanto políticas como
sociales, fueron totalmente destruidas en todo el mundo. La mentalidad de
postguerra estaba caracterizada por un gran deseo de recobrar la estabilidad
económica y la integridad política a través de la cooperación internacional para
evitar futuros conflictos bélicos.
Durante los años 50, Reino Unido aún sufría las consecuencias de la Segunda
Guerra mundial. Los ciudadanos tenían que identificarse con un carnet de
identidad y las amas de casa tenían que hacer cola con sus cartillas de
racionamiento. Churchill, considerado héroe de guerra, reencarnaba la nueva
esperanza, al ser reelegido presidente del país, Primer Ministro, bajo un
mandato conservador. Su objetivo era dar una nueva oportunidad a todos los
británicos para aliviar la dureza y la crueldad de la guerra.
Durante los años 60, el Primer Ministro conservador Harold Macmillan se
encontró con una difícil crisis económica. El crecimiento del país era lento, con
una ratio de la mitad del crecimiento de los países europeos líderes en aquel
momento. El partido Laborista, con Harold Wilson como Primer Ministro desde
1964 a 1970, se vio obligado a devaluar la moneda nacional en 1967 para dar
una solución al panorama financiero del país. El declive de la economía de
Reino Unido hizo que los sindicatos salieran a la calle a luchar por los
derechos de los trabajadores.
Durante los años 70, como consecuencia del conflicto árabe-israelí, los países
árabes redujeron la producción de petróleo y subieron el precio del crudo como
venganza por la ayuda occidental que estaba recibiendo Israel. Para muchos

316
países con una economía basada en el petróleo y con ninguna otra fuente de
energía alternativa, la subida de precio fue devastadora. Las áreas más
afectadas fueron Japón y la Europa occidental, entre ellos Reino Unido.
Durante los años 80, la vuelta a los valores victorianos reforzó la creencia de
que el individuo tenía que aceptar la posición jerárquica que conllevaba su
clase social, género y raza. La competitividad, el individualismo, la segregación
y la exclusión era parte de la vida cotidiana.
Durante los años 90, John Mayor, Primer Ministro desde 1990 a 1997, heredó
de Margaret Thatcher un sistema educativo decadente por la falta de inversión
y por la falta de oportunidades debido al gran desequilibrio social existente en
aquellos años.
Muchos de los cambios en el sistema educativo se llevaron a cabo siguiendo
una doctrina política determinada. Decisiones imprudentes y disparatadas
fueron el resultado de la rivalidad entre partidos políticos sin tener en cuenta lo
mejor para la población; aunque otras decisiones se tomaron con afán de
mejorar tuvieron resultados pésimos.
La mayoría de las fuentes primarias que he utilizado para la realización de esta
tesis han sido documentos oficiales tales como proyectos de ley, leyes,
códigos de prácticas, legislaciones e informes. Distinta y variada
documentación se ha elaborado constantemente para saciar las necesidades
sociales, cumplir con la demanda del mercado, establecer la competitividad
entre colegios y otros muchos objetivos.
En relación con las fuentes secundarías, existe una gran variedad de literatura;
ésta ha sido fundamental para la elaboración de mi trabajo. Las fuentes más
relevantes para el análisis de mi tesis han sido las bases de datos online,

317
periódicos y reseñas; como por ejemplo BBC News y The Guardian además de
libros tantos impresos como libros en versión digitalizada, cada vez más
comunes en la red.
La existencia de páginas webs especializadas en educación ha sido una ayuda
inestimable; un claro ejemplo es la página web del Departamento de Educación
británico (www.education.gov.uk).
En cuanto a la recopilación de datos, por un lado, la información cualitativa
implica la obtención de datos abiertos a la interpretación. Dicha información se
ha recopilado a través de la interpretación de reseñas históricas, lo que ha
constituido la esencia de mi estudio.
Por otro lado, la información cuantitativa implica la información que es
cuantificable, es decir, la que no está abierta a interpretación. El uso de dicha
clase de información ha sido limitada. Pero, en cualquier caso, ha sido utilizada
para aclarar o reforzar información. Tanto las ilustraciones como las tablas
usadas a lo largo de toda la investigación han ayudado a entender mejor
posturas antiguas y actuales; también a definir conceptos con explicaciones
más claras dando lugar a la disipación de cualquier duda en la explicación de
algún concepto.
Las implicaciones de los documentos de educación más relevantes han sido
analizadas en los once capítulos que componen esta tesis cubriendo la
educación infantil y primaria, el Currículum Nacional, formación profesional,
estudios universitarios, la contratación del profesorado y empleados públicos,
la aparición de las academias, el acoso escolar, la multiculturalidad en las
aulas, los presupuestos, la transmisión de las tradiciones y la importancia de
la música. La lectura y reflexión de la documentación oficial se ha llevado a

318
cabo para poder avanzar adecuadamente en la elaboración de cada uno de los
capítulos.
Como resultado de la mencionada metodología, el desarrollo de los temas de
cada capítulo se resume de la siguiente manera:
En el capítulo 1, se definen los diferentes aspectos relacionados con la
educación infantil y primaria para poder conocer mejor lo que implica la
educación en tan tempranas etapas. Está consagradamente probado que la
población más joven necesita un entorno seguro donde cuidar su salud mental
y física para conseguir un rendimiento académico óptimo.
Los niños son el futuro de un país. Como grupo comparten características
similares; aunque hay diversas definiciones con respecto a lo que es una
generación. Kupperschmidt define generación como un grupo identificable, o
cohorte, que comparte edad, ubicación y eventos significativos en las etapas
más críticas del desarrollo (The Health Care Manager, 200:66). Palese, Pantali
y Saiani sostienen que una generación es aquellos nacidos en una misma
franja histórica (The Health Care Manager, 200:182). M. Crumpacker y J.D
Crumpacker añaden que la ratio de nacimientos junto con los eventos
históricos definen cada generación (Public Personnel Management, 2007: 350).
Estos grupos desarrollan una pauta única de comportamiento basado en las
experiencias comunes.
Tajfel define identidad social como “una parte esencial del individuo que se
deriva de su aceptación como miembro en un grupo social (o grupos) junto a la
carga emocional que conlleva dicha pertenencia” (Nezlek, 2007:244; mi
traducción). Por lo que, todos los programas desarrollados en los últimos 10

319
años, tienen como objetivo el comprender las características y necesidades de
las nacidos en Reino Unido.
Uno de los ejemplos más claros del intento de unificar una población se sitúa
en EE.UU, donde la bandera nacional se alza a cada pocos metros para
recordar a sus ciudadanos que todos ellos pertenecen al mismo país. Esto es
debido a su profunda historia de inmigración, junto con el amplio abanico de
programas educativos para aquellos que necesitan integrarse, el denominado
“melting pot”. Reino Unido no necesita alzar su bandera; aunque los
escoceses recientemente, en 2014, han votado por seguir perteneciendo a
Reino Unido. De todas formas, un gran esfuerzo se está llevando a cabo para
lograr que todos los ciudadanos se consideren británicos. La población
estudiantil en general pasa junta muchas horas en el colegio y es allí donde
todos los esfuerzos deben dirigirse para ofrecer una identidad sólida y una
orientación laboral coherente.
En el capítulo 2, se analizan los cambios más importantes en la estructura del
Curriculum Nacional para primaria y secundaria. Las modificaciones son
debidas a planteamientos teóricos o a intereses políticos del partido en el
gobierno.
Han habido diferentes enfoques en el proceso de aprendizaje a lo largo del
tiempo; tres de las muchas teorías sobre el aprendizaje se pueden considerar
como los tres pilares de la creación y de las modificaciones posteriores del
Curriculum Nacional.
El cognitivismo se enfoca en la actividad mental; los procesos mentales como
pensar, recordar y la capacidad de resolver problemas son objeto de
exploración y estudio; el humanismo cree que es necesario estudiar a la

320
persona como un todo, ya que defiende la importancia de los cambios que el
individuo sufre en distintas etapas durante el proceso de madurez a lo largo
de la vida; y por último, el tercer pilar es el pensamiento de las habilidades del
siglo XXI ; las competencias tradicionales, la competencia digital, la retención
de conocimiento, la competencia mediática, y las habilidades de aprendizaje
son esenciales para obtener éxito en la vida académica y laboral en una era tan
digitalizada como la actual (Learning-Theories.com).
La flexibilidad y la adaptación son esenciales. Los días de un trabajo para toda
la vida, típicos del Japón de postguerra, ya no existen; han sido reemplazados
por trabajos donde la adecuación y la transformación de las habilidades son
primordiales para el éxito ( Balcar , 10).
El objetivo del Curriculum Nacional es ser el parámetro de la enseñanza y el
aprendizaje en las escuelas. También establece niveles mínimos para cada
asignatura y los objetivos que debe alcanzar el alumnado. Además, fija los
criterios de evaluación para valorar el progreso del alumno. El Curriculum
Nacional es considerado por el gobierno británico como la guía esencial de la
enseñanza y el aprendizaje en todo el país.
En el capítulo 3, se explica la relevancia de dar una segunda oportunidad a
ese alumnado que no se siente cómodo con el sistema académico tradicional.
La existencia de la formación profesional es una salida para los que no
encuentran su lugar en el sistema educativo. La participación en dichos cursos
facilita que el alumnado pueda adquirir los requisitos necesarios para tener una
vida laboral activa y participar en la economía del país. La formación
profesional se creó para que ese sector de la población pudiera desenvolverse
de forma autónoma en el mercado laboral.

321
Muchos estudiantes rechazan una prometedora carrera en la formación
profesional por el estigma relacionado con dichos estudios. Alemania se ha
considerado siempre un claro ejemplo del buen funcionamiento de la formación
profesional; tienen un sistema extraordinariamente bien organizado y
estructurado junto con una sólida industria que ha diseñado programas de
prácticas en los cuales el alumnado consigue saber perfectamente lo que le
espera en una situación real, es lo que se conoce como “sistema dual”.
De todas formas, las titulaciones ofertadas en Reino Unido están cada vez más
complementadas con programas de reciclaje y prácticas en empresas para
ofrecer a los alumnos un contacto real con el mercado laboral deseado ( 21st
Century Challenges.com). El presupuesto en formación en Reino Unido se ha
duplicado a lo largo de los últimos 24 años, de £43 billones (alrededor de €54
billones) en 1987/88 a £87 billones (alrededor de €110 billones) en 2010/11
(Barnes, 5).
El gobierno británico intenta por todos los medios que toda su población
encuentre un trabajo además de minimizar la discriminación laboral entre
hombres y mujeres. Nuevos programas y programas actualizados se están
ofertando aunque desgraciadamente la crisis económica ha sido un golpe duro
para la inversión; en los años venideros, sólo se espera que la crisis
desaparezca y se vuelva a invertir.
En el capítulo 4, se examina la educación universitaria como una forma de
contribuir a la riqueza nacional y al bienestar económico del individuo. Las
universidades, consideradas fábricas del conocimiento, tienen un papel crucial
en la producción de riqueza.
322
Según Altbach et al, una revolución académica está tomando forma con una
transformación sin precedente en el alcance y en la diversidad como causa de
la gran movilidad social, nuevas formas de pago, y a la cada vez mayor
variedad de programas en el sistema educativo. Los tratados de Boloña y de
Lisboa son el ejemplo más claro de un compromiso europeo internacional; se
estima que 8 millones de estudiantes cursarán estudios universitarios fuera de
su país de origen para el 2010 (7). El ataque terrorista del 11S en las torres
gemelas, the World Trade Centre, de Nueva York, en 2001 junto al terror
global que provocó dio como resultado que la aprobación de las solicitudes de
VISA fuera mucho más difícil de conseguir; además del gran obstáculo que
supone el precio de las matrículas universitarias y los gastos indirectos que los
estudiantes deben afrontar. Esto se debe a la idea neoliberal de que la
educación superior es un bien privado y como tal debe ser pagado por sus
usuarios (Marxistleftreview.org).
Otro reto para el gobierno británico es la gran demanda por parte de los
estudiantes de minorías étnicas de tener profesores pertenecientes a dichas
minorías étnicas para tener un modelo a seguir más próximo. Los estudiantes
con discapacidad son cada vez más visibles y sus necesidades cada vez más
cubiertas.
En el capítulo 5, se ven las características más significativas de la
contratación del profesorado, su formación, los requisitos mínimos y su sueldo.
El profesorado es un elemento clave en la vida de los estudiantes por lo que el
derecho básico a la educación no sería posible sin ellos; los futuros líderes del
mañana pasarán por sus aulas siendo la transmisión del conocimiento el medio
para llegar al éxito ya que los profesores amplían la capacidad de decisión para

323
que tengan una integración laboral responsable y productiva. Por lo tanto la
calidad de un sistema educativo se basa en la calidad de su profesorado;
siendo las prácticas en el aula la esencia de su formación
(Loewenberg, 2009:497). Los países con más éxito son aquellos donde la
enseñanza tiene mayor prestigio.
No obstante, la situación en Reino Unido es más complicada. Los profesores,
sobre todo los profesores noveles, están abandonando la profesión. La
enseñanza no da oportunidad de ascender, el aumento del sueldo no está
basado en méritos y las pagas extras son pocas y muy distanciadas entre ellas;
además de tener que estar al día con las exigencias laborales, la interminable
burocracia, la presión de los exámenes con la publicación de los resultados,
horarios compactos y clases donde los profesores tienen una sobreratio
añadiendo a todo esto los desafíos del día a día.
Para el 2050, Reino Unido necesitará 53.000 profesionales para alcanzar una
cuota de 507.000 profesores para cubrir las demandas de la población. Para
asegurar una buena plantilla, se necesita incrementar el número de profesores
a 1.600 al año a partir del 2008 (Randstad.co.uk).
Para poder alcanzar este propósito, el estatus del profesorado debe ser
restaurado socialmente. Ellos educan el futuro de un país y su labor no está
reconocida; en otros países como Finlandia, los profesores son muy
respetados y alcanzan un estatus social muy distinguido; otro ejemplo es
Japón, donde los profesores son los únicos súbditos que no tienen que hacer
una reverencia al Emperador. Por tanto, se necesita un concepto más valorado
de la profesión, hasta entonces la dificultad de contratar profesionales nunca
desaparecerá.

324
En el capítulo 6, se explica con detalle la gran transformación del sistema
educativo con la aparición de las Academias. El lanzamiento de dicho
programa en el 2000 fue algo novedoso para la realización de mejoras
educativas en las áreas urbanas. ( Gunter, 2014:301)
El principal objetivo de las Academias es atajar el fracaso escolar. El Gobierno
británico presentó el proyecto de ley de las Academias en el 2010 entrando
en vigor como ley a finales de ese mismo año.
Como parte de la estrategia gubernamental para fomentar la existencia de las
Academias, se estableció hacer público los resultados académicos; siendo
objeto de investigación aquéllas que no llegasen a los objetivos mínimos
establecidos. A lo largo de los años su expansión ha peligrado por factores
diferentes como problemas económicos, logísticos y otros inesperados dando
lugar a un distanciamiento de su fin original.
Este distanciamiento ha suscitado campañas en contra de las academias; sin
embargo poca atención se les ha otorgado. Esta negligencia ha provocado un
gran desamparo entre los disidentes y un nuevo enfoque se ha planteado para
recuperar su esencia.(Hatcher, 2010:330)
En cualquier caso, los alumnos de hoy en día competirán globalmente por un
puesto de trabajo. El mercado laboral exige las denominadas habilidades
superiores tales como toma de decisión, priorización de objetivos, elaboración
de estrategias y resolución en común de problemas ( “Teaching Higher-Order
Thinking”, 53) por lo que el alumnado tiene que dominar estas nuevas
destrezas para tener una oportunidad en el mundo laboral.
Estamos en un periodo de incertidumbre y evolución donde las habilidades
están claras pero la forma de conseguirlas está aún en prueba porque el

325
profesorado tiene que enseñar nuevas destrezas que nunca antes les habían
sido enseñadas.
En el capítulo 7, se describe el fenómeno del acoso escolar. Se han aclarado
conceptos erróneos y se han tomado en cuenta nuevos enfoques por el hecho
de que tanto el profesorado como el alumnado son piezas claves de este
hostigamiento o bien como acosadores o bien como víctimas o bien como
sujetos pasivos.
El acoso escolar es un fenómeno muy antiguo; se tiene referencia de la
existencia de casos de esta índole en investigaciones realizadas a mediados
del siglo XX; aunque será una preocupación nacional a partir de 1989 cuando
apareció por primera vez en el informe ,“ Disciplina en los colegios “, de Lord
Elton.
Entre la gran variedad de definiciones de acoso, la más empleada es la que
entiende que un alumno es acosado cuando está expuesto, repetidas veces a
lo largo del tiempo, a acciones negativas por uno o más compañeros
(Olweus, 62). Aun siendo la más recurrida, se ha quedado obsoleta a causa de
la involucración de nuevos participantes.
Por parte del alumnado, el desarrollo de la personalidad y el despertar sexual
hacen que cualquiera que no se ajuste a los estereotipos sociales sea la
perfecta victima; en alusión al profesorado, son los que experimentan uno de
los más altos niveles de estrés de todas las profesiones. El ministerio de
Empleo y Seguridad Social británico estima que el estrés, ansiedad y
depresión laboral afecta a 36.000 profesores anualmente en Reino Unido
(Teacher Support Network.info).

326
Se ha producido un gran avance en la sensibilización de la sociedad ante este
lastre del comportamiento humano; por naturaleza, el ser humano tiende a
estar en desacuerdo por lo que tenemos que esforzarnos en respetar a los
demás y ser respetado de tal manera que no nos hieran y que no hiramos a
nadie; sólo con buena predisposición y esfuerzo se podrá impedir.
En el capítulo 8, se interpreta como la inmigración ha creado una nueva
sociedad en Reino Unido con una segunda generación de nacidos en el país
con antecedentes no británicos. La multiculturalidad y la aceptación son la
clave para promover la unidad social entre distintos grupos étnicos. La
integración es la única vía para lograr la cohesión nacional.
El concepto de diversidad vela por el respeto de las diferencias culturales,
étnicas, raciales y religiosas ( D’Cruz, 2007:35).La inmigración de Reino Unido
tiende a mantenerse a altos niveles causando una emergente nueva sociedad
como resultado de los movimientos migratorios actuales; un hecho a tener en
cuenta es que más de la mitad de la población estudiantil de Londres son hijos
de inmigrantes (Saggar, 2); hay que añadir la entrada al país de menores no
acompañados que alcanzaron la cifra de 4.285 solicitudes de asilo en el 2008 ;
estos menores, bajo la protección jurídica, tiene derecho a recibir tutela legal,
independientemente de su edad.
La globalización y el flujo de personas han cambiado la organización de las
ciudades. Algunas autoridades locales se enfrentan a dificultades de personal,
otras a falta de infraestructuras que ha hecho que la integración social y
económica de los inmigrantes sea una tarea casi imposible. La ampliación de
la Unión Europea en el 2004, con la entrada de la República Checa, Estonia,
Chipre, Letonia, Lituania, Hungría, Malta, Polonia, Eslovaquia y Eslovenia , ha

327
sido la más numerosa en cuanto al número de países miembros y a la totalidad
de la población involucrada; en el 2007 se unió Bulgaria y Rumania; en el 2013,
Croacia se unió; actualmente, la EU está compuesta por 28 países miembros
con libre movimiento de personas (Europa.eu).
A Reino Unido hay que sumarle los refugiados y los súbditos de la
Commonwealth; para luchar contra el racismo se han elaborado diferentes
programas educativos y se ha concienciado de la imperante necesidad de
adaptarse a una realidad social en constante cambio.
En el capítulo 9, se desvela cómo se financia el sistema educativo británico.
Los programas de financiación están dirigidos a que el sistema se convierta en
un pilar de la recuperación económica. La educación es la única herramienta
que hace que la población llegue a ser una fuerza laboral activa.
El gobierno británico ha comprendido perfectamente como dirigir su país; lo
lidera como una gran empresa por lo que aplica principios básicos de Recursos
Humanos en referencia a los trabajadores, a la obtención de las destrezas,
habilidades, conocimiento y experiencia para ocupar puestos de trabajos,
además de aplicar dichos principios a la formación de los empleados para que
tengan un rendimiento adecuado o puedan ascender ( Bratton, 14)
La gravedad de la crisis económica fue infravalorada lo que motivó a que el
presupuesto para Educación fuera realizado de una manera poco seria,
estando muy alejado de la realidad. Una reducción de un 12 % se barajaba
debido al gran esfuerzo para asegurar las pensiones del profesorado, las
subidas de salario y cubrir la seguridad social. Se espera que el alumnado
crezca un 7% entre enero del 2016 y enero del 2020 paralelamente con el
gasto escolar (BBC.com).

328
El presupuesto final para el 2014 era de £90.2 billones, alrededor de 114€
billones, en vez de £99.3 billones, alrededor de 125€ billones; para el 2015 se
bajó de £102.7 billones ,alrededor de 129€ billones, a £90.1 billones ; para el
2016 se prevee un presupuesto de £92 billones, alrededor de 116€ billones.
(Ukpublicspending.co.uk).
La inversión en Educación no va a ser una tarea fácil. La mayoría de los países
han sido duramente golpeados por la crisis económica desde finales del 2008.
Con la esperanza de reducir el déficit fiscal, Reino Unido restringió el gasto
público teniendo como consecuencia presupuestos recortados, bajada de
salarios, despidos y congelación de empleo ( “ Education and Global Economic
Crisis”, 2). No obstante, la inversión en educación, formación y formación
permanente es la base del desarrollo ( Zagordo, 2).
El panorama económico no refleja las necesidades ni actuales ni las futuras
de la educación; se prevee una escasez de profesorado y de centros
educativos en los años venideros. La inversión en Educación se debe retomar
tan pronto como la consolidación fiscal sea un hecho constatable.
En el capítulo 10, se expone como el patrimonio cultural británico es protegido,
conservado y trasmitido a las nuevas generaciones y recién llegados a Reino
Unido. La finalidad es elaborar un sentido de identidad nacional entre súbditos
con antecedentes no británicos para eliminar el significado del concepto
antropológico de “ los otros”.
El individuo necesita pertenecer a un grupo que le ofrezca protección,
confianza e integración en un sistema de relaciones sociales ( Korostelina, 18);
así pues, hay circunstancias en las que el individuo se ve a sí mismo como

329
parte esencial de la comunidad aceptando la perspectiva del grupo como la
propia (Abrams and Hogg, 147).
A los nacidos en Reino Unido hay que sumarles aquéllos que provienen de una
inmigración por razones económicas, por asilo político o por hambruna en sus
países de origen aumentando los efectos del concepto de la diáspora
(Brah, 178); mantener la cultura de origen en los países anfitriones produce
que la identidad nacional se desquebraje poco a poco.
La oleada actual de conflictos en Oriente Medio, especialmente en Siria con el
grupo extremista islámico ISIS, la presión demográfica , las incesantes guerras
étnicas en África, el tráfico humano y la inmigración económica de los Balcanes
hace que Europa viva una crisis humanitaria sin precedentes. La masiva
llegada de personas, huyendo de sus países, tiene que ser acomodada e
integrada en la sociedad del país anfitrión. Exponerlos al patrimonio cultural y a
las tradiciones del país es fundamental para asegurar una integración
completa, aunque muchas veces el integrarse no siempre es fácil.
La sociopsicología intenta entender la naturaleza y las razones del
comportamiento humano que más tarde se materializará en una conducta
social (Baaron,5); así pues fomentar el respeto a través de festivales, visitas y
programas culturales es un procedimiento sutil para construir una imagen de lo
que se entiende por “ británico” tanto para nacionales como para no nacionales;
dando como resultado una sociedad más cohesiva donde cada miembro de la
sociedad se siente vinculado a su prójimo.
El gobierno tiene un gran interés por mantener a sus súbditos unidos bajo un
mismo sentimiento de nación. La educación, en todos sus niveles, es primordial
para llevar a cabo dicha empresa; a las nuevas generaciones se les provee de

330
todo lo necesario para sentirse pertenecientes a un mismo país sin tener en
cuenta sus antecedentes; es una cuestión de tiempo el saber si tanto esfuerzo
gubernamental ha dado sus frutos en una sociedad más compacta y sólida.
En el capítulo 11, el objetivo es dar una visión general de los distintos
programas de música. La música es esencial para el aprendizaje y el
desarrollo del ser humano y también constituye una importante fuente de
ingresos para el gobierno británico puesto que engloba tanto a los artistas
como a la audiencia.
El término inglés “ enculturation” o inmersión en la música y en las prácticas
musicales del entorno del sujeto es un factor fundamental para el aprendizaje y
el desarrollo de la inteligencia emocional y las destrezas sociales ( Green, 5 )
Para el desarrollo de una persona como ser humano se necesita algo más que
datos académicos, las artes en general son el alimento del alma y nutrir este
aspecto es vital para construir una sólida personalidad. La música se usa como
una herramienta terapéutica para incrementar el conocimiento del individuo
sobre sí mismo y sobre los demás; también a la música se la valora como un
dominio donde las identidades se desafían, se desglosan, se reafirman y se
reconstruyen (Worldpopmusic.com). Así pues, es transcendental para el
individuo y para el grupo estar expuestos a los beneficios de la música.
Cuando un grupo de personas se reúnen para crear música, trabajan por un
objetivo común desencadenando un vínculo intangible que produce cambios en
las personas involucradas; dicho vínculo es el medio para reconocer y tolerar
diferencias. (“Aiming High”, 5).
Es inevitable que minorías étnicas tanto en el profesorado como en el
alumnado se encuentren en algún momento de sus trayectorias académicas;

331
ante lo cual es la primera vez que se establece oficialmente un plan nacional
para la educación musical para todos los centros educativos de Reino Unido.
Se fortalece el alma al mismo tiempo que se refuerza los buenos resultados
académicos.
Como conclusión, se puede observar que la educación está tomando un
camino incierto por la necesidad de adaptarse a un nuevo sistema, el cual se
debe amoldar a las exigencias sociales; la globalización, la economía, la
tecnología, la inmigración y las minorías étnicas son los factores principales
alrededor de los cuales se realiza la reorganización educativa.
El profesorado actual está preparando a un alumnado para un futuro sin
fronteras; no solamente facilitándoles las destrezas necesarias sino también
confiriéndoles el conocimiento necesario para construir una identidad común
que les haga sentirse más próximos los unos a los otros en una sociedad
multicultural. Esta tesis muestra los distintos enfoques que Reino Unido ha
tomado para dicha finalidad.
Desde una perspectiva postcolonial, el declive del imperio británico y la
creación de la Commonwealth despertaron falsas esperanzas en los antiguos
colonizados. Los súbditos del Imperio se trasladaron a la madre patria con la
creencia de tener una oportunidad de mejorar sus vidas. La tierra de las
oportunidades se tornó en otro infierno ya que los británicos no estaban
preparados para aceptar otras culturas ocasionando una integración parcial
mas no completa de los recién llegados; los sueños de aquéllos que pisaban
Reino Unido por primera vez se fracturaron al tener que vivir una adversidad
inesperada, la discriminación, como consecuencia de la supremacía blanca.

332
La interacción de las minorías étnicas como grupo y la socialización de sus
miembros es vital para erradicar los conflictos sociales. Desde entonces, la
situación ha mejorado pero no se ha llegado a ninguna solución permanente.
Desde una perspectiva antropológica, es obvio que el comportamiento de los
británicos ha cambiado a lo largo del tiempo acomodándose a las tendencias
sociales del momento. La adaptación y la aceptación de los cambios sociales
requieren su tiempo aun cuando estos se cumplen a base de legislación oficial,
la cual forma un cuerpo legal para guiarles hacia una evolución sin prejuicios.
En este sentido, la integración laboral es esencial. La supervivencia se
fundamenta en trabajo, comida y cobijo. El acceso a condiciones humanas
dignas se realiza a través del trabajo que a su vez se obtiene gracias a una
sólida formación académica. Las familias, los centros educativos y los
gobiernos tienen que esforzarse conjuntamente para proporcionar las
oportunidades necesarias. A la sociedad se la considera como un cuerpo
humano, todos los aspectos sociales funcionan como órganos vitales, tienen su
función propia que es primordial para su funcionamiento global (Livesay, 2).
Para mí, esta tesis ha sido un viaje hacia una nueva forma de entender hacia
dónde va la educación. No sabía lo que me iba a encontrar. Solamente he
estado aceptando lo que me he estado encontrando en el camino. La evolución
del sistema hacia una incondicional flexibilidad es indispensable para que los
cambios se produzcan sin traumas y acordes a las tendencias sociales,
políticas y económicas del momento. El futuro es incierto a lo que una actitud
positiva y comprensiva para lo que aún no ha llegado es la única manera de
mejorar.

333
Sinceramente creo que mi tesis es una plataforma para futuras investigaciones.
Las sociedades no dejan de cambiar y nuevas modificaciones serán requeridas
tan pronto como nuevos modelos emerjan. Por lo cual sería muy interesante
analizar los programas educativos expuestos en esta investigación en un
lapsus de tiempo de diez años; de esta manera se podría ver la eficacia de los
mismos en la preparación de una sociedad hacia una nueva era.