Chapter 3 Direct Solar Energy - Intergovernmental Panel on ...
99
Zero Order Draft Special Report Renewable Energy Sources (SRREN) Chapter 3 Direct Solar Energy
-
Upload
khangminh22 -
Category
Documents
-
view
2 -
download
0
Transcript of Chapter 3 Direct Solar Energy - Intergovernmental Panel on ...
Zero Order Draft Special Report Renewable Energy Sources (SRREN)
Chapter 3
Direct Solar Energy
Second Order Draft Contribution to Special Report Renewable Energy Sources (SRREN)
Do Not Cite or Quote 1 of 98 Chapter 3 SRREN_Draft02_Ch03 15-Jun-10
Chapter: 3 Title: Direct Solar Energy (Sub)Section: All Author(s): CLAs: Dan Arvizu; Palani Balaya LAs: Luisa F. Cabeza, Terry Hollands, Arnulf Jäger-Waldau, Michio Kondo,
Charles Konseibo, Valentin Meleshko, Wes Stein, Yutaka Tamaura, Honghua Xu, Roberto Zilles
CAs: Armin Aberle, Andreas Athienitis, Shannon Cowlin, Don Gwinner, Thomas Huld, Ted James, Lawrence Kazmerski, Margaret Mann, Koji Matsubara, Anton Meier, Ed Morofsky, Arun Mujumdar, Takashi Oozeki, Oumar Sanogo, Matheos Santamouris, Michael Sterner, Paul Weyers
Remarks: Second Order Draft Version: 01 File name: SRREN_Draft02_Ch03 Date: 15-Jun-10 15:15 Time-zone: CET Template Version: 9 1
2 COMMENTS ON TEXT BY TSU TO REVIEWER
Turquoise highlighted – inserted comment text from Authors or TSU i.e. [AUTHORS/TSU] 3
Yellow highlighted – original chapter text to which comments are referenced 4
5
6 7 8 9
10 11
12 13 14
15
16
17
Chapter 3 has been allocated 68 pages in the SRREN. The actual chapter length (excluding references & cover page) is 84 pages: a total of 16 pages over the allocated page number. Expert reviewers are therefore kindly asked to indicate where the Chapter could be shortened by up to 16 pages in terms of text and/or figures and tables to reach the allocated length.
All monetary values provided in this document will need to be adjusted for inflation/deflation and converted to US$ for the base year 2005.
Some values for 2008 or 2009 are not yet available, but should be by later this year: changes will be made then to Fig. 3.9, Sec. 3.4.1 (active solar heating; below Table 3.3), Sec. 3.4.2 (active solar heating and cooling).
Second Order Draft Contribution to Special Report Renewable Energy Sources (SRREN)
Do Not Cite or Quote 2 of 98 Chapter 3 SRREN_Draft02_Ch03 15-Jun-10
1
2
3 4 5 6 7 8 9
10 11 12 13 14 15 16 17 18 19 20 21 22 23 24 25 26 27 28 29 30 31 32 33 34 35 36 37 38 39 40 41 42 43 44 45 46 47 48
Chapter 3: Direct Solar Energy
CONTENTS
COMMENTS ON TEXT BY TSU TO REVIEWER..........................................................................1 Chapter 3: Direct Solar Energy....................................................................................................2
CONTENTS.........................................................................................................................................2 EXECUTIVE SUMMARY .................................................................................................................4
3.1 Introduction......................................................................................................................5 3.1.1 Brief History ............................................................................................................5 3.1.2 Theoretical Potential and Nature of the Resource ...................................................6 3.1.3 Various Conversion Technologies and Applications...............................................6 3.1.4 Context Summary ....................................................................................................7
3.2 Resource Potential............................................................................................................7 3.2.1 Global Technical Resource Potential.......................................................................7 3.2.2 Sources of Solar Radiation Data ............................................................................10 3.2.3 Possible Impact of Climate Change on Resource Potential...................................12
3.3 Technology and Applications ........................................................................................13 3.3.1 Passive Solar ..........................................................................................................13 3.3.2 Active Solar Heating and Cooling .........................................................................17 3.3.3 Photovoltaic Solar Electricity Generation..............................................................23 3.3.4 Concentrating Solar Power Solar Electricity Generation ......................................29 3.3.5 Solar Fuel Production ............................................................................................32
3.4 Global and Regional Status of Market and Industry Development ...............................37 3.4.1 Installed Capacity and Generated Energy..............................................................37 3.4.2 Industry Capacity and Supply Chain .....................................................................45 3.4.3 Impact of Policies...................................................................................................51
3.5 Integration into Broader Energy System........................................................................52 3.5.1 Building-Integrated Solar Energy ..........................................................................52 3.5.2 Low-Capacity Electricity Demand ........................................................................52 3.5.3 District Heating and Other Thermal Loads............................................................53 3.5.4 PV Generation Characteristics and Smoothing Effect...........................................54 3.5.5 CSP Generation Characteristics and Grid Stabilization.........................................54
3.6 Environmental and Social Impacts ................................................................................54 3.6.1 Environmental Impacts ..........................................................................................55 3.6.2 Social Impacts ........................................................................................................60
3.7 Prospects for Technology Improvements and Innovation .............................................62 3.7.1 Passive Solar Technologies....................................................................................62 3.7.2 Active Solar Heating and Cooling .........................................................................63 3.7.3 PV Electricity Generation ......................................................................................64 3.7.4 CSP Electricity Generation ....................................................................................67 3.7.5 Solar Fuel Production ............................................................................................68 3.7.6 Other Potential Future Applications ......................................................................69
3.8 Cost Trends ....................................................................................................................70 3.8.1 Passive Solar Technologies....................................................................................70 3.8.2 Active Solar Heating and Cooling .........................................................................71 3.8.3 PV Electricity Generation ......................................................................................74 3.8.4 CSP Electricity Generation ....................................................................................77 3.8.5 Solar Fuels Production...........................................................................................78
3.9 Potential Deployment.....................................................................................................79
Second Order Draft Contribution to Special Report Renewable Energy Sources (SRREN)
Do Not Cite or Quote 3 of 98 Chapter 3 SRREN_Draft02_Ch03 15-Jun-10
1 2 3 4
3.9.1 Near-Term Forecasts..............................................................................................79 3.9.2 Long-Term Deployment in the Context of Carbon Mitigation..............................80 3.9.3 Concluding Remarks on Potential Deployment.....................................................85
REFERENCES...................................................................................................................................86
Second Order Draft Contribution to Special Report Renewable Energy Sources (SRREN)
Do Not Cite or Quote 4 of 98 Chapter 3 SRREN_Draft02_Ch03 15-Jun-10
1
2 3 4 5 6
7 8 9
10 11 12 13
14 15 16 17 18 19 20 21 22 23 24 25 26 27 28 29 30 31 32 33 34 35
36 37 38 39 40 41 42 43 44 45 46 47 48 49
EXECUTIVE SUMMARY
This Chapter summarizes the current status of the direct use of solar energy as a means to mitigate climate change. Drawing on references from the most recent literature, we review solar energy’s resource potential, describe the technology and its current status, look at the current trends in its adoption, and provide predictions of its future role. We summarize here the important findings of the Chapter.
Solar energy is the most abundant of all energy resources. Indeed, the rate at which solar energy is intercepted by the Earth is about 10,000 times greater than the rate at which all energy is used on this planet. In a more practical example, with today’s solar power technology, the world’s energy requirements for electricity and for other needs could be met by operating solar power stations on only about 4% of the surface area of the Sahara Desert. Although not all countries are equally endowed with solar energy, almost every country receives sufficient direct solar energy that can contribute significantly to its energy mix.
Solar technology embraces a family of technologies capable of being integrated amongst themselves, as well as with other renewable energy technologies. The solar technologies can deliver heat, cooling, electricity, lighting, and fuels for a host of applications. Conversion of solar energy to heat (i.e., thermal conversion) is comparatively straightforward, because any material object placed in the sun will absorb thermal energy. However, maximizing and maintaining that absorbed energy can take specialized techniques and devices such as vacuums, phase-change materials, optical coatings, and mirrors. Which technique will be used depends on the application and temperature at which the heat is to be delivered, and this can range from 25°C (e.g., for swimming pool heating) to 1000°C (e.g., for dish/Stirling solar thermal electrical power)—and even up to 3000°C in solar furnaces. Generation of electricity can be achieved in either of two ways. In the first, solar energy is converted directly into electricity in a solid-state semiconductor device called a photovoltaic (PV) cell. In the second, solar thermal energy is used in a concentrating solar power (CSP) plant to produce high-temperature heat, which is then converted to electricity via a heat engine and generator. Both approaches are currently in use. The use of solar energy for lighting requires no conversion per se; solar lighting occurs naturally in buildings through windows, but maximizing the effect requires careful engineering and architectural design. In addition to these applications, passive solar heating is a technique for maintaining buildings at comfortable conditions by exploiting the sun’s rays incident on the buildings’ exterior, without using pumps and fans. Solar cooling for buildings can also be achieved, for example, by using solar-derived heat to drive a special thermodynamic cycle called absorption refrigeration. Furthermore, solar devices can deliver process heat and cooling, and other solar technologies are being developed that will deliver fuels such as hydrogen or hydrocarbons.
The various solar technologies have differing maturities, and their viability depends on local conditions and government policies to support their adoption. Some technologies are already viable in certain locations, and the overall viability of solar technologies in general is improving. Solar thermal can be used for a wide variety of applications, such as for domestic hot water, comfort heating of buildings, and industrial process heat. It is significant that many countries spend up to one-third of their annual energy usage as heat. Service hot-water heating for domestic and commercial buildings is now a mature technology growing at a rate of about 16% per year and employed in most countries of the world. The world installed capacity of thermal power from these devices is estimated to be 200 GWth, with a capacity factor of about 10%. The production of electricity from PV panels is also a worldwide phenomenon. Assisted by supportive pricing policies, PV production is growing at a rate of about 40% per year—making it one of the fastest-growing energy technologies. Currently, it claims an installed capacity power production of about 22 GWe, with a capacity factor of about 11%. Most of these installations are roof-mounted and grid-connected. Energy from PV panels and solar domestic water heaters can be especially valuable
Second Order Draft Contribution to Special Report Renewable Energy Sources (SRREN)
Do Not Cite or Quote 5 of 98 Chapter 3 SRREN_Draft02_Ch03 15-Jun-10
1 2 3 4 5 6 7 8 9
10 11 12 13 14 15 16
17 18 19 20 21 22 23 24 25 26 27 28
30 31 32 33 34 35 36
37 38 39 40 41
42 43 44
45 46 47 48
because the energy production often occurs at times of peak loads on the grid, as in cases where there is a large load associated with air conditioning. For example, a cost savings can be incurred by photovoltaics when it offsets the expensive peak-load electricity generated by conventional technologies. PV and solar domestic water heaters also fit well with the needs of many countries because they are modular, quick to install, and can delay the need for a large national grid. The production of electricity from CSP installations has seen a huge increase in planned capacity in just the last few years and has now reached a cumulative installed capacity within a few countries of about 0.7 GWe, with capacity factors expected to be in the range of 35 to 40%. At the same time, passive solar and solar daylighting are conserving energy in buildings at a highly significant rate, but the actual amount is difficult to quantify. The use of passive solar has been found to decrease the comfort heating requirements by about 15% for existing buildings and about 40% for well-designed new buildings. The remaining solar technologies, such as fuel production and provision of industrial process heat, are still being developed and/or are waiting for higher conventional energy prices and for market barriers to be removed before they can be deployed in a significant way. In total, it is estimated that direct solar technologies are currently preventing about 6,000,000 tonnes of CO2 per year from entering the atmosphere.
Over the last 30 years, solar technologies have seen very substantial reductions in cost through learning or experience. And so, looking to the future, we can expect that further technological improvements and cost reductions will be achieved. For example, much work is ongoing to improve the efficiency and reduce the materials requirements of PV cells. Judging from the more than 30 years track record of learning curves in semiconductor devices of 20% cost reduction with each doubling of production volume, one can expect that the steep learning curve will continue into the future. But the learning curves of solar technologies depend on production volume, not on the mere passage of time, and so they will only continue if market volumes for the respective technologies increase in parallel. Without rapidly increasing production volumes, the learning curves will slow, limiting the application of solar technologies in the future. Private capital is flowing into all the technologies, but government support and stable political conditions are needed to lessen the risk of private investment and to boost the assurance of faster development.
3.1 Introduction 29
Solar energy is an abundant energy resource. Indeed, in just one hour, the solar energy intercepted by the Earth exceeds the world’s energy consumption for the entire year. Solar energy’s potential to mitigate climate change is equally impressive. Except the modest amount of CO2 emissions produced in the manufacture of conversion devices—recently estimated at 18 to 76 g per kWh for PV conversion (Fthenakis and Kim, 2010) and about 14 g per kWh for CSP conversion (Trieb, 2005; European Commission, 2007)—the direct use of solar energy produces essentially no greenhouse gases, and it has the potential to displace large quantities of fossil fuels.
The aim of this chapter is to provide a synopsis of the state-of-the-art and possible future scenarios of the full realization of this potential for climate change mitigation. It establishes the resource base, describes the various technologies (which are many and varied), appraises the current market development, outlines some methods for integrating solar into other energy systems, addresses its environmental and social impacts, and finally, evaluates the prospects for future developments.
Some of the solar energy absorbed by the Earth appears later in the form of wind, wave, ocean thermal, hydro power, and excess biomass energies. The scope of this chapter, however, does not include these other indirect forms. Rather, it deals with the direct use of solar energy.
3.1.1 Brief History That history started when early civilizations discovered that buildings with openings facing the sun were warmer and brighter, even in cold weather. During the late 1800s, solar collectors for heating water and other fluids were invented and put into practical use for domestic water heating. Later,

Second Order Draft Contribution to Special Report Renewable Energy Sources (SRREN)
Do Not Cite or Quote 6 of 98 Chapter 3 SRREN_Draft02_Ch03 15-Jun-10
1 2 3 4 5
6 7 8 9
10 11 12 13 14
15 16 17 18 19
20 21 22 23 24
25 26 27 28 29 30 31
32 33 34 35 36 37
38 39 40 41 42 43
44 45 46 47
attempts were made to use mirrors to boost the available fluid temperature, so that heat engines driven by the sun could develop motive power, and thence, electrical power. Also, the late 1800s brought the discovery of a device for converting sunlight directly into electricity. Called the photovoltaic (PV) cell, this device bypassed the need for a heat engine. The modern solar cell, attributed to Russell Ohl working at AT&T’s Bell Labs, was discovered in around 1940.
The modern age of solar research began in the 1950s with the establishment of the International Solar Energy Society (ISES) and increased research and development (R&D) efforts in many industries. For example, advances in the solar hot-water heater by companies such as Miromit in Israel and the efforts of Harry Tabor at the National Physical Laboratory in Jerusalem helped to make solar energy the standard method for providing hot water for homes in Israel by the early 1960s. At about the same time, national and international networks of solar radiation measurements were beginning to be established. The founders of ISES were motivated by the fact that the age of fossil fuels was limited and a sustainable replacement was needed; but it soon became clear that the mitigation of climate change was an equally important incentive for developing solar energy.
With the oil crisis of the 1970s, most countries in the world developed programs for solar energy R&D, and this involved efforts in industry, government labs, and universities. These policy support efforts, which have, for the most part, continued up to the present, have borne fruit: now one of the fastest-growing renewable energy technologies, solar energy is poised to play a vital and environmentally friendly role on the world energy stage.
3.1.2 Theoretical Potential and Nature of the Resource A nuclear fusion reactor in the sun’s core drives an enormous release of energy at its surface. In fact, the energy release at the sun’s surface is so great that even the small fraction intercepted by the Earth—1.53 ×10⁹ TWh or 5.5×10⁶ EJ per year—dwarfs the rate at which the world consumes energy, which is about 1.5 ×10⁵ TWh or 500 EJ/year.
Every material body emits heat rays, called thermal radiation, and solar radiation is that thermal radiation emitted by the sun. Above the Earth’s atmosphere, solar radiation’s energy rate equals 1368 watts (W) per every square meter of surface facing the sun. With clear skies on Earth, this figure becomes roughly 1000 W/m2 at the Earth’s surface. These rays are actually electromagnetic waves—travelling fluctuations in electric and magnetic fields. With the sun’s surface temperature being close to 5800 Kelvin, solar radiation is spread over short wavelengths ranging from 0.25 to 3 micrometers (µm).
The sun’s high temperature, unequalled on Earth, makes solar radiation very special. For example, it embraces daylight: about 40% of solar radiation is visible light, while another 10% is ultraviolet radiation, and 50% is infrared radiation. Solar radiation can alternatively be viewed as a flux of electromagnetic bundles of energy, called photons. Because of the sun’s high temperature, many of these photons are so energetic that they can generate conduction electrons in semiconductors, thereby ultimately enabling the PV conversion of sunlight into electricity.
3.1.3 Various Conversion Technologies and Applications Solar energy is a family of technologies having a broad range of energy service applications: lighting, comfort heating, hot water for buildings and industry, high-temperature solar heat for electric power and industry, photovoltaic conversion for electrical power, and production of solar fuels, e.g., direct water-splitting with a semiconductor solar device without electricity production. This chapter will deal with all of these technologies in detail.
Several solar technologies, such as domestic hot-water heating and pool heating, are already competitive and used in locales where it offers the least-cost option. And in jurisdictions where governments have taken steps to level the energy playing field, very large solar-electricity (both PV and solar-thermal) installations, approaching 1000 MW of power, have been realized, in addition to
Second Order Draft Contribution to Special Report Renewable Energy Sources (SRREN)
Do Not Cite or Quote 7 of 98 Chapter 3 SRREN_Draft02_Ch03 15-Jun-10
1 2
3 4 5 6 7 8 9
10 11
12 13 14 15 16
17 18 19 20 21 22 23 24 25 26 27 28 29 30 31 32
34 35 36 37
38 39 40 41 42 43
44 45 46
huge numbers of rooftop installations. Other applications, such as solar fuels, require additional R&D before reaching this level of adoption.
In pursuing any of the solar technologies, there is the need to deal with the sun’s variability. One option is to store excess collected energy until it is needed. This is particularly effective for handling the lack of sun at night, which is the least-challenging aspect of solar variability. For example, a 0.1-meter-thick slab of concrete in the floor of a home will store much of the solar energy absorbed during the day and release it to the room at night. When totalled over a long period of time such as one year, or over a large geographical area such as a continent, solar energy becomes much more reliable. The use of both these concepts, together with energy storage, has enabled designers to produce more reliable solar systems. But much more work is needed in the area of solar reliability.
Because of its inherent variability, solar energy is most useful when integrated with another energy source, to be used when solar energy is not available. In the past, that source has generally been a non-renewable one. But there is great potential for integrating direct solar energy with other renewable energies. When properly integrated, renewable energy can meet a large fraction of the world’s energy demands.
3.1.4 Context Summary The rest of this chapter will include the following topics. The next section (Section 3.2) summarizes the research that has gone into characterizing this solar resource and establishes the technical potential for direct solar energy. Section 3.3 describes the five different technologies and their applications: passive solar heating and lighting for buildings (Section 3.3.1), active solar heating and cooling for buildings and industry (Section 3.3.2), PV solar electricity generation (Section 3.3.3), concentrating solar power electricity generation (Section 3.3.4), and finally solar fuel production (Section 3.3.5). The next section (Section 3.4) reviews the current status of market development, including installed capacity and energy currently being generated (Section 3.4.1) and the industry capacity and supply chain (Section 3.4.2). Following this are sections on the integration of solar technologies into other energy systems (Section 3.5), the environmental and social impacts (Section 3.6), and finally, the prospects for future technology innovations (Section 3.7). The two final sections cover cost trends (Section 3.8) and the policies needed to achieve the goals for deployment (Section 3.9). Many of the sections are, like Section 3.3, segmented into subsections, one for each of the five solar technologies. Thus, the reader must be ready to jump between the technologies, because that is the nature of direct solar energy: it has many faces.
3.2 Resource Potential 33
3.2.1 Global Technical Resource Potential The solar resource is inexhaustible, and it is available and able to be used in all countries and regions of the world. But to plan and design appropriate energy conversion systems, solar energy technologists must know how much radiation will fall on their collectors.
The solar energy flux at the top of the atmosphere can be evaluated with high precision because it depends essentially on astronomical parameters. At the Earth’s surface, however, evaluation of the solar flux is more difficult because of its interaction with the atmosphere, which contains aerosols, water vapor, and clouds that vary both geographically and temporally. Atmospheric conditions reduce direct-beam solar radiation by about 10% on clear, dry days and by 100% on days with thick clouds, leading to lower average solar flux.
The solar radiation reaching the Earth’s surface is divided into two components: direct-beam radiation, which comes directly from the sun's disk, and diffuse radiation, which comes from the whole of the sky except the sun's disk. The term “global solar radiation” refers to the sum of the
Second Order Draft Contribution to Special Report Renewable Energy Sources (SRREN)
Do Not Cite or Quote 8 of 98 Chapter 3 SRREN_Draft02_Ch03 15-Jun-10
1 2
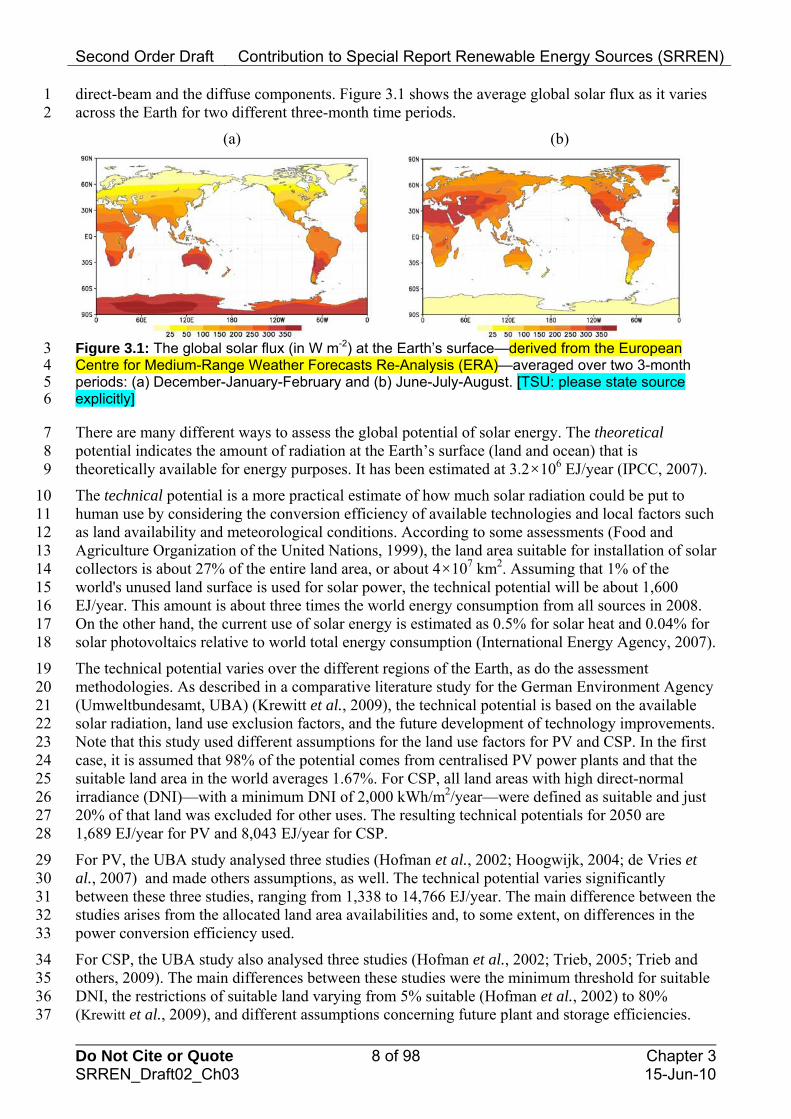
direct-beam and the diffuse components. Figure 3.1 shows the average global solar flux as it varies across the Earth for two different three-month time periods.
(a) (b)
Figure 3.1: The global solar flux (in W m-2) at the Earth’s surface—derived from the European 3 Centre for Medium-Range Weather Forecasts Re-Analysis (ERA)—averaged over two 3-month 4 periods: (a) December-January-February and (b) June-July-August. [TSU: please state source 5 explicitly] 6
7 8 9
10 11 12 13 14 15 16 17 18
19 20 21 22 23 24 25 26 27 28
29 30 31 32 33
34 35 36 37
There are many different ways to assess the global potential of solar energy. The theoretical potential indicates the amount of radiation at the Earth’s surface (land and ocean) that is theoretically available for energy purposes. It has been estimated at 3.2×10⁶ EJ/year (IPCC, 2007).
The technical potential is a more practical estimate of how much solar radiation could be put to human use by considering the conversion efficiency of available technologies and local factors such as land availability and meteorological conditions. According to some assessments (Food and Agriculture Organization of the United Nations, 1999), the land area suitable for installation of solar collectors is about 27% of the entire land area, or about 4×10⁷ km2. Assuming that 1% of the world's unused land surface is used for solar power, the technical potential will be about 1,600 EJ/year. This amount is about three times the world energy consumption from all sources in 2008. On the other hand, the current use of solar energy is estimated as 0.5% for solar heat and 0.04% for solar photovoltaics relative to world total energy consumption (International Energy Agency, 2007).
The technical potential varies over the different regions of the Earth, as do the assessment methodologies. As described in a comparative literature study for the German Environment Agency (Umweltbundesamt, UBA) (Krewitt et al., 2009), the technical potential is based on the available solar radiation, land use exclusion factors, and the future development of technology improvements. Note that this study used different assumptions for the land use factors for PV and CSP. In the first case, it is assumed that 98% of the potential comes from centralised PV power plants and that the suitable land area in the world averages 1.67%. For CSP, all land areas with high direct-normal irradiance (DNI)—with a minimum DNI of 2,000 kWh/m2/year—were defined as suitable and just 20% of that land was excluded for other uses. The resulting technical potentials for 2050 are 1,689 EJ/year for PV and 8,043 EJ/year for CSP.
For PV, the UBA study analysed three studies (Hofman et al., 2002; Hoogwijk, 2004; de Vries et al., 2007) and made others assumptions, as well. The technical potential varies significantly between these three studies, ranging from 1,338 to 14,766 EJ/year. The main difference between the studies arises from the allocated land area availabilities and, to some extent, on differences in the power conversion efficiency used.
For CSP, the UBA study also analysed three studies (Hofman et al., 2002; Trieb, 2005; Trieb and others, 2009). The main differences between these studies were the minimum threshold for suitable DNI, the restrictions of suitable land varying from 5% suitable (Hofman et al., 2002) to 80% (Krewitt et al., 2009), and different assumptions concerning future plant and storage efficiencies.

Second Order Draft Contribution to Special Report Renewable Energy Sources (SRREN)
Do Not Cite or Quote 9 of 98 Chapter 3 SRREN_Draft02_Ch03 15-Jun-10
1 2 3
4 5
In Table 3.1, the column marked “Minimum” shows a breakdown of the global technical potential for different regions. A more optimistic assessment of the solar energy resource is also given in the table under the “Maximum” column.
Table 3.1: Annual technical potential of solar energy for various regions of the world (modified from Nakićenović et al., 1998).
Technical Potential of Solar Energy Regions Minimum, EJ Maximum, EJ
North America 181 741 Latin America and Caribbean 113 338 Western Europe 25 91 Central and Eastern Europe 4 154 Former Soviet Union 199 866 Middle East and North Africa 412 1,106 Sub-Saharan Africa 372 953 Pacific Asia 41 99 South Asia 39 134 Central Asia 116 414 Pacific OECD 73 226 TOTAL 1,575 5,122 Ratio of technical potential to primary energy consumption in 2007 = 503 EJ (IEA, 2009d, Table 9.1, p.322)
3.1 10.2
Note: Assumptions used in assessing minimum and maximum technical potential of solar energy: 6 7 8 9
10 11 12 13 14 15 16 17 18 19 20 21 22 23 24 25 26 27 28 29
Annual minimum clear-sky irradiance relates to horizontal collector plane, and annual maximum clear-sky irradiance relates to two-axis-tracking collector plane; see Table 2.2 in World Energy Council (1994).
Maximum and minimum annual sky clearance assumed for the relevant latitudes; see Table 2.2 in World Energy Council (1994).
1% of unused land is used for both maximum and minimum solar power installations; unused land data are taken from (Food and Agriculture Organization of the United Nations, 1999).
For conversion from EJ to TWh: 278 TWh = 1 EJ.
As Table 3.1 also indicates, the worldwide technical potential of solar energy is considerably larger than the current primary energy consumption. However, the economic potential for applying solar energy depends on a wide variety of factors, for example, theoretical availability of solar energy in a particular region, environmental constraints (e.g., topography, climate condition), resource availability (e.g., land, water), conversion efficiency of the available technology, competition with alternative energy sources, national and local support policies for renewable power generation, coverage and structure of the electricity grid, capability of the power system to deal with power output intermittency, and last but not least, energy consumption demand and patterns in various sectors of the economy and social life. The range of technologies using solar energy is wide and the respective markets have quite different growth rates, ranging between 10% and 50% per year. Therefore, determining the resource potentials is a moving target. Whenever the cost of a specific solar technology is reduced or the cost of conventional energy increases, a new market opens up and the assessment of economic potential changes dramatically.
Second Order Draft Contribution to Special Report Renewable Energy Sources (SRREN)
Do Not Cite or Quote 10 of 98 Chapter 3 SRREN_Draft02_Ch03 15-Jun-10
1 2 3 4 5 6 7 8 9
10
11 12 13 14 15 16
17 18 19 20 21 22 23 24 25 26 27 28 29 30
31 32 33 34
35 36 37 38 39 40 41 42
43 44 45 46 47 48
In determining the amount of solar energy reaching the Earth’s surface, one should keep in mind that because of absorption by the atmosphere, its maximum value does not exceed 1000 W/m2 at a perpendicular surface and for clear-sky conditions. However, due to cloud reflection and clean atmospheric conditions, the solar flux may be higher than the above value in some cases. Generally, the daily mean value of solar flux per unit area is at least three times less due to change of day and night and inclination of the sun above the horizon. During winter, the magnitude of solar flux in the middle latitudes is further reduced; thus, the available amount of energy per unit area at the Earth’s surface determines the potential of solar resources. Currently, solar energy is widely used in regions where there are physical limitations in using other energy sources, in off-grid applications, and where the use of solar energy is justified economically.
Regarding the national and local policies on which the application potential also substantially depends, it is important to note that currently at least 60 countries (37 developed and transition countries and 23 developing countries) have some type of policy to promote renewable power generation, including solar energy. The most common policy is the feed-in law, which has been enacted in many countries and regions in recent years, but there are many other forms of policy support (REN21, 2009).
3.2.2 Sources of Solar Radiation Data Technologists studying the solar impact on energy systems such as buildings and power plants require data measured at the place of the application, i.e., directly at the site of the solar installation. Knowledge of solar energy resource available at different locations strongly influences the assessment of the economics of solar investments. Therefore, it is very important to know the overall global solar energy available, as well as the relative magnitude of its three components: direct-beam irradiation, diffuse irradiation from the sky including clouds, and irradiation received by reflection from the ground surface. Also important are the patterns of seasonal availability, variability of irradiation, and daytime temperature on site. Due to significant inter-annual variability of regional climate conditions in different parts of the world, such measurements must be generated over several years for many applications to provide sufficient statistical validity. In the case of solar PV, panels mounted on roofs of buildings located in tropical regions easily reach temperatures over 70°C (158°F), thereby reducing power output by up to 20%. This is attributed to the temperature sensitivity of solar PV modules.
Solar radiation data can be used to do the following: 1) select optimum sites for large solar energy applications such as power plants, 2) estimate the performance of any solar energy system at any location, 3) design optimum solar energy systems for specific sites, and 4) estimate probable returns on investments.
Numerous empirical schemes have been developed to estimate the global radiation, mainly using conventional ground-based observation of bright sunshine duration and clear-sky solar flux for particular locations. The accuracy of these schemes has been widely studied, and some schemes have been found to reproduce the actual measurements within up to ±30 W/m2 on a monthly basis, or roughly 3% of maximum clear-sky flux. Although not satisfactory as full-scale measurement, these data can be useful for designers. For example, they can be combined with methods for generating synthetic radiation data to achieve appropriate hourly values that can be used in simulation programs (Graham et al., 1988; Graham and Hollands, 1990).
A complementary source of radiation data can be provided by remote sensing from geostationary satellites. Although such data are inherently less accurate than the ground-based measurements, they may be more suitable for generating specific data at arbitrary locations and times. The images from the satellite provide an estimate of global solar radiation on the horizontal surface with spatial resolution up to about 10 km × 10 km. However, calibration of satellite data from ground measuring stations is also needed.
Second Order Draft Contribution to Special Report Renewable Energy Sources (SRREN)
Do Not Cite or Quote 11 of 98 Chapter 3 SRREN_Draft02_Ch03 15-Jun-10
1 2 3 4 5 6
7 8 9
10 11
12 13 14 15 16 17 18 19 20
It is important to note that satellites measure only the upward reflected and scattered solar radiation. Therefore, satellite conversion algorithms are generally based on semi-empirical assumptions. Information contained in these data on the atmospheric composition is then used to compute the amounts of global and diffuse radiation reaching the ground. In the case of variable conditions, satellite-estimated irradiance is representative of the ground-measured irradiance at least in some locations for a time within an hour.
Various international and national institutions provide information on the solar resource: World Radiation Data Center (WRDC, Russia), National Renewable Energy Laboratory (NREL), National Aeronautics and Space Administration (NASA), Brasilian Spatial Institute (INPE), German Aerospace Center (DLR), Bureau of Meteorology Research Center (Australia), CIEMAT (Spain), and certain commercial companies.
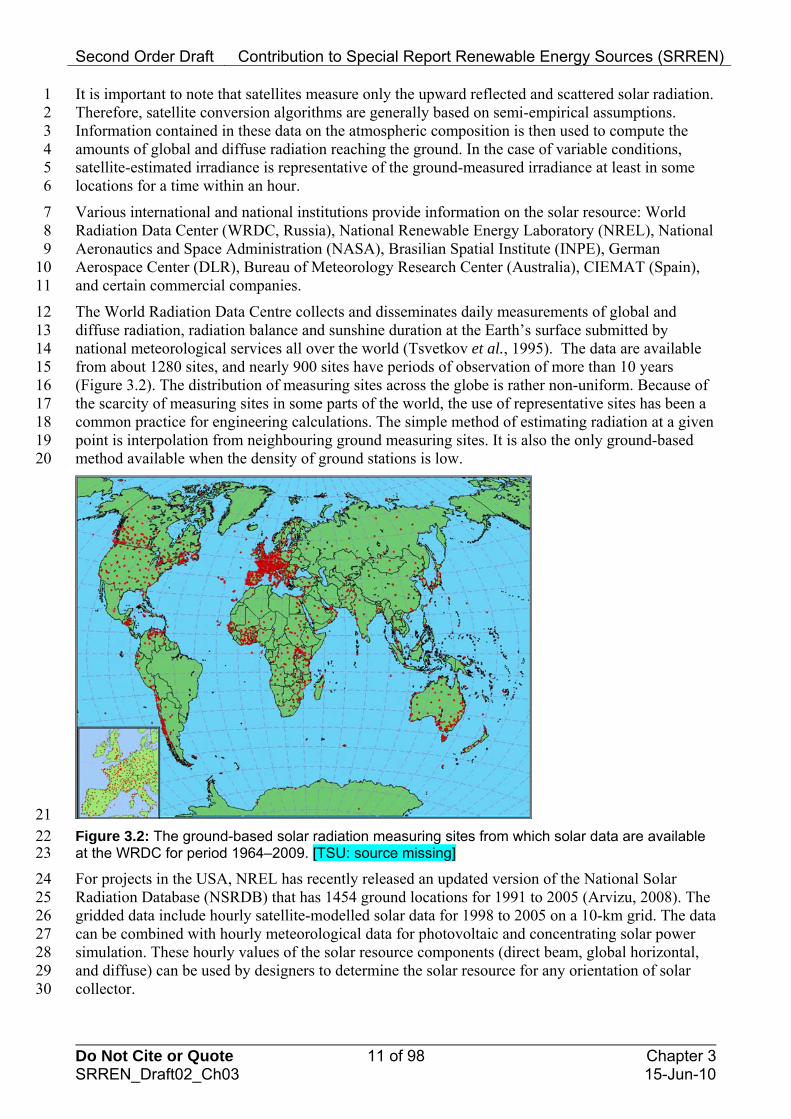
The World Radiation Data Centre collects and disseminates daily measurements of global and diffuse radiation, radiation balance and sunshine duration at the Earth’s surface submitted by national meteorological services all over the world (Tsvetkov et al., 1995). The data are available from about 1280 sites, and nearly 900 sites have periods of observation of more than 10 years (Figure 3.2). The distribution of measuring sites across the globe is rather non-uniform. Because of the scarcity of measuring sites in some parts of the world, the use of representative sites has been a common practice for engineering calculations. The simple method of estimating radiation at a given point is interpolation from neighbouring ground measuring sites. It is also the only ground-based method available when the density of ground stations is low.
21 22 Figure 3.2: The ground-based solar radiation measuring sites from which solar data are available
at the WRDC for period 1964–2009. [TSU: source missing] 23
24 25 26 27 28 29 30
For projects in the USA, NREL has recently released an updated version of the National Solar Radiation Database (NSRDB) that has 1454 ground locations for 1991 to 2005 (Arvizu, 2008). The gridded data include hourly satellite-modelled solar data for 1998 to 2005 on a 10-km grid. The data can be combined with hourly meteorological data for photovoltaic and concentrating solar power simulation. These hourly values of the solar resource components (direct beam, global horizontal, and diffuse) can be used by designers to determine the solar resource for any orientation of solar collector.
Second Order Draft Contribution to Special Report Renewable Energy Sources (SRREN)
Do Not Cite or Quote 12 of 98 Chapter 3 SRREN_Draft02_Ch03 15-Jun-10
1 2 3 4 5 6 7 8 9
10 11 12
13 14 15 16 17 18 19
20 21 22 23
24 25 26 27 28 29 30
31 32 33 34 35 36 37 38 39 40 41 42 43 44
45 46 47 48 49
The most common data for describing the local solar climate are the Typical Meteorological Year (TMY) data, which are a collation of selected weather data for a specific location. The TMYs are data sets of hourly values of solar radiation and meteorological elements for a 1-year period. Their intended use is for computer simulations of solar energy conversion systems and building systems to facilitate performance comparisons of different system types, configurations, and locations. Because they represent typical, rather than extreme, conditions, they are not suited for designing systems to meet the worst-case conditions occurring at a location. TMY data are frequently used to assess the expected heating and cooling costs for the design of a building. They are also used by designers of solar energy systems including solar domestic hot-water systems and large-scale solar thermal power plants. The latest TMY3 collection compiled by the National Renewable Energy Laboratory is based on data for 1,020 locations and derived from a 1991–2005 period of record (Wilcox and Marion, 2008).
Another valuable source of solar energy data is the European Solar Radiation Atlas (ESRA) prepared under the auspices of the Commission of the European Communities (Scharmer and Greif, 2000a; Scharmer and Greif, 2000b). The Atlas comprises observed daily global radiation and monthly sums of sunshine duration provided from many National Weather Services and scientific institutions of the European countries. Satellite images from METEOSAT were supplied by GKSS Research Centre (Geesthacht, Germany), Deutscher Wetterdienst (Offenbach, Germany), and NASA Langley Research Center (USA).
The long-term monthly average data of ESRA were taken as the basis for developing PVGIS (Šúri et al., 2005; Šúri et al., 2007). In this, the ESRA data are enhanced by 3D spatial interpolation and the use of a higher-resolution (1-km) digital elevation model. The effect of shadows from terrain is also taken into account.
The Solar Radiation Atlas of Africa was prepared with support from the Non-Nuclear Energy R&D programme (SUNSAT project) of the Commission of the European Communities. It contains information on the surface radiation with a temporal detail of one month and a spatial resolution of 30 to 50 km, over all regions of Europe, Asia Minor, Africa, and most parts of the Atlantic Ocean. The data covering 1985 and 1986 were derived from measurements of upward solar radiation, which is reflected from the Earth’s surface to space and was regularly measured by the geostationary satellite METEOSAT 2.
Another data set representing Africa has been developed at the Ecole des Mines de Paris, France. The data are based on images from the METEOSAT geostationary satellites that were processed with the Heliosat-2 method (Rigollier et al., 2004) and covers the period 1985 to 2004. Long-term average solar radiation data from this database can be accessed using the Photovoltaic Geographical Information System (PVGIS Photovoltaic Geographic Information System, 2008) interface. To control the accuracy of this information for potential users, thorough comparisons were performed with collocated and simultaneously measured data. The ground-based measurements were made at sites in countries that were seen from METEOSAT’s position. These comparisons confirmed that data on a monthly basis showed a 10% uncertainty range. Comparison between monthly averages of global radiation data derived from METEOSAT 2 data (resolution about 30 to 50 km) and collocated at the ground shows that bias could vary from 17 to 68 Wh/m2 and the unbiased standard deviation could vary from 433 to 474 Wh/m2. All databases primarily prepared for solar energy applications are available to potential users on request from the Institute of Physics of the GKSS Research Centre.
3.2.3 Possible Impact of Climate Change on Resource Potential On a long timescale, climate warming due to increase of greenhouse gases in the atmosphere may influence cloud cover and turbidity, and it can impact the potential of the solar energy resource in different regions of the globe. Changes of major climate variables, including cloud cover and solar flux at the Earth’s surface, have been evaluated using climate models for the 21st century (Meehl et

Second Order Draft Contribution to Special Report Renewable Energy Sources (SRREN)
Do Not Cite or Quote 13 of 98 Chapter 3 SRREN_Draft02_Ch03 15-Jun-10
1 2 3
5 6 7 8
10 11 12 13 14 15 16
17 18 19 20 21 22
23 24 25 26
27 28 29 30 31 32 33 34 35 36 37 38 39
40 41 42 43 44
45 46 47
al., 2007; Meleshko et al., 2008). It was found that the pattern variation of monthly mean global solar flux does not exceed 1% over some regions of the globe, and it varies from model to model. Validity of the pattern changes seems to be rather low, even for large-scale areas of the Earth.
3.3 Technology and Applications 4
This section discusses technical issues for a range of solar technologies, organized under the following categories: passive solar, active heating and cooling, photovoltaic (PV) electricity generation, concentrating solar power (CSP) electricity generation, and solar fuel production. Each section also describes applications of these technologies.
3.3.1 Passive Solar 9 Passive solar energy technologies absorb solar energy, store and distribute it in a natural manner without using mechanical elements, but use natural ventilation (Hernandez Gonzalvez, 1996). The term “passive solar building” is a qualitative term describing a building that makes significant use of solar gain to reduce heating and possibly cooling energy consumption based on the natural energy flows of radiation, conduction, and natural convection. The term “passive building” is often employed to emphasize use of passive energy flows in both heating and cooling, including redistribution of absorbed direct solar gains and night cooling (Athienitis and Santamouris, 2002).
The basic elements of passive solar architecture are windows, thermal mass, protection elements, and reflectors. With the combination of these basic elements, different systems are obtained: direct-gain systems (e.g., the use of windows in combination with walls able to store energy), indirect-gain systems (e.g., Trombe walls), mixed-gain systems (a combination of direct-gain and indirect-gain systems, such as greenhouses), and isolated-gain systems. Passive technologies are integrated with the building and may include the following components:
1. Near-equatorial-facing windows with high solar transmittance and a high thermal resistance to maximize the amount of direct solar gains into the living space while reducing heat losses through the windows in the heating season and heat gains in the cooling season. Skylights are also often used for daylighting in office buildings and in solaria/sunspaces.
2. Building-integrated thermal storage, commonly referred to as thermal mass, may be sensible, such as concrete or brick, or phase-change materials (Mehling and Cabeza, 2008). The most common type of thermal storage is the direct gain system in which thermal storage is distributed in the living space, absorbing the direct solar gains. Storage is particularly important because it performs two essential functions: storing much of the absorbed direct gains for slow release, and maintaining satisfactory thermal comfort conditions by limiting the maximum rise in operative (effective) room temperature (ASHRAE, 2009). Alternatively, a collector-storage wall, known as a Trombe wall, may be used, in which the thermal mass is placed directly next to the glazing, with possible air circulation between the cavity of the wall system and the room. However, this system has not gained much acceptance because it limits views to the outdoor environment through the fenestration. Isolated thermal storage passively coupled to a fenestration system or solarium/sunspace is another option in passive design.
3. Airtight insulated opaque envelope appropriate for the climatic conditions to reduce heat transfer to and from the outdoor environment. In most climates, this energy-efficiency aspect is an essential part of passive design. A solar technology that may be used with opaque envelopes is transparent insulation (Hollands et al., 2001) combined with thermal mass to store solar gains in a wall, turning it into an energy-positive element.
4. Daylighting technologies and advanced solar control systems, such as motorized shading (internal, external) and fixed shading devices, particularly for daylighting applications in the workplace. These technologies include electrochromic and thermochromic coatings and
Second Order Draft Contribution to Special Report Renewable Energy Sources (SRREN)
Do Not Cite or Quote 14 of 98 Chapter 3 SRREN_Draft02_Ch03 15-Jun-10
1 2 3 4 5 6 7 8 9
10 11 12 13 14 15 16
17 18 19 20 21 22 23 24
25 26 27
28 29
newer technologies such as transparent photovoltaics, which, in addition to a passive daylight transmission function, also generate electricity. Daylighting is a combination of energy conservation and passive solar design. It aims to make the most of the natural daylight that is available. Traditional techniques include the following: shallow-plan design, allowing daylight to penetrate all rooms and corridors; light wells in the centre of the buildings; roof lights; tall windows, which allow light to penetrate deep inside rooms; the use of task lighting directly over the workplace, rather than lighting the whole building interior; and deep windows that reveal and light room surfaces to cut the risk of glare (Everett, 1996).
Some basic rules for optimizing the use of passive solar heating in buildings are the following: buildings should be well insulated to reduce overall heat losses; they should have a responsive, efficient heating system; they should face toward the Equator—the glazing should be concentrated on the equatorial side, as should the main living rooms, with little-used rooms such as bathrooms on the opposite-equatorial side; they should avoid shading by other buildings to benefit from the essential mid-winter sun; and they should be “thermally massive” to avoid overheating in the summer (Everett, 1996).
Clearly, passive technologies cannot be separated from the building itself. Thus, when estimating the contribution of passive solar gains, we need to distinguish between the following: 1) buildings specifically designed to harness direct solar gains using passive systems, defined here as solar buildings, and 2) buildings that harness solar gains through near-equatorial facing windows; this orientation is more by chance than by design. Few reliable statistics are available on the adoption of passive design in residential buildings. Furthermore, the contribution of passive solar gains is missing in existing national statistics. Passive solar is reducing the demand and is not part of the supply chain, which is what is considered by the energy statistics.
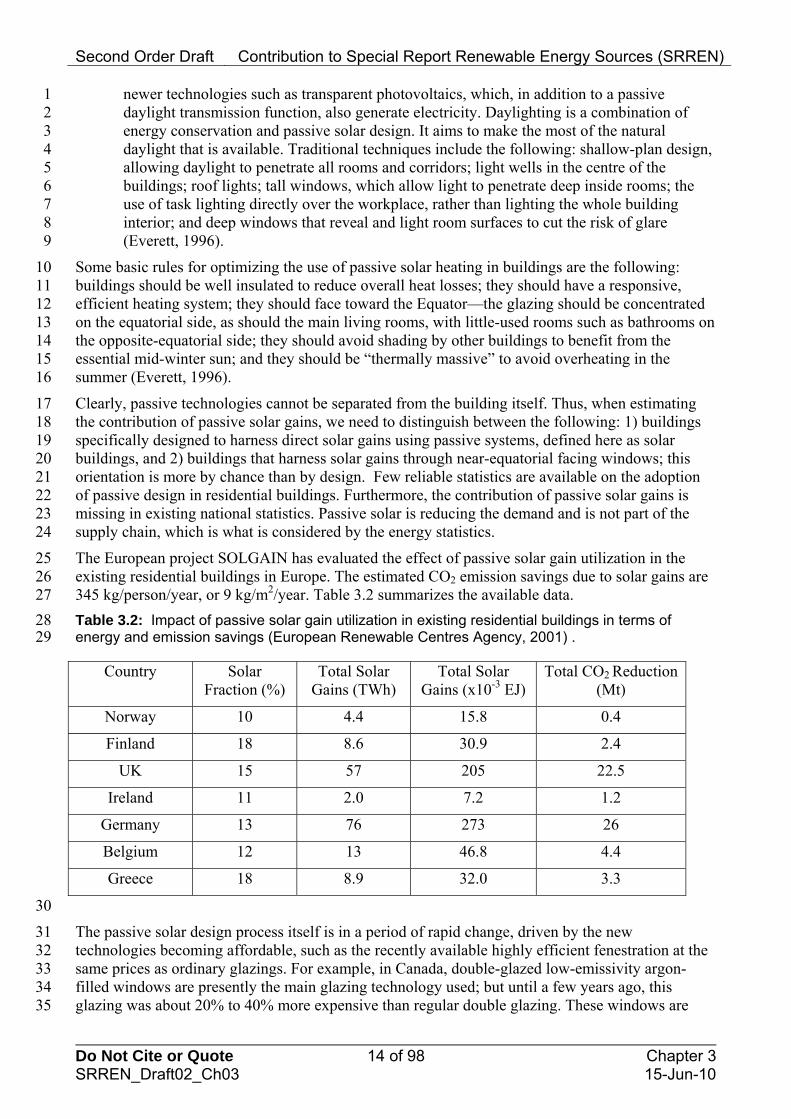
The European project SOLGAIN has evaluated the effect of passive solar gain utilization in the existing residential buildings in Europe. The estimated CO2 emission savings due to solar gains are 345 kg/person/year, or 9 kg/m2/year. Table 3.2 summarizes the available data.
Table 3.2: Impact of passive solar gain utilization in existing residential buildings in terms of energy and emission savings (European Renewable Centres Agency, 2001) .
Country Solar Fraction (%)
Total Solar Gains (TWh)
Total Solar Gains (x10-3 EJ)
Total CO2 Reduction (Mt)
Norway 10 4.4 15.8 0.4
Finland 18 8.6 30.9 2.4
UK 15 57 205 22.5
Ireland 11 2.0 7.2 1.2
Germany 13 76 273 26
Belgium 12 13 46.8 4.4
Greece 18 8.9 32.0 3.3
30
31 32 33 34 35
The passive solar design process itself is in a period of rapid change, driven by the new technologies becoming affordable, such as the recently available highly efficient fenestration at the same prices as ordinary glazings. For example, in Canada, double-glazed low-emissivity argon-filled windows are presently the main glazing technology used; but until a few years ago, this glazing was about 20% to 40% more expensive than regular double glazing. These windows are
Second Order Draft Contribution to Special Report Renewable Energy Sources (SRREN)
Do Not Cite or Quote 15 of 98 Chapter 3 SRREN_Draft02_Ch03 15-Jun-10
1 2 3
4 5 6 7 8 9
10 11 12
13 14 15 16 17 18 19 20 21 22 23
24 25 26 27 28 29 30
31 32
33 34
35 36
37 38 39 40
41 42 43 44 45
46
now being used in retrofits of existing homes, as well. Many homes also add a solarium during retrofit. The new glazing technologies and solar control systems allow the design of a larger window area than in the recent past.
Assuming random and equal window distribution, one can estimate that about 25% of the window area on existing buildings is within ±45 degrees of facing the Equator. However, these window areas are typically only about 5% (Swan et al., 2009) of the heated floor area in existing Canadian houses, as compared to 9% or more in the case of solar homes such as the Athienitis house (Athienitis, 2008). Solar homes receive significant useful passive solar gains and have the potential to reduce heating loads by about 20% to 30% (Balcomb, 1992)—and up to 40% in well-insulated houses according to the Passive House Standard (PassivHaus Planning Package [PHPP], 2004). However, occupants often leave curtains or blinds closed while away, which potentially reduces the useful passive solar gains by 30% to 50%.
In most climates, unless effective solar gain control is employed, there may be a need to cool the space during the summer. However, the need for mechanical cooling may often be eliminated by designing for passive cooling. Passive cooling techniques are based on the use of heat and solar protection techniques, heat storage in thermal mass, and heat-dissipation techniques. Progress on passive cooling techniques is important, and applying such techniques may decrease the cooling load of buildings up to 80%, (Santamouris and Asimakopoulos, 1996). The specific contribution of passive solar and energy conservation techniques depends strongly on the climate (United Nations Environment Programme [UNEP], 2007). Solar-gain control is particularly important during the “shoulder” seasons when some heating may be required. In adopting larger window areas—enabled by their high thermal resistance—active solar-gain control becomes important in solar buildings for both thermal and visual considerations.
The potential of passive solar cooling in reducing CO2 emissions has been shown in two recent publications (Cabeza et al., 2010; Castell et al., 2010). Experimental work shows that adequate insulation can reduce by up to 50% the cooling energy demand of a building during the hot season. Moreover, including phase-change materials in the already insulated building envelop can reduce the cooling energy demand in such buildings further by up to 15%—about 1 to 1.5 kg/year/m2 of CO2 emissions would be saved in these buildings due to reducing the energy consumption compared to the insulated building without phase-change material.
Passive solar system applications are mainly of the direct-gain type, but they can be further subdivided into the following main application categories:
Multistory residential buildings designed to have a large equatorial-facing façade so as to provide the potential for a large solar capture area.
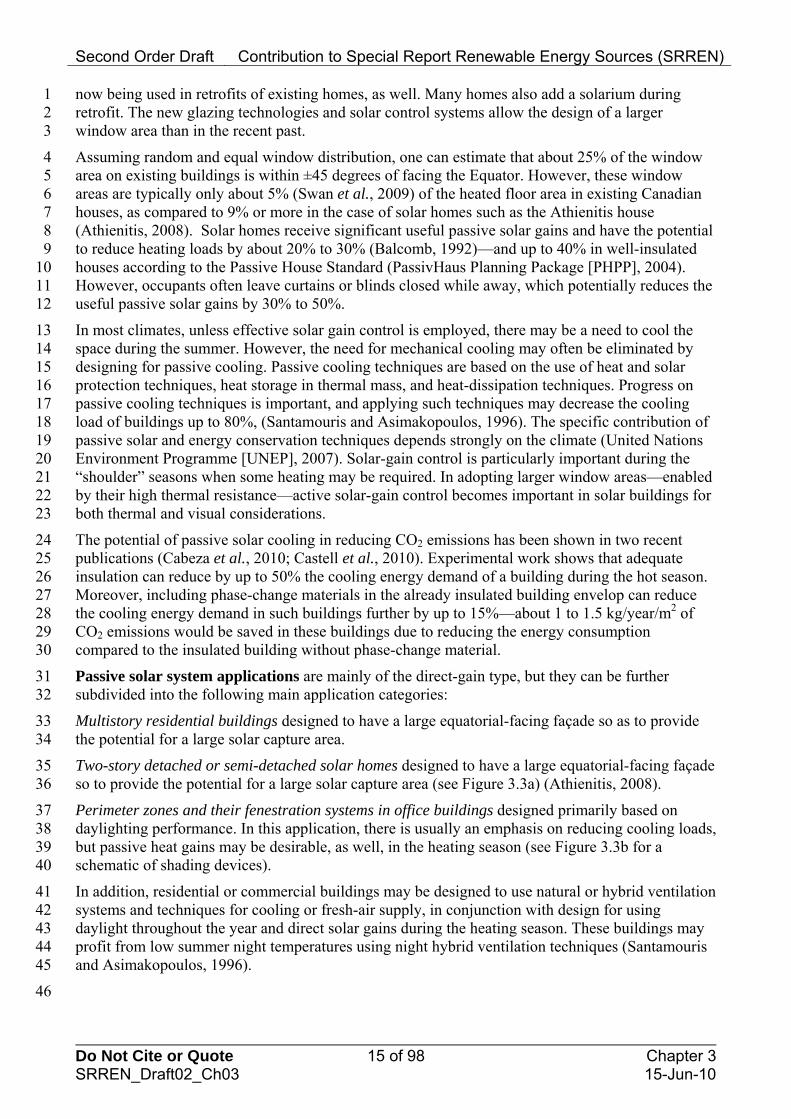
Two-story detached or semi-detached solar homes designed to have a large equatorial-facing façade so to provide the potential for a large solar capture area (see Figure 3.3a) (Athienitis, 2008).
Perimeter zones and their fenestration systems in office buildings designed primarily based on daylighting performance. In this application, there is usually an emphasis on reducing cooling loads, but passive heat gains may be desirable, as well, in the heating season (see Figure 3.3b for a schematic of shading devices).
In addition, residential or commercial buildings may be designed to use natural or hybrid ventilation systems and techniques for cooling or fresh-air supply, in conjunction with design for using daylight throughout the year and direct solar gains during the heating season. These buildings may profit from low summer night temperatures using night hybrid ventilation techniques (Santamouris and Asimakopoulos, 1996).
Second Order Draft Contribution to Special Report Renewable Energy Sources (SRREN)
Do Not Cite or Quote 16 of 98 Chapter 3 SRREN_Draft02_Ch03 15-Jun-10
(a) (b)
Figure 3.3: (a) Schematic of thermal mass placement and passive-active systems in EcoTerra house; (b) schematic of several daylighting concepts designed to redistribute daylight into the
1 2
office interior space.[TSU: sources missing] 3
4 5 6 7 8 9
10 11 12 13 14 15 16 17 18
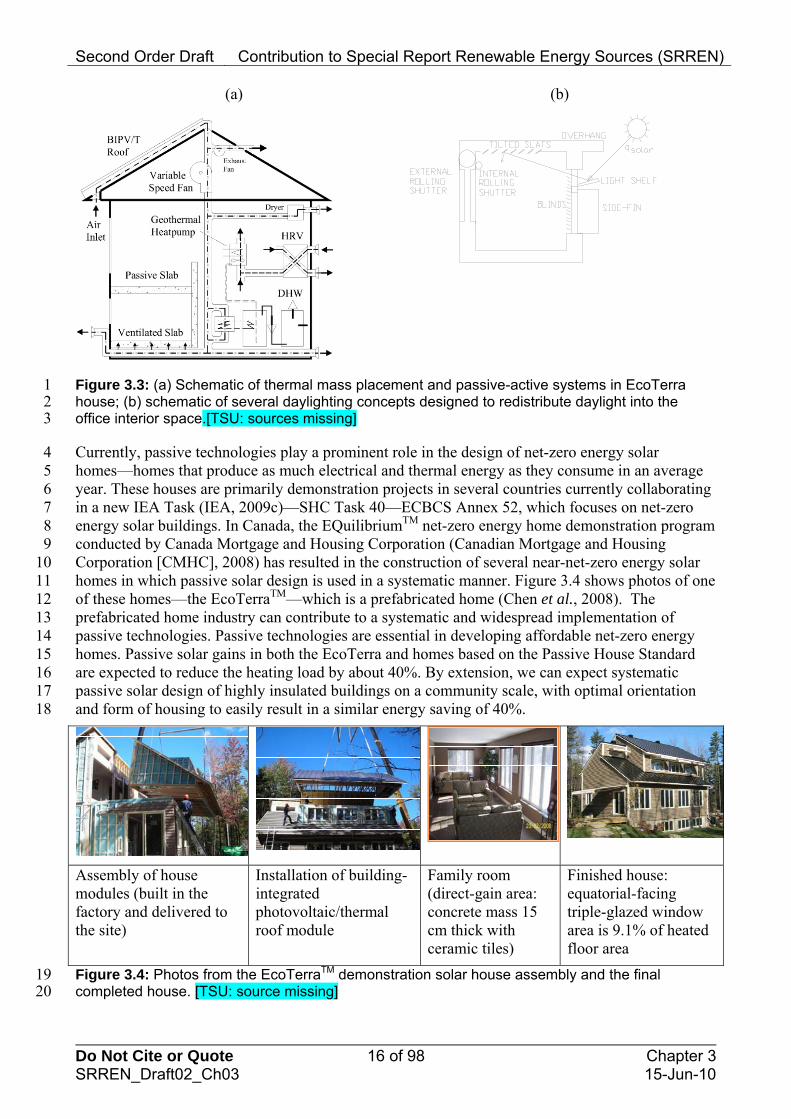
Currently, passive technologies play a prominent role in the design of net-zero energy solar homes—homes that produce as much electrical and thermal energy as they consume in an average year. These houses are primarily demonstration projects in several countries currently collaborating in a new IEA Task (IEA, 2009c)—SHC Task 40—ECBCS Annex 52, which focuses on net-zero energy solar buildings. In Canada, the EQuilibriumTM net-zero energy home demonstration program conducted by Canada Mortgage and Housing Corporation (Canadian Mortgage and Housing Corporation [CMHC], 2008) has resulted in the construction of several near-net-zero energy solar homes in which passive solar design is used in a systematic manner. Figure 3.4 shows photos of one of these homes—the EcoTerraTM—which is a prefabricated home (Chen et al., 2008). The prefabricated home industry can contribute to a systematic and widespread implementation of passive technologies. Passive technologies are essential in developing affordable net-zero energy homes. Passive solar gains in both the EcoTerra and homes based on the Passive House Standard are expected to reduce the heating load by about 40%. By extension, we can expect systematic passive solar design of highly insulated buildings on a community scale, with optimal orientation and form of housing to easily result in a similar energy saving of 40%.
Assembly of house modules (built in the factory and delivered to the site)
Installation of building-integrated photovoltaic/thermal roof module
Family room (direct-gain area: concrete mass 15 cm thick with ceramic tiles)
Finished house: equatorial-facing triple-glazed window area is 9.1% of heated floor area
Figure 3.4: Photos from the EcoTerraTM demonstration solar house assembly and the final 19 completed house. [TSU: source missing] 20
Second Order Draft Contribution to Special Report Renewable Energy Sources (SRREN)
Do Not Cite or Quote 17 of 98 Chapter 3 SRREN_Draft02_Ch03 15-Jun-10
1 2 3 4 5 6
7 8 9
10
11 12 13 14 15 16 17
18 19 20
21 22 23
24 25 26 27 28 29
Another IEA Annex—ECES IA Annex 23—was initiated in November 2009 (IEA Energy Conservation through Energy Storage). The general objective of the Annex is to ensure that energy storage techniques are properly applied in ultra-low-energy buildings and communities. Applications of these designs are foreseen in a post-Kyoto Protocol world where total CO2 reduction is required. Proper application of energy storage is expected to increase the likelihood of sustainable building technologies.
Windows play a very important role in the energy balance of buildings because heat losses through them are 4 to 10 times higher than through the other elements of the building. In parallel, windows control daylight penetration and natural ventilation flow. Another possibility is the provision of summer shading for direct-gain windows by using photovoltaic overhangs.
Other solar passive applications are natural water heating (included in the next subsection) and natural drying. Grains and many other agricultural products have to be dried before being stored so that insects and fungi do not render them unusable. Examples include wheat, rice, coffee, copra (coconut flesh), certain fruits, and timber (Twidell and Weir, 2006). Solar energy dryers vary mainly as to the use of the solar heat and the arrangement of their major components. Solar dryers constructed from wood, metal, and glass sheets have been evaluated extensively and used quite widely to dry a full range of tropical crops (Imre, 2007).
3.3.2 Active Solar Heating and Cooling Active solar heating and cooling technologies use the sun to provide either heating or cooling; various of these technologies are discussed here, as well as thermal storage.
In a solar heating system the solar collector transforms solar radiation into heat and uses a carrier fluid (e.g., water, solar fluid, or air) to transfer that heat to a well-insulated storage tank, where it can be used when needed.
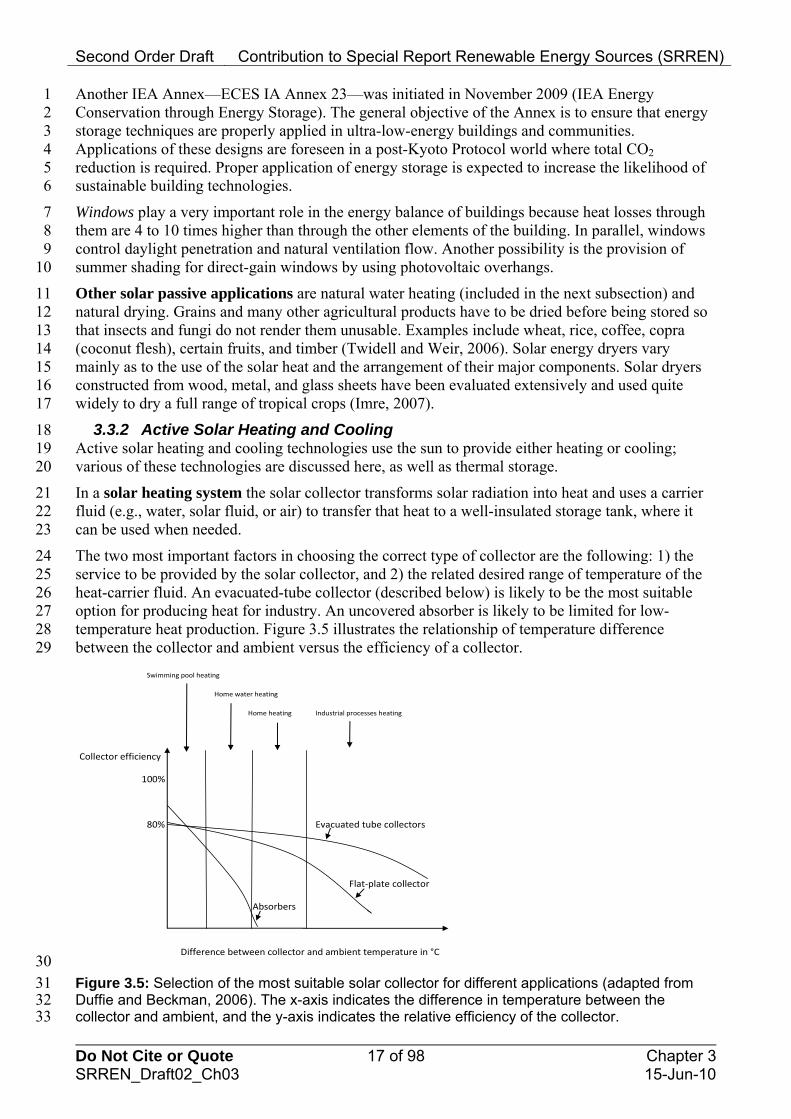
The two most important factors in choosing the correct type of collector are the following: 1) the service to be provided by the solar collector, and 2) the related desired range of temperature of the heat-carrier fluid. An evacuated-tube collector (described below) is likely to be the most suitable option for producing heat for industry. An uncovered absorber is likely to be limited for low-temperature heat production. Figure 3.5 illustrates the relationship of temperature difference between the collector and ambient versus the efficiency of a collector.
Swimming pool heating
Home water heating
Home heating Industrial processes heating
Collector efficiency
100%
80% Evacuated tube collectors
Flat‐plate collector
Absorbers
Difference between collector and ambient temperature in °C 30
31 32 33
Figure 3.5: Selection of the most suitable solar collector for different applications (adapted from Duffie and Beckman, 2006). The x-axis indicates the difference in temperature between the collector and ambient, and the y-axis indicates the relative efficiency of the collector.
Second Order Draft Contribution to Special Report Renewable Energy Sources (SRREN)
Do Not Cite or Quote 18 of 98 Chapter 3 SRREN_Draft02_Ch03 15-Jun-10
1 2
3 4 5 6 7 8 9
A solar collector can incorporate many different materials and be manufactured using a variety of techniques. Its design is influenced by the system in which it will operate and by the region.
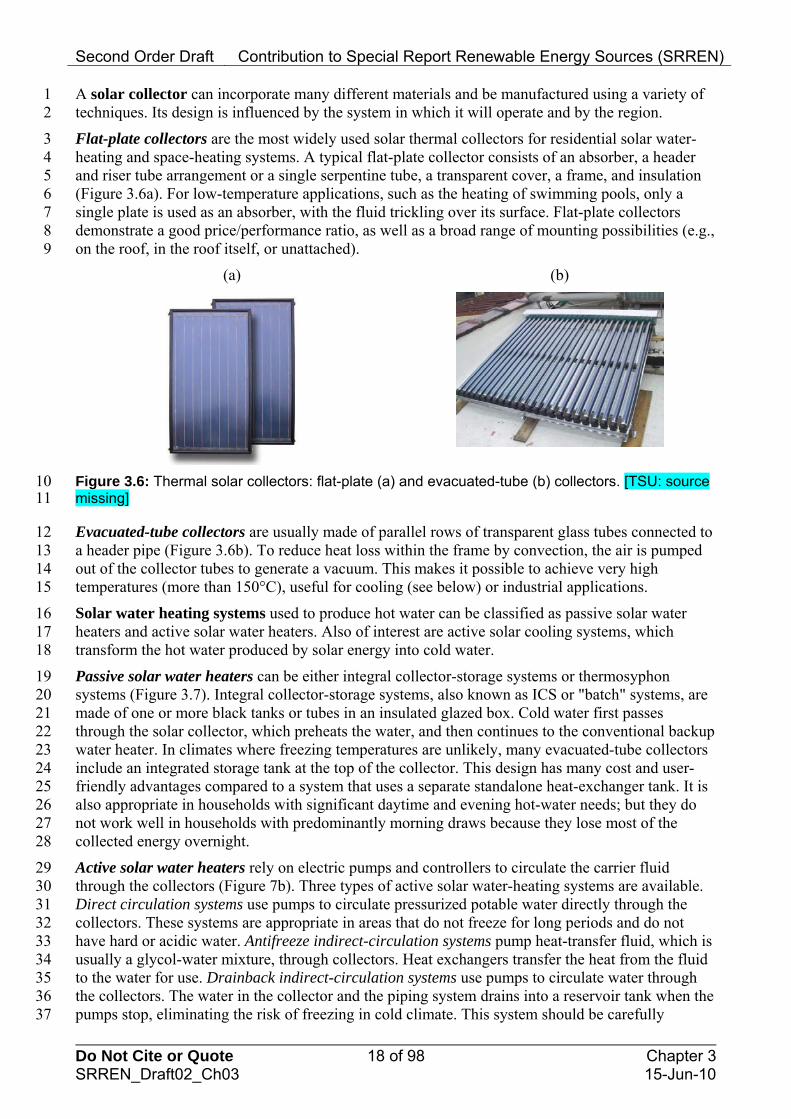
Flat-plate collectors are the most widely used solar thermal collectors for residential solar water-heating and space-heating systems. A typical flat-plate collector consists of an absorber, a header and riser tube arrangement or a single serpentine tube, a transparent cover, a frame, and insulation (Figure 3.6a). For low-temperature applications, such as the heating of swimming pools, only a single plate is used as an absorber, with the fluid trickling over its surface. Flat-plate collectors demonstrate a good price/performance ratio, as well as a broad range of mounting possibilities (e.g., on the roof, in the roof itself, or unattached).
(a) (b)
Figure 3.6: Thermal solar collectors: flat-plate (a) and evacuated-tube (b) collectors. [TSU: source 10 missing] 11
12 13 14 15
16 17 18
19 20 21 22 23 24 25 26 27 28
29 30 31 32 33 34 35 36 37
Evacuated-tube collectors are usually made of parallel rows of transparent glass tubes connected to a header pipe (Figure 3.6b). To reduce heat loss within the frame by convection, the air is pumped out of the collector tubes to generate a vacuum. This makes it possible to achieve very high temperatures (more than 150°C), useful for cooling (see below) or industrial applications.
Solar water heating systems used to produce hot water can be classified as passive solar water heaters and active solar water heaters. Also of interest are active solar cooling systems, which transform the hot water produced by solar energy into cold water.
Passive solar water heaters can be either integral collector-storage systems or thermosyphon systems (Figure 3.7). Integral collector-storage systems, also known as ICS or "batch" systems, are made of one or more black tanks or tubes in an insulated glazed box. Cold water first passes through the solar collector, which preheats the water, and then continues to the conventional backup water heater. In climates where freezing temperatures are unlikely, many evacuated-tube collectors include an integrated storage tank at the top of the collector. This design has many cost and user-friendly advantages compared to a system that uses a separate standalone heat-exchanger tank. It is also appropriate in households with significant daytime and evening hot-water needs; but they do not work well in households with predominantly morning draws because they lose most of the collected energy overnight.
Active solar water heaters rely on electric pumps and controllers to circulate the carrier fluid through the collectors (Figure 7b). Three types of active solar water-heating systems are available. Direct circulation systems use pumps to circulate pressurized potable water directly through the collectors. These systems are appropriate in areas that do not freeze for long periods and do not have hard or acidic water. Antifreeze indirect-circulation systems pump heat-transfer fluid, which is usually a glycol-water mixture, through collectors. Heat exchangers transfer the heat from the fluid to the water for use. Drainback indirect-circulation systems use pumps to circulate water through the collectors. The water in the collector and the piping system drains into a reservoir tank when the pumps stop, eliminating the risk of freezing in cold climate. This system should be carefully

Second Order Draft Contribution to Special Report Renewable Energy Sources (SRREN)
Do Not Cite or Quote 19 of 98 Chapter 3 SRREN_Draft02_Ch03 15-Jun-10
1 2
designed and installed to ensure that the piping always slopes downward to the reservoir tank. Also, stratification should be carefully considered in the design of the water tank (Hadorn, 2005).
(a) (b)
Figure 3.7: Thermal solar system: passive (a) and active (b) system. [TSU: sources missing], 3 [TSU: figure (a): quality insufficient] 4
5 6 7 8 9
10 11 12
13 14 15
16 17 18 19 20 21 22
23 24 25 26
27 28 29 30
31 32 33
Solar cooling can be broadly categorized into solar electric refrigeration, solar thermal refrigeration, and solar thermal air-conditioning. In the first category, the solar electric compression refrigeration uses photovoltaic panels to power a conventional refrigeration machine (Fong et al., 2010). In the second category, the refrigeration effect can be produced through solar thermal gain; solar mechanical compression refrigeration, solar absorption refrigeration, and solar adsorption refrigeration are the three common options. In the third category, the conditioned air can be directly provided through the solar thermal gain by means of desiccant cooling. Both solid and liquid sorbents are available, such as silica gel and lithium chloride, respectively.
Active thermal solar cooling is used when solar heat powers an absorption chiller. This system can be used as an air-conditioning system in any building. Deploying such a technology depends heavily on the industrial deployment of low-cost small-power absorption chillers.
Open cooling cycle (or desiccant cooling) systems are mainly of interest for the air conditioning of buildings. They can use solid or liquid sorption. The central component of any open solar-assisted cooling system is the dehumidification unit. In most systems using solid sorption, this unit is a desiccant wheel. Various sorption materials can be used, such as silica gel or lithium chloride. All other system components are found in standard air-conditioning applications with an air-handling unit and include the heat-recovery units, heat exchangers, and humidifiers. Liquid sorption techniques have been demonstrated successfully.
The heat required for the regeneration of the sorption wheel can be provided at low temperatures (45° to 90°C), which suits many solar collectors on the market. Other types of desiccant dehumidifiers exist that use solid sorption. These have some thermodynamic advantages and can lead to higher efficiency, but place higher demands on the material and equipment.
Closed heat-driven cooling systems using these cycles have been known for many years and are usually used for large capacities, from 100 kW and greater. The physical principle used in most systems is based on the sorption phenomenon. Two technologies are established to produce thermally driven low- and medium-temperature refrigeration: absorption and adsorption.
Absorption technologies cover the majority of the global thermally driven cooling market. The main advantage of absorption cycles is their higher coefficient of performance (COP) values, which range from 0.6 to 0.8 for single-stage machines, and from 0.9 to 1.3 for double-stage technologies.

Second Order Draft Contribution to Special Report Renewable Energy Sources (SRREN)
Do Not Cite or Quote 20 of 98 Chapter 3 SRREN_Draft02_Ch03 15-Jun-10
1 2
3 4 5 6
7 8 9
10 11 12
13 14 15 16 17 18 19
20 21 22 23
24 25 26 27 28 29
30 31
32 33 34 35 36 37 38 39 40 41
42 43 44 45 46 47
Typical heat-supply temperatures are 80° to 95°C and 130° to 160°C, respectively. The absorption pair used is either lithium bromide and water, or ammonia and water.
Adsorption refrigeration cycles using silica gel and water, for instance, as the adsorption pair can be driven by low-temperature heat sources down to 55°C, producing temperatures down to 5°C. This kind of system achieves COP values of 0.6 to 0.7. Today, the financial viability of adsorption systems is limited due to the far higher production costs compared to absorption systems.
Thermal storage within thermal solar systems is a key component to ensure reliability and efficiency. Four main types of thermal energy storage technologies can be distinguished: sensible, latent, sorption, and thermochemical heat storage (Hadorn, 2005).
Sensible heat storage systems use the heat capacity of a material. The vast majority of systems on the market use water for heat storage. Water heat storage covers a broad range of capacities, from several hundred litres to tens of thousands of cubic metres.
Latent heat storage systems store thermal energy during the phase change, either melting or evaporation, of a material. Depending on the temperature range, this type of storage is more compact than heat storage in water. Melting processes have energy densities on the order of 100 kWh/m3 compared to 25 kWh/m3 for sensible heat storage. Most of the current latent heat storage technologies for low temperatures store heat in building structures to improve thermal performance, or in cold storage systems. For medium-temperature storage, the storage materials are nitrate salts. Pilot storage units in the 100-kW range currently operate using solar steam.
Sorption heat storage systems store heat in materials using water vapour taken up by a sorption material. The material can either be a solid (adsorption) or a liquid (absorption). These technologies are still largely in the development phase, but some are on the market. In principle, sorption heat storage densities can be more than four times higher than sensible heat storage in water.
Thermochemical heat storage systems store heat in an endothermic chemical reaction. Some chemicals store heat 20 times more densely than water; but more typically, the storage densities are 8 to 10 times higher. Few thermochemical storage systems have been demonstrated. The materials currently being studied are the salts that can exist in anhydrous and hydrated form. Thermochemical systems can compactly store low- and medium-temperature heat. Thermal storage is discussed with specific reference to higher-temperature CSP in section 3.3.4.
Underground thermal energy storage (UTES) is used for seasonal storage and includes the various technologies described below.
The most frequently used storage technology, which makes use of the underground, is aquifer thermal energy storage (ATES). This technology uses a natural underground layer (e.g., a sand, sandstone, or chalk layer) as a storage medium for the temporary storage of heat or cold. The transfer of thermal energy is realized by extracting groundwater from the layer and by re-injecting it at the modified temperature level at a separate location nearby. Most applications are about the storage of winter cold to be used for the cooling of large office buildings and industrial processes. Aquifer cold storage is gaining interest because savings on electricity bills for chillers are about 75%, and in many cases, the payback time for additional investments is shorter than five years. A major condition for the application of this technology is the availability of a suitable geologic formation.
The other technologies for underground thermal energy storage are borehole storage (BTES), cavern storage (CTES), and pit storage. Which of these technologies is selected depends strongly on the local geologic conditions. With borehole storage, vertical heat exchangers are inserted into the underground, which ensure the transfer of thermal energy toward and from the ground (clay, sand, rock). Ground heat exchangers are also frequently used in combination with heat pumps, where the ground heat exchanger extracts low-temperature heat from the soil. With cavern storage
Second Order Draft Contribution to Special Report Renewable Energy Sources (SRREN)
Do Not Cite or Quote 21 of 98 Chapter 3 SRREN_Draft02_Ch03 15-Jun-10
1 2 3
4 5 6 7 8 9
10 11 12 13
14 15 16 17 18 19
20 21 22
23 24 25 26 27 28 29
30 31 32
33 34 35 36
37 38 39 40 41 42
43 44
45 46 47
and pit storage, large underground water reservoirs are created in the subsoil to serve as thermal energy storage systems. These storage technologies are technically feasible, but the actual application is still limited because of the high level of investment.
Improved designs are expected to address longer lifetimes, lower installed costs, and increased temperatures. The following are some design options: 1) The use of plastics in residential solar water-heating systems; 2) Powering air-conditioning systems using solar-energy systems, especially focusing on compound parabolic concentrating collectors; 3) The use of flat-plate collectors for residential and commercial hot water; and 4) Concentrating and evacuated-tube collectors for industrial-grade hot water and thermally activated cooling.
Research to decrease the cost of solar water-heating systems is mainly oriented toward developing the next generation of low-cost, polymer-based systems for mild climates. The focus includes testing the durability of materials. The work to date includes unpressurized polymer ICS systems that use a load-side immersed heat exchanger and direct thermosyphon systems.
For active solar heating and cooling applications, the amount of hot water a solar heater produces depends on the type and size of the system, amount of sun available at the site, seasonal hot-water demand pattern, and installation of the system. An industrial or agricultural process heat system comprises a solar collector, intermediate heat storage, and a means of conveying the collected heat from the storage unit to the application. The solar collector is usually selected based on outlet temperature matched to the required process heat (Norton, 2001).
Some process heat applications can be met with temperatures delivered by “ordinary” low-temperature collectors, namely, from 30° to 80°C. However, the bulk of the demand for industrial process heat requires temperatures from 80° to 250°C.
Process heat collectors are another application field for solar thermal heat collectors. Typically, these systems require a large capacity (hence, large collector areas), low costs, and high reliability and quality. Although low- and high-temperature collectors are offered in a dynamically growing market, process heat collectors are at a very early stage of development and no products are available on an industrial scale. In addition to “concentrating” collectors, improved flat collectors with double and triple glazing are currently being developed, which might be interesting for process heat in the range of up to 120°C.
Solar refrigeration is used, for example, to cool stores of vaccines. The need for such systems is greatest in peripheral health centers in rural communities in the developing world, where no electrical grid is available.
Solar cooling is a specific area of application for solar thermal. Either high-efficiency flat plates or evacuated tubes can be used to drive absorption cycles to provide cooling. For a greater COP, collectors with low concentration levels can provide the temperatures (up to around 250°C) needed for double-effect absorption cycles. There is a natural match between solar and the need for cooling.
A number of thermally driven cooling systems have been built employing closed thermally driven cooling cycles, using solar thermal energy as the main energy source. These systems often cater to large cooling capacities of up to several hundred kW. In the last 5 to 8 years, a number of systems have been developed in the small-capacity range, below 100 kW, and, in particular, below 20 kW and down to 4.5 kW. These small systems are single-effect machines of different types, used mainly for residential buildings and small commercial applications.
Although open cooling cycles are generally used for air conditioning in buildings, closed heat-driven cooling cycles can be used for both air-conditioning and industrial refrigeration.
Solar energy may be used for space heating of agricultural buildings. The guiding principles are similar to the solar space heating of non-agricultural buildings. Low-cost, roof-based, air-heating solar collectors tend to be used because of the low initial investment required. To assure excellent
Second Order Draft Contribution to Special Report Renewable Energy Sources (SRREN)
Do Not Cite or Quote 22 of 98 Chapter 3 SRREN_Draft02_Ch03 15-Jun-10
1 2
3 4 5 6 7 8 9
10
11
performance, one must establish good fabrication quality control and adequately educate installers about the proper sizing of the relevant system components.
Other solar applications are listed below. The production of potable water using solar energy has been readily adopted in remote or isolated regions. Fundamentally, three potable water extraction processes use solar energy: 1) Distillation, where water evaporated using solar heat is then condensed, thus separated from its mineral content; 2) Reverse osmosis, where a pressure gradient across a membrane causes water molecules to pass from one side to the other; larger mineral molecules cannot cross the membrane; and 3) Electrodialysis, where a selective membrane containing positive and negative ions separates water from minerals using solar-generated electricity.
Solar stills were widely used in some parts of the world (e.g., Puerto Rico) to supply water to households of up to 10 people. The modular devices supply up to 8 litres of drinking water from an 12 area of roughly 2 m² [TSU: not clear, insert temporal relation]. The potential for technical improvements is to be found in reducing the cost of materials and designs. Increased reliability and better-performing absorber surfaces would slightly increase production per m². Today, they are only used in developing countries, but depending on the environmental conditions their efficiency can be very low.
13 14 15 16 17
18 19 20 21 22
23 24 25 26 27 28 29 30 31 32 33
34 35 36 37 38 39
40 41 42 43 44 45 46
In appropriate insolation conditions, solar detoxification can be an effective low-cost treatment for low-contaminant waste. In photolytic detoxification, exposure to 1000-fold concentrated insolation destroys contaminants directly. Photocatalytic oxidation destroys contaminants by the ultraviolet component of insolation activating a catalyst that destroys the contaminants. Solar photocatalysis is effective for decontaminating bacterial, pesticide, organic, or chemical pollution of water supplies.
Multiple-effect humidification (MEH) desalination units indirectly use heat from highly efficient solar thermal collectors to induce evaporation and condensation inside a thermally isolated, steam-tight container. Using a solar thermal system to enhance humidification of air inside the box, water and salt are separated, because salt and dissolved solids from the fluid are not carried away by steam. When the steam is recondensed in the condenser, most of the energy used for evaporation is regained. This reduces the energy input for desalination, which requires temperatures of between 70° and 85°C. The specific water production rate is about 20 to 30 litres per m² absorber area per day. The specific investment is less than for the solar still, and this system is available for sizes from 500 to 50,000 litres per day. These MEH systems are now beginning to appear in the market. Also see the report on water desalination by CSP (German Aerospace Center [DLR], 2007) and discussion of SolarPACES Task VI (SolarPACES, 2009b).
In solar drying, solar energy is used either as the sole source of the required heat or as a supplemental source, and the air flow can be generated by either forced or free (natural) convection (Fudholi et al., 2010). Forced-convection dryers have higher drying rates compared to passive dryers and can be used for high production rates; but they are more complex and expensive. Free-convection dryers are simple to design and have low installation and operating costs; but the capacity per unit area of the dryer is limited and for small-scale operations only.
Solar cooking is one of the most widely used solar applications in developing countries. A solar cooker uses sunlight as its energy source, so no fuel is needed and operating costs are zero. Also, a reliable solar cooker can be constructed easily and quickly from common materials. Solar cookers basically concentrate sunlight and convert it into heat, which is then trapped and used for cooking. Different types of solar cookers include box, panel, parabolic, and hybrid cookers, as well as solar kettles. In some regions, solar cooking is promoted to help slow deforestation and desertification, which are caused by using wood as fuel.
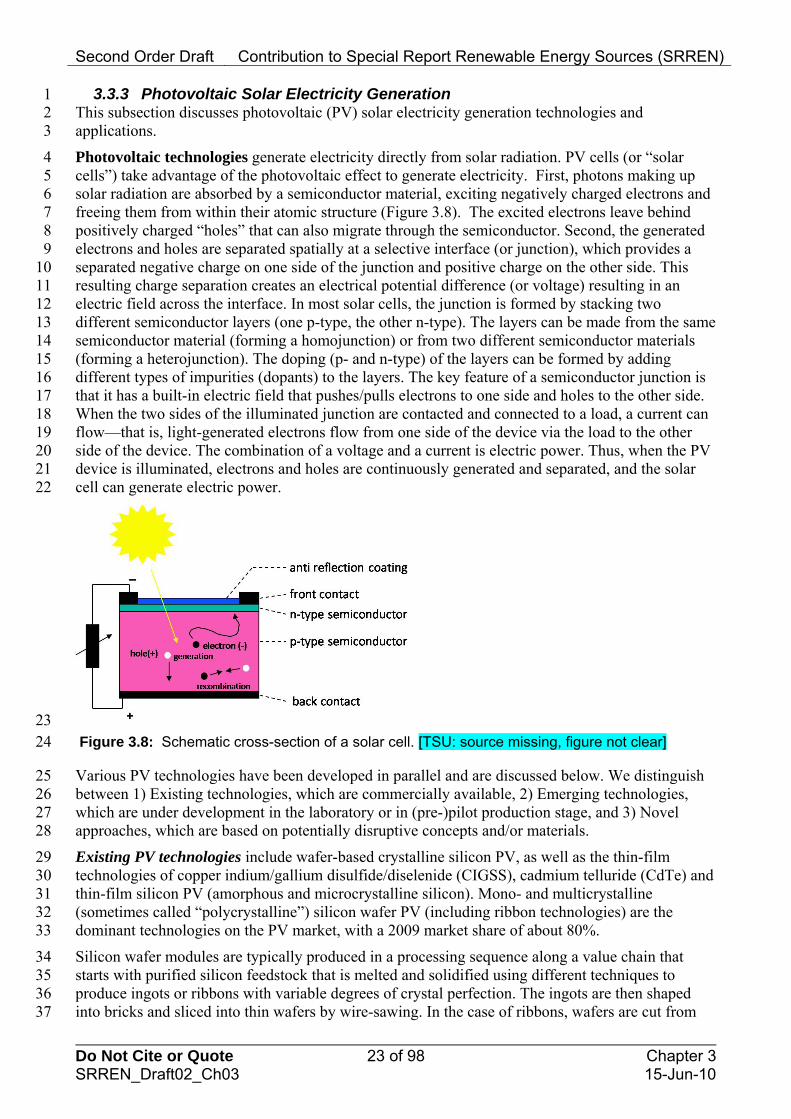
Second Order Draft Contribution to Special Report Renewable Energy Sources (SRREN)
Do Not Cite or Quote 23 of 98 Chapter 3 SRREN_Draft02_Ch03 15-Jun-10
2 3
4 5 6 7 8 9
10 11 12 13 14 15 16 17 18 19 20 21 22
3.3.3 Photovoltaic Solar Electricity Generation 1 This subsection discusses photovoltaic (PV) solar electricity generation technologies and applications.
Photovoltaic technologies generate electricity directly from solar radiation. PV cells (or “solar cells”) take advantage of the photovoltaic effect to generate electricity. First, photons making up solar radiation are absorbed by a semiconductor material, exciting negatively charged electrons and freeing them from within their atomic structure (Figure 3.8). The excited electrons leave behind positively charged “holes” that can also migrate through the semiconductor. Second, the generated electrons and holes are separated spatially at a selective interface (or junction), which provides a separated negative charge on one side of the junction and positive charge on the other side. This resulting charge separation creates an electrical potential difference (or voltage) resulting in an electric field across the interface. In most solar cells, the junction is formed by stacking two different semiconductor layers (one p-type, the other n-type). The layers can be made from the same semiconductor material (forming a homojunction) or from two different semiconductor materials (forming a heterojunction). The doping (p- and n-type) of the layers can be formed by adding different types of impurities (dopants) to the layers. The key feature of a semiconductor junction is that it has a built-in electric field that pushes/pulls electrons to one side and holes to the other side. When the two sides of the illuminated junction are contacted and connected to a load, a current can flow—that is, light-generated electrons flow from one side of the device via the load to the other side of the device. The combination of a voltage and a current is electric power. Thus, when the PV device is illuminated, electrons and holes are continuously generated and separated, and the solar cell can generate electric power.
23 Figure 3.8: Schematic cross-section of a solar cell. [TSU: source missing, figure not clear] 24
25 26 27 28
29 30 31 32 33
34 35 36 37
Various PV technologies have been developed in parallel and are discussed below. We distinguish between 1) Existing technologies, which are commercially available, 2) Emerging technologies, which are under development in the laboratory or in (pre-)pilot production stage, and 3) Novel approaches, which are based on potentially disruptive concepts and/or materials.
Existing PV technologies include wafer-based crystalline silicon PV, as well as the thin-film technologies of copper indium/gallium disulfide/diselenide (CIGSS), cadmium telluride (CdTe) and thin-film silicon PV (amorphous and microcrystalline silicon). Mono- and multicrystalline (sometimes called “polycrystalline”) silicon wafer PV (including ribbon technologies) are the dominant technologies on the PV market, with a 2009 market share of about 80%.
Silicon wafer modules are typically produced in a processing sequence along a value chain that starts with purified silicon feedstock that is melted and solidified using different techniques to produce ingots or ribbons with variable degrees of crystal perfection. The ingots are then shaped into bricks and sliced into thin wafers by wire-sawing. In the case of ribbons, wafers are cut from
Second Order Draft Contribution to Special Report Renewable Energy Sources (SRREN)
Do Not Cite or Quote 24 of 98 Chapter 3 SRREN_Draft02_Ch03 15-Jun-10
1 2
3 4 5 6 7 8
9 10 11 12 13 14 15
16 17 18 19 20 21 22 23
24 25 26 27 28
29 30 31 32 33 34 35 36 37 38 39 40
41 42 43 44 45 46 47
the sheet typically using a laser. Cut wafers and ribbons are processed into solar cells and interconnected in weatherproof or encapsulated packages.
Research single-junction cells have been externally verified to have record conversion efficiencies of 25.0% for monocrystalline silicon and 20.4% for multicrystalline cells (Green et al., 2009b) under standard reporting conditions (i.e., 1000 W m−2, AM1.5, 25°C). The theoretical Shockley-Queisser limit of a single-junction cell with an energy bandgap of crystalline silicon (1.1 electron-volt) is 31% conversion efficiency (Shockley and Queisser, 1961), whereas the specific maximum efficiency for crystalline silicon has been calculated to be 29% (Swanson, 2006).
Several variations for higher efficiency have been developed, e.g., heterojunction solar cells and interdigitated back-contact solar cells. Heterojunction solar cells consist of a crystalline silicon wafer base with a (deposited) amorphous silicon emitter. The highest efficiency of heterojunction solar cells is 23% for a 100-cm2 cell (Taguchi et al., 2009). In an interdigitated back-contact solar cell, both the base and emitter are contacted at the back of the cell, with one advantage being no shading of the front of the cell by a top electrode. The highest efficiency of such a silicon back-contact silicon wafer cell is reported to be 23.4% (Swanson, 2008).
Wafers have decreased in thickness from 400 μm in 1990 to less than 200 μm in 2009 and have increased in area from 100 cm2 to over 200 cm2 in this period. Module efficiency has improved from about 10% in 1990 to typically 13% to 15% today, with the best performers above 17%. And manufacturing facilities have increased from the typical 1 MWp to 5 MWp annual output range in 1990 to hundreds of MWp for today’s largest factories. The processes in the value chain have progressed significantly during recent years, but they still have potential for further large improvements. Commercial module efficiencies for wafer-based silicon PV range from 12% to 20%.
Commercial thin-film PV technologies include a range of absorber material systems: amorphous silicon, amorphous silicon-germanium microcrystalline silicon, cadmium telluride (CdTe), and copper indium gallium diselenide (or disulfide) (CIGS). Theses solar cells have an absorber layer thickness of a few micrometers or less and are deposited on glass, metal, or plastic substrates with areas up to 5.7 m2.
The amorphous silicon (a-Si) solar cell, introduced in 1976 (Carlson and Wronski, 1976) with initial efficiencies of 1% to 2%, has been the first commercially successful thin-film PV technology. Amorphous Si is a quasi-direct-bandgap material and hence has a high light absorption coefficient; therefore, the thickness of an a-Si cell can be more than 100 times thinner than that of a crystalline Si (c-Si) cell. This semiconductor is really an hydrogenated-amorphous Si (a-Si:H), with hydrogen tying up dangling Si bonds that would otherwise create a high density of defect states in the bandgap, which would eliminate any voltage production. Developing better efficiencies for a-Si has been limited by inherent material quality and by light-induced degradation identified as the Staebler-Wronski effect (Staebler and Wronski, 1977). However, research efforts have successfully lowered the impact of the Staebler-Wronski effect to around 10% or less by controlling the microstructure of the film. The highest stabilized efficiency reported is 10.1% (Benagli et al., 2009).
Higher efficiency has been achieved by using multijunction technologies with alloy materials, e.g., germanium and carbon, to form semiconductors with lower or higher bandgaps, respectively, to cover a wider range of the solar spectrum (Yang and Guha, 1992). Another approach to increase the efficiency of thin-film silicon devices is through a tandem consisting of a microcrystalline silicon bottom cell with an amorphous silicon top cell (Yamamoto et al., 1994; Meier et al., 1997). Stabilized efficiencies of 12% to 13% have been measured for various laboratory devices (Green et al., 2010).
Second Order Draft Contribution to Special Report Renewable Energy Sources (SRREN)
Do Not Cite or Quote 25 of 98 Chapter 3 SRREN_Draft02_Ch03 15-Jun-10
1 2 3 4 5 6 7
8 9
10 11 12 13 14 15 16 17 18
19 20 21 22 23 24 25 26 27 28 29
30 31 32 33 34 35 36 37 38 39 40 41 42
43 44 45 46
47 48 49
CdTe solar cells using a heterojunction with CdS have always been technologically interesting, because CdTe has a suitable energy bandgap of 1.45 electron-volts (eV) with a high coefficient of light absorption. The best efficiency of this cell is 16.5% (Green et al., 2008; Green et al., 2009a) and the best commercially available modules have an efficiency of about 10%–11%. Goncalves et al. (2008) estimated that the maximum efficiency will be 17.6%, and future improvements will focus on PV efficiency and how to further reduce manufacturing costs—which are already the lowest in the industry at $0.83/W in 2009.
The toxicity of metallic cadmium and the relative scarcity of tellurium are issues commonly associated with this technology. CdTe itself is a semiconductor and only limited toxicological data are available. Therefore, the evaluation of potential health risks has been based on other forms of cadmium (Sinha et al., 2008). The currently known toxic health effects of CdTe described on a typical material safety data sheet are limited to dust inhalation and ingestion. Recent investigations on CdTe by Zayed et al. on the acute oral and inhalation toxicity of CdTe in rats show that the toxicity potential is much lower than that of cadmium (Zayed and Philippe, 2009). But this potential hazard is mitigated by using a glass-sandwiched module design and by recycling the entire module and any industrial waste (Sinha et al., 2008). Contrary to the commonly assumed scarcity of tellurium, Wadia et al. (2009) found that the currently known economic tellurium reserves would allow the installation of about 10 TW of CdTe solar cells.
The CIGS material family is the basis of the highest efficiency thin-film solar cells to date. The CuInSe2/CdS solar cell was invented in the early 1970s at Bell Laboratories (Wagner et al., 1974). Incorporating Ga and/or S to produce CuInGa(Se,S)2 (CIGSS) results in the benefit of a widened bandgap depending on the composition (Dimmler and Schock, 1996). CIGS-based solar cells have been validated at an efficiency of 20.0% (Repins et al., 2008), using a doubly graded layer of Ga in the absorption layer to realize both high current density and high open-circuit voltage. Due to higher efficiencies and lower manufacturing energy consumptions, CIGSS cells are currently in the industrialisation phase, with best commercial module efficiencies of up to 13.1% (Kushiya, 2009) for CuInGaSe2 and 8.6% for CuInS2 (Meeder et al., 2007). As with tellurium reserves, Wadia et al. (2009) found that the currently known economic indium reserves would allow the installation of more than 10 TW of CIGSS-based PV systems.
High-efficiency solar cells based on GaAs and InGaP (i.e., III-V semiconductors) have superior efficiencies, but are also expensive devices. Double- and triple-junction devices are currently being commercialized. An economically feasible application is the use of these cells in concentrator PV systems (Bosi and Pelosi, 2007). The most commonly used cell is a three-junction device based on GaInP/GaAs/Ge, with a record efficiency of 41.6% for a lattice-matched cell (Boeing-Spectrolab) and 41.1% for a metamorphic or lattice-mismatched device (Fraunhofer). Submodule efficiencies have reached 27% (Green et al., 2009b) (may be 30% from Amonix). These cells were developed for space use. However, to achieve an economically suitable transition for terrestrial purposes, the solution is use these devices in a concentrator system. The advantage is that cell efficiencies increase with higher irradiance (Bosi and Pelosi, 2007) and the cell area decreases in proportion to the concentration level (i.e., under 1000-sun concentration, the area of the cell is about 1/1000 less than at 1-sun). Concentrator applications require a high fraction of direct (versus diffuse) irradiation, and is thus are only suited for Sunbelt regions with low cloud coverage.
Emerging technologies are technologies still under development and in laboratory or (pre-) pilot stage, but that could become commercially viable within the next decade. They are based on very low-cost materials and/or processes and include technologies such as dye-sensitized solar cells, organic solar cells, and low-cost (printed) versions of existing inorganic thin-film technologies.
Electricity generation by dye-sensitized solar cells (DSSCs) is based on light absorption in dye molecules (the “sensitizers”) attached to the very large surface area of a nanoporous oxide semiconductor electrode (usually titanium dioxide), followed by injection of excited electrons from
Second Order Draft Contribution to Special Report Renewable Energy Sources (SRREN)
Do Not Cite or Quote 26 of 98 Chapter 3 SRREN_Draft02_Ch03 15-Jun-10
1 2 3 4 5 6 7 8
9 10 11 12 13 14 15 16
17 18 19 20 21 22 23 24 25 26 27
28 29 30 31 32 33 34 35
36 37 38 39 40 41
42 43 44 45 46 47 48 49
the dye into the oxide. The dye/oxide interface thus serves as the separator of negative and positive charges, like the p-n junction in other devices. The injected electrons are then replenished by electrons supplied through a liquid electrolyte which penetrates the pores and which provides the electrical path from the counter electrode (Gratzel, 2001). State-of-the-art DSSCs have achieved a top conversion efficiency of 10.4% (Chiba et al., 2005). Despite the gradual improvements since its discovery in 1991 (O'Regan and Gratzel, 1991), long-term stability against ultraviolet light irradiation, electrolyte leakage, and high ambient temperatures continue to be key issues in commercializing these PV cells.
Organic PV (OPV) cells use stacked solid organic semiconductors, either polymers or small organic molecules. A typical structure of a small-molecule OPV cell consists of a stack of p-type and n-type organic semiconductors forming a planar heterojunction. The short-lived nature of the excited states (excitons) formed upon light absorption limits the thickness of the semiconductor layers that can be used—and therefore, the efficiency of such devices. Note that excitons need to move to the interface where positive and negative charges can be separated before they de-excite. If the travel distance is short, the “active” thickness of material is small and not all light can be absorbed within that thickness.
The efficiency that can be achieved with single-junction OPV cells is about 5% (Li et al., 2005), although predictions indicate about twice that value or higher (Forrest, 2005; Koster et al., 2006). To decouple exciton transport distances from optical thickness (light absorption), so-called bulk-heterojunction devices have been developed. In these devices, the absorption layer is made of a nanoscale mixture of p- and n-type materials (respectively, polymers such as P3HT and fullerenes) to allow the excitons to reach the interface within their lifetime, while also enabling a sufficient macroscopic layer thickness. This bulk-heterojunction structure plays a key role in improving the efficiency, to a record value of 7.9% in 2009 (Green et al., 2010). The developments in cost and processing (Brabec, 2004; Krebs, 2005) of materials have caused OPV research to advance further. Also, the main development challenge is to achieve a sufficiently high stability in combination with a reasonable efficiency.
Novel technologies are potentially disruptive (high-risk, high-potential) approaches based on new materials, devices, and conversion concepts. Generally, their practically achievable conversion efficiencies and cost structure are still unclear. Examples of these approaches include intermediate-band semiconductors, hot-carrier devices, spectrum converters, plasmonic solar cells, and various applications of quantum dots (see subsection 3.7.3). The emerging technologies described in the previous section primarily aim at very low cost, while achieving a sufficiently high efficiency and stability. However, for novel technologies, most aim at reaching very high efficiencies by making better use of the entire solar spectrum from infrared to ultraviolet.
PV Systems: A photovoltaic system is composed of the PV module, as well as the balance of systems (BOS), which includes storage, system utilization, and the energy network. The system must be reliable, cost effective, attractive, and match with the electric grid in the future (U.S. Photovoltaic Industry Roadmap Steering Committee, 2001; Navigant Consulting Inc., 2006; EU PV European Photovoltaic Technology Platform, 2007; Energy Information Administration [DOE], 2008; Kroposki et al., 2008; NEDO, 2009).
At the component level, a major objective of BOS development is to extend the lifetime of BOS components for grid-connected applications to that of the modules—typically 20 to 30 years—in addition to further reducing the cost of components and installation. The highest priority is given to developing inverters, storage devices, and new designs for specific applications such as building-integrated PV. For systems installed in isolated, off-grid areas, component lifetime should be increased to around 10 years, and components for these systems need to be designed so that they require little or no maintenance. Storage devices are necessary for off-grid PV systems and will require innovative approaches to the short-term storage of small amounts of electricity (1 to 10

Second Order Draft Contribution to Special Report Renewable Energy Sources (SRREN)
Do Not Cite or Quote 27 of 98 Chapter 3 SRREN_Draft02_Ch03 15-Jun-10
1 2 3 4 5 6 7 8 9
10 11 12 13 14 15
16 17 18 19
20 21 22 23 24
25
kWh); in addition, approaches are needed for integrating the storage component into the module, thus providing a single streamlined product that is easy to use in off-grid and remote applications. Moreover, devices for storing large amounts of electricity (over 1 MWh) will be adapted to large PV systems in the new energy network. As new module technologies emerge in the future, some of the ideas relating to BOS may need to be revised. Furthermore, the quality of the system needs to be assured and adequately maintained according to defined standards, guidelines, and procedures. To ensure system quality, assessing performance is important, including on-line analysis (e.g., early fault detection) and off-line analysis of PV systems. The knowledge gathered can help to validate software for predicting the energy yield of future module and system technology designs.
To increasingly penetrate the energy network, PV systems must use technology that is compatible with the electric grid and energy supply and demand. System designs and operation technologies must also be developed in response to demand patterns by developing technology to forecast power generation volume and to optimize the storage function. Moreover, inverters must improve the quality of grid electricity by controlling reactive power or filtering harmonics with communication in a new energy network such as the Smart Grid.
Photovoltaic applications include PV power systems classified into two major types: those not connected to the traditional power grid (i.e., off-grid applications) and those that are connected (i.e., grid-connected applications). In addition, there is a much smaller, but stable, market segment for consumer applications.
Off-grid systems have a significant potential in the unelectrified areas of developing countries. Figure 3.9 shows the ratio of various off-grid and grid-connected systems in the Photovoltaic Power Systems (PVPS) Programme countries. Of the total capacity installed in the IEA PVPS countries during 2008, only about 1% was installed in off-grid systems, and these now make up 5.5% of the cumulative installed PV capacity of the IEA PVPS countries (IEA, 2009c).
26 27 Figure 3.9: Historical trends of off-grid and grid-connected systems in the Organisation for
Economic Co-operation and Development (OECD) countries (IEA, 2009c). [TSU: Caption not clear 28 (cumulative installed capacity)] 29
30 31 32 33
Off-grid centralized PV mini-grid systems have become a reliable alternative for village electrification over the last years. In a PV mini-grid system, energy allocation is possible. For a village located in an isolated area and with houses not separated by too great a distance, the power may flow in the mini-grid without considerable losses. Centralized systems for local power supply
Second Order Draft Contribution to Special Report Renewable Energy Sources (SRREN)
Do Not Cite or Quote 28 of 98 Chapter 3 SRREN_Draft02_Ch03 15-Jun-10
1 2 3 4 5 6
7 8 9
10 11 12 13 14 15 16 17 18
19 20 21 22 23 24
25 26 27 28 29
30 31 32 33 34
35 36 37 38 39
40 41 42 43 44
45 46 47
have different technical advantages concerning electrical performance, reduction of storage needs, availability of energy, and dynamic behaviour. Photovoltaic centralized mini-grid systems could be the least-cost options for a given level of service, and they may have a diesel generator set as an optional backup system or operate as a hybrid photovoltaic-wind-diesel system. These kinds of systems are relevant for reducing and avoiding diesel generator use in remote areas (Muñoz et al., 2007; Sreeraj et al., 2010).
Grid-connected PV systems use an inverter to convert electricity from direct current (DC) as produced by the PV array to alternating current (AC), and then supply the generated electricity to the electricity network.
Compared to an off-grid installation, system costs are lower because energy storage is not generally required, since the grid is used as a buffer. The annual output yield ranges from 300 to 2000 kWh/kW (Clavadetscher and Nordmann, 2007; Gaiddon and Jedliczka, 2007; Kurokawa et al., 2007; PVGIS Photovoltaic Geographic Information System, 2008) for several installation conditions in the world. The average annual performance ratio—the ratio between average AC system efficiency and standard DC module efficiency—ranges from 0.7 to 0.8 (Clavadetscher and Nordmann, 2007) and gradually increases further to about 0.9 for specific technologies and applications. Grid-connected PV systems are classified into two types of applications: distributed and centralized.
Grid-connected distributed PV systems are installed to provide power to a grid-connected customer or directly to the electricity network. Such systems may be: 1) on or integrated into the customer’s premises, often on the demand side of the electricity meter; 2) on public and commercial buildings; or 3) simply in the built environment such as on motorway sound barriers. Typical sizes are 1 to 4 kW for residential systems, and 10 kW to several MW for rooftops on public and industrial buildings.
These systems have a number of advantages: distribution losses in the electricity network are reduced because the system is installed at the point of use; extra land is not required for the PV system and costs for mounting the systems can be reduced if the system is mounted on an existing structure; and the PV array itself can be used as a cladding or roofing material, as in “building-integrated PV” (BIPV) (Eiffert, 2002; Ecofys Netherlands BV, 2007; Elzinga, 2008).
An often-cited disadvantage is the greater sensitivity to grid-interconnection issues, such as overvoltage and unintended islanding (Kobayashi and Takasaki, 2006; Cobben et al., 2008; Ropp et al., 2008). However, this is no longer the case as, according to the standards by IEEE and Underwriter Laboratories (IEEE 1547 (2008), UL 1741), all inverters must have the function of the anti-islanding effect.
Grid-connected centralized PV systems perform the functions of centralized power stations. The power supplied by such a system is not associated with a particular electricity customer, and the system is not located to specifically perform functions on the electricity network other than the supply of bulk power. Typically, centralized systems are mounted on the ground, and they are larger than 1 MW.
The economical advantage of these systems is the optimization of installation and operating cost by bulk buying and the cost effectiveness of the PV components and balance of systems in large scale. In addition, the reliability of centralized PV systems is greater than distributed PV systems because they can have maintenance systems with monitoring equipment, which is a more reasonable portion of the total system cost.
Multi-functional PV and solar thermal components involving PV or solar thermal that have already been introduced into the built environment include the following: shading systems made from PV and/or solar thermal collectors; hybrid PV/thermal (PV/T) systems that generate electricity and heat
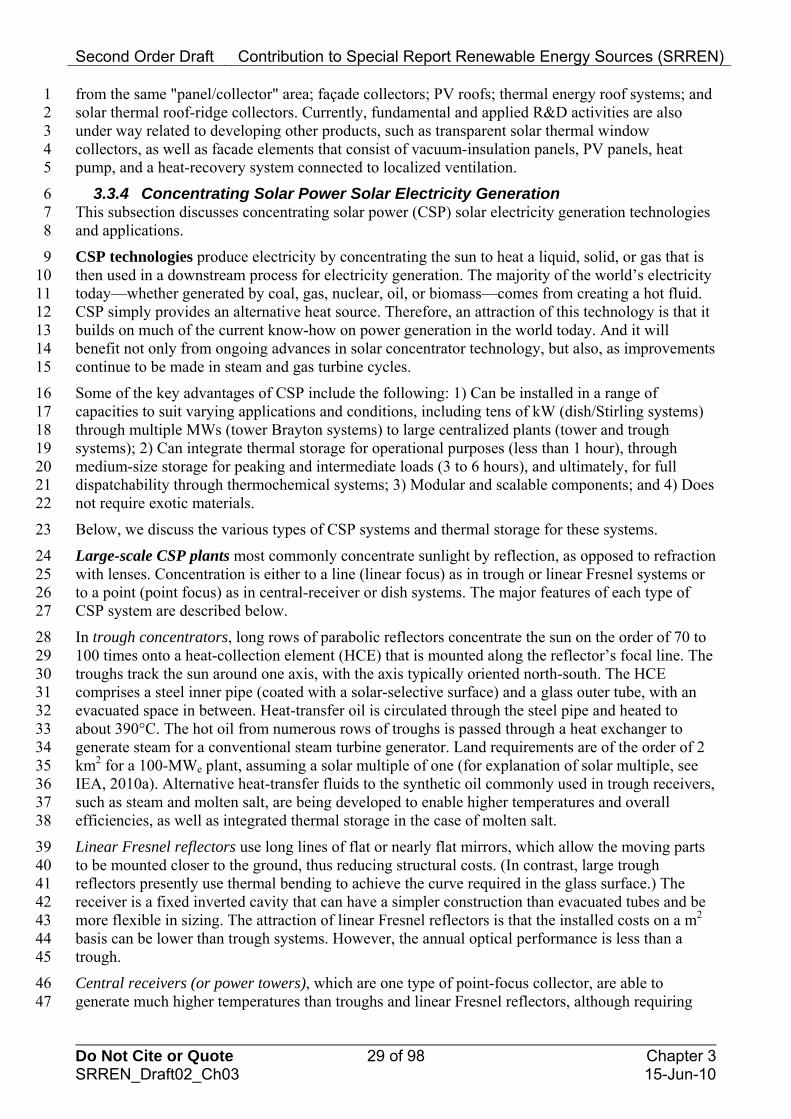
Second Order Draft Contribution to Special Report Renewable Energy Sources (SRREN)
Do Not Cite or Quote 29 of 98 Chapter 3 SRREN_Draft02_Ch03 15-Jun-10
1 2 3 4 5
7 8
9 10 11 12 13 14 15
16 17 18 19 20 21 22
23
24 25 26 27
28 29 30 31 32 33 34 35 36 37 38
39 40 41 42 43 44 45
46 47
from the same "panel/collector" area; façade collectors; PV roofs; thermal energy roof systems; and solar thermal roof-ridge collectors. Currently, fundamental and applied R&D activities are also under way related to developing other products, such as transparent solar thermal window collectors, as well as facade elements that consist of vacuum-insulation panels, PV panels, heat pump, and a heat-recovery system connected to localized ventilation.
3.3.4 Concentrating Solar Power Solar Electricity Generation 6 This subsection discusses concentrating solar power (CSP) solar electricity generation technologies and applications.
CSP technologies produce electricity by concentrating the sun to heat a liquid, solid, or gas that is then used in a downstream process for electricity generation. The majority of the world’s electricity today—whether generated by coal, gas, nuclear, oil, or biomass—comes from creating a hot fluid. CSP simply provides an alternative heat source. Therefore, an attraction of this technology is that it builds on much of the current know-how on power generation in the world today. And it will benefit not only from ongoing advances in solar concentrator technology, but also, as improvements continue to be made in steam and gas turbine cycles.
Some of the key advantages of CSP include the following: 1) Can be installed in a range of capacities to suit varying applications and conditions, including tens of kW (dish/Stirling systems) through multiple MWs (tower Brayton systems) to large centralized plants (tower and trough systems); 2) Can integrate thermal storage for operational purposes (less than 1 hour), through medium-size storage for peaking and intermediate loads (3 to 6 hours), and ultimately, for full dispatchability through thermochemical systems; 3) Modular and scalable components; and 4) Does not require exotic materials.
Below, we discuss the various types of CSP systems and thermal storage for these systems.
Large-scale CSP plants most commonly concentrate sunlight by reflection, as opposed to refraction with lenses. Concentration is either to a line (linear focus) as in trough or linear Fresnel systems or to a point (point focus) as in central-receiver or dish systems. The major features of each type of CSP system are described below.
In trough concentrators, long rows of parabolic reflectors concentrate the sun on the order of 70 to 100 times onto a heat-collection element (HCE) that is mounted along the reflector’s focal line. The troughs track the sun around one axis, with the axis typically oriented north-south. The HCE comprises a steel inner pipe (coated with a solar-selective surface) and a glass outer tube, with an evacuated space in between. Heat-transfer oil is circulated through the steel pipe and heated to about 390°C. The hot oil from numerous rows of troughs is passed through a heat exchanger to generate steam for a conventional steam turbine generator. Land requirements are of the order of 2 km2 for a 100-MWe plant, assuming a solar multiple of one (for explanation of solar multiple, see IEA, 2010a). Alternative heat-transfer fluids to the synthetic oil commonly used in trough receivers, such as steam and molten salt, are being developed to enable higher temperatures and overall efficiencies, as well as integrated thermal storage in the case of molten salt.
Linear Fresnel reflectors use long lines of flat or nearly flat mirrors, which allow the moving parts to be mounted closer to the ground, thus reducing structural costs. (In contrast, large trough reflectors presently use thermal bending to achieve the curve required in the glass surface.) The receiver is a fixed inverted cavity that can have a simpler construction than evacuated tubes and be more flexible in sizing. The attraction of linear Fresnel reflectors is that the installed costs on a m2 basis can be lower than trough systems. However, the annual optical performance is less than a trough.
Central receivers (or power towers), which are one type of point-focus collector, are able to generate much higher temperatures than troughs and linear Fresnel reflectors, although requiring
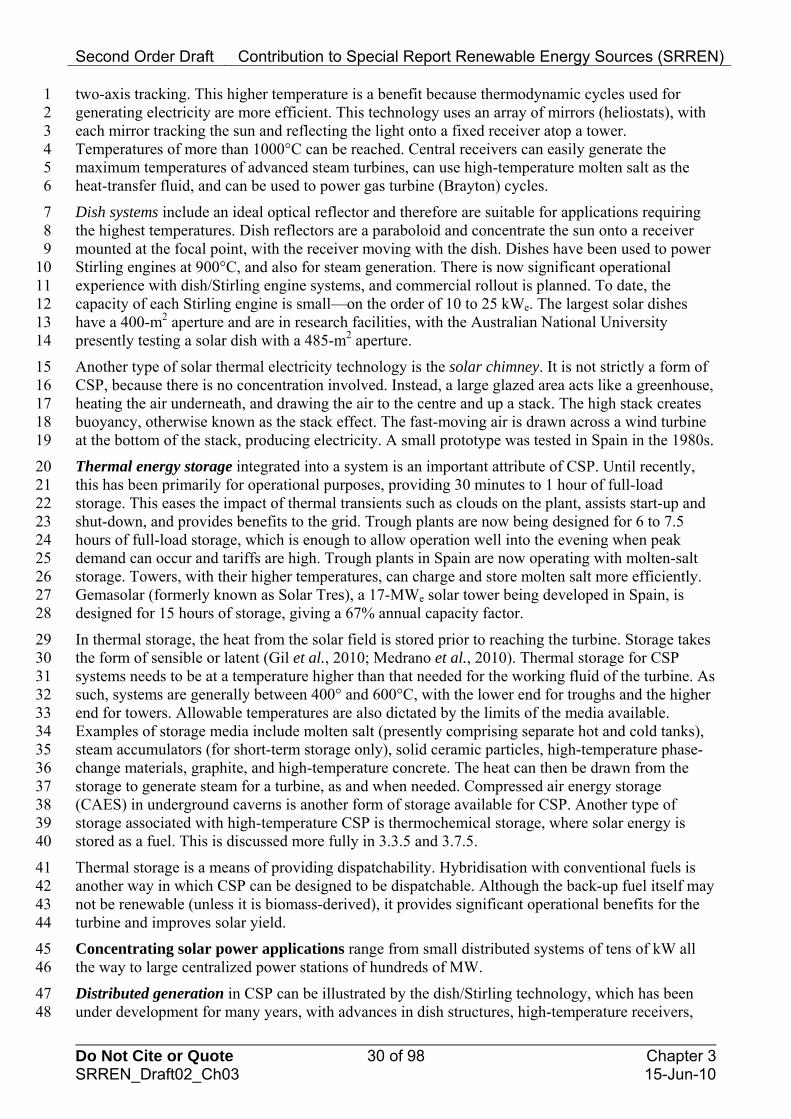
Second Order Draft Contribution to Special Report Renewable Energy Sources (SRREN)
Do Not Cite or Quote 30 of 98 Chapter 3 SRREN_Draft02_Ch03 15-Jun-10
1 2 3 4 5 6
7 8 9
10 11 12 13 14
15 16 17 18 19
20 21 22 23 24 25 26 27 28
29 30 31 32 33 34 35 36 37 38 39 40
41 42 43 44
45 46
47 48
two-axis tracking. This higher temperature is a benefit because thermodynamic cycles used for generating electricity are more efficient. This technology uses an array of mirrors (heliostats), with each mirror tracking the sun and reflecting the light onto a fixed receiver atop a tower. Temperatures of more than 1000°C can be reached. Central receivers can easily generate the maximum temperatures of advanced steam turbines, can use high-temperature molten salt as the heat-transfer fluid, and can be used to power gas turbine (Brayton) cycles.
Dish systems include an ideal optical reflector and therefore are suitable for applications requiring the highest temperatures. Dish reflectors are a paraboloid and concentrate the sun onto a receiver mounted at the focal point, with the receiver moving with the dish. Dishes have been used to power Stirling engines at 900°C, and also for steam generation. There is now significant operational experience with dish/Stirling engine systems, and commercial rollout is planned. To date, the capacity of each Stirling engine is small—on the order of 10 to 25 kWe. The largest solar dishes have a 400-m2 aperture and are in research facilities, with the Australian National University presently testing a solar dish with a 485-m2 aperture.
Another type of solar thermal electricity technology is the solar chimney. It is not strictly a form of CSP, because there is no concentration involved. Instead, a large glazed area acts like a greenhouse, heating the air underneath, and drawing the air to the centre and up a stack. The high stack creates buoyancy, otherwise known as the stack effect. The fast-moving air is drawn across a wind turbine at the bottom of the stack, producing electricity. A small prototype was tested in Spain in the 1980s.
Thermal energy storage integrated into a system is an important attribute of CSP. Until recently, this has been primarily for operational purposes, providing 30 minutes to 1 hour of full-load storage. This eases the impact of thermal transients such as clouds on the plant, assists start-up and shut-down, and provides benefits to the grid. Trough plants are now being designed for 6 to 7.5 hours of full-load storage, which is enough to allow operation well into the evening when peak demand can occur and tariffs are high. Trough plants in Spain are now operating with molten-salt storage. Towers, with their higher temperatures, can charge and store molten salt more efficiently. Gemasolar (formerly known as Solar Tres), a 17-MWe solar tower being developed in Spain, is designed for 15 hours of storage, giving a 67% annual capacity factor.
In thermal storage, the heat from the solar field is stored prior to reaching the turbine. Storage takes the form of sensible or latent (Gil et al., 2010; Medrano et al., 2010). Thermal storage for CSP systems needs to be at a temperature higher than that needed for the working fluid of the turbine. As such, systems are generally between 400° and 600°C, with the lower end for troughs and the higher end for towers. Allowable temperatures are also dictated by the limits of the media available. Examples of storage media include molten salt (presently comprising separate hot and cold tanks), steam accumulators (for short-term storage only), solid ceramic particles, high-temperature phase-change materials, graphite, and high-temperature concrete. The heat can then be drawn from the storage to generate steam for a turbine, as and when needed. Compressed air energy storage (CAES) in underground caverns is another form of storage available for CSP. Another type of storage associated with high-temperature CSP is thermochemical storage, where solar energy is stored as a fuel. This is discussed more fully in 3.3.5 and 3.7.5.
Thermal storage is a means of providing dispatchability. Hybridisation with conventional fuels is another way in which CSP can be designed to be dispatchable. Although the back-up fuel itself may not be renewable (unless it is biomass-derived), it provides significant operational benefits for the turbine and improves solar yield.
Concentrating solar power applications range from small distributed systems of tens of kW all the way to large centralized power stations of hundreds of MW.
Distributed generation in CSP can be illustrated by the dish/Stirling technology, which has been under development for many years, with advances in dish structures, high-temperature receivers,
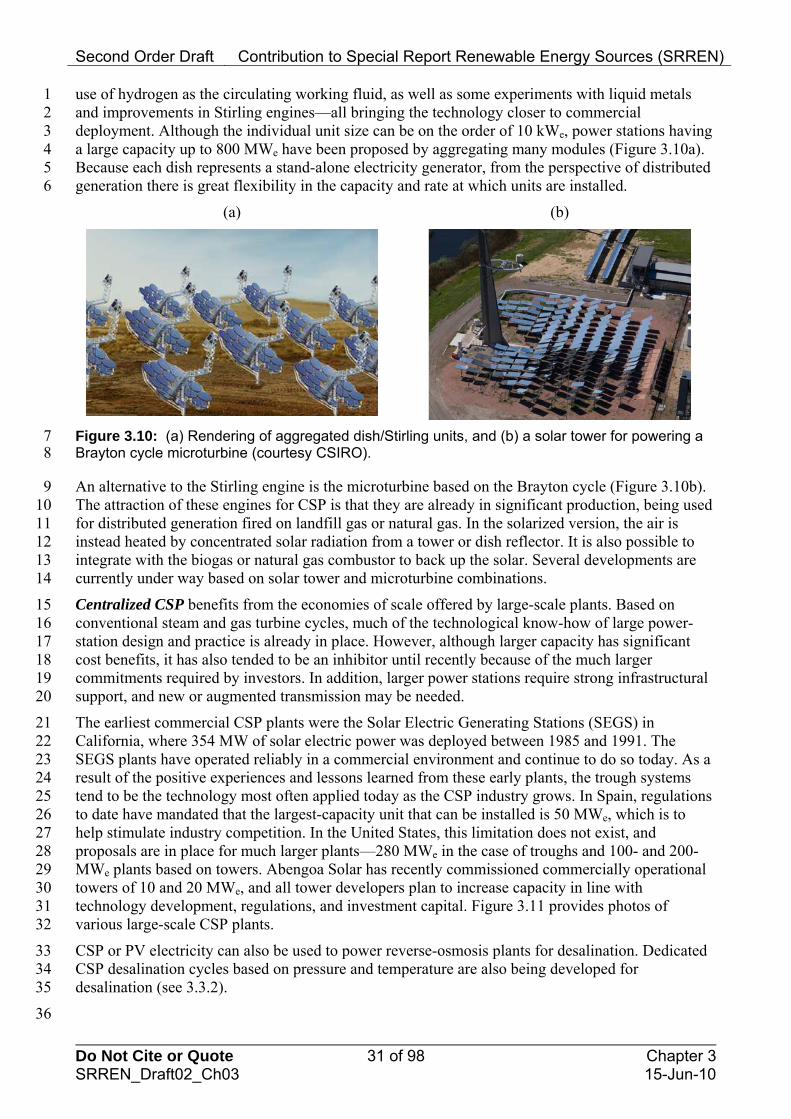
Second Order Draft Contribution to Special Report Renewable Energy Sources (SRREN)
Do Not Cite or Quote 31 of 98 Chapter 3 SRREN_Draft02_Ch03 15-Jun-10
1 2 3 4 5 6
use of hydrogen as the circulating working fluid, as well as some experiments with liquid metals and improvements in Stirling engines—all bringing the technology closer to commercial deployment. Although the individual unit size can be on the order of 10 kWe, power stations having a large capacity up to 800 MWe have been proposed by aggregating many modules (Figure 3.10a). Because each dish represents a stand-alone electricity generator, from the perspective of distributed generation there is great flexibility in the capacity and rate at which units are installed.
(a) (b)
Figure 3.10: (a) Rendering of aggregated dish/Stirling units, and (b) a solar tower for powering a Brayton cycle microturbine (courtesy CSIRO).
7 8
9 10 11 12 13 14
15 16 17 18 19 20
21 22 23 24 25 26 27 28 29 30 31 32
33 34 35
36
An alternative to the Stirling engine is the microturbine based on the Brayton cycle (Figure 3.10b). The attraction of these engines for CSP is that they are already in significant production, being used for distributed generation fired on landfill gas or natural gas. In the solarized version, the air is instead heated by concentrated solar radiation from a tower or dish reflector. It is also possible to integrate with the biogas or natural gas combustor to back up the solar. Several developments are currently under way based on solar tower and microturbine combinations.
Centralized CSP benefits from the economies of scale offered by large-scale plants. Based on conventional steam and gas turbine cycles, much of the technological know-how of large power-station design and practice is already in place. However, although larger capacity has significant cost benefits, it has also tended to be an inhibitor until recently because of the much larger commitments required by investors. In addition, larger power stations require strong infrastructural support, and new or augmented transmission may be needed.
The earliest commercial CSP plants were the Solar Electric Generating Stations (SEGS) in California, where 354 MW of solar electric power was deployed between 1985 and 1991. The SEGS plants have operated reliably in a commercial environment and continue to do so today. As a result of the positive experiences and lessons learned from these early plants, the trough systems tend to be the technology most often applied today as the CSP industry grows. In Spain, regulations to date have mandated that the largest-capacity unit that can be installed is 50 MWe, which is to help stimulate industry competition. In the United States, this limitation does not exist, and proposals are in place for much larger plants—280 MWe in the case of troughs and 100- and 200-MWe plants based on towers. Abengoa Solar has recently commissioned commercially operational towers of 10 and 20 MWe, and all tower developers plan to increase capacity in line with technology development, regulations, and investment capital. Figure 3.11 provides photos of various large-scale CSP plants.
CSP or PV electricity can also be used to power reverse-osmosis plants for desalination. Dedicated CSP desalination cycles based on pressure and temperature are also being developed for desalination (see 3.3.2).
Second Order Draft Contribution to Special Report Renewable Energy Sources (SRREN)
Do Not Cite or Quote 32 of 98 Chapter 3 SRREN_Draft02_Ch03 15-Jun-10
(a) (b)
(c) (d)
Figure 3.11: Large-scale CSP plants: (a) one of the original SEGS plants in California built by LUZ, operating for 20 years, showing the trough collectors and steam turbine plant; (b) aerial view of the five SEGS III-VII plants at Kramer Junction, California; (c) photo of eSolar’s 5-MWe demonstration plant in California; (d) aerial view of Abengoa Solar’s PS10 and PS20 solar towers
1 2 3 4
in operation near Seville, Spain. [TSU: sources missing, (c) blurry] 5
7
8 9
10 11 12 13 14
15 16 17 18 19 20 21
22 23 24 25 26
3.3.5 Solar Fuel Production 6 This subsection discusses solar fuel production technologies and applications.
Solar fuel technologies convert solar energy into chemical fuels, which is an attractive method of storing and transporting solar energy. Solar fuel processes can be used for upgrading fossil fuels, combusted to generate heat, used in high-efficiency gas-turbine cycles or internal combustion engines, or used directly to generate electricity in fuel cells to meet energy demands whenever and wherever required by the customers. The challenge is to produce large amounts of chemical fuels directly from sunlight in cost-effective ways and to minimize adverse effects on the environment (Steinfeld and Meier, 2004).
There are four basic routes, alone or in combination, for producing storable and transportable fuels from solar energy. The electrochemical route uses solar electricity made from PV or CSP systems followed by an electrolytic process; the photochemical / photobiological route makes direct use of solar photon energy for photochemical and photobiological processes; the thermochemical route uses solar heat at high temperatures followed by an endothermic thermochemical process; and the solar fuel synthesis from solar hydrogen and CO2 combines the electrochemical route with the thermochemical route using CO2 synthesis (Steinfeld and Meier, 2004; Sterner, 2009).
The thermochemical route offers attractive opportunities for CSP with broad economic implications. Figure 3.12 illustrates possible pathways to produce hydrogen (H2) or synthesis gas (syngas) from water and/or fossil fuels using concentrated solar energy as the source of high-temperature process heat (Steinfeld and Meier, 2004), (Steinfeld, 2005). Feedstocks include inorganic compounds such as water (H2O) and carbon dioxide (CO2), and organic sources such as
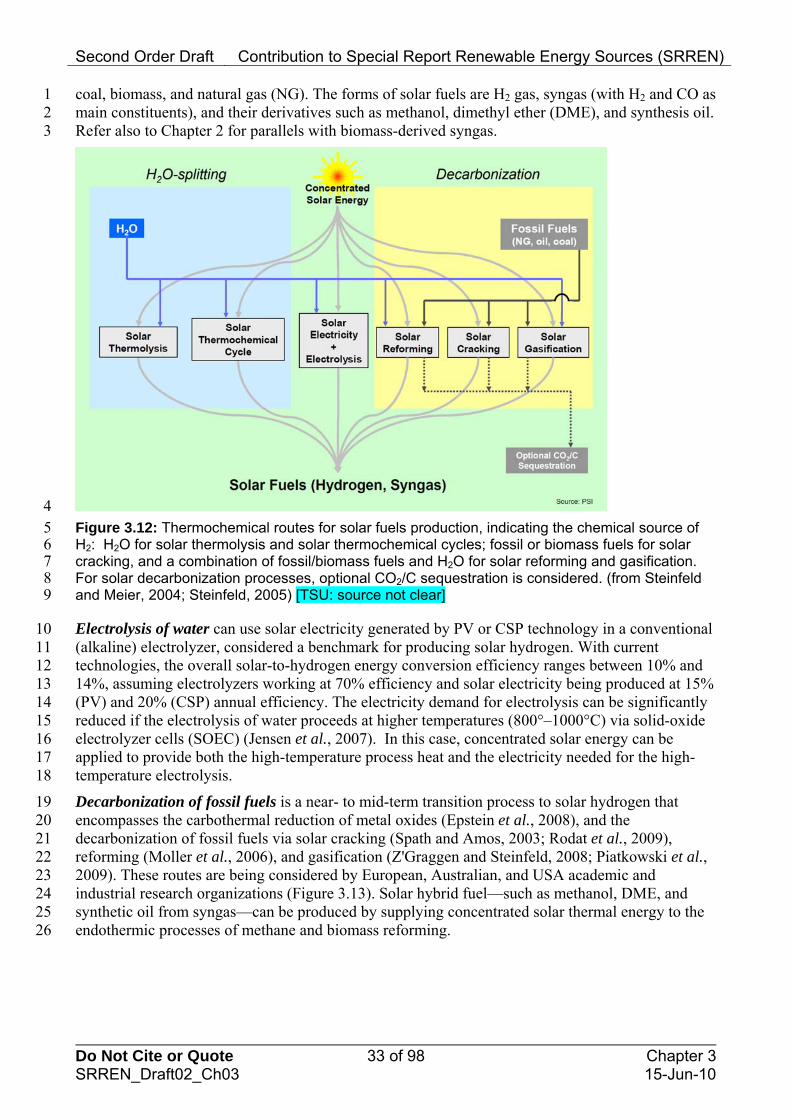
Second Order Draft Contribution to Special Report Renewable Energy Sources (SRREN)
Do Not Cite or Quote 33 of 98 Chapter 3 SRREN_Draft02_Ch03 15-Jun-10
1 2 3
coal, biomass, and natural gas (NG). The forms of solar fuels are H2 gas, syngas (with H2 and CO as main constituents), and their derivatives such as methanol, dimethyl ether (DME), and synthesis oil. Refer also to Chapter 2 for parallels with biomass-derived syngas.
4 5 6 7 8
Figure 3.12: Thermochemical routes for solar fuels production, indicating the chemical source of H2: H2O for solar thermolysis and solar thermochemical cycles; fossil or biomass fuels for solar cracking, and a combination of fossil/biomass fuels and H2O for solar reforming and gasification. For solar decarbonization processes, optional CO2/C sequestration is considered. (from Steinfeld and Meier, 2004; Steinfeld, 2005) [TSU: source not clear] 9
10 11 12 13 14 15 16 17 18
19 20 21 22 23 24 25 26
Electrolysis of water can use solar electricity generated by PV or CSP technology in a conventional (alkaline) electrolyzer, considered a benchmark for producing solar hydrogen. With current technologies, the overall solar-to-hydrogen energy conversion efficiency ranges between 10% and 14%, assuming electrolyzers working at 70% efficiency and solar electricity being produced at 15% (PV) and 20% (CSP) annual efficiency. The electricity demand for electrolysis can be significantly reduced if the electrolysis of water proceeds at higher temperatures (800°–1000°C) via solid-oxide electrolyzer cells (SOEC) (Jensen et al., 2007). In this case, concentrated solar energy can be applied to provide both the high-temperature process heat and the electricity needed for the high-temperature electrolysis.
Decarbonization of fossil fuels is a near- to mid-term transition process to solar hydrogen that encompasses the carbothermal reduction of metal oxides (Epstein et al., 2008), and the decarbonization of fossil fuels via solar cracking (Spath and Amos, 2003; Rodat et al., 2009), reforming (Moller et al., 2006), and gasification (Z'Graggen and Steinfeld, 2008; Piatkowski et al., 2009). These routes are being considered by European, Australian, and USA academic and industrial research organizations (Figure 3.13). Solar hybrid fuel—such as methanol, DME, and synthetic oil from syngas—can be produced by supplying concentrated solar thermal energy to the endothermic processes of methane and biomass reforming.
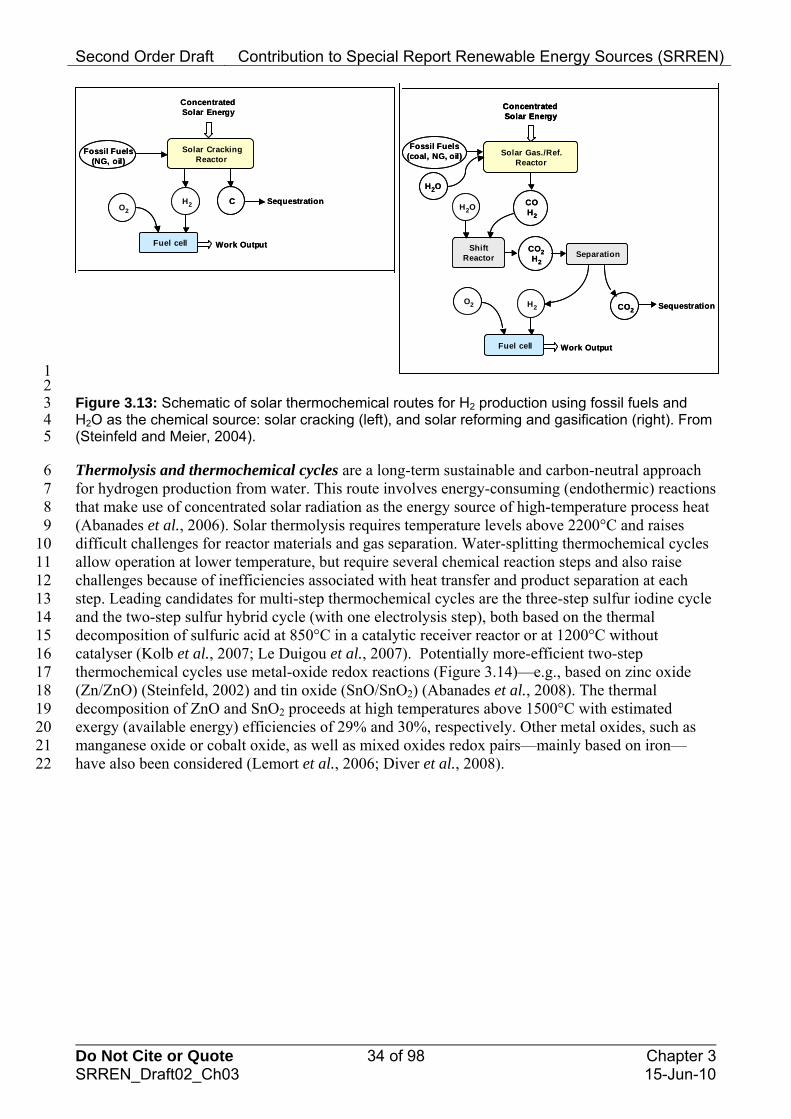
Second Order Draft Contribution to Special Report Renewable Energy Sources (SRREN)
Do Not Cite or Quote 34 of 98 Chapter 3 SRREN_Draft02_Ch03 15-Jun-10
1 2 3 4 5
6 7 8 9
10 11 12 13 14 15 16 17 18 19 20 21 22
Figure 3.13: Schematic of solar thermochemical routes for H2 production using fossil fuels and H2O as the chemical source: solar cracking (left), and solar reforming and gasification (right). From (Steinfeld and Meier, 2004).
Thermolysis and thermochemical cycles are a long-term sustainable and carbon-neutral approach for hydrogen production from water. This route involves energy-consuming (endothermic) reactions that make use of concentrated solar radiation as the energy source of high-temperature process heat (Abanades et al., 2006). Solar thermolysis requires temperature levels above 2200°C and raises difficult challenges for reactor materials and gas separation. Water-splitting thermochemical cycles allow operation at lower temperature, but require several chemical reaction steps and also raise challenges because of inefficiencies associated with heat transfer and product separation at each step. Leading candidates for multi-step thermochemical cycles are the three-step sulfur iodine cycle and the two-step sulfur hybrid cycle (with one electrolysis step), both based on the thermal decomposition of sulfuric acid at 850°C in a catalytic receiver reactor or at 1200°C without catalyser (Kolb et al., 2007; Le Duigou et al., 2007). Potentially more-efficient two-step thermochemical cycles use metal-oxide redox reactions (Figure 3.14)—e.g., based on zinc oxide (Zn/ZnO) (Steinfeld, 2002) and tin oxide (SnO/SnO2) (Abanades et al., 2008). The thermal decomposition of ZnO and SnO2 proceeds at high temperatures above 1500°C with estimated exergy (available energy) efficiencies of 29% and 30%, respectively. Other metal oxides, such as manganese oxide or cobalt oxide, as well as mixed oxides redox pairs—mainly based on iron—have also been considered (Lemort et al., 2006; Diver et al., 2008).
Fossil Fuels (NG, oil)
Solar Cracking Reactor
CH2 Sequestration
Fuel cell
Concentrated Solar Energy
Work Output
O2
Fossil Fuels (NG, oil)
Solar Cracking Reactor
CH2 Sequestration
Fuel cell
Concentrated Solar Energy
Work Output
O2
Solar Gas./Ref.Reactor
CO2
Concentrated Solar Energy
Fossil Fuels (coal, NG, oil)
H2O
COH2
Shift Reactor
H2O
CO2H2
Separation
H2
Fuel cell Work Output
O2 Sequestration
Solar Gas./Ref.Reactor
CO2
Concentrated Solar EnergyConcentrated Solar Energy
Fossil Fuels (coal, NG, oil)
H2O
COH2
Shift Reactor
H2O
CO2H2
Separation
H2
Fuel cell Work Output
O2 Sequestration
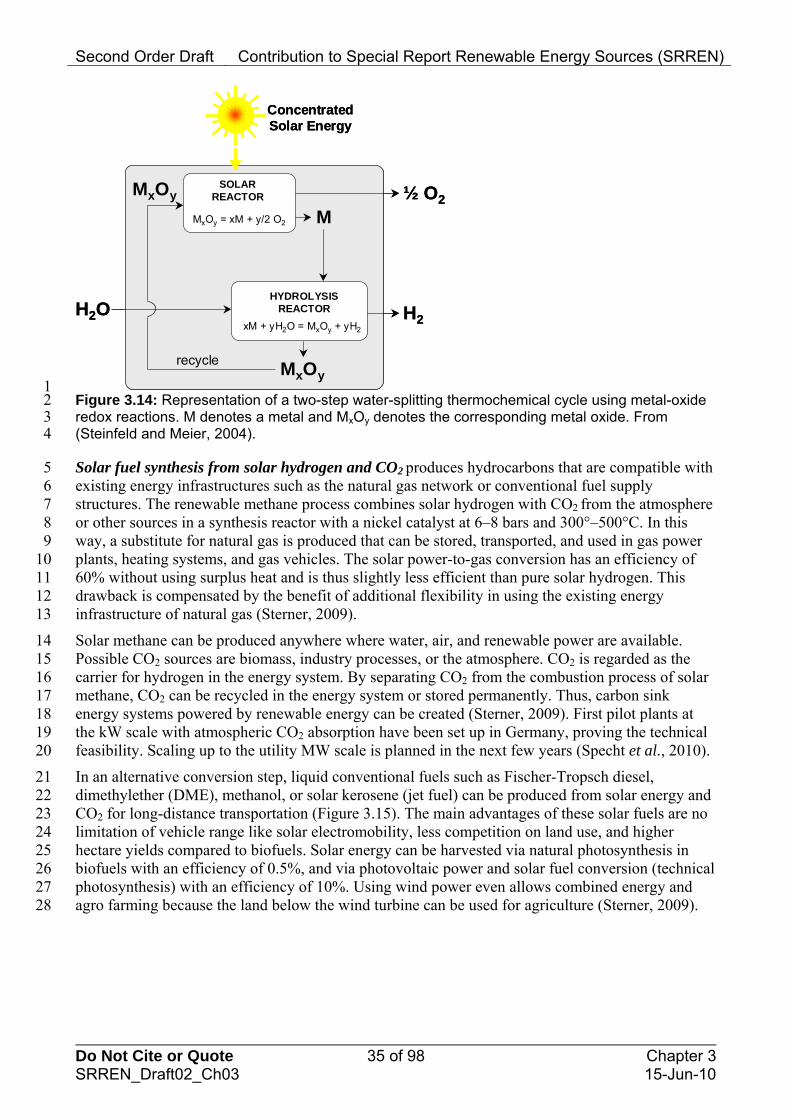
Second Order Draft Contribution to Special Report Renewable Energy Sources (SRREN)
Do Not Cite or Quote 35 of 98 Chapter 3 SRREN_Draft02_Ch03 15-Jun-10
H2H2O
ConcentratedSolar Energy
HYDROLYSISREACTOR
½ O2SOLAR
REACTOR
recycle
xM + yH2O = MxOy + yH2
MxOy = xM + y/2 O2
MxOy
M
MxOy
H2H2O
ConcentratedSolar Energy
HYDROLYSISREACTOR
½ O2SOLAR
REACTOR
recycle
xM + yH2O = MxOy + yH2
MxOy = xM + y/2 O2
MxOy
M
MxOy 1
2 3 4
5 6 7 8 9
10 11 12 13
14 15 16 17 18 19 20
21 22 23 24 25 26 27 28
Figure 3.14: Representation of a two-step water-splitting thermochemical cycle using metal-oxide redox reactions. M denotes a metal and MxOy denotes the corresponding metal oxide. From (Steinfeld and Meier, 2004).
Solar fuel synthesis from solar hydrogen and CO2 produces hydrocarbons that are compatible with existing energy infrastructures such as the natural gas network or conventional fuel supply structures. The renewable methane process combines solar hydrogen with CO2
from the atmosphere or other sources in a synthesis reactor with a nickel catalyst at 6–8 bars and 300°–500°C. In this way, a substitute for natural gas is produced that can be stored, transported, and used in gas power plants, heating systems, and gas vehicles. The solar power-to-gas conversion has an efficiency of 60% without using surplus heat and is thus slightly less efficient than pure solar hydrogen. This drawback is compensated by the benefit of additional flexibility in using the existing energy infrastructure of natural gas (Sterner, 2009).
Solar methane can be produced anywhere where water, air, and renewable power are available. Possible CO2 sources are biomass, industry processes, or the atmosphere. CO2 is regarded as the carrier for hydrogen in the energy system. By separating CO2 from the combustion process of solar methane, CO2 can be recycled in the energy system or stored permanently. Thus, carbon sink energy systems powered by renewable energy can be created (Sterner, 2009). First pilot plants at the kW scale with atmospheric CO2 absorption have been set up in Germany, proving the technical feasibility. Scaling up to the utility MW scale is planned in the next few years (Specht et al., 2010).
In an alternative conversion step, liquid conventional fuels such as Fischer-Tropsch diesel, dimethylether (DME), methanol, or solar kerosene (jet fuel) can be produced from solar energy and CO2 for long-distance transportation (Figure 3.15). The main advantages of these solar fuels are no limitation of vehicle range like solar electromobility, less competition on land use, and higher hectare yields compared to biofuels. Solar energy can be harvested via natural photosynthesis in biofuels with an efficiency of 0.5%, and via photovoltaic power and solar fuel conversion (technical photosynthesis) with an efficiency of 10%. Using wind power even allows combined energy and agro farming because the land below the wind turbine can be used for agriculture (Sterner, 2009).
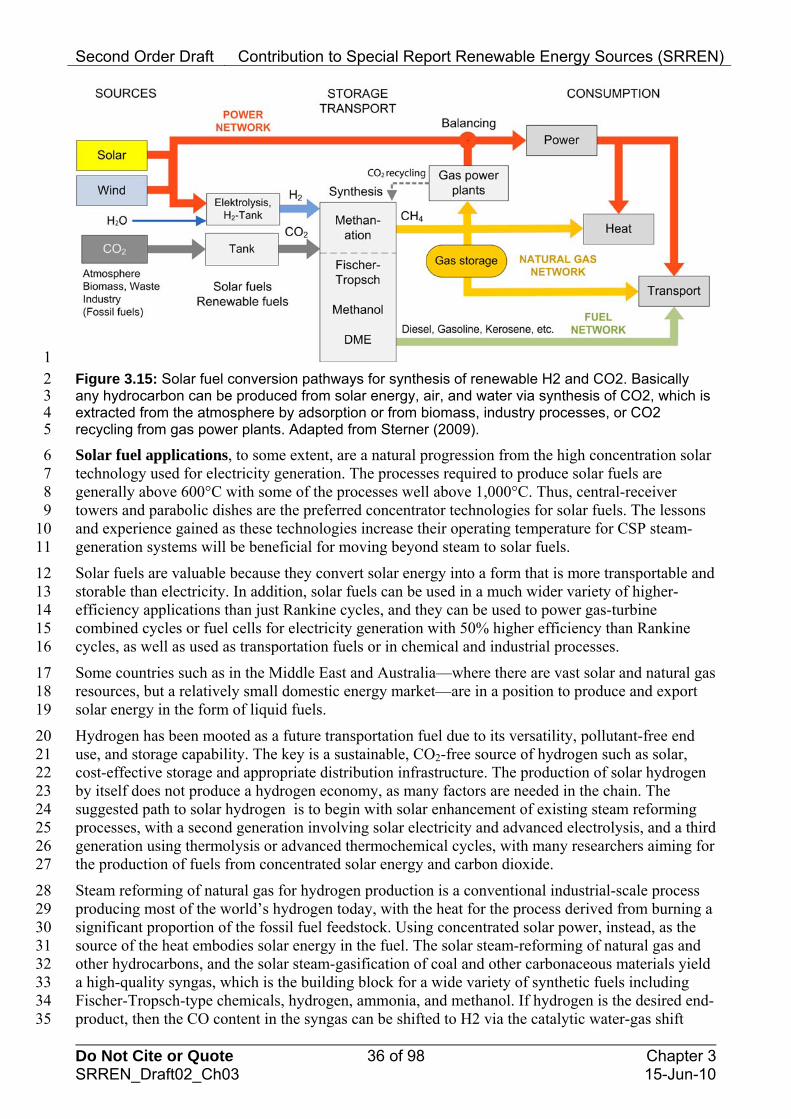
Second Order Draft Contribution to Special Report Renewable Energy Sources (SRREN)
Do Not Cite or Quote 36 of 98 Chapter 3 SRREN_Draft02_Ch03 15-Jun-10
1 2 3 4 5
6 7 8 9
10 11
12 13 14 15 16
17 18 19
20 21 22 23 24 25 26 27
28 29 30 31 32 33 34 35
Figure 3.15: Solar fuel conversion pathways for synthesis of renewable H2 and CO2. Basically any hydrocarbon can be produced from solar energy, air, and water via synthesis of CO2, which is extracted from the atmosphere by adsorption or from biomass, industry processes, or CO2 recycling from gas power plants. Adapted from Sterner (2009).
Solar fuel applications, to some extent, are a natural progression from the high concentration solar technology used for electricity generation. The processes required to produce solar fuels are generally above 600°C with some of the processes well above 1,000°C. Thus, central-receiver towers and parabolic dishes are the preferred concentrator technologies for solar fuels. The lessons and experience gained as these technologies increase their operating temperature for CSP steam-generation systems will be beneficial for moving beyond steam to solar fuels.
Solar fuels are valuable because they convert solar energy into a form that is more transportable and storable than electricity. In addition, solar fuels can be used in a much wider variety of higher-efficiency applications than just Rankine cycles, and they can be used to power gas-turbine combined cycles or fuel cells for electricity generation with 50% higher efficiency than Rankine cycles, as well as used as transportation fuels or in chemical and industrial processes.
Some countries such as in the Middle East and Australia—where there are vast solar and natural gas resources, but a relatively small domestic energy market—are in a position to produce and export solar energy in the form of liquid fuels.
Hydrogen has been mooted as a future transportation fuel due to its versatility, pollutant-free end use, and storage capability. The key is a sustainable, CO2-free source of hydrogen such as solar, cost-effective storage and appropriate distribution infrastructure. The production of solar hydrogen by itself does not produce a hydrogen economy, as many factors are needed in the chain. The suggested path to solar hydrogen is to begin with solar enhancement of existing steam reforming processes, with a second generation involving solar electricity and advanced electrolysis, and a third generation using thermolysis or advanced thermochemical cycles, with many researchers aiming for the production of fuels from concentrated solar energy and carbon dioxide.
Steam reforming of natural gas for hydrogen production is a conventional industrial-scale process producing most of the world’s hydrogen today, with the heat for the process derived from burning a significant proportion of the fossil fuel feedstock. Using concentrated solar power, instead, as the source of the heat embodies solar energy in the fuel. The solar steam-reforming of natural gas and other hydrocarbons, and the solar steam-gasification of coal and other carbonaceous materials yield a high-quality syngas, which is the building block for a wide variety of synthetic fuels including Fischer-Tropsch-type chemicals, hydrogen, ammonia, and methanol. If hydrogen is the desired end-product, then the CO content in the syngas can be shifted to H2 via the catalytic water-gas shift
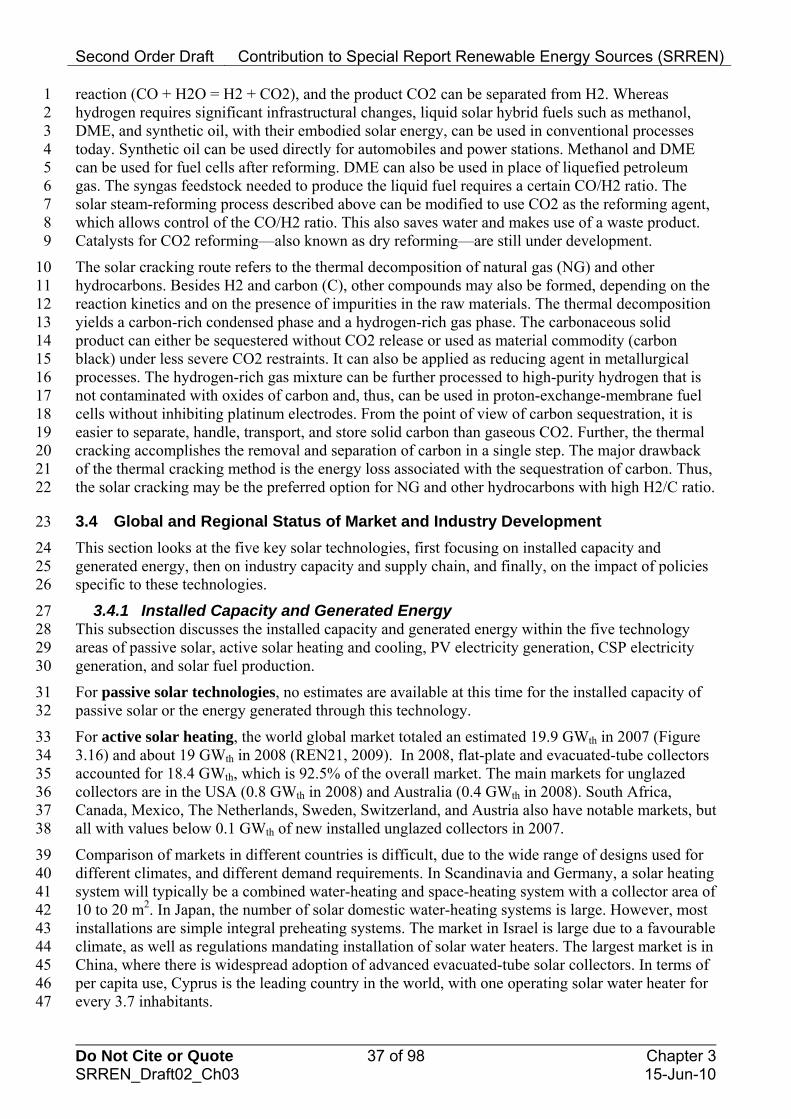
Second Order Draft Contribution to Special Report Renewable Energy Sources (SRREN)
Do Not Cite or Quote 37 of 98 Chapter 3 SRREN_Draft02_Ch03 15-Jun-10
1 2 3 4 5 6 7 8 9
10 11 12 13 14 15 16 17 18 19 20 21 22
24 25 26
27 28 29 30
31 32
33 34 35 36 37 38
39 40 41 42 43 44 45 46 47
reaction (CO + H2O = H2 + CO2), and the product CO2 can be separated from H2. Whereas hydrogen requires significant infrastructural changes, liquid solar hybrid fuels such as methanol, DME, and synthetic oil, with their embodied solar energy, can be used in conventional processes today. Synthetic oil can be used directly for automobiles and power stations. Methanol and DME can be used for fuel cells after reforming. DME can also be used in place of liquefied petroleum gas. The syngas feedstock needed to produce the liquid fuel requires a certain CO/H2 ratio. The solar steam-reforming process described above can be modified to use CO2 as the reforming agent, which allows control of the CO/H2 ratio. This also saves water and makes use of a waste product. Catalysts for CO2 reforming—also known as dry reforming—are still under development.
The solar cracking route refers to the thermal decomposition of natural gas (NG) and other hydrocarbons. Besides H2 and carbon (C), other compounds may also be formed, depending on the reaction kinetics and on the presence of impurities in the raw materials. The thermal decomposition yields a carbon-rich condensed phase and a hydrogen-rich gas phase. The carbonaceous solid product can either be sequestered without CO2 release or used as material commodity (carbon black) under less severe CO2 restraints. It can also be applied as reducing agent in metallurgical processes. The hydrogen-rich gas mixture can be further processed to high-purity hydrogen that is not contaminated with oxides of carbon and, thus, can be used in proton-exchange-membrane fuel cells without inhibiting platinum electrodes. From the point of view of carbon sequestration, it is easier to separate, handle, transport, and store solid carbon than gaseous CO2. Further, the thermal cracking accomplishes the removal and separation of carbon in a single step. The major drawback of the thermal cracking method is the energy loss associated with the sequestration of carbon. Thus, the solar cracking may be the preferred option for NG and other hydrocarbons with high H2/C ratio.
3.4 Global and Regional Status of Market and Industry Development 23
This section looks at the five key solar technologies, first focusing on installed capacity and generated energy, then on industry capacity and supply chain, and finally, on the impact of policies specific to these technologies.
3.4.1 Installed Capacity and Generated Energy This subsection discusses the installed capacity and generated energy within the five technology areas of passive solar, active solar heating and cooling, PV electricity generation, CSP electricity generation, and solar fuel production.
For passive solar technologies, no estimates are available at this time for the installed capacity of passive solar or the energy generated through this technology.
For active solar heating, the world global market totaled an estimated 19.9 GWth in 2007 (Figure 3.16) and about 19 GWth in 2008 (REN21, 2009). In 2008, flat-plate and evacuated-tube collectors accounted for 18.4 GWth, which is 92.5% of the overall market. The main markets for unglazed collectors are in the USA (0.8 GWth in 2008) and Australia (0.4 GWth in 2008). South Africa, Canada, Mexico, The Netherlands, Sweden, Switzerland, and Austria also have notable markets, but all with values below 0.1 GWth of new installed unglazed collectors in 2007.
Comparison of markets in different countries is difficult, due to the wide range of designs used for different climates, and different demand requirements. In Scandinavia and Germany, a solar heating system will typically be a combined water-heating and space-heating system with a collector area of 10 to 20 m2. In Japan, the number of solar domestic water-heating systems is large. However, most installations are simple integral preheating systems. The market in Israel is large due to a favourable climate, as well as regulations mandating installation of solar water heaters. The largest market is in China, where there is widespread adoption of advanced evacuated-tube solar collectors. In terms of per capita use, Cyprus is the leading country in the world, with one operating solar water heater for every 3.7 inhabitants.
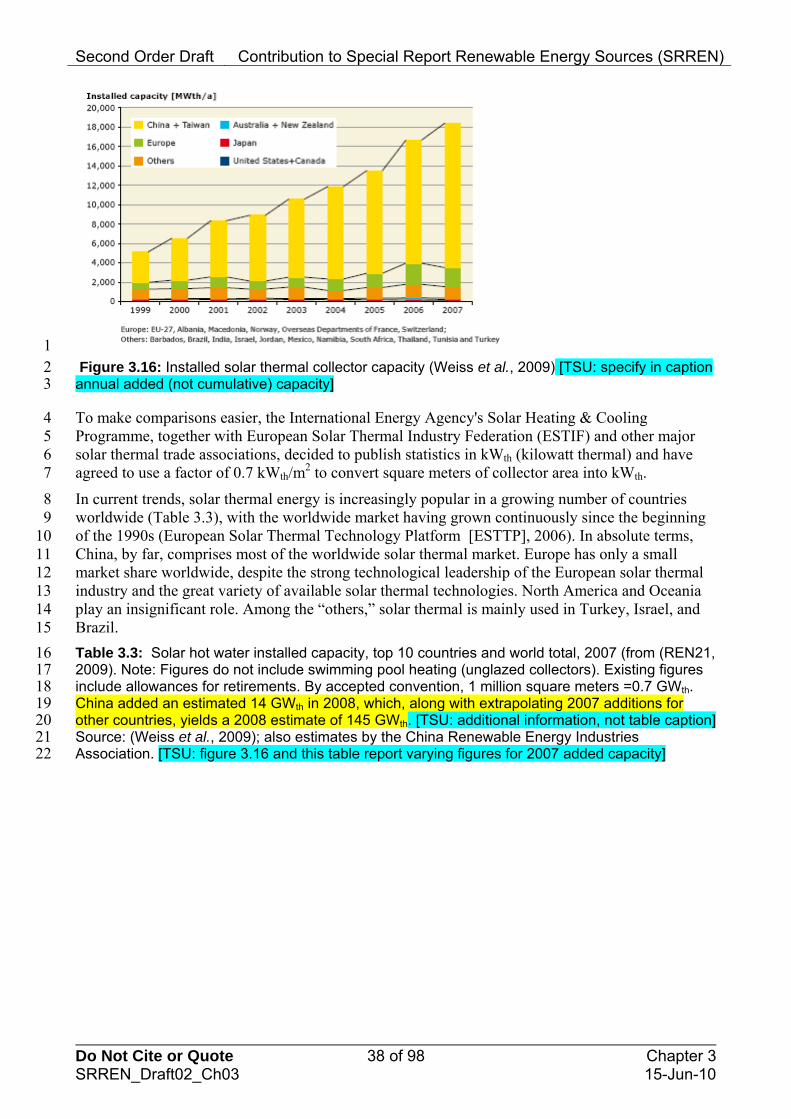
Second Order Draft Contribution to Special Report Renewable Energy Sources (SRREN)
Do Not Cite or Quote 38 of 98 Chapter 3 SRREN_Draft02_Ch03 15-Jun-10
1 Figure 3.16: Installed solar thermal collector capacity (Weiss et al., 2009) [TSU: specify in caption 2 annual added (not cumulative) capacity] 3
4 5 6 7
8 9
10 11 12 13 14 15
16 17 18
To make comparisons easier, the International Energy Agency's Solar Heating & Cooling Programme, together with European Solar Thermal Industry Federation (ESTIF) and other major solar thermal trade associations, decided to publish statistics in kWth (kilowatt thermal) and have agreed to use a factor of 0.7 kWth/m
2 to convert square meters of collector area into kWth.
In current trends, solar thermal energy is increasingly popular in a growing number of countries worldwide (Table 3.3), with the worldwide market having grown continuously since the beginning of the 1990s (European Solar Thermal Technology Platform [ESTTP], 2006). In absolute terms, China, by far, comprises most of the worldwide solar thermal market. Europe has only a small market share worldwide, despite the strong technological leadership of the European solar thermal industry and the great variety of available solar thermal technologies. North America and Oceania play an insignificant role. Among the “others,” solar thermal is mainly used in Turkey, Israel, and Brazil.
Table 3.3: Solar hot water installed capacity, top 10 countries and world total, 2007 (from (REN21, 2009). Note: Figures do not include swimming pool heating (unglazed collectors). Existing figures include allowances for retirements. By accepted convention, 1 million square meters =0.7 GWth. China added an estimated 14 GWth in 2008, which, along with extrapolating 2007 additions for 19 other countries, yields a 2008 estimate of 145 GWth. [TSU: additional information, not table caption] Source: (Weiss et al., 2009); also estimates by the China Renewable Energy Industries
20 21
Association. [TSU: figure 3.16 and this table report varying figures for 2007 added capacity] 22
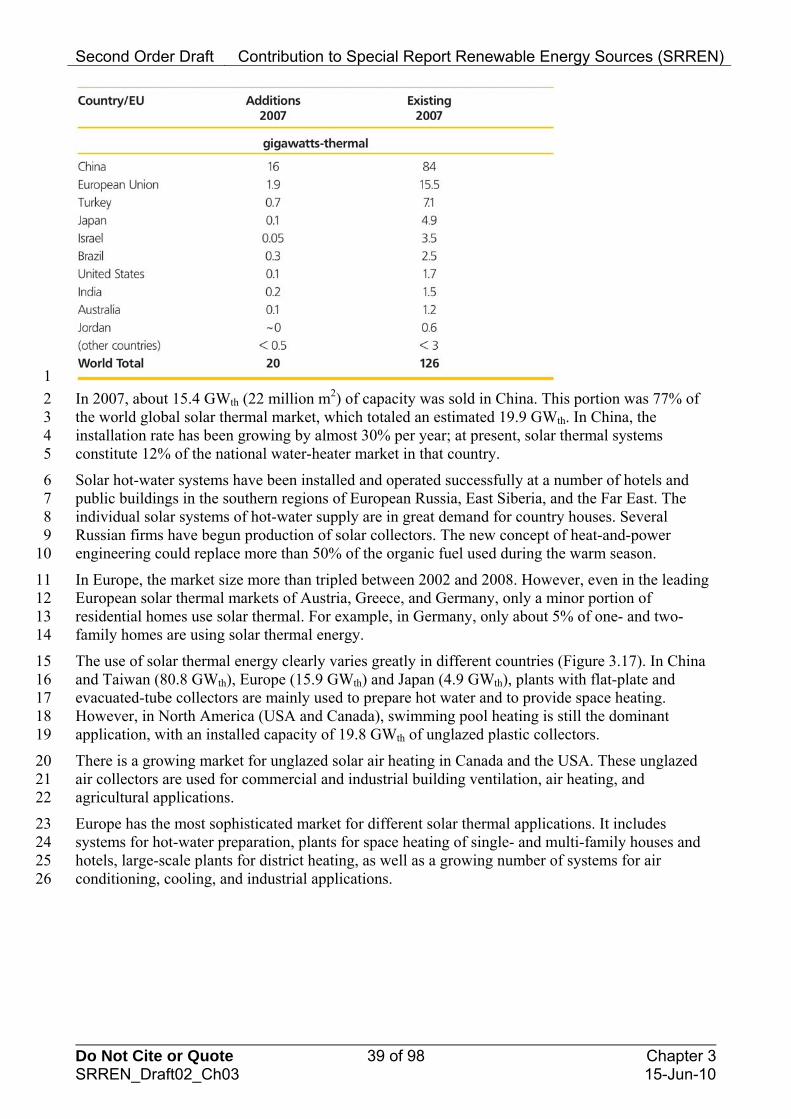
Second Order Draft Contribution to Special Report Renewable Energy Sources (SRREN)
Do Not Cite or Quote 39 of 98 Chapter 3 SRREN_Draft02_Ch03 15-Jun-10
1
2 3 4 5
6 7 8 9
10
11 12 13 14
15 16 17 18 19
20 21 22
23 24 25 26
In 2007, about 15.4 GWth (22 million m2) of capacity was sold in China. This portion was 77% of the world global solar thermal market, which totaled an estimated 19.9 GWth. In China, the installation rate has been growing by almost 30% per year; at present, solar thermal systems constitute 12% of the national water-heater market in that country.
Solar hot-water systems have been installed and operated successfully at a number of hotels and public buildings in the southern regions of European Russia, East Siberia, and the Far East. The individual solar systems of hot-water supply are in great demand for country houses. Several Russian firms have begun production of solar collectors. The new concept of heat-and-power engineering could replace more than 50% of the organic fuel used during the warm season.
In Europe, the market size more than tripled between 2002 and 2008. However, even in the leading European solar thermal markets of Austria, Greece, and Germany, only a minor portion of residential homes use solar thermal. For example, in Germany, only about 5% of one- and two-family homes are using solar thermal energy.
The use of solar thermal energy clearly varies greatly in different countries (Figure 3.17). In China and Taiwan (80.8 GWth), Europe (15.9 GWth) and Japan (4.9 GWth), plants with flat-plate and evacuated-tube collectors are mainly used to prepare hot water and to provide space heating. However, in North America (USA and Canada), swimming pool heating is still the dominant application, with an installed capacity of 19.8 GWth of unglazed plastic collectors.
There is a growing market for unglazed solar air heating in Canada and the USA. These unglazed air collectors are used for commercial and industrial building ventilation, air heating, and agricultural applications.
Europe has the most sophisticated market for different solar thermal applications. It includes systems for hot-water preparation, plants for space heating of single- and multi-family houses and hotels, large-scale plants for district heating, as well as a growing number of systems for air conditioning, cooling, and industrial applications.
Second Order Draft Contribution to Special Report Renewable Energy Sources (SRREN)
Do Not Cite or Quote 40 of 98 Chapter 3 SRREN_Draft02_Ch03 15-Jun-10
1 2 3
4 5 6 7 8 9
10 11 12
13 14 15 16 17
18 19 20 21 22 23
24 25 26 27
28 29 30 31
32 33
Figure 3.17: Total capacity in operation of water collectors of the 10 leading countries at the end of 2007 (Weiss et al., 2009).
The solar thermal market in the EU and Switzerland showed strong performance in 2008, growing by 60% to 3.3 GWth of new capacity (4.75 million m2 of collector area). The biggest push clearly came from the German market, which more than doubled. However, demand for solar thermal technology also grew strongly in smaller markets. Although in comparison the Austrian growth rate of 24% seems almost modest, the newly installed capacity per capita reached 29 kWth per 1 000—surpassed only by Cyprus’ 61 kWth per 1 000 capita. Despite Austria having rather average potential with respect to its climate, building stock, and prevailing heating systems, it is more than six times ahead of the EU average, and 10 to 40 times ahead of most other countries—including those with high potential such as Italy, Spain, and France.
With 2.1 million m2 of newly installed capacity, the German domestic market increased its share of the European market (EU27 + Switzerland) to 44% in 2008. Spain, Italy, and France overtook Greece, which was in second position in 2007. Together, these six countries currently account for 84% of Europe’s solar thermal market (for comparison, these countries account for only 54% of Europe’s population and 61% of its gross domestic product).
These huge gaps between neighbouring countries are not due to dramatically different technological barriers or objective conditions. Rather, the gaps are mainly due to market dynamics and conditions related to the political framework. Even in Austria, with its comparatively large stock of solar thermal capacity, there is not the slightest indication of market saturation. If the current trend in the Austrian solar thermal market continues, Austria will reach the per capita level of Cyprus in less than a decade.
At present, other European countries such as Spain, France, Italy, and the UK are also systematically developing their solar thermal markets. However, both within Europe and at a global level, solar thermal market development has previously been characterized by huge gaps between a small number of front-runner countries and a large number of countries still in the starting blocks.
Another segment of the solar thermal market is solar pool heating using plastic unglazed absorbers. This market is dominated by the USA, where 2007 shipments of solar pool-heater collectors totaled 785 MWth, with 57% of the installations in Hawaii and Florida (Energy Information Administration [DOE], 2008).
Advanced applications such as solar cooling and air conditioning (Henning, 2004; Henning, 2007), industrial applications (POSHIP Potential of Solar Heat for Industrial Processes, 2001), and
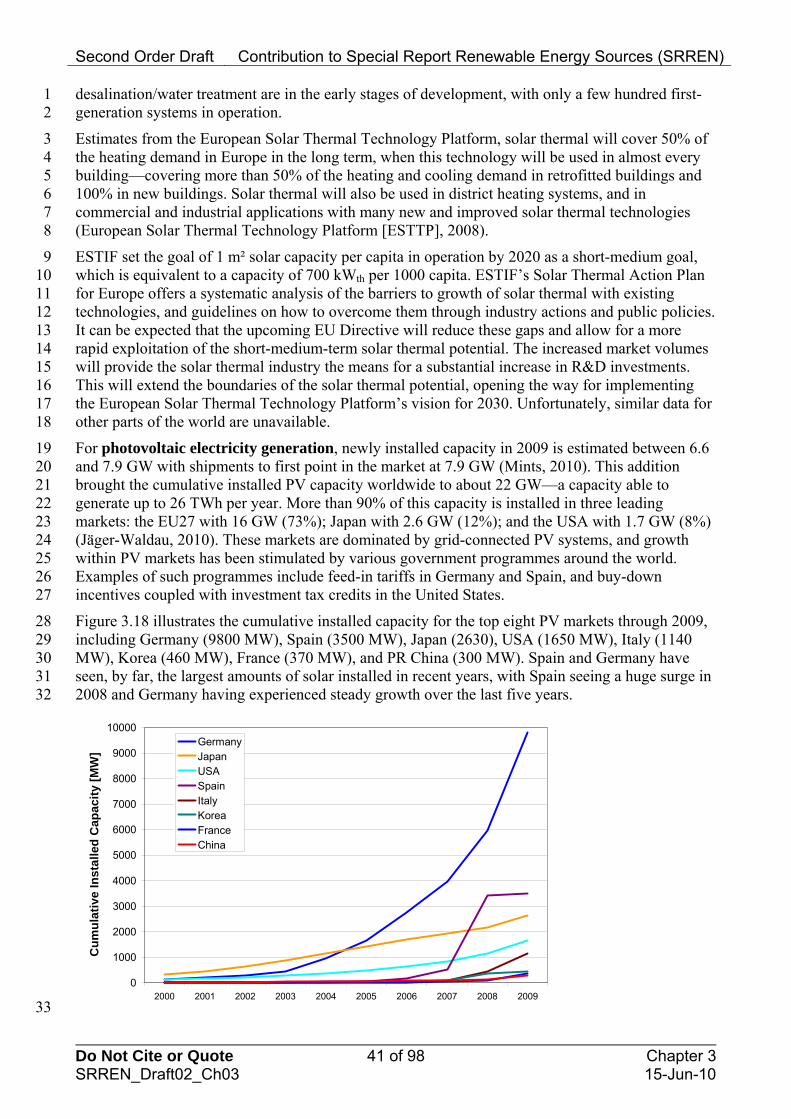
Second Order Draft Contribution to Special Report Renewable Energy Sources (SRREN)
Do Not Cite or Quote 41 of 98 Chapter 3 SRREN_Draft02_Ch03 15-Jun-10
1 2
3 4 5 6 7 8
9 10 11 12 13 14 15 16 17 18
19 20 21 22 23 24 25 26 27
28 29 30 31 32
desalination/water treatment are in the early stages of development, with only a few hundred first-generation systems in operation.
Estimates from the European Solar Thermal Technology Platform, solar thermal will cover 50% of the heating demand in Europe in the long term, when this technology will be used in almost every building—covering more than 50% of the heating and cooling demand in retrofitted buildings and 100% in new buildings. Solar thermal will also be used in district heating systems, and in commercial and industrial applications with many new and improved solar thermal technologies (European Solar Thermal Technology Platform [ESTTP], 2008).
ESTIF set the goal of 1 m² solar capacity per capita in operation by 2020 as a short-medium goal, which is equivalent to a capacity of 700 kWth per 1000 capita. ESTIF’s Solar Thermal Action Plan for Europe offers a systematic analysis of the barriers to growth of solar thermal with existing technologies, and guidelines on how to overcome them through industry actions and public policies. It can be expected that the upcoming EU Directive will reduce these gaps and allow for a more rapid exploitation of the short-medium-term solar thermal potential. The increased market volumes will provide the solar thermal industry the means for a substantial increase in R&D investments. This will extend the boundaries of the solar thermal potential, opening the way for implementing the European Solar Thermal Technology Platform’s vision for 2030. Unfortunately, similar data for other parts of the world are unavailable.
For photovoltaic electricity generation, newly installed capacity in 2009 is estimated between 6.6 and 7.9 GW with shipments to first point in the market at 7.9 GW (Mints, 2010). This addition brought the cumulative installed PV capacity worldwide to about 22 GW—a capacity able to generate up to 26 TWh per year. More than 90% of this capacity is installed in three leading markets: the EU27 with 16 GW (73%); Japan with 2.6 GW (12%); and the USA with 1.7 GW (8%) (Jäger-Waldau, 2010). These markets are dominated by grid-connected PV systems, and growth within PV markets has been stimulated by various government programmes around the world. Examples of such programmes include feed-in tariffs in Germany and Spain, and buy-down incentives coupled with investment tax credits in the United States.
Figure 3.18 illustrates the cumulative installed capacity for the top eight PV markets through 2009, including Germany (9800 MW), Spain (3500 MW), Japan (2630), USA (1650 MW), Italy (1140 MW), Korea (460 MW), France (370 MW), and PR China (300 MW). Spain and Germany have seen, by far, the largest amounts of solar installed in recent years, with Spain seeing a huge surge in 2008 and Germany having experienced steady growth over the last five years.
0
1000
2000
3000
4000
5000
6000
7000
8000
9000
10000
2000 2001 2002 2003 2004 2005 2006 2007 2008 2009
Cu
mu
lati
ve In
sta
lled
Cap
acit
y [M
W]
GermanyJapanUSASpainItalyKoreaFranceChina
33
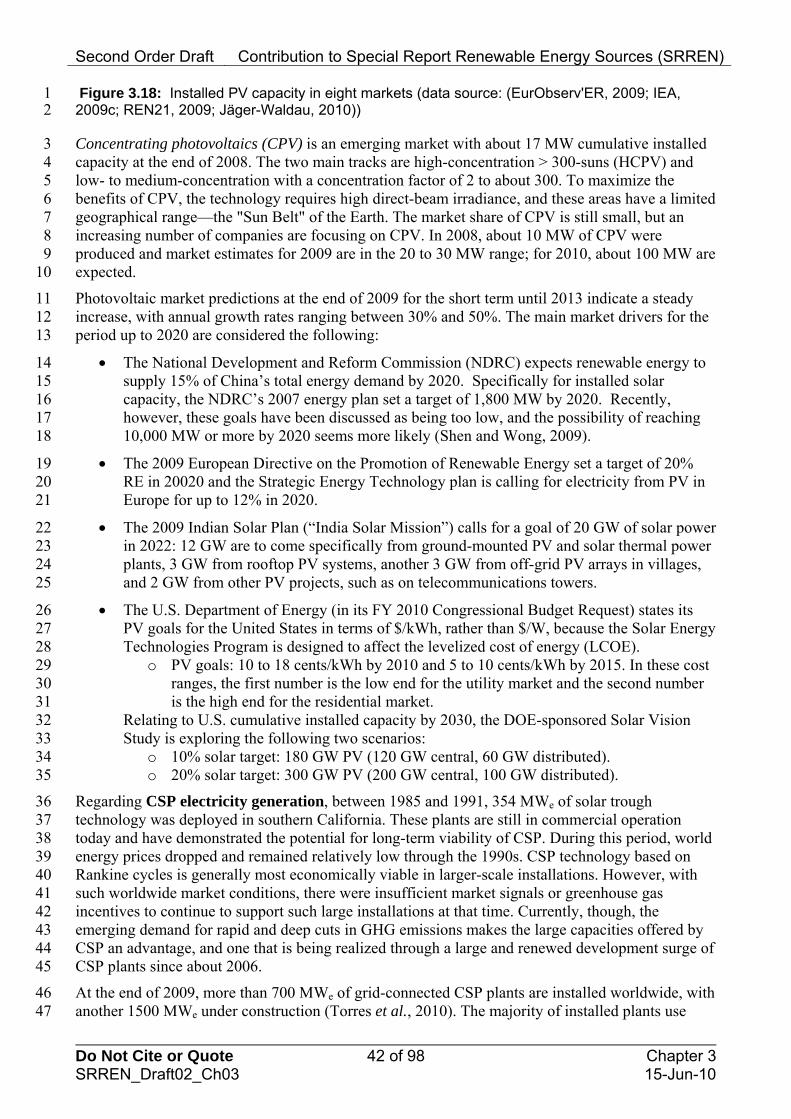
Second Order Draft Contribution to Special Report Renewable Energy Sources (SRREN)
Do Not Cite or Quote 42 of 98 Chapter 3 SRREN_Draft02_Ch03 15-Jun-10
1 2
3 4 5 6 7 8 9
10
11 12 13
14 15 16 17 18
19 20 21
22 23 24 25
26 27 28 29 30 31 32 33 34 35
36 37 38 39 40 41 42 43 44 45
46 47
Figure 3.18: Installed PV capacity in eight markets (data source: (EurObserv'ER, 2009; IEA, 2009c; REN21, 2009; Jäger-Waldau, 2010))
Concentrating photovoltaics (CPV) is an emerging market with about 17 MW cumulative installed capacity at the end of 2008. The two main tracks are high-concentration > 300-suns (HCPV) and low- to medium-concentration with a concentration factor of 2 to about 300. To maximize the benefits of CPV, the technology requires high direct-beam irradiance, and these areas have a limited geographical range—the "Sun Belt" of the Earth. The market share of CPV is still small, but an increasing number of companies are focusing on CPV. In 2008, about 10 MW of CPV were produced and market estimates for 2009 are in the 20 to 30 MW range; for 2010, about 100 MW are expected.
Photovoltaic market predictions at the end of 2009 for the short term until 2013 indicate a steady increase, with annual growth rates ranging between 30% and 50%. The main market drivers for the period up to 2020 are considered the following:
The National Development and Reform Commission (NDRC) expects renewable energy to supply 15% of China’s total energy demand by 2020. Specifically for installed solar capacity, the NDRC’s 2007 energy plan set a target of 1,800 MW by 2020. Recently, however, these goals have been discussed as being too low, and the possibility of reaching 10,000 MW or more by 2020 seems more likely (Shen and Wong, 2009).
The 2009 European Directive on the Promotion of Renewable Energy set a target of 20% RE in 20020 and the Strategic Energy Technology plan is calling for electricity from PV in Europe for up to 12% in 2020.
The 2009 Indian Solar Plan (“India Solar Mission”) calls for a goal of 20 GW of solar power in 2022: 12 GW are to come specifically from ground-mounted PV and solar thermal power plants, 3 GW from rooftop PV systems, another 3 GW from off-grid PV arrays in villages, and 2 GW from other PV projects, such as on telecommunications towers.
The U.S. Department of Energy (in its FY 2010 Congressional Budget Request) states its PV goals for the United States in terms of $/kWh, rather than $/W, because the Solar Energy Technologies Program is designed to affect the levelized cost of energy (LCOE).
o PV goals: 10 to 18 cents/kWh by 2010 and 5 to 10 cents/kWh by 2015. In these cost ranges, the first number is the low end for the utility market and the second number is the high end for the residential market.
Relating to U.S. cumulative installed capacity by 2030, the DOE-sponsored Solar Vision Study is exploring the following two scenarios:
o 10% solar target: 180 GW PV (120 GW central, 60 GW distributed). o 20% solar target: 300 GW PV (200 GW central, 100 GW distributed).
Regarding CSP electricity generation, between 1985 and 1991, 354 MWe of solar trough technology was deployed in southern California. These plants are still in commercial operation today and have demonstrated the potential for long-term viability of CSP. During this period, world energy prices dropped and remained relatively low through the 1990s. CSP technology based on Rankine cycles is generally most economically viable in larger-scale installations. However, with such worldwide market conditions, there were insufficient market signals or greenhouse gas incentives to continue to support such large installations at that time. Currently, though, the emerging demand for rapid and deep cuts in GHG emissions makes the large capacities offered by CSP an advantage, and one that is being realized through a large and renewed development surge of CSP plants since about 2006.
At the end of 2009, more than 700 MWe of grid-connected CSP plants are installed worldwide, with another 1500 MWe under construction (Torres et al., 2010). The majority of installed plants use
Second Order Draft Contribution to Special Report Renewable Energy Sources (SRREN)
Do Not Cite or Quote 43 of 98 Chapter 3 SRREN_Draft02_Ch03 15-Jun-10
1 2 3
4 5 6 7 8 9
10 11 12 13 14
15 16 17 18 19 20 21
22 23
parabolic trough technology. Central-receiver technology comprises a growing share of plants under construction and those announced. The bulk of the operating capacity is installed in Spain and the southwestern United States.
In 2007, after more than 15 years, the first new major CSP plants came on line with Nevada Solar One (64 MWe, USA) and PS10 (11 MWe, Spain). In Spain, successive Royal Decree’s have been in place since 2004 and have stimulated the CSP industry in that country. Royal Decree 661/2007 has been a major driving force for CSP plant construction and expansion plans. As of November 2009, 2,340 MWe of CSP projects have been preregistered for the tariff provisions of the Royal Decree. In the USA, more than 4,500 MWe of CSP are currently under power purchase agreement contracts. The different contracts specify when the projects must start delivering electricity between 2010 and 2014 (Kautto and Jäger-Waldau, 2009). More than 10,000 MWe of new CSP plants have been proposed in the USA. More than fifty CSP electricity projects are currently in the planning phase, mainly in North Africa, Spain, and the USA. In Australia, the federal government has called for 1,000 MWe of new solar plants, covering both CSP and PV, under the Solar Flagships program.
Hybrid solar/fossil plants have received much greater attention in recent years, and several integrated solar combined-cycle (ISCC) projects are now under construction in the Mediterranean region and the USA. In Algeria, Abengoa Solar is building the first such project consisting of a 150-MWe ISCC system with 30-MWe solar capacity. A similar project is under construction in Morocco where Abengoa Solar has been selected to build the plant. In Italy, another example of an ISCC project is Archimede; however, the plant’s 31,000-m2 parabolic trough solar field will be the first to use molten salt as the heat-transfer fluid (SolarPACES, 2009a).
Figure 3.19 shows the current and planned developments to add more CSP capacity in the near future.
0
500
1000
1500
2000
2500
3000
3500
4000
4500
1990 2000 2006 2007 2008 2009 2010 2011/2
Inst
alle
d C
apac
ity
[MW
]
USA Spain Australia
Italy Abu Dabi Marocco
Algeria Egypt Israel
24 25 26
27 28 29 30 31 32 33
Figure 3.19: Installed and planned concentrated solar thermal electricity plants by country. (Kautto and Jäger-Waldau, 2009)
The average capital investment costs for a CSP plant vary substantially from plant to plant due to the level of integrated thermal storage. Plants with storage cost more due to the storage itself, as well as the additional collector area needed to charge the storage. However, storage also increases the annual capacity factor, so the LCOE can be lower. But even if storage caused the LCOE to increase marginally, this increase could be more than recovered by the ability to dispatch electricity at times of peak tariffs in the market. Thus, a strategic approach to storage can improve a project’s internal rate of return.

Second Order Draft Contribution to Special Report Renewable Energy Sources (SRREN)
Do Not Cite or Quote 44 of 98 Chapter 3 SRREN_Draft02_Ch03 15-Jun-10
1 2 3
5 6 7 8
10 11 12 13 14 15 16 17 18 19 20 21 22 23 24
25 26 27 28 29 30 31 32 33
34 35 36 37 38
39 40 41 42 43
44 45 46
The U.S. Department of Energy (in its FY 2010 Congressional Budget Request) states its CSP goals for the United States in terms of $/kWh, rather than $/W, because the Solar Energy Technologies Program is designed to affect the levelized cost of energy (LCOE) and includes significant storage.
CSP goals: 10 to 12 cents/kWh by 2010, 7 to 9 cents/kWh (with 6 hours of thermal storage) 4 by 2015, and 5 to 7 cents/kWh (with 12 to 17 hours of thermal storage) by 2020.
Relating to U.S. cumulative installed capacity by 2030, the DOE-sponsored Solar Vision Study is exploring the following two scenarios:
10% solar target: 75 GW CSP 9 20% solar target: 120 GW CSP.
Solar fuels production technologies are in an earlier stage of development than solar thermal electricity production using CSP. Typically, the high-temperature solar reactor technology is being developed at laboratory scale of 1–10 kWth solar power input. Scaling up thermochemical processes for hydrogen production to the 100 kWth power level is reported for a medium-temperature mixed iron oxide cycle (800°–1200°C) (Roeb et al., 2006; Roeb et al., 2009) and for the high-temperature ZnO dissociation reaction at above 1700°C (Schunk et al., 2008; Schunk et al., 2009). Pilot plants in the power range of 300–500 kWth have been built for the carbothermic reduction of ZnO (Epstein et al., 2008), the steam methane reforming of methane (Moller et al., 2006), and the steam gasification of petcoke (Z'Graggen and Steinfeld, 2008). Solar-to-gas has been demonstrated in a 30-kW scale to drive a commercial natural gas vehicle, applying a nickel catalyst (Specht et al., 2010). Demonstration at the MW scale should be warranted before erecting commercial solar chemical plants for fuels production, which are expected to be available only after 2020 (Pregger et al., 2009).
Direct conversion of solar energy to fuel is not yet widely demonstrated or commercialized. But two options appear commercially feasible in the near to medium term: 1) the solar hybrid fuel production system (including solar methane reforming, and solar biomass reforming), and 2) PV- or CSP-solar electrolysis. These technologies are keys for reducing GHG emissions by solar fuel conversion. During the transition to a sustainable energy system, fossil fuels and concentrated solar energy are both used to produce solarized fuels. Thus, solar energy can begin to make an impact in non-electricity markets. As experience with high-temperature thermochemical technology is developed in the market place, the use of fossil fuels can be phased out and pure solar fuels can be introduced.
Australia’s Commonwealth Scientific and Industrial Research Organisation (CSIRO) is running a 250-kWth reactor and plans to build a 4-MWchemical demonstration plant using solar steam-reforming technology, with an eventual move to CO2 reforming for higher performance and less water usage. With such a system, liquid solar fuels can be produced in sunbelts such as Australia and solar energy shipped on a commercial basis to Asia and beyond.
Oxygen (O2) gas produced by solar electrolysis (PV or CSP) can be used for coal gasification and partial oxidation of natural gas. With the combined process of the solar electrolysis and partial oxidation of coal or methane, about 10% to 15% of solar energy is incorporated theoretically into the methanol or DME. Also, the production cost of the solar hybrid fuel can be lowered compared to the solar hydrogen produced by the solar electrolysis process only.
At favourable solar sites with direct-normal irradiance (DNI) exceeding 2300 kWh/m2/year, the equivalent of about 9.2 TWh (33.1 PJ) in the form of solar fuel can be produced by a system having 10% efficiency and equipped with a distributed collector area of 200 km × 200 km.

Second Order Draft Contribution to Special Report Renewable Energy Sources (SRREN)
Do Not Cite or Quote 45 of 98 Chapter 3 SRREN_Draft02_Ch03 15-Jun-10
2 3 4
5 6
7 8 9
10 11 12 13 14 15 16 17 18 19 20
21 22 23 24 25
26 27 28 29 30 31 32 33 34 35 36
37 38 39 40 41 42 43 44 45 46 47
3.4.2 Industry Capacity and Supply Chain 1 This subsection discusses the industry capacity and supply chain within the five technology areas of passive solar, active solar heating and cooling, PV electricity generation, CSP electricity generation, and solar fuel production.
We first discuss industry capacity and supply chain issues of passive solar technologies within the areas of the overall building industry, windows, and thermal storage.
The building industry in most countries is fragmented and often characterized by a piecemeal approach to building design, construction, and operation. The integration of passive solar systems with the active heating/cooling air-conditioning systems both in the design and operation stages of the building is essential to achieve good comfort conditions while saving energy. However, this is usually overlooked because of the absence of any systematic collaboration for integrating building design between architects and engineers. Thus, the architect often designs the building envelope based solely on qualitative passive solar design principles, and the engineer often designs the heating-ventilation-air-conditioning (HVAC) system based on extreme design conditions without factoring in the benefits due to solar gains and natural cooling. The result may be an oversized system and inappropriate controls incompatible with the passive system and that can cause overheating and discomfort (Athienitis and Santamouris, 2002). Collaboration between the disciplines involved in building design is improving with the adoption of computer tools. But fundamental institutional barriers remain due to the basic training of architects and engineers, which does not foster an integrated design approach.
The design of high-mass buildings with significant near-equatorial-facing window areas is common in some areas of the world such as Southern Europe. However, a systematic approach to designing such buildings is still not widely employed. This is changing with the introduction of the passive house standard in Germany and other countries (PassivHaus Planning Package [PHPP], 2004; CEPHEUS, 2009)
Glazing and window technologies have progressed tremendously in the last twenty years (Hollands et al., 2001). New-generation windows result in low energy losses, high daylight efficiency, solar shading, and noise reduction. However, selection of the proper glazing for a building is a trade-off between the cooling, heating, and lighting requirements. Different window materials or technologies improves lighting vs. heating or cooling. New technologies such as transparent photovoltaics and electrochromic windows provide many possibilities in the design of solar houses and offices with abundant daylight. Triple-glazed, low-emissivity, argon-filled windows with efficient framing were used in the EQuilibriumTM demonstration houses, and they are expected to become more common in climates with cold winters. The change from regular double-glazed to double-glazed low-emissivity argon windows is presently occurring in Canada and is accelerated by the rapid drop in prices of these windows.
The primary materials for low-temperature thermal storage in passive solar systems are concrete, bricks, and water. A review of thermal storage materials is given by (Hadorn, 2008) under IEA SHC Task 32, focusing on a comparison of the different technologies. Phase-change material (PCM) thermal storage (Mehling and Cabeza, 2008) is particularly promising in the design, control, and load management of solar buildings because it reduces the need for structural reinforcement needed for heavier traditional sensible storage in concrete-type construction. Recent developments facilitating integration include microencapsulated PCM that can be mixed with plaster and applied to interior surfaces (Schossig et al., 2004). PCM in microencapsulated polymers are now on the market and can be added to plaster, gypsum, or concrete to enhance the thermal capacity of a room. For renovation, they provide a good alternative to new heavy walls, which would require additional structural support (Hadorn, 2008).
Second Order Draft Contribution to Special Report Renewable Energy Sources (SRREN)
Do Not Cite or Quote 46 of 98 Chapter 3 SRREN_Draft02_Ch03 15-Jun-10
1 2 3 4 5 6 7 8
9 10 11 12 13
14 15 16
17 18 19 20
21 22 23 24 25 26
27 28 29 30 31
32 33 34 35 36
37 38 39
40 41 42 43 44 45
In spite of the advances in PCM, concrete has certain advantages for thermal storage when a massive building design approach is used, as in many of the Mediterranean countries. In this approach, the concrete also serves as the structure of the building and is thus likely more cost effective than thermal storage without this added function. The EcoTerra house includes a hollow-core concrete floor slab in the basement that is actively charged with solar-heated air from its roof-integrated photovoltaic/thermal system; but the release of the heat is passive, so this is hybrid thermal storage. A combination of passive and active thermal storage may enable the use of more solar gain and facilitate reaching the net-zero energy goal in a more cost-effective manner.
The next technology we look at is active solar heating and cooling. Due to the different application modes—including domestic hot water, heating, preheating, and combined systems, as well as varying climatic conditions—a number of different collector technologies and system approaches have been developed, according to the European Solar Thermal Technology Platform, “Solar Heating and Cooling for a Sustainable Energy Future in Europe.”
Flat-plate collectors comprise more than 80% of the worldwide installed systems. In 2007, a worldwide installed capacity of 19.9 GWth corresponded to 28.4 million m2 of solar collectors. Flat-plate and evacuated-tube collectors accounted for 18.4 GWth, which is 92.5% of the overall market.
It is remarkable that the market of evacuated-tube collectors grew 23.4% compared to 2006, whereas the markets of flat-plate collectors and unglazed collectors decreased 18.3% and 7.2%, respectively. However, data of installed unglazed collectors are officially collected in only a few countries.
In some parts of the production process, such as selective coatings, large-scale industrial production levels have been attained. A number of different materials, including copper, aluminium, and stainless steel, are applied and combined with different welding technologies to achieve a highly efficient heat-exchange process in the collector. The materials used for the cover glass are structured or flat, low-iron glass. The first antireflection coatings are coming onto the market on an industrial scale, leading to efficiency improvements of about 5%.
In general, vacuum-tube collectors are more efficient, especially for higher-temperature applications. The production of vacuum-tube collectors is currently dominated by the Chinese Dewar tubes, where a metallic heat exchanger is integrated to connect them with the conventional hot-water systems. In addition, some standard vacuum-tube collectors, with metallic heat absorbers, are on the market.
The largest exporters of solar heaters are Australia, Greece, and the USA. The majority of exports from Greece are to Cyprus and the near-Mediterranean area. France also exports a substantial number of systems to its overseas territories. The majority of USA exports are to the Caribbean region. Australian companies export about 50% of production (mainly thermosyphon systems with external horizontal tanks) to most of the areas of the world that do not have hard-freeze conditions.
In this next section, we look at PV electricity generation and discuss the industry capacity and supply chain issues of photovoltaic technologies under the areas of overall solar cell production, thin-film module production, and polysilicon production.
The development characteristic of the photovoltaic sector is much different than the traditional power sector. It more closely resembles the semiconductor market, with annual growth rates between 40% to 50% and a high learning rate. Therefore, scientific and peer-reviewed papers can be several years behind the actual market developments due to the nature of statistical time delays and data consolidation. The only way to keep track of such a dynamic market is to use commercial market data. Global PV cell production reached more than 10 GW in 2009. The estimates of the
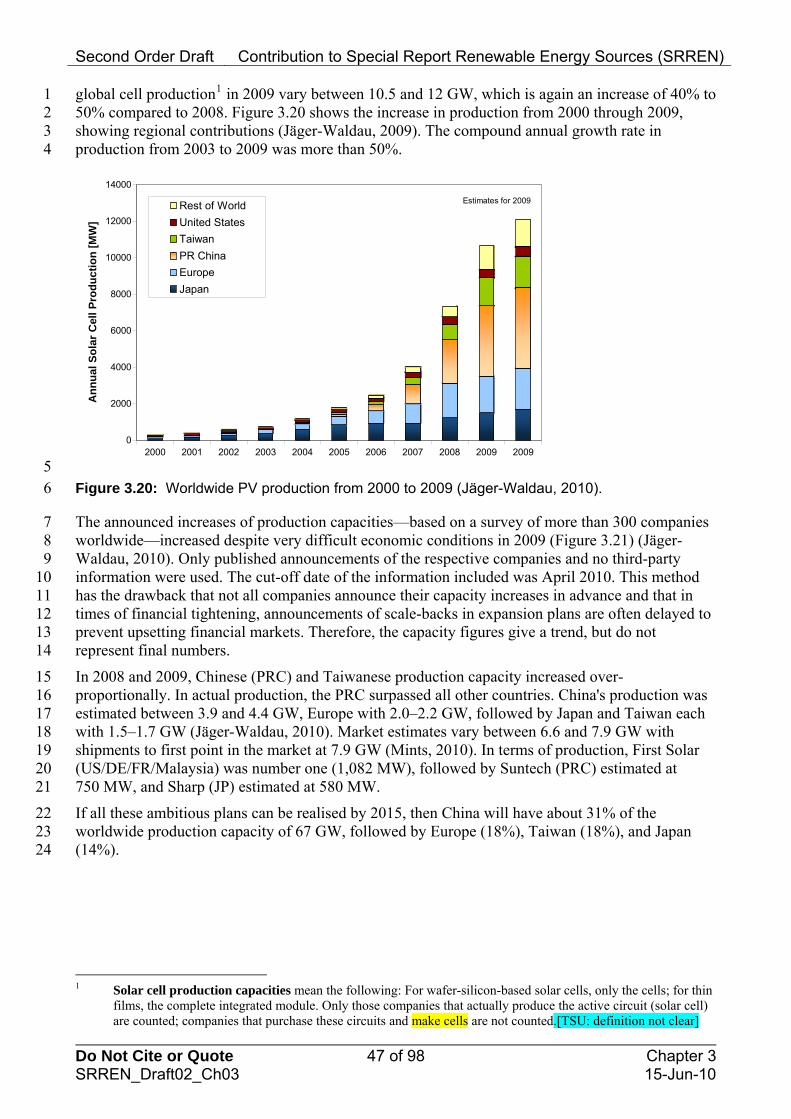
Second Order Draft Contribution to Special Report Renewable Energy Sources (SRREN)
Do Not Cite or Quote 47 of 98 Chapter 3 SRREN_Draft02_Ch03 15-Jun-10
1 2 3 4
global cell production1 in 2009 vary between 10.5 and 12 GW, which is again an increase of 40% to 50% compared to 2008. Figure 3.20 shows the increase in production from 2000 through 2009, showing regional contributions (Jäger-Waldau, 2009). The compound annual growth rate in production from 2003 to 2009 was more than 50%.
0
2000
4000
6000
8000
10000
12000
14000
An
nu
al S
ola
r C
ell
Pro
du
cti
on
[M
W]
2000 2001 2002 2003 2004 2005 2006 2007 2008 2009 2009
Rest of World
United States
Taiwan
PR China
Europe
Japan
Estimates for 2009
5 6
7 8 9
10 11 12 13 14
15 16 17 18 19 20 21
22 23 24
Figure 3.20: Worldwide PV production from 2000 to 2009 (Jäger-Waldau, 2010).
The announced increases of production capacities—based on a survey of more than 300 companies worldwide—increased despite very difficult economic conditions in 2009 (Figure 3.21) (Jäger-Waldau, 2010). Only published announcements of the respective companies and no third-party information were used. The cut-off date of the information included was April 2010. This method has the drawback that not all companies announce their capacity increases in advance and that in times of financial tightening, announcements of scale-backs in expansion plans are often delayed to prevent upsetting financial markets. Therefore, the capacity figures give a trend, but do not represent final numbers.
In 2008 and 2009, Chinese (PRC) and Taiwanese production capacity increased over-proportionally. In actual production, the PRC surpassed all other countries. China's production was estimated between 3.9 and 4.4 GW, Europe with 2.0–2.2 GW, followed by Japan and Taiwan each with 1.5–1.7 GW (Jäger-Waldau, 2010). Market estimates vary between 6.6 and 7.9 GW with shipments to first point in the market at 7.9 GW (Mints, 2010). In terms of production, First Solar (US/DE/FR/Malaysia) was number one (1,082 MW), followed by Suntech (PRC) estimated at 750 MW, and Sharp (JP) estimated at 580 MW.
If all these ambitious plans can be realised by 2015, then China will have about 31% of the worldwide production capacity of 67 GW, followed by Europe (18%), Taiwan (18%), and Japan (14%).
1 Solar cell production capacities mean the following: For wafer-silicon-based solar cells, only the cells; for thin
films, the complete integrated module. Only those companies that actually produce the active circuit (solar cell) are counted; companies that purchase these circuits and make cells are not counted.[TSU: definition not clear]
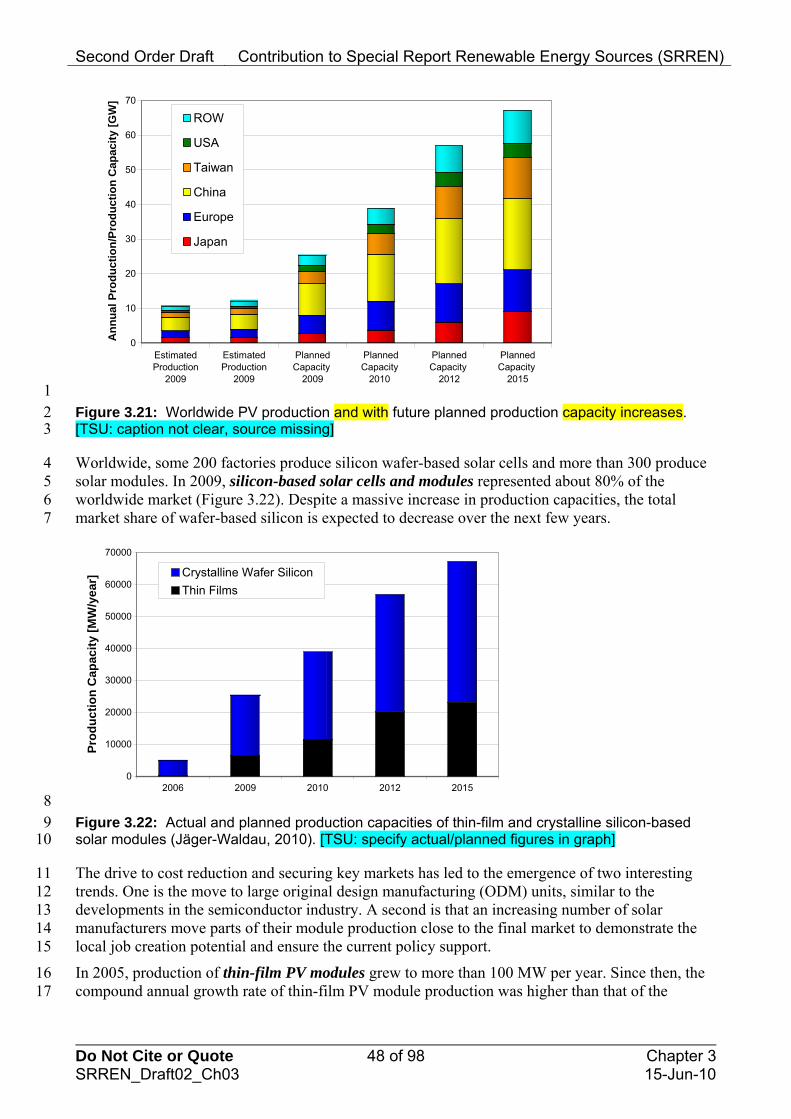
Second Order Draft Contribution to Special Report Renewable Energy Sources (SRREN)
Do Not Cite or Quote 48 of 98 Chapter 3 SRREN_Draft02_Ch03 15-Jun-10
0
10
20
30
40
50
60
70A
nn
ual
Pro
du
ctio
n/P
rod
uct
ion
Cap
acit
y [G
W]
EstimatedProduction
2009
EstimatedProduction
2009
PlannedCapacity
2009
PlannedCapacity
2010
PlannedCapacity
2012
PlannedCapacity
2015
ROW
USA
Taiwan
China
Europe
Japan
1 Figure 3.21: Worldwide PV production and with future planned production capacity increases. 2 [TSU: caption not clear, source missing] 3
4 5 6 7
Worldwide, some 200 factories produce silicon wafer-based solar cells and more than 300 produce solar modules. In 2009, silicon-based solar cells and modules represented about 80% of the worldwide market (Figure 3.22). Despite a massive increase in production capacities, the total market share of wafer-based silicon is expected to decrease over the next few years.
0
10000
20000
30000
40000
50000
60000
70000
Pro
du
cti
on
Cap
acit
y [M
W/y
ear
]
2006 2009 2010 2012 2015
Crystalline Wafer Silicon
Thin Films
8 9 Figure 3.22: Actual and planned production capacities of thin-film and crystalline silicon-based
solar modules (Jäger-Waldau, 2010). [TSU: specify actual/planned figures in graph] 10
11 12 13 14 15
16 17
The drive to cost reduction and securing key markets has led to the emergence of two interesting trends. One is the move to large original design manufacturing (ODM) units, similar to the developments in the semiconductor industry. A second is that an increasing number of solar manufacturers move parts of their module production close to the final market to demonstrate the local job creation potential and ensure the current policy support.
In 2005, production of thin-film PV modules grew to more than 100 MW per year. Since then, the compound annual growth rate of thin-film PV module production was higher than that of the

Second Order Draft Contribution to Special Report Renewable Energy Sources (SRREN)
Do Not Cite or Quote 49 of 98 Chapter 3 SRREN_Draft02_Ch03 15-Jun-10
1 2
3 4 5 6 7 8 9
10 11 12 13 14
15 16 17 18 19 20 21 22 23 24 25
26 27 28
29 30 31
32 33 34 35 36 37
38 39 40 41
42 43 44 45 46
industry, thus increasing the market share of thin-film products from 6% in 2005 to about 20% in 2009. Most of this thin-film share comes from the largest PV company.
More than 150 companies are involved in the thin-film solar cell production process, ranging from R&D activities to major manufacturing plants. The first 100-MW thin-film factories became operational in 2007 and the announcements of new production capacities accelerated again in 2008. If all expansion plans are realised in time, thin-film production capacity could be 20.2 GW, or 36% of the total 56.9 GW in 2012, and 23.0 GW, or 34% of a total of 67.2 GW in 2015 (Jäger-Waldau, 2009; Jäger-Waldau, 2010). The first thin-film factories with GW production capacity are already under construction for various thin-film technologies.
The rapid growth of the PV industry since 2000 led to the situation where between 2004 and early 2008, the demand for polysilicon outstripped the supply from the semiconductor industry. This led to a silicon shortage, which resulted in silicon spot-market prices as high as 500 $/kg and consequently higher prices for PV modules. This extreme price hike triggered the massive capacity expansion, not only of established companies, but many new entrants, as well.
The six companies that reported shipment figures shipped together about 43,900 metric tons of polysilicon in 2008, as reported by Semiconductor Equipment and Materials International (SEMI). In 2008, these companies had a production capacity of 48,200 metric tons of polysilicon (RTS Corporation, 2009). However, all polysilicon producers, including new entrants with current and alternative technologies, had a production capacity of more than 90,000 metric tons of polysilicon in 2008. Considering that not all new capacity actually produced polysilicon at nameplate capacity in 2008, it was estimated that 62,000 metric tons of polysilicon could be produced. Subtracting the needs of the semiconductor industry and adding recycling and excess production, the available amount of silicon for the PV industry was estimated at 46,000 metric tons of polysilicon. With an average material need of 8.7 g/Wp, this would have been sufficient for 5.3 GW of crystalline silicon PV cells.
The regional distribution of the polysilicon production capacities are as follows: China 20,000 metric tons (MT); Europe 17,500 MT; Japan 12,000 MT; and USA 37,000 MT (Chinese Academy of Science, 2009; RTS Corporation, 2009).
For 2009, about 88,000 MT of solar-grade silicon production were reported, sufficient for about 11 GW assuming an average materials need of 8 g/Wp (Displaybank, 2010). China produced about 18,000 MT or 20%, fulfilling about half of the domestic demand (Baoshan, 2010).
Projected silicon production capacities available for solar in 2012 vary between 140,000 MT from established polysilicon producers, up to 185,000 MT including the new producers [Gary Homan, Presentation at Intersolar 2009] and 250,000 MT (Bernreuther and Haugwitz, 2010). The possible solar cell production will also depend on the material use per Wp. Material consumption could decrease from the current 8 g/Wp to 7 g/Wp or even 6 g/Wp, but this may not be achieved by all manufacturers.
Projected silicon production capacities available for solar in 2010 vary between 99,500 MT (PV News, 2008) and 245,000 MT (EuPD Research and IFO Institut fur Wirtschaftforschung Universitat Munchen, 2008). In addition, the possible solar cell production will depend on the material use per Wp.
Next, we look at CSP electricity generation. When considering industry capacity, it is important to factor in that CSP is based on adapted knowledge from the existing power industry such as steam and gas turbines. The collectors themselves benefit from a range of existing skill sets such as mechanical, structural, and control engineers, metallurgists, and others. Often, the material or components used in the collectors are already mass-produced, such as glass mirrors.
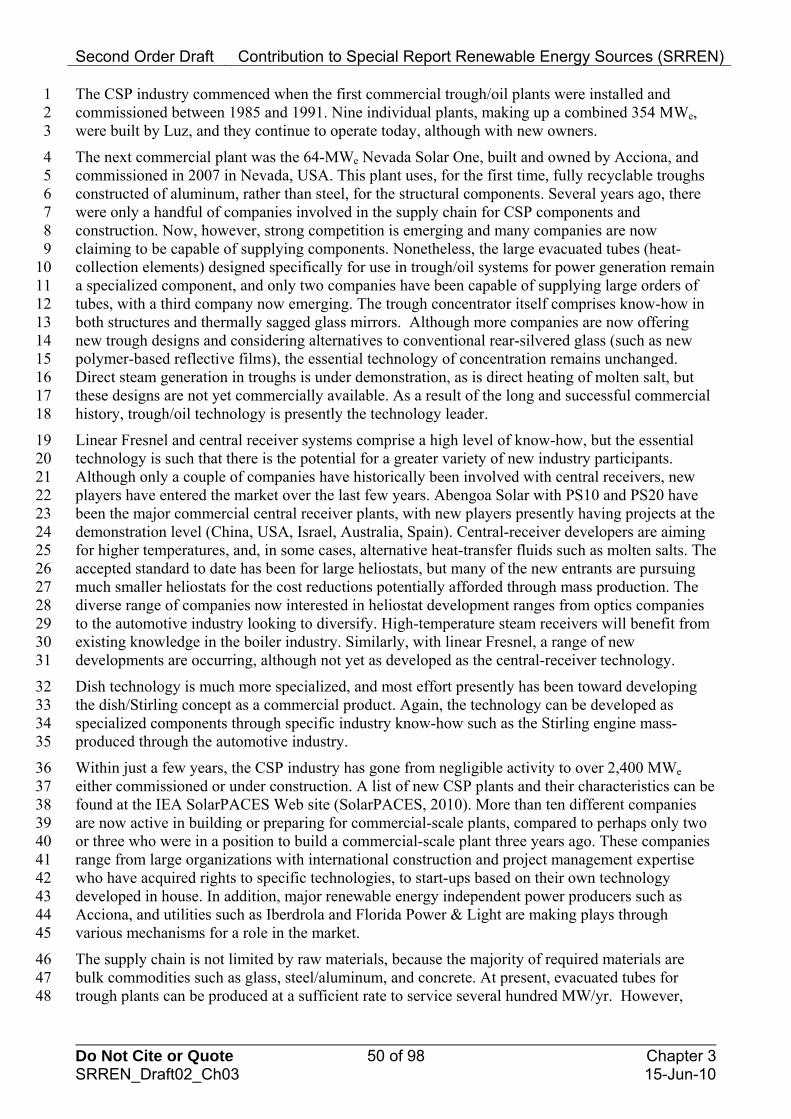
Second Order Draft Contribution to Special Report Renewable Energy Sources (SRREN)
Do Not Cite or Quote 50 of 98 Chapter 3 SRREN_Draft02_Ch03 15-Jun-10
1 2 3
4 5 6 7 8 9
10 11 12 13 14 15 16 17 18
19 20 21 22 23 24 25 26 27 28 29 30 31
32 33 34 35
36 37 38 39 40 41 42 43 44 45
46 47 48
The CSP industry commenced when the first commercial trough/oil plants were installed and commissioned between 1985 and 1991. Nine individual plants, making up a combined 354 MWe, were built by Luz, and they continue to operate today, although with new owners.
The next commercial plant was the 64-MWe Nevada Solar One, built and owned by Acciona, and commissioned in 2007 in Nevada, USA. This plant uses, for the first time, fully recyclable troughs constructed of aluminum, rather than steel, for the structural components. Several years ago, there were only a handful of companies involved in the supply chain for CSP components and construction. Now, however, strong competition is emerging and many companies are now claiming to be capable of supplying components. Nonetheless, the large evacuated tubes (heat-collection elements) designed specifically for use in trough/oil systems for power generation remain a specialized component, and only two companies have been capable of supplying large orders of tubes, with a third company now emerging. The trough concentrator itself comprises know-how in both structures and thermally sagged glass mirrors. Although more companies are now offering new trough designs and considering alternatives to conventional rear-silvered glass (such as new polymer-based reflective films), the essential technology of concentration remains unchanged. Direct steam generation in troughs is under demonstration, as is direct heating of molten salt, but these designs are not yet commercially available. As a result of the long and successful commercial history, trough/oil technology is presently the technology leader.
Linear Fresnel and central receiver systems comprise a high level of know-how, but the essential technology is such that there is the potential for a greater variety of new industry participants. Although only a couple of companies have historically been involved with central receivers, new players have entered the market over the last few years. Abengoa Solar with PS10 and PS20 have been the major commercial central receiver plants, with new players presently having projects at the demonstration level (China, USA, Israel, Australia, Spain). Central-receiver developers are aiming for higher temperatures, and, in some cases, alternative heat-transfer fluids such as molten salts. The accepted standard to date has been for large heliostats, but many of the new entrants are pursuing much smaller heliostats for the cost reductions potentially afforded through mass production. The diverse range of companies now interested in heliostat development ranges from optics companies to the automotive industry looking to diversify. High-temperature steam receivers will benefit from existing knowledge in the boiler industry. Similarly, with linear Fresnel, a range of new developments are occurring, although not yet as developed as the central-receiver technology.
Dish technology is much more specialized, and most effort presently has been toward developing the dish/Stirling concept as a commercial product. Again, the technology can be developed as specialized components through specific industry know-how such as the Stirling engine mass-produced through the automotive industry.
Within just a few years, the CSP industry has gone from negligible activity to over 2,400 MWe either commissioned or under construction. A list of new CSP plants and their characteristics can be found at the IEA SolarPACES Web site (SolarPACES, 2010). More than ten different companies are now active in building or preparing for commercial-scale plants, compared to perhaps only two or three who were in a position to build a commercial-scale plant three years ago. These companies range from large organizations with international construction and project management expertise who have acquired rights to specific technologies, to start-ups based on their own technology developed in house. In addition, major renewable energy independent power producers such as Acciona, and utilities such as Iberdrola and Florida Power & Light are making plays through various mechanisms for a role in the market.
The supply chain is not limited by raw materials, because the majority of required materials are bulk commodities such as glass, steel/aluminum, and concrete. At present, evacuated tubes for trough plants can be produced at a sufficient rate to service several hundred MW/yr. However,
Second Order Draft Contribution to Special Report Renewable Energy Sources (SRREN)
Do Not Cite or Quote 51 of 98 Chapter 3 SRREN_Draft02_Ch03 15-Jun-10
1 2
3 4 5 6 7 8 9
10 11 12 13 14 15 16
17 18 19 20 21 22
23 24 25 26 27 28 29 30 31 32
33 34 35 36 37 38
39 40 41 42 43 44 45
expanded capacity can be introduced fairly readily through new factories with an 18-month lead time.
Solar fuel technology is still at an emerging stage—thus, there is no supply chain in place at present for commercial applications. However, solar fuels will comprise much of the same solar-field technology being deployed for other high-temperature CSP systems, with solar fuels requiring a different receiver/reactor at the focus and different downstream processing and control. Much of the downstream technology, such as Fischer-Tropsch liquid fuel plants, would come from existing expertise in the petrochemical industry. The scale of solar fuel demonstration plants is being ramped up to build confidence for industry, which will eventually expand operations.
3.4.3 Impact of Policies Direct solar energy technologies face a range of potential barriers to achieve wide-scale deployment, and policies to advance markets generally target three issues: 1) accelerating technology improvements through use of incentives in the near-term, 2) streamlining planning and permitting processes, and 3) harmonizing global codes and standards. For electricity-producing technologies, longer-term support for enabling technologies (e.g., storage, smart grids) is being pursued. Current technology-specific policies and barriers are summarized below.
Solar Water Heating, Space Heating and Cooling, and Lighting. Energy efficiency technologies are supported by tax credits, grants and soft loans, and a few renewable electricity standards (RES) legal frameworks (Rickerson et al., 2009). Because these technologies are a relatively low-cost pathway to carbon emissions reductions, countries are increasing installation rates (Weiss et al., 2009). Yet, similar to PV, these technologies face inconsistent certification and standards issues.
Photovoltaics. Direct financial support measures from governments are driving growth in PV markets. Feed-in-tariffs (FIT), popularized after boosting levels of deployment in Germany and Spain, set a legal framework for utilities to purchase PV-generated electricity at premium rates. In various forms, FIT policies are now implemented in more than 40 countries (REN21, 2009). Tax credits and soft loans are another set of direct financial tools that are frequently used to increase demand and support manufacturing. Additionally, market penetration requirements, such as RES, increase demand by obligating power suppliers to provide a specified fraction of electricity from renewable energy technologies. Most common in the United States (IEA, 2009a), RES policies allow power suppliers flexibility in meeting targets by use of tradable certificate programs (Sullivan et al., 2009) and compliance penalties.
Through successful policy designs (Ragwitz et al., 2007), governments have stimulated strong growth in the industry despite several challenges, such as: 1) Inconsistent interconnection standards, net metering policy, and time-varying utility rate structures that capture the value of PV-generated electricity; 2) Complex access laws, permitting procedures, and fees; 3) Lagging regulatory structures that capture environmental and risk mitigation benefits; and 4) Lack of financing mechanisms that offset relatively high tax burdens and capital costs (Denholm et al., 2009).
Concentrating Solar Power. The general design of policy measures to support the deployment of CSP systems is similar to the options listed above for PV (feed-in tariffs and renewable energy portfolios); however, common barriers differ due to the much greater scale of CSP plants, and the need for investment by major companies rather than, for example, householders. These include: 1) Inconsistent policy supporting utility-scale deployment; 2) Insufficient transmission capacity for large plants linking remote resources regions to load centers; and 3) Siting and permitting challenges to develop land with favourable solar resources (Denholm et al., 2009).
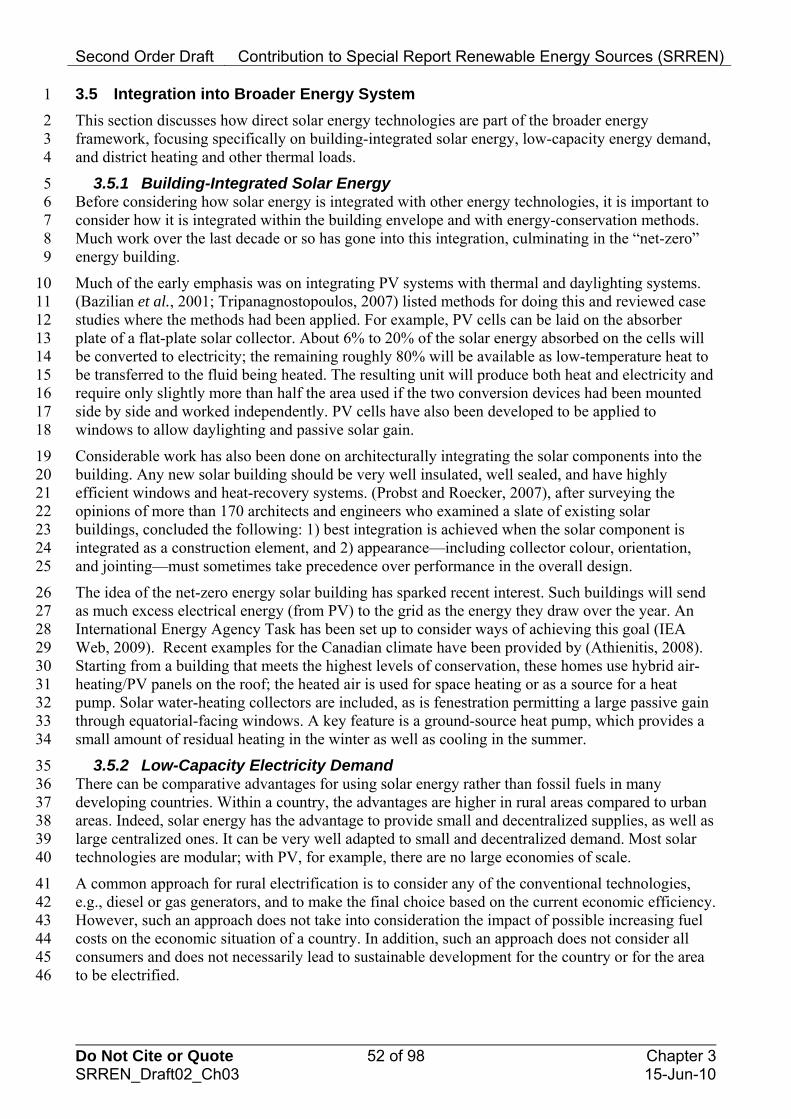
Second Order Draft Contribution to Special Report Renewable Energy Sources (SRREN)
Do Not Cite or Quote 52 of 98 Chapter 3 SRREN_Draft02_Ch03 15-Jun-10
2 3 4
6 7 8 9
10 11 12 13 14 15 16 17 18
19 20 21 22 23 24 25
26 27 28 29 30 31 32 33 34
35 36 37 38 39 40
41 42 43 44 45 46
3.5 Integration into Broader Energy System 1
This section discusses how direct solar energy technologies are part of the broader energy framework, focusing specifically on building-integrated solar energy, low-capacity energy demand, and district heating and other thermal loads.
3.5.1 Building-Integrated Solar Energy 5 Before considering how solar energy is integrated with other energy technologies, it is important to consider how it is integrated within the building envelope and with energy-conservation methods. Much work over the last decade or so has gone into this integration, culminating in the “net-zero” energy building.
Much of the early emphasis was on integrating PV systems with thermal and daylighting systems. (Bazilian et al., 2001; Tripanagnostopoulos, 2007) listed methods for doing this and reviewed case studies where the methods had been applied. For example, PV cells can be laid on the absorber plate of a flat-plate solar collector. About 6% to 20% of the solar energy absorbed on the cells will be converted to electricity; the remaining roughly 80% will be available as low-temperature heat to be transferred to the fluid being heated. The resulting unit will produce both heat and electricity and require only slightly more than half the area used if the two conversion devices had been mounted side by side and worked independently. PV cells have also been developed to be applied to windows to allow daylighting and passive solar gain.
Considerable work has also been done on architecturally integrating the solar components into the building. Any new solar building should be very well insulated, well sealed, and have highly efficient windows and heat-recovery systems. (Probst and Roecker, 2007), after surveying the opinions of more than 170 architects and engineers who examined a slate of existing solar buildings, concluded the following: 1) best integration is achieved when the solar component is integrated as a construction element, and 2) appearance—including collector colour, orientation, and jointing—must sometimes take precedence over performance in the overall design.
The idea of the net-zero energy solar building has sparked recent interest. Such buildings will send as much excess electrical energy (from PV) to the grid as the energy they draw over the year. An International Energy Agency Task has been set up to consider ways of achieving this goal (IEA Web, 2009). Recent examples for the Canadian climate have been provided by (Athienitis, 2008). Starting from a building that meets the highest levels of conservation, these homes use hybrid air-heating/PV panels on the roof; the heated air is used for space heating or as a source for a heat pump. Solar water-heating collectors are included, as is fenestration permitting a large passive gain through equatorial-facing windows. A key feature is a ground-source heat pump, which provides a small amount of residual heating in the winter as well as cooling in the summer.
3.5.2 Low-Capacity Electricity Demand There can be comparative advantages for using solar energy rather than fossil fuels in many developing countries. Within a country, the advantages are higher in rural areas compared to urban areas. Indeed, solar energy has the advantage to provide small and decentralized supplies, as well as large centralized ones. It can be very well adapted to small and decentralized demand. Most solar technologies are modular; with PV, for example, there are no large economies of scale.
A common approach for rural electrification is to consider any of the conventional technologies, e.g., diesel or gas generators, and to make the final choice based on the current economic efficiency. However, such an approach does not take into consideration the impact of possible increasing fuel costs on the economic situation of a country. In addition, such an approach does not consider all consumers and does not necessarily lead to sustainable development for the country or for the area to be electrified.

Second Order Draft Contribution to Special Report Renewable Energy Sources (SRREN)
Do Not Cite or Quote 53 of 98 Chapter 3 SRREN_Draft02_Ch03 15-Jun-10
1 2 3 4 5 6 7 8
9 10 11 12 13
In a wide range of countries, particularly those that are not oil producers, solar energy and other forms of renewable energy can be the most appropriate. If electricity demand exceeds supply, the lack of electricity can prevent development of many economic sectors. Even in countries with high solar energy potential, renewable energy is often only considered to satisfy high-power requirements such as the industrial sector. However, large-scale technologies such as CSP are often not available to them due, for example, to resource conditions or suitable land-area availability. In such cases, it is reasonable to keep the electricity generated near the source to provide high power to cover industrial needs.
Applications that have low power consumption, such as lighting in rural areas, can then primarily be satisfied using on-site PV—even if the business plan for the electrification of the concerned rural area indicates that a connection to the grid would be more profitable. Furthermore, the criteria to determine the most-suitable technological option for the electrification of a rural area should include benefits such as local economic development: exploiting natural resources, creating jobs, reducing the country’s dependence on imports, and protecting the environment. [TSU: section lacks 14 references] 15
16 17 18 19 20 21 22 23 24 25
26 27 28 29 30 31 32 33 34
35 36 37
38 39 40 41 42 43 44 45
46 47 48
3.5.3 District Heating and Other Thermal Loads In China, Greece, and Israel, solar water heaters make a significant contribution to residential energy demand. In addition, solar water heating is widely used for pool heating in Australia and the USA. The power output from 100,000 m2 of flat-plate solar collectors is on the order of 50 MW during the middle of the day (assuming 1,000 W/m2 incident radiation and 50% collector efficiency). Thus, the peak power capacity of solar water heaters in a number of countries already exceeds 1,000 MW. In countries where electricity is a major resource for water heating, e.g., Australia, Canada, and USA, the impact of the installation of a large number of solar domestic water heaters on the operation of an electricity grid depends on the load management strategies of the utility.
For a utility that uses centralized load switching to manage electric water-heater load, the impact of solar water heaters is limited to fuel savings. If a utility does not use load switching, then the installation of a large number of solar water heaters may have the additional benefit of reducing peak demand on the grid. For a utility that has a summer peak, the time of maximum solar water-heater output corresponds with peak electrical demand, and there is a capacity benefit from load displacement of electric water heaters. Large-scale implementation of solar water heating can benefit both the customer and the utility. Another benefit to utilities is emissions reduction, because solar water heating will displace the marginal and most-polluting generating plant used to produce peak-load power.
Highly insulated buildings can be heated easily with relatively low-temperature district-heating systems (where solar energy is ideal) or quite small quantities of renewable-generated electricity (Boyle, 1996).
Combining biomass and low-temperature solar thermal energy could provide zero-emissions, high-capacity-factor solutions well suited to areas with less frequent direct-beam solar radiation. In the short term, such areas often have high biomass availability due to increased rainfall (from the thick cloud cover). On the other hand, solar technology is much more land efficient and greatly reduces the need for biomass growing area and biomass transport cost. It is likely that some optimum ratio of solar thermal electricity and biomass supply would exist at each site. Research is being conducted on tower and dish systems to develop technologies, such as solar-driven gasification of biomass, that optimally combine both these renewable resources.
In the longer term, greater interconnectedness across different climate regimes may provide more stability of supply as a total grid system, reducing the need for occasional fuel supply for each individual solar thermal electricity system.
Second Order Draft Contribution to Special Report Renewable Energy Sources (SRREN)
Do Not Cite or Quote 54 of 98 Chapter 3 SRREN_Draft02_Ch03 15-Jun-10
2 3 4 5 6 7 8 9
10 11 12 13 14 15 16 17
18 19 20 21 22 23 24 25
26 27 28 29 30 31 32 33 34
35 36 37 38 39 40 41 42 43 44 45
47 48
3.5.4 PV Generation Characteristics and Smoothing Effect 1 PV system generation at a single point varies periodically in a day and a year, but also randomly according to weather conditions. The variation of PV generation is supposed to have a large impact on voltage and power flow of the local transmission/distribution system from the early penetration stage, and supply-demand balance in a total power system operation in the deep penetration stage. The impact of supply-demand balance may be a critical constraint of PV integration into a power system. Currently, there are not enough data on generation characteristics to evaluate the smoothing effect. The data collection from a sufficiently large number of sites, periods, and time resolution has just begun in several areas in the world. The total electricity generation of numerous PV systems in a broad area should have less random and fast variation because the generation output variations of numerous PV systems have slight correlation and cancel each other. Otani et al. (1998) analyzed the non-correlational irradiation/generation characteristics of several PV systems/sites that are dispersed spatially. (Ramachandran et al., 2004) analyzed the reduction in power output fluctuation for spatially dispersed PV systems and for different time periods, and they proposed a cluster model to represent very large numbers of small, geographically dispersed PV systems. However, the critical impact on supply-demand balance of a power comes from the total generation of the PV system of a power system (Ogimoto et al., 2010).
Oozeki et al. (2010) quantitatively evaluated the smoothing effect in a load dispatch control area in Japan to determine the importance of data accumulation and analysis. The study also proposed a methodology to calculate the total PV output from a limited number of measurement data using Voronoi Tessellation, which assumes the total PV generation as the weighted sum of the each measurement by the Voronoi cell area. Collecting reliable measurement data with sufficient time resolution and time synchronization, the smoothed generation characteristics of the PV penetration will be analyzed precisely and contribute to the economical and reliable integration of PV into the energy system.
3.5.5 CSP Generation Characteristics and Grid Stabilization CSP plants can be designed for solar-only electricity generation to satisfy a peak-load demand; but ideally, with thermal storage systems, up to a 100% solar share could be achieved in the future. This potential and their ability to dispatch power on demand during peak periods are key characteristics that have motivated regulators in the Mediterranean Region, starting with Spain, to support large-scale implementation of this technology with tailored feed-in tariffs. CSP is suitable for large-scale 10 to 200 MWe plants, replacing conventional thermal power capacity. With thermal storage or fossil backup, CSP plants can also produce power when radiation is low and at night. Solar thermal power plants can reliably deliver firm, scheduled power while the grid remains stable.
Solar thermal plants may be combined with a high fossil share in fuel-efficient integrated solar combined-cycle (ISCC) systems. In ISCC power plants, a solar parabolic-trough field is integrated in a modern gas and steam power plant, where the waste-heat boiler is modified and the steam turbine is oversized to provide additional steam from a solar steam generator. Better fuel efficiency and extended operating hours make combined solar/fossil power generation much more cost-effective than in separate CSP and combined-cycle plants. Without storage, however, solar steam could only be supplied for some 2000 of the 6000–8000 combined-cycle operating hours. Furthermore, since the solar steam is only feeding the combined-cycle turbine—which supplies only a third of its power—the solar share obtainable is under 10%. This is especially of interest for oil- and gas-producing Sunbelt countries, where solar power technologies can be introduced on their fossil-based power market (SolarPACES, 2008).
3.6 Environmental and Social Impacts 46
The section first discusses the environmental impacts of direct solar technologies, and then describes potential social impacts.
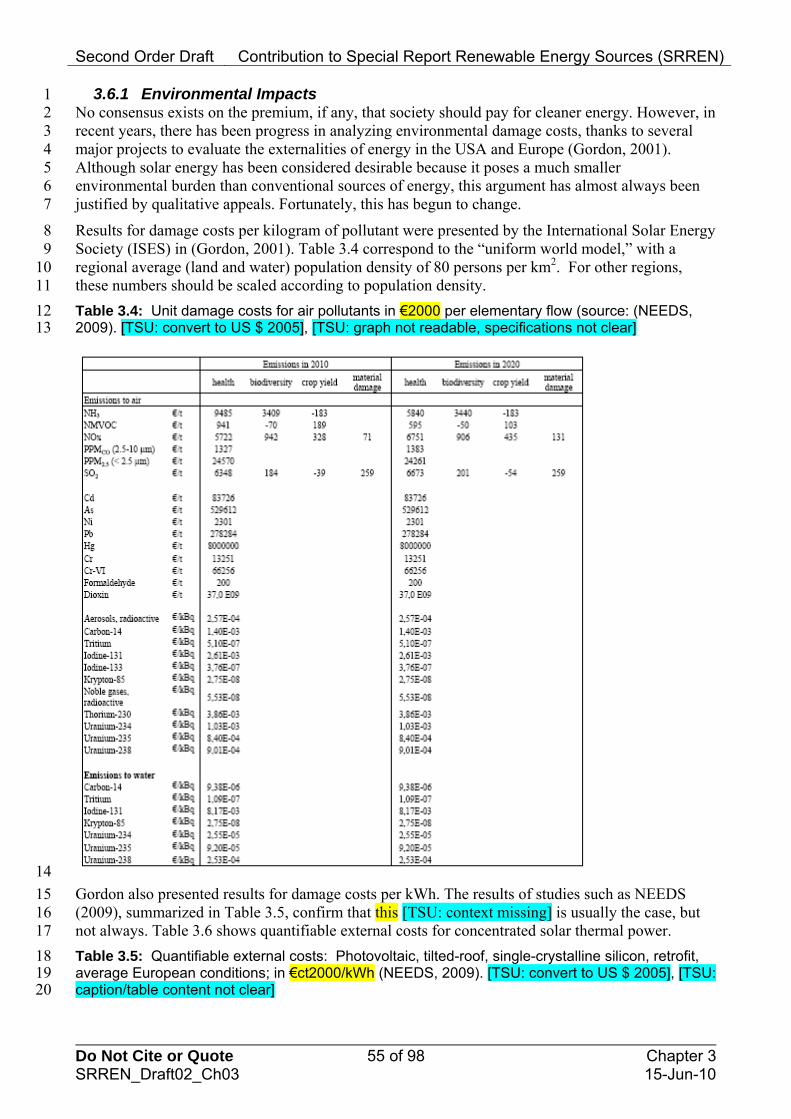
Second Order Draft Contribution to Special Report Renewable Energy Sources (SRREN)
Do Not Cite or Quote 55 of 98 Chapter 3 SRREN_Draft02_Ch03 15-Jun-10
2 3 4 5 6 7
8 9
10 11
3.6.1 Environmental Impacts 1 No consensus exists on the premium, if any, that society should pay for cleaner energy. However, in recent years, there has been progress in analyzing environmental damage costs, thanks to several major projects to evaluate the externalities of energy in the USA and Europe (Gordon, 2001). Although solar energy has been considered desirable because it poses a much smaller environmental burden than conventional sources of energy, this argument has almost always been justified by qualitative appeals. Fortunately, this has begun to change.
Results for damage costs per kilogram of pollutant were presented by the International Solar Energy Society (ISES) in (Gordon, 2001). Table 3.4 correspond to the “uniform world model,” with a regional average (land and water) population density of 80 persons per km2. For other regions, these numbers should be scaled according to population density.
Table 3.4: Unit damage costs for air pollutants in €2000 per elementary flow (source: (NEEDS, 12 2009). [TSU: convert to US $ 2005], [TSU: graph not readable, specifications not clear] 13
14
15 Gordon also presented results for damage costs per kWh. The results of studies such as NEEDS (2009), summarized in Table 3.5, confirm that this [TSU: context missing] is usually the case, but not always. Table 3.6 shows quantifiable external costs for concentrated solar thermal power.
16 17
18 Table 3.5: Quantifiable external costs: Photovoltaic, tilted-roof, single-crystalline silicon, retrofit, average European conditions; in €ct2000/kWh (NEEDS, 2009). [TSU: convert to US $ 2005], [TSU: 19 caption/table content not clear] 20

Second Order Draft Contribution to Special Report Renewable Energy Sources (SRREN)
Do Not Cite or Quote 56 of 98 Chapter 3 SRREN_Draft02_Ch03 15-Jun-10
1 Table 3.6: Quantifiable external costs: Concentrated solar thermal power; in €ct2000/kWh 2 (NEEDS, 2009). [TSU: convert to US $ 2005], [TSU: caption/table content not clear] 3
4
5 6 7 8 9
10
11 12 13 14 15
16 17 18
19 20 21 22 23 24 25 26 27 28 29 30
It is possible to factor environmental and social costs and benefits into an ordinary financial analysis, but this is rarely done (Gordon, 2001). A critical error is that the economics of renewable energy systems are often calculated without reference to their environmental benefits. This omission constitutes a very strong bias in favour of polluting technologies. Relying on traditional levelized-cost accounting for all aspects of energy is untenable without a wider cost/benefit analysis that includes all inputs and outputs.
Environmental benefits must ultimately be included in a rational marketplace. However, many of these benefits cannot be applied across the spectrum in different areas related to energy; this is because they tend to be location specific, and hence, sensitive to local conditions. Conventional energy generation and distribution may reap these benefits by merging with other technologies related to energy efficiency.
One approach that takes account of emissions is to estimate the cost of carbon avoidance, for example, for existing or near-term solar thermal electricity technology (taken from (Kolb, 1998; Mills and Dey, 2000).
All energy technologies have land requirements that differ quite significantly. A recent study (see Figure 3.23) reviewed and updated the land-transformation metric for conventional- and renewable-fuel cycles for generating electricity (Fthenakis and Kim, 2009). The study shows that the PV life cycle of power plants in the U.S. Southwest involves less disturbance of land than do conventional and other renewable-fuel cycles. Even under average U.S. solar irradiation, the land requirement of PV is less than that of coal-based fuel cycles. In contrast to the fossil- and nuclear-fuel cycles, PV does not disturb land by extracting and transporting fuel to the power plants. Furthermore, PV eliminates the necessity of reclaiming mine lands or securing additional lands for waste disposal. Accounting for secondary effects—including water contamination, change of the forest ecosystem, and accidental land contamination—makes the advantages of the PV cycle even greater than those described herein. Further investigation is needed to assess these impacts on a regional and global level.
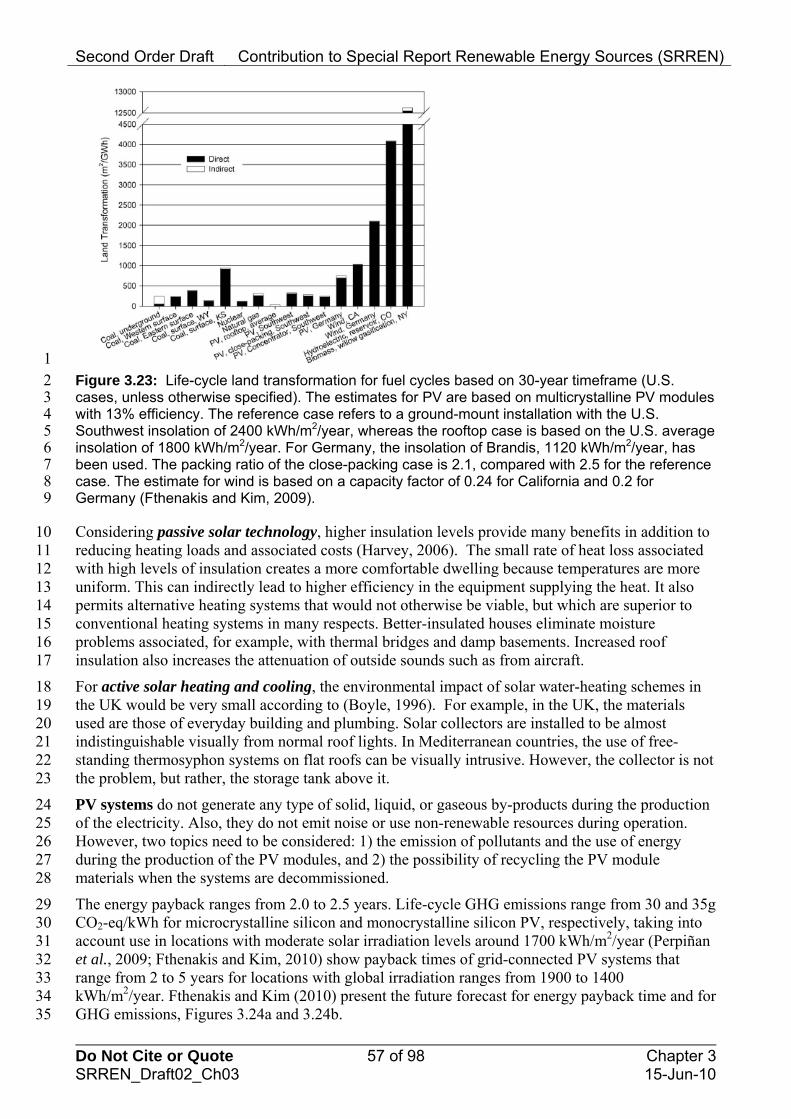
Second Order Draft Contribution to Special Report Renewable Energy Sources (SRREN)
Do Not Cite or Quote 57 of 98 Chapter 3 SRREN_Draft02_Ch03 15-Jun-10
1 2 3 4 5 6 7 8 9
10 11 12 13 14 15 16 17
18 19 20 21 22 23
24 25 26 27 28
29 30 31 32 33 34 35
Figure 3.23: Life-cycle land transformation for fuel cycles based on 30-year timeframe (U.S. cases, unless otherwise specified). The estimates for PV are based on multicrystalline PV modules with 13% efficiency. The reference case refers to a ground-mount installation with the U.S. Southwest insolation of 2400 kWh/m2/year, whereas the rooftop case is based on the U.S. average insolation of 1800 kWh/m2/year. For Germany, the insolation of Brandis, 1120 kWh/m2/year, has been used. The packing ratio of the close-packing case is 2.1, compared with 2.5 for the reference case. The estimate for wind is based on a capacity factor of 0.24 for California and 0.2 for Germany (Fthenakis and Kim, 2009).
Considering passive solar technology, higher insulation levels provide many benefits in addition to reducing heating loads and associated costs (Harvey, 2006). The small rate of heat loss associated with high levels of insulation creates a more comfortable dwelling because temperatures are more uniform. This can indirectly lead to higher efficiency in the equipment supplying the heat. It also permits alternative heating systems that would not otherwise be viable, but which are superior to conventional heating systems in many respects. Better-insulated houses eliminate moisture problems associated, for example, with thermal bridges and damp basements. Increased roof insulation also increases the attenuation of outside sounds such as from aircraft.
For active solar heating and cooling, the environmental impact of solar water-heating schemes in the UK would be very small according to (Boyle, 1996). For example, in the UK, the materials used are those of everyday building and plumbing. Solar collectors are installed to be almost indistinguishable visually from normal roof lights. In Mediterranean countries, the use of free-standing thermosyphon systems on flat roofs can be visually intrusive. However, the collector is not the problem, but rather, the storage tank above it.
PV systems do not generate any type of solid, liquid, or gaseous by-products during the production of the electricity. Also, they do not emit noise or use non-renewable resources during operation. However, two topics need to be considered: 1) the emission of pollutants and the use of energy during the production of the PV modules, and 2) the possibility of recycling the PV module materials when the systems are decommissioned.
The energy payback ranges from 2.0 to 2.5 years. Life-cycle GHG emissions range from 30 and 35g CO2-eq/kWh for microcrystalline silicon and monocrystalline silicon PV, respectively, taking into account use in locations with moderate solar irradiation levels around 1700 kWh/m2/year (Perpiñan et al., 2009; Fthenakis and Kim, 2010) show payback times of grid-connected PV systems that range from 2 to 5 years for locations with global irradiation ranges from 1900 to 1400 kWh/m2/year. Fthenakis and Kim (2010) present the future forecast for energy payback time and for GHG emissions, Figures 3.24a and 3.24b.

Second Order Draft Contribution to Special Report Renewable Energy Sources (SRREN)
Do Not Cite or Quote 58 of 98 Chapter 3 SRREN_Draft02_Ch03 15-Jun-10
1 Figure 3.24: Future forecast for energy payback time and GHG emissions from the life cycles of PV modules. Estimates are based on the Southern European irradiation level, 1700 kWh/m2/year, a performance ratio of 0.75, and lifetime of 30 years (* Based on the average U.S. irradiation level of 1800 kWh/m2/year and a performance ratio of 0.8) (Fthenakis and Kim, 2010).
2 3 4 5
6 7 8 9
10
11 12 13 14
15 16 17 18 19 20 21 22 23 24
The PV industry uses some toxic and explosive gases, as well as corrosive liquids, in its production lines—for instance, silane, NF3, HF, Cd, Pb, Se, Cu, Ni, and Ag. The presence and amount of those materials depend strongly on the cell type. However, the intrinsic needs of the productive process of the PV industry force the use of quite rigorous control methods that minimize the emission of potentially hazardous elements during module production.
Recycling the material in PV modules is already economically viable, mainly for concentrated and large-scale applications. Predictions are that between 80% and 96% of the glass, ethylene vinyl acetate (EVA), and metals (Te, Se, and Pb) will be recycled. Other metals, such as Cd, Te, Sn, Ni, Al, and Cu, should be saved or they can be recycled by other methods.
An exhaustive literature search of all PV-related life cycle assessment (LCA) studies published after 1980 was conducted. Of the 220 pieces of literature gathered, 74 met screening criteria for quality and relevance to potential technology deployment. The quality screen eliminated studies that did not meet the basic requirements set forth in the ISO 14000 series of standards for LCA, including boundary definition and documentation of assumptions and results. Life-cycle GHG emissions were reported for 106 technology scenarios in 21 of the 74 pieces of literature that passed the screen. Figure 3.25 shows that the majority of life-cycle GHG emission estimates cluster between about 30 and 70 g CO2-equivalent/kWh, with potentially important outliers at greater values. Additional harmonization efforts to explain these outliers and further LCA studies to increase the number of estimates for some technologies (e.g., CdTe) are recommended.
(a)
0
0,5
1
1,5
2
2,5
3
Ribbon-Si Multi-Si Mono-Si CdTe*
Yea
rs
Current
Future
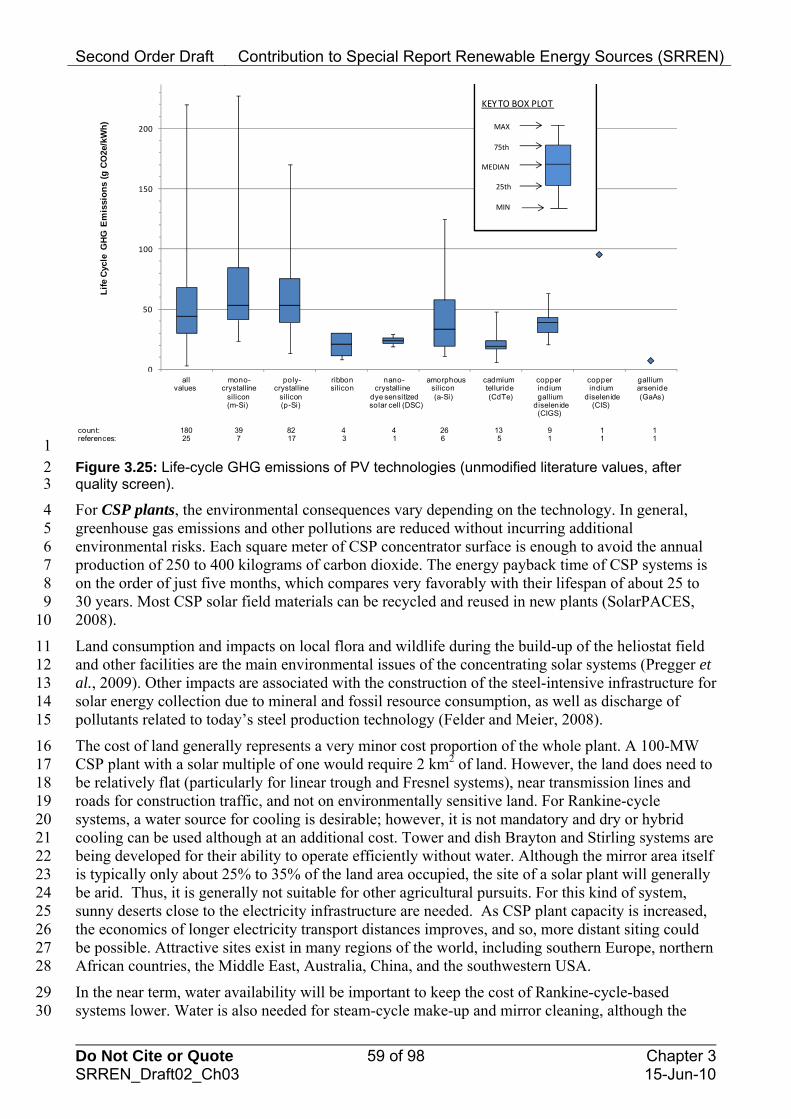
Second Order Draft Contribution to Special Report Renewable Energy Sources (SRREN)
Do Not Cite or Quote 59 of 98 Chapter 3 SRREN_Draft02_Ch03 15-Jun-10
0
50
100
150
200
1 2 3 4 5 6 7 8 9 10
Lif
e C
ycle
GH
G E
mis
sio
ns
(g C
O2e
/kW
h)
all mono- poly- ribbon nano- amorphous cadmium copper copper galliumvalues crystalline crystalline silicon crystalline silicon telluride indium indium arsenide
silicon silicon dye sensitized (a-Si) (CdTe) gallium diselenide (GaAs)(m-Si) (p-Si) solar cell (DSC) diselenide (CIS)
(CIGS)
count: 180 39 82 4 4 26 13 9 1 1references: 25 7 17 3 1 6 5 1 1 1
KEYTO BOX PLOT
MAX
75th
MEDIAN
25th
MIN
1 2 3
4 5 6 7 8 9
10
11 12 13 14 15
16 17 18 19 20 21 22 23 24 25 26 27 28
29 30
Figure 3.25: Life-cycle GHG emissions of PV technologies (unmodified literature values, after quality screen).
For CSP plants, the environmental consequences vary depending on the technology. In general, greenhouse gas emissions and other pollutions are reduced without incurring additional environmental risks. Each square meter of CSP concentrator surface is enough to avoid the annual production of 250 to 400 kilograms of carbon dioxide. The energy payback time of CSP systems is on the order of just five months, which compares very favorably with their lifespan of about 25 to 30 years. Most CSP solar field materials can be recycled and reused in new plants (SolarPACES, 2008).
Land consumption and impacts on local flora and wildlife during the build-up of the heliostat field and other facilities are the main environmental issues of the concentrating solar systems (Pregger et al., 2009). Other impacts are associated with the construction of the steel-intensive infrastructure for solar energy collection due to mineral and fossil resource consumption, as well as discharge of pollutants related to today’s steel production technology (Felder and Meier, 2008).
The cost of land generally represents a very minor cost proportion of the whole plant. A 100-MW CSP plant with a solar multiple of one would require 2 km2 of land. However, the land does need to be relatively flat (particularly for linear trough and Fresnel systems), near transmission lines and roads for construction traffic, and not on environmentally sensitive land. For Rankine-cycle systems, a water source for cooling is desirable; however, it is not mandatory and dry or hybrid cooling can be used although at an additional cost. Tower and dish Brayton and Stirling systems are being developed for their ability to operate efficiently without water. Although the mirror area itself is typically only about 25% to 35% of the land area occupied, the site of a solar plant will generally be arid. Thus, it is generally not suitable for other agricultural pursuits. For this kind of system, sunny deserts close to the electricity infrastructure are needed. As CSP plant capacity is increased, the economics of longer electricity transport distances improves, and so, more distant siting could be possible. Attractive sites exist in many regions of the world, including southern Europe, northern African countries, the Middle East, Australia, China, and the southwestern USA.
In the near term, water availability will be important to keep the cost of Rankine-cycle-based systems lower. Water is also needed for steam-cycle make-up and mirror cleaning, although the
Second Order Draft Contribution to Special Report Renewable Energy Sources (SRREN)
Do Not Cite or Quote 60 of 98 Chapter 3 SRREN_Draft02_Ch03 15-Jun-10
1 2 3 4 5
6 7 8 9
10 11 12 13
14 15 16 17 18 19 20 21 22 23 24 25 26
27 28 29 30 31 32 33 34 35 36 37
38 39 40 41 42
43 44 45 46 47 48 49
latter two uses represent only a few percent of that needed if wet cooling is used. However, there will be otherwise highly favourable sites where water is not available for cooling. The additional cost of electricity from a dry-cooled plant is 2%–10% (U.S. Department of Energy, 2009), although it depends on many factors such as ambient conditions and technology (e.g., tower plants operating at higher temperature require less cooling per MWh than troughs).
In solar fuel production, solar thermal processes use concentrated solar radiation as the main or sole source of high-temperature process heat. A solar thermal plant consists of a central-receiver system comprising a heliostat field focusing direct solar radiation on a receiver that is mounted on a tower. The receiver comprises a chemical reactor or a heat-exchanging device. Direct CO2 emissions released by the thermochemical processes are negligible or significantly lower than from current processes (Pregger et al., 2009). All other possible effects are comparable to the conventional processes or can be prevented by safety measures and equipment that are common practice in the chemical industry.
3.6.2 Social Impacts Solar energy has the potential to meet rising energy demands and decrease greenhouse gas emissions, but solar technologies have faced resistance due to public concerns among some groups. The land-area requirements for centralized CSP and PV plants raise concerns for visual impacts, which can be minimized during the siting phase by choosing locations in areas with low population density, although this will usually be the case for suitable solar sites any way. Visual concerns also exist for distributed solar systems in built-up areas, which may find greater resistance for applications on historical or cultural buildings versus modern constructions. By avoiding conservation areas and incorporating solar technologies into building design, these conflicts can be minimized. Noise impacts may be of concern in the construction phase, but impacts can be mitigated in the site-selection phase and by adoption of good work practices (Tsoutsos et al., 2005). Community engagement throughout the planning process of renewable projects can also significantly increase public acceptance of projects (Zoellner et al., 2008).
Increased deployment of consumer-purchased systems still faces barriers with respect to costs, subsidy structures that may be confusing, and misunderstanding about reliability and maintenance requirements (Faiers and Neame, 2006). Effective marketing of solar technologies, including publicizing impacts relative to traditional power generation facilities and environmental and energy security benefits, have helped to accelerate social acceptance and increase willingness to pay (Batley et al., 2001). Government spending on solar technologies through fiscal incentives and R&D could garner increased public support through increased quantification and dissemination of the economic impacts associated with those programs. A recent study comparing job impacts across energy technologies showed that solar PV had the greatest job-generating potential at an average of 0.87 job-years per GWh, while CSP yielded an average of 0.23 jobs generated per GWh, both of which exceeded job creation estimates for fossil technologies (Wei et al., 2010).
Solar technologies can also improve the health and livelihood opportunities for many of the world’s poorest populations. Solar technologies have the potential to address some of the gap in availability of modern energy services for the about 1.6 billion people who do not have access to electricity and the more than 2 billion people who rely on traditional biomass for home cooking and heating needs (International Energy Agency [IEA], 2002).
Solar home systems and PV-powered community grids can provide economically favourable electricity to many areas for which connection to a main grid is impractical, such as in remote, mountainous, and delta regions. Electric lights are the most frequently owned and operated household appliance in electrified households, and access to electric lighting is widely accepted as the principal benefit of electrification programs (Barnes, 1988). Electric lighting may replace light supplied by kerosene lanterns, which are generally associated with poor-quality light, high household fuel expenditures, and pose fire and poisoning risks. The improved quality of light

Second Order Draft Contribution to Special Report Renewable Energy Sources (SRREN)
Do Not Cite or Quote 61 of 98 Chapter 3 SRREN_Draft02_Ch03 15-Jun-10
1 2 3 4 5 6 7 8 9
10 11 12 13
14 15 16 17 18 19 20 21 22 23
24 25 26 27 28 29 30 31 32 33 34 35 36 37 38 39 40 41
42 43 44 45 46 47
48 49
allows for increased reading by household members, study by children, and home-based enterprise activities after dark, resulting in increased education and income opportunities for the household. Higher-quality light can also be provided through solar lanterns, which can afford the same benefits achieved through solar home system-generated lighting. Solar-lantern models can be stand-alone or can require central-station charging, and programs of manufacture, distribution, and maintenance can provide microenterprise opportunities. Use of solar lighting can represent a significant cost savings to households over the lifetime of the technology compared to kerosene, and it can reduce the 190 million metric tons of estimated annual CO2 emissions attributed to fuel-based lighting (Mills, 2005). Solar-powered street lights and lights for community buildings can increase security and safety and provide night-time gathering locations for classes or community meetings. PV systems have been effectively deployed in recent disaster situations to provide safety, care, and comfort to victims in the United States and Caribbean and could be similarly deployed worldwide for crisis relief (Young, 1996).
Solar home systems can also power televisions, radios, and cellular telephones, resulting in increased access to news, information, and distance education opportunities. A study of Bangladesh’s Rural Electrification Program revealed that in electrified households all members are more knowledgeable about public health issues, women have greater knowledge of family planning and gender equality issues, the income and gender discrepancies in adult literacy rates are lower, and immunization guidelines for children are adhered to more regularly when compared with non-electrified households (Barkat et al., 2002). Electrified households may also buy appliances such as fans, irons, grinders, washing machines, and refrigerators to increase comfort and reduce the drudgery associated with domestic tasks (Energy Sector Management Assistance Programme [ESMAP], 2004).
Indoor smoke from solid fuels is responsible for more than 1.6 million deaths annually and 3.6% of the global burden of disease. This mortality rate is similar in scale to the 1.7 million annual deaths associated with unsafe sanitation and more than twice the estimated 0.8 million yearly deaths from exposure to urban air pollution (Ezzati et al., 2002). In areas where solar cookers can satisfactorily produce meals, these cookers can reduce unhealthy exposure to high levels of particulate matter from traditional use of solid fuels for cooking and heating and the associated morbidity and mortality from respiratory and other diseases. Decreased consumption of firewood will correspondingly reduce the time women spend collecting firewood. Studies in India and Africa have collected data showing that this time can total 2 to 15 hours per week, and this is increasing in areas of diminishing fuelwood supply (Brouwer et al., 1997; Energy Sector Management Assistance Programme [ESMAP], 2004). Risks to women collecting fuel include injury, snake bites, landmines, and sexual violence (Environmental Health Perspectives, 2003; Patrick, 2007); when children are enlisted to help with this activity, they may do so at the expense of educational opportunities (Nankhuni and Findeis, 2004). Well-being may be acutely at risk in refugee situations, as are strains on the natural resource systems where fuel is collected (Lynch, 2002). Solar cookers do not generally fulfil all household cooking needs due to technology requirements or their inability to cook some traditional foods; however, even partial use of solar cookers can realize fuelwood savings and reductions in exposure to indoor air pollution (Wentzel and Pouris, 2007).
Solar technologies also have the potential to combat other prevalent causes of morbidity and mortality in poor, rural areas. Solar desalination and water purification technologies can help combat the high prevalence of diarrheal disease brought about by lack of access to potable water supplies. PV systems for health clinics can provide refrigeration for vaccines and lights for performing medical procedures and seeing patients at all hours. Improved working conditions for rural health-care workers can also lead to decreased attrition of talented staff to urban centers.
Solar technologies can improve the economic opportunities and working conditions for poor rural populations. Solar dryers can be used to preserve foods and herbs for consumption year round and
Second Order Draft Contribution to Special Report Renewable Energy Sources (SRREN)
Do Not Cite or Quote 62 of 98 Chapter 3 SRREN_Draft02_Ch03 15-Jun-10
1 2 3 4 5
6 7 8 9
10 11 12 13 14 15 16
18 19 20 21
22 23 24 25 26 27 28 29 30 31 32
33 34 35 36 37 38
39 40 41 42 43 44 45 46
produce export-quality products for income generation. Solar water pumping can minimize the need for carrying water long distances to irrigate crops, which can be particularly important and impactful in the dry seasons and in drought years. Burdens and risks from water collection parallel those of fuel collection, and decreased time spent on this activity can also increase the health and well-being of women, who are largely responsible for these tasks.
The high capital costs of solar systems are often cited as a barrier to increased deployment, and donor programs have experienced issues with fully subsidized systems falling into disrepair (Nieuwenhout et al., 2001). If appropriate financing and after-sales services are offered, markets for solar home systems can develop independently of donor programs. However, market conditions vary widely, and limits of market size and purchasing power can require funds and organizational support from the government or donor agency to yield substantial dissemination of systems (van der Vleuten et al., 2007). Another alternative to user-owned systems, purchased individually or with donor assistance, is ownership by an energy service company, who owns and maintains the system and sells the energy services to the customers (Martinot et al., 2001; Gustavsson and Ellegard, 2004). This arrangement eliminates the need for users to provide up-front capital and increases user satisfaction through proper system maintenance.
3.7 Prospects for Technology Improvements and Innovation 17
This section considers technical innovations that are possible in the future for a range of solar technologies, under the following headings: passive solar technologies, active solar heat and cooling, PV electricity generation, CSP electricity generation, solar fuel production, and other possible applications.
3.7.1 Passive Solar Technologies Passive solar technologies, particularly the direct-gain system, are intrinsically highly efficient because no energy is needed to move collected energy to storage and then to a load. The collection, storage, and use are all integrated. Through technological advances such as low-emissivity coatings and the use of gases such as argon in glazings, near-equatorial-facing windows have reached a high level of performance at increasingly affordable cost. Nevertheless, in heating-dominated climates, further advances are possible, such as the following: 1) Reduction of thermal conductance through use of dynamic exterior night insulation (night shutters); 2) Use of evacuated glazing units; and 3) Translucent glazing systems that may include materials that change solar/visible transmittance with temperature (including a possible phase change) while providing increased thermal resistance in the opaque state.
Considering cooling-load reduction in solar buildings, advances are possible in areas such as the following: 1) Use of cool roof technologies involving materials with high solar reflectivity and emissivity; 2) More systematic use of heat dissipation techniques such as use of the ground and water as a heat sink; 3) Use of advanced pavements and outdoor structures to improve the microclimate around the buildings and decrease urban ambient temperatures; and 4) Advanced solar control devices allowing penetration of daylight, but not of the thermal energy.
Advances in thermal storage integrated in the interior of direct-gain zones are still possible, such as phase-change materials integrated in gypsum board, bricks, or tiles and concrete. The target will be to maximize energy storage per unit volume/mass of material so that such materials can be integrated in lightweight wood-framed homes that are common in cold-climate areas. The challenge for such materials will be to ensure that they continue to store and release heat effectively after 10,000 cycles or more while meeting other performance requirements such as fire resistance. Phase-change materials may also be used systematically in plasters to reduce high indoor temperatures in summer.
Second Order Draft Contribution to Special Report Renewable Energy Sources (SRREN)
Do Not Cite or Quote 63 of 98 Chapter 3 SRREN_Draft02_Ch03 15-Jun-10
1 2 3 4 5 6 7 8 9
10 11 12 13 14 15
16 17 18 19 20 21
22 23 24 25 26
27 28 29 30 31
32 33 34 35
36 37 38 39
40 41 42 43 44 45 46 47 48
As explained in subsections 3.4.1 and 3.4.2, increasingly larger window areas become possible and affordable with the recent drop in prices of highly efficient double-glazed and triple-glazed low-e argon-filled windows. These increased window areas make systematic solar-gain control essential in mild-moderate climatic conditions, but also in continental areas that tend to be cold in winter and hot in summer. Solar-gain control techniques may increasingly rely on active systems such as motorized blinds/shades or electrochromic, thermochromic, and gasochromic coatings to admit the solar gains when they are desirable or keep them out when overheating in the living space is detected or anticipated. Solar-gain control, thermal storage design, and heating/cooling system control are three strongly linked aspects of passive solar design and control.
In any solar building, there are normally some direct-gain zones that receive high solar gains and other zones behind that are generally colder in winter. Therefore, it is beneficial to circulate air between the direct-gain zones and back zones in a solar home, even when heating is not required. With forced-air systems commonly used in North America, this is increasingly possible and the system fan may be run at low flow rate when heating is not required, thus helping to redistribute absorbed direct solar gains to the whole house (Athienitis, 2008).
During the summer period, hybrid ventilation systems and techniques may be used to provide fresh air and reduce indoor temperatures (Heiselberg, 2002). Various types of hybrid ventilation systems have been designed, tested, and applied in many types of buildings. Performance tests have found that although natural ventilation cannot maintain appropriate summer comfort conditions, the use of a hybrid system is the best choice—using at least 20% less energy than any purely mechanical system.
Finally, design tools are expected to be developed that will facilitate the simultaneous consideration of passive design, active solar-gain control, HVAC system control, and hybrid ventilation at different stages of the design of a solar building. Indeed, the systematic adoption of these technologies and their optimal integration is essential to move toward the goal of cost-effective solar buildings with net-zero annual energy consumption (IEA, 2009b).
3.7.2 Active Solar Heating and Cooling The vision of the European Solar Thermal Technology Platform (European Solar Thermal Technology Platform [ESTTP], 2006) is to establish the “Active Solar Building” as a standard for new buildings by 2030, where an Active Solar Building covers 100% of its demand for heating (and cooling, if any) with solar energy.
For existing buildings, ESTTP fosters the Active Solar Renovation, achieving massive reductions in energy consumption through energy-efficiency measures and passive solar energy. The goal is also to cover substantially more than 50% of the remaining heating and/or cooling demands with active solar energy.
Heat storage represents a key technological challenge, because the wide deployment of Active Solar Buildings largely depends on developing cost-effective and practical solutions for seasonal heat storage. The ESTTP vision assumes that by 2030, heat-storage systems will be available that allow for seasonal heat storage with an energy density eight times higher than water.
In the future, active solar systems—such as thermal collectors, PV panels, and photovoltaic-thermal systems—will be the obvious components of roof and façades. And they will be integrated into the construction process at the earliest stages of building planning. The walls will function as a component of the active heating and cooling systems, supporting the thermal energy storage through the application of advanced materials (e.g., phase-change materials). One central control system will lead to optimal regulation of the whole heating, ventilation, and air-conditioning (HVAC) system, maximizing the use of solar energy within the comfort parameters set by users. Heat- and cold-storage systems will play an increasingly important role in reaching maximum solar thermal contributions to cover the thermal requirements in buildings.
Second Order Draft Contribution to Special Report Renewable Energy Sources (SRREN)
Do Not Cite or Quote 64 of 98 Chapter 3 SRREN_Draft02_Ch03 15-Jun-10
1 2 3 4 5 6 7
8 9
10 11 12 13 14
15 16 17 18 19 20
21 22 23 24
25 26 27
28 29 30
31 32 33 34 35 36
37 38 39 40 41
42 43 44 45 46
Solar heating for industrial processes (SHIP) is currently at a very early stage of development (POSHIP Potential of Solar Heat for Industrial Processes, 2001). Worldwide, less than a hundred operating solar thermal systems for process heat are reported, with a total capacity of about 24 MWth (34,000 m²). Most systems are experimental and relatively small scale. However, great potential exists for market and technological developments, because 28% of the overall energy demand in the EU27 countries originates in the industrial sector, and much of this demand is for heat below 250°C. Education and dissemination is needed for the deployment of this technology.
In the short term, SHIP will mainly be used for low-temperature processes, ranging from 20° to 100°C. With technological development, an increasing number of medium-temperature applications—up to 250°C—will become feasible within the market. According to a published study (Werner, 2006), about 30% of the total industrial heat demand is required at temperatures below 100°C, which could theoretically be met with SHIP using current technologies. And 57% of this demand is required at temperatures below 400°C, which could largely be supplied by solar in the foreseeable future.
In several specific industry sectors—such as food, wine and beverages, transport equipment, machinery, textiles, and pulp and paper—the share of heat demand at low and medium temperatures (below 250°C) is around 60% (POSHIP Potential of Solar Heat for Industrial Processes, 2001). Tapping into this potential would provide a significant solar contribution to industrial energy requirements. Substantial potential for solar thermal systems also exists in chemical industries and in washing processes.
Among the industrial processes, desalination and water treatment (e.g., sterilization) are particularly promising applications for solar thermal energy, because these processes require large amounts of medium-temperature heat and are often necessary in areas with high solar radiation and high conventional energy costs.
3.7.3 PV Electricity Generation This subsection discusses photovoltaic technology improvements and innovation within the areas of solar PV cells, as well as the entire PV system.
Photovoltaic modules are the basic building blocks of flat-plate PV systems. Further technological efforts should lead to reduced cost, enhanced performance, and an improved environmental profile. It is useful to distinguish between technology categories that require specific R&D approaches.
First, we look at wafer-based crystalline silicon, existing thin-film technologies, and emerging and novel technologies (including “boosters” to the first two categories). The following paragraphs list R&D topics that have highest priority, with further details to be found in the various PV roadmaps, e.g., Strategic Research Agenda for Photovoltaic Solar Energy Technology (U.S. Photovoltaic Industry Roadmap Steering Committee, 2001; European Commission, 2007; NEDO, 2009).
Efficiency, energy yield, stability, and lifetime. Research often aims at optimizing rather than maximizing these parameters, which means that additional costs and gains are critically compared. Because research is primarily aimed at reducing the cost of electricity generation, it is important not to focus only on initial costs (€/Wp), but also, on lifecycle gains, i.e., actual energy yield (kWh/Wp over the economic or technical lifetime).
High-productivity manufacturing, including in-process monitoring and control. Throughput and yield are important parameters in low-cost manufacturing and essential to achieve the cost targets. In-process monitoring and control are crucial tools to increase product quality and yield. Dedicated developments are needed to bring PV manufacturing to maturity.
Second Order Draft Contribution to Special Report Renewable Energy Sources (SRREN)
Do Not Cite or Quote 65 of 98 Chapter 3 SRREN_Draft02_Ch03 15-Jun-10
2 3 4 5
7 8 9
10
11 12 13 14 15 16 17 18
19 20 21 22 23 24
25 26 27 28
29 30
31
32
33
34
35 36 37 38
39 40 41 42 43 44 45
Environmental sustainability. The energy and materials requirements in manufacturing, as 1 well as the possibilities for recycling, are important parameters in the overall environmental quality of the product. Further shortening of the energy payback time, design for recycling and, ideally, avoiding the use of critical materials are the most important issues to be addressed here.
Applicability. As discussed in more detail in the paragraphs on BOS and systems, 6 standardization and harmonization are important to bring down the costs of PV. Some related aspects must be addressed on a module level. In addition, improved ease of installation is partially related to module features. Finally, aesthetic quality of modules (and systems) is an important aspect for large scale use in the built environment.
Some PV technologies represent truly revolutionary approaches—and they will not only greatly change the way we “think and do” technology, but will herald the energy solutions for our consumers of 2030 and beyond. These advanced technologies include those that have passed some proof-of-concept phase or can be considered as mid-term (10–20-year) options to the other approaches already discussed. These emerging concepts are medium to high risk and are based on extremely low-cost materials and processes with high performance. Examples are 4- to 6-junction concentrators, multiple-junction polycrystalline thin films, crystalline silicon in the sub-100-micrometer-thick regime, multiple-junction organic PV, and hybrid solar cells.
Even further out on the timeline are concepts that offer incredible performances and/or low cost—but are yet to be demonstrated beyond some preliminary stages. These technologies are truly high risk, but have extraordinary potential involving new materials, new device architectures, and even new conversion concepts. They go beyond the normal Shockley-Queisser limits and may include biomimetic devices, quantum dots (QDs), multiple-exciton generation (MEG), and plasmonic solar cells.
Second, we look at PV concentrator systems as a separate category, because the R&D issues are fundamentally different compared to flat-plate technologies. Note, however, that some of the concepts discussed under “Emerging and novel technologies” may ultimately be especially suited for use in concentrator systems.
As mentioned in section 3.3.3, CPV offers a variety of technical solutions and these solutions are given on the system level. The research issues can be divided into the following activities:
Concentrator solar cell manufacturing
Optical system
Module assembly and fabrication method of concentrator modules and systems
System aspects, such as tracking, inverter, and installation issues.
However, it should be clearly stated once more: CPV is a system approach. The whole system is optimised only if we consider all the interconnections between the components. A corollary is that an optimised component is not necessarily the best choice for the optimal CPV system. Thus, strong interactions are required among the various research groups.
Third, we look at balance-of-system components and systems. A photovoltaic system is composed of the PV module, as well as the balance of system, which can include an inverter, storage, charge controller, system structure, and the energy network. The system must be reliable, cost effective, attractive, and mesh with the electric grid in the future (U.S. Photovoltaic Industry Roadmap Steering Committee, 2001; Navigant Consulting Inc., 2006; EU PV European Photovoltaic Technology Platform, 2007; Energy Information Administration [DOE], 2008; Kroposki et al., 2008; NEDO, 2009). Users meet PV technology at the system level, and their interest is in a
Second Order Draft Contribution to Special Report Renewable Energy Sources (SRREN)
Do Not Cite or Quote 66 of 98 Chapter 3 SRREN_Draft02_Ch03 15-Jun-10
1 2
5 6
8
9 10 11 12 13 14 15 16 17 18 19 20 21 22 23 24 25
26 27 28 29 30 31 32 33 34 35
36 37 38 39 40 41 42 43 44
45 46 47
reliable, cost-effective, and attractive solution to their energy supply needs. This research agenda concentrates on topics that will achieve one or more of the following:
Reduce costs at the component and/or system level. 3
Increase the overall performance of the system, including aspects of increased and 4 harmonised component lifetimes, reduced performance losses, and maintenance of performance levels throughout system life.
Improve the functionality of and services provided by the system, thus adding value to the 7 electricity produced.
At the component level, a major objective of balance-of-system development is to extend the lifetime of BOS components for grid-connected applications to that of the modules, typically 20 to 30 years. The highest priority is given to developing inverters, storage devices, and new designs for specific applications such as building-integrated PV. For systems installed in isolated, off-grid areas, component lifetime should be increased to around 10 years, and components for these systems need to be designed so that they require little or no maintenance. Storage devices are necessary for off-grid PV systems and will require innovative approaches to the short-term storage of small amounts of electricity (1 to 10 kWh); in addition, approaches are needed for integrating the storage component into the module, thus providing a single streamlined product that is easy to use in off-grid and remote applications. Moreover, devices for storing large amounts of electricity (over 1 MWh) will be adapted to large PV systems in the new energy network. As new module technologies emerge in the future, some of the ideas relating to BOS may need to be revised. Furthermore, the quality of the system needs to be assured and adequately maintained according to defined standards, guidelines, and procedures. To assure system quality, assessing performance is important, including on-line analysis (e.g., early fault detection) and off-line analysis of PV systems. The knowledge gathered can help to validate software for predicting the energy yield of future module and system technology designs.
To increasingly penetrate the energy network, PV systems must use technology that is compatible with the electric grid and energy supply and demand. System designs and operation technologies must also be developed in response to demand patterns by developing technology to forecast power generation volume and to optimize the storage function. Moreover, inverters must improve the quality of grid electricity by controlling reactive power or filtering harmonics with communication in a new energy network such as the Smart Grid. Furthermore, very-large-scale PV (VLS-PV) systems will be required that have capacities ranging from several megawatts to gigawatts, and practical project proposals need to be developed for implementing VLS-PV systems in desert regions (Komoto et al., 2009). In the long term, VLS-PV will play an important role in the worldwide energy network (DESERTEC Foundation, 2007)
Fourth, we look at standards, quality assurance, and safety and environmental aspects. National and especially local authorities and utilities require that PV systems meet agreed-upon standards (such as building standards, including fire- and electrical-safety requirements). In a number of cases, the development of the PV market is being hindered by either 1) existing standards, 2) differences in local standards (e.g., inverter requirements/settings), or 3) the lack of standards (e.g., PV modules/PV elements not being certified as a building element because of the lack of an appropriate standard). Standards and/or guidelines are required for the whole value chain. In many cases, the development of new and adapted standards and guidelines implies that dedicated R&D is required.
Quality assurance is an important tool that assures the effective functioning of individual components in a PV system, as well as the PV system as a whole. Standards and guidelines are an important basis for quality assurance. In-line production control procedures and guidelines must
Second Order Draft Contribution to Special Report Renewable Energy Sources (SRREN)
Do Not Cite or Quote 67 of 98 Chapter 3 SRREN_Draft02_Ch03 15-Jun-10
1 2
3 4 5 6 7 8 9
10 11
12 13 14 15 16 17 18 19 20 21 22
23 24 25 26 27 28 29 30
31 32 33 34 35 36 37 38
39 40 41 42 43 44 45
46 47 48
also be developed. At the system level, monitoring techniques must be developed for early fault detection.
Recycling is an important building block to ensure a sustainable PV industry. To date, most attention has been paid to recycling of crystalline silicon solar modules. Methods for recycling of thin-film modules and BOS components (where no recycling procedures exist) must be addressed in the future. Life-cycle assessment (LCA) studies are an important tool for evaluating the environmental profile of the various renewable energy sources. To assure the position of PV with respect to other sources, reliable LCA data are required. From these data, one can calculate properties such as the CO2 emission per kWh of electricity produced and the energy payback time. In addition, the results of LCA data can be used in the design phase of new processes and equipment for cell and module production lines.
3.7.4 CSP Electricity Generation CSP is a proven technology at the utility scale. The longevity of components has been established over two decades; operation and maintenance (O&M) aspects are understood; and there is enough operational experience to have enabled O&M cost-reduction studies to not only recommend, but also to test, those improvements. In addition, field experience has been fed back to industry and research institutes and has led to improved components and more advanced processes. Importantly, there is now substantial experience that allows researchers and developers to better understand the limits of performance, the likely potential for cost reduction, or both. Studies (Sargent and Lundy LLC Consulting Group, 2003) have concluded that cost reductions will come from technology improvement, economies of scale, and mass production. Other needed innovations related to power cycles and collectors are discussed below.
CSP is a technology driven by thermodynamics. Thus, the thermal energy conversion cycle plays a critical role in determining overall performance and cost. In general, thermodynamic cycles with higher temperatures will perform more efficiently. Of course, the solar collectors that provide the higher-temperature thermal energy to the process must be able to perform efficiently at these higher temperatures also, and today, considerable R&D attention is being given to increasing the operating temperature of CSP systems. Although CSP works with turbine cycles used by the fossil fuel industry, there are opportunities to refine turbines such that they can better accommodate the duties associated with thermal cycling invoked by solar inputs.
Considerable development is taking place to optimize the linkage between solar collectors and higher-temperature thermodynamic cycles. The most commonly used power block to date is the steam turbine (Rankine cycle). The steam turbine is most efficient and most cost effective in large capacities. Present trough plants using oil as the heat-transfer fluid limit steam-turbine temperatures to 370°C and turbine cycle efficiencies of around 37%, leading to design-point solar-to-electric efficiencies on the order of 18% and annual average efficiency of 14%. To increase efficiency, alternatives to the use of oil as the heat-transfer fluid—such as producing steam directly in the receiver, or molten salts—are being developed for troughs.
These fluids and others are already preferred for central receivers. Central receivers and dishes are capable of reaching the upper limits of these fluids (around 600°C for present molten salts) for advanced steam-turbine cycles, whether subcritical or supercritical pressure, and they can also provide the temperatures needed for higher-efficiency cycles such as gas turbines (Brayton cycle) and Stirling engines. Such high-temperature cycles have the capacity to boost design-point solar-to-electricity efficiency to 35% and annual average efficiency to 25%. The penalty for dry cooling is also reduced.
The collector is the single largest area for potential cost reduction in CSP plants. For CSP collectors, the objective is to lower their cost while achieving the higher optical efficiency necessary for powering higher-temperature cycles. Trough technology will benefit from continuing
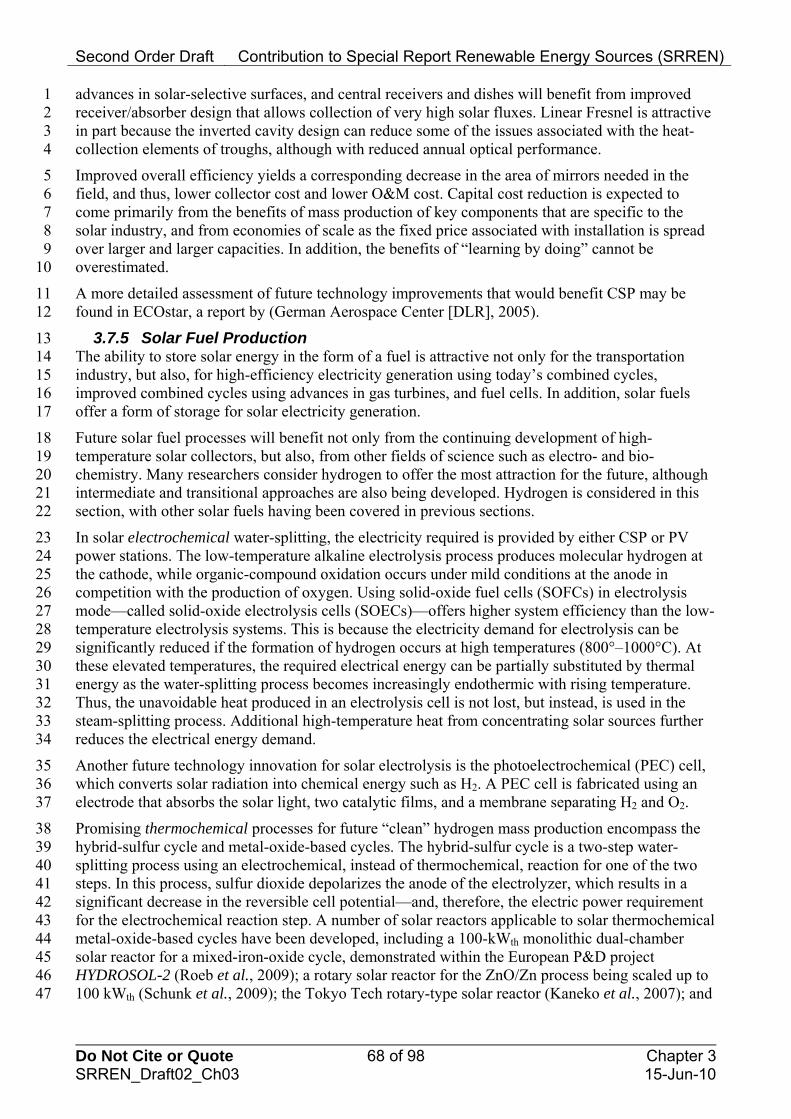
Second Order Draft Contribution to Special Report Renewable Energy Sources (SRREN)
Do Not Cite or Quote 68 of 98 Chapter 3 SRREN_Draft02_Ch03 15-Jun-10
1 2 3 4
5 6 7 8 9
10
11 12
13 14 15 16 17
18 19 20 21 22
23 24 25 26 27 28 29 30 31 32 33 34
35 36 37
38 39 40 41 42 43 44 45 46 47
advances in solar-selective surfaces, and central receivers and dishes will benefit from improved receiver/absorber design that allows collection of very high solar fluxes. Linear Fresnel is attractive in part because the inverted cavity design can reduce some of the issues associated with the heat-collection elements of troughs, although with reduced annual optical performance.
Improved overall efficiency yields a corresponding decrease in the area of mirrors needed in the field, and thus, lower collector cost and lower O&M cost. Capital cost reduction is expected to come primarily from the benefits of mass production of key components that are specific to the solar industry, and from economies of scale as the fixed price associated with installation is spread over larger and larger capacities. In addition, the benefits of “learning by doing” cannot be overestimated.
A more detailed assessment of future technology improvements that would benefit CSP may be found in ECOstar, a report by (German Aerospace Center [DLR], 2005).
3.7.5 Solar Fuel Production The ability to store solar energy in the form of a fuel is attractive not only for the transportation industry, but also, for high-efficiency electricity generation using today’s combined cycles, improved combined cycles using advances in gas turbines, and fuel cells. In addition, solar fuels offer a form of storage for solar electricity generation.
Future solar fuel processes will benefit not only from the continuing development of high-temperature solar collectors, but also, from other fields of science such as electro- and bio-chemistry. Many researchers consider hydrogen to offer the most attraction for the future, although intermediate and transitional approaches are also being developed. Hydrogen is considered in this section, with other solar fuels having been covered in previous sections.
In solar electrochemical water-splitting, the electricity required is provided by either CSP or PV power stations. The low-temperature alkaline electrolysis process produces molecular hydrogen at the cathode, while organic-compound oxidation occurs under mild conditions at the anode in competition with the production of oxygen. Using solid-oxide fuel cells (SOFCs) in electrolysis mode—called solid-oxide electrolysis cells (SOECs)—offers higher system efficiency than the low-temperature electrolysis systems. This is because the electricity demand for electrolysis can be significantly reduced if the formation of hydrogen occurs at high temperatures (800°–1000°C). At these elevated temperatures, the required electrical energy can be partially substituted by thermal energy as the water-splitting process becomes increasingly endothermic with rising temperature. Thus, the unavoidable heat produced in an electrolysis cell is not lost, but instead, is used in the steam-splitting process. Additional high-temperature heat from concentrating solar sources further reduces the electrical energy demand.
Another future technology innovation for solar electrolysis is the photoelectrochemical (PEC) cell, which converts solar radiation into chemical energy such as H2. A PEC cell is fabricated using an electrode that absorbs the solar light, two catalytic films, and a membrane separating H2 and O2.
Promising thermochemical processes for future “clean” hydrogen mass production encompass the hybrid-sulfur cycle and metal-oxide-based cycles. The hybrid-sulfur cycle is a two-step water-splitting process using an electrochemical, instead of thermochemical, reaction for one of the two steps. In this process, sulfur dioxide depolarizes the anode of the electrolyzer, which results in a significant decrease in the reversible cell potential—and, therefore, the electric power requirement for the electrochemical reaction step. A number of solar reactors applicable to solar thermochemical metal-oxide-based cycles have been developed, including a 100-kWth monolithic dual-chamber solar reactor for a mixed-iron-oxide cycle, demonstrated within the European P&D project HYDROSOL-2 (Roeb et al., 2009); a rotary solar reactor for the ZnO/Zn process being scaled up to 100 kWth (Schunk et al., 2009); the Tokyo Tech rotary-type solar reactor (Kaneko et al., 2007); and

Second Order Draft Contribution to Special Report Renewable Energy Sources (SRREN)
Do Not Cite or Quote 69 of 98 Chapter 3 SRREN_Draft02_Ch03 15-Jun-10
1 2
3 4 5 6 7 8
9 10 11 12 13 14 15
16 17 18 19
20 21 22 23 24 25 26 27
28 29 30 31 32 33
34 35 36 37 38 39 40 41
42 43 44 45 46 47 48
the Counter-Rotating-Ring Receiver/Reactor/Recuperator (CR5), a device using recuperation of sensible heat to efficiently produce H2 in a two-step thermochemical process (Miller et al., 2008).
High temperatures demanded by the thermodynamics of the thermochemical processes pose severe material challenges and also increase re-radiation losses from the reactor, thereby lowering the absorption efficiency (Steinfeld and Meier, 2004). The overall energy conversion efficiency is improved by reducing thermal losses at high temperatures through improved mirror optics and cavity-receiver design, and by recovering part of the sensible heat from the thermochemical processes.
High-temperature thermochemical processes require thermally and chemically stable reactor-wall materials that can withstand the severe operating conditions of the various solar fuel production processes. For many lower-temperature processes (e.g., sulfur-based thermochemical cycles), the major issue is corrosion. For very high-temperature metal-oxide cycles, the challenge is the thermal shock resistance of the ceramic wall materials. Near-term solutions include surface modification of thermally compatible refractory materials such as graphite and silicon carbide. Longer-term solutions include modifications of bulk materials. Novel reactor designs may prevent wall reactions.
A key aspect is integrating the chemical process into the solar concentrating system. The concentrating optics—consisting of heliostats and secondary concentrators (compound parabolic concentrator, CPC)—need to be further developed and specifically optimized to obtain high solar-flux intensities and high temperatures in solar chemical reactors for producing fuels.
Photochemical and photobiological processes are other candidates for solar fuel conversion. Future innovative technologies are being developed for producing biofuels from modified photosynthetic microorganisms and chemical solar cells for fuel production. Both approaches have the potential to provide fuels with solar energy conversion efficiencies much better than those based on field crops. Artificial solar-driven fuel production will require biomimetic nanotechnology, where scientists must develop a series of fundamental and technologically advanced multi-electron redox catalysts coupled to photochemical elements. Hydrogen production by these methods at scale is still distant, but has vast potential.
A combination of all three forms is found in the synthesis of biogas with solar hydrogen. Biogas, a mixture of methane and CO2, is produced via conventional photosynthesis. Solar hydrogen is added by electrochemical water-splitting. Bio-CO2 reacts with hydrogen in a thermochemical process to generate hydrocarbons such as substitute natural gas (SNG) or liquid solar fuels (Sterner, 2009). These approaches are still nascent, but have a feasible economic potential in the future as fossil fuel prices increase and solar power generation costs continue to decrease.
3.7.6 Other Potential Future Applications There are also methods for producing electricity by solar thermal without the need for an intermediate thermodynamic cycle. This direct solar thermal power generation includes such concepts as thermoelectric, thermionic, magnetohydrodynamic, and alkali-metal methods. The thermoelectric concept is the most investigated to date, and all have the attraction that the absence of a heat engine should mean a quieter and theoretically more-efficient method of producing electricity, with suitability for distributed generation. Specialised applications include military and space power.
Space-based solar power (SSP) is the concept of collecting vast quantities of solar power in space using large satellites in Earth orbit, then sending that power to receiving antennae (rectennae) on Earth via microwave power beaming. The concept was first introduced in 1968 by Peter Glaser (Glaser, 1968). NASA and the U.S. Department of Energy studied SSP extensively in the 1970s as a possible solution to the energy crisis of that time. Scientists studied system concepts for satellites large enough to send gigawatts of power to Earth and concluded that the concept seemed technically feasible and environmentally safe; but the state of enabling technologies was insufficient

Second Order Draft Contribution to Special Report Renewable Energy Sources (SRREN)
Do Not Cite or Quote 70 of 98 Chapter 3 SRREN_Draft02_Ch03 15-Jun-10
1 2 3 4 5 6
8
10 11 12 13 14 15
16 17 18 19 20 21 22 23
to make SSP economically competitive. Since the 1970s, however, great advances have been made in these technologies, such as high-efficiency photovoltaic cells, highly efficient solid-state microwave power electronics, and lower-cost space launch vehicles (Mankins, 1997; Kaya et al., 2001; Hoffert et al., 2002; Mankins, 2002; Mankins, 2009). Still, significant breakthroughs will be required to achieve cost-competitive terrestrial baseload power (National Academy of Sciences, 2004).
3.8 Cost Trends 7
This section provides cost trends for the five direct solar technology areas.
3.8.1 Passive Solar Technologies 9 High-performance building envelopes entail greater up-front construction costs, but lower energy-related costs during the lifetime of the building (Harvey, 2006). The total up-front cost of the building may or may not be higher, depending on the extent to which heating and cooling systems can be downsized, simplified, or eliminated altogether as a result of the high-performance envelope. Any additional up-front cost will be compensated for, to some extent, by reduced energy costs over the lifetime of the building.
Figure 3.26 compares differences in the life-cycle costs when additional heating costs are computed for each level of insulation relative to the highest level of insulation considered. Although the specific incremental construction costs that should be used in any given location will differ from those used in Figure 3.26 there is very little difference in the life-cycle cost if insulation levels moderately worse or moderately better than the least-cost level are chosen. Although the life-cycle cost associated with the highest insulation level is not the smallest life-cycle cost, it is not substantially greater than the minimum life-cycle cost when the fuel cost is 15 USD/GJ or 20 USD/GJ, and is less than the life-cycle cost at low levels of insulation.
24 25 Figure 3.26: Comparison of incremental life-cycle costs of walls with increasing amounts of
insulation. [TSU: source missing, geographical location/heat requirements not specified, US $ 2005 26 conversion?] 27
28 29
Differences in life-cycle costs are influenced by the length of time over which life-cycle costs are computed and by the rate of inflation in energy costs. A 30-year timeframe was chosen in Figure 3.24 [TSU: reference not correct] because mortgages in North America are typically of this duration. However, much longer mortgages are common in Europe, and in any case, the lifespan of the building should be closer to 100 years. Figure 3.27 compares the incremental life-cycle costs for
30 31 32
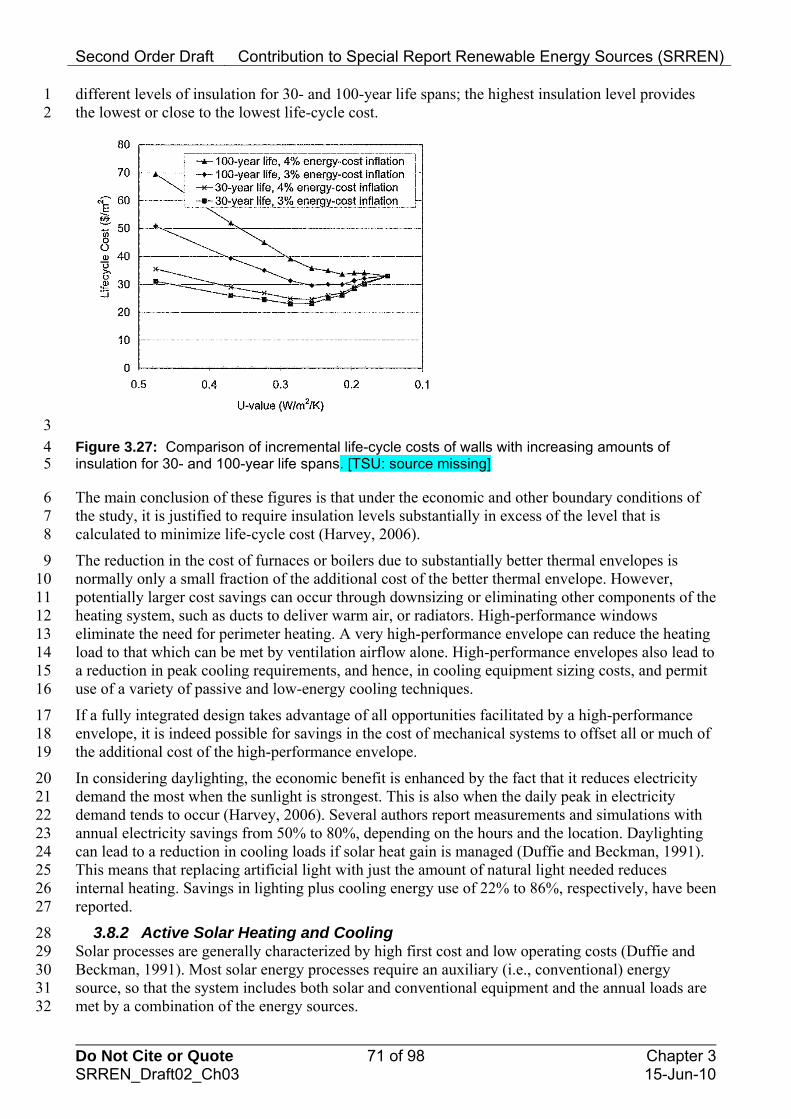
Second Order Draft Contribution to Special Report Renewable Energy Sources (SRREN)
Do Not Cite or Quote 71 of 98 Chapter 3 SRREN_Draft02_Ch03 15-Jun-10
1 2
different levels of insulation for 30- and 100-year life spans; the highest insulation level provides the lowest or close to the lowest life-cycle cost.
3 4 Figure 3.27: Comparison of incremental life-cycle costs of walls with increasing amounts of
insulation for 30- and 100-year life spans. [TSU: source missing] 5
6 7 8
9 10 11 12 13 14 15 16
17 18 19
20 21 22 23 24 25 26 27
28 29 30 31 32
The main conclusion of these figures is that under the economic and other boundary conditions of the study, it is justified to require insulation levels substantially in excess of the level that is calculated to minimize life-cycle cost (Harvey, 2006).
The reduction in the cost of furnaces or boilers due to substantially better thermal envelopes is normally only a small fraction of the additional cost of the better thermal envelope. However, potentially larger cost savings can occur through downsizing or eliminating other components of the heating system, such as ducts to deliver warm air, or radiators. High-performance windows eliminate the need for perimeter heating. A very high-performance envelope can reduce the heating load to that which can be met by ventilation airflow alone. High-performance envelopes also lead to a reduction in peak cooling requirements, and hence, in cooling equipment sizing costs, and permit use of a variety of passive and low-energy cooling techniques.
If a fully integrated design takes advantage of all opportunities facilitated by a high-performance envelope, it is indeed possible for savings in the cost of mechanical systems to offset all or much of the additional cost of the high-performance envelope.
In considering daylighting, the economic benefit is enhanced by the fact that it reduces electricity demand the most when the sunlight is strongest. This is also when the daily peak in electricity demand tends to occur (Harvey, 2006). Several authors report measurements and simulations with annual electricity savings from 50% to 80%, depending on the hours and the location. Daylighting can lead to a reduction in cooling loads if solar heat gain is managed (Duffie and Beckman, 1991). This means that replacing artificial light with just the amount of natural light needed reduces internal heating. Savings in lighting plus cooling energy use of 22% to 86%, respectively, have been reported.
3.8.2 Active Solar Heating and Cooling Solar processes are generally characterized by high first cost and low operating costs (Duffie and Beckman, 1991). Most solar energy processes require an auxiliary (i.e., conventional) energy source, so that the system includes both solar and conventional equipment and the annual loads are met by a combination of the energy sources.
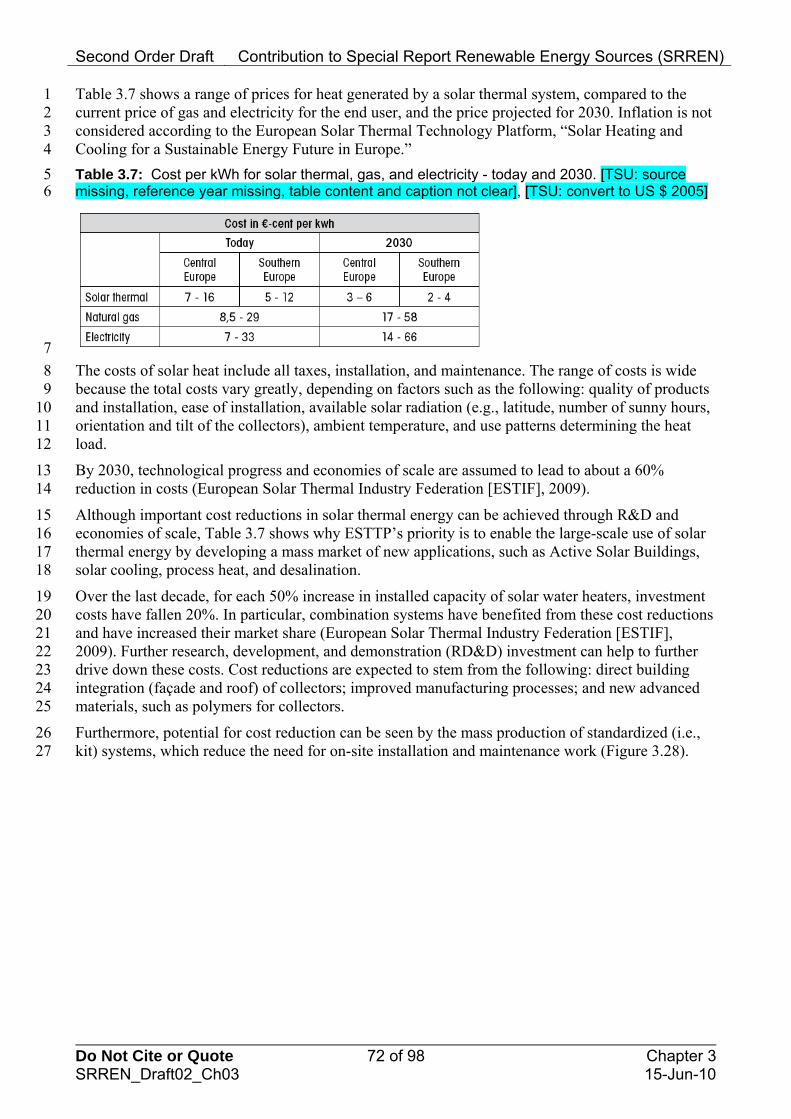
Second Order Draft Contribution to Special Report Renewable Energy Sources (SRREN)
Do Not Cite or Quote 72 of 98 Chapter 3 SRREN_Draft02_Ch03 15-Jun-10
1 2 3 4
Table 3.7 shows a range of prices for heat generated by a solar thermal system, compared to the current price of gas and electricity for the end user, and the price projected for 2030. Inflation is not considered according to the European Solar Thermal Technology Platform, “Solar Heating and Cooling for a Sustainable Energy Future in Europe.”
Table 3.7: Cost per kWh for solar thermal, gas, and electricity - today and 2030. [TSU: source 5 missing, reference year missing, table content and caption not clear], [TSU: convert to US $ 2005] 6
7
8 9
10 11 12
13 14
15 16 17 18
19 20 21 22 23 24 25
26 27
The costs of solar heat include all taxes, installation, and maintenance. The range of costs is wide because the total costs vary greatly, depending on factors such as the following: quality of products and installation, ease of installation, available solar radiation (e.g., latitude, number of sunny hours, orientation and tilt of the collectors), ambient temperature, and use patterns determining the heat load.
By 2030, technological progress and economies of scale are assumed to lead to about a 60% reduction in costs (European Solar Thermal Industry Federation [ESTIF], 2009).
Although important cost reductions in solar thermal energy can be achieved through R&D and economies of scale, Table 3.7 shows why ESTTP’s priority is to enable the large-scale use of solar thermal energy by developing a mass market of new applications, such as Active Solar Buildings, solar cooling, process heat, and desalination.
Over the last decade, for each 50% increase in installed capacity of solar water heaters, investment costs have fallen 20%. In particular, combination systems have benefited from these cost reductions and have increased their market share (European Solar Thermal Industry Federation [ESTIF], 2009). Further research, development, and demonstration (RD&D) investment can help to further drive down these costs. Cost reductions are expected to stem from the following: direct building integration (façade and roof) of collectors; improved manufacturing processes; and new advanced materials, such as polymers for collectors.
Furthermore, potential for cost reduction can be seen by the mass production of standardized (i.e., kit) systems, which reduce the need for on-site installation and maintenance work (Figure 3.28).
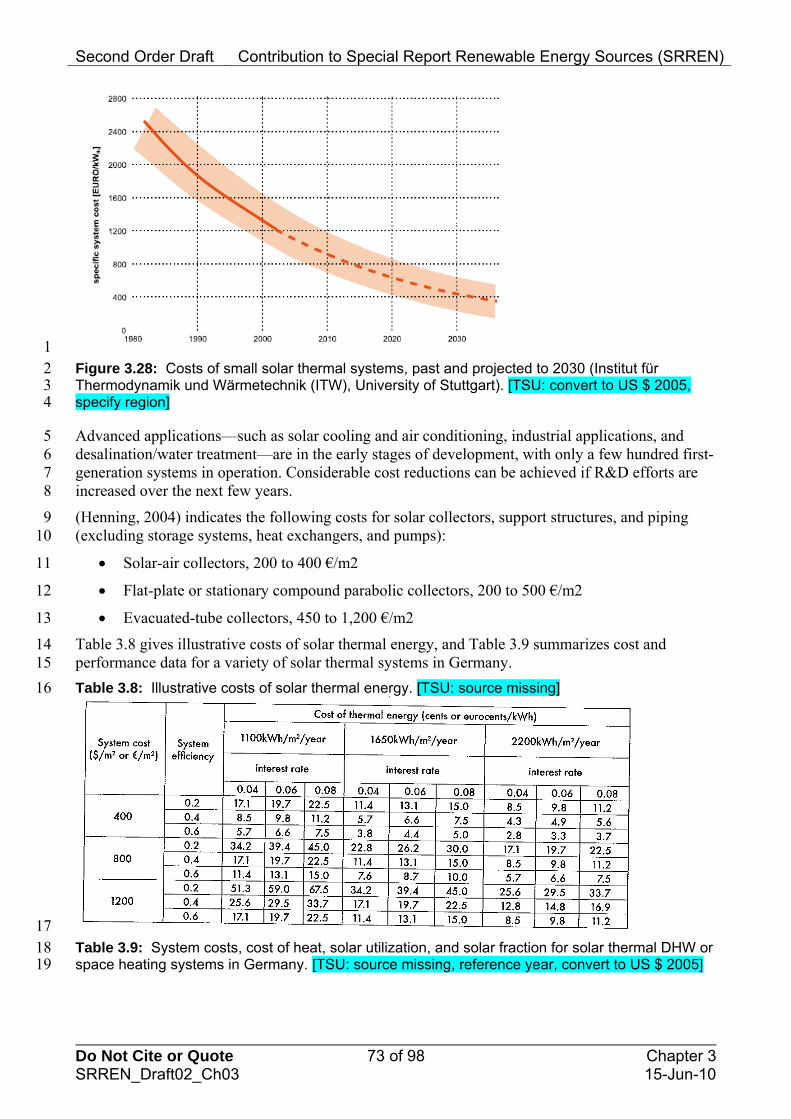
Second Order Draft Contribution to Special Report Renewable Energy Sources (SRREN)
Do Not Cite or Quote 73 of 98 Chapter 3 SRREN_Draft02_Ch03 15-Jun-10
1 2 Figure 3.28: Costs of small solar thermal systems, past and projected to 2030 (Institut für
Thermodynamik und Wärmetechnik (ITW), University of Stuttgart). [TSU: convert to US $ 2005, 3 specify region] 4
5 6 7 8
9 10
11
12
13
14 15
Advanced applications—such as solar cooling and air conditioning, industrial applications, and desalination/water treatment—are in the early stages of development, with only a few hundred first-generation systems in operation. Considerable cost reductions can be achieved if R&D efforts are increased over the next few years.
(Henning, 2004) indicates the following costs for solar collectors, support structures, and piping (excluding storage systems, heat exchangers, and pumps):
Solar-air collectors, 200 to 400 €/m2
Flat-plate or stationary compound parabolic collectors, 200 to 500 €/m2
Evacuated-tube collectors, 450 to 1,200 €/m2
Table 3.8 gives illustrative costs of solar thermal energy, and Table 3.9 summarizes cost and performance data for a variety of solar thermal systems in Germany.
Table 3.8: Illustrative costs of solar thermal energy. [TSU: source missing] 16
17 18 Table 3.9: System costs, cost of heat, solar utilization, and solar fraction for solar thermal DHW or
space heating systems in Germany. [TSU: source missing, reference year, convert to US $ 2005] 19
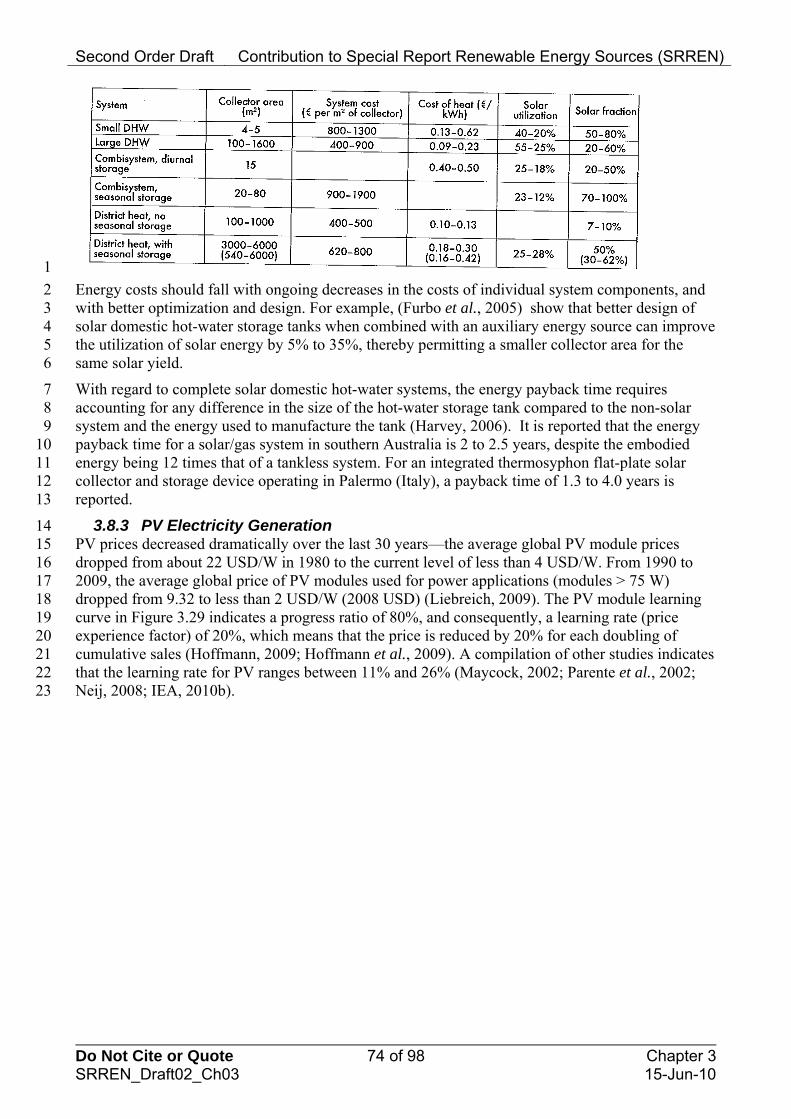
Second Order Draft Contribution to Special Report Renewable Energy Sources (SRREN)
Do Not Cite or Quote 74 of 98 Chapter 3 SRREN_Draft02_Ch03 15-Jun-10
1
2 3 4 5 6
7 8 9
10 11 12 13
14 15 16 17 18 19 20 21 22 23
Energy costs should fall with ongoing decreases in the costs of individual system components, and with better optimization and design. For example, (Furbo et al., 2005) show that better design of solar domestic hot-water storage tanks when combined with an auxiliary energy source can improve the utilization of solar energy by 5% to 35%, thereby permitting a smaller collector area for the same solar yield.
With regard to complete solar domestic hot-water systems, the energy payback time requires accounting for any difference in the size of the hot-water storage tank compared to the non-solar system and the energy used to manufacture the tank (Harvey, 2006). It is reported that the energy payback time for a solar/gas system in southern Australia is 2 to 2.5 years, despite the embodied energy being 12 times that of a tankless system. For an integrated thermosyphon flat-plate solar collector and storage device operating in Palermo (Italy), a payback time of 1.3 to 4.0 years is reported.
3.8.3 PV Electricity Generation PV prices decreased dramatically over the last 30 years—the average global PV module prices dropped from about 22 USD/W in 1980 to the current level of less than 4 USD/W. From 1990 to 2009, the average global price of PV modules used for power applications (modules > 75 W) dropped from 9.32 to less than 2 USD/W (2008 USD) (Liebreich, 2009). The PV module learning curve in Figure 3.29 indicates a progress ratio of 80%, and consequently, a learning rate (price experience factor) of 20%, which means that the price is reduced by 20% for each doubling of cumulative sales (Hoffmann, 2009; Hoffmann et al., 2009). A compilation of other studies indicates that the learning rate for PV ranges between 11% and 26% (Maycock, 2002; Parente et al., 2002; Neij, 2008; IEA, 2010b).
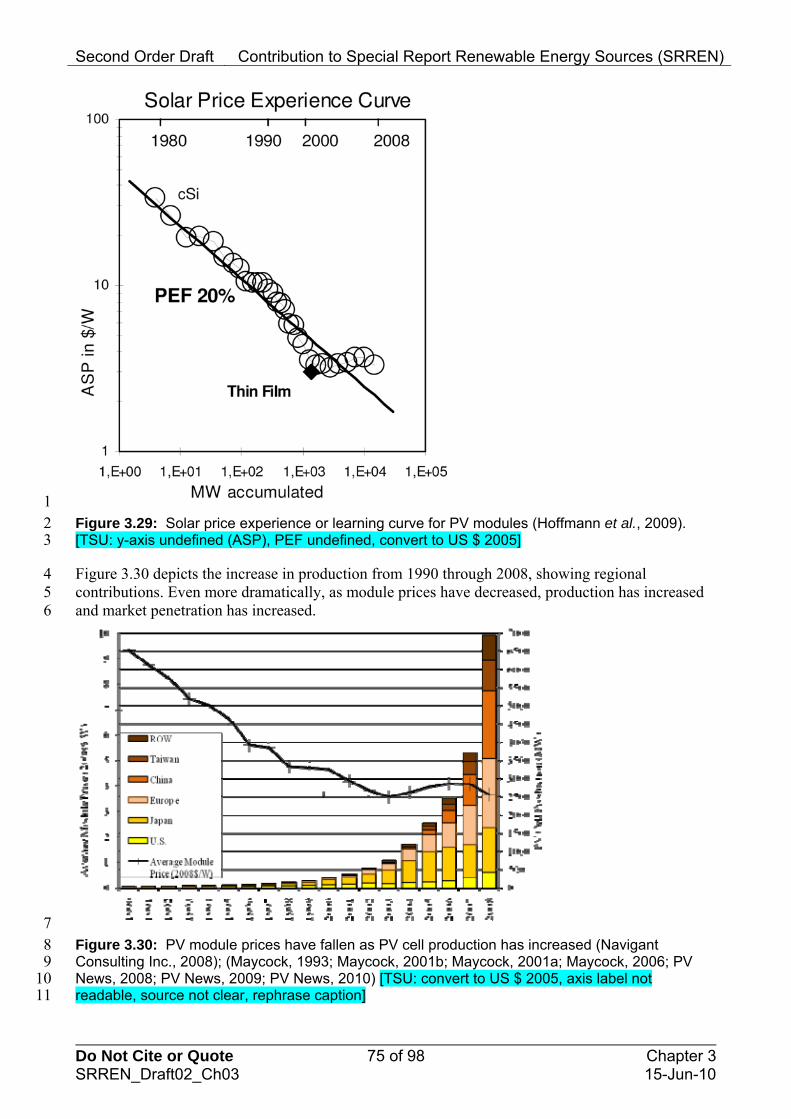
Second Order Draft Contribution to Special Report Renewable Energy Sources (SRREN)
Do Not Cite or Quote 75 of 98 Chapter 3 SRREN_Draft02_Ch03 15-Jun-10
1 2 Figure 3.29: Solar price experience or learning curve for PV modules (Hoffmann et al., 2009).
[TSU: y-axis undefined (ASP), PEF undefined, convert to US $ 2005] 3
4 5 6
Figure 3.30 depicts the increase in production from 1990 through 2008, showing regional contributions. Even more dramatically, as module prices have decreased, production has increased and market penetration has increased.
7 8 9
Figure 3.30: PV module prices have fallen as PV cell production has increased (Navigant Consulting Inc., 2008); (Maycock, 1993; Maycock, 2001b; Maycock, 2001a; Maycock, 2006; PV News, 2008; PV News, 2009; PV News, 2010) [TSU: convert to US $ 2005, axis label not 10 readable, source not clear, rephrase caption] 11
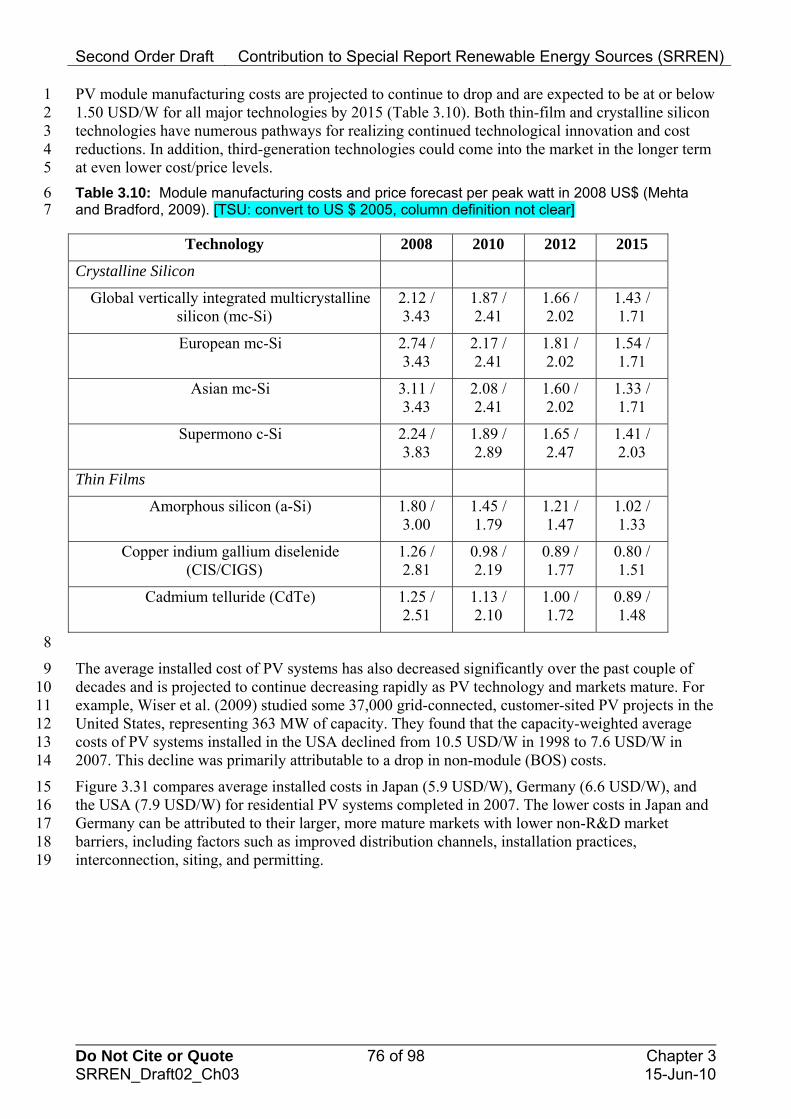
Second Order Draft Contribution to Special Report Renewable Energy Sources (SRREN)
Do Not Cite or Quote 76 of 98 Chapter 3 SRREN_Draft02_Ch03 15-Jun-10
1 2 3 4 5
6
PV module manufacturing costs are projected to continue to drop and are expected to be at or below 1.50 USD/W for all major technologies by 2015 (Table 3.10). Both thin-film and crystalline silicon technologies have numerous pathways for realizing continued technological innovation and cost reductions. In addition, third-generation technologies could come into the market in the longer term at even lower cost/price levels.
Table 3.10: Module manufacturing costs and price forecast per peak watt in 2008 US$ (Mehta and Bradford, 2009). [TSU: convert to US $ 2005, column definition not clear] 7
Technology 2008 2010 2012 2015
Crystalline Silicon
Global vertically integrated multicrystalline silicon (mc-Si)
2.12 / 3.43
1.87 / 2.41
1.66 / 2.02
1.43 / 1.71
European mc-Si 2.74 / 3.43
2.17 / 2.41
1.81 / 2.02
1.54 / 1.71
Asian mc-Si 3.11 / 3.43
2.08 / 2.41
1.60 / 2.02
1.33 / 1.71
Supermono c-Si 2.24 / 3.83
1.89 / 2.89
1.65 / 2.47
1.41 / 2.03
Thin Films
Amorphous silicon (a-Si) 1.80 / 3.00
1.45 / 1.79
1.21 / 1.47
1.02 / 1.33
Copper indium gallium diselenide (CIS/CIGS)
1.26 / 2.81
0.98 / 2.19
0.89 / 1.77
0.80 / 1.51
Cadmium telluride (CdTe) 1.25 / 2.51
1.13 / 2.10
1.00 / 1.72
0.89 / 1.48
8
9 10 11 12 13 14
15 16 17 18 19
The average installed cost of PV systems has also decreased significantly over the past couple of decades and is projected to continue decreasing rapidly as PV technology and markets mature. For example, Wiser et al. (2009) studied some 37,000 grid-connected, customer-sited PV projects in the United States, representing 363 MW of capacity. They found that the capacity-weighted average costs of PV systems installed in the USA declined from 10.5 USD/W in 1998 to 7.6 USD/W in 2007. This decline was primarily attributable to a drop in non-module (BOS) costs.
Figure 3.31 compares average installed costs in Japan (5.9 USD/W), Germany (6.6 USD/W), and the USA (7.9 USD/W) for residential PV systems completed in 2007. The lower costs in Japan and Germany can be attributed to their larger, more mature markets with lower non-R&D market barriers, including factors such as improved distribution channels, installation practices, interconnection, siting, and permitting.

Second Order Draft Contribution to Special Report Renewable Energy Sources (SRREN)
Do Not Cite or Quote 77 of 98 Chapter 3 SRREN_Draft02_Ch03 15-Jun-10
$0
$2
$4
$6
$8
$10
Japan Germany United States
Ave
rag
e R
esid
enti
al P
V
Inst
alle
d C
ost
wit
ho
ut
Sal
es
Tax
(20
07$/
W)
0
1,000
2,000
3,000
4,000
5,000
Cu
mu
lati
ve G
rid
-Co
nn
ecte
d
Cap
acit
y th
rou
gh
200
7 (M
W)
Avg. Installed Cost of Residential Systems (left axis)
Cumulative Grid-Connected Capacity (right axis)
1 2 Figure 3.31: Average installed cost of residential PV systems completed in 2007, in Japan,
Germany, and the USA (Wiser et al., 2009) [TSU: convert to US $ 2005] 3
4 5 6 7 8 9
10
11
Since the second half of 2008, PV system prices have decreased considerably. This decrease is due to the increased competition between PV companies because of huge increases in production capacity and production overcapacities. The first-quarter 2010 average PV system price in Germany dropped to 2,864 €/kWp (2005 US $: 3,315 $/kWp) (Bundesverband Solarwirtschaft e.V., 2009). In 2009, thin-film projects were realized as low as 2.72 $/Wp (2005 US $; 3 $/Wp in 2009 $) (Liebreich, 2009). The resulting levelized cost of energy (LCOE) varied between 0.145 and 0.363 $/Wp (0.16 and 0.40 $/Wp in 2009 $).
Today, the cost of PV electricity generation in regions of high solar irradiance is already in the range of 17 to 20 €ct/kWh in Europe and the U.S. Until 2020, the cost is expected to be reduced 12 more than 50% down to about 8 $ct/kWh (Breyer et al., 2009) [TSU: convert to US $ 2005]. 13
14 15 16 17 18
19 20 21 22
23 24 25 26 27
The goal of the U.S. Department of Energy (DOE) Solar Energy Technology Program expressed in its Technology Plan is to make PV-generated electricity cost-competitive with conventional energy sources in the USA by 2015. Specific energy cost targets for various market sectors are 0.08 to 0.10 USD/kWh for residential, 0.06 to 0.08 USD/kWh for commercial, and 0.05 to 0.07 USD/kWh for utilities.
Funding of PV R&D over the past decades has supported innovation and gains in PV cell quality, efficiencies, and price. Public budgets for R&D programs in the IEA Photovoltaic Power Systems Programme countries collectively reached about 330 million USD, with the USA, Germany, and Japan contributing 138, 61, and 39 million USD, respectively (IEA, 2008).
3.8.4 CSP Electricity Generation Solar thermal electricity systems are a complex technology operating in a complex resource and financial environment, so many factors affect life-cycle cost calculations (Gordon, 2001). A study for the World Bank (World Bank Global Environment Facility Program, 2006) suggested four phases in cost reduction for CSP technology and that cost competitiveness with fossil fuel could be reached by 2025. [TSU: reference to Fig.3.32 missing] 28
Second Order Draft Contribution to Special Report Renewable Energy Sources (SRREN)
Do Not Cite or Quote 78 of 98 Chapter 3 SRREN_Draft02_Ch03 15-Jun-10
1 2 Figure 3.32: Energy cost (in U.S. cents per kWh) for PV and three CSP technologies from 1990 to
2030. [TSU: source missing] 3
4 5 6 7
8 9
10 11 12 13 14 15
16 17 18 19
20 21 22 23 24 25 26 27
The total investment for the nine stations making up the 354 MWe of Solar Electric Generating Station plants in California (installed from 1985 to 1991) was 1.25 billion USD (nominal, not adjusted for inflation). For the nominal 64-MWe Nevada Solar One plant installed in 2007, construction and associated costs amounted to 260 million USD.
The publicized capital costs of CSP plants are often confused when compared with other renewables, as varying levels of integrated thermal storage increase the capital cost, but also improve the annual output and capacity factor of the plant. The U.S. DOE CSP initiative that funds R&D projects with U.S. companies is focusing on thermal storage, concentrator component manufacturing, and advanced CSP systems and components (U.S. Department of Energy, 2008). The projects are aiming to reduce today’s energy costs to 0.07 to 0.10 USD/kWh by 2015 and to less than 0.07 USD/kWh with 12 to 17 hours of storage by 2020. The European Union is pursuing similar goals through a comprehensive RD&D program.
The learning ratio for CSP, excluding the power block, is given as 10% ±5% by Neij (2008; IEA, 2010a). Other studies provide learning rates according to CSP components: Trieb et al. (2009) give 10% for solar field, 8% for storage, and 2% for power block, and NEEDS (2009) states 12% for solar field, 12% for storage, and 5% for power block.
3.8.5 Solar Fuels Production Thermochemical cycles along with electrolysis of water are the most-promising processes for “clean” hydrogen production for the future. In a comparison study, both the hybrid-sulfur cycle and a metal-oxide-based cycle were operated by solar tower technology for multi-stage water-splitting (Graf et al., 2008). The electricity required for the alkaline electrolysis was produced by a parabolic trough power plant. For each process, the investment, operating, and hydrogen production costs were calculated on a 50 MWth scale. The study points out the economic potential of sustainable hydrogen production using solar energy and thermochemical cycles compared to commercial electrolysis. A sensitivity analysis was done for three different cost scenarios. Hydrogen production 28 costs ranged from 3.9 to 5.6 €/kg for the hybrid-sulfur cycle, from 3.5 to 12.8 €/kg for the metal-29 oxide-based cycle, and 2.1 to 6.8 €/kg for alkaline electrolysis. [TSU: convert to US $ 2005] The weaknesses of these economic assessments are primarily related to the uncertainties in the viable efficiencies and investment costs of the various solar components due to their early stage of development and their economy of scale (Steinfeld and Meier, 2004).
30 31 32 33

Second Order Draft Contribution to Special Report Renewable Energy Sources (SRREN)
Do Not Cite or Quote 79 of 98 Chapter 3 SRREN_Draft02_Ch03 15-Jun-10
1 A substitute natural gas can be produced by the combination of solar hydrogen and CO2 in a thermochemical synthesis at cost ranges from 8 to 10 €cent/kWhth with renewable power costs of 2 2 to 4 €ct/kWhel (Sterner, 2009). [TSU: convert to US $ 2005] These costs are highly dependent on the operation mode of the plant and can be reduced by improving efficiency and reducing electricity costs.
3 4 5
7 8 9
10 11 12 13 14
15 16 17 18
19 20 21 22 23 24 25 26 27
28 29 30 31 32
33 34 35 36 37 38 39
40 41 42
43 44 45 46 47
3.9 Potential Deployment 6
The potential of direct solar energy is often underestimated. The reason is because 1) direct solar covers a wide range of technologies and applications, and 2) most scenarios only look into common indicators such as the share of primary energy, electricity, heat, or transport fuel from renewable energy sources. These indicators do not consider that a number of applications of direct solar energy may contribute only small numbers to these indicators, but that the value provided—and, consequently, the reason why people use them—is much higher. In addition, Martinot et al. (2007) explain that the different scenario targets use different accounting methods, which lead to quite different outcomes.
One example is the difference between the International Energy Agency (IEA) method and the British Petroleum (BP) method used for their Statistical Review of World Energy to account for primary energy (British Petroleum, 2008). This difference is discussed in Chap.1, as well as in a box in Chap. 10.
The issue is how one accounts for distributed stand-alone generation of solar electricity and low-temperature solar heat. In addition, storage is never considered in these studies. These indicators are rarely used in scenarios, but they are becoming more important as these applications grow in use. As pointed out in section 3.4, the IEA's Solar Heating & Cooling Programme, together with the European Solar Thermal Industry Federation and other major solar thermal trade associations, has decided to publish statistics in kWth (kilowatt thermal) and has agreed to use a factor of 0.7 kWth/m
2 to convert square meters of collector area into kWth. However, an unresolved issue is what statistical number to use for the primary energy part of heat—either the total produced or the actual used.
This section presents the near-term and long-term forecasts for solar energy deployment. Then we comment on the prospects and barriers to solar energy deployment in the longer-term scenarios, and the role of the deployment of solar energy in meeting different GHG mitigation targets. This discussion is based on energy-market forecasts and carbon and energy scenarios published in recent literature.
3.9.1 Near-Term Forecasts Currently, the main market drivers are the various national support programs for solar-powered electricity systems or low-temperature solar heat installations. These programs either support the installation of the systems or the generated electricity. The scenarios for the potential deployment of the technology depend strongly on public support to develop markets, which can then drive down costs along the learning curves. It is important to remember that learning curves depend on actual production volume, not on time.
The markets for the different solar technologies vary significantly between the technologies. But they also vary regionally for the same technology. This fact leads to very different thresholds and barriers for becoming competitive with existing technologies.
Table 3.11 shows scenarios developed for solar capacities. It should be highlighted that passive solar gains are not included in these statistics, because this technology reduces the demand and is not part of the supply chain considered by the energy statistics. The same PV technology can be applied for stand-alone, mini-grid, or hybrid systems in remote areas without grid connection, as well as for distributed and centralized grid-connected systems. The deployment of CSP technology
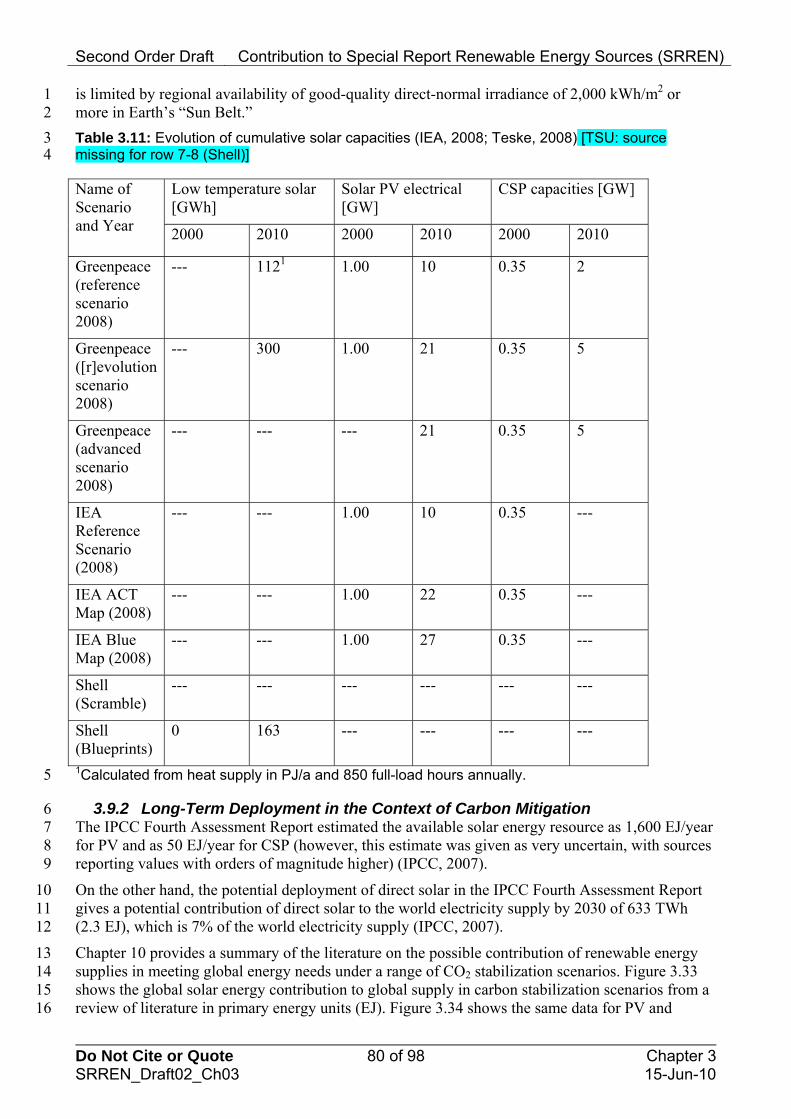
Second Order Draft Contribution to Special Report Renewable Energy Sources (SRREN)
Do Not Cite or Quote 80 of 98 Chapter 3 SRREN_Draft02_Ch03 15-Jun-10
1 2
is limited by regional availability of good-quality direct-normal irradiance of 2,000 kWh/m2 or more in Earth’s “Sun Belt.”
Table 3.11: Evolution of cumulative solar capacities (IEA, 2008; Teske, 2008) [TSU: source 3 missing for row 7-8 (Shell)] 4
Low temperature solar [GWh]
Solar PV electrical [GW]
CSP capacities [GW] Name of Scenario and Year 2000 2010 2000 2010 2000 2010
Greenpeace (reference scenario 2008)
--- 1121 1.00 10 0.35 2
Greenpeace ([r]evolution scenario 2008)
--- 300 1.00 21 0.35 5
Greenpeace (advanced scenario 2008)
--- --- --- 21 0.35 5
IEA Reference Scenario (2008)
--- --- 1.00 10 0.35 ---
IEA ACT Map (2008)
--- --- 1.00 22 0.35 ---
IEA Blue Map (2008)
--- --- 1.00 27 0.35 ---
Shell (Scramble)
--- --- --- --- --- ---
Shell (Blueprints)
0 163 --- --- --- ---
1Calculated from heat supply in PJ/a and 850 full-load hours annually. 5
7 8 9
10 11 12
13 14 15 16
3.9.2 Long-Term Deployment in the Context of Carbon Mitigation 6 The IPCC Fourth Assessment Report estimated the available solar energy resource as 1,600 EJ/year for PV and as 50 EJ/year for CSP (however, this estimate was given as very uncertain, with sources reporting values with orders of magnitude higher) (IPCC, 2007).
On the other hand, the potential deployment of direct solar in the IPCC Fourth Assessment Report gives a potential contribution of direct solar to the world electricity supply by 2030 of 633 TWh (2.3 EJ), which is 7% of the world electricity supply (IPCC, 2007).
Chapter 10 provides a summary of the literature on the possible contribution of renewable energy supplies in meeting global energy needs under a range of CO2 stabilization scenarios. Figure 3.33 shows the global solar energy contribution to global supply in carbon stabilization scenarios from a review of literature in primary energy units (EJ). Figure 3.34 shows the same data for PV and
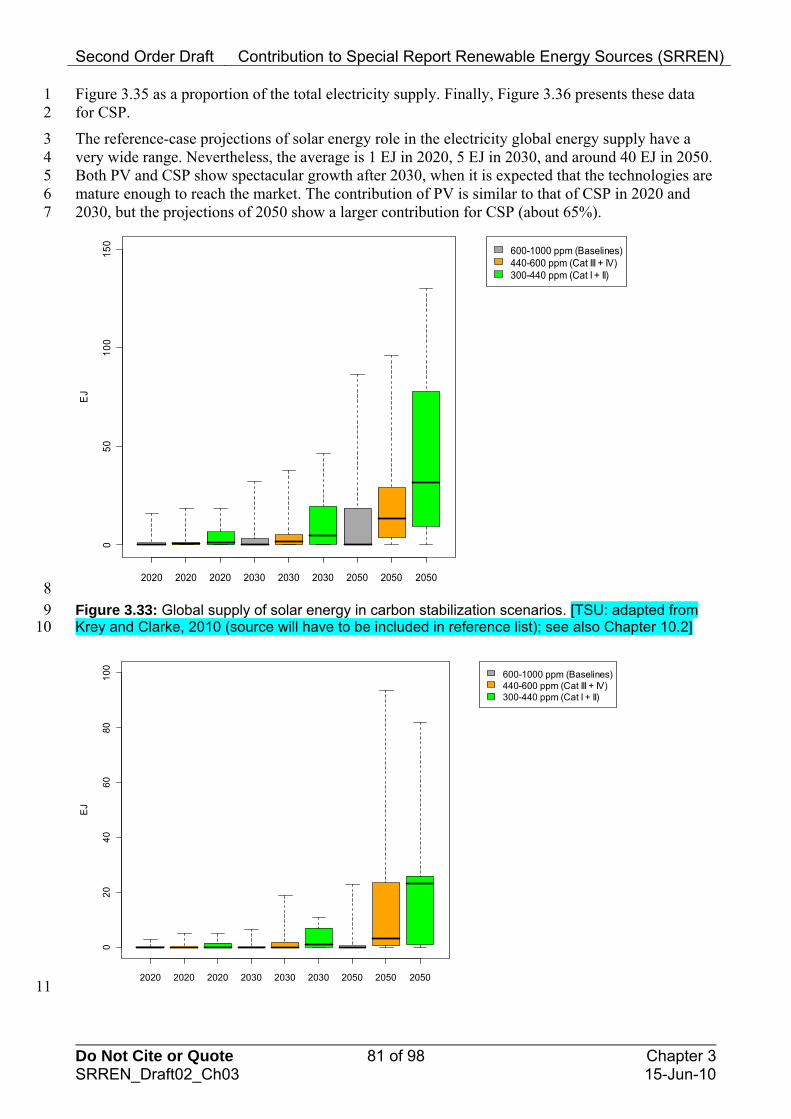
Second Order Draft Contribution to Special Report Renewable Energy Sources (SRREN)
Do Not Cite or Quote 81 of 98 Chapter 3 SRREN_Draft02_Ch03 15-Jun-10
1 2
3 4 5 6 7
Figure 3.35 as a proportion of the total electricity supply. Finally, Figure 3.36 presents these data for CSP.
The reference-case projections of solar energy role in the electricity global energy supply have a very wide range. Nevertheless, the average is 1 EJ in 2020, 5 EJ in 2030, and around 40 EJ in 2050. Both PV and CSP show spectacular growth after 2030, when it is expected that the technologies are mature enough to reach the market. The contribution of PV is similar to that of CSP in 2020 and 2030, but the projections of 2050 show a larger contribution for CSP (about 65%).
2020 2020 2020 2030 2030 2030 2050 2050 2050
05
01
00
15
0
EJ
600-1000 ppm (Baselines)440-600 ppm (Cat III + IV)300-440 ppm (Cat I + II)
8 Figure 3.33: Global supply of solar energy in carbon stabilization scenarios. [TSU: adapted from 9 Krey and Clarke, 2010 (source will have to be included in reference list); see also Chapter 10.2] 10
2020 2020 2020 2030 2030 2030 2050 2050 2050
02
04
06
08
01
00
EJ
600-1000 ppm (Baselines)440-600 ppm (Cat III + IV)300-440 ppm (Cat I + II)
11
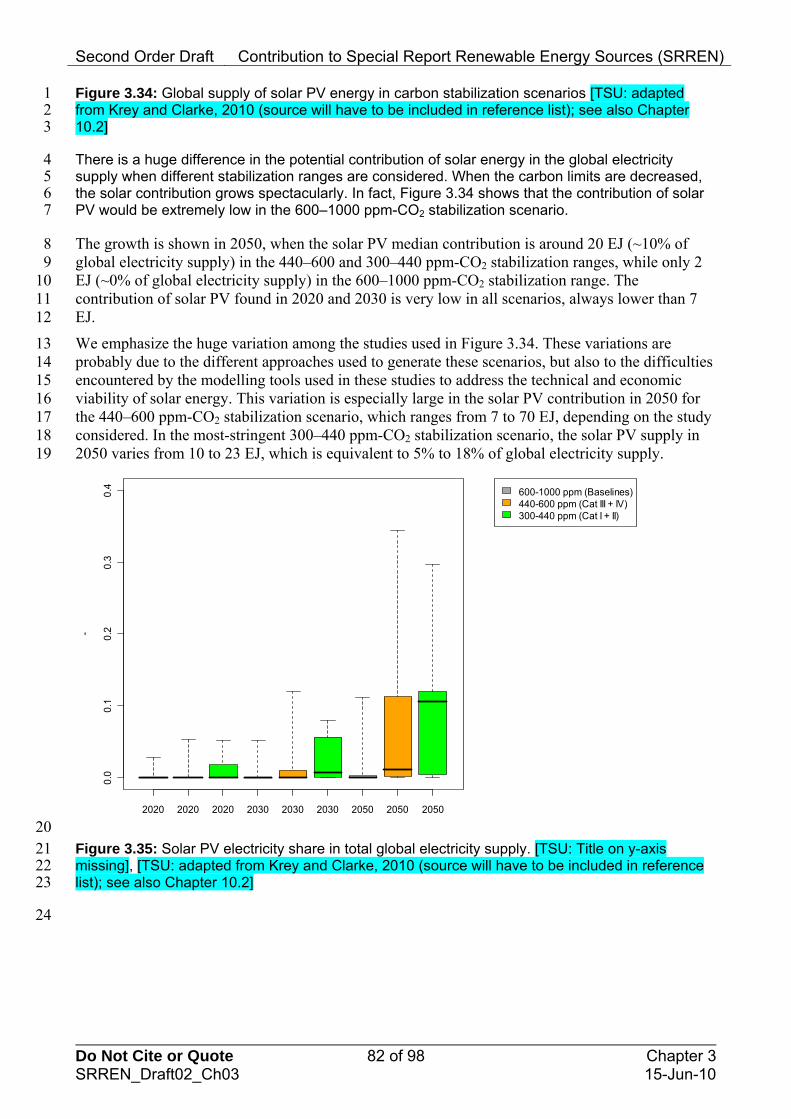
Second Order Draft Contribution to Special Report Renewable Energy Sources (SRREN)
Do Not Cite or Quote 82 of 98 Chapter 3 SRREN_Draft02_Ch03 15-Jun-10
Figure 3.34: Global supply of solar PV energy in carbon stabilization scenarios [TSU: adapted 1 from Krey and Clarke, 2010 (source will have to be included in reference list); see also Chapter 2 10.2] 3
4 5 6 7
8 9
10 11 12
13 14 15 16 17 18 19
There is a huge difference in the potential contribution of solar energy in the global electricity supply when different stabilization ranges are considered. When the carbon limits are decreased, the solar contribution grows spectacularly. In fact, Figure 3.34 shows that the contribution of solar PV would be extremely low in the 600–1000 ppm-CO2 stabilization scenario.
The growth is shown in 2050, when the solar PV median contribution is around 20 EJ (~10% of global electricity supply) in the 440–600 and 300–440 ppm-CO2 stabilization ranges, while only 2 EJ (~0% of global electricity supply) in the 600–1000 ppm-CO2 stabilization range. The contribution of solar PV found in 2020 and 2030 is very low in all scenarios, always lower than 7 EJ.
We emphasize the huge variation among the studies used in Figure 3.34. These variations are probably due to the different approaches used to generate these scenarios, but also to the difficulties encountered by the modelling tools used in these studies to address the technical and economic viability of solar energy. This variation is especially large in the solar PV contribution in 2050 for the 440–600 ppm-CO2 stabilization scenario, which ranges from 7 to 70 EJ, depending on the study considered. In the most-stringent 300–440 ppm-CO2 stabilization scenario, the solar PV supply in 2050 varies from 10 to 23 EJ, which is equivalent to 5% to 18% of global electricity supply.
2020 2020 2020 2030 2030 2030 2050 2050 2050
0.0
0.1
0.2
0.3
0.4
-
600-1000 ppm (Baselines)440-600 ppm (Cat III + IV)300-440 ppm (Cat I + II)
20 Figure 3.35: Solar PV electricity share in total global electricity supply. [TSU: Title on y-axis 21 missing], [TSU: adapted from Krey and Clarke, 2010 (source will have to be included in reference 22 list); see also Chapter 10.2] 23
24
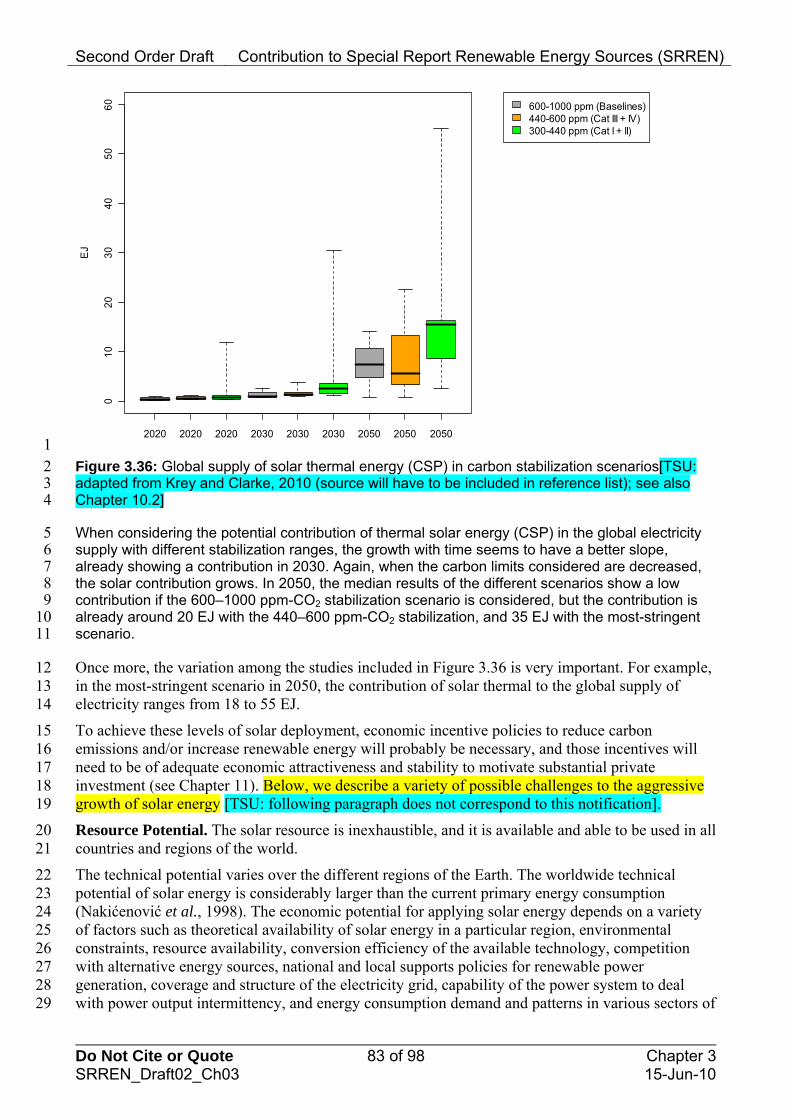
Second Order Draft Contribution to Special Report Renewable Energy Sources (SRREN)
Do Not Cite or Quote 83 of 98 Chapter 3 SRREN_Draft02_Ch03 15-Jun-10
2020 2020 2020 2030 2030 2030 2050 2050 2050
01
02
03
040
50
60
EJ
600-1000 ppm (Baselines)440-600 ppm (Cat III + IV)300-440 ppm (Cat I + II)
1 Figure 3.36: Global supply of solar thermal energy (CSP) in carbon stabilization scenarios[TSU: 2 adapted from Krey and Clarke, 2010 (source will have to be included in reference list); see also 3 Chapter 10.2] 4
5 6 7 8 9
10 11
12 13 14
15 16 17
When considering the potential contribution of thermal solar energy (CSP) in the global electricity supply with different stabilization ranges, the growth with time seems to have a better slope, already showing a contribution in 2030. Again, when the carbon limits considered are decreased, the solar contribution grows. In 2050, the median results of the different scenarios show a low contribution if the 600–1000 ppm-CO2 stabilization scenario is considered, but the contribution is already around 20 EJ with the 440–600 ppm-CO2 stabilization, and 35 EJ with the most-stringent scenario.
Once more, the variation among the studies included in Figure 3.36 is very important. For example, in the most-stringent scenario in 2050, the contribution of solar thermal to the global supply of electricity ranges from 18 to 55 EJ.
To achieve these levels of solar deployment, economic incentive policies to reduce carbon emissions and/or increase renewable energy will probably be necessary, and those incentives will need to be of adequate economic attractiveness and stability to motivate substantial private investment (see Chapter 11). Below, we describe a variety of possible challenges to the aggressive 18 growth of solar energy [TSU: following paragraph does not correspond to this notification]. 19
20 21
22 23 24 25 26 27 28 29
Resource Potential. The solar resource is inexhaustible, and it is available and able to be used in all countries and regions of the world.
The technical potential varies over the different regions of the Earth. The worldwide technical potential of solar energy is considerably larger than the current primary energy consumption (Nakićenović et al., 1998). The economic potential for applying solar energy depends on a variety of factors such as theoretical availability of solar energy in a particular region, environmental constraints, resource availability, conversion efficiency of the available technology, competition with alternative energy sources, national and local supports policies for renewable power generation, coverage and structure of the electricity grid, capability of the power system to deal with power output intermittency, and energy consumption demand and patterns in various sectors of

Second Order Draft Contribution to Special Report Renewable Energy Sources (SRREN)
Do Not Cite or Quote 84 of 98 Chapter 3 SRREN_Draft02_Ch03 15-Jun-10
1 2
3 4
5 6 7 8 9
10
11 12 13 14 15 16 17 18 19 20
21 22 23 24 25 26 27 28
29 30 31 32
33 34 35 36 37 38 39
40 41 42 43 44 45 46
the economy and social life. The range of technologies using solar energy is wide and the respective markets have quite different growth rates, ranging between 10% and 50% per year.
Regional Deployment. Industry-driven scenarios with regional visions for up to 100% of renewable energy supply by 2050 are developed in various parts of the world.
The Semiconductor Equipment and Materials International Association (SEMI) developed PV roadmaps for China and India that go far beyond the targets of the national governments (Semiconductor Equipment and Materials International, 2009b; Semiconductor Equipment and Materials International, 2009a). These targets are about 20 GW by 2020 and 100 GW by 2050 for electricity generation in China and 20 GW and 200 GW in India (both PV and CSP) (Indian Ministry of New and Renewable Energy, 2010; Zhang et al., 2010).
In Europe, the European Renewable Energy Council developed a 100% Renewable Energy vision based on the inputs of the various European industrial industry associations (Zervos et al., 2010). 2010]. Assumptions for 2020 on final electricity, heat and cooling, as well as transport demand are based on the European Commission´s New Energy Policy (NEP) scenario with both a moderate and high price environment as outlined in the Second Strategic Energy Review (European Commission, 2008). The scenarios for 2030 and 2050 assume a massive improvement in energy efficiency to realise the 100% renewable energy goals. For Europe, this scenario assumes that solar thermal can contribute about 557 TWh and 1415 TWh heating and cooling in 2030 and 2050, respectively. For electricity generation, about 556 TWh from PV and 141 TWh from CSP are anticipated for 2030 and 1347 TWh and 385 TWh for 2050, respectively.
In Japan, the New Energy Development Organisation (NEDO), the Ministry for Economy, Trade and Industry (METI), the Photovoltaic Power Generation Technology Research Association (PVTEC), and Japan Photovoltaic Energy Association (JPEA) drafted the “PV Roadmap Towards 2030” in 2004 (Kurokawa and Aratani, 2004). In 2009, the roadmap was revised; the target year was extended from 2030 to 2050, and a goal was set to cover between 5% and 10% of domestic primary energy demand with PV power generation in 2050. The targets for electricity from PV systems range between 35 TWh for the reference scenario and 89 TWh for the advanced scenario in 2050 (Komiyama et al., 2009).
In the USA, the industry associations—Solar Electric Power Association (SEPA) and Solar Energy Industry Association (SEIA)—are working together with the U.S. Department of Energy (DOE) and other stakeholders to develop scenarios for electricity from solar resources (PV and CSP) of 10% and 20% in 2030. The results of the Solar Vision Study are expected in the middle of 2010.
Supply Chain Issues. Passive solar is a purely local market because the building market is a local market. Globalizing the knowledge on passive solar technologies would increase its market penetration. Low-temperature solar thermal is implemented all over the world with local markets, local suppliers, and local industries, but a global market is starting to be developed. PV is a global industry with a global supply chain; some industries have more industry policies, but others not so much. CSP is starting to develop a global supply chain; currently, the market is driven by Spain and USA, but other countries such as India are helping to expand the market.
Technology and Economics. Passive solar has a well-established technology with room for improvement; however, the awareness of the building sector is not always available. The economics are understood, but they depend on local solar resources and local support and building regulations. Low-temperature solar thermal is a well-established technology ranging from lower to higher technological solutions with further room of improvement; the economics depends on solar resource and range of applications and local economy—some regions may need support programs to create markets and be competitive, but in other regions it is already competitive.
Second Order Draft Contribution to Special Report Renewable Energy Sources (SRREN)
Do Not Cite or Quote 85 of 98 Chapter 3 SRREN_Draft02_Ch03 15-Jun-10
1 2 3 4 5 6
7 8 9
10 11
12 13 14 15
16 17 18 19
20 21 22 23 24
25 26 27 28
29 30 31 32
33 34 35 36 37 38 39
PV is already an established technology, but further development is under way; economics have a similar pattern, but depend on the local solar resource. Economics of PV technology depends on support programs; currently, there is a tendency that higher support and less competition leads to higher end-market prices. The CSP technology is developed, but still at an early stage of commercialisation; there is little competition yet, but it is growing rapidly. The economics are similar to those of PV.
Integration and Transmission. This is not an issue for passive solar applications. The integration issues in low-temperature solar are only important for large systems where integration to local district heating systems is needed. Due to the availability of the resource only during the day, improved transmission and storage systems are needed for a high penetration of PV systems. Integration and transmission issues for CSP are exactly the same as for any other power plant.
Social and Environmental Concerns. Direct solar energy has few social and environmental concerns. Rather, the main benefit of passive solar is in reducing energy demand of buildings. Similar to low-temperature solar, it has the benefit of reducing the energy demand for water heating and room heating.
The main concern of the PV technology is the availability of material. Water availability and consumption is the main environmental concern for CSP. However, this technology has the benefit of using dessert areas, of increasing environmental benefits of technologies such as desalination, and of producing dispatchable renewable electricity.
3.9.3 Concluding Remarks on Potential Deployment Potential deployment scenarios range widely—from a marginal role of direct solar energy in 2050 to one of the major sources of energy supply. Although it is true that direct solar energy provides only a very small fraction of the world energy supply, it is undisputed that this energy source has the largest potential and a promising future.
Reducing cost is a key issue in making direct solar energy more cost competitive. This can only be achieved if the solar technologies reduce their costs along their learning curves, which depend primarily on market volumes. In addition, continuous R&D efforts are required to ensure that the slope of the learning curves do not flatten too early.
The true costs of implementing solar energy are still unknown because the main implementation scenarios that exist today consider only a single technology. These scenarios do not take into account the co-benefits of a renewable/sustainable energy supply via a range of different renewable energy sources and energy-efficiency measures.
Potential deployment depends on the actual resources and availability of the respective technology. However, to a large extent, the regulatory and legal framework in place can foster or hinder the uptake of direct solar energy applications. Minimum building standards with respect to building orientation and insulation can reduce the energy demand of buildings significantly and can increase the share of renewable energy supply without increasing the overall demand. Transparent, streamlined administrative procedures to install and connect solar power source to existing grid infrastructures can further lower the cost related to direct solar energy.
Second Order Draft Contribution to Special Report Renewable Energy Sources (SRREN)
Do Not Cite or Quote 86 of 98 Chapter 3 SRREN_Draft02_Ch03 15-Jun-10
1
2
3 4 5 6 7 8 9
10 11 12 13 14 15 16 17 18 19 20 21 22 23 24 25 26 27 28 29 30 31 32 33 34 35 36 37 38 39 40 41 42 43 44 45 46 47 48 49
REFERENCES
Abanades, S., P. Charvin, G. Flamant, and P. Neveu, 2006: Screening of water-splitting thermochemical cycles potentially attractive for hydrogen production by concentrated solar energy. Energy, 31(14), pp. 2805-2822. Abanades, S., P. Charvin, F. Lemont, and G. Flamant, 2008: Novel two-step SnO2/SnO water-splitting cycle for solar thermochemical production of hydrogen. International Journal of Hydrogen Energy, 33(21), pp. 6021-6030. Arvizu, D.E., 2008: Potential Role and Contribution of Direct Solar Energy to the Mitigation of Climate Change. IPPC (Intergovernmental Panel on Climate Change) Meeting on Renewable Energy Sources. Proceedings. Working Group III. 20-25 Jan. 2008. Hohmeyer, O., and T. Trittin. Intergovernmental Panel on Climate Change, Lubeck, Germany, pp. 33-58. ASHRAE, 2009: ASHRAE Handbook--Fundamentals. American Society of Heating, Refrigerating, and Air-Conditioning Engineers, Inc., Atlanta, GA. Athienitis, A.K., 2008: Design of Advanced Solar Homes Aimed at Net-Zero Annual Energy Consumption in Canada. ISES-AP - 3rd International Solar Energy Society Conference - Asia Pacific Region. Incorporating the 46th ANZSES Conference. 25-28 Nov. 2008. Sydney, Australia, pp. 14 Athienitis, A.K., and M. Santamouris, 2002: Thermal analysis and design of passive solar buildings. James & James, London, 288 pp. Balcomb, J.D., 1992: Passive Solar Buildings. MIT Press, Cambridge, Massachusetts, 534pp. Baoshan, L., 2010: Research on the Progress of Silicon Materials in China. In: 6th China SoG Silicon and PV Conference 2010. Barkat, A., S.H. Khan, M. Rahman, S. Zaman, A. Poddar, S. Halim, N.N. Ratna, M. Majid, A.K.M. Maksud, A. Karim, and S. Islam, 2002: Economic and Social Impact Evaluation Study of the Rural Electrification Program in Bangladesh. In: Electric Cooperatives in Bangladesh. National Rural Electric Cooperative Association (NRECA) International, Dhaka, Bangladesh, pp. 41 Barnes, D.F., 1988: Electric power for rural growth : how electricity affects rural life in developing countries. Westview Press, Boulder, 236 pp. Batley, S.L., D. Colbourne, P.D. Fleming, and P. Urwin, 2001: Citizen versus consumer: challenges in the UK green power market. Energy Policy, 29, pp. 479-487. Bazilian, M.D., F. Leenders, B.G.C. Van der Ree, and D. Prasad, 2001: Photovoltaic cogeneration in the built environment. Solar Energy, 71(1), pp. 57-69. Benagli, S., D. Borrello, E. Vallat-Sauvain, J. Meier, U. Kroll, J. Hoetzel, J. Bailat, J. Steinhauser, M. Marmelo, M. M., and L. Castens, 2009: High-Efficiency Amorphous Silicon Devices on LPCVD-ZnO-TCO Prepared in Industrial KaiTM-M R&D Reactor. In: Proceedings of the 24th European Photovoltaic Solar Energy Conference, Hamburg, pp. 2293. Bernreuther, J., and F. Haugwitz, 2010: The Who's Who of Silicon Production. Bernreuther Consulting. Bosi, M., and C. Pelosi, 2007: The potential of III-V semiconductors as terrestrial photovoltaic devices. Progress in Photovoltaics, 15(1), pp. 51-68. Boyle, G., 1996: Renewable energy : power for a sustainable future. Oxford University Press in association with the Open University, Oxford, 479 pp. Brabec, C.J., 2004: Organic photovoltaics: technology and market. Solar Energy Materials and Solar Cells, 83(2-3), pp. 273-292. Breyer, C., A. Gerlach, J. Mueller, H. Behacker, and A. Milner, 2009: Grid-Parity Analysis for EU and US Regions and Market Segments - Dynamics of Grid-Parity and Dependence on Solar Irradiance, Local Electricity Prices and PV Progress Ratio. In: 24th European Photovoltaic Solar Energy Conference, 21-25 September 2009, Hamburg, Germany.
Second Order Draft Contribution to Special Report Renewable Energy Sources (SRREN)
Do Not Cite or Quote 87 of 98 Chapter 3 SRREN_Draft02_Ch03 15-Jun-10
1 2 3 4 5 6 7 8 9
10 11 12 13 14 15 16 17 18 19 20 21 22 23 24 25 26 27 28 29 30 31 32 33 34 35 36 37 38 39 40 41 42 43 44 45 46 47 48 49 50
British Petroleum, 2008: BP Statistical Review of World Energy. BP (British Petroleum), London, UK. Brouwer, I.D., J.C. Hoorweg, and M.J. van Liere, 1997: When households run out of fuel: Responses of rural households to decreasing fuelwood availability, Ntcheu District, Malawi World Development, 25(2), pp. 255-266. Bundesverband Solarwirtschaft e.V., 2009: Statistische Zahlen der deutschen Solarstrombranche (photovoltaik). Bundesverband Solarwirtschaft e.V. (BSW Solar), Berlin, Germany, 4 pp. Cabeza, L., A. Castell, M. Medrano, I. Martorell, G. Pérez, and Fernández, 2010: Experimental study on the performance of insulation materials in Mediterranean construction. Energy and Buildings, 42, pp. 630-636. Canadian Mortgage and Housing Corporation [CMHC], 2008: The Five Principles of EQuilibrium Housing. Canadian Mortgage and Housing Corporation, Ottawa, Ontario Canada. Carlson, D.E., and C.R. Wronski, 1976: Amorphous Silicon Solar-Cell. Applied Physics Letters, 28(11), pp. 671-673. Castell, A., I. Martorell, M. Medrano, G. Peréz, and L.F. Cabeza, 2010: Experimental study using PCM in brick constructive solutions for passive cooling. Energy and Buildings, 42, pp. 534-540. CEPHEUS, 2009: CEPHEUS, Cost Effective Passive Houses as European Standards. A Project within the THERMIE Program of the European Commission. Chen, Y., A.K. Athienitis, K.E. Galal, and Y. Poissant, 2008: Design and simulation for a solar house with building integrated photovoltaic-thermal system and thermal storage. International Solar Energy Society. ISES Solar World Congress. Goswami, D.Y., and Y. Zhao. Springer, pp. 327-331. Chiba, Y., A. Islam, K. Kakutani, R. Komiya, N. Koide, and L. Han, 2005: High efficiency dye sensitized solar cells. In: Technical Digest, 15th International Photovoltaic Science and Engineering Conference, October, Shanghai, pp. 665-666. Chinese Academy of Science, 2009: Need info. Clavadetscher, L., and T. Nordmann, 2007: Cost and Performance Trends in Grid-Connected Photovoltaic System and Case Studies 2007. IEA Photovoltaic Power Systems Program (PVPS). Task 2. IEA PVPS Pool Switzerland for the IEA Photovoltaic Power Systems Program, 54 pp. Cobben, S., B. Gaiddon, and H. Laukamp, 2008: Impact of Photovoltaic Generation on Power Quality in Urban areas with High PV Polulation: Results from Monitoring Campaigns. PVupscale, WP4 - Deliverable 4.3. . Intelligent Energy Europe. PVupscale project. Contract: EIE/05/171/SI2.420208, 53 pp. de Vries, B., M.M. Hoogwijk, and D. van Vuuren, 2007: Renewable energy sources: Their global potential for the first-half 21st century at a global level: An integrated approach. Energy Policy, 35(4), pp. 2590-2610. Denholm, P., E. Drury, R. Margolis, and M. Mehos, 2009: Solar Energy: The Largest Energy Resource, Generating Electricity in a Carbon Constrained World. Elsevier, Paris DESERTEC Foundation, 2007: Clean Power from Deserts - The DESERTEC Concept for Energy, Water and Climate Security. WhiteBook., 4th ed. Dimmler, B., and H.W. Schock, 1996: Scaling-up of CIS technology for thin-film solar modules. Progress in Photovoltaics, 4(6), pp. 425-433. Displaybank, 2010: Displaybank Briefing. Diver, R.B., J.E. Miller, M.D. Allendorf, N.P. Siegel, and R.E. Hogan, 2008: Solar thermochemical water-splitting ferrite-cycle heat engines. Journal of Solar Energy Engineering-Transactions of the ASME, 130(4) Duffie, J.A., and W.A. Beckman, 1991: Solar engineering of thermal processes. Wiley, New York, 2nd ed., 919 pp. Duffie, J.A., and W.A. Beckman, 2006: Solar Engineering of Thermal Processes. Wiley, New York, 3rd ed., 928pp.
Second Order Draft Contribution to Special Report Renewable Energy Sources (SRREN)
Do Not Cite or Quote 88 of 98 Chapter 3 SRREN_Draft02_Ch03 15-Jun-10
1 2 3 4 5 6 7 8 9
10 11 12 13 14 15 16 17 18 19 20 21 22 23 24 25 26 27 28 29 30 31 32 33 34 35 36 37 38 39 40 41 42 43 44 45 46 47 48 49 50
Ecofys Netherlands BV, 2007: Current state-of-the-art and best practices of BIPV. D6.1.1. European Commission Sixth Framework Programme. Ecofys Netherlands BV. Contract No. 019718, Utrecht, The Netherlands. Eiffert, P., 2002: Guidelines for Economic Evaluation of Building Integrated Photovoltaic Power Systems. IEA Photovoltaic Power Systems Program (PVPS). Task 7. National Renewable Energy Laboratory, Golden, CO, 52 pp. Elzinga, D., 2008: Urban BIPV in the New Residential Construction Industry. IEA Photovoltaic Power Systems Program (PVPS). Task 10. Activity 3.1. Natural Resources Canada for the International Energy Agency Photovoltaic Power Systems Program, Ottawa, Canada, 58 pp. Energy Information Administration [DOE], 2008: Solar Thermal Collector Manufacturing Activities 2007. Energy Sector Management Assistance Programme [ESMAP], 2004: The Impact of Energy on Women's Lives in Rural India. ESMAP Paper no. ESM276. World Bank. Joint UNDP/World Bank Energy Sector Management Assistance Programme, Washington, D.C., 96 pp. Environmental Health Perspectives, 2003: Environews Focus -The Quest for Fire: Hazards of a Daily Struggle. New Stoves for Better Children's Health? Environmental Health Perspectives: EHP, 111(1), pp. A28-A33. Epstein, M., G. Olalde, S. Santen, A. Steinfeld, and C. Wieckert, 2008: Towards the Industrial Solar Carbothermic Production of Zinc. Solar Energy Engineering, 130, pp. 014505-1. EU PV European Photovoltaic Technology Platform, 2007: A Strategic Research Agenda for Photovoltaic Solar Energy Technology. European Communities. Sixth European Framework Programme for Research and Technological Development, Luxembourg, 76 pp. EuPD Research, and IFO Institut fur Wirtschaftforschung Universitat Munchen, 2008: Standortgutachten Photovoltaik in Deutschland. 28 pp. EurObserv'ER, 2009: Photovoltaic Energy Barometer. EurObserv'ER. Observatoire des Energies Renouvelables, Paris, France. European Commission, 2007: A European Strategic Energy Technology Plan (SET-Plan) - Technology Map. European Commission, 2008: Communication from the Commission to the European Parliament, the Council, the European Economic and Social Committee and the Committee of the Regions. Second Strategic Energy Review. An EU Energy Security and Solidarity Action Plan. 781pp. European Renewable Centres Agency, 2001: SolGain: Contribution and Potential of Passive Solar Gains in Residential Buildings in the European Union. Final Report., EU Thermie Project, Brussels, Belgium. European Solar Thermal Industry Federation [ESTIF], 2009: Solar Thermal Markets in Europe-Trends and Market Statistics in 2008. European Solar Thermal Industry Federation, Brussels, Belgium, 8 pp. European Solar Thermal Technology Platform [ESTTP], 2006: Solar Thermal Vision 2030. Vision of the Usage and Status of Solar Thermal Energy Technology in Europe and the Corresponding Research Topics to make the Vision a Reality. European Solar Thermal Technology Platform (ESTTP) Secretariat, Brussels, Belgium, 16 pp. European Solar Thermal Technology Platform [ESTTP], 2008: Solar Heating and Cooling for a Sustainable Energy Future in Europe - Strategic Research Agenda European Solar Thermal Technology Platform (ESTTP) Secretariat, Brussels, Belgium, 123 pp. Everett, B., 1996: Solar Thermal Energy. In: Renewable Energy: Power for a Sustainable Future. Oxford University Press, Oxford, UK, pp. 41-88. Ezzati, M., A.D. Lopez, A. Rodgers, S. Vander Hoorn, and C.J.L. Murray, 2002: Selected major risk factors and global and regional burden of disease. Lancet, 360(9343), pp. 1347-1360. Faiers, A., and C. Neame, 2006: Consumer attitudes towards domestic solar power systems. Energy Policy 34, pp. 1797-1806.
Second Order Draft Contribution to Special Report Renewable Energy Sources (SRREN)
Do Not Cite or Quote 89 of 98 Chapter 3 SRREN_Draft02_Ch03 15-Jun-10
1 2 3 4 5 6 7 8 9
10 11 12 13 14 15 16 17 18 19 20 21 22 23 24 25 26 27 28 29 30 31 32 33 34 35 36 37 38 39 40 41 42 43 44 45 46 47 48 49 50 51
Felder, R., and A. Meier, 2008: Well-to-wheel analysis of solar hydrogen production and utilization for passenger car transportation. Journal of Solar Energy Engineering-Transactions of the ASME, 130(1) Fong, K.F., T.T. Chow, C.K. Lee, Z. Lin, and L.S. Chan, 2010: Comparative study of different solar cooling systems for buildings in subtropical city. Solar Energy, 84, pp. 227-244. Food and Agriculture Organization of the United Nations, 1999: Statistical Databases on the Internet. FAOSTAT-Agriculture FAO, Rome, Italy. Forrest, S.R., 2005: The limits to organic photovoltaic cell efficiency. MRS Bulletin, 30(1), pp. 28-32. Fthenakis, V., and H.C. Kim, 2009: Land use and electricity generation: A life-cycle analysis. Renewable & Sustainable Energy Reviews, 13(6-7), pp. 1465-1474. Fthenakis, V.M., and H.C. Kim, 2010: Photovoltaics: Life-Cycle Analysis Solar Energy Fudholi, A., K. Sopian, M.H. Ruslan, M.A. Alghoul, and M.Y. Sulaiman, 2010: Review of solar dryers for agricultural and marine products. Renewable & Sustainable Energy Reviews, 14(1), pp. 1-30. Furbo, S., E. Andersen, S. Knudsen, N.K. Vejen, and L.J. Shah, 2005: Smart solar tanks for small solar domestic hot water systems. Solar Energy, 78(2), pp. 269-279. Gaiddon, B., and M. Jedliczka, 2007: Compared Assessment of Selected Environmental Indicators of Photovoltaic Electricity in OECD Cities. IEA Photovoltaic Power Systems Program (PVPS). Task 10. Activity 4.4. French Agency for Environment and Energy Management for the International Energy Agency, Hespu, Villeurbanne France, 44 pp. German Aerospace Center [DLR], 2005: ECOSTAR European Concentrated Solar Thermal Road-Mapping. Final Report. German Aerospace Center (DLR). Stuttgart, Germany, 144 pp. German Aerospace Center [DLR], 2007: AQUA-CSP. Concentrating Solar Power for Seawater Desalination. Final Report. German Aerospace Center (DLR). Institute of Technical Thermodynamics. Section Systems Analysis and Technology Assessment, Stuttgart, Germany, 279 pp. Gil, A., M. Medrano, I. Martorell, A. Lazaro, P. Dolado, B. Zalba, and L.F. Cabeza, 2010: State of the art on high temperature thermal energy storage for power generation. Part 1-Concepts, materials and modellization. Renewable & Sustainable Energy Reviews, 14(1), pp. 31-55. Glaser, P.E., 1968: Power from the Sun - Its Future. Science, 1, pp. 655-667. Goncalves, L.M., V.D. Bermudez, H.A. Ribeiro, and A.M. Mendes, 2008: Dye-sensitized solar cells: A safe bet for the future. Energy & Environmental Science, 1(6), pp. 655-667. Gordon, J.M., 2001: Solar Energy: The State of the Art. ISES Position Papers. James & James London, United Kingdom, 706 pp. Graf, D., N. Monnerie, M. Roeb, M. Schmitz, and C. Sattler, 2008: Economic comparison of solar hydrogen generation by means of thermochemical cycles and electrolysis. International Journal of Hydrogen Energy, 33(17), pp. 4511-4519. Graham, V.A., and K.G.T. Hollands, 1990: A Method to Generate Synthetic Hourly Solar Radiation, Globally. Solar Energy, 44(6), pp. 333-341. Graham, V.A., K.G.T. Hollands, and T.E. Unny, 1988: A Time Series Model for Kt With Application to Global Synthetic Weather Generation. Solar Energy, 40(2), pp. 83-92. Gratzel, M., 2001: Photoelectrochemical cells. Nature, 414(6861), pp. 338-344. Green, M., K. Emery, Y. Hishikawa, and W. Warta, 2010: Solar cell efficiency tables (version 35). Progress in Photovoltaics: Research and Applications, 18(2), pp. 144-150. Green, M.A., K. Emery, Y. Hishikawa, and W. Warta, 2008: Solar cell efficiency tables (version 32). Progress in Photovoltaics, 16(5), pp. 435-440. Green, M.A., K. Emery, Y. Hishikawa, and W. Warta, 2009a: Solar Cell Efficiency Tables (Version 33). Progress in Photovoltaics, 17(1), pp. 85-94.
Second Order Draft Contribution to Special Report Renewable Energy Sources (SRREN)
Do Not Cite or Quote 90 of 98 Chapter 3 SRREN_Draft02_Ch03 15-Jun-10
1 2 3 4 5 6 7 8 9
10 11 12 13 14 15 16 17 18 19 20 21 22 23 24 25 26 27 28 29 30 31 32 33 34 35 36 37 38 39 40 41 42 43 44 45 46 47 48 49 50
Green, M.A., K. Emery, Y. Hishikawa, and W. Warta, 2009b: Solar Cell Efficiency Tables (Version 34). Progress in Photovoltaics, 17(5), pp. 320-326. Gustavsson, M., and A. Ellegard, 2004: The impact of solar home systems on rural livelihoods. Experiences from the Nyimba Energy Service Company in Zambia. Renewable Energy, 29(7), pp. 1059-1072. Hadorn, J.C., 2005: Thermal energy storage for solar and low energy buildings : state of the art. IEA Solar Heating and Cooling Task 32; International Energy Agency; Solar Heating and Cooling Programme. Servei de Publicacions Universidad Lleida, [Lleida, Espagne], 170 pp. Hadorn, J.C., 2008: Thermal Energy Storage-Overview of Technologies and Status for Solar Heat. EuroSun 2008, 1st International Conference on Solar Heating, Cooling and Buildings. 7-10 Oct. 2008. International Solar Energy Society, Lisbon, Portugal. Harvey, L.D.D., 2006: A handbook on low-energy buildings and district-energy systems : fundamentals, techniques and examples. Earthscan, Sterling, Virginia, 701 pp. Heiselberg, P. (ed.), 2002: Principles of Hybrid Ventilation. IEA Energy Conservation in Buildings and Community Systems Programme. Annex 35, Hybrid Ventilation and New and Retrofitted Office Buildings. IEA Energy Conservation in Buildings and Community Systems Programme, Birmingham, UK, 73 pp. Henning, H.-M., 2004: Solar-assisted air-conditioning in buildings : a handbook for planners. Springer, Wien; New York, 136 pp. Henning, H.-M., 2007: Solar assisted air conditioning of buildings - an overview. Applied Thermal Engineering, 27, pp. 1734-1749. Hernandez Gonzalvez, C., 1996: Manual de energía solar térmica. Instituto para la Diversificación de la Energía (IDAE), Madrid, Spain, 123 pp. Hoffert, M.I., K. Caldeira, G. Benford, D.R. Criswell, C. Green, H. Herzog, A.K. Jain, H.S. Kheshgi, K.S. Lackner, J.S. Lewis, H.D. Lightfoot, W. Manheimer, J.C. Mankins, M.E. Mauel, L.J. Perkins, M.E. Schlesinger, T. Volk, and T.M.L. Wigley, 2002: Advanced technology paths to global climate stability: Energy for a greenhouse planet. Science, 298, pp. 981-987. Hoffmann, W., 2009: The role of PV solar electricity to power the 21st century's global prime energy demand. IOP Conf. Series: Earth and Envirionmental Sciences, 8(012007) Hoffmann, W., S. Wieder, and T. Pellkofer, 2009: Differentiated Price Experience Curves as Evaluation Tool for Judging the Further Development of Crystalline Silicon and Thin Film PV Solar Electricity Products. In: 24th European Photovoltaic Solar Energy Conference, 21-25 September 2009, Hamburg, Germany. Hofman, Y., D. de Jager, E. Molenbroek, F. Schilig, and M. Voogt, 2002: The potential of solar electricity to reduce CO2 emissions. Utrecht, Ecofys, 106pp. Hollands, K.G.T., J.L. Wright, and C.G. Granqvist, 2001: Glazing and Coatings. In: Solar Energy: The State of the Art. ISES Position Papers. James & James, London, UK, pp. 24-107. Hoogwijk, M., 2004: On the Global and Regional Potential of Renewable Energy Sources. Utrecht University, Department of Science, Technology and Society, Utrecht. IEA, 2008: PVPS. IEA, 2009a: Online Global Renewable Energy Policies and Measures database. IEA, 2009b: Towards Net Zero Energy Solar Buildings. IEA Energy Conservation in Buildings and Community Systems Programme. Solar Heating and Cooling Programme. SHC Task 40. ECBCS Annex 52 IEA. IEA, 2009c: Trends in Photovoltaic Applications: Survey Report of Selected IEA Countries Between 1992 and 2008. IEA Photovoltaic Power Systems Program (PVPS). Task 1 IEA, 44 pp. IEA, 2009d: World Energy Outlook 2009. International Energy Agency. IEA, 2010a: Technology Roadmap, Concentrating Solar Power. International Energy Agency, 48pp. IEA, 2010b: Technology Roadmap, Solar Photovoltaic Energy. International Energy Agency, 48pp.
Second Order Draft Contribution to Special Report Renewable Energy Sources (SRREN)
Do Not Cite or Quote 91 of 98 Chapter 3 SRREN_Draft02_Ch03 15-Jun-10
1 2 3 4 5 6 7 8 9
10 11 12 13 14 15 16 17 18 19 20 21 22 23 24 25 26 27 28 29 30 31 32 33 34 35 36 37 38 39 40 41 42 43 44 45 46 47 48 49 50 51
IEA Energy Conservation through Energy Storage, ECES (Energy Conservation through Energy Storage. Implementing Agreement). IEA Web, 2009: "Net Zero Energy Solar Buildings" IEA web. Imre, L., 2007: Solar Drying. In: Handbook of Industrial Drying Taylor & Francis, Philadelphia, Pennsylvania, 3rd ed., pp. 307-361. Indian Ministry of New and Renewable Energy, 2010: Jawaharlal Nehru National Solar Mission - Towards Building SOLAR INDIA. International Energy Agency, 2007: Renewables in Global Energy Supply: An IEA Fact Sheet. Organization for Economic Co-operation and Development (OECD)/IEA, Paris, France. International Energy Agency [IEA], 2002: Energy and Poverty. In: World Energy Outlook. Organisation for Economic Co-operation and Development (OECD)/IEA, Paris, France, pp. 365-393. IPCC, 2007: Climate Change 2007: Mitigation of Climate Change. Contribution of Working Group III to the Fourth Assessment Report of the Intergovernmental Panel on Climate Change. Intergovernmental Panel on Climate Change, 851pp. Jäger-Waldau, A., 2009: Photovoltaics Status Report 2009: Research, Solar Cell Production and Market Implementation of Photovoltaics. Euro-Report EUR 24027 EN. Office for Official Publications of the European Union, Luxembourg. Jäger-Waldau, A., 2010: Status and Perspectives of Thin Film Photovoltaics. In: Thin Film Solar Cells: Current Status and Future Trends. Nova Publishers, New York Jensen, S.H., P.H. Larsen, and M. Mogensen, 2007: Hydrogen and synthetic fuel production from renewable energy sources. International Journal of Hydrogen Energy, 32(15), pp. 3253-3257. Kaneko, H., T. Miura, A. Fuse, H. Ishihara, S. Taku, H. Fukuzumi, Y. Naganuma, and Y. Tamaura, 2007: Rotary-type solar reactor for solar hydrogen production with two-step water splitting process. Energy & Fuels, 21(4), pp. 2287-2293. Kautto, N., and A. Jäger-Waldau, 2009: Renewable Energy Snapshots 2009. Euro-Report EUR 23819 EN. European Commission. Joint Research Centre. Institute for Energy, Luxembourg. Kaya, N., J.C. Mankins, B. Erb, D. Vassaux, G. Pignolet, D. Kassing, and P. Collins, 2001: Report of Workshop on Clean and Inexhaustible Space Solar Power at Unispace III Conference. Acta Astronautica, 49(11), pp. 627-630. Kobayashi, H., and M. Takasaki, 2006: Demonstration Study of Autonomous Demand Area power System. Transmission and Distribution Conference and Exhibition 2005/2006. IEEE Power Engineering Society, 21-24 May 2006. IEEE, Dallas, Texas, pp. 548-555. Kolb, G.J., 1998: Economic evaluation of solar-only and hybrid power towers using molten-salt technology. Solar Energy, 62(1), pp. 51-61. Kolb, G.J., R.B. Diver, and N. Siegel, 2007: Central-station solar hydrogen power plant. Journal of Solar Energy Engineering-Transactions of the ASME, 129(2), pp. 179-183. Komiyama, R., C. Marnay, M. Stadler, J. Lai, S. Borgeson, B. Coffey, and I. Lima Azevedo, 2009: Japan's Long-term Energy Demand and Supply Scenario to 2050 -- Estimation for the Potential of Massive CO2 Mitigation. The Institute for Energy Economics, Japan. Komoto, K., M. Ito, P. van der Vleuten, D. Faiman, and K. Kurokawa, 2009: Energy from the Desert, Very Large Scale Photovoltaic Systems: Socio-economic, Financial, Technical and Environmental Aspects. Earthscan Publishers, London, UK. Koster, L.J.A., V.D. Mihailetchi, and P.W.M. Blom, 2006: Ultimate efficiency of polymer/fullerene bulk heterojunction solar cells. Applied Physics Letters, 88(9) Krebs, F.C., 2005: Alternative PV: Large Scale organic Photovoltaics. REfocus, 6(3), pp. 38-39. Krewitt, W., K. Nienhaus, C. Kleßmann, C. Capone, E. Stricker, W. Graus, M. Hoogwijk, N. Supersberger, U. von Winterfeld, and S. Samadi, 2009: Summary Climate Change 18/2009 -- Role and Potential of Renewable Energy and Energy Efficiency for Global Energy Supply. German Aerospace Center (DLR); Ecofys Germany; Ecofys Netherlands; Wuppertal Institute for Climate, Environment and Energy.
Second Order Draft Contribution to Special Report Renewable Energy Sources (SRREN)
Do Not Cite or Quote 92 of 98 Chapter 3 SRREN_Draft02_Ch03 15-Jun-10
1 2 3 4 5 6 7 8 9
10 11 12 13 14 15 16 17 18 19 20 21 22 23 24 25 26 27 28 29 30 31 32 33 34 35 36 37 38 39 40 41 42 43 44 45 46 47 48 49 50
Kroposki, B., R. Margolis, G. Kuswa, J. Torres, W. Bower, T. Key, and D. Ton, 2008: Renewable Systems Interconnection. National Renewable Energy Laboratory, Golden, Colorado, 23 pp. Kurokawa, K., and F. Aratani, 2004: Perceived Technical Issues Accompanying Large PV Development and Japanese "PV2030". In: 19th European Photovoltaic Solar Energy Conference and Exhibition, June 2004, Paris, France. Kurokawa, K., K. Komoto, P. van der Vleuten, and D. Faiman, 2007: Summary Energy from the Desert - Practical Proposals for Very Large Scale Photovoltaic Power Generation (VLS-PV) Systems. IEA Photovoltaic Power Systems Program (PVPS). Task 8. Earthscan, London, UK. Kushiya, K., 2009: Key near-term R&D issues for continuous improvement in CIS-based thin-film PV modules. Solar Energy Materials & Solar Cells, 93, pp. 1037-1041. Le Duigou, A., J.M. Borgard, B. Larousse, D. Doizi, R. Allen, B.C. Ewan, G.H. Priestman, R. Elder, R. Devonshire, V. Ramos, G. Cerri, C. Salvini, A. Giovannelli, G. De Maria, C. Corgnale, S. Brutti, M. Roeb, A. Noglik, P.M. Rietbrock, S. Mohr, L. De Oliveira, N. Monnerie, M. Schmitz, C. Sattler, A.O. Martinez, D.D. Manzano, J.C. Rojas, S. Dechelotte, and O. Baudouin, 2007: HYTHEC: An EC funded search for a long term massive hydrogen production route using solar and nuclear technologies. International Journal of Hydrogen Energy, 32(10-11), pp. 1516-1529. Lemort, F., P. Charvin, C. Lafon, and A. Romnicianu, 2006: Technological and chemical assessment of various thermochemical cycles: From the UT3 cycle up to the two steps iron oxide cycle. International Journal of Hydrogen Energy, 31(14), pp. 2063-2075. Li, G., V. Shrotriya, J.S. Huang, Y. Yao, T. Moriarty, K. Emery, and Y. Yang, 2005: High-efficiency solution processable polymer photovoltaic cells by self-organization of polymer blends. Nature Materials, 4(11), pp. 864-868. Liebreich, M., 2009: New Energy Finance Presentation. Guardian Cleantech Summit, 23 Nov., 2009. London, UK, pp. 27 Lynch, M., 2002: Reducing environmental damage caused by the collection of cooking fuel by refugees. Refuge 21(1), pp. 18-27. Mankins, J.C., 1997: A fresh look at space solar power: New architectures, concepts, and technologies. Acta Astronautica, 41(4-10), pp. 347-359. Mankins, J.C., 2002: A technical overview of the "Suntower" solar power satellite concept. Acta Astronautica, 50(6), pp. 369-377. Mankins, J.C., 2009: New directions for space solar power. Acta Astronautica, 65, pp. 146-156. Martinot, E., A. Cabraal, and S. Mathur, 2001: World Bank/GEF solar home system projects: experiences and lessons learned 1993-2000. Renewable & Sustainable Energy Reviews, 5(1), pp. 39-57. Martinot, E., C. Dienst, L. Weiliang, and C. Qimin, 2007: Renewable energy futures: Targets, scenarios, and pathways. Annual Review of Environment and Resources, 32, pp. 205-239. Maycock, P., 1993: Annual Data Collection Results. PV News, 12(2) Maycock, P., 2001a: Annual Data Collection Results. PV News, 20(2) Maycock, P., 2001b: Annual Data Collection Results. PV News, 20(2-3) Maycock, P., 2006: Annual Data Collection Results. PV News, 25(2-3) Maycock, P.D., 2002: The World Photovoltaic Market--Report (January). PV Energy Systems Medrano, M., A. Gil, I. Martorell, X. Potau, and L.F. Cabeza, 2010: State of the art on high-temperature thermal energy storage for power generation. Part 2-Case studies. Renewable & Sustainable Energy Reviews, 14(1), pp. 56-72. Meeder, A., A. Neisser, U. Rühle, and N. Mayer, 2007: Manufacturing the First MW of Large-Area CuInS2-Based Solar Modules - Recent Experiences and Progress. In: Proceedings of the 22nd European Photovoltaic Solar Energy Conference, Milan, pp. 2115. Meehl, G.A., T.F. Stocker, W.D. Collins, P. Friedlingstein, A.T. Gaye, J.M. Gregory, A. Kitoh, R. Knutti, J.M. Murphy, A. Noda, S.C.B. Raper, I.G. Watterson, A.J. Weaver, and Z.-C. Zhao, 2007: Global Climate Projections In: Climate Change 2007: The Physical Science Basis. Contribution of

Second Order Draft Contribution to Special Report Renewable Energy Sources (SRREN)
Do Not Cite or Quote 93 of 98 Chapter 3 SRREN_Draft02_Ch03 15-Jun-10
1 2 3 4 5 6 7 8 9
10 11 12 13 14 15 16 17 18 19 20 21 22 23 24 25 26 27 28 29 30 31 32 33 34 35 36 37 38 39 40 41 42 43 44 45 46 47 48 49 50 51
Working Group I to the Fourth Assessment Report of the Intergovernmental Panel on Climate Change Cambridge University Press, Cambridge, UK, pp. 747-846. Mehling, H., and L.F. Cabeza, 2008: Heat and cold storage with PCM : an up to date introduction into basics and applications. Springer, Berlin; London, 308 pp. Mehta, S., and T. Bradford, 2009: PV Technology, Production and Cost, 2009 Forecast: The Anatomy of a Shakeout. Greentech Media Inc., Cambridge, Massachusetts, 203 pp. Meier, J., S. Dubail, R. Platz, P. Torres, U. Kroll, J.A. Selvan, N. Pellaton Vaucher, C. Hof, D. Fischer, H. Keppner, R. Flückiger, A. Shah, S. Shklover, and K.-D. Ufert, 1997: Towards high-efficiency thin-film silicon solar cells with the “micromorph” concept. Solar Energy Materials and Solar Cells, 49(1-4), pp. 35-44. Meleshko, V.P., V.M. Kattsov, B.A. Govorkova, P.V. Sporyshev, I.M. Skolnik, and B.E. Sneerov, 2008: Climate of Russia in the 21st Century. Part 3. Future Climate Change Calculated with an Ensemble of Coupled Atmosphere-Ocean General Circulation CMIP3 Models. Meteorology and Hydrology. Original Russian text published in Meteorologiya i Gidrologiya no. 9, 2008, 33(9), pp. 541-552. Miller, J.E., M.D. Allendorf, R.B. Diver, L.R. Evans, N.P. Siegel, and J.N. Stuecker, 2008: Metal oxide composites and structures for ultra-high temperature solar thermochemical cycles. Journal of Materials Science, 43(14), pp. 4714-4728. Mills, D.R., and C.J. Dey, 2000: Transition Strategies for Solar Thermal Power Generation. Proceedings of the International Solar Energy Society. 1999 Solar World Congress, 4-9 Jul. 2009. Grossman, G. Elsevier, Jerusalem, Israel, 1, pp. 272-279. Mills, E., 2005: Environment - The specter of fuel-based lighting. Science, 308(5726), pp. 1263-1264. Mints, P., 2010: The PV industry's black swan. Photovoltaics World Moller, S., D. Kaucic, and C. Sattler, 2006: Hydrogen production by solar reforming of natural gas: A comparison study of two possible process configurations. Journal of Solar Energy Engineering-Transactions of the ASME, 128(1), pp. 16-23. Nakićenović, N., G. Arnulf, and M. Alan, 1998: Global energy: perspectives. Cambridge University Press, New York, 299 pp. Nankhuni, F.J., and J.L. Findeis, 2004: Natural resource-collection work and children's schooling in Malawi. Agricultural Economics, 31(2-3), pp. 123-134. National Academy of Sciences, 2004: Laying the Foundation for Space Solar Power--An Assessment of NASA's Space Solar Power Investment Strategy. National Academy of Sciences, Washington, DC. Navigant Consulting Inc., 2006: A Review of PV Inverter Technology Cost and Performance Projections. National Renewable Energy Laboratory, Golden, CO, 100 pp. Navigant Consulting Inc., 2008: Photovoltaic Manufacturer Shipments & Competitive Analysis 2007/2008. NEDO, 2009: The Roadmap PV2030+ NEDO. New Energy and Industrial Technology Organization, Kawasaki, Japan. NEEDS, 2009: New Energy Externalities Development for Sustainability (NEEDS). Final Report and Database New Energy Externalities Development for Sustainability, Rome, Italy. Neij, L., 2008: Cost development of future technologies for power generation--A study based on experience curves and complementary bottom-up assessments. Energy Policy, 36, pp. 2200-2211. Nieuwenhout, F.D.J., A. van Dijk, P.E. Lasschuit, G. van Roekel, V.A.P. van Dijk, D. Hirsch, H. Arriaza, M. Hankins, B.D. Sharma, and H. Wade, 2001: Experience with solar home systems in developing countries: a review. Progress in Photovoltaics: Research and Applications, 9, pp. 455-474. Norton, B., 2001: Solar Process Heat: Distillation, Drying, Agricultural and Industrial Uses. In: Solar Energy: The State of the Art . ISES Position Papers James & James, London, UK, pp. 477-496.

Second Order Draft Contribution to Special Report Renewable Energy Sources (SRREN)
Do Not Cite or Quote 94 of 98 Chapter 3 SRREN_Draft02_Ch03 15-Jun-10
1 2 3 4 5 6 7 8 9
10 11 12 13 14 15 16 17 18 19 20 21 22 23 24 25 26 27 28 29 30 31 32 33 34 35 36 37 38 39 40 41 42 43 44 45 46 47 48 49 50
O'Regan, B., and M. Gratzel, 1991: A Low-Cost, High-Efficiencyh Solar-Cell Based on Dye-Sensitized Colloidal TiO2 Films. Nature, 353(6346), pp. 737-740. Ogimoto, K., T. Oozeki, and Y. Ueda, 2010: Long-range Power Demand and Supply Planning Analysis Including Photovoltaic Generation Penetration. Oozeki, T., T. Takashima, K. Otani, Y. Hishikawa, G. Koshimizu, Y. Uchida, and K. Ogimoto, 2010: Statistical analysis of the smoothing effect for photovoltaic systems in a large area. IEEJ, 130 Otani, K., A. Murata, K. Sakuta, J. Minowa, and K. Kurokawa, 1998: Statistical Smoothing of Power Delivered to Utilities by Distributed PV Systems. 2nd World Conference and Exhibition on Photovoltaic Solar Energy Conversion. Proceedings of the International Conference, 6-10 Jul., 1998. Schmid, J., H.A. Ossenbrink, P. Helm, H. Ehmann, and E.D. Dunlop. European Commission, Vienna, Austria, 3, pp. 2530-2533. Parente, V., J. Goldemberg, and R. Zilles, 2002: Comments on experience curves for PV modules. Progress in Photovoltaics: Research and Applications, 10, pp. 571-574. PassivHaus Planning Package [PHPP], 2004: PassivHaus Planning Package (PHPP). Technical Information PHI-2004/1(E) - Specifications for Quality Approved Passive Houses. PassiveHause Institute, Darmstadt, Germany. Patrick, E., 2007: Sexual Violence and Fuelwood Collection in Darfur. Forced Migration Review, 27, pp. 40-41. Perpiñan, O., E. Lorenzo, M.A. Castro, and R. Eyras, 2009: Energy Payback Time of Grid Connected PV Systems: Comparison Between Tracking and Fixed Systems. Progress in Photovoltaics, 17(2), pp. 137-147. Piatkowski, N., C. Wieckert, and A. Steinfeld, 2009: Experimental investigation of a packed-bed solar reactor for the steam-gasification of carbonaceous feedstocks. Fuel Processing Technology, 90(3), pp. 360-366. POSHIP Potential of Solar Heat for Industrial Processes, 2001: Calor Solar Para Provesos Industriales: Proyecto POSHIP. Instituto Para Lad Diversificacion y Ahorro de Energia (IDAE), Madrid, Spain. Pregger, T., D. Graf, W. Krewitt, C. Sattler, M. Roeb, and S. Moller, 2009: Prospects of solar thermal hydrogen production processes. International Journal of Hydrogen Energy, 34(10), pp. 4256-4267. Probst, M.M., and C. Roecker, 2007: Towards an improved architectural quality of building integrated solar thermal systems (BIST). Solar Energy, 81(9), pp. 1104-1116. PV News, 2008: Annual Data Collection Results. PV News, 27(4) PV News, 2009: Annual Data Collection Results. PV News, 28(4) PV News, 2010: Annual Data Collection Results. PV News, 29(5) PVGIS Photovoltaic Geographic Information System, 2008: Solar Radiation and Photovoltaic Electricity Potential Country and Regional Maps for Europe (Africa) European Commission, Joint Research Centre. Institute for Energy, Renewable Energy Unit, Ispra, Italy. Ragwitz, M., A. Held, G. Resch, and T. Faber, 2007: Assessment and optimization of renewable energy support schemes in the European electricity market: Final Report. Karlsruhe, Germany. Ramachandran, J., N.M. Pearsall, and G.A. Putrus, 2004: Reduction in Solar Radiation Fluctuation by Spatial Smoothing Effect. 19th European Photovoltaic Solar Energy Conference. Proceedings of the International Conference. 7-11 Jul., 2004. WIP-Renewable Energies, Paris, France, pp. 2900-2903. REN21, 2009: Renewables Global Status Report. 2009 Update. REN21: Renewable Energy Policy Network for the 21st Century. Deutsche Gesellschaft fur Technische Zusammenarbeit (GBZ), Eschborn, Germany, 32 pp. Repins, I., M.A. Contreras, B. Egaas, C. DeHart, J. Scharf, C.L. Perkins, B. To, and R. Noufi, 2008: 19.9%-efficient ZnO/CdS/CuInGaSe2 solar cell with 81.2% fill factor. Progress in Photovoltaics, 16(3), pp. 235-239.
Second Order Draft Contribution to Special Report Renewable Energy Sources (SRREN)
Do Not Cite or Quote 95 of 98 Chapter 3 SRREN_Draft02_Ch03 15-Jun-10
1 2 3 4 5 6 7 8 9
10 11 12 13 14 15 16 17 18 19 20 21 22 23 24 25 26 27 28 29 30 31 32 33 34 35 36 37 38 39 40 41 42 43 44 45 46 47 48 49 50 51
Rickerson, W., T. Halfpenny, and S. Cohan, 2009: The emergence of renewable heating and cooling policy in the United States. Policy and Society, 27(4), pp. 365-377. Rigollier, C., M. Lefevre, and L. Wald, 2004: The method Heliosat-2 for deriving shortwave solar radiation from satellite images. Solar Energy, 77(2), pp. 159-169. Rodat, S., S. Abanades, and G. Flamant, 2009: High-Temperature Solar Methane Dissociation in a Multitubular Cavity-Type Reactor in the Temperature Range 1823-2073 K. Energy & Fuels, 23, pp. 2666-2674. Roeb, M., M. Neises, J.P. Sack, P. Rietbrock, N. Monnerie, J. Dersch, M. Schmitz, and C. Sattler, 2009: Operational strategy of a two-step thermochemical process for solar hydrogen production. International Journal of Hydrogen Energy, 34(10), pp. 4537-4545. Roeb, M., C. Sattler, R. Kluser, N. Monnerie, L. de Oliveira, A.G. Konstandopoulos, C. Agrafiotis, V.T. Zaspalis, L. Nalbandian, A. Steele, and P. Stobbe, 2006: Solar hydrogen production by a two-step cycle based on mixed iron oxides. Journal of Solar Energy Engineering-Transactions of the ASME, 128(2), pp. 125-133. Ropp, M., J. Newmiller, C. Whitaker, and B. Norris, 2008: Review of Potential Problems and Utility Concerns Arising from High Penetration Levels of Photovoltaics in Distribution Systems. 33rd IEEE Photovoltaic Specialists Conference. Conference Proceedings, 11-16 May, 2008. IEEE, San Diego, California, pp. 518-523. RTS Corporation, 2009: PV Activities in Japan and Global PV Highlights (Monthly Report), 15(11) Santamouris, M., and D. Asimakopoulos, 1996: Passive cooling of buildings. James & James, London, 472 pp. Sargent and Lundy LLC Consulting Group, 2003: Assessment of Parabolic Trough and Power Tower Solar Technology Cost and Performance Forecasts. National Renewable Energy Laboratory, Golden, Colorado, 344 pp. Scharmer, K., and J. Greif, 2000a: The European solar radiation atlas. Vol. 1, Fundamentals and maps. École des Mines, Paris, France, 118 pp. Scharmer, K., and J. Greif, 2000b: The European solar radiation atlas. Vol. 2, Database and exploitation software. Les Presses de l'Ecole des Mines, Paris, France, 296 pp. Schossig, P., H. Henning, and T. Haussmann, 2004: Microencapsulated Phase Change Materials Integrated into Construction Materials. EuroSun 2004: 14th International Sonnenforum, 20-23 Jun., 2004. Freiburg, Germany, 2, pp. 413-421. Schunk, L.O., P. Haeberling, S. Wepf, D. Wuillemin, A. Meier, and A. Steinfeld, 2008: A receiver-reactor for the solar thermal dissociation of zinc oxide. Journal of Solar Energy Engineering-Transactions of the ASME, 130(2) Schunk, L.O., W. Lipinski, and A. Steinfeld, 2009: Heat transfer model of a solar receiver-reactor for the thermal dissociation of ZnO-Experimental validation at 10 kW and scale-up to 1 MW. Chemical Engineering Journal, 150(2-3), pp. 502-508. Semiconductor Equipment and Materials International, 2009a: China's Solar Future (SEMI China White Paper). Semiconductor Equipment and Materials International, 2009b: The Solar PV Landscape in India - An Industry Perspective (SEMI India White Paper). Shen, R., and J. Wong, 2009: China Solar Set to be 5 Times 2020 Target. Reuter's Business and Financial News (Online) Shockley, W., and H.J. Queisser, 1961: Detailed Balance Limit of Efficiency of p-n Junction Solar Cells. Journal of Applied Physics, 32(3), pp. 510-519. Sinha, P., C.J. Kriegner, W.A. Schew, S.W. Kaczmar, M. Traister, and D.J. Wilson, 2008: Regulatory policy governing cadmium-telluride photovoltaics: A case study contrasting life-cycle management with the precautionary principle. Energy Policy, 36, pp. 381-387. SolarPACES, 2008: SolarPACES Annual Report 2007. International Energy Agency, 204pp. SolarPACES, 2009a: SolarPACES Annual Report 2008. International Energy Agency (IEA), 90pp. SolarPACES, 2009b: Task VI: Solar Energy & Water Processes and Applications.
Second Order Draft Contribution to Special Report Renewable Energy Sources (SRREN)
Do Not Cite or Quote 96 of 98 Chapter 3 SRREN_Draft02_Ch03 15-Jun-10
SolarPACES, 2010: SolarPACES Website (www.solarpaces.org), International Energy Agency (IEA).
1 2 3 4 5 6 7 8 9
10 11 12 13 14 15 16 17 18 19 20 21 22 23 24 25 26 27 28 29 30 31 32 33 34 35 36 37 38 39 40 41 42 43 44 45 46 47 48 49 50 51
Spath, P.L., and W.A. Amos, 2003: Using a concentrating solar reactor to produce hydrogen and carbon black via thermal decomposition of natural gas: Feasibility and economics. Journal of Solar Energy Engineering-Transactions of the ASME, 125(2), pp. 159-164. Specht, M., F. Baumgart, B. Feigl, V. Frick, B. Stuermer, U. Zuberbuehler, M. Sterner, and G. Waldstein, 2010: Speicherung von Bioenergie und erneuerbarem Strom im Erdgasnetz (Storage of bioenergy and renewable power in the natural gas network). In: FVEE Annual Meeting 2009. Forschen für globale Märkte erneuerbarer Energien, Berlin, Germany. Staebler, D.L., and C.R. Wronski, 1977: Reversible Conductivity Changes in Discharge-Produced Amorphous Si. Applied Physics Letters, 31(4), pp. 292-294. Steinfeld, A., 2002: Solar hydrogen production via a two-step water-splitting thermochemical cycle based on Zn/ZnO redox reactions. International Journal of Hydrogen Energy, 27(6), pp. 611-619. Steinfeld, A., 2005: Solar thermochemical production of hydrogen - a review. Solar Energy, 78(5), pp. 603-615. Steinfeld, A., and A. Meier, 2004: Solar Fuels and Materials. In: Encyclopedia of Energy. Elsevier, Amsterdam, The Netherlands, pp. 623-637. Sterner, M., 2009: Bioenergy and renewable power methane in integrated 100% renewable energy systems. Limiting global warming by transforming energy systems. Dissertation, Kassel University, Germany. Sullivan, P., J. Logan, L. Bird, and W. Short, 2009: Comparative Analysis of Three Proposed Federal Renewable Electricity Standards. NREL Report No. TP-6A2-45877, 30pp. Šúri, M., T.A. Huld, and E.D. Dunlop, 2005: PV-GIS: a web based solar radiation database for the calculation of PV potential in Europe. International Journal of Sustainable Energy, 24(2), pp. 55-67. Šúri, M., T.A. Huld, E.D. Dunlop, and H.A. Ossenbrink, 2007: Potential of solar electricity generation in the European Union member states and candidate countries. Solar Energy, 81(10), pp. 1295-1305. Swan, L.G., V.I. Ugursal, and I. Beausoleil-Morrison, 2009: A database of house descriptions representative of the Canadian housing stock for coupling to buildings energy performance simulation. Journal of Building Performance Simulation, 2(2), pp. 75-84. Swanson, R., 2008: In: Proc. of the 33rd IEEE Photovoltaic Specialists Conference, San Diego, California. Swanson, R.M., 2006: Approaching the 29% limit efficiency of silicon solar cells. In: 20th European Photovoltaic Solar Energy Conference, Munich, pp. 584. Taguchi, M., Y. Tsunomura, H. Inoue, S. Taira, T. Nakashima, T. Baba, H. Sakata, and E. Maruyama, 2009: High-efficiency HIT solar cell on thin (< 100 μm) silicon wafer. In: Proceedings of the 24th European Photovoltaic Solar Energy Conference, Hamburg, pp. 1690. Teske, S., 2008: Energy [r]evolution a sustainable global energy outlook. Greenpeace International ; Brussels, Belgium : European Renewable Energy Council, (Saint-Lazare, Quebec : Gibson Library Connections, 2009). Amsterdam, The Netherlands, 211 pp. Torres, J.M.M., N.G. Löpez, and C. Márquez, 2010: The Global Concentrator Solar Power Industry Report 2010-2011. First Conferences Ltd., London, UK. Trieb, F., 2005: Concentrating Solar Power for the Mediterranean Region, Final Report 285pp. Trieb, F., and others, 2009: Characterisation of Solar Electricity Import Corridors from MENA to Europe - Potential, Infrastructure and Cost. DLR. Trieb, F., C. Schillings, M. O'Sullivan, T. Pregger, and C. Hoyer-Klick, 2009: Global potential of concentrating solar power. In: SolarPACES Conference, September 2009, Berlin, Germany. Tripanagnostopoulos, Y., 2007: Aspects and improvements of hybrid photovoltaic/thermal solar energy systems. Solar Energy, 81(9), pp. 1117-1131.
Second Order Draft Contribution to Special Report Renewable Energy Sources (SRREN)
Do Not Cite or Quote 97 of 98 Chapter 3 SRREN_Draft02_Ch03 15-Jun-10
1 2 3 4 5 6 7 8 9
10 11 12 13 14 15 16 17 18 19 20 21 22 23 24 25 26 27 28 29 30 31 32 33 34 35 36 37 38 39 40 41 42 43 44 45 46 47 48 49 50
Tsoutsos, T., N. Fratezeskaki, and V. Gekas, 2005: Environmental impacts from the solar energy technologies. Energy Policy, 33, pp. 289-296. Tsvetkov, A., S. Wilcox, D. Renne, and M. Pulscak, 1995: International Solar Resource Data at the World Radiation Data Center,. SOLAR '95. Proceedings of the 1995 Annual Conference American Solar Energy Society, 15-20 Jul. 1995. American Solar Energy Society, Minneapolis, Minnesota, pp. 216-219. Twidell, J., and A.D. Weir, 2006: Renewable Energy Resources. Taylor & Francis Oxon, UK. U.S. Department of Energy, 2008: Solar Energy Technologies Program. Multi-Year Program Plan 2008-2012. U.S. Department of Energy, Energy Efficiency and Renewable Energy, Washington, DC, 125 pp. U.S. Department of Energy, 2009: Concentrating Solar Power Commercial Application Study: Reducing Water Consumption of Concentrating Solar Power Electricity Generation. Report to Congress. U.S. Department of Energy, Washington, DC, 35 pp. U.S. Photovoltaic Industry Roadmap Steering Committee, 2001: Solar-Electric Power: The U.S. Photovoltaic Industry Roadmap. 36 pp. United Nations Environment Programme [UNEP], 2007: Buildings and Climate Change - Status, Challenges and Opportunities. UNEP. van der Vleuten, F., N. Stam, and R. van der Plas, 2007: Putting solar home system programmes into perspective: What lessons are relevant? Energy Policy, 35(3), pp. 1439-1451. Wadia, C., A.P. Alivisatos, and D.M. Kammen, 2009: Materials availability expands the opportunity for large-scale photovoltaic deployment. Environmental Science & Technology, 43(6), pp. 2072-2077. Wagner, S., J.L. Shay, Migliorato, and H.M. Kasper, 1974: CuInSe2/CdS heterojunction photovoltaic detectors. Applied Physics Letters, 25, pp. 434. Wei, M., S. Patadia, and D. Kammen, 2010: Putting renewables to work: How many jobs can the clean energy industry generate in the US? Energy Policy, 38, pp. 919-931. Weiss, W., I. Bergmann, and G. Faninger, 2009: Solar Heat Worldwide - Markets and Contribution to the Energy Supply 2007. International Energy Agency. Solar Heating & Cooling Programme (SHCP). International Energy Agency, 48 pp. Wentzel, M., and A. Pouris, 2007: The development impact of solar cookers: A review of solar cooking impact research in South Africa. Energy Policy, 35(3), pp. 1909-1919. Werner, S., 2006: Ecoheatcool. NEP Conference. Helsinki. Wilcox, S., and W. Marion, 2008: User's Manual for TMY3 Data Sets. NREL/TP-581-43156, National Renewable Energy Laboratory, Golden, CO. Wiser, R., G. Barbose, and C. Peterman, 2009: Tracking the Sun: The Installed Cost of Photovoltaics in the U.S. from 1998-2007. Lawrence Berkeley National Laboratory, 42pp. World Bank Global Environment Facility Program, 2006: Assessment of the World Bank/GEF Strategy for the Market Development of Concentrating Solar Thermal Power. The International Bank for Reconstruction and Development/The World Bank, Washington, DC, 149 pp. World Energy Council, 1994: New Energy Resources. World Energy Council (WEC), London, UK. Yamamoto, K., A. Nakashima, T. Suzuki, M. Yoshimi, H. Nishio, and M. Izumina, 1994: Thin-Film Polycrystalline Si Solar Cell on Glass Substrate Fabricated by a Novel Low Temperature Process. Jpn. J. Appl. Phys., 33, pp. L1751-L1754. Yang, J., and S. Guha, 1992: Double-Junction Amorphous Silicon-Based Solar-Cells with 11-Percent Stable Efficiency. Applied Physics Letters, 61(24), pp. 2917-2919. Young, W.R., 1996: History of Applying Photovoltaics to Disaster Relief. Florida Solar Energy Center, Cocoa, FL, 16 pp. Z'Graggen, A., and A. Steinfeld, 2008: Hydrogen production by steam-gasification of carbonaceous materials using concentrated solar energy - V. Reactor modeling, optimization, and scale-up. International Journal of Hydrogen Energy, 33(20), pp. 5484-5492.
Second Order Draft Contribution to Special Report Renewable Energy Sources (SRREN)
Do Not Cite or Quote 98 of 98 Chapter 3 SRREN_Draft02_Ch03 15-Jun-10
1 2 3 4 5 6 7 8 9
10
Zayed, J., and S. Philippe, 2009: Acute Oral and Inhalation Toxicities in Rats with Cadmium Telluride. International Journal of Toxicology, 28(4), pp. 259-265. Zervos, A., C. Lins, and J. Muth, 2010: RE-thinking 2050 - A 100% Renewable Energy Vision for the European Union. European Renewable Energy Council. Zhang, X., W. Ruoshui, H. Molin, and E. Martinot, 2010: A study of the role played by renewable energies in China's sustainable energy supply. Energy (in press) Zoellner, J., P. Schweizer-Ries, and C. Wemheuer, 2008: Public acceptance of renewable energies: Results from case studies in Germany. Energy Policy, 26, pp. 4136-4141.