Risk sharing and public transfers*
13
Copyright ã UNU/WIDER 2002 1 University of Oxford and 2 University of Cambridge. This study has been prepared within the UNU/WIDER project on Insurance Against Poverty, which is directed by Dr Stefan Dercon. UNU/WIDER gratefully acknowledges the financial contribution to the project by the Ministry for Foreign Affairs of Finland. Discussion Paper No. 2002/85 Risk Sharing and Public Transfers Stefan Dercon 1 and Pramila Krishnan 2 September 2002 Abstract We use public transfers in the form of food aid to test for the presence of risk sharing arrangements at the village level in rural Ethiopia. We reject perfect risk-sharing, but find evidence of partial risk-sharing via transfers. There is also evidence consistent with crowding out of informal insurance linked to food aid programmes. Keywords: risk, public transfers, informal insurance JEL classification: E20, I38, O17
Transcript of Risk sharing and public transfers*

Copyright� UNU/WIDER 20021University of Oxford and2University of Cambridge.
This study has been prepared within the UNU/WIDER project on Insurance Against Poverty, which isdirected by Dr Stefan Dercon.
UNU/WIDER gratefully acknowledges the financial contribution to the project by the Ministry forForeign Affairs of Finland.
Discussion Paper No. 2002/85
Risk Sharing and Public Transfers
Stefan Dercon1 and Pramila Krishnan2
September 2002
Abstract
We use public transfers in the form of food aid to test for the presence of risk sharingarrangements at the village level in rural Ethiopia. We reject perfect risk-sharing, butfind evidence of partial risk-sharing via transfers. There is also evidence consistent withcrowding out of informal insurance linked to food aid programmes.
Keywords: risk, public transfers, informal insurance
JEL classification: E20, I38, O17

UNU World Institute for Development Economics Research (UNU/WIDER)was established by the United Nations University as its first research andtraining centre and started work in Helsinki, Finland in 1985. The purpose ofthe Institute is to undertake applied research and policy analysis on structuralchanges affecting the developing and transitional economies, to provide aforum for the advocacy of policies leading to robust, equitable andenvironmentally sustainable growth, and to promote capacity strengtheningand training in the field of economic and social policy making. Its work iscarried out by staff researchers and visiting scholars in Helsinki and throughnetworks of collaborating scholars and institutions around the world.
UNU World Institute for Development Economics Research (UNU/WIDER)Katajanokanlaituri 6 B, 00160 Helsinki, Finland
Printed at UNU/WIDER, Helsinki
The views expressed in this publication are those of the author(s). Publication does not implyendorsement by the Institute or the United Nations University, nor by the programme/project sponsors, ofany of the views expressed.
ISSN 1609-5774ISBN 92-9190-294-2 (printed publication)ISBN 92-9190-295-0 (internet publication)

Risk Sharing and Public Transfers
Stefan Dercona and Pramila Krishnanb
aUniversity of Oxford and bUniversity of [email protected]@econ.cam.ac.uk
September 6, 2002
AbstractWe use public transfers in the form of food aid to test for the presence
of risk sharing arrangements at the village level in rural Ethiopia. Wereject perfect risk- sharing, but ¯nd evidence of partial risk-sharing viatransfers. There is also evidence consistent with crowding out of informalinsurance linked to food aid programmes.
In the wake of Townsend's (1994) seminal paper, much empirical work hasfocused on testing perfect risk-sharing. Most tests involve investigating whetheridiosyncratic shocks contain any information to explain consumption growth.Results from a variety of contexts, such as extended families in the United States,communities in India and nuclear households in Ethiopia have failed to ¯ndperfect risk sharing but do ¯nd evidence of partial risk sharing (Hayashi et al.,1996; Townsend, 1994; Dercon and Krishnan, 2000a). This in turn suggests thatthere might be a substantial role for interventions that might help householdspool risk more e®ectively (Morduch, 1999).
But the impact of such interventions cannot be assessed independently ofexisting informal mechanisms. Several standard transfer models predict thatprivate transfers will be reduced if public transfers are introduced and there issome empirical support for this proposition as well (Cox et al., 1998). When in-formal risk-sharing arrangements are present, public transfers to speci c house-holds might be treated like positive idiosyncratic shocks and hence, shared acrosshouseholds. Alternatively, a formal safety net could undermine existing infor-mal insurance: if informal arrangements must be self-enforcing, any scheme thatchanges the value of autarky relative to being in the scheme will a®ect the de-gree of risk-sharing. The result may be less informal insurance and even resultin making some households worse o® (Ligon et al., 2002; Attanasio and RiosRull, 2000).
In this paper, we investigate public transfers in the form of food aid forfarm households in Ethiopia to test for the presence of community risk-sharingarrangements. We ¯rst test the predictions of the perfect risk sharing model:controlling for community resources, food aid should have no impact on house-hold consumption. Under autarky, with no transfers between households, food
1

aid to some households should not a®ect consumption of other households. Ifautarky is rejected then this test provides evidence that transfers take placebetween households. We ¯nd that this is indeed the case: both perfect risksharing and autarky are rejected, suggesting partial risk-sharing using informaltransfers. We also test a prediction of the constrained e±cient (partial) risk-sharing model with enforceability constraints: that in areas with public safetynets, idiosyncratic shocks may be less insured. We present evidence that this isindeed the case.
1 Theoretical FrameworkConsider an endowment economy consisting of a community of N households,each household j with time-separable expected utility de¯ned over instantaneousutility u(cj
ts ; zjts) in which cj is a single consumption good and zj
ts are tasteshifters, varying across households; both c and z are de¯ned across T periods tand S states s.Endowments in each period are assumed to be risky. There is nostorage. Let us assume that all households in this community e±ciently sharerisk, without commitment or information constraints, so that the problem canbe represented as if a social planner allocated weights θj to each household andmaximises the weighted sum of expected utilities (ignoring time preference forsimplicity), subject to the community-level resource constraint in each period tand state s.Formally, at period 0, we can write this weighted sum as:
maxNX
j=1
θj
TX
t=0
SX
s=1
πsu(cjts ; z
jts) (1)
in which πs is the probability of state s occurring. Denoting ejts as the
endowment of household j in state s in time t, and using cAts and eA
ts to denoteaggregate consumption and endowments in the community in each state andtime period, the community resource constraint in each period and state canthen be de¯ned as:
cAts ´
NX
j=1
cjts · eA
ts ´NX
j=1
ejts (2)
More elaborate models including incomes, assets and production could bede¯ned, but the key predictions from a perfect risk-sharing model would not bea®ected (Mace 1991; Cochrane 1991; Deaton 1992; Townsend 1994). De¯ningµst as the multiplier on the community resource constraint in each period andstate, divided by the probability of the state occurring (πs), then the ¯rst ordercondition for optimal allocation of consumption from this problem for householdj at period t can be stated as:
θjujc(c
jts; z
jts) = µst (3)
2

with ujc(c
jts ; z
jts) denoting the marginal utility of consumption of household
j . Since the pareto weights are linked to a single consumption plan and sinceµst only depends on aggregate, not household consumption, this implies thestandard perfect risk-sharing result: that the growth path of marginal utilitiesof all households is the same and that it is only in°uenced by changes in theaggregate resource constraint. We will use this framework to discuss the impactof food aid when risk-sharing is present.
This assumes that the risk-sharing arrangement is perfectly enforceable.There is a growing literature focusing on constrained e±cient contracts, en-forced by the threat to leave the arrangement and return to autarky (Ligon etal., 2002; Attanasio and Rios Rull, 2000). To characterise these arrangements,one could start from (1) and (2) above, but add an additional constraint foreach household h, stating that in each period and state of the world, it mustbe in the interest of the household to stay in the arrangement rather than re-vert to autarky. These contracts still imply that risk-sharing will take place -so that changes in the community resource constraint will still a®ect the pathof household marginal utilities. However, anything that increases the value ofautarky relative to the value of staying in the contract will reduce the degreeof risk sharing. This means that shocks to individual endowments and incomesmay a®ect the ratio of marginal utilities across individuals, despite the presenceof a risk-sharing arrangement.
2 Econometric speci¯cation
Testable formulations of the perfect risk sharing model can be obtained by as-suming speci c utility functions. Using a standard CRRA formulation, uj (cj
t ; zjt ) =
zjt
(cjt)1+γ¡11+γ (in which subscript s is dropped so that conventional notation is
used), using logarithms and allowing for measurement error εjt in the logarithm
of consumption, we can write (3) as:
ln cjt =
1γ
ln µt ¡ 1γ
lnzjt ¡ 1
γlnθj + εj
t (4)
Equation (4) can be estimated using within (¯xed e®ects) estimators, or¯rst di®erences, so that the unobservable ¯xed pareto weights do not a®ectestimation of the parameters of interest Equation (4) gives a useful basis fora standard test of perfect risk-sharing. Suppose one can identify a variableXj
t that a®ects the income or endowment of household j, then provided Xjt
is cross-sectionally independent of zjt , θj or εj
t , then under the null of perfectrisk-sharing, ln cj
t . should be cross-sectionally independent of Xjt .
Idiosyncratic income shocks are thus useful candidates for testing risk-sharing,provided that they are independent of current consumption levels.1 Most neg-
1The advantage of using shocks to income, rather than just income is that in many alter-native models, predictable changes would have been taken into account in the consumptionpath, and would therefore contain less information to reject perfect risk-sharing.
3

ative shocks typically used in the literature such as illness, job loss and agri-cultural shocks arguably would satisfy this condition. In this paper, we usepositive shocks, in the form of food aid given to individuals in the village,as one of the idiosyncratic income shocks. Under perfect risk-sharing, positiveshocks should also be shared and not a®ect household consumption directly, butonly do so through aggregate village resources. However, food aid is typicallynot randomly distributed so the assumption of cross-sectional independence ofaid Aj
t with zjt and particularly, θj is untenable. This is the standard program-
placement problem of evaluating public programs. If aid is targeted to speci ctypes of households - e.g. those in poor areas or those headed by females,then without further controls for program-placement, the impact of aid on ln cj
twould be inconsistently estimated in (4). However, if placement is determinedby characteristics that do not change over time, then estimating (4) by ¯xede®ects removes the source of inconsistency.
We begin with an estimation of (5), and regress the logarithm of consumptionon a set of time-varying community dummies Dt and a set of time-varying tasteshifters Zj
t (which will be de¯ned below).ϑj is assumed to contain all time-invariant taste shifters, the ¯xed part of aggregate resources, ¯xed placemente®ects and the pareto weights.
ln cjt = αDt + βZj
t + δY jt + λAj
t + ϑj + εjt (5)
This regression is used to test perfect risk-sharing, using a set of variablesmeasuring idiosyncratic events a®ecting income, such as illness, crop pests andlivestock disease Y j
t , as well as aid Ajt . The coe±cient, λ, should be zero under
perfect risk sharing, as should be δ, the coe±cient on idiosyncratic income. Ifthe hypothesis that λ = 0 (or δ = 0), is rejected, then perfect risk sharing isruled out. Does this then mean that no risk-sharing arrangement exists? Notnecessarily, but (5) cannot clarify this point. To test this we can ask whetheraid given to other people in the village a®ects a households' consumption. If so,this would provide strong evidence of some sharing arrangement. Furthermore,a prediction of constrained e±cient risk-sharing models, that a change in thevalue of autarky a®ects the degree of risk-sharing, can be tested by investigatingwhether the impact of a reduction in idiosyncratic income is higher in commu-nities with substantial food aid compared to villages where there is little or noaid.
3 DataThe data come from three rounds of the Ethiopian Rural Household Survey(ERHS), a panel data survey consisting of three rounds collected at intervalsof about 5 months between 1994 and 1995. It covers 15 villages, representativefor di®erent areas across the country, and a total of 1450 households were in-terviewed, across villages. The attrition rate in this panel is very low at about3 percent per year. The survey has detailed information on households, in-cluding information on consumption, assets and income, as well as on shocks
4
due to drought, pests and illnessd. Furthermore, it contains information onparticipation in food aid and food-for-work programs.
Consumption per adult equivalent2 (in 1994 prices) is low: about 80 birr onaverage per month or $0.35 a day. The survey period was a good crop year onaverage, but a quarter of the villages were a®ected by drought, while diseases af-°icted crops and livestock elsewhere. An average household loses several persondays a month due to illness. Ability to cope with shocks is generally known tobe quite limited, with life histories suggesting serious hardship linked to shocksdue drought, illness, policy changes and other factors.
Ethiopia is one of the highest recipients of food aid in the world. The annualvolume of cereal food aid has typically represented about 5 to 15 percent ofproduction (Jayne et al., 2002). Much of this is distributed throughout thecountry directly to households: more than half via food-for-work programmesand the rest via direct distribution. The stated aim is to target the poor andvulnerable. Self-targeting of food-for-work is rarely used, and wages are usuallyhigher than opportunity costs of time, resulting in more people applying to workthan can be accommodated. In e®ect, this means that the distinction betweenfood aid and food-for-work may not be useful for our purposes, and is notaddressed in this paper. Previous studies suggest that there is some persistencein the placement of food aid but also of relatively poor targeting.3
Households were asked to list all assistance received since the previous surveyround, about 5 months earlier. On average 27 percent of households receivedaid in each round. There is some persistence in the food aid allocation: the cor-relation between receiving aid today and in the preceding period is statisticallysigni¯cant but not high at 0.15. Two villages received no aid at all while in¯ve of the villages, aid was only distributed once At the household level, about50 % of households received aid at least once, 29% received it just once butonly 5 % received it thrice. Finally, conditional on a village receiving aid, thepercentage of households receiving aid is typically high - about 50 %. Overall,this suggests substantial variation over space and time, allowing us to performthe tests described earlier.
Table 1 displays the descriptive statistics, organised by whether householdsreceive aid or not. Data de¯nitions are provided below the table (details inDercon and Krishnan, 2000b). It is striking that there is little di®erence betweenthe characteristics of those who obtained aid and those who did not. Recipientshave somewhat smaller household size, and su®ered more illness and livestockdisease, but experienced better rainfall and fewer crop shocks. Aid receipts areequivalent to about 13 percent of total consumption for those receiving it. Meanconsumption levels are similar for both groups, with high standard deviations.
2The consumption data are based on summing all sources of food and non-food consump-tion, de°ated by a consumer price index, using the average household in the ¯rst round as abase. It is expressed in adult equivalent units using nutritional equivalence scales based onWHO data for East Africa.
3Sharp (1997) ¯nds little evidence of area targeting. Participants are selected at the com-munity level but aid is spread over a large number of bene¯ciaries. This is con¯rmed by Jayneet al. (2002) who also ¯nd that the most important factor determining access to food aid wassimply whether a programme existed in the area before.
5
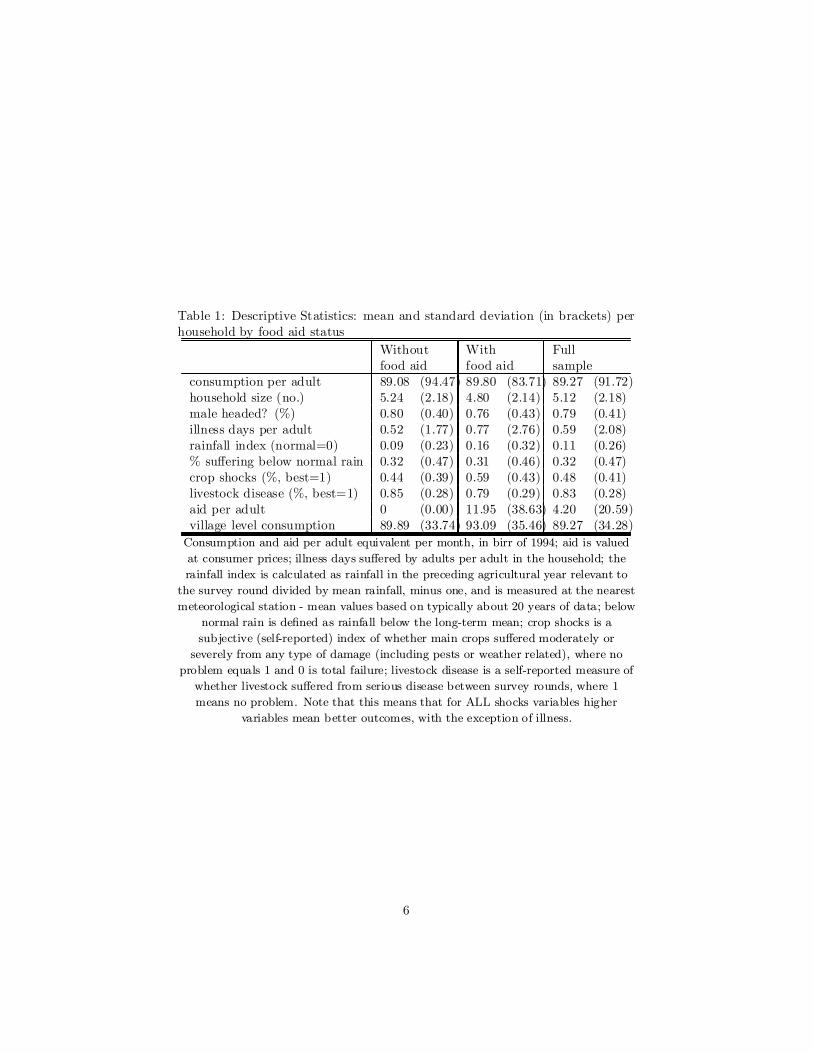
Table 1: Descriptive Statistics: mean and standard deviation (in brackets) perhousehold by food aid status
Without With Fullfood aid food aid sample
consumption per adult 89.08 (94.47) 89.80 (83.71) 89.27 (91.72)household size (no.) 5.24 (2.18) 4.80 (2.14) 5.12 (2.18)male headed? (%) 0.80 (0.40) 0.76 (0.43) 0.79 (0.41)illness days per adult 0.52 (1.77) 0.77 (2.76) 0.59 (2.08)rainfall index (normal=0) 0.09 (0.23) 0.16 (0.32) 0.11 (0.26)% su®ering below normal rain 0.32 (0.47) 0.31 (0.46) 0.32 (0.47)crop shocks (%, best=1) 0.44 (0.39) 0.59 (0.43) 0.48 (0.41)livestock disease (%, best=1) 0.85 (0.28) 0.79 (0.29) 0.83 (0.28)aid per adult 0 (0.00) 11.95 (38.63) 4.20 (20.59)village level consumption 89.89 (33.74) 93.09 (35.46) 89.27 (34.28)Consumption and aid per adult equivalent per month, in birr of 1994; aid is valuedat consumer prices; illness days su®ered by adults per adult in the household; therainfall index is calculated as rainfall in the preceding agricultural year relevant to
the survey round divided by mean rainfall, minus one, and is measured at the nearestmeteorological station - mean values based on typically about 20 years of data; below
normal rain is de¯ned as rainfall below the long-term mean; crop shocks is asubjective (self-reported) index of whether main crops su®ered moderately or
severely from any type of damage (including pests or weather related), where noproblem equals 1 and 0 is total failure; livestock disease is a self-reported measure of
whether livestock su®ered from serious disease between survey rounds, where 1means no problem. Note that this means that for ALL shocks variables higher
variables mean better outcomes, with the exception of illness.
6

(Note that this consumption level is measured after receipt of aid.) By andlarge, food aid recipients live in villages with higher mean consumption.
4 ResultsTables 2 and 3 summarises the econometric tests. We report the ¯xed e®ectsestimates, with robust standard errors. Idiosyncratic income determinants in-cluded are whether aid was received by the household as well as other indices ofshocks, including the self-reported measure of shocks to crops, livestock diseaseand illness. These alternative sources of shocks are introduced as control vari-ables, to isolate the impact of aid. Household composition and the sex of thehousehold head (with changes mainly due to seasonal migration or death) areused as taste shifters. We begin with a test of the perfect risk-sharing model,with all aggregate resources summarised as time-varying village level dummies.We measure the impact of aid in two di®erent ways: as a dummy for whether thehousehold received any aid, as well as the logarithm of the level of aid received.Table 1, columns 1 and 2, suggest that the perfect risk sharing model is rejectedin either case, since controlling for time-varying community ¯xed e®ects, aid aswell as other shocks a®ect consumption levels4. Column 2 suggests that a tenpercent increase in aid increases consumption by 0.8 percent.
Next we test whether there is actually any risk-sharing taking place. Todo this, we replace the community level variables by time-varying variablesproxying changes in common resources. Deviations from normal rainfall levelswere included, expressed as actual levels divided by long-term mean levels minusone. We allow for di®erent e®ects on resources from 'better than normal' rainfallcompared to 'worse than normal' levels. For example, if savings are possible, butcredit markets su®er from imperfections, then it is easier to smooth in good yearsthan in bad years (Deaton, 1991). Therefore the regression includes rainfall ingeneral, as well as a separate measure of rainfall interacted with a dummyvariable that takes the value of one when the rainfall index is below 0, or belownormal levels. Hence, in bad years, the e®ect of rainfall on consumption is thesum of the coe±cient on rainfall and the coe±cient on rainfall interacted withthis dummy; both coe±cients are expected to be positive. All the regressionresults con¯rm this: below normal rainfall has a signi¯cantly larger impactthan above normal rainfall. However, both e®ects are substantial, consistentwith large weather-induced °uctuations in consumption.
A further community characteristic included is whether more than ¯ve percent of the households from a particular village in the sample received food aid.Testing its e®ect gave a strongly signi cant, positive e®ect. However, it couldbe argued that in areas with poorly functioning food markets, where arbitragehappens slowly or not at all, the addition of substantial amounts of food aid tosupplies in a village may simply have relative price e®ects, so that the impactmeasured by this food aid at the village level is merely a price e®ect, and
4Note that the positive sign on crop shocks implies that worse crop conditions reducedconsumption.
7

Table 2: Regression results. Left hand side variable is log real consumption peradult. Fixed e®ects estimator with robust standard errors
1 2 3coe® p-value coe® p-value coe® p-value
crop shocks (%, best=1) 0.086 0.000 0.076 0.001 0.025 0.293livestock shocks (%, best=1) 0.005 0.381 0.004 0.406 0.005 0.391illness days per adult 0.061 0.116 0.062 0.108 0.002 0.963rainfall deviation (normal=0) 0.465 0.000rainfall deviation if bad (if <0) 0.316 0.000aid dummy 0.130 0.000 0.090 0.001ln aid per adult 0.082 0.000village aid dummy 0.090 0.000ln village aid per adultln relative price indexsex head (1=male) 0.131 0.318 0.162 0.206 0.194 0.146household size (no.) -0.119 0.000 -0.110 0.000 -0.131 0.000crop shocks*village aid dumlivestock*village aid dummytime-varying village dummies yes yes
R-squared 0.080 0.085 0.048observations 3987 3985 3987
Table 3: Further regression results. Left hand side variable is log real consump-tion per adult. Fixed e®ects estimator with robust standard errors
1 2 3 4coe® p-
valuecoe® p-
valuecoe® p-
valuecoe® p-
valuecrop shocks (%, best=1) 0.036 0.130 0.021 0.379 0.034 0.328 -0.029 0.426livestock shocks (%, best=1) 0.005 0.355 0.005 0.336 0.005 0.379 0.005 0.295illness days per adult 0.046 0.208 0.032 0.337 0.066 0.123 0.052 0.251rainfall deviation (normal=0) 0.377 0.000 0.433 0.000 0.425 0.000rainfall deviation if bad (if <0) 0.293 0.000 0.240 0.000 0.324 0.000aid dummy 0.111 0.000 0.053 0.054ln aid per adult 0.040 0.005 0.051 0.009village aid dummy 0.075 0.196ln village aid per adult 0.022 0.140 0.124 0.001ln relative price index -0.641 0.000 -0.590 0.000 -0.596 0.000sex head (1=male) 0.025 0.129 0.223 0.102 0.133 0.310 0.240 0.135household size (no) -0.118 0.000 -0.119 0.000 -0.120 0.000 -0.119 0.000crop shocks*village aid dum 0.084 0.068 0.107 0.025livestock*village aid dummy -0.020 0.558 -0.069 0.243time-varying village dummies yes
R-squared 0.059 0.059 0.080 0.061observations 3985 3987 3987 3985
8

not evidence for risk-sharing transfers between households. To control for thispossibility, we include a measure of the level of local food prices, compared tothe average in the full sample: in short, as a control for local price movementsbeyond in°ationary trends in national food prices. Column 3 shows that thishas a strongly signi¯cant e®ect, and lowers the impact of the village aid dummy,but the latter remains strongly signi cant. This would suggest that some risk-sharing is taking place and evidence in favour of the use of transfers betweenhouseholds.
We explored this further using levels of food aid given to individuals andto the community. To construct a measure of the latter, we calculated thetotal volume of aid coming into the village per adult per month, using all re-ported levels by the households in the sample. Obviously, since we work witha sample of households (even if it typically constitutes about a quarter of thevillage), measurement error may bedevil this estimate. Even so, table 3, column1 demonstrates that both individual and community level aid have a positiveimpact on consumption, but the latter is only signi cant at 14 per cent. How-ever, we have an alternative measure of aid °ows that might be used as aninstrument to tackle the measurement issue further. Our measure of food aidcoming in is based on a question asking for receipts of aid between the surveyrounds - typically about 5 months. However, in the consumption questionnaire,food aid received from public sources is recorded again with a recall period of7 days. Since this is an independent measure of the food aid variable, obvi-ously correlated with the measure from the consumption ¯les, we can use thismeasure as an identifying instrument for household and community level foodaid received. The results are reported in column 2, and as expected, both thesize and signi¯cance of the coe±cients increases, especially the community levele®ect. In short, food aid coming into the village seems to be shared to someextent.
Finally, we test whether there is any evidence of pressure on informal risk-sharing arrangements due to the presence of food aid. To investigate this, we usethe same regression as in columns 1 and 3 of table 2, but this time we includean interaction between idiosyncratic shocks that are clearly observable: viz.crop shocks and livestock shocks, and interact them with a measure of whetherthe village receives any food aid. The null hypothesis of no impact on informalarrangements from food aid is that the coe±cient on the interaction term of foodaid with the idiosyncratic shocks, is zero, i.e. there is no additional informationin this extra term to explain consumption (controlling for idiosyncratic shocksas before). Recall that in column 1 (table 2), there was evidence of crop shocksnot being fully insured within the community. Column 3 (table 3) shows thatthe coe±cient on the interaction term of crop shocks with food aid is positiveand signi¯cant at 7 percent, i.e. that there is a larger e®ect of idiosyncraticcrop shocks in these communities than in those without food aid5. In fact, theevidence suggests that this lack of full insurance only occurs in villages receiving
5Given the de¯nition of the interaction term, in villages with food aid, the total e®ectof crop shocks on consumption is the sum of the coe±cient on idiosyncratic shocks and thecoe±cient on the interaction term,
9

food aid, while for villages without food aid the coe±icient is not signi¯cantlydi®erent from zero, as if in localities with safety nets some idiosyncratic shocksare not insured anymore. This result is con¯rmed (and signi¯cant at 3 percent)in column 4, where rainfall information is used as a direct measure of timevarying village level variables. This supports the proposition that food aidcrowds out local arrangements for insuring idiosyncratic risk.
5 ConclusionsWe use public transfers in the form of food aid to test for the presence of risksharing arrangements at the village level in rural Ethiopia. We reject perfectrisk- sharing, but ¯nd evidence of partial risk-sharing via transfers. There isalso evidence consistent with crowding out of informal insurance linked to foodaid programmes.
AcknowledgementsThe data used in this paper were collected by Economics Department of Ad-
dis Ababa University in collaboration with the Centre for the Study of AfricanEconomies at Oxford University.
References[1] Attanasio, O., and Rios-Rull, J. (2000). `Consumption Smoothing in Island
Economies: Can Public Insurance Reduce Welfare.', European EconomicReview, vol.44, no 7, pp.1259-79.
[2] Cox, D. , Eser, Z. and Jimenez, E. (1998). `Motives for private transfers overthe life-cycle: An analytical framework and evidence from Peru.', Journalof Development Economics, vol. 55, pp.57-80.
[3] Deaton, A. (1991). `Savings and Liquidity Constraints.' Econometrica,vol.59, no.5, pp.1221{1248.
[4] Dercon, S. and Krishnan, P. (2000a). `In Sickness and in Health: Risk-Sharing within Households in Ethiopia.', Journal of Political Economy,vol.108, no.vol.4, pp.688{727.
[5] | (2000b). `Vulnerability, Seasonality, and Poverty in Ethiopia.' Journalof Development Studies, vol.36, no.6, pp. 25-53.
[6] Hayashi, F., Altonji, J., and Kotliko®, L. (1996). `Risk-Sharing Betweenand Within Families.' Econometrica, vol.64, no.2, pp.261{94.
[7] Ligon, E., Thomas, J. and Worrall, T. (2002). `Informal Insurance withLimited Commitment: Theory and Evidence from Village Economies.' Re-view of Economic Studies, vol.69, no.1, pp. 209-44.
10
[8] Morduch, J. (1999). `Between the State and the Market: Can InformalInsurance Patch the Safety Net?' World Bank Research Observer, vol.14,no.2, pp.187{207.
[9] Sharp, K. (1997). Targeting of Food Aid in Ethiopia, Addis Ababa: Savethe Children Fund, Ethiopia.
[10] Jayne, T.S, Strauss, J., Yamano, Y. and Molla, D. (2002). `Targeting offood aid in rural Ethiopia: chronic need or inertia?', Journal of Develop-ment Economics, vol.68, pp.247-288.
[11] Townsend, R.M. (1994). `Risk and Insurance in Village India.' Economet-rica, vol.62, no.3, pp.539{91.
11