
Surrogate modelling for characterising the performance of a dielectric barrier discharge plasma...
16
1 American Institute of Aeronautics and Astronautics Surrogate Modeling for Characterizing the Performance of Dielectric Barrier Discharge Plasma Actuator Young-Chang Cho *1 , Balaji Jayaraman †2 , Felipe A. C. Viana ‡3 , Raphael T. Haftka §3 and Wei Shyy **1 1 Department of Aerospace Engineering, University of Michigan, Ann Arbor, MI 48109 2 T-3 Fluid Dynamics Group, Los Alamos National Laboratory, NM 87545 3 Department of Mechanical and Aerospace Engineering, University of Florida, Gainesville, FL 32611 The dielectric barrier discharge (DBD) plasma actuator offers promising opportunities for flow control because it does not require mass injection and involves no moving mechanical components. In order to gain better understanding of the impact of the materials and operational parameters on the performance of the DBD actuator, and to facilitate design of effective control schemes, the surrogate modeling technique is adopted. The model is established based on three design variables, namely (i) frequency of the applied voltage, (ii) dielectric constant of the insulator, and (iii) polarity (positive/negative) time ratio of the applied waveform, and focuses on two objectives, namely, (i) net force generated, and (ii) power requirement. The 2-species fluid plasma model with helium as a working gas is used in the computational model to generate the data needed by the surrogate model. Multiple surrogate models are compared to enhance the robustness of the surrogate performance. There exist multiple Pareto fronts where the x-directional force is positive with relatively low power and negative with high power respectively. Global sensitivity analysis indicates that the frequency of the applied voltage is important for the actuator performance in one region whereas the time ratio of the applied waveform is in the other, while the dielectric constant is always important. The performance dependency on variables also differs significantly according to the different regions. Nomenclature D = Diffusivity of charged particles d e = Gap distance between electrodes E = Electric field vector F x = Instantaneous x-directional force F x,ST = Time and domain averaged x-directional force h d = Dielectric material thickness l el = Length of lower electrode l eu = Length of upper electrode P T = Power input per one period q = Charge of one species particle r f = Positive to negative time ratio of the applied waveform r = Position vector r ie = Destruction rate of couples of particles S = Area of the computational domain S ie = Creation rate of couples of particles T = Period of the applied voltage u = (u x ,u y ) = Cell-averaged velocity of charged particles n = Particle number density * Graduate Research Assistant, Student Member AIAA † Technical Staff Member (Research Associate), Member AIAA ‡ Research Scholar § Distinguished Professor, Fellow AIAA ** Clarence L “Kelly” Johnson Professor, Fellow AIAA 46th AIAA Aerospace Sciences Meeting and Exhibit 7 - 10 January 2008, Reno, Nevada AIAA 2008-1381 Copyright © 2008 by the American Institute of Aeronautics and Astronautics, Inc. All rights reserved.
-
Upload
independent -
Category
Documents
-
view
2 -
download
0
Transcript of Surrogate modelling for characterising the performance of a dielectric barrier discharge plasma...
1
American Institute of Aeronautics and Astronautics
Surrogate Modeling for Characterizing the Performance of
Dielectric Barrier Discharge Plasma Actuator
Young-Chang Cho*1
, Balaji Jayaraman†2
, Felipe A. C. Viana‡3
,
Raphael T. Haftka§3
and Wei Shyy**1
1Department of Aerospace Engineering, University of Michigan, Ann Arbor, MI 48109
2T-3 Fluid Dynamics Group, Los Alamos National Laboratory, NM 87545
3Department of Mechanical and Aerospace Engineering, University of Florida, Gainesville, FL 32611
The dielectric barrier discharge (DBD) plasma actuator offers promising opportunities
for flow control because it does not require mass injection and involves no moving
mechanical components. In order to gain better understanding of the impact of the materials
and operational parameters on the performance of the DBD actuator, and to facilitate design
of effective control schemes, the surrogate modeling technique is adopted. The model is
established based on three design variables, namely (i) frequency of the applied voltage, (ii)
dielectric constant of the insulator, and (iii) polarity (positive/negative) time ratio of the
applied waveform, and focuses on two objectives, namely, (i) net force generated, and (ii)
power requirement. The 2-species fluid plasma model with helium as a working gas is used
in the computational model to generate the data needed by the surrogate model. Multiple
surrogate models are compared to enhance the robustness of the surrogate performance.
There exist multiple Pareto fronts where the x-directional force is positive with relatively low
power and negative with high power respectively. Global sensitivity analysis indicates that
the frequency of the applied voltage is important for the actuator performance in one region
whereas the time ratio of the applied waveform is in the other, while the dielectric constant is
always important. The performance dependency on variables also differs significantly
according to the different regions.
Nomenclature D = Diffusivity of charged particles
de = Gap distance between electrodes
E = Electric field vector
Fx = Instantaneous x-directional force
Fx,ST = Time and domain averaged x-directional force
hd = Dielectric material thickness
lel = Length of lower electrode
leu = Length of upper electrode
PT = Power input per one period
q = Charge of one species particle
rf = Positive to negative time ratio of the applied waveform
r = Position vector
rie = Destruction rate of couples of particles
S = Area of the computational domain
Sie = Creation rate of couples of particles
T = Period of the applied voltage
u = (ux,uy) = Cell-averaged velocity of charged particles
n = Particle number density
* Graduate Research Assistant, Student Member AIAA
† Technical Staff Member (Research Associate), Member AIAA
‡ Research Scholar
§ Distinguished Professor, Fellow AIAA
** Clarence L “Kelly” Johnson Professor, Fellow AIAA
46th AIAA Aerospace Sciences Meeting and Exhibit7 - 10 January 2008, Reno, Nevada
AIAA 2008-1381
Copyright © 2008 by the American Institute of Aeronautics and Astronautics, Inc. All rights reserved.
2
American Institute of Aeronautics and Astronautics
Vapp = Applied voltage
ε0 = Permittivity of vacuum
εgas = Relative permittivity of gas
εd = Relative permittivity of the dielectric material
μ = Mobility of charged particles
Subscripts
e = electron
i = ion
p = Particle species
Acronyms
BDF = Backward differentiation formula
DB = Distance-based design
DBD = Dielectric barrier discharge
FCCD = Face-centered composite design
GSA = Global sensitivity analysis
GQ = Gaussian Quadrature
KRG = Kriging model
LHS = Latin-hypercube sampling
MS = Multiple surrogate model
PRESS = Square root of predicted residual sum of squares
PRS = Polynomial response surface model
RBNN = Radial basis neural network model
SBO = Surrogate-based optimization
I. Introduction
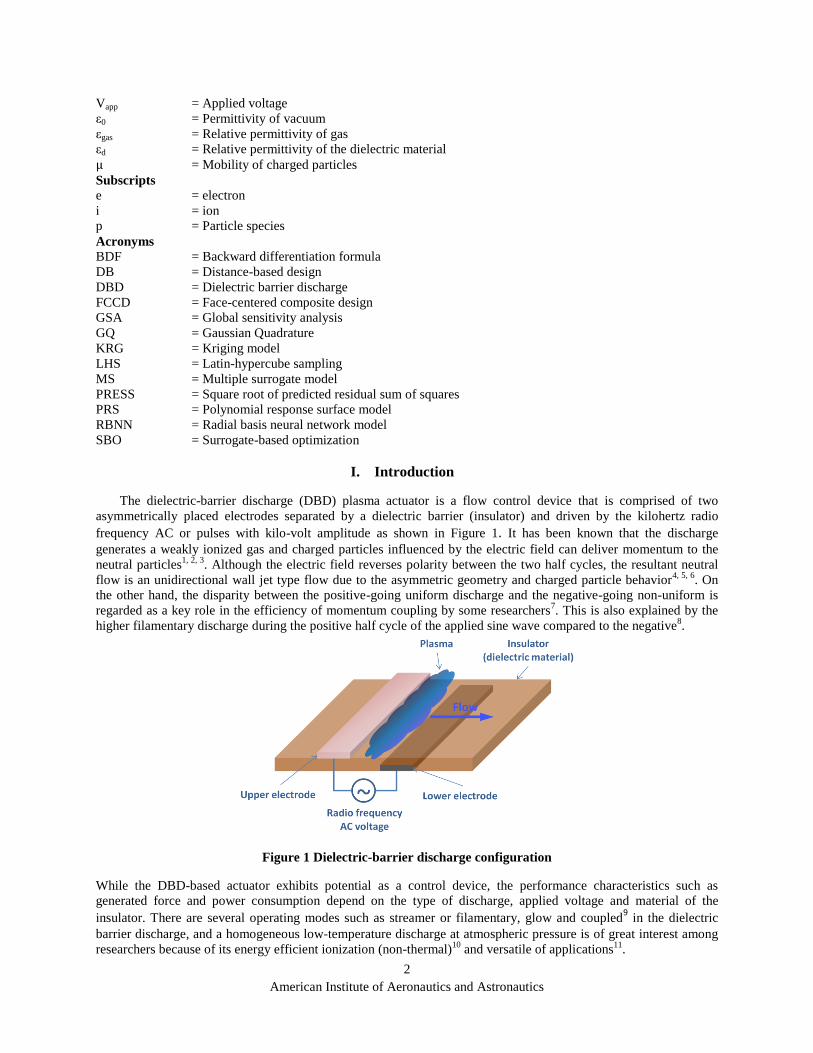
The dielectric-barrier discharge (DBD) plasma actuator is a flow control device that is comprised of two
asymmetrically placed electrodes separated by a dielectric barrier (insulator) and driven by the kilohertz radio
frequency AC or pulses with kilo-volt amplitude as shown in Figure 1. It has been known that the discharge
generates a weakly ionized gas and charged particles influenced by the electric field can deliver momentum to the
neutral particles1, 2, 3
. Although the electric field reverses polarity between the two half cycles, the resultant neutral
flow is an unidirectional wall jet type flow due to the asymmetric geometry and charged particle behavior4, 5, 6
. On
the other hand, the disparity between the positive-going uniform discharge and the negative-going non-uniform is
regarded as a key role in the efficiency of momentum coupling by some researchers7. This is also explained by the
higher filamentary discharge during the positive half cycle of the applied sine wave compared to the negative8.
Figure 1 Dielectric-barrier discharge configuration
While the DBD-based actuator exhibits potential as a control device, the performance characteristics such as
generated force and power consumption depend on the type of discharge, applied voltage and material of the
insulator. There are several operating modes such as streamer or filamentary, glow and coupled9 in the dielectric
barrier discharge, and a homogeneous low-temperature discharge at atmospheric pressure is of great interest among
researchers because of its energy efficient ionization (non-thermal)10
and versatile of applications11
.
3
American Institute of Aeronautics and Astronautics
The dielectric-barrier discharge-based plasma actuator has been widely studied for its flow control application.
However, in spite of its inherent advantages (no moving parts and vast control potential), little insight is available
regarding efficient operating conditions to accommodate various performance needs. With relatively high
magnitudes of applied voltage (15kV at 5-10kHz AC) for uniform discharge, the force generated by a single actuator
is less than 10mN/m in air12. The flow velocity induced by a single actuator is usually less than 5m/s for pulsed
input voltage13
as well as sinusoidal voltage waveform14
. In their efforts to understand the operating mechanism of
the actuator, various researchers have conducted parametric studies to identify trends and if possible optimal
conditions. The effects of electrode gap and width14
, wave form of applied voltage and gas species15
, frequency and
amplitude of applied voltage, dielectric material14,15,16
, pressure of neutral gas17
on the induced flow velocity and/or
power efficiency have been reported.
From the previous parametric studies, some features of the correlation between variables have been deduced.
Higher voltage, frequency, and rate of voltage increase result in higher force generation or induced velocity14-16, 18.
Materials with larger dielectric constant (εd=30 compared to 2) are observed to produce larger force due to the
increase in electric field and plasma volume although at the cost of increased power16. In the same way, thinner
dielectric material induces higher flow velocity until the electric field is high enough to produce filamentary
discharge which induces smaller momentum transfer to the neutral flow14. Although some parametric trends can be
explained through the actuator mechanism, the overall performance is affected by many parameters that are
correlated to each other. Hence it is hard to identify optimal design of the actuator with reasonable fidelity purely
based on independent trends.
Although the related phenomena have been well captured, since the experimental analysis is bounded by the
difficulty of measurement, the numerical approach is crucial to understanding the mechanism and physics of the
DBD plasma actuator. Recently, the numerical approaches have been improved to simulate the complex phenomena
with qualitative comparison to the experiments. Boeuf et al.19
use the fluid modeling approach to study the effect of
the negative ions, which is important for air chemistry. Font et al.20
made a comparison between the particle (PIC-
DSMC) and fluid plasma simulations, and analyzed the asymmetry in the forward and backward cycles and spatial
non-neutrality in oxygen. Likhanskii et al.21
demonstrate the use of positive pulses with a positive bias and report an
improved performance in force generation. Roy et al.22
use eight charged and neutral species for N2/O2 air chemistry
simulation, observing the existence of decelerating force downstream of the powered electrode which deteriorates
the performance of actuators.
In spite of these recent efforts to accurately capture the actuator physics, significant strides need to be made to
integrate these models with the flow physics to study complex flow control applications. Specifically there is
significant difference in plasma and neutral flow time scales at low Reynolds numbers23
which makes such
computations inefficient and infeasible for most practical problems. Anticipating their need, reduced order models
have been developed concurrently to accommodate various applications. Instead of using time-variant high fidelity
discharge models, a phenomenological model representation is proposed5 to approximate averaged body force field.
It enables the simulation of complex flow fields at a much smaller computational cost. It has been applied to the
flow control in low Reynolds number airfoil24, 25
, and low-pressure turbine26
, and separation elimination/delay has
been observed. The present effort using surrogate models assists in improving the earlier linear
field/phenomenological approach.
The surrogate-based optimization (SBO) approach has been successfully used in the design problems using
computationally expensive simulations27, 28. With limited numerical simulations, the surrogates enable us to generate
reliable approximation to the solution over a design space and assess the sensitivity and correlation of the various
parameters. They are basically analytical representations relating independent (design) variables to dependent
variables (objective functions) with a reasonable behavior. There are widely used models – polynomial response
surface approximation (PRS), Kriging (KRG), radial basis neural network (RBNN) and weighted average of
multiple surrogate models (MS or parametric weighted surrogate model)29
. Since the error due to the approximation
is affected by various factors such as number of design points, the design of experiments, and behavior of the
physical system, the surrogate model needs to be carefully chosen. The optimization process in many cases consists
of multiple objectives containing competing factors that can be simplified by ignoring insignificant parameters using
global sensitivity analysis (GSA). The iterative design refinement and Pareto front analysis that contains all the
possible optima can help identify the global optimum solution.
The present study focuses on understanding the effect of three chosen parameters – waveform and frequency of
the applied voltage and dielectric constant of the insulator on the DBD actuator performance – power input and
generated flow directional force - using surrogate models. The main objective is to gain an idea of the impact of
those variables which have significant interplay. To simplify the problem the computational model with relatively
4
American Institute of Aeronautics and Astronautics
simple chemistry of helium as against air is employed. Other variables that are known to have significant impact are
fixed to make the problem manageable including geometry of the actuator. Using the surrogate-based technique
parametric relations between the design variables and objective functions have been identified. Error and
performance of the various surrogate models for this application is also be discussed in detail.
II. Governing Equations and Numerical Approach
The set of governing equations used in modeling the DBD actuator are the continuity and momentum equations
derived from the Boltzmann equation and the electric field equation from the Maxwell’s equations. Since the
atmospheric pressure is high enough to assume the local thermodynamic equilibrium, the fluid model is reasonably
accurate and the local electric field density (E/N) can be used to approximate the phenomena related to the collision
processes – ionization/recombination, diffusion and drift - instead of solving the energy equation30. Governing
equations are given as Eq. (1) ~ (3) for only two species - He+ (subscript p=i) and electron (subscript p=e) – for
simplicity in this paper.
∂np
∂t+ ∇ ∙ np𝐮p = neSie − rnine (1)
npμp𝐄 − ∇ npDp = np𝐮p (2)
∇ ∙ εd𝐄 =q ini−qene
ε0 (3)
The equation (2) is the well-known drift-diffusion equation, which is valid also for ions in the high pressure
(atmospheric regime) discharge. To solve this set of equations the source terms are handled with 4th
order backward
differentiation formula (BDF) and the Poisson equation with the algebraic multigrid method23
. And the second-order
central difference and upwind methods are employed for the diffusion and convection terms respectively. The
number densities and electric field are coupled by solving the Poisson equation between the predictor and corrector
steps where the first order source splitting is used as noted in Ref. 30. The coefficients of gaseous properties of
helium regarding particle collisions and ionization/production are obtained from Ref. 1, 2, and 31.
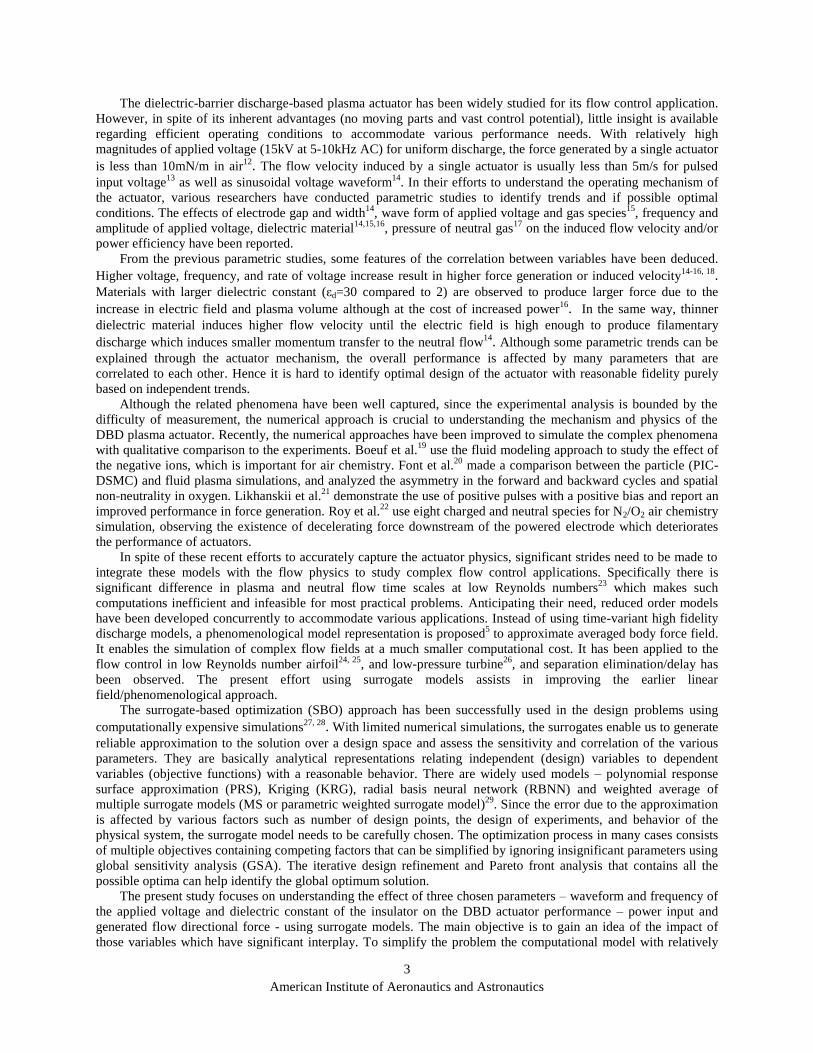
The computational domain with the actuator geometry is presented in Figure 2. The thickness of the insulator
(hd) is set as 0.5cm and the lengths of upper (leu) and lower electrodes (lel) are 0.2cm same as the gap distance (de).
The applied voltage to the upper electrode has sinusoidal shape but the positive-to-negative half cycle ratio, rf can be
varied. Boundary conditions for the charge species at the dielectric surface are set to satisfy the current continuity
that allows the accumulation of particles, and only electrons are allowed to be absorbed in the upper electrode
without the secondary emission. Gas pressure of helium is set as 300 mmHg, and the ion temperature is 300K. The
electron temperature is calculated as a function of the local electric field strength using a local field approximation
approach, which is discussed in detail in Ref. 23.
Figure 2 Computational domain and applied waveform
III. Surrogate Models and Optimization Methodology
Among the many possible parameters affecting the actuator performance, three are chosen as design variables to
assess their impact on the actuator efficiency. The dielectric constant of the insulator material (εd), frequency of the
5
American Institute of Aeronautics and Astronautics
applied voltage (fv) and positive-to-negative half cycle ratio (rf) are chosen for the preliminary parametric study
because they are among the key parameters which have non-simple effects on the resultant force by affecting both of
the positive and negative peak value of domain averaged force and asymmetry in its waveform6. However, there are
numerous parameters, which are known to affect the generated force and power. The peak magnitude of sinusoidal
voltage and the size of electrode are also decisive parameters in force generation, such as power dependency of the
force on the voltage peak32
. The constraint of each design variable is devised by considering the existing choice of
materials and the general working conditions of previous DBD actuators. The objective functions are chosen to
represent the actuator performance, namely the time and domain averaged x-directional force (Fx,ST) and average
power input to the circuit (PT). The time and domain averaged Lorentzian force to the charged particles is assumed
to be equivalent to the body force acting on the neutral gas, especially at atmospheric pressure conditions. The actual
power input to the discharge device can be calculated by considering the charge and displacement currents in the
volume of the medium33
. However in this study only the charge current through the upper electrode is considered for
simplicity. The definitions and parameter ranges are presented in Table 1.
Table 1 Design variable constraints and objective functions
Design variables Constraints
εd Dielectric constant of the
insulator 2 ≤ εd ≤ 15
fv Frequency of the applied
voltage (kHz) 5 ≤ fv ≤ 20
rf Positive-to-negative half
cycle ratio 0.5 ≤ rf ≤ 1.5
Objective functions Definitions
− Fx,ST Time and domain averaged
x-directional force (mN/m) Fx,ST ≡
1
ST Fx r , t dtdr
TS
PT
Power input for one cycle by
the charge current through
the upper electrode (W)
PT ≡1
T I t V t dtT
where I t = qini t uy,i t − qene t uy,e t dxleu
The objectives of the optimization problem are maximizing Fx,ST and minimizing PT. However, as will be discussed
later, since there are cases which produce the negative Fx,ST, one objective is chosen as minimizing − Fx,ST for the
convenience of minimizing both objective functions.
Since the number of the sampling points is restricted by the computational cost, the design of experiments needs
to be chosen carefully. Some of the most popular approaches such as the combination of face-centered composite
design (FCCD), Latin-hypercube sampling (LHS), distance-based (DB) designs and their modifications are used. By
spreading the design points towards constraints FCCD is efficient for second-order design in a cuboid design space,
and LHS provides space-filling data set with the even chance for each design variable. DB simply generates design
points to be evenly distributed in space, thus can cover complicated design space properly34
. Considering its iterative
nature and the computational expense, the number of sampling points at each refined level is set to 20 which is
usually sufficient for 2nd
order polynomial response surface.
Four different surrogate models such as 2nd
order polynomial response surface, Kriging, radial basis neural
network, and multiple surrogate which is the weighted combination of the rest- are applied to generate the analytic
response of the actuator model.28
The weight of each model in the multiple surrogates is set using the non-
parametric surrogate filter which gives higher value for the surrogate with the smaller square root of predicted
residual sum of squares (PRESS) error by evaluating it to be proportional to the sum of the PRESS of other
surrogates29
. Main and total effects of variables in the global sensitivity analysis are computed using the Gaussian
quadrature.
6
American Institute of Aeronautics and Astronautics
For the multi-objective optimization of minimizing two objective functions, the Pareto optimal set is
constructed by seeking the non-dominated points in the objective function space. This type of searching the best
trade-off solutions is accompanied by the multiple design space refinements based on the surrogate model statistics
in the previous level.
IV. Results and Discussion A. Surrogate modeling
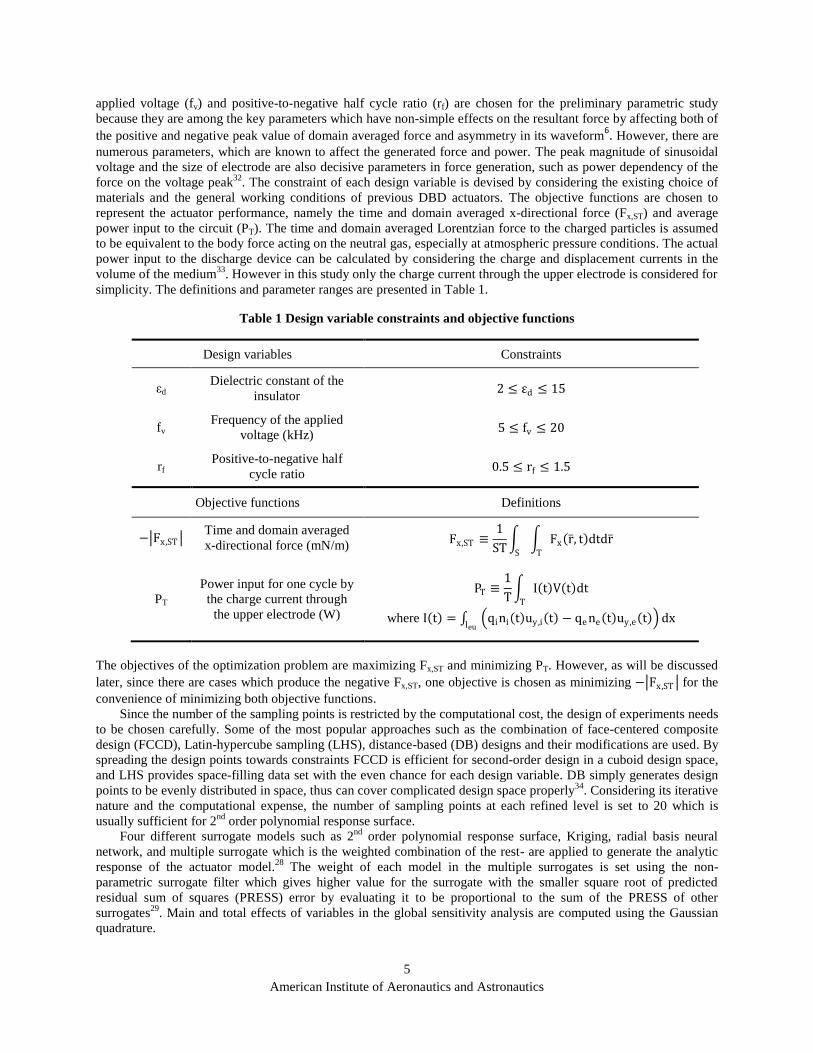
The first level design of experiments – level 0 - using the combination of FCCD and LHS and the simulation
result of those 20 points are presented in Figure 3. Although the sampled points are well distributed in the design
space, the response points cluster in some parts of the response space as in Figure 3 b). As a result it is hard to get an
idea of the objective function dependency on the design variables with sufficient accuracy, but some noteworthy
features can be observed from the contours. With higher dielectric constant of the insulator both power and
magnitude of force, |Fx,ST| tend to increase. The applied voltage with the lower frequency leads to lower power. The
ratio of first and second half cycle shows more complex effects and makes it hard to deduce any tendency.
a) Design of experiments: combination of FCCD and LHS
b) Design variable contours with simulation result in objective function space: εd, fv and rf
Figure 3 Design of experiments and their simulated results – level 0
The surrogate models are obtained using these sampled points and the PRESS errors of them are presented in
Table 2. Due to the insufficient number of sampled points and their complex response, significant PRESS errors
exist at this level especially in force prediction. In this case, however, the Kriging model has the best performance in
predicting the force, while the multiple surrogate model does the same for power.
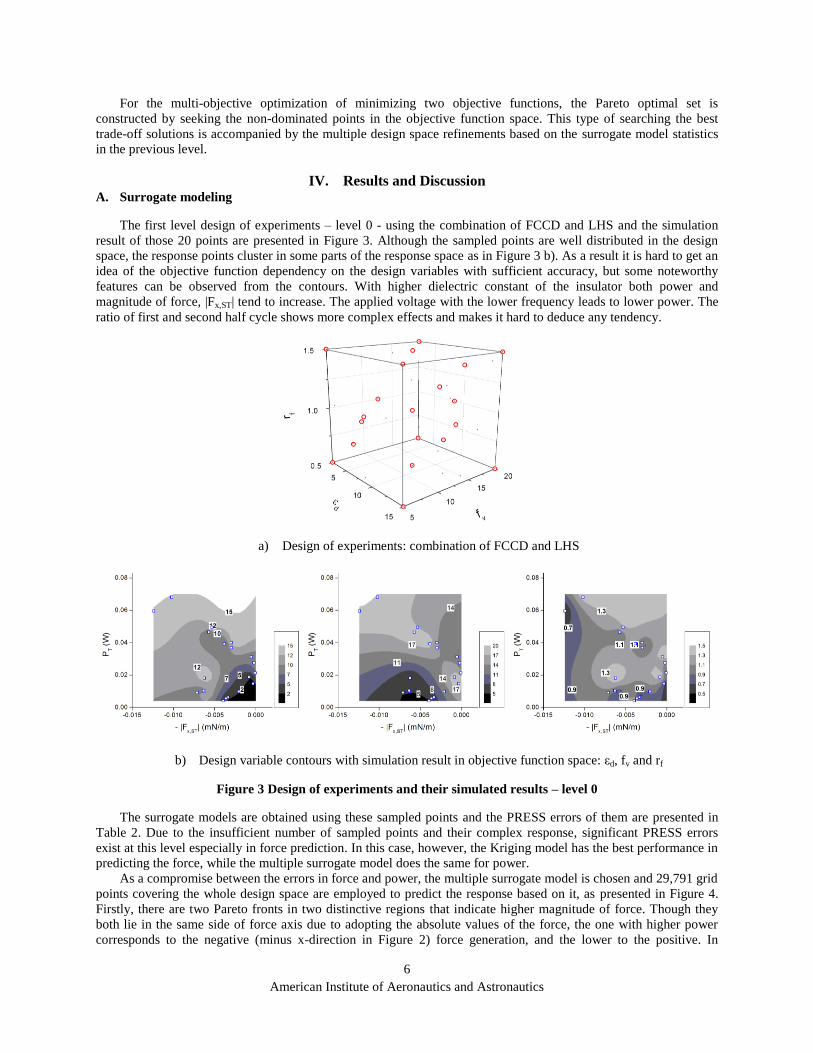
As a compromise between the errors in force and power, the multiple surrogate model is chosen and 29,791 grid
points covering the whole design space are employed to predict the response based on it, as presented in Figure 4.
Firstly, there are two Pareto fronts in two distinctive regions that indicate higher magnitude of force. Though they
both lie in the same side of force axis due to adopting the absolute values of the force, the one with higher power
corresponds to the negative (minus x-direction in Figure 2) force generation, and the lower to the positive. In
7
American Institute of Aeronautics and Astronautics
magnitude the negative force generation is larger than the positive, which can be more desirable from a force
generation perspective while the positive force does the same for power efficiency. The power ratio for those two
regions is about 5~6 compared to the force ratio of 2. Secondly, the shape and density of data points around the
Pareto fronts in two regions are much different. Since the calculated points are generated so as to cover the design
space evenly, the coarser distribution of result points and those forming the Pareto front in the higher power region
indicate higher sensitivity of the result, especially for the averaged force generation to the design variables,
compared to the lower power region.
Table 2 PRESS errors of the surrogate models – level 0
PRESS Kriging Polynomial
response
Radial basis
neural network
Multiple
surrogate
− Fx,ST 0.0020 (16)*
0.0027 (22) 0.0095 (77) 0.0028 (23)
PT 0.0032 (5.0) 0.0033 (5.2) 0.0063 (9.9) 0.0023 (3.6)
*: ( ) % = 100 x PRESS / (Xmax – Xmin), X = -|Fx,ST| or PT in level 0
Figure 4 Design and predicted points and Pareto fronts by the multiple surrogate model in level 0
The mechanism of the force generation over the two half-cycles has been a subject of interest with different
suggestions such as, whether it consists of two consecutive positive or a positive-negative alternating patterns5. It
has been reported by some researchers that the dominant positive and small negative force generations for the first
and second half cycles respectively exist for sinusoidal voltage excitation6, 35
or pulse-mode operation36
. Because of
the different charged species chemistry and other parameters such as geometry it is difficult to compare the solution
directly. Also in the numerical models there are other factors such as boundary treatment, temporal and spatial
resolution and domain size, surface reaction modeling which affect the force. In the current study there are positive
and negative alternating contributions of force generation in two half cycles, and in a certain part of design space the
negative portion excels the positive, resulting in a negative force generation.
Since the distribution of design points around those interesting regions is too sparse, two windowed constrains
are used to specify refinement regions, as candidates where Pareto front can reside.
Level 1-1, low power region: −0.009 ≤ − Fx,ST ≤ −0.005 (mN/m)
0 ≤ PT ≤ 0.02 (W)
8
American Institute of Aeronautics and Astronautics
Level 1-2, high power region: −0.014 ≤ − Fx,ST ≤ −0.009 (mN/m)
0.05 ≤ PT ≤ 0.07 (W)
The design variable constraints corresponding to these objective function constraints are generated based on
Kriging28
model considering the PRESS values in Table 2 and a conservative choice of the space defined by the
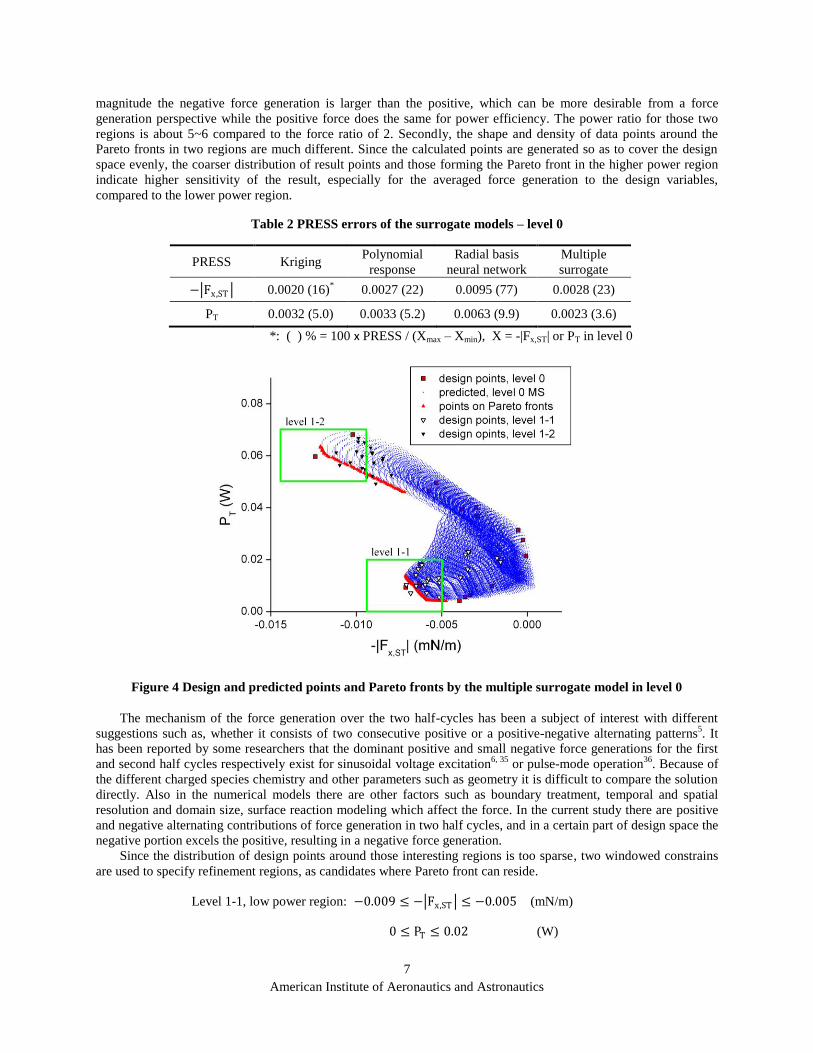
constraints, i.e. to cover the more space as possible. Figure 5 shows constraint surfaces in the design space that is
generated approximately by connecting neighboring grid points satisfying constraint criteria. There exist multiple
regions divided by the surfaces and the common space enclosed by force and power constraints corresponds to the
refinement region. Since these surfaces are contours of constant force or power, it can be said that objective
functions are relatively insensitive to the dielectric constant.
a) level 1-1: low power region (PT: diagonal surface) b) level 1-2: high power region (PT: larger surface)
Figure 5 Constraints, contours and design points for refinement in design space
Since the design space corresponding to level 1-1 and 1-2 constraint windows is an irregular shape, it is
impossible to use the design of experiments for a rectangular hexahedron or sphere. To generate design points LHS
is used to cover the space with as small number of points as possible, and at the same time, distance-based design
which ensures even distribution within the space is adopted. 20 points in each constraint design space are generated
by this approach as shown in Figure 5 with the constraint surfaces.
Table 3 PRESS errors of the surrogate models – level 1-1
PRESS Kriging Polynomial
response
Radial basis
neural network
Multiple
surrogate
− Fx,ST 5.2×10⁻⁴
(9.5)*
3.7×10-4
(6.7) 2.7×10⁻⁴
(4.9) 3.3×10⁻⁴
(6.0)
PT 1.9×10⁻⁴
(1.1) 1.4×10
-4
(0.80) 6.9×10
-4 (3.9) 1.2×10
-4 (0.69)
*: ( ) % = 100 x PRESS / (Xmax – Xmin), X = -|Fx,ST| or PT in level 1-1
Table 4 PRESS errors of the surrogate models – level 1-2
PRESS Kriging Polynomial
response
Radial basis
neural network
Multiple
surrogate
− Fx,ST 1.2×10⁻⁴
(3.8)*
1.1×10-4
(3.4) 3.4×10⁻⁴
(10.6) 1.1×10⁻⁴
(3.4)
PT 2.0×10⁻⁴
(1.1) 0.55×10⁻⁴
(0.31) 9.4×10⁻⁴
(5.3) 0.90×10⁻⁴
(0.51)
*: ( ) % = 100 x PRESS / (Xmax – Xmin), X = -|Fx,ST| or PT in level 1-2
9
American Institute of Aeronautics and Astronautics
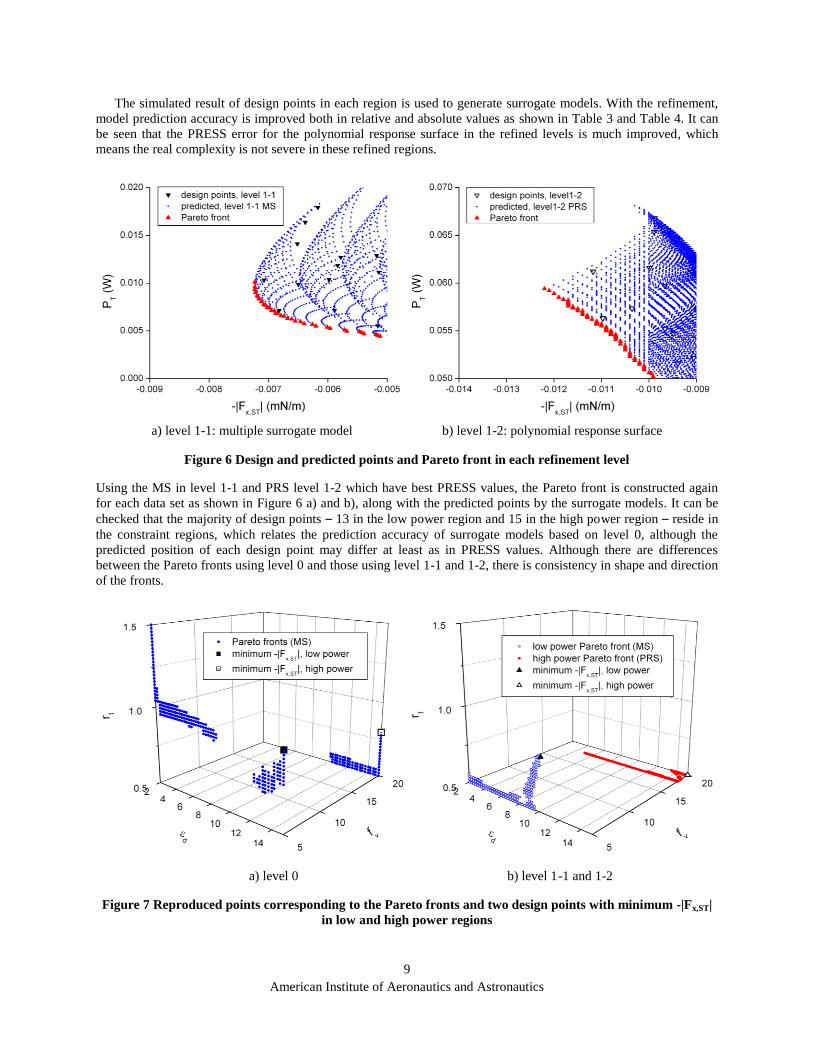
The simulated result of design points in each region is used to generate surrogate models. With the refinement,
model prediction accuracy is improved both in relative and absolute values as shown in Table 3 and Table 4. It can
be seen that the PRESS error for the polynomial response surface in the refined levels is much improved, which
means the real complexity is not severe in these refined regions.
a) level 1-1: multiple surrogate model b) level 1-2: polynomial response surface
Figure 6 Design and predicted points and Pareto front in each refinement level
Using the MS in level 1-1 and PRS level 1-2 which have best PRESS values, the Pareto front is constructed again
for each data set as shown in Figure 6 a) and b), along with the predicted points by the surrogate models. It can be
checked that the majority of design points – 13 in the low power region and 15 in the high power region – reside in
the constraint regions, which relates the prediction accuracy of surrogate models based on level 0, although the
predicted position of each design point may differ at least as in PRESS values. Although there are differences
between the Pareto fronts using level 0 and those using level 1-1 and 1-2, there is consistency in shape and direction
of the fronts.
a) level 0 b) level 1-1 and 1-2
Figure 7 Reproduced points corresponding to the Pareto fronts and two design points with minimum -|Fx,ST|
in low and high power regions
10
American Institute of Aeronautics and Astronautics
B. Two distinctive regions and Pareto fronts
To investigate the design variable variation around the Pareto fronts, surrogate models are used as functions to
refer the design space regions which correspond to the fronts. The region calculated based on level 0 is presented in
Figure 7 a) and based on level 1 in b). Compared to the prediction by the level 0 surrogate model, the level 1 shows
more coherent regions that correspond to two Pareto fronts respectively. The two fronts with high and low power
consumptions are separated by the whole design space in terms of the applied voltage frequency.
The most efficient points corresponding to force generation, i.e. minimum in -|Fx,ST| also differ much though
they occur at the same frequency of applied voltage, fv. It can be observed that to follow the Pareto front line of the
high power region the dielectric constant, εd can be the major variable, while for the one of the low power region, εd
and rf need to be varied. Though it may be inconvenient to vary the material constant such as εd to accommodate a
desired objective function state, if proper design variables are chosen, this type of information can be used to
establish a basis for the performance of these actuators as flow control devices.
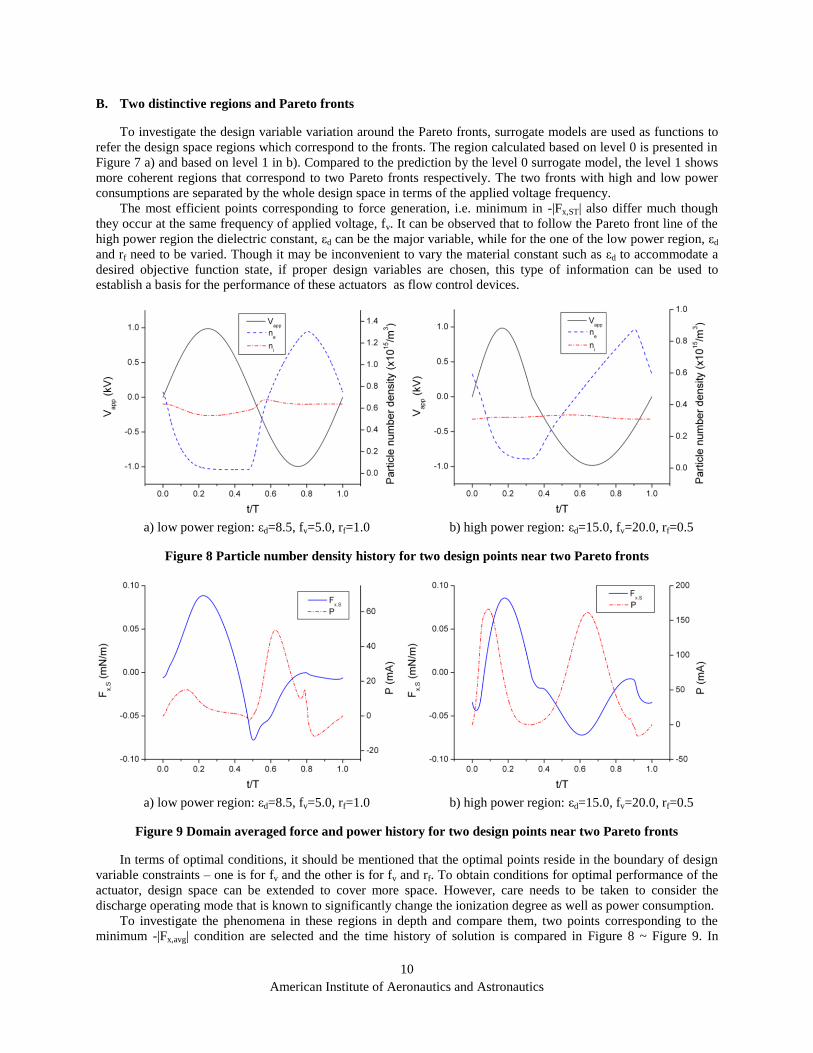
a) low power region: εd=8.5, fv=5.0, rf=1.0 b) high power region: εd=15.0, fv=20.0, rf=0.5
Figure 8 Particle number density history for two design points near two Pareto fronts
a) low power region: εd=8.5, fv=5.0, rf=1.0 b) high power region: εd=15.0, fv=20.0, rf=0.5
Figure 9 Domain averaged force and power history for two design points near two Pareto fronts
In terms of optimal conditions, it should be mentioned that the optimal points reside in the boundary of design
variable constraints – one is for fv and the other is for fv and rf. To obtain conditions for optimal performance of the
actuator, design space can be extended to cover more space. However, care needs to be taken to consider the
discharge operating mode that is known to significantly change the ionization degree as well as power consumption.
To investigate the phenomena in these regions in depth and compare them, two points corresponding to the
minimum -|Fx,avg| condition are selected and the time history of solution is compared in Figure 8 ~ Figure 9. In
11
American Institute of Aeronautics and Astronautics
Figure 8 a) and b) it can be observed that with lower frequency which lies in low power region, domain-averaged
ion number density is higher. This can be explained by considering the fact that lower frequency allows more time
to generate the particles, which is consistent with the previous research32
. The electron saturation instances in these
cases – about t/T=0.8 in the low power and 0.9 in the high power – coincide with the start of plateau or second dip in
Figure 9, which is also mentioned as one of key factors in the solution difference with different frequency.
From the force history result, one can deduce the effect of the ratio of first and second half cycles, rf – changing
the relative influence of discharge in each half cycle. It is thought as an effective parameter changing force history
profile and thus adopted as one of design variables for this purpose. Although positive force belongs to the first half
cycle and negative to the second, elongating the period of each part in applied electric field does not necessarily
induces increased force either in positive or negative. While decreasing rf, i.e. increasing the second half cycle
corresponds to the decreased -|Fx,avg| point in the high power region, increasing rf does not mean increasing the
magnitude of positive force cycle. The value of rf is about 0.8 for such a point in the low power region according to
the multiple surrogate model. The reason is that generating positive force is mainly related to the plateau region of
the second half cycle in Fx time history as in Figure 9.
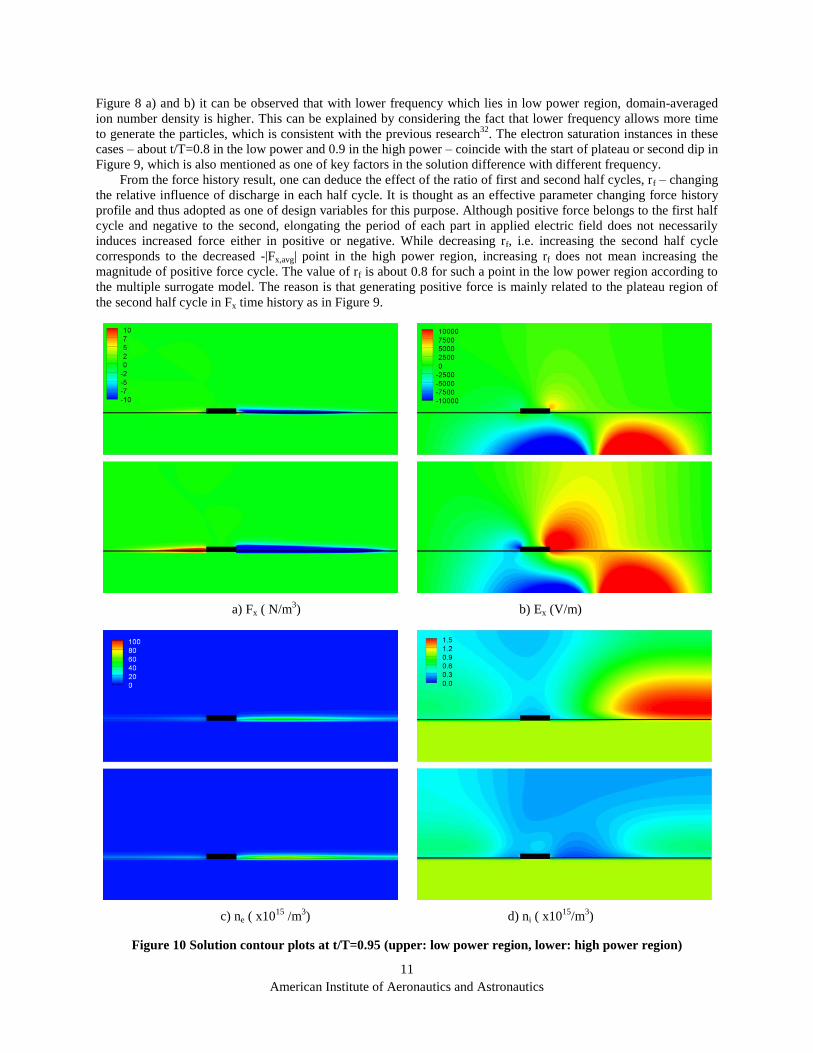
a) Fx ( N/m3) b) Ex (V/m)
c) ne ( x1015
/m3) d) ni ( x10
15/m
3)
Figure 10 Solution contour plots at t/T=0.95 (upper: low power region, lower: high power region)
12
American Institute of Aeronautics and Astronautics
This phenomenon is mainly affected by the difference in the amount and evolution of the electron and the ion
clouds which reside on the dielectric surface. In Figure 10 instantaneous contours of main physical quantities
especially around the upper electrode are presented at the moment of t/T=0.95 when the phase change in applied
voltage is about to occur. As noted in the previous research, force generation mainly occurs near wall and electrode
region at this instance, which is caused by electrons accumulated on the dielectric surface and high electric field near
the edge of electrode. Ion clouds having been repelled from the surface through the second half cycle compensate
the applied electric field as in Figure 10 d), resulting in the small magnitude of negative force generation in the later
part of the second half cycle, i.e. the plateau region. On the other hand, in the case of higher frequency this ion cloud
is much weaker and there is strong electric field near the upper electrode which, with the higher electron density
near the wall, results in the second negative peak at the end of the second half cycle.
In terms of εd, the same can be observed. In the previous research it has been pointed out that the dielectric
constant affects the asymmetry of the first and the second half cycles as well as the amplitude of generated force.
These two effects contribute to the average force in the opposite tendencies such that increasing the constant
increases the amplitude of force history thus has a tendency of increasing the averaged force generation but also
decreases asymmetry of the two half cycles thus decreasing the averaged force generation. As a result, for the low
power region the efficient point of force generation in Figure 7 occurs at εd =10.2 which is not on the boundary of
the design variable range, 2.0 ≤ εd ≤ 15.0. However, for the high power region it happens at the maximum value,
15.0.
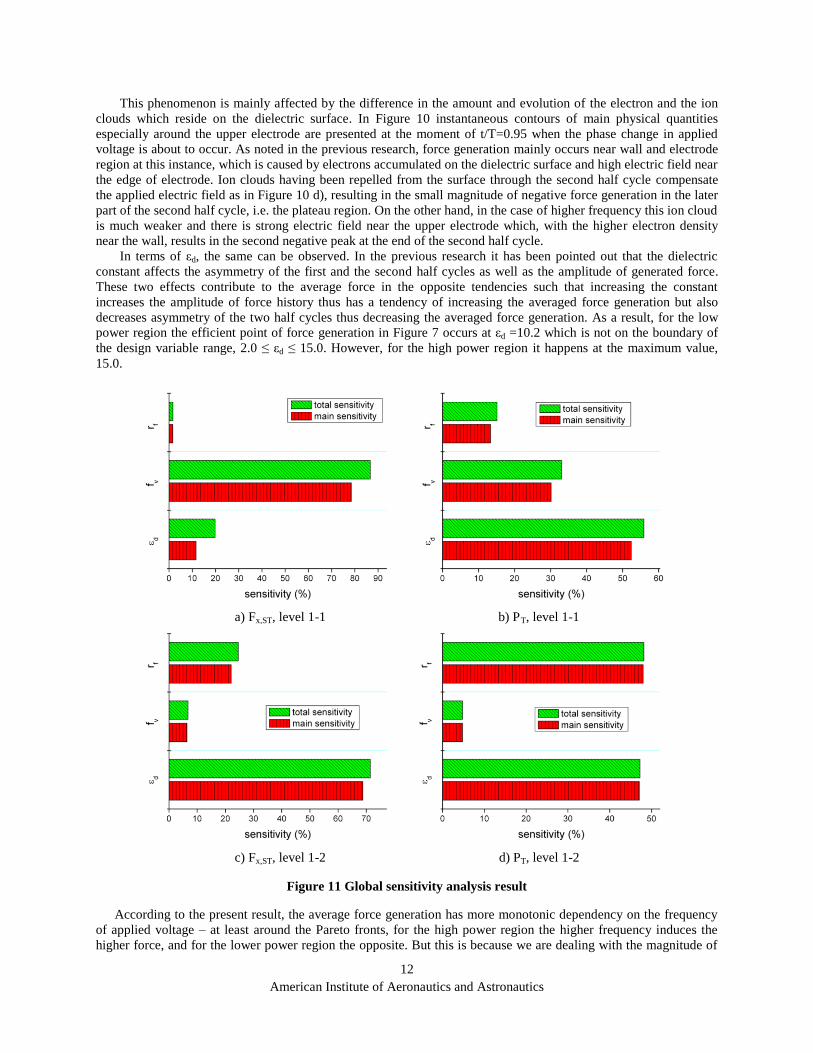
a) Fx,ST, level 1-1 b) PT, level 1-1
c) Fx,ST, level 1-2 d) PT, level 1-2
Figure 11 Global sensitivity analysis result
According to the present result, the average force generation has more monotonic dependency on the frequency
of applied voltage – at least around the Pareto fronts, for the high power region the higher frequency induces the
higher force, and for the lower power region the opposite. But this is because we are dealing with the magnitude of
13
American Institute of Aeronautics and Astronautics
the averages force generation ignoring its direction. From the previous research it has been found that the higher
force can be obtained with the lower frequency. And with the more prominent effect of the second half cycle the
averaged force generation to the negative direction excels the positive in magnitude with higher frequency.
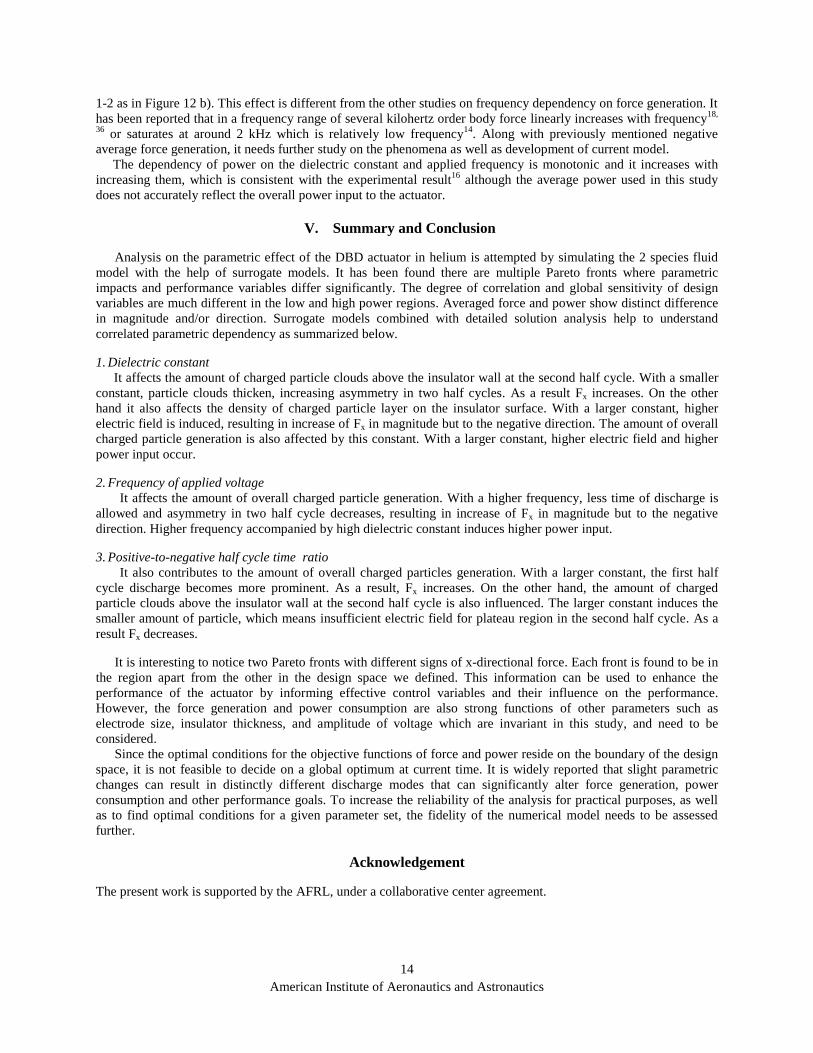
C. Analysis of global sensitivity and dependency on parameters
Figure 11 shows the global sensitivity analysis result of polynomial response surface for each refined level.
Compared to the level 1-2, level 1-1 has more effect of parameter correlation, which can be identified from the
difference between total and main sensitivities. Also, the frequency of applied voltage, fv in level 1-1 has much
significant effect on both of average force and power. On the other hand, in the high power refined space (level 1-2)
the effect of the positive-to-negative time ratio, rf is prominent, and fv affects much less. On the other hand, the
insulator dielectric constant is always important.
a) rf=1.0, level 1-1
b) rf=1.0, level 1-2
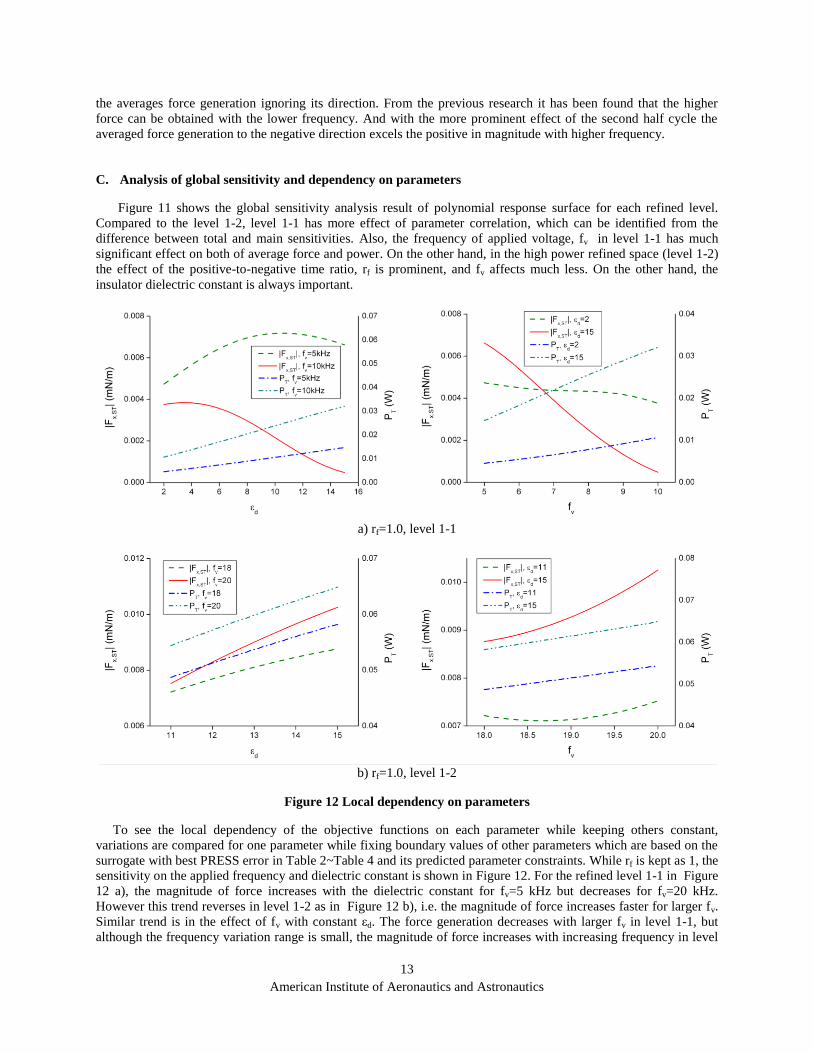
Figure 12 Local dependency on parameters
To see the local dependency of the objective functions on each parameter while keeping others constant,
variations are compared for one parameter while fixing boundary values of other parameters which are based on the
surrogate with best PRESS error in Table 2~Table 4 and its predicted parameter constraints. While rf is kept as 1, the
sensitivity on the applied frequency and dielectric constant is shown in Figure 12. For the refined level 1-1 in Figure
12 a), the magnitude of force increases with the dielectric constant for fv=5 kHz but decreases for fv=20 kHz.
However this trend reverses in level 1-2 as in Figure 12 b), i.e. the magnitude of force increases faster for larger fv.
Similar trend is in the effect of fv with constant εd. The force generation decreases with larger fv in level 1-1, but
although the frequency variation range is small, the magnitude of force increases with increasing frequency in level
14
American Institute of Aeronautics and Astronautics
1-2 as in Figure 12 b). This effect is different from the other studies on frequency dependency on force generation. It
has been reported that in a frequency range of several kilohertz order body force linearly increases with frequency18,
36 or saturates at around 2 kHz which is relatively low frequency
14. Along with previously mentioned negative
average force generation, it needs further study on the phenomena as well as development of current model.
The dependency of power on the dielectric constant and applied frequency is monotonic and it increases with
increasing them, which is consistent with the experimental result16
although the average power used in this study
does not accurately reflect the overall power input to the actuator.
V. Summary and Conclusion
Analysis on the parametric effect of the DBD actuator in helium is attempted by simulating the 2 species fluid
model with the help of surrogate models. It has been found there are multiple Pareto fronts where parametric
impacts and performance variables differ significantly. The degree of correlation and global sensitivity of design
variables are much different in the low and high power regions. Averaged force and power show distinct difference
in magnitude and/or direction. Surrogate models combined with detailed solution analysis help to understand
correlated parametric dependency as summarized below.
1. Dielectric constant
It affects the amount of charged particle clouds above the insulator wall at the second half cycle. With a smaller
constant, particle clouds thicken, increasing asymmetry in two half cycles. As a result Fx increases. On the other
hand it also affects the density of charged particle layer on the insulator surface. With a larger constant, higher
electric field is induced, resulting in increase of Fx in magnitude but to the negative direction. The amount of overall
charged particle generation is also affected by this constant. With a larger constant, higher electric field and higher
power input occur.
2. Frequency of applied voltage
It affects the amount of overall charged particle generation. With a higher frequency, less time of discharge is
allowed and asymmetry in two half cycle decreases, resulting in increase of Fx in magnitude but to the negative
direction. Higher frequency accompanied by high dielectric constant induces higher power input.
3. Positive-to-negative half cycle time ratio
It also contributes to the amount of overall charged particles generation. With a larger constant, the first half
cycle discharge becomes more prominent. As a result, Fx increases. On the other hand, the amount of charged
particle clouds above the insulator wall at the second half cycle is also influenced. The larger constant induces the
smaller amount of particle, which means insufficient electric field for plateau region in the second half cycle. As a
result Fx decreases.
It is interesting to notice two Pareto fronts with different signs of x-directional force. Each front is found to be in
the region apart from the other in the design space we defined. This information can be used to enhance the
performance of the actuator by informing effective control variables and their influence on the performance.
However, the force generation and power consumption are also strong functions of other parameters such as
electrode size, insulator thickness, and amplitude of voltage which are invariant in this study, and need to be
considered.
Since the optimal conditions for the objective functions of force and power reside on the boundary of the design
space, it is not feasible to decide on a global optimum at current time. It is widely reported that slight parametric
changes can result in distinctly different discharge modes that can significantly alter force generation, power
consumption and other performance goals. To increase the reliability of the analysis for practical purposes, as well
as to find optimal conditions for a given parameter set, the fidelity of the numerical model needs to be assessed
further.
Acknowledgement
The present work is supported by the AFRL, under a collaborative center agreement.
15
American Institute of Aeronautics and Astronautics
1 McDaniel, E. W., Collision Phenomena in Ionized Gases, John Wiley & Sons, Inc., New York, 1964 2 Mitchner, M. and Kruger, C. H. Jr., Partially Ionized Gases, John Wiley & Sons, Inc., New York, 1973 3 Boeuf, J. P., “Numerical model of rf glow discharges,” Phys. Rev. A 36 (6), 1987, pp. 2782-2792 4 Roth, J. R., and Sherman, D. M. “Boundary layer flow control with a one atmosphere uniform glow discharge
surface plasma,” AIAA Paper 98-0328, 1998 5 Shyy, W., Jayaraman, B., and Andersson, A., “Modeling of glow discharge-induced fluid dynamics,” J. Appl.
Phys., 92(11), 2002 6 Jayaraman, B., Cho, Y., and Shyy, W., “Modeling of dielectric barrier discharge plasma actuator,” AIAA Paper
2007-4531, 38th
AIAA Plasmadynamics and Lasers Conference, June 25-28, Miami, FL, 2007 7 Enloe, C. L., McLaughlin, T. E., VanDyken, R. D., Kachner, K. D., Jumper, E. J., and Corke, T. C., “Mechanisms
and responses of a single dielectric barrier plasma actuator: plasma morphology,” AIAA Journal Vol. 42, No. 3,
March 2004, pp. 589-594 8 Pons, J, Moreau, E. and Touchard, G., “Asymmetric surface dielectric barrier discharge in air at atmospheric
pressure: electrical properties and induced airflow characteristics,” J. Phys. D: Appl. Phys., Vol. 38, 2005,
pp.3635-3642 9 Gherardi, N., and Massines, F., “Mechanisms controlling the transition from glow silent discharge to streamer
discharge in nitrogen,” IEEE Transactions on Plasma Science, Vol. 29, No. 3, June 2001, pp.536-544 10 Roth, J. R., Industrial Plasma Engineering, Volume 2: applications to nonthermal plasma processing, IOP
publishing, 2001 11 Yuan, X., Shin, J., and Raja, L. L., “One-dimensional simulation of multi pulse phenomena in dielectric barrier
atmospheric-pressure glow discharges,” Vacuum 80, 2006, pp.1199-1205 12 Porter, C. O., McLaughlin, T. E., Enloe, C. L., Font, G. I., Roney, J., and Baughn, J. W., “Boundary layer control
using a DBD plasma actuator,” AIAA Paper 2007-786, 45th AIAA Aerospace Sciences Meeting and Exhibit, 8-11
January, Reno, NV, 2007 13 Jukes, T. N., Choi, K, Johnson, G. A., and Scott, S. J., “Characterization of surface plasma-induced wall flows
through velocity and temperature measurements,” AIAA Journal, Vol. 44, No. 4, 2006, pp. 764-771 14 Forte, M., Jolibois, J., Moreau, E., and Touchard, G., and Cazalens, M., “Optimization of a dielectric barrier
discharge actuator by stationary and non-stationary measurements of the induced flow velocity - application to
airflow control,” AIAA Paper 2006-2863, 3rd
AIAA Flow Control Conference, 5-8 June, San Francisco, CA, 2006 15 Abe, T., Takizawa, Y., Sato, S., and Kimura, N., “A parametric experimental study for momentum transfer by
plasma actuator,” AIAA Paper 2007-187, 45th
Aerospace Sciences Meeting and Exhibit, 8-11 January, Reno, NV,
2007 16 Roth, J. R., and Dai, X., “Optimization of the aerodynamic plasma actuator as an electrohydrodynamic(EHD)
electrical device,” AIAA Paper 2006-1203, 44th
AIAA Aerospace Sciences Meeting and Exhibit, 9-12 January,
Reno, NV, 2006 17 Gregory, J. W., Enloe, C. L., Font, G. I., and McLaughlin, T. E., “Force production mechanisms of a dielectric-
barrier discharge plasma actuator,” AIAA Paper 2007-185, 45th
AIAA Aerospace Sciences Meeting and Exhibit,
8-11 January, Reno, NV, 2007 18 Baughn, J. W., Porter, C. O., Peterson B. L., Mclaughlin, T. E., Enloe, C. L., Font, G. I., and Baird, C.,
“Momentum transfer for an aerodynamic plasma actuator with an imposed boundary layer,” AIAA Paper 2006-
168, 44th
AIAA Aerospace Sciences Meeting and Exhibit, 9-12 January, Reno, NV, 2006 19 Boeuf, J. P., Lagmich, Y., Callegari, Th., and Pitchford, L. C., “EHD force in dielectric barrier discharges
parametric study and influence of negative ions,” AIAA Paper 2007-183, 45th
AIAA Aerospace Sciences Meeting
and Exhibit, 8-11 January, Reno, NV, 2007 20 Font, G. I., Enloe, C. L., McLaughlin, T. E., and Orlov, D., “Plasma discharge characteristics and experimentally
determined boundary conditions for a plasma actuator,” AIAA Paper 2007-188, 45th
AIAA Aerospace Sciences
Meeting and Exhibit, 8-11 January, Reno, NV, 2007 21 Likhanskii, A. V., Shneider, M. N., Macheret, S. O., and Miles, R. B., “Optimization of dielectric barrier
discharge plasma actuators driven by repetitive nanosecond pulses,” AIAA Paper 2007-633, 45th
AIAA Aerospace
Sciences Meeting and Exhibit, 8-11 January, Reno, NV, 2007 22 Roy, S., Singh, K. P., and Gaitonde, D. V., “Air plasma actuators for effective flow control,” AIAA Paper 2007-
184, 45th
AIAA Aerospace Sciences Meeting and Exhibit, 8-11 January, Reno, NV, 2007 23 Jayaraman, B., and Shyy, W., “Modeling of dielectric barrier discharge-induced fluid dynamics and heat transfer,”
Prog. Aero. Sci., doi: 10.1016/i.paerosci.2007.10.004, 2007
16
American Institute of Aeronautics and Astronautics
24 Visbal, M. R., Gaitonde, D. V., and Roy, S., “Control of transitional and turbulent flows using plasma-based
actuators,” AIAA Paper 2006-3230, 36th
AIAA Fluid Dynamics Conference and Exhibit, 5-8 June, San Francisco,
CA, 2006 25 Jayaraman, B., Lian, Y., and Shyy, W., “Low-Reynolds number flow control using dielectric barrier discharge
actuators,” AIAA Paper 2007-3974, 37th
AIAA Fluid Dynamics Conference and Exhibit, 25-28 June, Miami, FL,
2007 26 Rizzetta, D. P., and Visbal, M. R., “Numerical investigation of plasma-based flow control for transitional highly
loaded low-pressure turbine,” AIAA Journal Vol. 45, No. 10, October 2007, pp.2554-2564 27 Mack, Y., Goel, T., Shyy, W., Haftka, R., and Queipo, N., “Multiple surrogate for the shape optimization of bluff
body-facilitated mixing,” AIAA Paper 2005-333, 43rd
AIAA Aerospace Sciences Meeting and Exhibit, 10-13
January, Reno, NV, 2005 28 Goel, T., Zhao, J., Tharkur, S., Haftka, R. T., and Shyy, W., “Surrogate model-based strategy for cryogenic
cavitation model validation and sensitivity evaluation,” AIAA Paper 2006-5047, 42nd
AUAA/ASME/SAE/ASEE
Joint Propulsion Conference & Exhibit, 9-12 July, Sacramento, CA, 2006 29 Goel, T., Haftka, R., T., Queipo, N., and Shyy, W., “Performance estimate and simultaneous application of
multiple surrogates,” AIAA Paper 2006-7047, 11th
AIAA/ISSMO Multidisciplinary Analysis and Optimization
Conference, 6-8 September, Portsmouth, VA, 2006 30 Jayaraman, B., Tharkur, S., and Shyy, W., “Modeling of fluid dynamics and heat transfer induced by dielectric
barrier plasma actuator,” J. Heat Trans., Vol. 129, April 2007, pp. 517-525 31 Ward, A. L., “Calculations of cathode-fall characteristics,” J. Appl. Phys., 33(9), 1962 32 Jayaraman, B., Cho, Y., and Shyy, W., “Modeling of dielectric barrier discharge plasma actuator,” Submitted to J.
Appl. Phys., 2007 33 Morrow, R, and Sato, N. “The discharge current induced by the motion of charged particles in time-dependent
electric fields; Sato’s equation extended,” J. Phys. D: Appl. Phys., Vol. 32, L20-L22, 1999 34 Myers, R. H., and Montgomery, D. C., Response Surface Methodology: Process and Product Optimization Using
Designed Experiments, 2nd
ed., John Wiley & Sons, Inc., 2002 35 Singh, K. P. and Roy, S., “Modeling plasma actuators with air chemistry for effective flow control,” J. Appl.
Phys., 101(12), 2007 36 Porter, C. O. Baughn, J. W., McLaughlin, T. E., Enloe, C. L., and Font, G. I., “Plasma Actuator Force
Measurements,” AIAA Journal Vol. 45, No. 7, July 2007, pp. 1562-1570