The impact of actual and surrogate variegated cutworm ...
193
Retrospective eses and Dissertations Iowa State University Capstones, eses and Dissertations 1984 e impact of actual and surrogate variegated cutworm stubble phytophagy on the growth and yield of alfalfa G. David Buntin Iowa State University Follow this and additional works at: hps://lib.dr.iastate.edu/rtd Part of the Entomology Commons is Dissertation is brought to you for free and open access by the Iowa State University Capstones, eses and Dissertations at Iowa State University Digital Repository. It has been accepted for inclusion in Retrospective eses and Dissertations by an authorized administrator of Iowa State University Digital Repository. For more information, please contact [email protected]. Recommended Citation Buntin, G. David, "e impact of actual and surrogate variegated cutworm stubble phytophagy on the growth and yield of alfalfa " (1984). Retrospective eses and Dissertations. 8152. hps://lib.dr.iastate.edu/rtd/8152
-
Upload
khangminh22 -
Category
Documents
-
view
1 -
download
0
Transcript of The impact of actual and surrogate variegated cutworm ...

Retrospective Theses and Dissertations Iowa State University Capstones, Theses andDissertations
1984
The impact of actual and surrogate variegatedcutworm stubble phytophagy on the growth andyield of alfalfaG. David BuntinIowa State University
Follow this and additional works at: https://lib.dr.iastate.edu/rtd
Part of the Entomology Commons
This Dissertation is brought to you for free and open access by the Iowa State University Capstones, Theses and Dissertations at Iowa State UniversityDigital Repository. It has been accepted for inclusion in Retrospective Theses and Dissertations by an authorized administrator of Iowa State UniversityDigital Repository. For more information, please contact [email protected].
Recommended CitationBuntin, G. David, "The impact of actual and surrogate variegated cutworm stubble phytophagy on the growth and yield of alfalfa "(1984). Retrospective Theses and Dissertations. 8152.https://lib.dr.iastate.edu/rtd/8152
INFORMATION TO USERS
This reproduction was made from a copy of a document sent to us for microfilming. While the most advanced technology has been used to photograph and reproduce this document, the quality of the reproduction is heavily dependent upon the quality of the material submitted.
The following explanation of techniques is provided to help clarify markings or notations which may appear on this reproduction.
1. The sign or "target" for pages apparently lacking from the document photographed is "Missing Page(s)". If it was possible to obtain the missing page(s) or section, they are spliced into the film along with adjacent pages. This may have necessitated cutting through an image and duplicating adjacent pages to assure complete continuity.
2. When an image on the film is obliterated with a round black mark, it is an indication of either blurred copy because of movement during exposure, duplicate copy, or copyrighted materials that should not have been filmed. For blurred pages, a good image of the page can be found in the adjacent frame. If copyrighted materials were deleted, a target note will appear listing the pages in the adjacent frame.
3. When a map, drawing or chart, etc., is part of the material being photographed, a definite method of "sectioning" the material has been followed. It is customary to begin filming at the upper left hand comer of a large sheet and to continue from left to right in equal sections with small overlaps. If necessary, sectioning is continued again—beginning below the first row and continuing on until complete.
4. For illustrations that cannot be satisfactorily reproduced by xerographic means, photographic prints can be purchased at additional cost and inserted into your xerographic copy. These prints are available upon request from the Dissertations Customer Services Department.
5. Some pages in any document may have indistinct print. In all cases the best available copy has been filmed.
Universi Micrêîilms
International 300 N. Zeeb Road Ann Arbor, Ml 48106

8505806
Buntin, G. David
THE IMPACT OF ACTUAL AND SURROGATE VARIEGATED CUTWORM STUBBLE PHYTOPHAGY ON THE GROWTH AND YIELD OF ALFALFA
Iowa State University PH.D. 1984
University Microfilms
Intern Sti O n 8.1 300 N. zeeb Road, Ann Arbor, Ml 48106


The impact of actual and surrogate variegated cutworm stubble
phytophagy on the growth and yield of alfalfa
by
G. David Buntin
A Dissertation Submitted to the
Graduate Faculty in Partial Fulfillment of the
Requirements for the Degree of
DOCTOR OF PHILOSOPHY
Major: Entomology
Approved:
In Chargé~5JS^îlajor Work
or the Majéir Department
For the Graflaate College
Iowa State University Ames, Iowa
1984
Signature was redacted for privacy.
Signature was redacted for privacy.
Signature was redacted for privacy.
ii
TABLE OF CONTENTS
Page
INTRODUCTION 1
LITERATURE REVIEW 6
Variegated Cutworm Biology 6
Physiology of Alfalfa Regrowth 16
Response of Alfalfa Regrowth to Insect Injury 27
PART I. VARIEGATED CUTWORM FOLIAGE CONSUMPTION
AND LARVAL DEVELOPMENT ON ALFALFA 31
ABSTRACT 32
INTRODUCTION 33
MATERIALS AND METHODS 34
RESULTS AND DISCUSSION 36
PART II. ALFALFA DEVELOPMENT, DRY MATTER ACCUMULATION, AND PARTITIONING AFTER SURROGATE INSECT INJURY OF STUBBLE 44
ABSTRACT 45
INTRODUCTION 46
MATERIALS AND METHODS 49
Statistical Analyses 51
RESULTS 53
Initial Growth and Stem Initiation 53
Alfalfa Development and Morphology 59
Analysis of Growth and Partitioning 61
DISCUSSION 71

iii
PART III. DRY MATTER ACCUMULATION, PARTITIONING, AND DEVELOPMENT OF ALFALFA REGROWTH AFTER
STUBBLE INJURY BY THE VARIEGATED CUTWORM 74
ABSTRACT 75
INTRODUCTION 76
MATERIALS AND METHODS 78
Statistical Analyses 81
RESULTS 82
Damage Syndrome and Stem Initiation 82
Plant Development and Morphology 86
Analysis of Growth Rates 94
Analysis of Partitioning Rates 98
DISCUSSION 102
PART IV. DEVELOPMENT OF ECONOMIC INJURY LEVELS AND MANAGEMENT PRACTICES FOR THE VARIEGATED CUTWORM IN ALFALFA 104
ABSTRACT 105
INTRODUCTION 107
MATERIALS AND METHODS 110
Delay of Regrowth Study 110
Larval Infestation Study 113
Economic Analysis 115
RESULTS 117
Delay of Regrowth Study 117
Larval Infestation Study 123
DISCUSSION 131
SUMMARY AND CONCLUSIONS 138
LITERATURE CITED 143
iv
ACKNOWLEDGEMENTS 150
APPENDIX A. MEANS AND ANALYSIS OF DATA FOR THE DELAY OF REGROWTH STUDY 151
APPENDIX B. MEANS AND ANALYSIS OF DATA FOR THE VARIEGATED CUTWORM LARVAL INFESTATION STUDY 169
1
INTRODUCTION
The ultimate goal oi most applied entomological research is the
development of more effective technology and strategies of pest control-
Typically, integrated pest management (IPM) strives to maintain pest pop
ulations below levels that cause economic loss through the optimal use of
control tactics, while minimizing producer costs and adverse environmental
effects (NAS 1969). IPM is a holistic approach that considers pest sup
pression in the context of the entire production system, rather than in
isolation from other production factors. This approach requires an
extensive knowledge of pest biology, plus an understanding of pest/plant
interaction.
Implicit in the definition of IPM is the concept of economic damage
and economic injury level (EIL), which integrate pest and plant biologies
with economics. Although the idea of incorporating economics into the
criteria of pest control decisions was being discussed as early as the
1930s (Pierce 1934), specific concepts were first clearly outlined by
Stem et al. in 1959. They defined EIL as "the lowest population density
that will cause economic damage," where economic damage is "the amount of
injury which will justify the cost of artificial control measures." An
additional concept, the economic threshold (ET), was defined as "the
density at which control measures should be initiated to prevent an
increasing pest population from reaching the EIL." The four elements
needed for the calculation of an EIL are cost of control, commodity
price, proportional injury per individual pest, and crop response to
injury such as yield or quality reduction (Stone and Pedigo 1972). Con

2
sequently, the EIL and ET concepts have been employed most extensively
with insects in agricultural systems, because commodity prices and
quality standards are readily available. The EIL concept has been less
useful in nonagricultural situations, such as urban and medical pest
control, because of aesthetic and social considerations and the difficulty
of expressing losses in monetary terms.
The development of Ells is a dynamic process. EILs evolve through
a series of stages and become more complete as knowledge of the crop,
pests, and their interaction increases (Boston et al. 1983). This evolu
tion has been categorized into the following four stages: (1) no EIL,
(2) nominal EIL based on the best guess of workers in the field,
(3) simple EIL based on quantitative research data for a single pest,
and (4) comprehensive EIL that incorporates multiple pests and stress
factors for a variety of growing environments and economic situations
(Boston et al. 1983). Most current IPM programs rely upon nominal or
simple EILs.
The development of valid and applicable EILs requires the elucida
tion of insect/plant interaction, particularly the crop response to
insect injury. The traditional approach by entomologists to the study
of crop stress has been to examine the effect of insect density on final
productivity, measured as yield and/or quality. Although useful in the
calculations of simple EILs, this "black-box" approach has ignored the
mechanism of crop response to injury. The applicability of thresholds
derived in this manner is limited, because of the inability to predict
how a plant may respond in different environments and interact with other
stresses. The construction of more comprehensive EILs will require a

3
more thorough, and basic understanding of plant response to insect stress.
The investigation of plant/pest relationships will be enhanced by a more
holistic and agronomic approach to insect-induced plant stress.
This approach requires the quantification of the impact of insect
injury on plant growth, development, and other processes such as photo
synthesis and carbon flow within the plant. Furthermore, an understand
ing of how pests injure plants is needed. Boote (1981) has placed pests
into a number of categories based on the type of damage inflicted on the
crop. These categories are: stand reducers, leaf-mass consumers, leaf
(photosynthesis) rate reducers, senescence enhancers, light stealers,
assimilate sappers, turgor reducers, and fruit feeders that reduce both
quantify and/or quality. Insects potentially can fall into any of the
categories, except, perhaps, light stealers. One of the most common
types of insect injury is defoliation. Insect defoliators primarily are
leaf-mass consumers, and mainly affect the plant through the removal of
leaf mass and area. The photosynthetic capacity of remaining individual
leaves generally is reduced little. Canopy photosynthesis, however, can
be reduced by the loss of leaf area and reduction of light interception.
The effect of defoliation by insects on subsequent growth rates and
dry matter partitioning by plants has not been studied extensively. It
is possible that plants may compensate for defoliation by the production
of additional leaf mass and area. Boote (1981), however, claims that, at
least in annual seed-producing crops, compensatory growth is a myth. At
best, leaf growth is no more than normal for a undamaged canopy, thus the
loss in leaf mass is permanent and will remain until senescence. Recent
studies with soybean (Higgins et al. 1983, Hinson et al. 1978) and

4
alfalfa (Fick 1982) support this conclusion. Defoliation in these
studies, however, occurred at the beginning of flowering, consequently
the injury may have occurred too late for the plant to produce compensa
tory growth. Compensatory growth may occur if damage is inflicted at an
early stage of plant development.
This dissertation documents the study of these concepts in a system
involving the variegated cutworm (VCW), Peridroma saucia (Hiibner), in
alfalfa. Although VCW attacks over 120 plant species (Rings et al.
1976b), the species is of concern as a pest of alfalfa because it causes
delays in regrowth for up to two weeks or more (Soteres et al. 1984,
USDA 1957-1975). Damage usually is noticed only when regrowth is
delayed completely, with less severe defoliation largely going unnoticed.
Current management practices recommend the curative application of an
insecticide once damage is detected. The nominal ET of 1.1 larvae/
2 2 0.1 m (1 larva/ft ) has been proposed (DeWitt and Taylor 1984), but
this value is based on limited research data. Systematic examination of
the effects of stubble injury on alfalfa regrowth is needed to develop
simple Ells for VCW in alfalfa. This examination also will provide a
foundation for the development of more comprehensive and dynamic EILs for
other stubble defoliators in alfalfa.
The researchj therefore, investigates the response of alfalfa re
growth to actual and simulated injury by VCW. Specific objectives of
the study were to:
1) Characterize the alfalfa response-syndrome to stubble injury
in terms of dry matter production, plant development, and
resource partitioning;

5
2) Assess the impact of complete regrowth delays of varying
periods on subsequent alfalfa growth and yield;
3) Elucidate the relationship between the density of stubble-
feeding VCW and alfalfa growth and yield;
4) Quantify VCW growth and consumption on alfalfa foliage;
5) Develop valid and dynamic EILs and develop management
practices for this insect in alfalfa; and
6) Make progress toward the development of comprehensive EILs
for stubble-feeding insects in alfalfa.
6
LITERATURE REVIEW
The review of literature is divided into two parts. The first part
reviews the biology and damage potential of the variegated cutworm. The
second part summarizes information on alfalfa with emphasis on relevant
studies on the effects of defoliation on alfalfa growth and development.
Variegated Cutworm Biology
Life history and ecology
The variegated cutworm (VCW), Peridroma saucia (Hiibner), has been
found from southern Canada to Patagonia and from Scandinavia throughout
Europe to northern Africa and the Middle East (Snyder 1951). Since its
description by Hiibner, many studies and reports on VCW have been published
(see Rings et al. (1976a) for a complete bibliography). Our knowledge
of the VCW biology is based primarily on the works of Chittenden (1901),
Crumb (1929), Doane and Brodie (1901), Wadley (1921), and Walkden (1950).
Crumb (1929) also gave detailed descriptions of each life stage. Unless
indicated otherwise, the discussion of VCW biology will be based on these
references.
Eggs are laid in masses of 30-300 eggs/mass (Wadley 1921), and
initially they are cream color. As development proceeds, the eggs become
reddish brown and immediately before hatching they appear dark gray. Egg
development requires 7 to 10 days, and larvae disperse and initiate feed
ing soon after hatching. VCW seems rather indiscriminant during oviposi-
tion. Eggs usually are laid on vegetation or debris near the food plant;
7
however, eggs have been observed on buildings, fence posts, and other
nonfood substrates.
VCW larvae generally undergo six larval instars. The first three
larval stages usually occur on the aerial portions of the host plant,
where feeding is primarily a diurnal activity. As larvae become older,
they exhibit the more typical behavior of a climbing cutworm. During
the day, larvae are inactive and hide under debris on the soil surface.
At night, larvae become active and climb foliage to feed. This nega
tively phototactic behavior becomes more pronounced with each succeeding
stage, but the greatest behavioral transition occurs during the third
and fourth stadia. If food becomes scarce, large larvae will exhibit
armyworm-like behavior by moving, en masse, to adjacent fields.
VCW is highly polyphagous and is reported to feed on at least 121
host plants (Rings et al. 1976a). The list includes many vegetable,
orchard, ornamental, and field crop species along with a number of non-
crop and weed species. Although quite a few species of grasses are
reported as hosts, VCW shows a distinct preference for broadleaved
species, especially legumes (Snyder 1954).
Regardless of the host plant, VCW can consume a large amount of
2 foliage. Stages 4-6 have been found to consume a total of 130.85 cm
2 of sugarbeet foliage (Capinera 1978) and a total of 158 cm of potato
foliage (Shields 1983). Berry and Shields (1980) also reported that a
2 total of 174.4 cm of peppermint leaves was consumed by stages 3 through
6. This total was the equivalent of 26 average-sized peppermint leaves,
and over 94% of these leaves were consumed by the last two stages. It is
apparent that there are substantial differences in consumptive rates on
8
different hosts. Some of these differences probably are caused by dif
ferences in the leaf weight-to-area ratios of the host plants. Host-
leaf nutritional values also may explain some of the differences in con
sumption rates.
Diet also may affect the number of larval molts and larval develop
mental rates. Snyder (1954) found that less than 10% of larvae fed kale,
bean leaf, string bean, spinach, tobacco, and cabbage underwent a seventh
stage. Alfalfa caused 11% of larvae to have an extra molt. Celery,
tomato, lettuce, and com leaf, however, resulted in 29, 67, 93, and 100%
of larvae, respectively, to undergo a seventh stage. Furthermore, an
eighth stage was observed in half of the larvae fed lettuce, and corn
leaf caused 100, 56, and 11% of larvae to undergo an eighth, ninth, and
tenth stage, respectively.
The influence of diet on larval developmental rates can be substan
tial. Snyder (1954) reported that larval stadia at 25°C ranged from
22.2 days on kale to 44.0 days on corn with a mean of 30.9 days for all
twelve hosts. Development on alfalfa required 26.9 days. Tomescu. et al.
(1978) found that larval development on an unspecified artificial diet
took 30 days at 24°C and 60% RH. Additionally, VCW larval stages 2-6
required 27.5 days to complete development at 27°C on sugarbeet foliage
(Capinera 1978), and stages 3-6 required 21.9 days at 25°C when fed
peppermint foliage (Berry and Shields 1980). From these results, it
seems VCW larval development requires about 30 days at ca. 25°C for most
diets. The work of Snyder (1954), however, suggests that some hosts are
less suitable than others, and VCW may exhibit substrate specific rates
of development.
9
The other primary environmental factor determining larval develop
ment is temperature. Two thermal developmental models have been
developed for VCW (Simonet et al. 1981, Shields 1983). Larvae were
reared on artificial diets in both studies, but Simonet et al. used a
pinto bean-based diet, whereas Shields substituted lima beans for pinto
beans. Simonet et al. calculated theoretical lower developmental thres
holds for egg, larval, pupal, and total development to be 5.6, 6.7, 8.5,
and 7.1°C, respectively. Shields calculated these same values as 3.0,
4.1, 5.0, and 4.2°C, respectively. The model of Simonet et al. required
676°C degree days for total development, and Shield's model required
798°C degree days. Shield attributed model differences to the observed
development times at 10°C in both studies. This time was 126 days in
the Simonet et al. study and 64 days in Shield's study. The differences
between these studies may be caused by the length of time that the insect
was reared in the laboratory before experimentation. Furthermore, the
differences in diet may be partly responsible for the observed differ
ences in developmental rates (Shield 1983).
Larval consumption declines substantially four to six days before
pupation (Capinera 1978). When the larva is full grown and finished
feeding, it burrows into the soil and forms a pupation chamber. Once in
place, the larva undergoes a one to two day prepupal phase before pupa
tion when larval wet weight may decline by 50% or more (Capinera 1978).
Most of this weight loss occurs by elimination of water. Pupation takes
place inside the pupation chamber. The pupal stadium has been reported
to last 13-14 days at 24°C (Tomescu et al. 1978) and 15-17 days at 25°C
(Snyder 1954). Snyder found that the pupal stadium was not greatly

10
affected by larval diet. Weight of 1-day old pupae, however, was greatly
affected by larval diet. Weights ranged from 480 mg on string bean to
231 mg on corn leaf. Pupal survivorship was not consistently correlated
with pupal weight. Upon emergence, the adult makes its way to the soil
surface.
The adult is a fairly large moth that can be identified by the
kidney-shaped reniform and the sets of paired spots along the costal
edge of the forewing. Although adults do not exhibit sexual dimorphism,
three adult color morphs have been identified, based on the basal color
of the forewing. The typical morph has a tan to light brown-colored
forewing. Forewing color in form "margaritosa" is reddish to purplish
brown, and the forewing of "semifusca" is tan, like the typical form,
but the costal area is black. The regulatory mechanism of adult poly
morphism is unknown. The ecological significance of adult polymorphism
also is unclear, but Wadley (1921) speculated that form "margaritosa"
may exhibit an ovarian diapause.
Adult longevity is variable. Wadley (1921) reported that adults
live for 8 to 13 days and Tomescu et al. (1978) reported 10 to 20 days.
Simonet et al. (1981), however, found that adult longevity was tempera
ture dependent, with adults living up to 24 days at 12.8°C. These authors
also found that VCW exhibited a preovipositional period ranging from
5.5 days at 29.4°C to 13.9 days at 12.8°C. This range is similar to the
6 to 8 days reported by Crumb (1929), but longer than the 3-day preovi
positional period reported by Wadley (1921). Females normally begin
mating at this time and may mate a number of times during their adult
life.

11
Each female is capable of laying several thousand eggs. Walkden
(1950) calculated an average of 2111 eggs/female and Cook (1923) reported
a mean of 1497 eggs/female. Simonet et al. (1981), however, found that
fecundity is temperature dependent. Peak egg production of 1415 eggs/
female occurred at 23.9°C. Egg production was 377, 1161, and 424 eggs/
female at 12.8, 18.3, and 29.4°C, respectively. The influence of larval
diet on fecundity has not been investigated.
Detailed studies of the mating and ovipositional behavior of VCW
have not been conducted. Even so, mating is mediated by sex pheromones,
and Strubles et al. (1976) found that a 1:1 mixture of Z-9-tetradecen-
1-yl acetate and Z-ll-hexadecen-l-yl acetate is effective in attracting
males. VCW males also possess scent brushes located on the dorsal por
tion of the anterior abdominal segments. These structures have been
postulated to secrete compounds that inhibit calling behavior in the
female (Birch et al. 1976). It is apparent that the chemical communica
tion system in VCW may be quite complex.
The number of generations and mode of overwintering by VCW are
subjects that have received much speculation but little thorough study.
Table 1 summarizes the number of generations and probable overwintering
stages that are reported in the literature. Generally, two generations
per year are reported for the northern US and Canada, and three to four
generations are reported in southern areas of the US. Based on the
information in Table 1, VCW probably has two generations per year in Iowa.
All stages, except the egg stage, have been suggested as the over
wintering stage. Snyder (1951) clearly demonstrated that the egg stage
cannot withstand extended periods of temperatures near or below freezing.

Table 1. Number of flights and generations, and overwintering stages of the variegated cutworm reported in the literature
Location Number of gen.
Number of flights Stage* References
Arkansas 2 3 - Selman and Barton (1972)
Tennessee 4 4 P&L Crumb (1929)
Kansas 3 3-4 A Wadley (1921)
Kansas 3-4 3-4 P Walkden (1950)
Kentucky - - A (in part) Carman (1895)
District of Columbia 2 2 L&?P Chittenden (1901)
Ohio 2 2 L&P Simonet et al. (1981)
Illinois 2 - L,P&A Forbes (1904)
Pennsylvania 2 - L(3-5)&P Frost (1955)
Maine 2 2-3 - Dirks (1937)
Minnesota 2 2 L(med.),P&?A Knutson (1944)
Washington 1-2 3 L,P&A Doane and Brodie (1901)
Ontario - - migration McClanahan and Elliott (1976)
Manitoba 2 2 migration Ayre et al. (1983)
Canada 2 2 - Gibson (1915)
= larvae, P = pupae, A = adult, and ? = possible overwintering stage.
13
The most often mentioned overwintering stages are partly-grown larvae
(instars 3 to 6) and pupae. Both stages have been collected during the
winter by some of the researchers. Chittenden (1901) stated that larvae
may be active on warm days during the winter and that pupation takes
place as soon as the ground warms in the spring. Crumb (1929), on the
other hand, felt that VCW overwintered mostly as pupae, with larvae
overwintering to a lesser extent. Some authors also have suggested that
the adult stage may overwinter, and Chittenden (1901) speculated that
VCW has continuous generations in the southern-most portions of the US.
Crumb (1929), however, felt that VCW does not overwinter as an adult.
If VCW can overwinter as an adult, this mode of overwintering probably
is restricted to the milder portions of the insect's range.
Despite all the field observations of overwintering larvae and
pupae, Ayre et al. (1983) reported that no stage can tolerate extended
periods of freezing temperatures in the laboratory. No details of the
experimental procedures were provided however. These authors, McClanahan
and Elliot (1976) and researchers in Europe have hypothesized that VCW
does not overwinter in the northern part of its range. Populations in
these areas are initiated each spring by migration of adults from southern
overwintering areas. It is possible that in some areas both indigenous
overwintering cohorts and migrating adults are important sources of
initial spring populations.
Unfortunately, no studies have specifically investigated the over
wintering, migration, and diapause potential of VCW. Diapause has not
been clearly demonstrated to occur in VCW. If diapause exists in this
insect, undoubtedly it is facultative. In fact, Finney (1964) felt that
14
VCW was a good animal for laboratory studies because the life cycle was
not interrupted by diapause. Snyder (1951) was unable to induce larval
or pupal diapause under any of the temperature or light regimes he
tested. Until the overwintering and diapause potential of VCW is inves
tigated more thoroughly, many of the basic questions concerning VCW
biology will remain unresolved.
Economic importance
The wide host range and sudden periodic outbreaks of VCW make this
species potentially one of the most destructive cutworms in North America
(Crumb 1929, Doane and Brodie 1901, Wadley 1921). When an outbreak
occurs, VCW usually infests most suitable hosts in the area. The most
conmionly damaged crops are alfalfa, cabbage, clovers, cotton, lettuce,
potatoes, tobacco, and tomato (Snyder 1951). VCW also seems to cause
considerable damage in peppermint (Berry and Shields 1980). Additionally,
VCW often is a pest for home owners, because it will infest gardens and
damage ornamentals. During heavy infestations, VCW has even been reported
to feed on potato tubers (Chittenden 1901). The greatest economic impact
probably is in vegetable crops, of which potato and tomato are most
frequently damaged (Rings et al. 1976b). This is primarily because vege
tables are high cash-value crops that can withstand little damage before
economic loss occurs. Furthermore, VCW may feed directly on developing
flowers, buds, and fruit, thus causing direct loss to the harvestable
product and reduction in product quality.
Few people have attempted to assess the losses caused by VCW, but
Chittenden (1902) estimated that losses during the "great" outbreak of
15
1900 were $2.5 million. This outbreak was so severe and widespread in
North America that larvae destroyed entire fields of crops and moved en
masse from field to field. Doane and Brodie (1901) stated that "they
(the larvae) would carry everything before them, for they had by this
time (July 15) literally become an invading army, marching on from garden
to garden, from field to field, from orchard to orchard, eating every
green plant that came in their path."
In Iowa and the Great Plains, VCW is of most concern as a pest of
alfalfa. Potatoes also are sometimes damaged in the upper Midwest.
Examination of the Cooperative Economic Insect Report from 1957 to 1975
and the Cooperative Plant Pest Report from 1976 to 1981 indicates that
VCW primarily is a pest in alfalfa in the area from the Mississippi
River west to the Rocky Mountains. Alfalfa-growing areas in California,
Nevada, and Utah also reported damaging populations. VCW was not often
reported damaging alfalfa in the humid east. The regional nature of the
VCW problem in alfalfa is exemplified by the fact that VCW is considered
an important pest of alfalfa in Kansas (Grandfield and Throckmorton 1945),
but it is considered only a minor pest of alfalfa in Delaware (Milliron
1958).
Based on the number of reports from 1957 through 1981, outbreaks
occurred 12 of the 24 years examined. Furthermore, outbreaks generally
occurred every two to three years and, except for one case, they occurred
every other year from 1968 through 1981. It was uncommon for outbreaks
to happen during two consecutive years. This suggests that in the Great
Plains, VCW may exhibit population cycles of two to three years in dura
tion.

16
Physiology of Alfalfa Regrowth
Role of carbohydrates in regrowth
The association between the cutting of alfalfa and the cyclic changes
in root weight, and accumulated carbohydrates in the roots and to a lesser
extent in the crown, has been demonstrated by many studies (Grueb and
Wedin 1971, Nelson and Smith 1968a, Smith 1972, Smith and Nelson 1967).
Graber et al. (1927) were the first to suggest that nonstructural carbo
hydrates that accumulated in the crowns and taproots were an important
source of nutrition for regrowth in alfalfa. Many researchers have con
curred with this hypothesis; however, some studies (Hodgkinson 1973 and
1974) have stressed the importance of current photosynthesis (Ps) by
stubble leaves as a source of carbohydrates for regrowth.
Carbohydrates in alfalfa are stored primarily as starch, but
significant amounts of sucrose, glucose, and fructose also are present
in the plant (Nelson and Smith 1968b). Most of the cycling of carbo
hydrates occurs with the starch fraction (Nelson and Smith 1968b), and
\ sucrose probably is the primary transport carbohydrate within the plant
(Brown et al. 1972).
The carbohydrate cycle consists of a rapid decline in stored carbo
hydrates after cutting until about 15 to 20 days postcutting. Carbo
hydrate levels in the roots begin to increase about three to four weeks
after cutting and usually reach maximal levels about full bloom. The
extent of depletion and time needed for replenishing the reserves will
depend on many factors, including the frequency and intensity of cutting,
stage of maturity at cutting, the climate (humid vs. xeric), and the
17
external environmental conditions during regrowth (Bolton 1962, Smith
1975).
Smith and Silva (1969) indirectly examined the contribution of root
reserves to regrowth by comparing the regrowth of plants under light and
dark conditions. No significant differences in the levels of root
carbohydrates were found during the first 21 days of regrowth, indicating
that reserve utilization was similar in both environments. Most of the
reserves (66%) were translocated and used by the herbage. Herbage
weights, however, were significantly different on and after day 14, sug
gesting that current Ps contributed significantly to top regrowth after
the first week. The contribution of current Ps to total plant weight
was calculated by subtraction to be 0, 52, 70, and 93% of total plant
weight on days 7, 14, 21, and 42 after cutting, respectively.
Smith and Silva also observed small but significant declines in
root nitrogen (N) during the period of carbohydrate depletion suggesting
that stored nitrogenous confounds also may be translocated to new shoots.
These compounds, however, probably are not being used primarily as a
source of N because Hodgkinson (1973) showed that N demand was met by
current root uptake and not by remobilization of stored N. N compounds,
therefore, may be translocated and used as an energy source during re
growth.
The role of accumulated carbohydrates in regrowth was not clearly
demonstrated until ca. 1969 with the use of radiactive carbon (^^C)
(Hodgkinson 1969, Pearce et al. 1969, Smith and Marten 1970). Pearce
14 et al. studied the flow of carbon by adding C to plants weekly during
14 a regrowth cycle. The location and loss of C was monitored during
18
this cycle and during the subsequent regrowth cycle, when no additional
was added. This study clearly demonstrated the movement of from
tops into roots before cutting and a reverse movement of carbon from the
roots to new shoots after cutting. The depletion of carbohydrates in
the roots after cutting showed a sigmoid rate of decline, with maximal
rate of starch breakdown occurring between days 3 to 15. At the same
14 time, levels of C increased in tops until day 15. Root carbohydrate
levels remained low from day 15 to 28, and it was not until day 21 that
the net flow of carbon was from tops to roots. As top growth accumulated,
the net flow of to the roots increased after day 21, so that ca. 36%
14 of the C added on day 35 was translocated to the roots and converted
into starch. Starch breakdown, therefore, occurred from day 3 to 15 and
starch synthesis began on day 21 and continued until the next cutting.
During the first three days after cutting, the free sugar fraction
(ETOH extractable) declined significantly, but there was not significant
decline in stored starch until the sixth day. Indicative of the three-
day lag in starch breakdown was the observation that the percentage of
in the roots declined only 4% from day 0 to 3 but declined by 9%
14 from day 3 to 6. Additionally, the acid nonextractable C fraction in
the crowns increased substantially during the first three days of
regrowth. All carbohydrate fractions in the roots and crowns declined
after the third day. Vance et al. (1979) also found that root starch
breakdown did not begin until the fourth day of regrowth. Pearce et al.
interpreted these results as indicating that the plant was switching
from starch synthesis to starch degradation during the first three days
of plant regrowth. The free sugar fraction was used to produce the
19
proteins needed for the mobilization and utilization of the stored
carbohydrates, and the increase in acid nonextractable in the crown
was associated with the production of proteins required for regrowth.
The studies of Hodgkinson (1969) and Smith and Marten (1970)
essentially showed the same results as those of Pearce et al. Both of
these studies, however, indicated that most of the translocated from
the roots to the tops was used for respiration and not for the synthesis
of structural material. Hodgkinson further discovered that translocated
carbon was used by the first few leaves produced, but leaves generally
were self-sufficient and actually exported photosynthates after the
sixth day of regrowth. Stems, however, continued to import and used
carbohydrates translocated from the roots during the first 20 days of
regrowth. Therefore, the Ps capabilities of leaves seem to be
established after about one week of regrowth, whereas stems continue
to utilize stored carbohydrates for about three weeks.
While it is clear that accumulated carbohydrates are an important
and, usually, primary source of nutrition during the initial stages of
regrowth, current Ps by leaves remaining on the stubble after cutting
also mây be an important source of nutrition for regrowth. The Ps capa
bilities of stubble leaves have been specifically investigated in a
number of studies (Hodgkinson 1973 and 1974, Hodgkinson et al. 1972).
The Ps capacity and potential for rejuvenation of stubble leaves will
depend on leaf age and the light environment to which the leaf was
exposed. The Ps capacity of leaves declines greatly after about three
weeks of age (Fuess and Tesar 1968). Cutting of alfalfa, however, has
been found to rejuvenate stubble leaf Ps with net CO^ exchange rates

20
2 rising from 55 to 130 ng COg/cm /sec (Hodgkinson et al. 1972). Partial
defoliation was found to cause a complete rejuvenation in young and
middle-aged leaves, but only a partial recovery in older leaves
(Hodgkinson 1974). The rejuvenation of stubble leaves by cutting
probably was caused by the increase in light and nutrients available
to the leaves after cutting.
Hodgkinson et al. (1972) found that retention of stubble leaves
reduced the loss of root weight and depletion of root carbohydrate
levels, but there was no significant increase in the rate of shoot
growth. These results suggest that current Ps will be used preferentially
during regrowth, if it is available. These authors felt that the role of
carbohydrate reserves is passive rather than active in that reserve carbo
hydrates will be used, if necessary, to supplement the needs of the plant.
If current photosynthates are not available and reserves are adequate,
reserves alone are sufficient for maximal rate of regrowth.
From these results, Hodgkinson et al. (1972) concluded that the
retention of stubble leaves was beneficial and should be encouraged
especially if the frequency of cutting does not allow enough time to
replenish carbohydrate reserves. The studies of Hodgkinson and his
associates, however, were all conducted in the greenhouse where shading
of lower leaves probably was not as great as compared.with a field situa
tion. These studies also were conducted with plants less than one year
old, which probably would result in plants having reduced root storage
capacity as compared with field plants. Furthermore, plants were cut in
pre-flowering stages presumably before reserves could be entirely
replenished and stubble leaves degenerated. In a field situation.

21
usually by the time harvest occurs most stubble leaves are four to five
weeks old. These leaves have been shaded for two to three weeks and
probably have abscissed or degenerated beyond the "point-of-no-return"
because of natural processes and leaf diseases (Fuess and Tesar 1968).
Fuess and Tesar found that even if stubble leaves were still present at
harvest, 21-day-old leaves had 1/7 the Ps rate of young leaves. Brown
et al. (1972) also found that net CO^ exchange rates of stubble leaves in
the field were low and suggested that stubble leaves may be a detriment
rather than a benefit. Considering all these factors, the studies of
Hodgkinson and his associates probably have overstated the relative
importance of the retention of stubble leaves in most field situations.
Development of canopy structure
Canopy growth and development is a dynamic process that is affected
by the unique innate qualities of the plant and the environment in which
the plant occurs. In general, there are three phases of canopy develop
ment; phase of bud and shoot initiation, vegetative growth phase, and
reproductive growth phase. The period of bud initiation is when poten
tial stem density is determined, whereas the periods of vegetative and
reproductive growth determine shoot size, shoot quality, and final stem
density. The yield of alfalfa is determined primarily by the two
components of stem density and stem weight. Plant density generally is
not correlated with yield as long as the number of plants/unit area is
sufficient to provide a full stand of stems. A full stand has been
22
2 estimated as 375 stems/m (Bula and Hintz 1978). This lack of correla
tion in a full stand is because the number of stems per plant varies
inversely with plant density. To a certain extent this compensatory
ability is a feature of most forage crops.
Shoots of alfalfa usually initiate at the nodes on stubble of the
previous cutting (Leach 1968, Nelson and Smith 1968a, Singh and Winch
1974). A small portion of shoots also may arise directly from the crown.
Furthermore, Hodgkinson (1973) demonstrated that most shoots arise at or
near the base of the stubble. He found that almost 3/4 of the new shoots
on plants cut at 15 cm arose within the basal 2.5 cm of the plant. This
probably is why increased cutting height has not been found to greatly
increase stem density (Smith 1972). Removal of residual stubble leaves
also has been shown not to affect the number of new shoots (Leach 1968).
Leach (1968, 1969, and 1970) conducted a series of detailed studies
on the regrowth of alfalfa in Australia. He studied the number and rate
of bud initiation in plants subjected to cutting at various stages of
maturity and at various intensities of cutting. Less severe cuttings
increased shoot number, and later cutting increased both shoot number
and size. Variation in cutting height, other than complete removal of
stubble, did not affect shoot size.
Leach found that most of the observed treatment effects on yield
and regrowth could be explained by variation in the number of shoots
that regrew and the temporal pattern of shoot initiation. The rate of
bud initiation in healthy plants was rapid, with most shoots beginning
growth within seven days of cutting. Shoots beginning growth within the
first week of regrowth contributed about 80% of the final yield at harvest.
23
Shoots beginning growth after the first week were few in number, had
slower growth rates, and rarely continued to grow until harvest. Cutting
plants at an earlier stage or completely removing all stubble reduced
both the number of new shoots and the rate at which shoots initiated
growth. Shoot initiation was gradual and occurred over a longer period
of time than in healthy plants. Consequently, the crop growth rate
(dry weight per unit area per day) was reduced. The growth rate of
individual stems, however, was not affected by stage or intensity of
cutting, leach concluded that the rate of shoot initiation is equally
as important as the number of initiated shoots. Therefore, management
practices should attempt to maximize the number of shoots that initiate
growth soon after cutting. Additionally, because shoot growth was un
affected by residual leaves, management practices should promote the
rapid development of new leaf area, rather than the retention of old
leaf area.
Hodgkinson (1973) also examined the effect of cutting height on
alfalfa regrowth and nutrient uptake. As in Leach's studies, Hodgkinson
found that nearly all new shoots initiated growth within seven days of
cutting and most initiated growth within 3 to 5 days. Usually, half the
new shoots, however, did not grow taller than 2.5 cm. He attributed
this phenomenon to apical dominance which limited or stopped growth and
nutrient uptake by uninitiated buds and subordinate shoots. Hodgkinson
also found that most of the effects of cutting height developed during
the first week of regrowth and persisted until harvest. Reduced
regrowth during the first week probably was caused by a reduction in
the rate of shoot initiation.

24
Cowett and Sprague (1962 and 1963) investigated the effects of
various environmental and cultural factors on tillering. Tillering was
reduced by inadequate soil moisture, low light intensity, high tempera
tures particularly at night, poor nutrient balance, and frequent cutting.
All these conditions tended to reduce root weight and the accumulation
of stored carbohydrates presumably by inhibiting Ps, increasing respira
tory losses, or by not allowing enough time for the accumulation of
carbohydrates. Most of the factors seem to directly or indirectly affect
the carbohydrate accumulation and levels within the plant. Consequently,
these authors concluded that carbohydrate levels probably are the most
important factor governing tillering in alfalfa. This conclusion is
consistent with the results of the studies by Leach and Hodgkinson.
As previously discussed, vegetative growth during the first 7 to
10 days is determined primarily by the levels of carbohydrate reserves.
Although new leaves will begin to export photosynthate after the sixth
day (Hodgkinson 1973), current Ps is not an important source of carbo-
hdyrates during early shoot growth, unless stored carbohydrate levels
are low (Leach 1968, Smith and Silva 1969). Current Ps quickly becomes
important after about the tenth day, even though stems, but not leaves,
will continue to use stored reserves for about 20 days (Hodgkinson 1969).
Once the period of bud initiation is complete, alfalfa exhibits a
period of rapid vegetative growth. Stem density usually reaches a. peak
one to two weeks after cutting. Thereafter, stem density declines until
harvest, with stem mortality sometimes exceeding 50% (Singh and Winch
1974). Nelson and Smith (1968a) found that most stems were unbranched
during the first few weeks of growth. Axillary branches began develop

25
ing ia the axils of lower main-stem leaves and branching became exten
sive, especially in aftermath growths, as the plant continued to grow
and entered the reproductive phase.
Alfalfa growth and canopy development has been studied under 2-, 3-,
and 4-cut systems in the upper midwestem US by Fuess and Tesar (1968),
Grueb and Wedin (1971), Nelson and Smith (1968b), Smith and Nelson (1967),
and Wilfong et al. (1967). Growth and leaf area accumulations were low
during the period of bud initiation (first 7 to 10 days). After this
time, leaf area index (LAI) and dry matter accumulation increased in a
rapid and almost linear pattern until flowering. LAI and yield were the
largest during the spring growth in all the studies. LAI in the spring
growth achieved 95% light interception about three weeks before flower
ing. Apparent canopy Ps (APs) and consequently crop growth rate (CGR)
increased with LAI until 95% light interception. At this point, APs and
CGR stopped increasing and remained constant until flowering, even
though LAI continued to increase. Nelson and Smith (1968a) found that
95% light interception occurred at an LAI of 3.5 during the spring
growth. After this point, LAI was optimal, because CGR had reached a
maximal level. CGR usually remained high until flowering, and con
sequently, LAI was optimal over a broad range of LAI values in the
spring. CGR and the rate of increase in LAI declined at flowering
because of a reduction in vegetative growth and an increase in leaf
senescence and abscission. Fuess and Tesar (1968) found that leaf
droppage for plants harvested near full bloom was 1.19 MT/ha more than
leaf droppage of plants harvested near 1/10 bloom.

26
Alfalfa regrowth during the summer generally progresses in a similar
pattern as in the spring, but peak LAI and dry matter accumulation values
are lower than in the spring. LAI increases rapidly after the bud
initiation phase, but flowering, which is hastened by high summer temper
atures (Nelson and Smith 1969), usually occurs before or near the point
of 95% light interception. CGR also continues to increase until LAI
reaches a peak at or near flowering. LAI, therefore, is optimal for only
a short period of time before flowering and leaf abscission occur.
As alfalfa matures and enters the reproductive phase, LAI stops
increasing, and racemes of flowers develop at the upper most nodes.
Additional flower racemes also begin developing on upper main-stem and
branch nodes. Concurrent with flowering, the Ps capacity of lower main-
stem leaves declines, and senescence and droppage of these leaves in
creases. This has a large impact on LAI, because these leaves tend to
be larger than the newer leaves on axillary branches. Stems also become
woody and lignified with maturity. These trends combine to substantially
reduce forage digestibility and nutritive value during flowering. The
reduction in CGR and forage quality is the reason why systems that cut
herbage near the beginning of flowering (first bloom or 1/10 bloom) are
recommended for maximizing the production of digestible dry matter yield
(Fuess and Tesar 1968, Grueb and Wedin 1971, Nelson and Smith 1968a,
Smith 1975).
The reproductive phase also results in reduced apical dominance of
crown and stubble buds (Hodgkinson 1973). These buds will develop and
begin growth at about full bloom even if the herbage is not cut (Smith
1975). Buds generally are not fully developed until flowering and
27
usually are slow at initiating regrowth if the herbage is cut before
flowering. Therefore, rapid bud initiation and growth usually occur
when alfalfa is harvested after flowering has begun.
Response of Alfalfa Regrowth to Insect Injury
VCW causes direct injury to the harvestable product of alfalfa by
feeding on leaves, small stems, and new shoots. VCW most often causes
noticeable damage in alfalfa by feeding on new shoots soon after harvest.
If a sufficient number of larvae are present, this type of damage may
cause a complete delay in green-up for two weeks or more (Grandfield and
Throckmorton 1945). Delays in green-up usually occur after the first
cutting, but delays after later cuttings also have been reported (USDA
1976-1981). Most likely, some population densities do not cause complete
delays in regrowth. Little quantitative data, however, is available on
the impact of VCW feeding on alfalfa regrowth and yield. In Iowa, a
2 nominal economic threshold of 1 larva/ft has been used for newly cut
alfalfa fields (DeWitt and Taylor 1984). This threshold is based mostly
on experience rather than on experimental data.
VCW larvae also damages alfalfa between cuttings by feeding on
leaves and lateral branches located in the lower and middle parts of the
plant canopy. The impact of this type of damage is unknown. Neverthe
less, leaf feeding probably would have a greater impact than would be
expected based on yield loss alone. This is because ca. 2/3 of the
digestible nutrients of alfalfa are located in the leaves (Smith 1975).
Leaf feeding, therefore, would tend to reduce herbage quality to a

28
greater extent than yield. On the other hand, because leaf feeding
occurs in the lower parts of the canopy, a large portion of the leaves
damaged by larvae probably would have senesced and dropped from the
plant before harvest. This last factor tends to reduce the impact of
larval feeding between cuttings and probably is why damage to standing
alfalfa generally is not reported. Consequently, VCW probably damages
alfalfa mostly as a result of stubble feeding.
The impact of stubble feeding by insects has received little atten
tion, and no studies have specifically assessed the effects of damage
caused by VCW. Some studies, however, have investigated the effects of
stubble feeding by other insects. Lui and Pick (1975) and Fick and Liu
(1976) examined the season-long effects of alfalfa weevil (AW), Hypera
postica (Gyllenhal), damage on the yield, quality, root reserves,
developmental rate, and canopy structure of alfalfa. The studies were
conducted on var. 'Saranac' and 'Iroquois' alfalfa under systems of two
and three cuttings in New York state. Yield was significantly reduced
by AW feeding only during the second growth of the 3-cut system. The
first cutting of this system occurred before most larvae had pupated,
thus, most larvae continued to feed during the first part' of the second
growth. This feeding caused delays of five to 15 days in regrowth.
Damage was sufficient in one year to cause a 31% reduction in yield
during the second growth and a 17% reduction in total seasonal yield.
Effects on stem height and herbage quality, as measured by digestible
dry matter and crude protein, were small and not significant. Stubble
damage did cause a significant delay in morphological development,
resulting in a difference in the chronological age of the herbage in

29
damaged and undamaged plots. These developmental differences, however,
ameliorated before the end of second growth. Stubble feeding had no
significant effect on root carbohydrate depletion, but the rate of carbo
hydrate replenishment was not as fast in damaged plants. Consequently,
carbohydrate levels were significantly lower in damaged plants just
before harvest. Nevertheless, regrowth during subsequent cycles was not
reduced by AW feeding.
As a result of these studies, Pick (1976) specifically investigated
the impact of AW stubble feeding on alfalfa regrowth. The study was
conducted by infesting small plots with larvae up to densities of 10,260
2 larvae/m . Plots were infested on the fourth day after the first cutting.
Larval feeding occurred until day 9, with larger larval populations
causing longer delays. Yield losses were proportional to the severity
and duration of regrowth delays. Yield losses increased linearly
2 2 (r = 0.87), with larval density up to ca. 1600 larvae/m . Further
increases in larval density did not cause additional significant losses,
with maximal yield losses being about 1/3 of the potential yield of the
40-day regrowth period. Pick also found that regrowth delays caused
herbage to be chronologically younger. Therefore, delayed shoots were
less mature, shorter in height, and greater in the percentage of leaves,
as compared with undamaged shoots. Herbage quality also was better in
damaged plants, but the increase in quality was not enough to compensate
for the loss in yield. Root carbohydrate levels declined to the same
level in all treatments, but reserves did not recover as fast in heavily
damaged plants. These findings were essentially similar to the results
of the large-scale field studies previously discussed.

30
In a later study, Pick (1982) assessed the impact of simulated
AW defoliation at the first-bud and first-flower stages on subsequent
growth and development. Defoliation reduced yield, delayed maturation,
reduced stem height, and increased axillary branching. Herbage quality
was affected only slightly. The absolute differences in dry matter
between damaged and undamaged plants persisted until the end of the
study, suggesting that growth rates after defoliation were not inhibited
or stimulated by defoliation. Consequently, no compensatory growth
occurred. It is unknown, however, whether compensatory growth would
occur if plants were defoliated after cutting or during the vegetative
growth phase.
Significant delays in alfalfa regrowth also may result from insects
with haustellate mouthparts. Newton and Hill (1970) showed that adults
of the alfalfa plant bug, Adelphocoris lineolatus (Goeze), tarnished
plant bug, Lygus lineolaris (Palisot de Beauvois), meadow spittlebug,
Philaenus spumarius (L.), and the leafhopper, Athysanus argentarius
Metcalf, retarded regrowth by delaying the initiation of new buds and
causing dieback of new shoots. This study, however, was conducted on
caged plants in the greenhouse using enormous numbers of insects. It is
questionable whether populations on any of these species would ever
reach these densities in the field. Nevertheless, reductions in regrowth
by piercing-suckling insects are possible and, perhaps, should be inves
tigated in more detail.
31
PART I. VARIEGATED CUTWORM FOLIAGE CONSUMPTION AND
LARVAL DEVELOPMENT ON ALFALFA
32
ABSTRACT
Variegated cutworm, Peridroma saucia (Hiibner), consumption and
development on alfalfa was studied in the laboratory. Larvae exhibited
either six or seven molts. Larvae with six molts required 35.6 ± 7.1
days (±SD) for development and consumed 352.6 ± 67.5 mg of foliage.
Development and consumption by larvae with seven molts were 32.8 ± 3.7
days and 442.2 ± 57.9 mg of foliage, respectively. Larval and adult dry
weights indicated that larvae exhibiting seven molts probably were repre
sentative of feral individuals. Consequently, data from these larvae
were used to develop an alfalfa-consumption model for the variegated
cutworm.

33
INTRODUCTION
The variegated cutworm (VCW), Peridroma saucia (Hubner), is a pest
of many vegetable, ornamental, and field crops (Chittenden 1901, Crumb
1929). In some years, VCW in Iowa may cause widespread damage to alfalfa
and other crops. Larvae are nocturnal and climb stems to feed on leaves
and succulent stems. Damage is caused primarily by the consumption of
leaves, petioles, and axillary stems, rather than by severance of main
stems.
VCW phenology in Iowa is such that adults lay eggs in alfalfa in
late April and early May. Larvae hatch and feed on the spring alfalfa
growth. When alfalfa is cut, normally about June 1, many larvae are
entering or have entered the last larval stage. Because most consumption
in this species occurs during the last larval stage (Berry and Shields
1980), moderate populations of VCW may cause considerable damage to the
subsequent regrowth. This damage can result in regrowth delays of
several days to 2 weeks or more (Soteres et al. 1984). The objectives
of this study were to measure the consumption and developmental time of
VCW on alfalfa and to develop a consumption model for this insect on
alfalfa.

34
MATERIALS AND METHODS
All larvae used in this study were the progeny of feral adults
collected in blacklight traps located near Ames, Iowa. Eggs obtained
from these adults were held in an environmental chamber at 24 ± 0.5°C
in a 15:9-h L:D regime. Upon hatching, 50 larvae were placed indi
vidually in 76-diam. plastic petri dishes that contained moistened
filter paper. Larvae were provided with alfalfa foliage that was kept
turgid by placing leaf or branch stems in a 1-dr vial containing water
and a cotton plug. Foliage was obtained from a field of 'Valor* alfalfa
that was managed to maintain vegetative growth. Larvae that died during
the study were replaced with similarly treated larvae of the preceding
stage.
Larval development was monitored daily. Molting was confirmed by
examining containers for exuviae and by measuring head capsule widths
(HCW). Dry-weight consumption also was determined daily by calculating
the difference between initial and remaining (final) foliage dry weight
(Waldbaurer 1968). Initial dry weight was estimated from the initial
foliage fresh weight and the moisture content of an aliquot of control
leaves. Final dry weight was measured directly. To reduce error of
consumption estimates, the remaining foliage was minimized by providing
small, medium, and large larvae with single leaflets, leaves, and
lateral branches containing several leaves, respectively.
Beginning with the fourth stage, larval fresh weight was measured
after each molt, and pupal fresh weight was measured 2 days after pupa
tion. Larval and pupal dry weights were estimated on the basis of

35
moisture content of a similarly treated cohort of control larvae. Dry
weight of adults was measured directly 1 day after eclosion. Student's
t-tests indicated that most parameters were not significantly (P = .05)
affected by gender. Therefore, unless otherwise indicated, results for
males and females were combined, and all data are presented as means ±1
standard deviation.

36
RESULTS AND DISCUSSION
Mortality was low throughout the study, with stage-1 larvae, pre-
pupae, and pupae having the highest rates (5.2, 4.0, and 4.8%, respec
tively). Furthermore, 38.6% of larvae exhibited 6 stages and 61.4% of
larvae underwent 7 larval stages. Although VCW typically exhibits 6
larval stages (Capinera 1978, Berry and Shields 1980, Simonet et al.
1981), Snyder (1954) found that VCW may undergo supernumary molts when
reared on certain host plants, with 11% of larvae fed alfalfa exhibiting
a 7th stage.
The number of larval stages (hereinafter called mode) had no sig
nificant (P > .05) effect on stages 1-4, total larval, and pupal stadia
(Table 2). In fact, mode-7 larvae required an average of 2.8 days less
than mode-6 larvae to complete larval development. Stadia of stages 5
and 6 were significantly longer for mode-6 larvae than mode-7 larvae.
The combined duration of stages 6 and 7 for mode-7, however, .was not
significantly different from the duration of stage 6 for mode-6 larvae.
Irrespective of mode, all larvae underwent a 3-day prepupal phase.
Because little or no feeding occurred during this time, the duration of
feeding by ultimate-stage larvae was 17.4 and 11.4 days for mode 6 and 7
larvae, respectively.
The developmental times observed in this study are comparable with
those observed by other researchers. Rearing larvae at 25°C, Snyder
(1954) reported larval developmental times of 30.9 days for an overall
mean of 12 host plants and 26.9 days on alfalfa. Tomescu et al. (1978)
found that larval development on an unspecified artificial diet required

37
Table 2. Stadia (days) of variegated cutworms reared on alfalfa foliage with 6 and 7 total larval stages
Mode*
Stage 6 7
1 3.0 + 0.2a 2.8 ± 0.4a
2 2.1 + 0.2a 2.0 ± 0.2a
3 2.7 + 0.5a 2.6 ± 0.5a
4 2.9 + 0.3a 2.9 ± 0.3a
5 4.5 + 0.6a 3.7 ± 0.6b
6 20.3 + 7.1a 4.4 ± 0.7b
7 . . . 14.4 ± 3.2
1-7 35.6 + 7.1a 32.8 ± 3.7a
Pupa 13.2 + 0.8a 13.6 ± 0.8a
*Means within a row followed by the same letter are not significantly different (P = .05); Student's t-test.
30 days at 24°C. Additionally, stages 2-6 required 27.5 days to complete
development at 27®C on sugarbeet foliage (Capinera 1978), and stages 3-6
required 21.9 days at 25°C when fed peppermint foliage (Berry and Shields
1980).
Mean total consumption for mode 6 and 7 larvae was 352.6 ± 67.5 and
442.2 ±57.9 mg, respectively. Stage-specific and total consumption
were greater for females than males, but none of these differences was
statistically significant. Consumption also was similar among modes
during the first 4 larval stages; thus, differences in total consumption

38
developed from stage 5 to pupation (Table 3). Even though mode-7 larvae
consumed 75% of their total consumption during the 7th stage, ca. 95% of
total consumption of both modes occurred from stage 5 to pupation. Berry
and Shields 1980) also found that 94% of total consumption of peppermint
foliage occurred between stage 5 and pupation. Although VCW consumption
of peppermint (Berry and Shields 1980) and sugarbeet (Capinera 1978) has
been determined, these data are not directly comparable with the results
of the present study, because consumption in these other studies was
measured as leaf area and not dry weight. Nevertheless, if the value of
2 130.8 cm for consumption of sugarbeet foliage is multiplied by the
2 specific leaf weight of sugarbeet (3.8 mg/cm ; Capinera et al. 1981), a
value of 497.0 mg results. This value is only 12% larger than the con
sumption measured for mode-7 larvae in the present study.
Average daily consumption (ADC) more than doubled with each suc
cessive larval molt (Table 3). Mode did not significantly affect ADC
for any stage, except stage 5. This difference, however, was not numer
ically large. Because both modes consumed foliage at approximately the
same daily rate, most of the differences in stage-specific consumption
were caused by differences in larval developmental times and not in ADC.
Measurements of larval dry weight indicated that mode-6 larvae were
significantly heavier than mode-7 larvae at the beginning of stages 4,
5, and 6 (2.2 ± 0.5, 6.6 ± 1.7, and 18.5 ± 3.9 mg for mode 6; 1.8 ± 0.6,
5.3 ± 1.5, and 14.5 ± 2.6 mg for mode 7, respectively). Mode-7 larvae,
however, weighed 33.6 ± 6.7 mg at the beginning of the 7th stage.
Furthermore, mode-7 pupae and adults weighed 58.4 ± 8.6 and 41.2 ± 8.5 mg
and were 33 and 38% heavier than mode-6 pupae and adults, respectively.
39
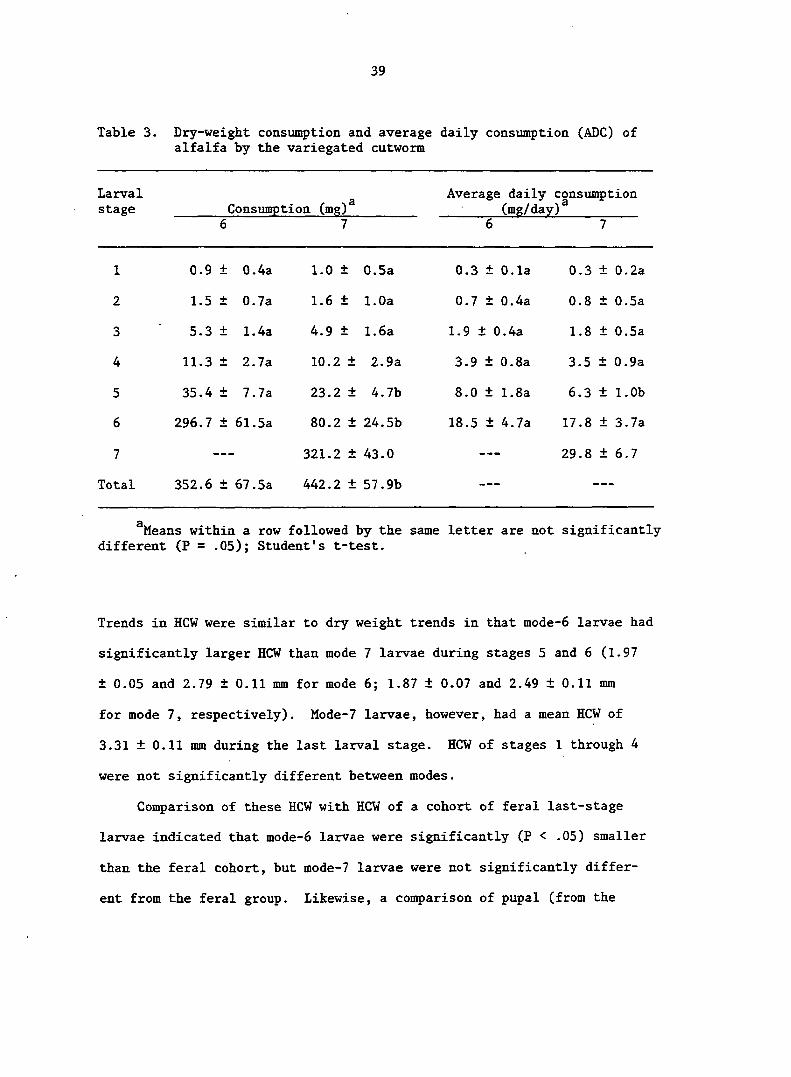
Table 3. Dry-weight consumption and average daily consumption (ADC) of alfalfa by the variegated cutworm
Larval Average daily consumption stage Consumption (mg) • (mg/day)
6 7 6 7
1 0.9 + 0.4a 1.0 ± 0.5a 0.3 ± 0.1a 0.3 + 0.2a
2 1.5 + 0.7a 1.6 ± 1.0a 0.7 ± 0.4a 0.8 + 0.5a
3 5.3 + 1.4a 4.9 ± 1.6a 1.9 ± 0.4a 1.8 + 0.5a
4 11.3 + 2.7a 10.2 ± 2.9a 3.9 ± 0.8a 3.5 + 0.9a
5 35.4 + 7.7a 23.2 ± 4.7b 8.0 ± 1.8a 6.3 + 1.0b
6 296.7 + 61.5a 80.2 ± 24.5b 18.5 ± 4.7a 17.8 + 3.7a
7 — 321.2 ± 43.0 — — — 29.8 + 6.7
Total 352.6 + 67.5a 442.2 ± 57.9b — — — —
^Means within a row followed by the same letter are not significantly different (P = .05); Student's t-test.
Trends in HCW were similar to dry weight trends in that mode-6 larvae had
significantly larger HCW than mode 7 larvae during stages 5 and 6 (1.97
±0.05 and 2.79 ± 0.11 mm for mode 6; 1.87 ± 0.07 and 2.49 ± 0.11 mm
for mode 7, respectively). Mode-7 larvae, however, had a mean HCW of
3.31 ± 0.11 mm during the last larval stage. HCW of stages 1 through 4
were not significantly different between modes.
Comparison of these HCW with HCW of a cohort of feral last-stage
larvae indicated that mode-6 larvae were significantly (P < .05) smaller
than the feral cohort, but mode-7 larvae were not significantly differ
ent from the feral group. Likewise, a comparison of pupal (from the

40
feral larvae) and adult (collected in blacklight traps) dry weights
showed that mode-6 pupae and adults were significantly (P < .05) lighter
than the feral group. Mode-7 pupae and adults, however, were not sig
nificantly (P > .05) different from the feral cohorts. These results
suggest that mode-7 larvae are representative of larvae in the field,
whereas mode-6 larvae probably are not typical.
Consequently, a foliage-consumption model was developed by using
data for the mode-7 larvae. Cumulative dry matter consumption (mg) was
regressed on developmental time expressed as cumulative centigrade
degree-days (CDD) from hatch, and the following equation was generated
(Fig. 1):
.Consumption = 29.6314 - 0.5552 (CDD) + 0.00251 (CDD)^ = .9995
CDD were calculated with a 6.2®C base temperature (Simonet et al. 1981),
and larval development did not include the prepupal phase.
The consumption model indicated that about 58 mg of foliage, or
13.3% of total consumption, was consumed during the first half of larval
development. Additionally, 50% of total consumption occurred during the
last 22.6% of larval development. The majority of foliage consumption
by VCW occurred during the last larval stage. Consumption before the
last stage amounted to ca. 120 mg, which represents 25% of total con
sumption.
The results of this study, therefore, suggest that, if alfalfa is
cut before most larvae have entered the last larval stage, the damage
potential of VCW to the first harvest of alfalfa probably is not great.
However, because of the high rate of consumption by last-stage larvae,
41
the presence of a small number of these larvae after cutting may cause
considerable immediate damage to alfalfa regrowth.

Figure 1. Cumulative dry-matter consumption of alfalfa foliage by saucia as a function of cumulative centigrade degree-says (CDD)

500 cumulative consumption (mc|)
400
300
200
100
100 200 500 600 300
cumulative cod
400
44
PART II. ALFALFA DEVELOPMENT, DRY MATTER ACCUMULATION AND
PARTITIONING AFTER SURROGATE INSECT INJURY OF STUBBLE
45
ABSTRACT
The effects of regrowth delays after the first cutting on rates of
growth, development, and resource partitioning of alfalfa, Medicago
sativa L. 'Valor', were investigated in a 2-year study. Damage was
designed to mimic insect injury sufficient to cause complete regrowth
delays of 1, 3, 7, and 11 days. Dry matter production was very low for
the first 3 days of regrowth. Herbage production increased greatly from
day 3 to day 7, and remained high after day 7. Regrowth delays of 1 and
3 days did not significantly delay plant development or significantly
alter rates of growth and partitioning. Delays of 7 and 11 days retarded
plant development and suppressed crop growth rate (CGR) of subsequent
regrowth. An 11-day delay reduced CGR by 18.4%, but nearly all of this
reduction was caused by a reduction in growth of leaf-support structures.
Leaf weight and leaf area growth rates were not significantly affected by
regrowth delays. Consequently, plants delayed for more than 3 days, par
titioned more leaf area per unit of dry weight through the allocation of
greater leaf weight per unit of total weight and greater leaf area per
unit of leaf weight. A delay of 11 days resulted in increases of 34.5%,
16.3%, and 15.9% for leaf area ratio, leaf weight ratio, and specific leaf
area, respectively. These increases were accomplished through the produc
tion of larger but thinner leaves, which enhanced leaf area more than leaf
weight. These results are discussed in terms of source-sink relationships
within damaged and undamaged plants.
46
INTRODUCTION
Alfalfa is attacked by a number of insect defoliators. As popula
tions approach economic levels, cutting often is recommended as an
alternative method of control. If control is not entirely effective,
stubble feeding by surviving individuals may result in delays in alfalfa
regrowth of two weeks or more. Regrowth delays after cutting most often
are associated with defoliation by the alfalfa weevil (AW), Hypera postica
(Gyllenhal), and the variegated cutworm, Peridroma saucia (Hïïbner) (Pick
1976, Sotores et al. 1984, USDA 1957-1975).
Stubble damage by AW is most common in the northern part of the
insect's range, where the species overwinters as an egg or adult. In
these areas, larval populations usually reach their peak about the time
of first cutting in early June. In a study of the season-long effects of
AW damage on alfalfa growth and yield under 2- and 3-cut systems, yield
was reduced significantly only during the second cutting of the 3-cut
system (Liu and Pick 1975). Many larvae were still active after the first
cutting and caused substantial stubble damage. Regrowth was delayed for
5 to 15 days, and damage was sufficient in one year to reduce second
growth yield by 31% and total seasonal yield by 17%. Fick (1976) sug
gested that stubble damage may be the most important management problem
of AW in the northern US.
Regrowth delays after the first, and sometimes second, cutting also
are reported from the southern and central Great Plains as a result of
stubble feeding by the variegated cutworm (USDA 1957-1975). Stubble
feeding by this species, however, has not been previously investigated.
47
A number of other defoliators also have the potential of damaging alfalfa
regrowth, including the armywonn, Pseudoletia unipxincta (Haworth), army
cutworm, Chorizagrotis auxiliaris (Grote), dingy cutworm, Feltia sub-
gothica (Haworth), and darksided cutworm, Euxoa messoria (Harris) (USDA
1957-1975, USDA 1979, Walkden 1950).
The effect of stubble feeding on alfalfa regrowth has not been
investigated extensively. Studies with AW (Liu and Pick 1975, Pick and
Liu 1976, Pick 1976), have found that herbage of damaged plants were
less mature, shorter in height, lower in dry weight, but greater in leaf
percentage, in vitro digestibility, and crude protein when compared with
undamaged plants. This increase in herbage quality did not offset the
loss in dry matter. Pick (1976) concluded that most differences in
herbage characteristics were the result of differences in herbage
maturity at the time of harvest. Although root carbohydrate levels of
damaged plants declined to similar levels as in undamaged plants, root
carbohydrate reserves did not recover as rapidly in delayed plants.
This effect persisted until the next cutting, but was not severe enough
to reduce regrowth during the following growth cycle.
No studies have specifically examined the response of component
growth rates and resource partitioning by alfalfa to insect-induced
regrowth delays. Reduced levels of available carbohydrates during
initial regrowth may alter subsequent rates of growth and partitioning
of dry matter in regrowth of damaged plants. Depending on the magnitude
of these alterations, initial losses could be ameliorated or magnified
at the following harvest. The present study was conducted to determine
the effect of insect-induced regrowth delays of various durations on the

48
subsequent rates of growth, development, and resource partitioning by
alfalfa.
MATERIALS AND METHODS
The experiment was conducted in a 1.7-ha field located on a Webster
silty clay loam (fine loamy, mixed, mesic Typic Haplaquoll) at the
Johnson Research Farm, 2.5 km south of Ames, Iowa. Alfalfa, Medicago
sativa L. 'Valor*, was drill-planted in 17.5-cm rows at the rate of
13.5 kg/ha of seed on 20 Aug., 1980. No fertilizer was applied at
planting, but top-dress applications of 135 kg/ha of phosphorous and
225 kg/ha of potassium were made during the spring of each year. The
experiment was conducted during the second and third growth cycles in
1981 and 1982. Trials were begun on 1 and 30 June in 1981 and on
1 June and 14 July in 1982. Trials in the same year were located at
adjacent sites within the field. Temperature and rainfall data were
obtained from a nearby National Oceanic and Atmospheric Administration
weather station (No. 0200 05) located 12 km west of the experimental
area.
Plots were established within 1 h after cutting. Stubble within
plots was clipped to a height of 7 cm, and excess trash and stubble was
raked from the plots. A split-plot design was used, with whole plots
consisting of duration of complete regrowth delay and split plots being
sample dates. Whole plots were arranged in a randomized complete-block
design with four replications during the first trial in 1981 and five
replications during the other trials. Whole plots were 1.5 m (7 rows)
by 3 m and were divided into six subplots, each measuring 0.36 (2 rows)
by 1.0 m. The two outer rows and the center row of each plot were
treated as border rows and were not harvested.
50
Insect damage sufficient to cause a complete delay of regrowth was
simulated by hand-picking all new herbage within plots every 2 days
beginning on day 1 (24 h after cutting). Foliage was picked off at the
point of attachment to the stubble or the soil surface. Picking con
tinued in a plot until the desired duration of damage was achieved.
The durations of damage were 0 (unpicked), 1, 3, 7, and 11 days post
cutting in all trials. A 5-day duration of damage treatment was
included in the second trial in 1982. Herbage that was picked from
plots damaged for 11 days was collected for dry weight determinations
during all trials.
A randomly selected subplot was harvested in each whole plot at 7,
14, 21, 28, 35, and 42 days after cutting during all trials, except the
first trial in 1981. The last 2 harvests were not taken during this
trial. Plots in all trials, except the first trial in 1981, were sprayed
with malathion (0,0-Dimethyl S-(l,2-dicardethoxyethyl) phosphorodithion-
ate) at the rate of 1.1 kg(AI)/ha 1 to 2 days after the 21-day harvest
for control of the potato leafhopper, Empoasca fabae (Harris). Subplots
were harvested with hand clippers by clipping all above-ground herbage.
Old dead stems, leaf litter, and weeds were removed from samples, and the
number of stems was counted on all sample dates in 1982 and at the final
harvests in 1981.
A representative subsample of 25 stems also was taken from each sub
plot for detailed analysis. Subsamples were processed in the laboratory
and the following parameters measured: stem height, developmental stage,
number of main-stem nodes (1982 trials), number of expanded leaves, leaf
area, leaf (including petioles and stem tips) dry weight, and support

51
structure (stem fraction) dry weight. Reproductive structures were
included with the support fraction, and leaf area measurements were made
with a Li-Cor® brand (Model 3000) leaf planimeter. Plant development
was expressed as percentage of stems with bud or flowers, and mean
developmental stage was calculated where 1 = vegetative, 2 = bud, 3 =
flower and 4 = pod. All samples and subsamples were dried for dry weight
measurements in a forced-air oven at 70®C for 72 h.
Statistical Analyses
Treatment differences in all plant variables were analyzed by sample
date and trial with an analysis of variance (ANOVA) and Duncan's Multiple
Range Test. Results of these analyses are contained in Appendix A. Over
all data trends were analyzed with regression techniques. Treatment
differences at any point in time, once regrowth began, were determined
by a combination of the initial reduction and subsequent changes in
plant growth rates. These two sources of loss were evaluated by gener
ating treatment-specific linear regression equations for each plant
parameter. Regressions were based on data from harvests when growth
was pre-bloom and linearly related to time (i.e., harvest dates 7
through 35). Initial losses were measured by the X-intercepts and are
expressed in days. Slopes were compared as a measure of subsequent
rates of growth and accumulation (Y) per unit of time (X). Because
plant responses may have been influenced by weather conditions during a
particular trial, X-intercepts and slopes were calculated for each trial,
and results were analyzed with an ANOVA using trials as replicates.
52
Treatment differences were separated with orthogonal contrasts where:
CI = 0, 1, and 3 versus 7 and 11; C2 = 7 versus 11; C3 = 0 and 1 versus
3; C4 = 0 versus 1. The 5-day duration of damage treatment in trial 2
in 1982 was not included in the analysis. Plant variables analyzed with
this approach were accumulation rates of stem height, leaves per stem,
2 leaf area index (LAI), and leaf, support, and total biomass (gm/m ).
Slope values of the last 4 variables represent leaf area growth rate
(LAGR), leaf growth rate (LGR), support growth rate (SGR), and crop
growth rate (CGR), respectively (Hunt 1978).
Regrowth delay effects on plant partitioning were assessed by calcu
lating the ratios of leaf area and leaf weight per unit of total dry
weight and the ratio of leaf area to leaf weight. These ratios are the
leaf area ratio (LAR), leaf weight ratio (LWR), and specific leaf area
(SLA), respectively, where LAR = LWR x SLA (Hunt 1978). Partitioning
ratios were estimated by slopes of regressions of the ratio's components
using data from pre-bloom harvests where plant dry weight and leaf area
increased linearly with time (i.e., harvest dates 7-35). Data from the
same harvest dates also were used to calculate the ratio of leaves per
unit dry weight (=leaf number ratio, LNR) and the area and weight per
leaf. Partition variables were calculated by treatment for each trial,
and analyzed as above with an ANOVA, using trials as replicates.

53
RESULTS
Precipitation was much below normal during the spring of 1981, which
resulted in reduced soil moisture levels at the beginning of both trials.
Deviations in rainfall from 30-year averages were -3.30, -8.86, and
-4.27 cm for April, May, and June, respectively. Weekly rainfall amounts,
however generally were adequate to prevent severe moisture stress during
trial 1 in 1981 (Table 4). Little rainfall during the first half of July
produced severe moisture stress during the first part of trial 2, which
began on July 1. Consequently, plant growth rates were suppressed during
this trial. Rainfall and soil moisture levels were near normal during the
spring of 1982, and moisture was adequate for normal growth during trial
1 in 1982. Although rainfall was erratic during trial 2 in 1982, soil
moisture levels were sufficient to prevent severe moisture stress during
this trial.
Initial Growth and Stem Initiation
Herbage picked at 2-day intervals from plots delayed for 11 days
revealed that herbage production was suppressed during the first 3 days
of regrowth (Fig. 2). The rate of herbage production increased from
day 3 to day 7 by a mean of 4.6 times in 1981 and 12.2 times in 1982.
The rate of herbage production leveled off after day 7. Although trends
were similar in all trials, regrowth occurred at a 2 to 2.5 times
greater rate in 1981 than 1982. Furthermore, a large amount of foliage
remained on the stubble immediately after both cuttings in 1981, but
little foliage was present after the cuttings in 1982. The reason for
54
Table 4. Summary of precipitation (cm) during weekly growth periods recorded for each trial^ in 1981 and 1982
Growth period mi 1982 (days)
Trial 1 Trial 2 Trial 1 Trial 2
0-7 0.89 1.98 0.61 6.30
8-14 0.23 0.84 0.89 0
15-21 3.02 0 4.32 0.33
22-28 6.25 6.73 0 4.27
29-35 - 1.98 2.34 0.05
36-42 - 6.25 7.75 0
^Trials were conducted during the second and third growth cycles in each year, respectively.
the reduction in growth rates between years is unknown, but differences
probably were caused, in part, by a reduction in plant vigor that typi
cally occurs during the second year of production (Smith 1975).
Trends in stem density, which was monitored during both 1982 trials,
generally were similar in all treatments once regrowth began (Fig. 3).
Stem density increased rapidly to a peak during the first 1 to 3 weeks
of regrowth and gradually declined from this peak at later harvests. The
minimal density needed for a full stand, 375 stems/m (Bula and Hintz
1978), was exceeded in all treatments. Significant reductions in stem
density occurred on sample dates 7, 14, and 21 in both trials. Peak stem
density, irrespective of date, was significantly (P < .05) reduced by
regrowth delays of 3, 7, and 11 days during trial 1 and by delays of 7
Figure 2. Dry matter production during the first 11 days of regrowth
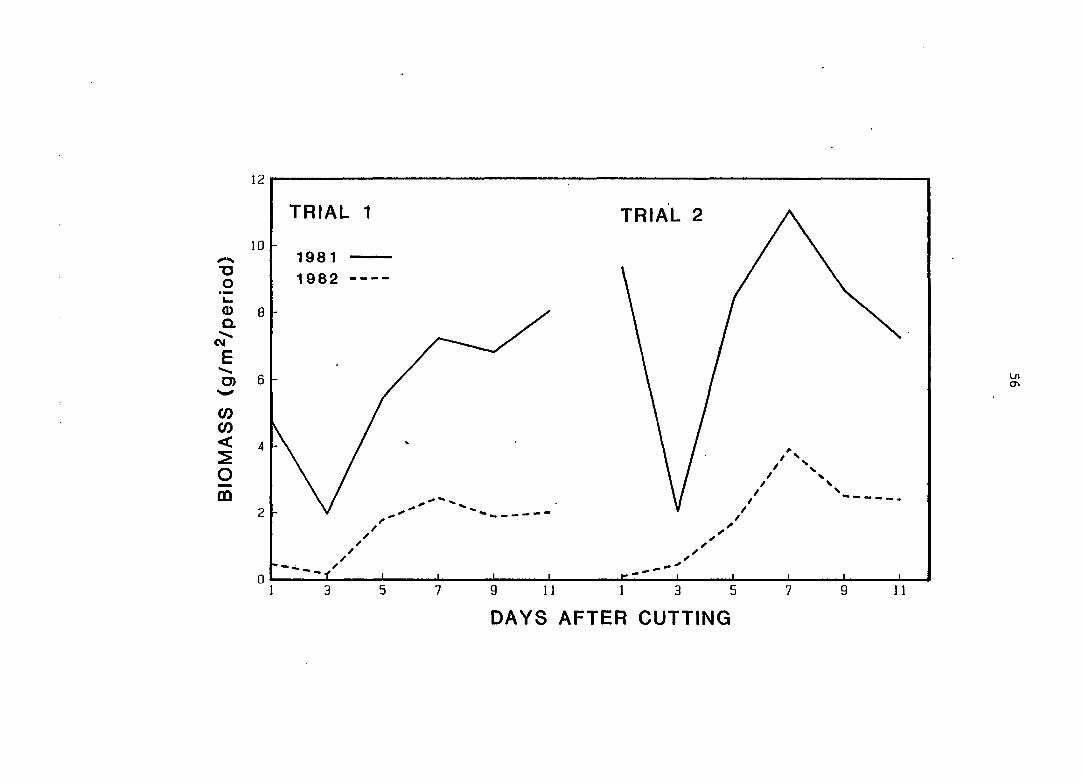
TRIAL 1 TRIAL 2
1981 1982
DAYS AFTER CUTTING
Figure 3. Effect of various periods (days) of regrowth delay on alfalfa stem density in 1982

1400 1400
TRIAL 2 TRIAL 1 1200 1200
1000 1000
K. ^ • 800 CO
800
S m H co
600 600
400 400
200 200
DAYS AFTER CUTTING
59
and 11 days during trial 2. Although peak stem density was reduced by
regrowth delays, except in one case, no significant treatment differ
ences in stem density occurred from day 28 until the final sample date
during either trial. Stem density at the final sample also was not
significantly different in trial 2 in 1981, but was significantly greater
in the 11-day treatment on day 28 (final sample) in the first trial in
1981 (date not shown). Consequently, large initial differences in stem
density were transitory and did not persist through the final sample.
Alfalfa Development and Morphology
Regrowth delays had a substantial effect on the developmental rates
of alfalfa. Differences in mean developmental stage were evident by day
14 in both 1981 trials and day 21 in both 1982 trials. Stand maturity
on all subsequent dates declined with the length of regrowth delay.
Except for trial 2 in 1982, the maturity of plants delayed for 0, 1, and
3 days was not significantly different from each other on the last three
sample dates of any trial. Development during trial 2 in 1982 was not
significantly affected by a 1-day delay, but was reduced by a 3-day delay
on all dates except the final sample. The maturity of plants damaged for
7 and 11 days was delayed significantly in all trials. Furthermore,
these treatments generally were significantly different from each other.
Differences in herbage production during the first 3 days of regrowth
suggest that a 1-day delay in regrowth may not coincide with a 1-day delay
in plant development. To explore this relationships, the number of days
from cutting to first bloom was used as a measure of the time required

60
to reach a particular developmental stage. Days to first bloom were
estimated by solving a linear or quadratic equation, whichever described
the data best, of percentage bloom against time. Results of this
analysis (Table 5) indicate that regrowth delays of 1 and 3 days did not
significantly increase the number of days to first bloom. Delays of 7
and 11 days caused a significant increase in days to first bloom, as
compared with nondefoliated plants. Plants defoliated for 11 days were
delayed significantly longer than 7-day defoliated plants in 3 of 4
trials. The mean increase in the number of days to bloom, however, was
less than the actual duration of damage. An average of 0.22, 1.15, 3.41,
and 8.46 extra days were required for bloom to occur in plants where
regrowth was delayed for 1, 3, 7 and 11 days, respectively. Therefore,
the 3-day regrowth delay treatment caused only a 1-day delay in first
bloom. Likewise, plants delayed for 7 and 11 days reached first bloom
approximately 3 days sooner than expected, based on the actual period of
defoliation.
The effects of regrowth delays on alfalfa biomass and LAI in 1982
are shown in Figures 4 and 5 (1981 data is not presented). Regrowth
delays caused substantial reductions in alfalfa biomass and LAI on most
sample dates. Both biomass and LAI increased linearly in all treatments
once damage had ceased. Absolute differences in biomass tended to remain
the same or increase over time. The rate of increase in LAI moderated
during the last growth period of each trial (except trial 1 in 1981) for
plants delayed for 0, 1, and 3 days. This lack of increase in LAI during
the last growth period probably reflects a combination of the reduced

61
Table 5. Predicted date (days after cutting) of first bloom for alfalfa with regrowth delays of various periods
Regrowth 1^81 1982 Delay (days)
Trial 1 Trial 2 Trial 1 Trial 2 Mean
0 21.00 22.98 35.30 26.05 26.33
1 21.58 23.83 35.30 25.49 26.55
3 22.46 24.25 35.44 27.78 27.48
7 28.00 25.47 35.58 29.91 29.74
11 30.41 28.49 40.25 39.54 34.66
Contrasts^
0-3 vs. 7-11 ** ** ** ** **
7 vs. 11 NS * ** irk •irX-
^Contrasts of 0, 1, and 3 days delays are not significant for any trial; NS = not significant; * and ** are significant at the .05 and •01 levels, respectively.
vegetative growth associated with the shift from vegetative to reproduc
tive phases of development and the senescence of older main-stem leaves
(Fuess and Tesar 1968, Nelson and Smith 1968a).
Analysis of Growth and Partitioning
Analysis of initial components of loss, as measured by X-intercepts,
is shown in Table 6. Delays of 1 and 3 days did not significantly affect
the X-intercepts of any plant variable. Delays of 7 and 11 days caused
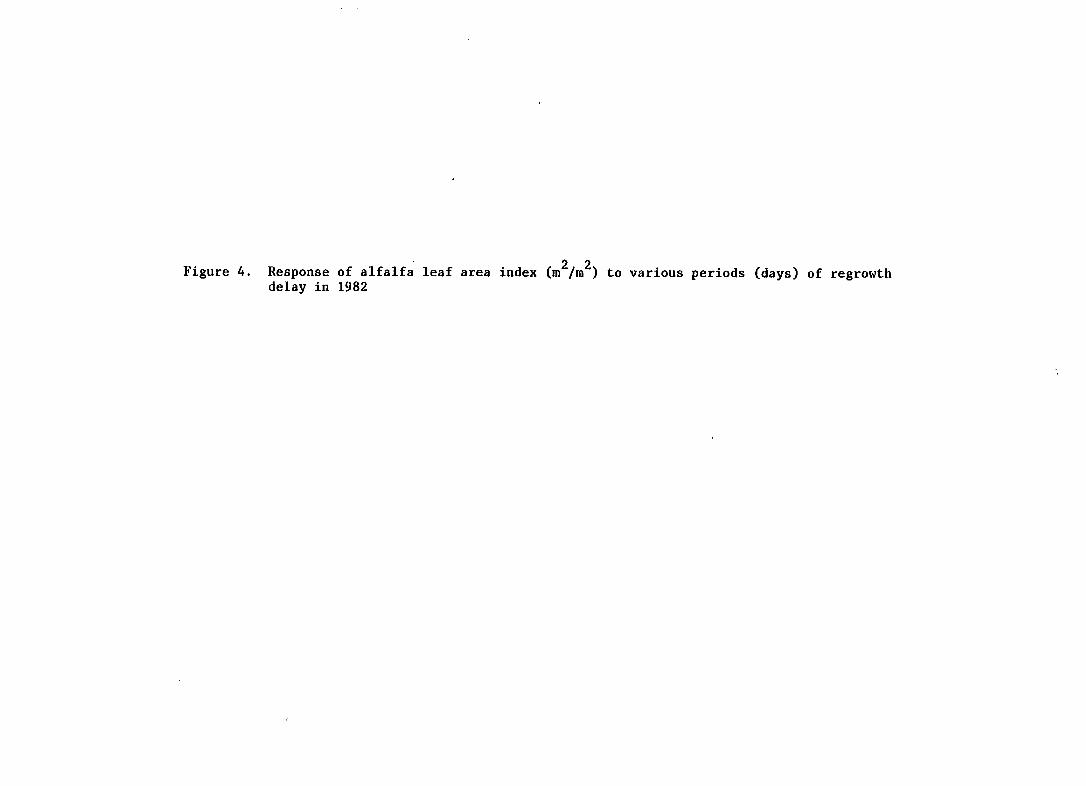
2 2 Figure 4. Response of alfalfa leaf area index (m /m ) to various periods (days) of regrowth
delay in 1982

X LU O
4.0
3.5 -
3.0 -
TRIAL 1 0 1 3
—-— 1 1 2.5 -
< LU 2.0 OC < U. 1.5 < LU
1 .0
0 . 0
4.0
3.5 -
3.0 -
2.5 -
35 42
TRIAL 2
ON U)
14 21 28 35
DAYS AFTER CUTTING

Figure 5. Response of alfalfa biomass (kg/ha) to various periods (days) of regrowth delay in 1982

5000 5000
TRIAL 1 TRIAL 2
4000 4000
1 1
CD 3000 3000
2000 2000
/ // 1000 1000
28 35 42 0 7
DAYS AFTER CUTTING
14 21 28 35 42

66
Table 6. Effects of various lengths of alfalfa regrowth delay on the X-intercepts from the regressions of six plant variables against time (days)
Regrowth Biomass delay Stem Leaves/ Leaf (days) height stem Leaf Support Total area
0 1.35 5.55 0.07 4.51 2.63 2.08
1 2.19 5.67 2.34 5.51 4.14 4.53
3 3.56 6.06 2.84 5.86 4.53 5.47
7 8.29 9.87 6.43 10.11 8.50 9.75
11 12.68 12.33 12.44 13.87 13.18 13.90
Contrasts^
0-3 vs 7-11 ** •k* ** •krC ** **
7 vs 11 -k •k* * •k •it •k
^Contrasts of 0, 1, and 3 days delay are not significant for any variable; * and ** are significant at the .05 and .01 levels, respectively.
significant (P < .01) increases in the X-intercepts of all plant variables,
when compared with the other treatments. Additionally, an 11-day delay
caused a significant (P < .05) increase in the X-intercept of all variables
as compared with a 7-day delay. These results suggest that regrowth delays
greater than 3 days were needed to cause significant initial losses in all
plant variables. Longer regrowth delays produced similar initial losses
in all measured plant parameters. The lack of effect on initial growth
caused by delays of 1 and 3 days probably is the result of the greatly
reduced rate of growth during the first 3 days of regrowth.

67
Table 7. Regrowth delay effects on the accumulation of stem height and leaves per stem and on leaf growth rate (LGR), support growth rate (SGR), crop growth rate (CGR), and leaf area growth rate (LAGR) of alfalfa
Regrowth Stem Leaves/ Biomass (gm/n i^/day) LAGR delay (days)
height (cm/day)
stem (No/day) LGR SGR CGR (m^/m^/day)
0 1.444 1.298 0.0467 0.0656 0.1123 0.1074
1 1.419 1.202 0.0484 0.0655 0.1139 0.1170
3 1.437 1.185 0.0466 0.0625 0.1091 0.1116
7 1.515 1.197 0.0440 0.0591 0.1032 0.1160
11 1.548 0.956 0.0447 0.0469 0.0916 0.1168
Contrasts^
0-3 vs 7-11 NS ** NS ** ** NS
7 vs 11 NS ** NS * . NS NS
^Contrasts of 0, 1, and 3 days delay are not significant for any variable; NS = not significant; * and ** are significant at the .05 and .01 levels, respectively.
The effects of simulated regrowth delays on the subsequent rates of
accumulation are shown in Table 7. Delays in regrowth had no significant
effect on subsequent rates of accumulated stem height. The same also
was true for nodes per stem during the two trials in which this variable
was measured (data not shown). The accumulation rate of leaf number per
stem, however, declined significantly when regrowth was delayed for 7
and 11 days. Because the number of main-stem nodes was not affected by
regrowth treatments, the reduction in the accumulation rate of leaves

68
per stem probably was caused by a reduction in axillary leaf production
and branching.
Increasingly longer regrowth delays caused proportional reductions
in CGR (Table 7). Delays of 7 and 11 days significantly reduced CGR
when compared with shorter delays. The reduction in CGR between delays
of 7 and 11 days, however, was not statistically significant. Almost
all of the reduction in CGR was attributable to a decline in SGR. Delays
of 7 and 11 days significantly reduced SGR, and the difference in SGR
between these treatments also was significant. Leaf growth rate was not
significantly affected by any treatment. An 11-day delay caused a
decline of 4.3% in LGR and 28.5% in SGR compared with an 18.4% reduction
in CGR. As with LGR, LAGR was not significantly affected by any treatment,
and LAGR was actually 8.8% greater in plants delayed for 11 days than in
nondefoliated plants.
The greater deleterious effect of regrowth delays on SGR than LGR
and LAGR suggests that damaged plants may partition resources differently
than undamaged plants. Trends in LAR, LVJR, and SLA confirm this sugges
tion (Table 8). Although delays of 1 and 3 days had no significant
effect on LAR, LWR, or SLA, delays of 7 and 11 days significantly in
creased LAR by 21.3 and 34.5%, respectively. The increase in LAR between
the 7 and 11 day treatments also was significant. Delays of 7 and 11
days also significantly enhanced LWR and SLA. An 11-day delay caused LWR
and SLA to increase by 16.3 and 15.5%, respectively. Therefore, LAR was
enhanced by a combination of an increase in both LWR and SLA. In other
words, plants delayed for more than 3 days produced greater leaf area per
unit of dry weight by increasing leaf weight at the expense of support

69
weight and by producing greater leaf area per unit of leaf weight. The
latter consequence results in thinner, less dense leaves. The component
growth analysis, however, indicated that the decline in LWR was the
result of a reduction in support weight relative to leaf weight production
rather than an increase in leaf weight per se.
The increase in LWR (i.e., the maintaince of leaf weight production
in delayed plants) could be accomplished by producing more leaves per
unit of dry weight (i.e., greater LNR) or by producing larger leaves.
Leaf number ratio was not significantly different for any treatment,
thus, leaf production declined in direct proportion with total dry
weight (Table 8). Area and weight per leaf, however, increased signifi
cantly in plants delayed for 7 and 11 days, although area was enhanced
more than weight. This would be expected because of the increased SLA
in plants delayed for more than 3 days. Therefore, LWR increased by the
production of larger leaves rather than the production of more leaves
per unit of dry weight.

70
Table 8. Effects of various lengths of regrowth delay on alfalfa leaf area ratio (LAR), leaf weight ratio (LWR), specific leaf area (SLA), leaf number ratio (LNR), and area and weight per leaf
Regrowth delay (days)
LAR
2 (cm /gm)
LWR
(gm/gm) •
SLA
2 (cm /gm)
LNR
(No/gm)
Area/ leaf (cm )
Weight/ leaf (mg)
0 94.8 0.415 227.0 56.89 1.77 7.71
1 102.1 0.416 241.1 57.85 1.83 7.54
3 101.1 0.420 239.0 58.89 1.81 7.40
7 115.0 0.436 260.8 58.24 2.11 7.93
11 127.4 0.482 262.2 56.16 2.34 9.18
Contrasts^ 0-3 vs 7-11 ** ** ** NS ** -JWr
7 vs 11 * ** NS NS * **
^Contrasts of 0, 1, and 3 days delay are not significant for any variable; NS = not significant; * and ** are significant at the .05 and .01 levels, respectively.
71
DISCUSSION
Complete regrowth delays of 1 and 3 days caused no significant
initial loss in any plant variable, as measured by X-intercepts. Further
more, subsequent rates of growth and partitioning were not significantly
affected by these treatments. The lack of effect of these delays
probably is a consequence of the low rate of crop growth during the first
3 days of regrowth. Herbage production was substantially greater after
the third day, and growth rates remained elevated until the eleventh day.
The 3-day lag in regrowth occurred in all 4 trials. Plants delayed for
more than 3 days seemed to produce herbage at the higher rate of produc
tion immediately, thereby, avoiding the initial 3-day lag in regrowth.
Previous studies (Pearce et al. 1969, Vance et al. 1979) of carbon
flow in alfalfa following cutting have found approximately a 3-day lag
in root carbohydrate mobilization following cutting. Starch levels and
14 percentage of C in taproots declined sigmoidally after cutting, with
the latter showing a decline of only 4% from day 0 to 3 and a 9% decline
from day 3 to 6 (Pearce et al. 1969). Stored root starch did not decline
significantly until the sixth day of regrowth. Pearce et al. interpreted
these findings as indicating that approximately 3 days were needed for the
plant to switch from starch synthesis before cutting to starch degrada
tion and mobilization following cutting. During this time, proteins
needed for stored carbohydrate mobilization and utilization were being
produced. This lag time in carbohydrate mobilization may explain the
approximately 3 days of low herbage production observed in the present
study. It is also possible that basal and axillary buds simply may
require several days to develop and initiate new growth.
72
Complete delays in regrowth of more than 3 days significantly
delayed plant development and caused significant initial reductions in
all plant parameters. Plant development, however, was delayed less than
expected based on the actual length of defoliation. Again, this probably
was the result of the reduced growth rate during the first 3 days. This
damage also was sufficient to reduce subsequent growth rates and alter
resource partitioning. Initial reductions in support and total biomass
and leaves per stem were magnified further by significant declines in
the rates of production of these components. Although CGR was sup
pressed, most of the reduction in biomass production was caused by a
decline in the support component growth rate. The leaf component was
not significantly affected, and the production rate of LAI actually
increased slightly in regrowth-delayed plants. Defoliation of more than
3 days, however, resulted in reduced leaf density. This would have the
effect of enhancing the area available for light interception without a
concomitant increase in leaf biomass. Alfalfa, therefore, minimized the
adverse effects of insect-induced regrowth delays by maintaining leaf
area and leaf-weight growth rates at the expense of the support struc
ture component of growth.
The differential effects on component growth rates and plant
partitioning in plants delayed for more than 3 days may be, at least in
part, the result of an alteration in carbohydrate source-sink relation
ships. In undamaged plants, two sources of carbohydrates are normally
available for regrowth; stored root reserves and photosynthates produced
by current photosynthesis. Although current photosynthates will be
used preferentially during regrowth (Hodgkinson 1969), relatively low
73
availability of this source necessitates the use of stored reserves as
the primary source of carbon for about the first 3 weeks of regrowth
(Hodgkinson 1969, Pearce et al. 1969, Smith and Marten 1970). Hodgkinson
(1969), however, found that new leaves import stored carbon only during
the first week or so of regrowth. Leaves generally become self-
sufficient after this time and begin exporting photosynthates. Support
structures, on the other hand, continue to rely on stored carbon for
about 21 days. After this time, stored carbohydrates are reduced and
support structures must rely mainly on current photosynthates for growth.
It is probable that subsequent regrowth, in plants where regrowth
is delayed for 8 to 10 days, would occur without the benefit of large
amounts of stored carbohydrates. The primary carbohydrate source for
regrowth most likely would be shifted from stored carbohydrates to cur
rently produced photosynthates. Consequently, leaf growth by delayed
plants should be affected much less than support growth because:
(1) leaves, in comparison with support structures, require relatively
little imported carbohydrate, and, (2) sources (i.e., leaves) generally
will meet their own needs before exporting assimilates (Cook and Evans
1978). Support growth, however, would be suppressed because of the low
availability of stored carbohydrates and inability of current photo
synthesis to make up the difference. Thereby, leaf growth rates are
maintained while support structure growth rates suffer.
74
PART III. DRY MATTER ACCUMULATION, PARTITIONING AND
DEVELOPMENT OF ALFALFA REGROWTH AFTER STUBBLE
INJURY BY THE VARIEGATED CUTWORM

75
ABSTRACT
The impact of stubble feeding by the variegated cutworm (VCW),
Peridroma saucia (Hubner), on alfalfa growth, development, and dry matter
partitioning during the second growth cycle was investigated in a 3-year
2 study. Densities of 6 or greater larvae/0.1 m completely suppressed
regrowth and caused significant delays in the development of subsequent
regrowth. Lower densities only partly suppressed regrowth and did not
consistently delay plant development. Larval damage produced large
reductions in stem density during the first 2 to 3 weeks of regrowth,
but these reductions were transitory and did not persist after the third
2 week. Densities of 1.5 and 3 larvae/0.1 m did not consistently affect
growth rates or partitioning of subsequent regrowth. Densities of 6 or
2 greater larvae/0.2 m caused regrowth to produce stem height at a sig
nificantly faster rate. The rate of production of main-stem nodes was
not affected, and the production of leaves per stem declined signifi
cantly. Larval damage also suppressed daily rates of dry matter produc
tion. Most of this reduction, however, was caused by a reduction in the
support component of growth. Leaf growth rate was not suppressed, and
leaf area production actually increased in severely defoliated treatments.
Damaged plants produced more leaf area per unit of total dry weight
through relative increases in both leaf weight per unit of total dry
weight and leaf area per unit of leaf weight. Damaged plants seemed to
minimize the adverse effects of VCW stubble feeding by maintaining growth
rates of leaves at the expense of support structures.

76
INTRODUCTION
The variegated cutworm (VCW), Peridroma saucia (Hiibner), is a pest
of a large number of vegetable, ornamental, field, and forage crops
(Chittenden 1901, Crumb 1929, Rings et al. 1976b). In the southern and
central Great Plains, VCW can cause considerable damage to alfalfa by
feeding on new regrowth soon after cutting (Soteres et al. 1984, USDA
1957-1975). If sufficient numbers of larvae are present, stubble
feeding by VCW may cause partial or complete delays of regrowth for
several days to two weeks or more. VCW phenology is such that many
larvae are near maturity when the first cutting is taken in early June.
Stubble damage, therefore, usually occurs after the first cutting, but
regrowth delays also have been reported after the second cutting in some
years (USDA 1975).
The impact of stubble feeding by insects on alfalfa growth and yield
has received little attention, and no studies have specifically investi
gated stubble injury by VCW. Several studies (Fick 1976, Pick and Liu
1976, Liu and Fick 1975) have investigated stubble injury by the alfalfa
weevil (AW), Hypera postica (Gyllenhal). Regrowth damage by AW primarily
is a problem in the northern part of the insect's range. In these
areas, AW overwinters mostly in the egg stage, and larval populations
usually reach a peak about the time of the first harvest. A study of
the season-long effects of AW on alfalfa in New York found that AW
significantly reduced yield only during the second growth of a 3-cut
system (Liu and Fick 1975). Yield loss was the result of stubble feeding
by larvae after the first cutting. Regrowth was delayed from 5 to 15
77
days, causing second cut and total seasonal yields reductions of 31 and
17%, respectively.
In a companion study of AW stubble injury (Fick 1976), yield losses
increased with larval density up to a plateau, above which greater
densities did not cause additional yield losses. Herbage of delayed
plants was less mature, shorter in height, and lower in dry weight, but
was greater in leaf percentage, in vitro digestibility, and crude protein.
The increase in quality was small and not sufficient to offset the loss
in dry weight. Fick attributed most of the differences in herbage of
defoliated and nondefoliated plants to the relative differences in
herbage maturity at harvest.
Stubble feeding by VCW also could have a large impact on alfalfa
regrowth. The stress of VCW-induced stubble injury also may alter
subsequent rates of growth and partitioning by alfalfa. Therefore, a
study was conducted to determine the effects of .stubble feeding by VCW
on alfalfa regrowth. Presented here are the results of the effects on
rates of growth, development, and resource partitioning by alfalfa.
78
MATERIALS AMD METHODS
A stand of 'Valor' alfalfa, Medicago sativa L., vas seeded on
20 August, 1980 in a field located 3 km south of Ames, Iowa. Seed was
drill-planted in 17.5-cm rows at the rate of 13.5 kg/ha. No fertilizer
was applied at planting, but fertilizer was top dressed with 135 kg/ha
of P and 225 kg/ha of K before growth in each year. Except when studies
were conducted, the field was maintained with management practices typical
for central Iowa. Malathion (0,0-Dimethyl S-(l,2-dicarbethoxyethyl)
phosphorodithionate) was applied as needed at the rate of 1.1 kg(AI)/ha
to control AW during the first cutting. Malathion also was applied at
the same rate after VCW feeding had ceased to control the potato leaf-
hopper, Empoasca fabae (Harris). Temperature and rainfall data were
obtained from a National Oceanic and Atmospheric Admin, weather station
(No. 0200 05) located 12 km west of the experimental area.
Plots measuring 1.5 m (7 rowsX by 4 m were established immediately
after cutting on 10 June, 1981, 1 June, 1982, and 14 June, 1983. Plots
were clipped to a height of 7.5 cm. Excess trash and stubble were raked
from the plots. After cutting, each plot was enclosed with a 45-cm
aluminum barrier using the procedure employed by Showers et al. (1983).
Barriers were implanted to a depth of 15 cm by digging a trench with a
mechanical trencher, and care was taken to throw soil away from plot
areas. The following evening, plots were infested with various densities
of larvae. Larvae for all studies were progeny of feral adults that
were collected with modified blacklight traps during the spring of each
year. Groups of 25 larvae were reared in 470-ml cartons on a modified

79
artificial diet of Shorey and Hale (1965), where lima beans were sub
stituted for pinto beans (Harper 1970). All larvae, however, were
transferred to a diet of fresh alfalfa foliage 3 to 4 days before infes
tation. Initial rearing conditions were 24 ± 0.5°C, but as larval
development progressed, temperature was varied so that most individuals
were newly molted, last stage (6 or 7) larvae at the time of infestation.
A split-plot experimental design was employed where whole plots
consisted of larval densities and subplots were samples over time. Whole
plots were arranged in a randomized complete-block design with 5 blocks
in 1981 and 1982, and 4 blocks in 1983. Larval densities were 0, 1.5, 3,
2 6, 9, and 12 larvae/0.1 m in all years, except in 1981 when the 1.5
2 2 larvae/0.1 m density was not used, and in 1983 when the 12 larvae/0.1 m
density was not used. These densities were chosen to represent the full
range of VCW densities reported to infest alfalfa stubble (USDA 1957-
1975).
In 1981 and 1982, whole plots were divided into four subplots
2 measuring 0.36 m (2 rows) by 1.5 m (0.53 m ). The outer two rows and the
center row of each plot were not sampled as part of the subplots. After
larval feeding ceased, one subplot was harvested weekly beginning on day
14 in 1981 and day 21 in 1982. All above-ground herbage was clipped with
hand clippers and returned to the laboratory. Dead stems, leaf litter,
and weeds were separated from the herbage, and stem density and dry weight
were measured. A representative subsample of 25 stems was taken from
each subplot for detailed measurements. In 1982, stem density also was
measured nondestructively in the 21-day sample subplot on days 4, 8, 12,
and 16 after cutting. Additionally, if regrowth was present, a sub-

80
sample of 25 stems was taken from areas between subplots on days 8, 12,
and 16 after cutting.
The split-plot portion of the study was modified in 1983 to specifi
cally examine the interaction between VCW stubble feeding and subsequent
2 weed populations. Whole plots were divided into three 1.0 m subplots.
Two subplots were hand-weeded at 21 days after cutting, and natural weed
populations were allowed to develop in the third subplot. Alfalfa
regrowth was monitored weekly beginning on day 7 in one of the weeded
subplots by taking a representative sample of 25 stems. Plant develop
ment, shoot dry weight, and forage quality were determined from these
samples. Stem density also was measured nondestructively in a randomly
chosen half of the other weeded subplot. Weekly yields were estimated
from these data, and final yield was determined on day 35 by harvesting
the nondestructively sampled subplot. The subplot containing weeds also
was harvested on day 35, but the results of the weed interaction portion
of the study will not be presented here.
Subsamples for detailed measurements were processed similarly in all
years. Parameters measured were stem height, number of main-stem nodes
per stem (1982 and 1983), number of expanded leaves, leaf area, and
average stage of morphological development (where 1 = vegetative, 2 = bud,
3 = flower, and 4 = pod). Leaf area was measured with a LiCor® model 3000
leaf area planimeter. Subsamples were separated into leaf (including
petioles and stem tips) and support fractions to determine their separate
dry weights. All herbage was dried in a forced-air oven at 70°C for 72
hours.
81
Statistical Analyses
All plant parameters were analyzed by year and sample date with and
analysis-of-variance (ANOVA) and subsequent Duncan's Multiple Range Test."
Parameter means and results of these analyses are contained in Appendix B. .
An overall ANOVA was conducted by year for plant variables that were
linearly related to time. Data used in these analyses were from harvest
dates 14 (day 16 in 1982) through day 35 for all years. The design was
a split plot, where whole-plot treatment differences were elucidated by
orthogonal comparisons. Contrasts used to separate differences in
larval densities were: CI = 0-6 versus 9-12, C2 = 9 versus 12, C3 = 0-3
versus 6, C4 = 0-1.5 versus 3, and C5 = 0 versus 1.5. Contrast C2 was
not used in 1983, and C5 was not used in 1981. The linear effect of
sample date was examined at the split-plot level, and the orthogonal
treatment contrasts by day-linear effects were examined in the interac
tion. The interaction analysis tested for differences in linear trends
(slopes) of treatments over time.

82
RESULTS
Alfalfa growth rates were suppressed somewhat in 1981 because of
below normal soil-moisture levels and less than average precipitation
during the first part of the study (Table 9). Rainfall in 1982 and 1983
was near normal or excessive before and during the time both studies
were conducted. Consequently, little moisture stress was evident during
1982 and 1983. Mean deviation from 30-year averages in rainfall from
April through June was -16.13, -1.96, and +5.60 cm in 1981, 1982, and
1983, respectively.
Damage Syndrome and Stem Initiation
Larval feeding occurred for ca. 12 days in 1981 and 1983 and for
2 about 14 days in 1982. Densities of 9 and 12 larvae/0.1 m consistently
caused complete delays in regrowth in all years. Few new shoots grew in
these plots while feeding occurred, and the few shoots that did grow
were severely damaged. Feeding scars also were present on the old
2 stubble. Densities of 1.5 and 3 larvae/0.1 m caused partial damage to
regrowth in all years. Feeding evidence on most shoots was reflected as
wholly or partly missing leaves and leaflets. Damage, however, usually
was not severe enough to cause noticeable stunting of the shoots. Densi-
2 ties of 6 larvae/0.1 m produced intermediate results in that regrowth
was completely delayed in some plots, whereas others had some regrowth
present while defoliation was occurring. Shoots that did grow, however,
were severely damaged. Most leaf lamina were absent, and shoots were
severely stunted, with the apical meristem often removed. Larval feeding
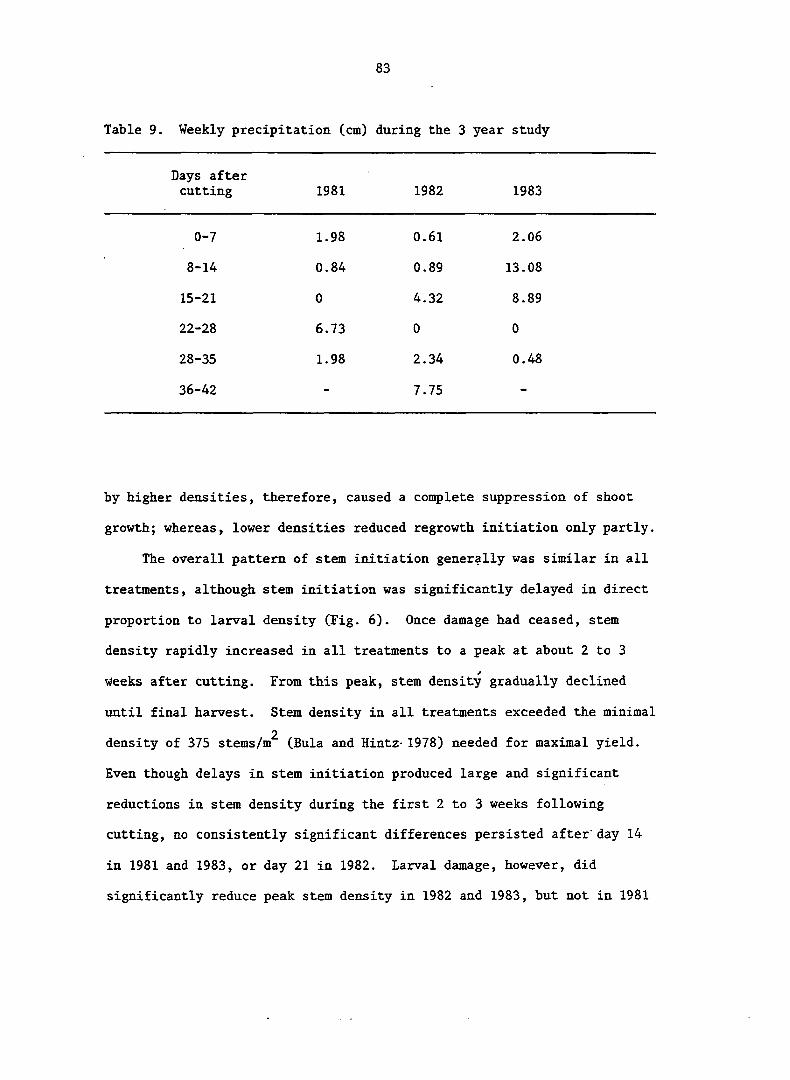
83
Table 9. Weekly precipitation (cm) during the 3 year study
Days after cutting 1981 1982 1983
0-7 1.98 0.61 2.06
8-14 0.84 0.89 13.08
15-21 0 4.32 8.89
22-28 6.73 0 0
28-35 1.98 2.34 0.48
36-42 - 7.75 -
by higher densities, therefore, caused a complete suppression of shoot
growth; whereas, lower densities reduced regrowth initiation only partly.
The overall pattern of stem initiation generally was similar in all
treatments, although stem initiation was significantly delayed in direct
proportion to larval density (Fig. 6). Once damage had ceased, stem
density rapidly increased in all treatments to a peak at about 2 to 3
Weeks after cutting. From this peak, stem density gradually declined
until final harvest. Stem density in all treatments exceeded the minimal
2 density of 375 stems/m (Bula and Hintz- 1978) needed for maximal yield.
Even though delays in stem initiation produced large and significant
reductions in stem density during the first 2 to 3 weeks following
cutting, no consistently significant differences persisted after" day 14
in 1981 and 1983, or day 21 in 1982. Larval damage, however, did
significantly reduce peak stem density in 1982 and 1983, but not in 1981

2 Figure 6. Effect of stubble injury by various densities (larvae/0.1 m ) of variegated cutworms on
alfalfa stem density
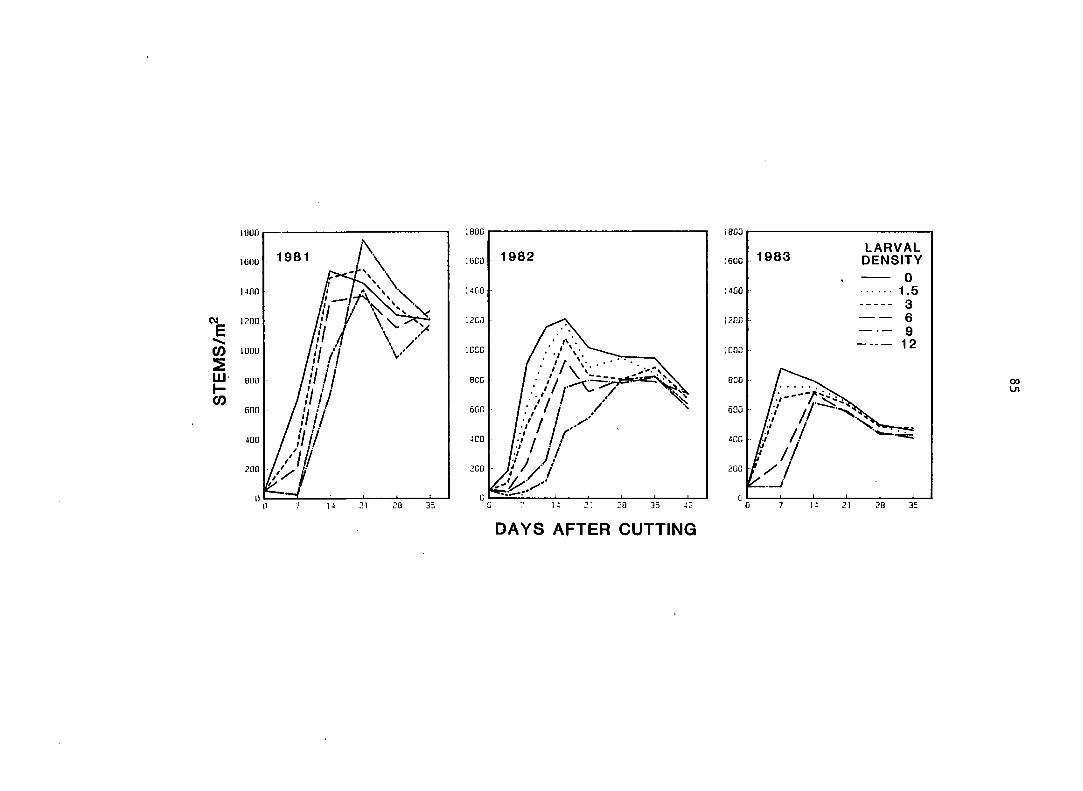
1981
;Bflo
1982
•.4C0
:ccc
BCC
6CC
4C0
2C0
28
DAYS AFTER CUTTING
,800
LARVAL DENSITY . 1983
MOO
1200
1 2
600
4CC
200
28
86
(Table 10). The lack of effect in. 1981 probably was caused by the
increased plant vigor during the first production year (Smith 1975). The
reduction in vigor between years also is evident in the mean stem density
2 in all plots at final harvest (1683, 1040, and 750 stems/m for 1981,
1982, and 1983, respectively). The reduction in peak stem density by
larval defoliation may lessen a stand's ability to tolerate subsequent
stresses.
Plant Development and Morphology
VCW damage had a substantial effect on mean stage of plant develop
ment (Table 11). Developmental differences, however, were not evident
until day 14 in 1981 and 1983 and day 28 in 1982. In all samples after
these dates, plant maturity decreased with increasing larval density.
2 Maturation of plants in the 6, 9, and 12 larvae/0.1 m treatments was
delayed significantly in all years as compared with nondefoliated plants.
The two largest densities, however, were not significantly different from
each other during either year. Nondefoliated plants were more mature
than plants in all other treatments on days 21 and 35 in 1981, but were
2 not different from the 3 and 6 larvae/0.1 m treatments on day 28 in
that year. In 1982, nondefoliated plants were significantly more mature
than plants in all other treatments on days 28 and 42, but were similar
2 to plants in the 1.5 and 3 larvae/0.1 m treatments on day 35. Except
2 for one instance, plants in the 1.5 and 3 larvae/0.1 m treatments were
not significantly less mature than nondefoliated plants on any date in
2 1983. Consequently, the 1.5 and 3 larvae/0.1 m densities caused some
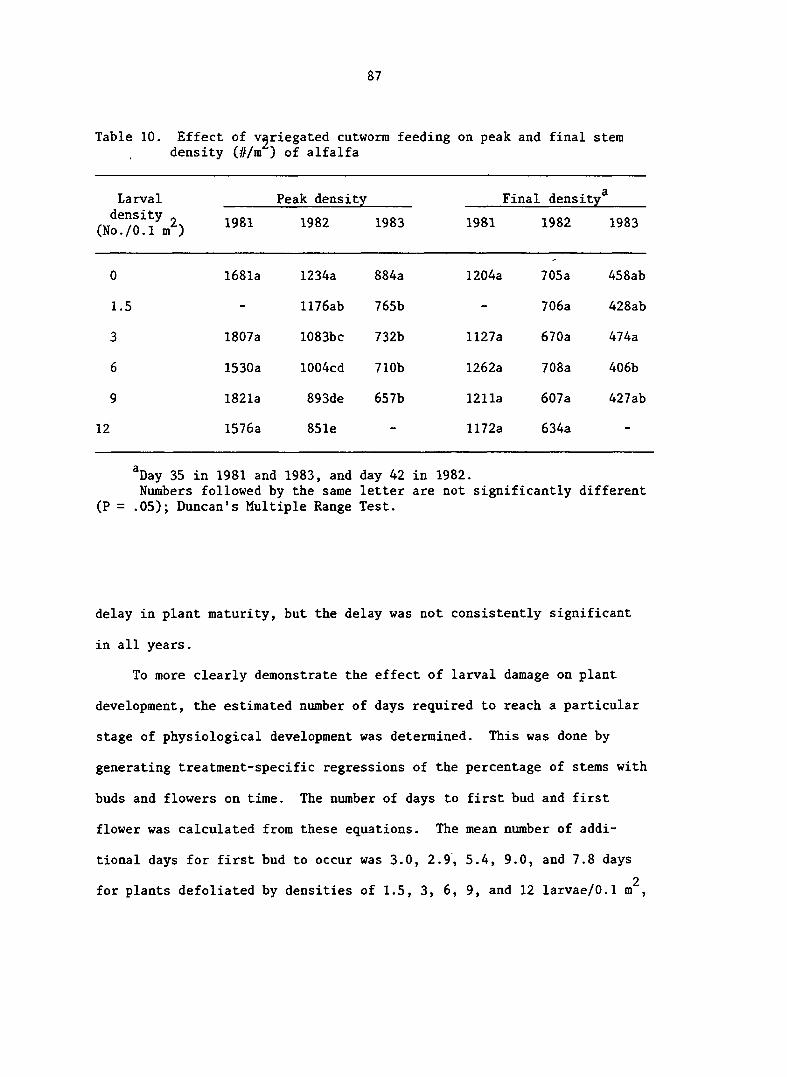
87
Table 10. Effect of variegated cutworm feeding density (#/m ) of alfalfa
on peak and final stem
Larval Peak density Final density* 1
1982 1983 1981 1982 1983
0 1681a 1234a 884a 1204a 705a 458ab
1.5 - 1176ab 765b - 706a 428ab
3 1807a 1083bc 732b 1127a 670a 474a
6 1530a 1004cd 710b 1262a 708a 406b
9 1821a 893de 657b 1211a 607a 427ab
12 1576a 851e - 1172a 634a -
*Day 35 in 1981 and 1983, and day 42 in 1982. Numbers followed by the same letter are not significantly different
(P = .05); Duncan's Multiple Range Test.
delay in plant maturity, but the delay was not consistently significant
in all years.
To more clearly demonstrate the effect of larval damage on plant
development, the estimated number of days required to reach a particular
stage of physiological development was determined. This was done by
generating treatment-specific regressions of the percentage of stems with
buds and flowers on time. The number of days to first bud and first
flower was calculated from these equations. The mean number of addi
tional days for first bud to occur was 3.0, 2.9, 5.4, 9.0, and 7.8 days
2 for plants defoliated by densities of 1.5, 3, 6, 9, and 12 larvae/0.1 m ,
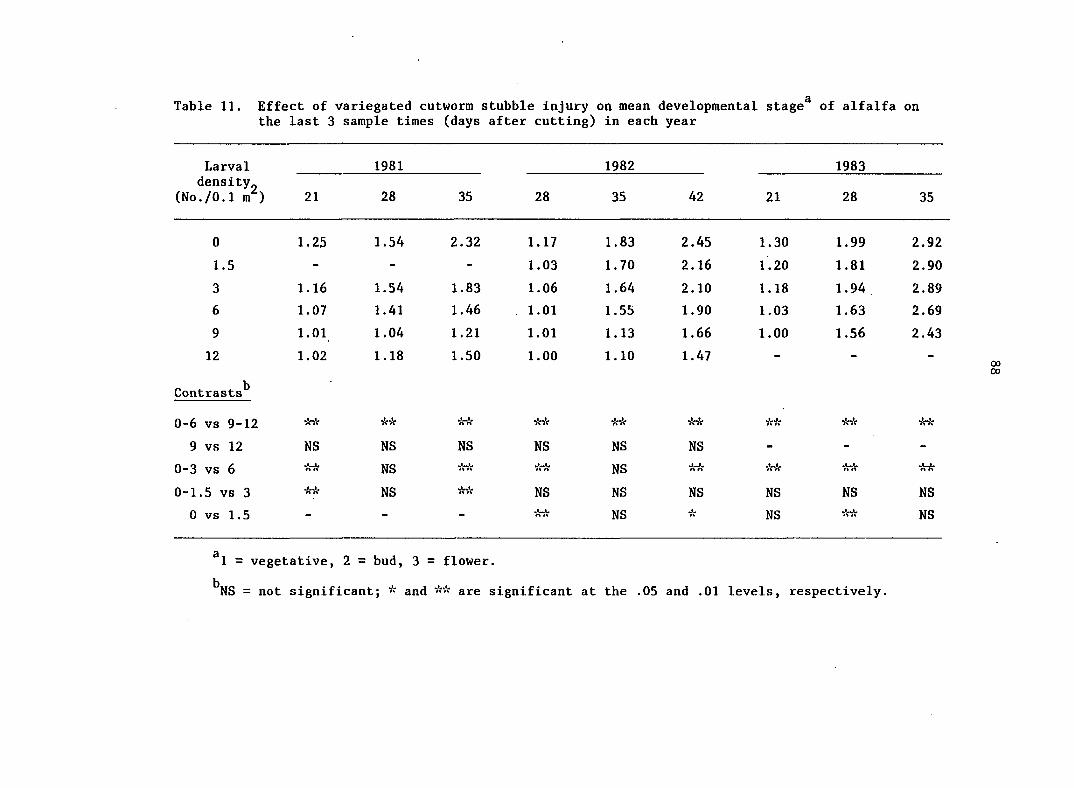
Table 11. Effect of variegated cutworm stubble injury on mean developmental stage^ of alfalfa on the last 3 sample times (days after cutting) in each year
Larval 1981 1982 1983 density.
(No./O.l 21 28 35 28 35 42 21 28 35
0 1.25 1.54 2.32 1.17 1.83 2.45 1.30 1.99 2.92
1.5 - - - 1.03 1.70 2.16 1.20 1.81 2.90
3 1.16 1.54 1.83 1.06 1.64 2.10 1.18 1.94 2.89
6 1.07 1.41 1.46 . 1.01 1.55 1.90 1.03 1.63 2.69
9 1.01 1.04 1.21 1.01 1.13 1.66 1.00 1.56 2.43
12 1.02 1.18 1.50 1.00 1.10 1.47 - - -
Contrasts^
0-6 vs 9-12 'k-k ** ** ** ** VR* ** ** •Sfk
9 vs 12 NS NS NS NS NS NS - - -
0-3 vs 6 VNV NS ** ** NS ** ** VVIV **
0-1.5 vs 3 ** NS ** NS NS NS NS NS NS
0 vs 1.5 - - - VwV NS NS ** NS
= vegetative, 2 = bud, 3 = flower.
^NS = not significant; " and are significant at the .05 and .01 levels, respectively.

89
respectively. Likewise, the mean number of extra days for first flower
to occur was 0.8, 2.2, 4.7, 8.5, and 10.7 days, respectively. Typically,
2 the delay caused by densities of 1.5 and 3 larvae/0.1 m was not statisti
cally significant for all years. Damage by higher larval densities did
significantly delay maturity in most years.
VCW stubble feeding caused significant reductions in all stem-
related variables, which include stem height, leaves per stem, and main-
stem nodes per stem. The overall response of variables to specific
treatment combinations was reflected in the whole plot portion of the
ANOVA. Orthogonal contrasts CI (0-6 vs. 9-12) and C3 (0-3 vs. 6) were
highly significant (P < .01) in all years for all three variables. Con-
2 trast (C2) of the 9 and 12 larvae/0.1 m treatments also was significant
for all three variables in 1982, but this contrast was not significant
for any variable in 1981. Contrasts C4 (0-1.5 vs. 3) and C5 (0 vs. 1.5)
were not consistently significant in all years for any stem variable.
Therefore, averaged across all dates, densities of 1.5 and 3 larvae/0.1
2 m did not reduce height, nodes, or leaves per stem. Densities of 6 and
2 greater larvae/0.1 m significantly reduced all three stem-related
variables.
The trends in stem variables also were apparent in the analysis of
yield and leaf area index (LAI). Both variables increased linearly over
time in all treatments (Figs. 7 and 8), but yield and LAI generally were
suppressed significantly in all years only by densities of 6, 9, and
2 12 larvae/0.1 m . Neither variable, however, was significantly differ
ent between the 2 highest densities (contrast C2). Densities of 1.5 and

Figure 7. Effect of stubble injury by various densities (larvae/0.1 m^) of variegated cutworms .on alfalfa leaf area index
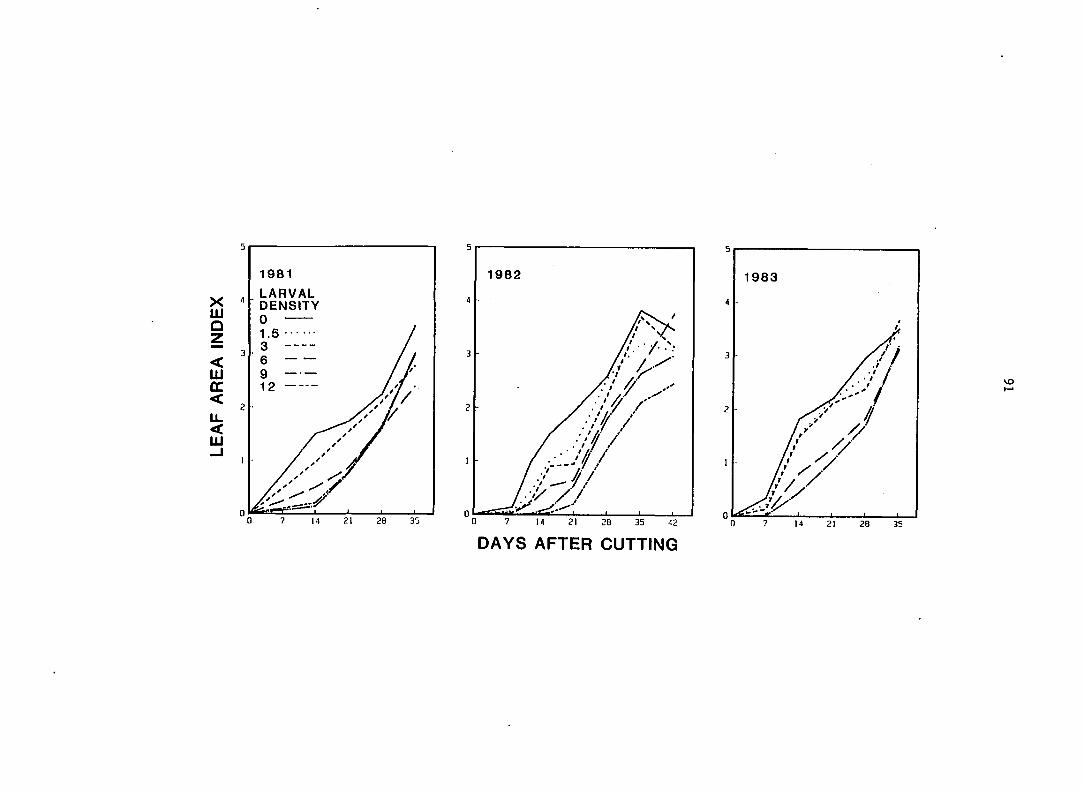
5
1981
LARVAL DENSITY
4
3
12
2
0 0 28
1982
0 7 14 21 28 35
5
1983
4
3
2
0 0 28
DAYS AFTER CUTTING
2 Figure 8. Effect of stubble injury by various densities (larvae/0.1 ra ) of variegated cutworms on
alfalfa biomass
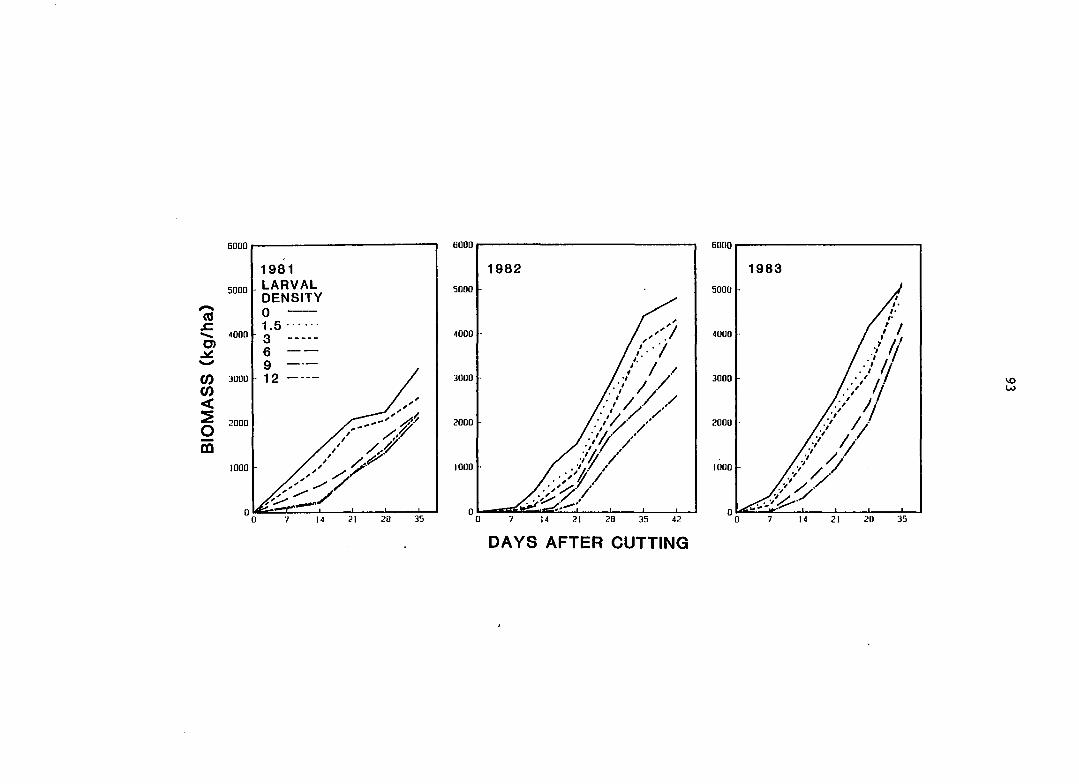
6000
5000
4000
(0 sz — O)
(0 3000
CO <
1981 LARVAL DENSITY 0 1.5 3 6 9 12
o CO
2000
1000 y _i I I I
14 21 28 35
6000
1982
5000
4000
3000
2000
1000
42
DAYS AFTER CUTTING
6000
1983
5000
4000
3000
2000
1000
20

94
2 3 larvae/0.2 m (contrasts C4 and C5) significantly (P < .05) reduced
yield in most years, but did not consistently reduce LAI.
Analysis of Growth Rates
Effects of VCW damage on the rate of increase of stem height, nodes
per stem, and leaves per stem are shown in Table 12. Stem height accumu
lated at a significantly faster rate in 2 of 3 years in plants damaged
2 by 9 and 12 larvae/0.1 m as compared with healthy plants. Plants
2 damaged by 9 larvae/0.1 m produced stem height at a 77.6% and 29.6%
faster rate than undamaged plants in 1981 and 1983, respectively. In
1982, the accumulation rate of stem height declined slightly in the
highest density plots as compared with the check, but increased by 13%
2 in plants damaged by 9 larvae/0.1 m . VCW defoliation had little effect
on the rate of accumulation of mainstem nodes. Although contrast CI
was significant iù 1982, nodes were produced at only an 8.4% faster rate
2 in the 9 larvae/0.1 m treatment as compared with the check. The differ
ence between these two treatments in 1983 was +3.7% and no contrasts were
significant in this year. Because there was little difference in the
accumulation rates of nodes, the large increase in stem height accumula
tion rates most likely was attained by an increase in internode lengths
in stems of severely defoliated plants.
The rate of accumulation of nodes per stem also has a bearing on
the accumulation rate of leaves per stem. Leaf production rates declined
with increasingly severe larval injury. Plants defoliated by 9 larvae/
2 0.1 m produced leaves at 49.1, 29.9, and 33.5% slower rates than
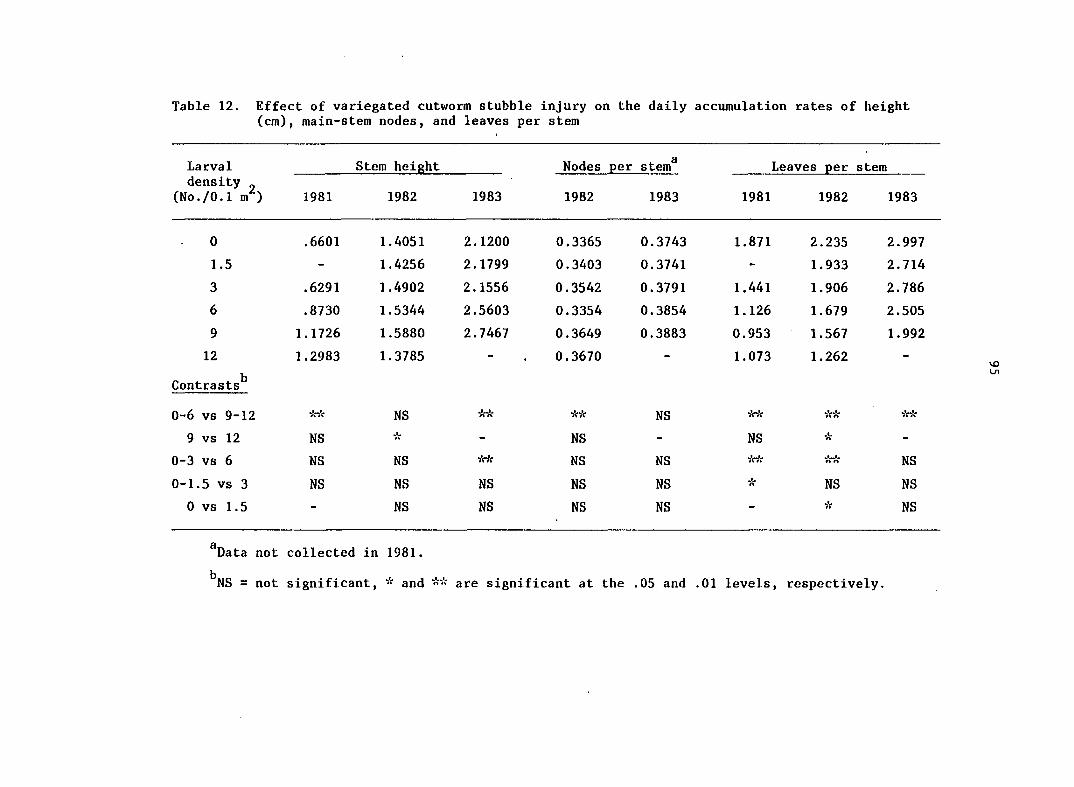
Table 12. Effect of variegated cutworm stubble injury on the daily accumulation rates of height (cm), main-stem nodes, and leaves per stem
Larval Stem height Nodes per stem^ Leaves per stem density „
(No./O.l m ) 1981 1982 1983 1982 1983 1981 1982 1983
0 .6601 1.4051 2.1200 0.3365 0.3743 1.871 2.235 2.997
1.5 - 1.4256 2.1799 0.3403 0.3741 - 1.933 2.714
3 .6291 1.4902 2.1556 0.3542 0.3791 1.441 1.906 2.786
6 .8730 1.5344 2.5603 0.3354 0.3854 1.126 1.679 2.505
9 1.1726 1.5880 2.7467 0.3649 0.3883 0.953 1.567 1.992
12 1.2983 1.3785 - 0.3670 - 1.073 1.262 -
Contrasts^
0-6 vs 9-12 ** NS ** ** NS ** ** irk
9 vs 12 NS •k - NS - NS * -
0-3 vs 6 NS NS Yf* NS NS ** ** NS
0-1.5 vs 3 NS NS NS NS NS * NS NS
0 vs 1.5 - NS NS NS NS - * NS
^Data not collected in 1981.
^NS = not significant, * and are significant at the .05 and .01 levels, respectively.
96
healthy plants in 1981, 1982, and 1983, respectively. These reductions
resulted in highly significant CI contrasts in all years and C3 con
trasts in 1981 and 1982. The large reductions in leaf production rates,
as compared with node production rates, suggest that there were fewer
leaves per node. The cause of reduced production of leaves relative to
nodes probably was a reduction in the development of axillary leaves and
branches.
The effects of VCW stubble injury on subsequent growth rates of
leaf (LGR), support-structure (SGR), and total (CGR) dry weight, and leaf
area index (LAGR) are shown in Table 13. Leaf growth rate and SGR are
the leaf and support components of yield, and LAGR is the rate of produc
tion of LAI. In 1981, CGR increased slightly and SGR decreased somewhat
with treatment severity. No contrasts were significant for CGR and SGR
in 1981. Leaf growth rate, however, increased significantly with larval
density in 1981 such that LGR was 57% greater for plants damaged by
2 9 larvae/0.1 m than for undamaged plants. In 1982 and 1983, both CGR
and SGR declined with larval densities. These reductions were signifi-
2 cant for densities of 9 and 12 larvae/0.1 m in 1982 and densities of
2 6 and 9 larvae/0.1 m in 1983. As in 1981, SGR was more adversely
affected than CGR in both years. Treatments in both years had little
effect on LGR, and except for contrast C5 in 1983, no contrasts were
significant for LGR in 1982 and 1983.
Leaf area growth rate increased substantially with treatment
2 severity in all years. Defoliation by 9 larvae/0.1 m increased LAGR
by 44.1, 43.8, and 53.9% in 1981, 1982, and 1983, respectively. Contrast
CI was significant in 1981 and 1983, and the C3 contrast was significant
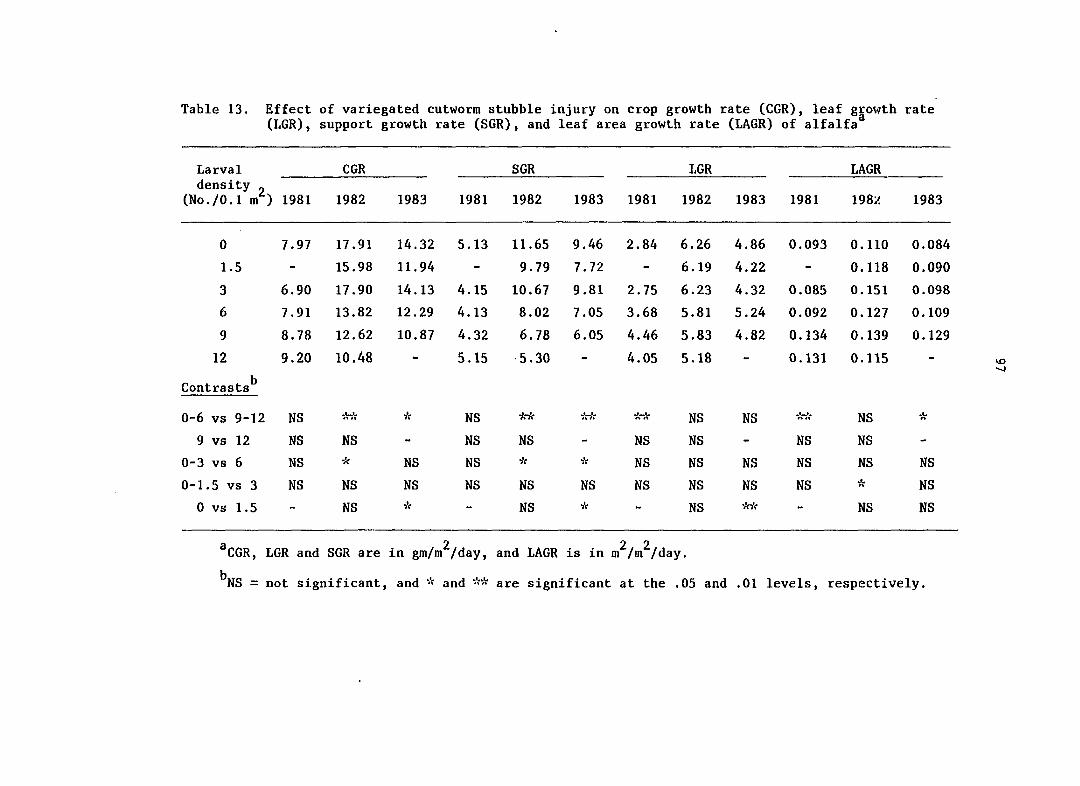
Table 13. Effect of variegated cutworm stubble injury on crop growth rate (CGR), leaf growth rate (LGR), support growth rate (SGR), and leaf area growth rate (LAGR) of alfalfa^
Larval CGR SGR LGR LAGR density _
(No./O.l m^) 1981 1982 1983 1981 1982 1983 1981 1982 1983 1981 1982 1983
0 7.97 17.91 14.32 5.13 11.65 9.46 2.84 6.26 4.86 0.093 0.110 0.084
1.5 - 15.98 11.94 - 9.79 7.72 - 6.19 4.22 - 0.118 0.090
3 6.90 17.90 14.13 4.15 10.67 9.81 2.75 6.23 4.32 0.085 0.151 0.098
6 7.91 13.82 12.29 4.13 8.02 7.05 3.68 5.81 5.24 0.092 0.127 0.109
9 8.78 12.62 10.87 4.32 6.78 6.05 4.46 5.83 4.82 0.134 0.139 0.129
12 9.20 10.48 - 5.15 5.30 - 4.05 5.18 - 0.131 0.115 -
Contrasts^
0-6 vs 9-12 NS ** * NS irk •k-k NS NS ** NS *
9 vs 12 NS NS - NS NS - NS NS - NS NS -
0-3 vs 6 NS •k NS NS * * NS NS NS NS NS NS
0-1.5 vs 3 NS NS NS NS NS NS NS NS NS NS * NS
0 vs 1.5 - NS •iV - NS * - NS irk - NS NS
^CGR, LGR and SGR are in gm/m^/day, and LAGR is in m^/m^/day.
^NS = not significant, and •> and ** are significant at the .05 and .01 levels, respectively.

98
in 1982. The Cl contrast was not significant in 1982 because of a low
LAGR in the highest density treatment.
Except for contrast C5 in 1983, contrasts comparing densities of
2 0, 1.5, and 3 larvae/0.1 m were not significant for CGR, LGR, SGR, or
2 LAGR. The comparison of these treatments with 6 larvae/0.1 m also was
usually not significant. Consequently, the subsequent CGR of alfalfa
2 was significantly reduced by densities of 6 or greater larvae/0.1 m ,
1.e., by densities large enough to cause a complete regrowth delay.
Almost all reduction in CGR was caused by a reduction in SGR, but LGR
was not significantly reduced by any treatment. Interestingly, despite
the lack of effect on LGR, LAGR was substantially greater in plants
damaged by the highest larval densities.
Analysis of Partitioning Rates
It is clear from the previous analysis that a complete delay in
regrowth changed the partitioning of resources during subsequent re-
growth. Partitioning can be measured by the ratios of leaf area and
leaf weight to total plant weight açd by the ratio of leaf area to leaf
weight. These ratios are the leaf area ratio (LAR), leaf weight ratio
(LWR), arid specific leaf area (SLA), respectively, where LAR = LWR x SLA
(Hunt 1978).
Increases in larval density caused significant increases in LAR in
2 all years (Table 14). The LAR of plants defoliated by 9 larvae/0.1 m
was 48.1, 40.5, and 63.5% greater than the LAR of nondefoliated plants
during the three respective years. The increase in LAR was caused by a
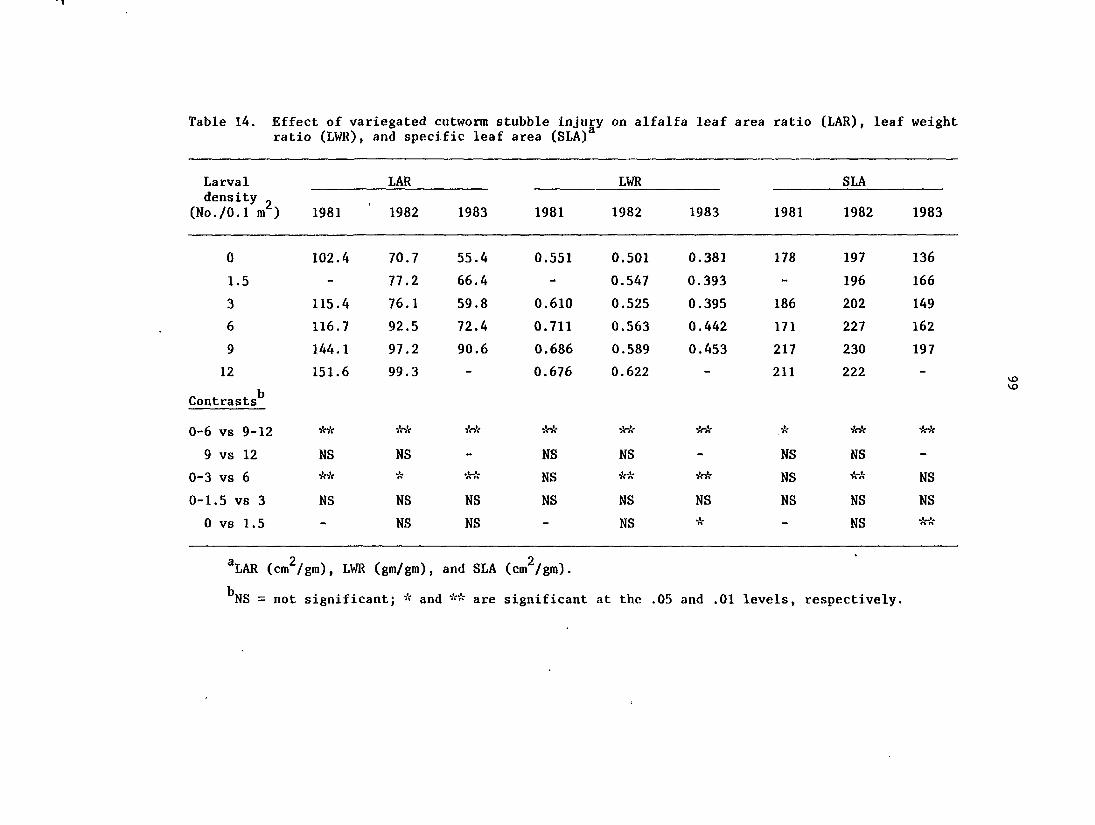
Table 14. Effect of variegated cutworm stubble injury on alfalfa leaf area ratio (LAR), leaf weight ratio (LWR), and specific leaf area (SLA)^
Larval LAR LWR SLA density „
(No./O.l ra ) 1981 1982 1983 1981 1982 1983 1981 1982 1983
0 102.4 70.7 55.4 0.551 0.501 0.381 178 197 136
1.5 - 77.2 66.4 - 0.547 0.393 - 196 166
3 115.4 76.1 59.8 0.610 0.525 0.395 186 202 149
6 116.7 92.5 72.4 0.711 0.563 0.442 171 227 162
9 144.1 97.2 90.6 0.686 0.589 0.453 217 230 197
12 151.6 99.3 - 0.676 0.622 - 211 222 -
Contrasts^
0-6 vs 9-12 îVîV ** 'kit i-k * •k-k **
9 vs 12 NS NS - NS NS - NS NS -
0-3 vs 6 * •k-k NS ** •irk NS •ick NS
0-1.5 vs 3 NS NS NS NS NS NS NS NS NS
0 vs 1.5 - NS NS - NS * - NS it-k
^LAR (cmf 2
/gm), LWR (gm/gm), and SLA (cm /gm).
^NS = not significant; * and ** are significant at the .05 and .01 levels, respectively.

100
2 combination of an increase in both LWR and SLA. Nine larvae/0.1 m
caused LV® to increase by 22.0, 24.2, and 18.6% and SLA to increase by
18.7, 15.2, and 45.5% as compared with nondefoliated plants during the
three years, respectively. Orthogonal treatment contrasts, however,
2 indicated that densities of up to 3 larvae/0.1 m usually did not signifi-
2 cantly affect plant partitioning. Densities of 6 larvae/0.1 m did alter
partitioning significantly in most years, and densities greater than
2 6 larvae 0.1 m increased all three partition variables significantly in
all years.
Consequently, densities capable of completely delaying regrowth
increased the allocation of leaf area per unit of dry weight by increas
ing the ratio of leaf weight per unit of total weight, and by increasing
the leaf area per unit of leaf weight. The latter consequence was
accomplished by producing thinner, less-dense leaves. Increased LWR
could be the result.of the production of larger leaves or more leaves
per unit of total weight. Calculation of the ratio of leaf number per
unit of total weight (LM) showed that LM was not significantly affected
by VCW damage in 1982 and 1983 (Table 15). Leaf number ratio, however,
declined significantly in 1981. Calculation of the ratio of area and
weight per leaf showed that both variables increased significantly in
2 all years for densities of 6 or greater larvae/0.1 m . Furthermore,
leaf area responded to a greater extent than leaf weight, which is
indicative of the increase in SLA. The increase in LWR, therefore, was
not accomplished by the production of more leaves; rather it was the
result of the production of larger leaves.

Table 15. Effgct of variegated cutworm stubble injury in alfalfa leaf number ratio (LNR), and area (cm ) and weight (mg) per leaf
Larval density
(No./O.l m"^)
LNR Leaf weight Area/leaf Larval density
(No./O.l m"^) 1981 1982 1983 1981 1982 1983 1981 1982 1983
0 185.0 51.1 58.9 2.36 6.88 6.34 0.53 1.34 0.93
1.5 - 49.8 60.6 - 7.78 6.50 - 1.55 1.10
3 160.4 47.3 59.7 3.10 7.81 6.75 0.66 1.57 1.00
6 154.8 48.7 55.2 4.34 8.13 8.05 0.76 1.84 1.33
9 124.7 50.6 53.6 5.63 8.30 8.32 1.20 1.92 1.69
12 110.2 54.0 - 5.88 8.24 - 1.31 1.82 -
Contrasts^
0-6 vs 9-12 NS NS Vw. NS ** ** ** **
0-3 vs 6 NS NS NS •k-k NS * * ** *
^NS = not significant; * and are significant at the .05 and .01 levels, respectively.
^Contrasts C2, C4, and C5 were not significant in any year.

102
DISCUSSION
Comparison of the partitioning variables with the component growth
rates suggests that the apparent increase in resource partitioning to
leaf weight was only a relative increase. In fact, the accumulation
rate of leaf weight generally remained unchanged, whereas the support
component of CGR declined substantially. Therefore, the change in
partitioning was actually a reduction in support weight relative to leaf
weight, and not an increase in leaf weight, per se. The increase in SLA
did add to the reduction of support weight so that the increase in LAR
was caused by a combination of a reduction in support weight and an
increase in the leaf area per unit of leaf weight. The increase in SLA
(i.e., reduced leaf density) would have the effect of enhancing the area
available for Incident light interception without a concomitant increase
in leaf biomass. The relative differences in growth and partitioning
rates between 1981 and the later years probably were the result of the
moisture stress that occurred in 1981.
The changes in plant partitioning may be the consequence of an
alteration in carbohydrate source-sink relationships in damaged plants.
Although current photosynthesis may be available during initial re-
growth, plants normally use carbohydrates stored in the roots as the
primary source of carbon for about the first three weeks of regrowth
(Hodgkinson 1969, Pearce et al. 1969, Smith and Marten 1970). New
leaves, however, import and use translocated carbohydrates only during
the first week or so of regrowth, after which they become self-
sufficient. Support structures, on the other hand, continue to rely on

103
stored carbohydrates for about three weeks or until reserves are depleted
(Hodgkinson 1969).
In plants injured enough to delay regrowth for 10 to 14 days (i.e.,
2 densities of 6 or greater larvae/0.1 m ), subsequent regrowth would
occur without the benefit of large reserves of stored carbohydrates.
These reserves presumably would already be near depletion at the time
larval defoliation ceased. Consequently, regrowth would need to rely
primarily on photosynthates produced by current leaf photosynthesis.
Leaf growth probably would not be suppressed greatly, because assimilate
sources tend to satisfy their own needs before exporting assimilates
(Cook and Evans 1978). Growth of support structures (carbohydrate sinks)
most likely would be suppressed more severely, because of the loss of
stored carbohydrates and the inability of current photosynthesis to make
up the difference.
Therefore, in conclusion, subsequent growth and partitioning of
alfalfa were significantly affected when VCW stubble injury was severe
enough to cause a complete delay in regrowth. Changes in partitioning
by completely delayed plants, however, seemed to minimize the adverse
effects of stubble injury by maintaining the growth rate of the primary
photosynthetic organs (e.g., leaves) at the expense of support structure
growth..
104
PART IV. DEVELOPMENT OF ECONOMIC INJURY LEVELS AND
MANAGEMENT PRACTICES FOR THE VARIEGATED
CUTWORM IN ALFALFA
105
ABSTRACT
Studies were conducted to investigate the impact of the duration and
intensity of stubble injury by the variegated cutworm (VCW), Peridroma
saucia (Hubner), on the yield, quality, and economic return of alfalfa.
One study assessed the effects on alfalfa productivity of the duration
of complete regrowth suppression by simulated insect injury. The inten
sity of damage was investigated in the second study where the effects on
alfalfa regrowth of various densities of last-stage larvae were examined.
Larval feeding occurred for 10 to 15 days. Regrowth was suppressed
2 completely by 6 and greater larvae/0.1 m , whereas densities of 1.5 and
2 3 larvae/0.1 m only partly suppressed regrowth. Stubble injury in both
studies affected regrowth through: (1) an initial loss in plant regrowth
with a concomitant delay in plant development and loss in dry matter, and
(2) an additional loss of dry matter associated with a reduction in sub
sequent growth rates. Production of dry matter, therefore, was affected
more adversely than plant development. Herbage quality was affected
primarily by the relative delay in plant maturity. Consequently, dry
matter and nutrient yields were reduced at the same stage of plant
development. These results, however, were significant only when regrowth
was completely suppressed for more than 3 days. Likewise, plant develop
ment and yield were significantly affected only by larval densities of 6
2 and greater larvae/0.1 m . Lower densities did not consistently affect
regrowth significantly in all years.
A replacement feed-cost analysis was conducted for both studies.
Dollar-loss equations were generated for harvest systems where cutting
106
is based on plant developmental stage (i.e., first bloom) or calendar
date. Regrowth-delay loss thresholds and VCW economic injury levels
were calculated for both harvest systems, and a management program for
VCW in alfalfa stubble developed.

107
INTRODUCTION
Alfalfa is attacked by a large number of defoliators. Although
cutting is often an effective method of control, stubble feeding by a
small number of surviving individuals may cause substantial damage to
new regrowth. The two defoliators most often associated with regrowth
damage are the variegated cutworm (VCW), Peridroma saucia (Hiibner), and
the alfalfa weevil (AW), Hypera postica Gyllenhal (Pick 1976, USDA
1957-1975). A number of other species also have been reported to damage
alfalfa regrowth, including the armyworm, Pseudoletia unipuncta (Haworth),
dingy cutworm, Feltia subgothica (Haworth), darksided cutworm, Euxoa
messoria (Harris), and bristly cutworm, Mamestra regina (Stephens)
(USDA 1957-1975, USDA 1976-1981, Walkden 1950).
VCW phenology in Iowa is such that first generation larval develop
ment coincides with the first growth cycle of alfalfa. Typically, most
larvae are at or the near the beginning of the last larval stage (6) at
the first cutting in early June. Stubble damage usually occurs after
the first cutting, but regrowth injury after the second cutting also has
been reported (USDA 1975)- Partial to complete suppression of regrowth
may occur for several days to two weeks or more (Soteres et al. 1984,
USDA 1957-1975). Based on numbers of reports in the Coop. Economic
Insect Report and Coop. Plant Pest Report, regrowth delays by VCW
primarily are a problem in the southern and central Great Plains from
north Texas, Oklahoma, and Arkansas to South Dakota, Iowa, and southern
Minnesota. Widespread outbreaks occurred in 1957, 1964, 1968, 1973, 1975,
and 1977, with localized outbreaks being reported in six additional years.

108
Regrowth damage by AW primarily is a problem in the northern US.
In this area, AW overwinters mainly in the adult stage, and larval popula
tions usually reach a peak about the time of the first cutting. Feeding
by surviving larvae may cause considerable damage to new regrowth for up
to two weeks (Hamlin et al. 1949). Newly emerged adults also may suppress
new regrowth (Bjork and Davis 1984).
The response of alfalfa to insect stubble injury has received little
attention, and no studies have specifically examined stubble damage by
VCW. Some studies (Liu and Pick 1975, Pick 1976), however, have investi
gated stubble injury by AW. Although AW may significantly reduce first-
cutting yield (Hintz et al. 1976), a study in New York found that AW
significantly reduced yield only during the second cutting of a three-
cut system (Liu and Fick 1975). Larvae continued to feed on stubble
after the first cutting for 5 to 15 days, which resulted in a second
growth yield loss of 31% and a seasonal loss of 17%. In a companion
study (Fick 1976), yield losses caused by stubble damage increased
2 linearly with larval density up to ca. 1600 larvae/m . Greater densities
did not cause additional significant losses, and maximal yield loss
represented approximately 1/3 of the potential yield of a 40-day second
growth period. Herbage of defoliated plants was less mature, shorter in
height, and lesser in dry weight than nondefoliated plants. Leaf per
centage and forage quality, however, were greater in defoliated plants.
Most of these differences were attributed to the relative difference in
herbage age and developmental stage at harvest.
Presented here are the results of two studies, in which the impact
of actual and simulated stubble injury by VCW on the yield, quality, and

109
economic return of alfalfa is assessed. Studies focused on VCW because
little is known about the effects of stubble feeding by this insect on
alfalfa. Specific objectives were to determine: (1) how long a complete
suppression of regrowth could be tolerated before significant economic
losses occurred, (2) the number of larvae required to completely suppress
alfalfa regrowth, and (3) the effects of partial and complete regrowth
suppression by VCW on alfalfa productivity. Using this information,
economic injury levels and management practices for VCW were developed,
and guidelines for the management of AW also are proposed.

110
MATERIALS AND METHODS
Both studies were conducted in a field of 'Valor' alfalfa located
2.5 km south of Ames, Iowa on a Webster silty-clay loam. Alfalfa seed
was drill-planted in 17.5-cm rows at the rate of 13.5 kg/ha on 20 August,
1980. Recommended management practices typical of central Iowa were
followed, including the top-dress application of phosphorous and potas
sium during the spring of each year. Plot areas were treated with
malathion at the rate of 1.1 kg (AI)/ha to suppress AW during the first
growth cycle. Plots also were sprayed with malathion at the same rate
after the 21-day sample date to control the potato leafhopper, Empoasca
fabae (Harris).
Delay of Regrowth Study
A study was conducted to assess the effects of complete regrowth
suppression for varying periods of time on alfalfa production. Insect
damage sufficient to cause a conçlete suppression of regrowth was
simulated by hand-picking all new regrowth (leaves and stems) at the
point of attachment to the stubble or soil surface. Shoots were picked
every two days beginning on day 1 (24 h after cutting) until the desired
duration of damage was achieved. Treatment durations were 0 (unpicked),
1, 3, 7, and 11 days in all trials. The study was conducted four times;
once during the second and third growth cycles in 1981 and 1982. Trials
were begun on 1 June and 30 June in 1981 and 1 June and 14 July in 1982.
The experimental area was clipped on these dates to a stubble height of
7.5 cm, and all plots were established within 12 h of cutting.

I l l
A split-plot experimental design was used, with whole plots con
sisting of the duration of regrowth delay and subplots being sample
times. Whole plots, measuring 1.5 m (7 rows) by 3 m, were arranged in
a randomized complete-block design with four replications during the
first trial in 1981, and five replications in the other trials. Whole
plots were divided in to six subplots measuring 0.36 (2 rows) by 1.0 m.
Subplots were sampled weekly for six weeks beginning on day 7 after
cutting during all trials, except during the first trial in 1981 when
the last two samples were not taken. Subplots were harvested with hand
clippers by clipping all above-ground herbage. Stem density was deter
mined on all sample dates in 1982 and on the final sample dates in the
1981 trials. A representative subsample of 25 stems was collected from
each sample to monitor plant development. Stems were classified by
vegetative, bud, flower, or pod stage. The date of first bloom was
estimated for each treatment and trial by solving a linear or quadratic
(whichever described the data best) regression equation of percentage
of flowering stems against time.
All samples were dried in a forced-air oven at 70°C for 72 h before
dry weight was measured. Quality measurements were made on those samples
collected on sample dates 21 through 42 during all trials. Samples
first were ground through a 1-mm mesh screen using a Wiley mill. Quality
was evaluated by determining herbage digestibility and crude protein
content (CP). A micro-Kjeldahl technique was used to determine CP.
Digestibility was assessed with the Tilley-Terry m vitro digestible dry
matter (IVDDM) assay as modified by Marten and Barnes (1979) for direct
acidification. CP and IVDDM of all samples were based on duplicate

112
determinations. Quality measurements were coupled with dry weight
measurements to calculate estimated yields of CP and digestible dry
matter (DDM).
Statistical analyses
CP, IVDDM, and yield of CP and DDM were analyzed by date and trial
with an analysis-of-variance (ANOVA) and orthogonal treatment contrasts.
Treatment (regrowth delay) contrasts were CI = 0-3 versus 7-11, C2 =
7 versus 11, C3 = 0-1 versus 3, and C4 = 0 versus 1. Well-managed
alfalfa, however, normally is harvested based on stage of physiological
development rather than calender date (Smith 1975). Consequently, yield
and quality measurements also were calculated for the same stage of
development. First bloom was chosen because it is easily identifiable
in the field and it represents a reasonable compromise between yield and
quality (Hanson and Barnes 1973, Smith 1975). First bloom estimates of
herbage yield and quality were generated by fitting treatment-specific
regression equations to the observed data for each trial. The equations
then were solved for the previously calculated date of first bloom.
Trial 1 in 1981 was not included in this analysis because there were not
enough sample dates for generating regression equations. Yield and
quality estimates calculated for the other three trials were analyzed
with an ANOVA and orthogonal treatment contrasts using trials as
replicates.

113
Larval Infestation Study
The effects of stubble feeding by various densities of VCW larvae
on the second growth cycle of alfalfa were assessed in a study using
barriered plots. Plots, measuring 1.5 m (7 rows) by 4 m, were established
immediately after the first cutting on 10 June, 1981, 1 June, 1982, and
14 June, 1983. Plots were clipped to a stubble height of 7.5 cm with a
mower/conditioner. Employing a technique used by Showers et al. (1983),
each plot was enclosed with a 45-cm high aluminum barrier. All barriers
were in place within 36 h of cutting, and plots were infested with early
ultimate-stage larvae at dusk. Larvae for all studies were progeny of
feral adults collected during the spring of each year. Larval rearing
procedures are described in Part III of this dissertation.
A split-plot experimental design was employed with whole plots
consisting of larval density. Whole plots were arranged in a randomized
complete-block design with five blocks in 1981 and 1982, and four blocks
in 1983. Larval densities in all years were 0, 1.5, 3, 6, 9, and 12
larvae/0.1 m^, except in 1981 and 1983 when the 1.5 and 12 larvae/0.1
densities were not used, respectively. Whole plots in the first two
years were divided into four subplots measuring 0.36 (2 rows) by 1.5 m.
After larval feeding ceased, one subplot was sampled weekly beginning
on day 14 in 1981 and day 21 in 1982. Subplots were harvested by
clipping all above-ground herbage with hand clippers. Dead stems and
trash were separated from the alfalfa herbage, and stem density and dry
weight measured. A subsample of 25 stems was taken from each sample in

114
both years to determine mean stage of plant development and percentage
of flowering stems.
In 1983, the arrangement of subplots was modified to specifically
examine the possible interaction between stubble damage by VCW and sub-
2 sequent week populations. Whole plots were divided into three 1.0 m
subplots. Two subplots were hand-weeded on day 21, and weeds were allowed
to develop in the third subplot. Alfalfa regrowth was monitored weekly
for five weeks beginning on day 7 in one of the weeded subplots. A
representative sample of 25 stems was collected to measure shoot dry-
weight, mean stage of plant development, and percentage of flowering
stems. Stem density was nondestructively determined in a randomly
chosen half of the other weeded subplot. Weekly yield estimates were
calculated from shoot weight and density, and final yield was measured
directly on day 35 by harvesting the nondestructively sampled subplot.
Samples in all years were processed and quality measurements were
determined as previously described in the regrowth delay study for
herbage collected on days 14-35 in 1981, days 21-42, in 1982 and days
21-35 in 1982. Yields of CP and DDM were calculated from these deter
minations .
Statistical analyses
Yield and quality measurements were analyzed by sample date within
year with an ANOVA, and treatment (larval density) differences were
elucidated with Duncan's Multiple Range Test. Date of first bloom was
estimated for each plot within a year by linear interpolation of the
percentage of flowering shoots. CP, IVDDM, and nutrient and dry matter

115
yield at first bloom also were estimated as described in the regrowth
delay study. Estimates were calculated for each plot, and these results
were analyzed with an ANOVA and Duncan's Multiple Range Test.
Economic Analysis
Dollar value return estimates were calculated for both studies using
a modified replacement feed-cost analysis (Craven and Hasbargen 1979,
Onstad and Shoemaker 1984). The analysis uses CP and DDM yields to esti
mate the dollar value return of hay production. Previous analyses, how
ever, have based replacement costs on the value of corn-soybean meal.
This practice probably has overestimated the value of hay because corn
and soybean meal generally is a more valuable feedstuff than alfalfa hay.
Furthermore, the loss in hay yield most likely will be replaced with
more hay rather than corn and soybean meal. Consequently, dollar values
in the present analysis were based on the market values of hay purchased
on-farm and hay bought off-farm. Prices of $6l/MT ($55/Ton) and $77/MT
($70/Ton), respectively, are representative of the current market value
in Iowa of aftermath hay cut at or before first bloom. The price differ
ential between hay types is the result of transportation costs for off-
farm hay.
Dollar value estimates were calculated based on the yield of CP and
DDM and the unit value of each nutrient. Before dollar values were cal
culated, however, dry matter and nutrient yields were adjusted to
reflect the harvest loss normally associated with curing and baling of
hay. This was necessary because commodity prices were based on baled
116
hay, whereas yields were based on the standing crop before it is cut.
Hoglund (1964) reported average harvest losses of 25% for curing and
baling alfalfa, thus, all yield values were reduced by this amount-
Unit values of CP and DDM were calculated by dividing the market
price of hay, expressed on a dry matter basis, by the average CP and DDM
content of aftermath hay cut at first bloom. The National Research
Council (1969) reports average nutrient contents for this type of hay
(feedstuff reference No. 1-00-059) as 57% total digestible nutrients
(estimated by IVDDM) and 18.4% CP. The resulting unit costs are
$0.1230 and $0.1565/kg for DDM and $0.3847 and $0.4934/kg for CP when
hay is valued at $61 and $77 per MT, respectively. After separate dollar
values were generated based on CP and DDM yields, an overall value per
ha was calculated as the average of the two estimates.
Dollar returns and dollar loss equations for both studies were cal
culated for harvest systems where either plant developmental stage or
calendar date would be used as the criterion for cutting. Dollar values
for first bloom were used for the developmental-stage harvest system.
Values for the calendar date system were taken from sample dates when
the undamaged plants were near first bloom. Sample dates used for this
system were day 28 for all trials in the delay of regrowth study, and
day 28 in 1981 and day 35 in 1982 and 1983 for the larval infestation
study.
117
RESULTS
Delay of Regrowth Study
Results of the analysis of plant development indicate that first
bloom occurred 26.3, 26.6, 27.5, 29.7, and 34.7 days after cutting, when
averaged for all trials, for undamaged plants and plants delayed for 1,
3, 7, and 11 days, respectively. Regrowth delays of 1 and 3 days did
not significantly (P > .05) increase the number of days to first bloom,
whereas delays of 7 and 11 days caused significant (F^ ~ 35.06,
P < .01) increases in days to first bloom. Furthermore, plants damaged
for 11 days were delayed for a significantly (F- = 12.11, P < .01) 1 , i z
longer time than 7-day damaged plants. First bloom, however, was delayed
less than expected based on the actual duration of damage. Plants delayed
for 1, 3, 7, and 11 days required an additional 0.22, 1.15, 3.41, and
8.46 days for first bloom to occur, respectively. Therefore, a 3-day
regrowth delay caused only a 1-day delay in date of bloom, and plants
delayed for 7 and 11 days reached first bloom approximately 3 days
sooner than expected, based on the initial regrowth delay.
Regrowth delays also significantly affected forage quality and
nutrient yields (Fig. 9). On any given sample date, CP and IVDDM
increased with longer regrowth delays. This increase was significant
(P < .05) on all sample dates and trials for plants delayed for 7 and 11
days (contrast CI). Delays of 1 and 3 days did not significantly affect
either quality parameter on any date in all trials. Forage quality
declined somewhat more quickly in severely delayed plants, as compared
with undamaged plants. This observation, however, probably is an artifact

Figure 9. Response of alfalfa crude protein (CP), in vitro digestible dry matter (IVDDM), CP yield, and digestible dry matter (DDM) yield to complete regrowth suppression for various times (days) in 1982 (1981 data not shown)
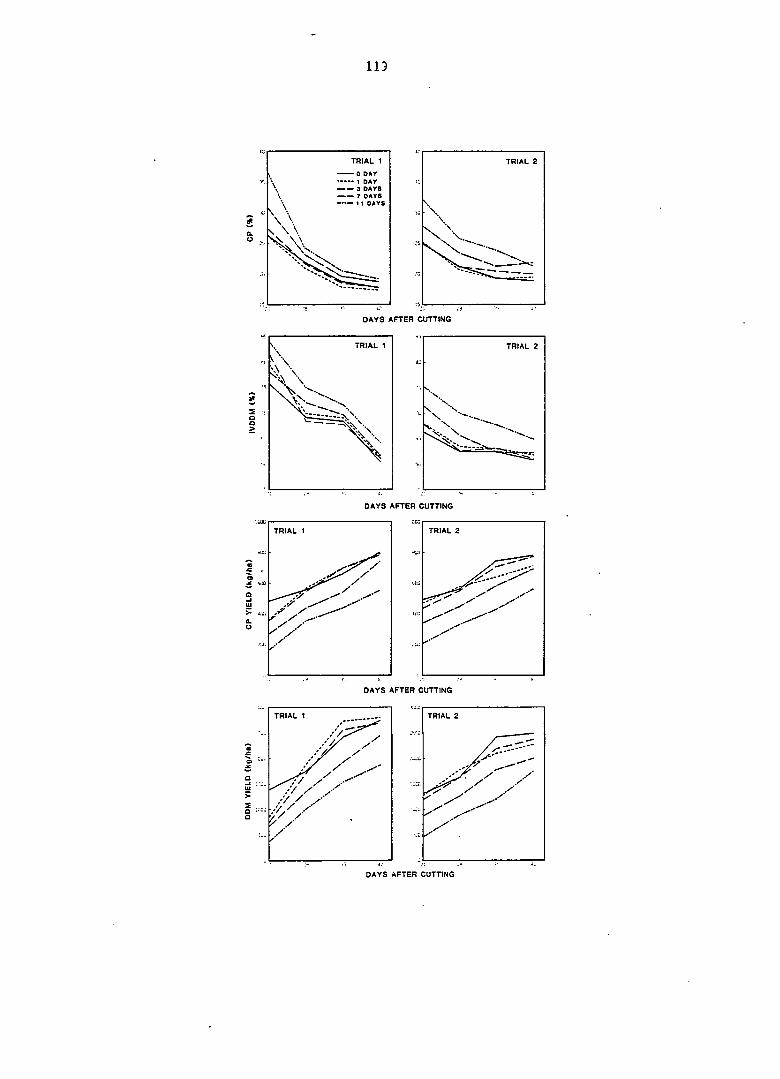
113
TRIAL 1 TRIAL 2
3 DAYS 7 DAYS
DAYS AFTER CUTTING
TRIAL 1 TRIAL 2
DAYS AFTER CUTTING
TRIAL 2 TRIAL 1
DAYS AFTER CUTTING
TRIAL 2 TRIAL 1
DAYS AFTER CUTTING
120
of the relative herbage age in each of the treatments, in that the rate of
decline of herbage quality moderated as herbage became older. Although
damaged plants had significantly better herbage quality, yields of CP and
DDM were reduced significantly when regrowth was delayed for 11 days, and
to a lesser extent, 7 days (Fig. 9). Except in one instance (day 21,
trial 1, 1982), delays of 1 and 3 days did not significantly reduce CP
and DDM yields, when compared with undamaged plants, on any sample date
in all trials.
These results demonstrate that alfalfa quality and nutrient yields
are affected by regrowth delays of greater than 3 days. Yield and
quality differences, however, may be caused entirely by the relative
differences in herbage age and maturity. The confounding effect of
regrowth age was removed by calculating quality and nutrient yields for
the same stage of development (i.e., first bloom) (Table 16). Although
CP and IVDDM were somewhat greater in plants delayed for 7 and 11 days,
the increase was relatively small and significant only for IVDDM (con
trast CI). No other contrasts were significant for IVDDM, and no
contrasts were significant for CP. Conversely, delays of greater than
3 days did cause significant reductions in dry matter (DM), DDM and CP
yield at first bloom. Yields were not significantly affected by delays
of 1 and 3 days. Therefore, regrowth delays of 7 and 11 days had a more
severe effect on DM production than plant development and quality. Yield
reductions were caused by a combination of the direct initial loss of
DM and a reduction in the subsequent crop growth rate of the regrowth
(Part II of this dissertation).

Table 16. Effect of regrowth delays on alfalfa crude protein (CP), iji vitro digestible dry matter (IVDDM), dry matter (DM) yield, digestable dry matter (DDM) yield, and CP yield, and dollar-value returns for calendar date and first bloom harvest systems
Dollar value/ha
Regrowth Quality (%) Yield (kft/ha) First bloom Calendar date delay (days) CP IVDDM DM DDM CP $6l/MT $77/MT $61/MT $77/MT
0 21.92 67.20 2586 1709 542 157.60 200.55 167.77 213.49
1 21.94 67.53 2581 1784 556 162.86 207.23 171.36 218.05
3 22.19 67.20 2551 1684 538 155.59 197.99 155.54 197.92
7 23.80 68.67 2093 1382 459 130.41 165.95 128.95 164.08
11 23.13 68.19 2003 1352 440 126.31 160.73 99.37 126.39
Contrasts^
0-3 vs 7-11 NS * ** ** -Irk Mi •k'k Yf* irk
7 vs 11 NS NS NS NS NS NS NS ** **
^Trial 1 in 1981 not included in analysis.
'^Contrasts comparing delays of 0, 1, and 3 days were not significant (NS) for any variable; * and "" indicate significance at the .05 and .01 levels, respectively.

122
Economic analysis
Reductions in nutrient yields for harvest systems based on first
bloom and calendar date translated into significant losses in dollar
value returns per ha (Table 16). Values at first bloom declined signifi
cantly for both commodity prices in treatments delayed for more than 3
days, when compared with returns of treatments damaged for 1 and 3 days.
The additional delay from 7 to 11 days did not produce additional signifi
cant dollar-value reductions. The same results were true for calendar-
date values, except that the dollar values were significantly different
for 7 and 11 day delays. Delays of 1 and 3 days did not significantly
affect dollar returns, as compared with undamaged plants, for either
harvest system.
A delay-loss threshold (point where the loss caused by a regrowth
delay would justify the cost of insect control) was generated using the
estimates of dollar returns by calculating the dollar loss associated
with each treatment as the difference in value from the undamaged treat
ment. Loss values were regressed against the days delay in regrowth,
forcing the regression through the origin, to calculate the dollar loss
per ha for each day delay in regrowth. Loss equations were developed for
both harvest systems. For a system where harvest occurs at first bloom,
each day delay caused $2.97 and $3.78 loss per ha when hay is valued at
$61 and $77 per MT, respectively. These values translate into delay-loss
thresholds of 4.4 to 7.5 days (Table 17). Dollar losses for a calendar-
date harvest system were $5.21 and $6.57/ha for each day delay when hay
costs $61 and $77/MT, respectively. The calculated delay-loss thresholds
for this system ranged from 2.6 to 4.3 days (Table 17).

123
Table 17. Delay-loss thresholds (days) and VCW economic injury levels (larvae/0.1 m ) for alfalfa stubble, based on calendar-date and plant-stage (first bloom) harvest systems
Plant-stage harvest Calendar-date harvest
Commodity Control costs^ Control costs price
($/MT) $16.80 $22.40- $16.80 $22.40
Delay-loss thresholds
61 5.7 7.5 3.2 4.3
77 4.4 5.9 2.6 3.5
VCW economic injury levels
61 3.6 4.8 2.1 2.8
77 2.8 3.8 1.7 2.2
^Control costs ($/ha) are based on a ground application of 1.1 kg (MI)/ha of trichlorfon (Dylox 80w), plus $6.18 and $12.35/ha for application costs.
Larval Infestation Study
Larval damage occurred for 10 to 12 days in 1981 and 1983, and for
2 about 15 days in 1982. Densities of 9 and 12 larvae/0.1 m consistently
caused complete delays in regrowth in all years. Feeding by 1.5 and
2 3 larvae/0.1 m did not completely suppress regrowth in any year. Damage,
however, was evident on most shoots with leaves and leaflets often being
2 completely removed. Six larvae/0.1 m completely suppressed regrowth in
some plots, whereas regrowth was only partly suppressed in other plots.
Shoots that did grow in these plots usually were severely stunted, and
most leaves were absent.
124
Larval feeding caused delays in plant development, as measured by
days in first bloom, that were proportional to larval density (Table 18).
The mean (averaged across years) number of extra days to first bloom was
0.8, 2.2, 4.7, 8.5, and 10.7 days for densities of 1.5, 3, 6, 9, and
2 12 larvae/0.1 m , respectively. In most years, delays caused by 1.5 and
2 3 larvae/0.1 m were not statistically significant. Damage by higher
densities delayed first bloom significantly in most years.
The effects of VCW stubble feeding on forage quality and nutrient
yields are shown in Fig. 10. CP and forage digestibility declined in all
treatments with time. The relative differences between treatments in
forage quality also were similar on most sample dates. Forage quality
2 almost always was greater in the 6, 9, and 12 larvae/0.1 m treatments
than in the lower density treatments. In most instances, forage quality
2 was significantly (P < .05) different in the 9 and 12 larvae/0.1 m
treatments in 1982, but not in 1981. Comparisons of the 0, 1.5, and
2 3 larvae/0.1 m treatments usually were not significant (P > .05) on
most sample dates for CP and IVDDM.
The increase in forage quality with larval density was not enough
to prevent significant reductions in nutrient (CP and DDM) yields
(Fig. 10). Larval defoliation produced similar, significant reductions
in CP and DDM yields on all sample dates in all years. Densities of 6,
2 9, and 12 larvae/0.1 m significantly (P < .05) reduced nutrient yields
on nearly all sample dates, when compared with lower density treatments.
Nutrient yields were not significantly (P > .05) different in the 9 and
2 12 larvae/0.1 m treatments on any date in 1981 and 1982, except on day
21 in 1982. Additionally, there were no consistently significant
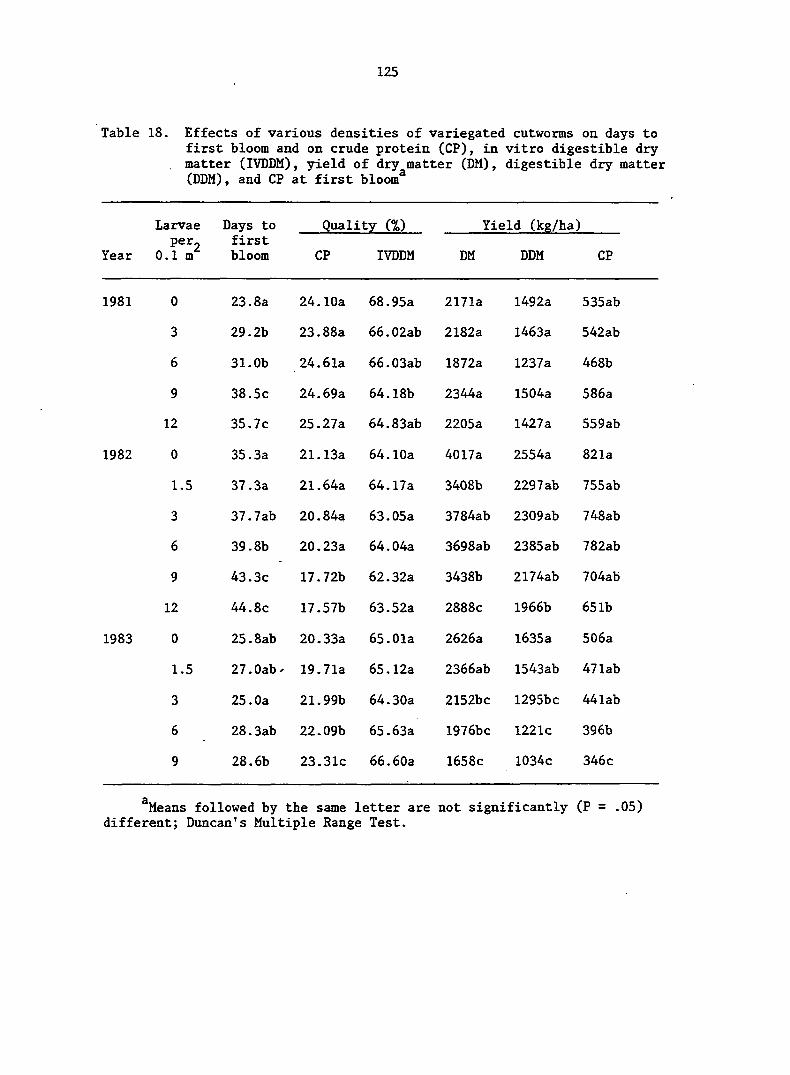
125
Table 18. Effects of various densities of variegated cutworms on days to first bloom and on crude protein (CP), in vitro digestible dry
. matter (lYDDM), yield of dry matter (DM), digestible dry matter (DDM), and CP at first bloom^
Larvae Days to Quality (%) Yield (kg/ha)
Year per.
0.1 m first bloom CP IVDDM DM DDM CP
1981 0 23.8a 24.10a 68.95a 2171a 1492a 535ab
3 29.2b 23.88a 66.02ab 2182a 1463a 542ab
6 31.0b 24.61a 66.03ab 1872a 1237a 468b
9 38.5c 24.69a 64.18b 2344a 1504a 586a
12 35.7c 25.27a 64.83ab 2205a 1427a 559ab
1982 0 35.3a 21.13a 64.10a 4017a 2554a 821a
1.5 37.3a 21.64a 64.17a 3408b 2297ab 755ab
3 37.7ab 20.84a 63.05a 3784ab 2309ab 748ab
6 39.8b 20.23a 64.04a 3698ab 2385ab 782ab
9 43.3c 17.72b 62.32a 3438b 2174ab 704ab
12 44.8c 17.57b 63.52a 2888c 1966b 651b
1983 0 25.8ab 20.33a 65.01a 2626a 1635a 506a
1.5 27.0ab, 19.71a 65.12a 2366ab 1543ab 47 lab
3 25.0a 21.99b 64.30a 2152bc 1295bc 44 lab
6 28.3ab 22.09b 65.63a 1976bc 1221c 396b
9 28.6b 23.31c 66.60a 1658c 1034c 346c
^Means followed by the same letter are not significantly (P = .05) different; Duncan's Multiple Range Test.

Figure 10. Response of alfalfa crude protein (CP), m vitro digestible dry matter (lYDDM), CP yield and digestible dry matter (DDM) yield tg stubble injury by various densities (larvae/0-1 m ) of variegated cutworms in 1982 and 1983 (1981 data not shown)

127
1982 1983
DAYS AFTER CUTTING
DAYS AFTER CUTTING
1982
DAYS AFTER CUTTING
1982 1983
DAYS AFTER CUTTING

128
(P > .05) differences in nutrient yields between treatments with 3 or
2 less larvae/0.1 m in any year. Consequently, on any particular sample
date, larval damage increased forage quality, but reduced nutrient
yields in direct proportion with larval density. These effects, however,
generally were significant only for densities of 6 or greater larvae/0.1
2 m . Lower densities did not consistently affect forage quality or
nutrient yields significantly.
Larval damage had variable effects on forage quality at first bloom
(Table 18). Although IVDDM tended to decline with increasing densities,
there were no strong and significant trends in forage quality at first
bloom in 1981. IVDDM was not significantly different between treatments
in 1982 and 1983. CP levels declined significantly with larval densi
ties in 1982, but increased significantly with larval densities in 1983.
Thus, there were no strong and consistent trends in either measure of
quality at first bloom when all three years are considered. This result
and the similar trends in quality in all treatments over time suggest
that most of the differences in quality on a particular sample date were
caused by differences in relative herbage age. There was little evidence
of an additional affect on forage quality, exclusive of the effect on
herbage age, as a result of larval stubble damage.
There also were no consistently significant trends in dry matter
and nutrient yields at first bloom in 1981. The lack of effect on DM
production in 1981 probably was the result of moisture conditions during
this trial. Moisture stress during the first 3.5 weeks of the study
suppressed growth rates in all treatments. When it did rain, undamaged
2 plants and plants damaged by 1.5 to 6 larvae/0.1 m already were entering
129
the reproductive phase, and they did not respond to the moisture by pro-
2 ducing additional growth. Plants damaged by 9 and 12 larvae/0.1 m ,
however, were less mature, and responded to the rain with a flush of
growth. This extra growth ameliorated the initial loss in DM production.
Larval damage produced significant reductions in DM and nutrient
yields at first bloom in 1982 and 1983. The declines were more severe
in 1983 than 1982. Nine larvae/0.1 m^ reduced DM, DDM, and CP yields at
first bloom by 14.4, 14.9, and 14.3% in 1982 and by 36.8, 36.8, and 31.6%
in 1983, respectively. Furthermore, DM and nutrient yield reductions
within a year were proportional, suggesting that most of the reduction
in nutrient yields was attributable to the decline in DM production.
Economic analysis
Trends in nutrient yields were reflected in the estimation of mean
dollar values for both harvest systems (Table 19). There were no con
sistent trends at first bloom in dollar values in 1981. Values based on
calendar dates, however, did decline proportionally with larval density.
Values estimates in 1982 and 1983 also declined in direct proportion with
larval density for both harvest systems.
Value estimates from 1982 and 1983 were used to calculate economic
injury levels for VCW. Data from 1981 were not included because of the
droughty conditions during this trial. Dollar losses were regressed
against larval density using data from both years and forcing equations
2 through the origin. The predicted loss per larva per 0.1 m at first
bloom for hay prices at $61 and $77/MT was $4.67 and $5.96/ha, respec-
2 tively. Dollar losses per larva per 0.1 m . for a calendar-date harvest
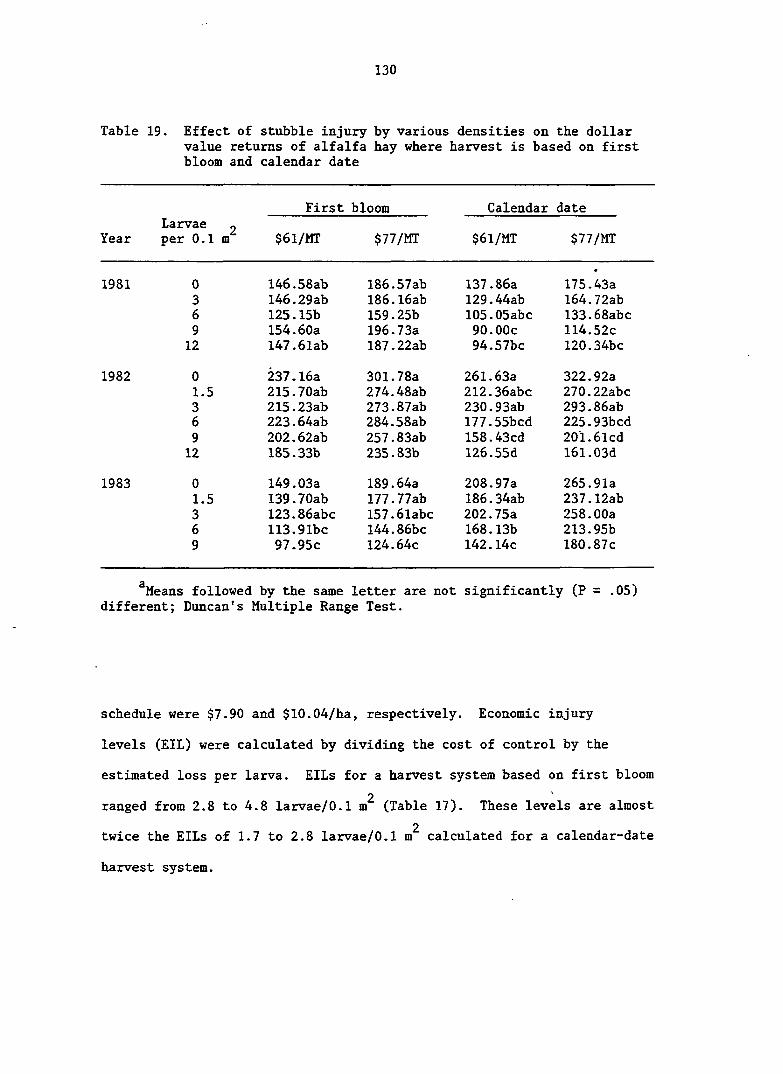
130
Table 19. Effect of stubble injury by various densities on the dollar value returns of alfalfa hay where harvest is based on first bloom and calendar date
Year Larvae g per 0.1 m
First bloom Calendar date
Year Larvae g per 0.1 m $61/MT $77/MT $6l/MT $77/MT
1981 0 I46.58ab 186.57ab 137.86a 175.43a
3 I46.29ab 186.I6ab 129.44ab I64.72ab 6 125.15b 159.25b 105.05abc 133.68abc
9 154.60a 196.73a 90.00c 114.52c
12 I47.6lab 187.22ab 94.57bc 120.34bc
1982 0 237.16a 301.78a 261.63a 322.92a
1.5 215.70ab 274.48ab 212.36abc 270.22abc
3 215.23ab 273.87ab 230.93ab 293.86ab 6 223.64ab 284.58ab 177.55bcd 225.93bcd
9 202.62ab 257.83ab 158.43cd 201.6led
12 185.33b 235.83b 126.55d 161.03d
1983 0 149.03a 189.64a 208.97a 265.91a
1.5 139.70ab 177.77ab 186.34ab 237.12ab
3 123.86abc 157.6labc 202.75a 258.00a 6 113.91bc 144.86bc 168.13b 213.95b
9 97.95c 124.64c 142.14c 180.87c
*Means followed by the same letter are not significantly (P = .05) different; Duncan's Multiple Range Test.
schedule were $7.90 and $10.04/ha, respectively. Economic injury
levels (EIL) were calculated by dividing the cost of control by the
estimated loss per larva. EILs for a harvest system based on first bloom
2 ranged from 2.8 to 4.8 larvae/0.1 m (Table 17). These levels are almost
2 twice the EILs of 1.7 to 2.8 larvae/0.1 m calculated for a calendar-date
harvest system.
131
DISCUSSION
The results of this research demonstrate that 6 or greater larvae/
2 0.1 m are required to completely suppress alfalfa regrowth. Stubble
injury had a more adverse effect on dry matter production than on plant
development. Consequently, actual and simulated stubble injury produced
two primary effects on regrowth; (1) a delay in plant development with
a concomitant loss in DM, and (2) an additional loss in DM associated
with a reduction in the subsequent rate of growth. These relationships
are illustrated in Figure 11 for complete delays of regrowth, but the
same relationships apply to injury caused by larvae (e.g., substitute
larval density for length of regrowth delay). Regrowth quality was
affected primarily by the relative delay in herbage chronology. No
strong additional effect on herbage quality, other than the effect on
herbage age, was evident. The delay in plant development and reduction
in growth rates, however, were significant only when regrowth was
completely delayed for more than 3 days. Likewise, these effects were
significant only when larval densities were large enough to suppress
2 regrowth almost completely (i.e., 6 or greater larvae/0.1 m ).
The response of alfalfa regrowth to stubble injury was remarkably
similar in both studies. This indicates that the damage simulation
technique satisfactorily mimicked a complete suppression of regrowth
caused by insect injury. Furthermore, these results suggest the primary
effect of stubble injury was the removal of regrowth biomass with minimal
adverse effects as a result of feeding toxicants or other larval activi
ties.
Figure 11. Stylized response of alfalfa yield to complete regrowth delays of 7 and 11 days showing the developmental delay and yield loss at first bloom, and the yield loss for a calendar-date harvest system when undamaged plants are at first bloom

Yield (kg/ha x 1000)
2.5
- \
2 . 0
o o °1.5
5
2
•V
Grain ^Threshold
\ \
Flrsî"" Bloom
\ Harvest
CalendaN, Date \ Harvest \
\ \
i=_l L I I I—L _L _L
T3 is >
1.0
0 13 7 11 Regrowth delay (days)
0.5
Yield loss at first bloom
^ Yield at first bloom
Delay (days) in first bloom
Yield when undamaged plants at first bloom
W w
15 20 25
Days after cutting

134
The economic analysis of stubble injury would be simplified were it
not for the fact that most alfalfa grown for consumption by livestock
is harvested based on stage of plant development rather than calendar
date (Smith 1975). Alfalfa may be harvested by calendar date for a
number of reasons including the production of dehydrated pellets. There
fore, should yield-loss equations be based on yield differences for a
particular sample date, such as day 35 in all years, or.should loss
equations be based on yield differences for the same stage of plant
physiological development? In instances where alfalfa is harvested
based on stage of development, such as first or 1/10 bloom, threshold
calculations probably should be based on the yield loss relationship
for the same stage of development (Fig. 11). The associated develop
mental delay can be ignored unless: (1) the delay caused the loss of
an entire subsequent cutting (such as the last cutting of the year), or
(2) delay in the last cutting did not allow enough time to replenish
root reserves before the winter. Probably a delay in plant development
of greater than 1 week would be needed before subsequent harvest schedules
would be adversely affected. Otherwise, the grower still would realize
the same number of cuttings, and assuming no significant carryover effects
on dry matter production, yield loss will occur only during the cutting in
which stubble feeding occurs. Stubble injury by AW during the second
growth cycle has been found not to cause significant carryover effects on
yield (Liu and Fick 1975).
In the present study, delay thresholds based on first bloom ranged
from 4.4 to 7.5 days. First bloom was retarded by 1.2 and 3.4 days when
regrowth was completely suppressed for 3 and 7 days, respectively. Con
135
sequently, delays in first bloom associated with the calculated delay-
loss thresholds probably would be within the range of 1 to 3.5 days.
Therefore, the delay-loss thresholds calculated for a harvest system
based on cutting at first bloom are valid, and damage for these dura
tions probably would not adversely affect subsequent harvest schedules.
Likewise, economic injury levels calculated based on losses at
first bloom indicated that control measures would be justified for 2.8
2 to 4.8 newly-molted, last-stage larvae/0.1 m . Stubble feeding by this
range of larval densities would result in less than a complete delay of
regrowth. Delays in plant development for infestations of 3 and 6 larvae/
2 0.1 m were 2.2 and 4.7 days, respectively. Thus, developmental delays
caused by densities at the EIL most likely would fall within the range
of 2 to 4 days. Again, this developmental delay is not excessive and
probably would not appreciably alter subsequent harvest schedules.
A management program for VCW in alfalfa stubble can be developed
from these results for a harvest system based on cutting at or near
first bloom. If VCW larvae were present at economic levels, but most
larvae were full grown and within several days of pupation, curative
measures probably would not be needed. This is because most larvae
probably would finish feeding and pupate before the delay-loss threshold
of 4.5 to 7.5 days was exceeded. If, however, most larvae were at or near
the beginning of the last larval stage, thus having ca. 75% of their
total potential consumption remaining (Part I of this dissertation), the
calculated EILs should be used (Table 17). In this instance, the economic
threshold is set equal to the EIL, because the population is being

136
evaluated while maximal damage is occurring and when little or no further
increase in the population would be expected.
If, however, alfalfa is harvested based on calendar date, the
associated developmental delay at first bloom could be important because
a delay may require the alteration of subsequent harvest schedules. In
this instance, damage thresholds should be based on the yield-loss
relationship for a sample date when the undamaged plants are at or near
a desired stage of development. Delay loss thresholds for cutting by
calendar date ranged from 2.6 to 4.3 days. Because hay for pelleting is
green-chopped and removed in one operation, fields could be scouted for
stubble injury one to two days after cutting. Curative measures would
be justified if damage is expected to exceed the delay loss threshold,
or if VCW populations exceed the calculated Ells (Table 17). EILs should
be applied even if larvae are near pupation, because damage most likely
would continue past the delay-loss threshold.
The results of the regrowth delay study also have implications for
the management of stubble feeding by other defoliators, particularly the
AW. Regrowth can be completely suppressed by defoliators during the
three to four days while hay is being processed, without the crop suffer
ing substantial economic losses. This is especially true in less
intensively managed alfalfa. Consequently, fields can be scouted for
stubble defoliators, including VCW, during this time and a decision made
concerning curative measures once the hay is removed, without adversely
affecting productivity.
Management of the AW usually involves early first cutting followed
by the treatment of the stubble with insecticide if needed (DeWitt and

137
Stockdale 1976, Onstad and Shoemaker 1984). Recent research in Kentucky
(Brown, unpublished data) has demonstrated that AW populations also can
be suppressed by inducing natural epizootics of the entomopathogen
Erynia sp. Epizootics are induced by cutting and windrowing the alfalfa
hay, which creates a favorable microenvironment for fungal development.
The incubation period of the fungus is five to six days, consequently
stubble injury during this time must be tolerated. Delay-loss thresholds
were within this range for on-farm hay ($6l/MT) that is harvested based
on stage of plant development. Therefore, the inducement of fungal
epizootics by harvest procedures is a viable alternative to stubble
sprays for less intensely managed alfalfa, if the grower is willing to
accept the risk of little control should the fungal epizootic fail to
develop.

138
SUMMARY Aim CONCLUSIONS
The response of alfalfa to actual and simulated stubble injury by
the variegated cutworm (VCW) was investigated in a laboratory and two
field studies. The objectives of this research were to: (1) characterize
the damage-response syndrome of alfalfa to stubble injury in terms of
growth, development, and partitioning, (2) assess the effects of complete
regrowth delays for varying periods on subsequent growth and yield,
(3) elucidate the relationships between larval density and alfalfa growth
and yield, and (4) quantify VCW larval development and foliage consump
tion on alfalfa. With these data, a final overall objective was (5) to
develop economic injury levels and management practices for VCW in
alfalfa, and make progress towards the development of a more comprehen
sive management program for stubble-feeding insects in alfalfa.
Larvae exhibited 6 or 7 larval stages in the laboratory, with most
larvae (61.3%) undergoing 7 molts. Larvae with 6 and 7 molts required
35.6 and 32.8 days for development at 24°C, and consumed 352.6 and
442.4 mg of foliage, respectively- Mode-7 larvae consumed 75% of their
total consumption during the last stage, and both modes consumed about
95% of total consumption from stage 5 to pupation. Larval and adult dry
weights indicated that larvae with 7 malta/probably were representative
of feral individuals. Consequently, an alfalfa-consumption model was
developed using data for mode-7 larvae. Based on these results, the
damage potential of VCW during the first cutting probably will not be
large, if cutting occurs before most larvae have entered the last stage.
Because of the high rate of consumption by last-stage larvae, however,

139
a small number of these larvae present after cutting may cause consider
able damage to alfalfa stubble.
The response of alfalfa regrowth to the duration and intensity of
stubble injury by VCW was investigated in several field studies. The
duration component of stubble damage was examined in a study of the
effects of a complete regrowth suppression for varying times on alfalfa
productivity. Complete regrowth suppression was simulated by hand-
picking foliage for 1, 3, 7, and 11 days. The effect of damage intensity
was investigated in a separate field study of the response of alfalfa
to stubble feeding by various densities of VCW larvae. This study
demonstrated that newly-molted, last-stage larvae injured regrowth for
10 to 15 days. This time range is similar to the stadia observed in the
laboratory for last-stage larvae. Densities of 6 and greater larvae/
2 0.1 m were needed to completely suppress alfalfa regrowth. Lower densi
ties suppressed regrowth only partly by reducing the rate of shoot initia
tion and damaging shoots that did grow.
Complete regrowth suppression for 1 and 3 days did not significantly
retard plant development or alter rates of growth and partitioning. The
lack of effect of these delays probably was a consequence of the greatly
reduced growth rate during the first 3 days of regrowth. Growth rates
increased substantially after the third day. Plants with regrowth
delayed for more than 3 days seemed to produce herbage at the greater
rate immediately, thus avoiding most of the initial 3 days of reduced
growth.
Analysis of growth and partitioning rates generally showed similar
effects on regrowth for both actual and simulated stubble injury. This
140
suggests that the simulation technique satisfactorily mimicked actual
defoliation where regrowth is suppressed completely. Stubble injury
caused delays in plant development and reduced subsequent crop growth
rates (CGR). Most of the reduction in CGR was caused by a decline in
the growth rate of support structures. Leaf and leaf area growth rates
generally were not significantly reduced by stubble damage. The sup
pression in support growth relative to leaf and leaf area growth rates
resulted in an increased leaf area ratio. Leaf area ratio was enhanced
by a combined increase in the leaf weight ratio and specific leaf area.
The increase in leaf weight ratio was attributed to the production of
heavier leaves rather than the production of more leaves per unit of
total dry weight. The main difference in plant response in both studies
was that actual larval damage increased the production rate of stem
height, whereas, stem-height production was not significantly increased
by simulated stubble defoliation. The cause of this discrepancy was not
determined. The changes in plant growth and partitioning however, were
significant only when regrowth was completely suppressed for 7 or more
days. Likewise, growth and partitioning were affected significantly in
all years only when larval damage was severe enough to suppress regrowth
2 almost completely (e.g., densities of 6 or greater larvae/0.1 m ). Al
though lesser densities significantly affected regrowth in some years,
these densities did not consistently affect regrowth in all years.
The combined results of both studies indicated that a complete
suppression of regrowth for 7 or more days caused: (1) an initial delay
in plant growth and development with a concomitant loss in dry matter,
and (2) an additional dry matter loss caused by the reduction in sub

141
sequent growth rates. Damaged plants partitioned more leaf area per
unit of dry weight through relative increases in both leaf weight per
unit of total dry weight and leaf area per unit of leaf weight. The
latter trend resulted in a reduction in leaf density, which has the
effect of increasing leaf area available for light interception without
a concomitant increase in leaf biomass. The overall effect of the
changes in plant partitioning was to minimize the adverse effects of
insect-induced stubble injury by maintaining growth rates of leaf weight
and area at the expense of support structure growth.
A hypothesis was postulated to explain the changes in partitioning
by damaged plants. The hypothesis is based on the depletion of stored
carbohydrate reserves, while regrowth is being suppressed. Once defolia
tion ceases, regrowth presumably would proceed without the benefit of
large reserves of stored carbohydrates. New shoots, therefore, would be
more dependent on currently produced photosynthates for growth. Because
assimilate sources (i.e., leaves) tend to satisfy their own needs before
exporting assimilates (Cook and Evans 1978), leaf growth probably would
not.be suppressed greatly. Growth rates of support structures (i.e.,
assimilate sinks), however, most likely would be suppressed more
severely, because of the loss of stored carbohydrates to maintain growth
and the inability of current photosynthesis to make up the difference.
Although this simple hypothesis may explain the observed changes in
plant partitioning, it is possible that other factors, such as hormone
levels in damaged plants, may be partly responsible for the altered
rates of growth and partitioning.
142
A replacement feed-cost analysis was conducted for both studies,
using commodity prices for on-farm and off-farm hay. Dollar-loss equa
tions were generated for harvest systems where cutting is based on
either plant stage, such as first bloom, or calendar date for a date
when undamaged plants are near the desired stage for harvest. Depending
on commodity price and control costs, delays of 4.4 to 7.5 days would
justify the cost of artificial control for a system where cutting occurs
at first bloom. These values drop to a range of 2.6 to 4.3 days for a
calendar-date harvest system. Economic injury levels (Ell) also were
calculated using data from the larval infestation study. EILs for a
harvest system based on first bloom were 2.8 to 4.8 newly-molted, last-
2 stage larvae/0.1 m , and EILs for a calendar-date system were 1.7 to
2 2.8 newly-molted, last-stage larvae/0.1 m . Therefore, inclusion of the
delay in plant development as a loss criterion reduced action thresholds
by about half.
Based on the results of these studies, a management program was
developed for VCW in alfalfa. Guidelines also were proposed for the
management of other stubble defoliators. The action thresholds and
recommendations generated by this research will permit more effective
management of VCW and other defoliators in alfalfa. Furthermore, the
proposed program should minimize economic losses caused by VCW in alfalfa
and reduce unnecessary applications of insecticides during future out
breaks .

143
LITERATURE CITED
Ayre, G. L., W. J. Turnock, and D. L. Struble. 1983. Spactial and temporal variability in sex attractant trap catches of Leucania commoides and Peridroma saucia (Lepidoptera: Noctuidae) in relation to their biology in Manitoba. Can. Entomol. 115:1573-1582.
Berry, R. E., and E. J. Shields. 1980. Variegated cutworm: leaf consumption and economic loss in peppermint. J. Econ. Entomol. 73: 607-608.
Birch, M. C., G. G. Grant, and U. E. Brady. 1976. Male scent brush of Peridroma saucia: Chemistry of secretion. Ann. Entomol. Soc. Am. 69:491-492.
Bjork, C. D., and D. W. Davis. 1984. Consumption of alfalfa by adult alfalfa weevils (Coleoptera: Curculionidae). Environ. Entomol. 13: 432-438.
Bolton, J. I. 1962. Alfalfa: Botany, cultivation, and utilization. Interscience Publishers Inc., N.Y 474 pp.
Boote, K. J. 1981. Concepts for modeling crop response to pest damage. ASAE Pap. 81-4007. ASAE, St. Joseph, MI. 22 pp.
Brown, R. H., R. B. Pearce, D. 0. Wolf, and R. E. Blaser. 1972. Energy accumulation and utilization. In Hanson, C. H. (ed.). Alfalfa Science and Technology. Amer. Soc. Agron. Madison, WI. p. 143-164.
Bula, R. J., and T. R. Hintz. 1978. Estimating alfalfa yield from stem height. Fifteenth Annual Invitational Alfalfa Insects Conference. Purdue Univ. West Lafayette, IN. p. 27-31.
Capinera, J. L. 1978. Variegated cutworm: consumption of sugarbeet foliage and development on sugarbeet. J. Econ. Entomol. 71:978-980.
Capinera, J- L., S. E. Naranjo, and A. R. Renaud. 1981. Alfalfa webworm: larval development in response to diet and temperature. Southwest. Entomol. 6:10-17.
Chittenden, F. H. 1901. The fall armyworm and variegated cutworm. U.S. Dep. Agric., Div. Entomol. Bull. 29:1-64.
Chittenden, F. H. 1902. Estimated loss occasioned by the variegated cutworm in 1900. U.S. Dep. Agric., Div. Entomol. Bull. 38:1-110.

144
Cook, M. G., and L. T. Evans. 1978. Effect of relative size and distance of competing sinks on the distribution of photosynthetic assimilates in wheat. Aust. J. Plant Physiol. 5:495-509.
Cook, W. C. 1923. Studies in the physical ecology of Noctuidae. Minn. Agric. Exp. Stn. Bull. 12:1-27.
Cowett, E. R., and M. A. Sprague. 1962. Factors affecting tillering in alfalfa. Agron. J. 54:294-297.
Cowett, E. R., and M. A. Sprague. 1963. Effect of stand density and light intensity on the microenviromnent and stem production of alfalfa. Agron. J. 55:432-434.
Craven, R. H., and P. R. Hasbargen. 1979. How much is a feed worth? Univ. Minn. Agric. Ext. Serv. Fact Sheet FM 560. 2 pp.
Crumb, S. E. 1929. Tobacco cutworms. U.S. Dep. Agric. Tech. Bull. 88:1-176.
DeWitt, J., and H. Stockdale. 1976. Controlling the alfalfa weevil. Iowa Coop. Ext. Serv. IC-428. 2 p.
DeWitt, J., and S. E. Taylor. 1984. Integrated pest management decision guide. Iowa Coop. Ext. Serv. Publ. IPM-22. 113 pp.
Dirks, C. A. 1937. Biological studies of Maine moths by light trap methods. Maine Agric. Exp. Stn. Bull. 389:1-162.
Doane, R. W., and D. A. Brodie. 1901- The variegated cutworm. Wash. Agric. Exp. Stn. Bull. 47:1-16.
Fick, G. W. 1976. Alfalfa weevil effects on regrowth of alfalfa. Agron. J. 68:809-812.
Fick, G. W. 1982. Simulating alfalfa weevil effects by defoliation. Agron. J. 74:835-840.
Fick, G. W., and B. W. Y. Liu. 1976. Alfalfa weevil effects on root reserves, development rate, and canopy structure. Agron. J. 68:595-599.
Finney, G. L. 1964. The rearing of the variegated cutworm, Peridroma saucia, in the laboratory. J. Econ. Entomol. 57:788-790.
Forbes, S. A. 1904. The more important insect injuries to Indian corn. Univ. Illinois Agric. Exp. Stn. Bull. 95:331-399.
Frost, S. W. 1955. Cutworms of Pennsylvania. Penn. State Agric. Exp. Stn. Bull. 596:1-29.

145
Fuess, F. W., and M. B. Tesar. 1968. Photosynthetic efficiency, yields, and leaf loss in alfalfa. Crop Sci. 8:159-163.
Graber, L. F., N. T. Nelson, W. A. Luekel, and W. B. Albert. 1927. Organic food reserves in relation to the growth of alfalfa and
other perennial herbaceous plants. Wisconsin Agric. Exp. Stn. Res. Bull. 80 pp.
Carman, H. 1895. Cutworms of Kentucky. Kentucky Agric. Exp. Stn. Bull. 114:15-47.
Gibson, A. 1915. Cutworms and their control. Dom. Canada Dep. Agric. Entomol. Br. Bull. 10:1-31.
Grandfield, C. 0., and R. I. Throckmorton. 1945. Alfalfa in Kansas. Kansas Agric. Exp. Stn. Bull. 328:1-64.
Grueb, L. J., and W. F. Wedin. 1971. Leaf area, dry-matter accumulation, and carbohydrate reserves of alfalfa and birdsfoot trefoil under a three-cut management. Crop Sci. 11:341-344.
Hamlin, J. C., F. V. Lieberman, R. W. Bunn, W. C. McDuffie, R. C. Newton, and L. J. Jones. 1949. Field studies of the alfalfa weevil and its environment. USDA Tech. Bull. 975. 84 pp.
Hanson, C. H., and D. K. Barnes. 1973. Alfalfa. In Heath, M. E.; D. S. Metcalfe, and R. F. Barnes (ed.). Forages 3rd ed. Iowa State Univ. Press, Ames, Iowa, pp. 136-147.
Harper, K. C. 1970. Laboratory production of Peridroma saucia and its nuclear polyhedrosis virus. J. Econ. Entomol. 63:1633-1634.
Higgins, R. A., L. P. Pedigo, and D. W. Staniforth. 1983. Selected
preharvest morphological characteristics of soybean stressed by
simulated green cloverworm (Lepidoptera: Noctuidae) defoliation and velvetleaf competition. J. Econ. Entomol. 76:484-491.
Hinson, K., R. H. Nino, and K. J. Boote. 1978. Characteristics of removed leaflets and yield response of artificially defoliated soybeans. Proc. Soil Crop Sci. Soc. Fla. 37:104-109.
Hodgkinson, K. C. 1969. The utilization of root organic compounds during the regeneration of lucerne. Aust. J. Biol. Sci. 22:1113-1123.
Hodgkinson, K. C. 1973. Establishment and growth of shoots following low and high cutting of lucerne in relation to the pattern of nutrient uptake. Aust. J. Agric. Res. 24:497-510.
146
Hodgkinson, K. C. 1974. Influence of partial defoliation on photosynthesis, photorespiration and transpiration by lucerne leaves of different ages. Aust. J. Plant. Physiol. 1:561-578.
Hodgkinson, K. C., N. G. Smith, and G. E. Miles. 1972. The photo-synthetic capacity of stubble leaves and their contribution to growth of the lucerne plant after high level cutting. Aust. J. Agric. Res. 23:225-238.
Hoglund, C. R. 1964. Comparative losses and feeding values of alfalfa and corn silage crops when harvested at different moisture levels and stored in gastight and conventional tower silos: An appraisal of research results. Mich. State Univ. Agric. Econ. Publ. 947. 16 pp.
Hintz, T. R., M. C. Wilson, and E. J. Armbrust. 1976. Impact of alfalfa weevil larval feeding on the quality and yield of first cutting alfalfa. J. Econ. Entomol. 69:749-754.
Hunt, R. 1978. Plant Growth Analysis. Studies in Biol. no. 69. Inst, of Biol. Edward Arnold Ltd. London. 67 pp.
Knutson, H. 1944. Minnesota Phalaenidae (Noctuidae): The seasonal history and economic importance of the more common and destructive species. Univ. Minn. Agric. Exp. Stn. Bull. 165:1-128.
Leach, G. L. 1968. The growth of the lucerne plant after cutting: The effects of cutting at different stages of maturity and at different intensities. Aust. J. Agric. Res. 19:517-530.
Leach, G. L. 1969. Shoot numbers, shoot size, and yield of regrowth in three lucerne cultivars. Aust. J. Agric. Res. 20:425-434.
Leach, G. L. 1970. Shoot growth on lucerne plants cut at different heights. Aust. J. Agric. Res. 21:583-591.
Liu, B. W. Y., and G. W. Pick. 1975. Yield and quality losses due to alfalfa weevil. Agron. J. 67:828-832.
Marten, G. C., and R. F. Barnes. 1979. Prediction of energy digestibility of forages with m vitro rumen fermentation and fungal enzyme systems. Proc. Int. Workshop Standardization Anal. Methodol. Feeds IDRC-134e:67-71.
McClanahan, R. J., and W. M. Elliott. 1976. Light trap collections of certain economically important Lepidoptera at Harrow, Ontario. Proc. Entomol. Soc. Ontario. 107:57-63.
Milliron, H. E. 1958. Economic insect and allied pests of Delaware. Univ. Delaware Agric. Exp. Stn. Bull. 321:1-87.
147
National Academy of Science. 1969. Insect pest management and control. NAS Publ. 1695. 505 pp.
National Research Council. 1969. United States-Canadian tables of feed composition. Nat. Acad. Sci. Government Printing Office Publ. ISBN 0-309-01684-3. Washington. 350 pp.
Nelson, C. J., and D. Smith. 1968a. Growth of birdsfoot trefoil and alfalfa. II. Morphological development and dry matter distribution. Crop. Sci. 8:21-25.
Nelson, C. J., and D. Smith. 1968b. Growth of birdsfoot trefoil and alfalfa. III. Changes in carbohydrate reserves and growth under field conditions. Crop Sci. 8:25-28.
Nelson, C. J., and D. Smith. 1969. Growth of birdsfoot trefoil and alfalfa. IV. Carbohydrate reserve levels and growth analysis under two temperature regimes. Crop Sci. 9:589-591.
Newton, R. C., and R. R. Hill Jr. 1970. Use of caged adult forage insects to determine their comparative roles in delaying the regrowth of alfalfa. J. Econ. Entomol. 63:1542-1543.
Onstad, D. W., and C. A. Shoemaker. 1984. Management of alfalfa and alfalfa weevil (Hypera postica): An example of systems analysis in forage production. Agric. Systems 14:1-30.
Pearce, R. B., G. Fissel, and G. E. Carlson. 1969. Carbon uptake and distribution before and after defoliation of alfalfa. Crop Sci. 9:756-759.
Pierce, W. D. 1934. At what point does insect attack become damage? Entomol. News 40:1-4.
Poston, F. L., L. P. Pedigo, and S. M. Welch. 1983. Economic injury levels: Reality and practicality. Bull. Entomol. Soc. Am. 29:49-53.
Rings, R. W., B. A. Johnson, and F. J. Arnold. 1976a. A worldwide, annotated bibliography of the variegated cutworm. Ohio Agric. Res. and Develop. Center, Res. Circ. 219. 126 pp.
Rings, R. W., B. A. Johnson, and F. J. Arnold. 1976b. Host range of the variegated cutworm on vegetables: A bibliography. Bull. Entomol. Soc. Am. 22:409-415.
Selman, C. L., and H. E. Barton. 1972. Seasonal trends in catches of moths of 12 harmful species in blacklight traps in northeast Arkansas. J. Econ. Entomol. 65:1018-1020.
148
Shields, E. J. 1983. Development rate of variegated cutworm (Lepidoptera: Noctuidae). Ann. Entomol. Soc. Am. 76:171-172.
Shorey, H. H., and R. L. Hale. 1965. Mass-rearing of the larvae of nine noctuid species on a single artifical medium. J. Econ. Entomol. 58:522-524.
Showers, W. B., and L. V. Raster, and P. G. Mulder. 1983. Corn seedling growth stage and black cutworm (Lepidoptera: Noctuidae) damage. Environ. Entomol. 12:241-244.
Simonet, D. E., S. L. Clement, W. L. Bubink, and R. W. Rings. 1981. Temperature requirements for development and oviposition of Peridroma saucia (Lepidoptera: Noctuidae). Can. Entomol. 113:891-897.
Singh, Y., and J. E. Winch. 1974. Morphological development of two alfalfa cultivars under various harvesting schedules. Can. J.
Plant Sci. 54:79-87.
Smith, D. 1972. Cutting schedules and maintaining a pure stand. In Hanson, S. H. (ed.). Alfalfa Science and Technology. Am. Soc. Agron. Madison WI. p. 481-493.
Smith, D. 1975. Forage Management in the North. 4th ed. Kendall Hunt Publishing Co. Dubuque, Iowa. 258 pp.
Smith, D., and C. J. Nelson- 1967. Growth of birdsfoot trefoil and alfalfa. I. Responses to height and frequency of cutting.
Crop Sci. 7:130-133.
Smith, D., and J. P. Silva. 1969. Use of carbohydrate and nitrogen root reserves in the regrowth of alfalfa from greenhouse experiments under light and dark conditions. Crop Sci. 9:464-467.
Smith, L. H., and G. C. Marten. 1970. Foliar regrowth of alfalfa utilizing C-labeled carbohydrates stored in roots. Crop Sci.
10:146-150.
Snyder, K. D. 1951. The biology of the variegated cutworm, Peridroma saucia (Hiïbner), with special reference to the effect of temperature and food on development. Ph.D. Dissertation. University of
California, Berkley. 92 pp.
Snyder, K. D. 1954. The effect of temperature and food on the development of the variegated cutworm Peridroma margaritosa Haw. (order Lepidoptera, family Noctuidae). Ann. Entomol. Soc. Am. 47:603-613.
Soteres, K. M., R. C. Berberet, and R. W. McNew. 1984. Parasites of larval Euxoa auxiliaris (Grote) and Peridroma saucia (Hiïbner) (Lepidoptera: Noctuidae) in alfalfa fields in Oklahoma. J. Kansas Entomol. Soc. 57:63-68.

149
Stern, V. M., R. E. Smith, R. Vanden Bosch, and K. S. Hagen. 1959. The integrated control concept. Hilgardia 29:81-101.
Stone, J. D., and L. P. Pedigo. 1972. Development and economic-injury level of the green cloverworm on soybean in Iowa. J. Econ. Entomol. 65:197-201.
Struble, D. L., G. E. Swailes, W. F. Steck, E. W. Underbill, and M. D. Chisholm. 1976. A sex attractant for adult males of variegated cutworm, Peridroma saucia. Environ. Entomol. 5:988-990.
Tomescu, N., G. Stan, B. Kis, and N. Coman. 1978. The reproduction and development of Peridroma saucia Hb- (Lepidoptera: Noctuidae) under laboratory conditions. Studia Univ. Babes Bolyai Biol. 1:52-55.
U.S. Dep. Agric. 1957-1975. Coop. Economic Insect Report. Coop. Ext. Serv. Government Printing Office. Washington. Volumes 1-25.
U.S. Dep. Agric. 1976-1981. Coop. Plant Pest Report. Coop Ext. Serv. Government Printing Office. Washington. Volumes 1-6.
Vance, C. P., G. H. Heichel, D. K. Barnes, J. W. Bryan, and L. E. Johnson. 1979. Nitrogen fixation, nodule development, and vegetative regrowth of alfalfa (Medicago sativa L.) following
harvest. Plant Physiol. 64:1-8.
Wadley, F. M. 1921. Life history of the variegated cutworm. J. Econ. Entomol. 14:272-277.
Waldbaurer, G. P. 1968. The consumption and utilization of food by insects. Adv. Insect Physiol. 5:229-288.
Walkden, H. H. 1950. Cutworms, armyworms, and related species attacking cereal and forage crops in the central Great Plains. U.S. Dep. Agric. Circ. 849:1-52.
Wilfong, R. T., R. H. Brown, and R. E. Blaser. 1967. Relationships between leaf area index and apparent photosynthesis in alfalfa (Medicago sativa L.) and ladino clover (Trifolium repens L.). Crop Sci. 7:27-30.
150
ACKNOWLEDGEMENTS
I wish to express my deepest thanks to Dr. Larry P. Pedigo for
serving as my advisor. I am very grateful for the guidance and profes
sional opportunity that you have given me. Likewise, I want to thank
Drs. DeWitt, George, Showers and Wedin for their assistance as members
of my doctoral committee. I also wish to extend a special thank you to
Dr. Sharron Quisenberry, currently at Louisiana State University, for her
assistance and encouragement during my doctoral program.
I am grateful to the other former and current graduate students of
"SPMRU," particularly E. Bechinski, J. Fund^rburk, R. Higgins, L. Higley,
and K. Ostlie, for conceptual and technical assistance throughout this
research. I also wish to thank the numerous technicians that assisted
with my work.
Finally, I wish to acknowledge the invaluable help of my wife, Linda.
Without her love, encouragement, and editorial ability, the completion of
this dissertation may not have been possible.
151
APPENDIX A. MEANS AND ANALYSIS OF DATA FOR THE DELAY OF REGROWTH STUDY
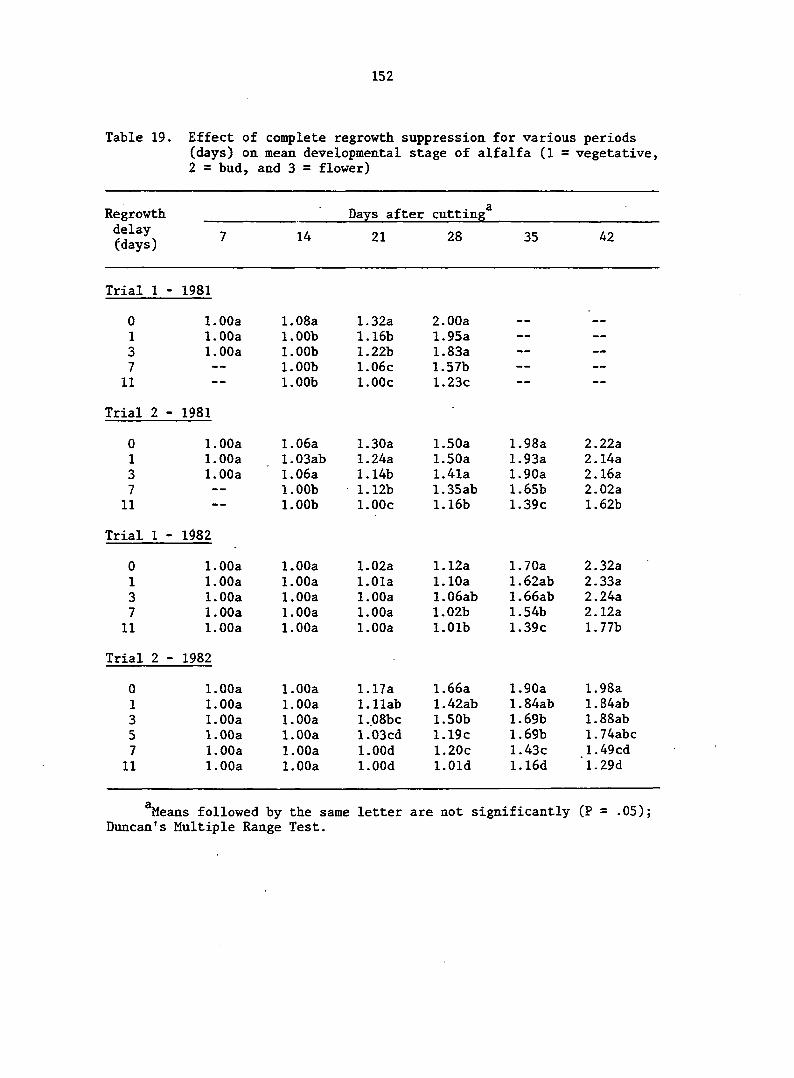
152
Table 19. Effect of complete regrowth suppression, for various periods (days) on mean developmental stage of alfalfa (1 = vegetative, 2 = bud, and 3 = flower)
Regrowth Days after cutting* delay (days)
7 14 21 28 35 42
Trial 1 - 1981
0 1.00a 1.08a 1.32a 2.00a — — — —
1 1.00a 1.00b 1.16b 1.95a - -
3 1.00a 1.00b 1.22b 1.83a — — — —
7 — 1.00b 1.06c 1.57b — - - -
11 — - 1.00b 1.00c 1.23c -- - -
Trial 2 - 1981
0 1.00a 1.06a 1.30a 1.50a 1.98a 2.22a
1 1.00a 1.03ab 1.24a 1.50a 1.93a 2.14a
3 1.00a 1.06a 1.14b 1.41a 1.90a 2.16a
7 — 1.00b 1.12b 1.35ab 1.65b 2.02a
11 — 1.00b 1.00c 1.16b 1.39c 1.62b
Trial 1 - 1982
0 1.00a 1.00a 1.02a 1.12a 1.70a 2.32a
1 1.00a 1.00a 1.01a 1.10a 1.62ab 2.33a
3 1.00a 1.00a 1.00a 1.06ab 1.66ab 2.24a
7 1.00a 1.00a 1.00a 1.02b 1.54b 2.12a
11 1.00a 1.00a 1.00a 1.01b 1.39c 1.77b
Trial 2 - 1982
0 1.00a 1.00a 1.17a 1.66a 1.90a 1.98a
1 1.00a 1.00a l.llab 1.42ab 1.84ab 1.84ab
3 1.00a 1.00a 1.08bc 1.50b 1.69b 1.88ab
5 1.00a 1.00a 1.03cd 1.19c 1.69b 1.74abc
7 1.00a 1.00a l.OOd 1.20c 1.43c 1.49cd
11 1.00a 1.00a l.OOd l.Old l.l6d 1.29d
^eans followed by the same letter are not significantly (P = .05); Duncan's Multiple Range Test.

153
Table 20. Effect of complete regrowth suppression for various periods (days) on percentage alfalfa stems in bud stage
Days after cutting'
delay (days)
7 14 21 28 35 42
Trial 1 - 1981
0 0 9 .Oa 30.0a 64.0a —• — » —
1 0 Ob 16.0b 57.0a — —
3 0 Ob 22.0b 64.0a — —
7 0 Ob 6.0c 57.0a — —
11 0 Ob Oc 23.0b
Trial 2 - 1981
0 0 5 .6a 30.4a 46.4a 26.4b 5.6a
1 0 3 .2ab 20.8b 45.6a 44.8a 8.8b
3 0 6 .4a 10.4c 37.6ab 36.8ab 6.4a
7 0 Ob 15.2bc 32.0ab 33.6ab 8.8a
11 0 Ob Od 16.0b 24.0b 16.8a
Trial 1 - 1982
0 0 0 1.6a 12.0a 69.6a 44.0a
1 0 0 0.8a 10.4a 63.2ab 46.4a
3 0 0 Oa 5.6ab 65.6ab 50.4a
7 0 0 Oa 1.6b 54.4b 65.6ab
11 0 0 Oa 0.8b 39.2c 74.4b
Trial 2 - 1982
0 0 0 15.2a 60.8a 72.8a 44.8a
1 0 0 11.2s 40.8ab 68.8a 33.6ab
3 0 0 8.0ab 49.6b 59.2ab 32.0ab
5 0 0 3.2bc 20.0c 54.4b 35.2ab
7 0 0 Oc 20.0c 40.0c 32.8ab
11 0 0 Oc 0.8d 16.Od 25.6b
^See footnote. Table 19.
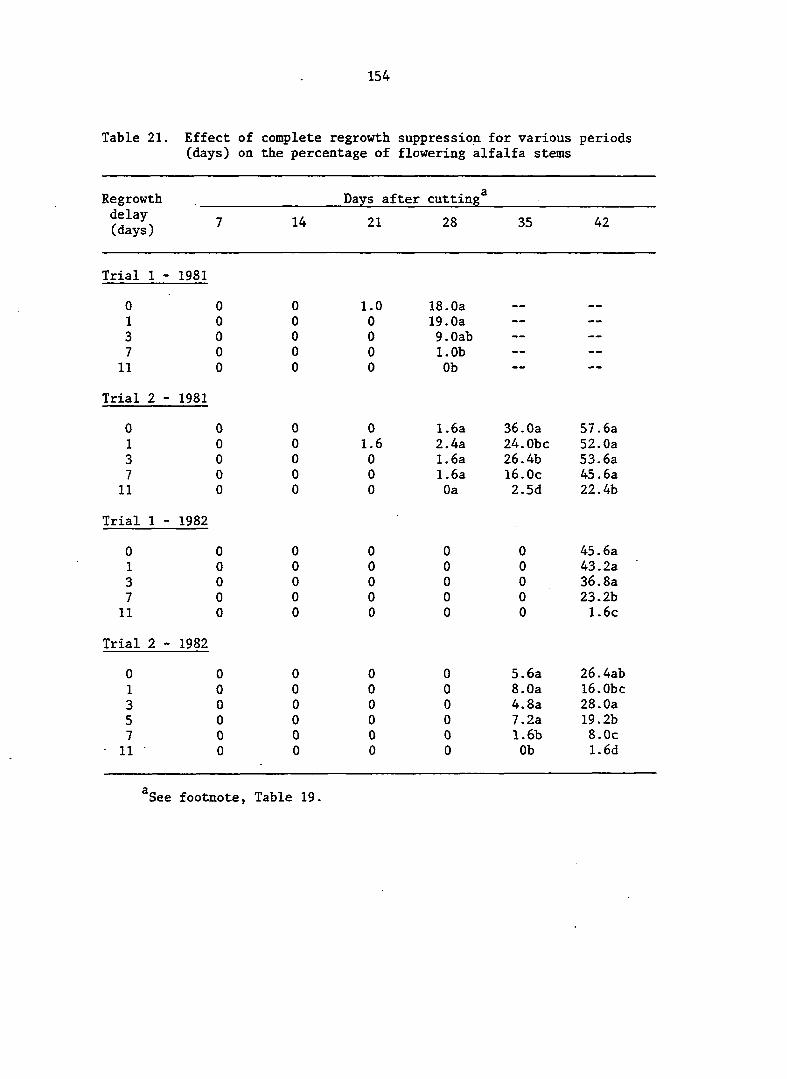
154
Table 21. Effect of complete regrowth suppression for various periods (days) on the percentage of flowering alfalfa stems
Regrowth Days after cutting*
delay (days)
7 14 21 28 35 42
Trial 1 - 1981
0 0 0 1.0 18.0a « «
1 0 0 0 19.0a — — —
3 0 0 0 9.0ab — — — —
7 0 0 0 1.0b --
11 0 0 0 Ob — -
Trial 2 - 1981
0 0 0 0 1.6a 36.0a 57.6a
1 0 0 1.6 2.4a 24.0bc 52.0a
3 0 0 0 1.6a 26.4b 53.6a
7 0 0 0 1.6a 16.0c 45. 6a
11 0 0 0 Oa 2.5d 22.4b
Trial 1 - 1982
0 0 0 0 0 0 45.6a
1 0 0 0 0 0 43.2a •
3 0 0 0 0 0 36.8a
7 0 0 0 0 0 23.2b
11 0 0 0 0 0 1.6c
Trial 2 - 1982
0 0 0 0 0 5.6a 26.4ab
1 0 0 0 0 8.0a l6.0bc
3 0 0 0 0 4.8a 28.0a
5 0 0 0 0 7.2a 19.2b
7 0 0 0 0 1.6b 8.0c
• 11 0 0 0 0 Ob 1.6d
*See footnote, Table 19.
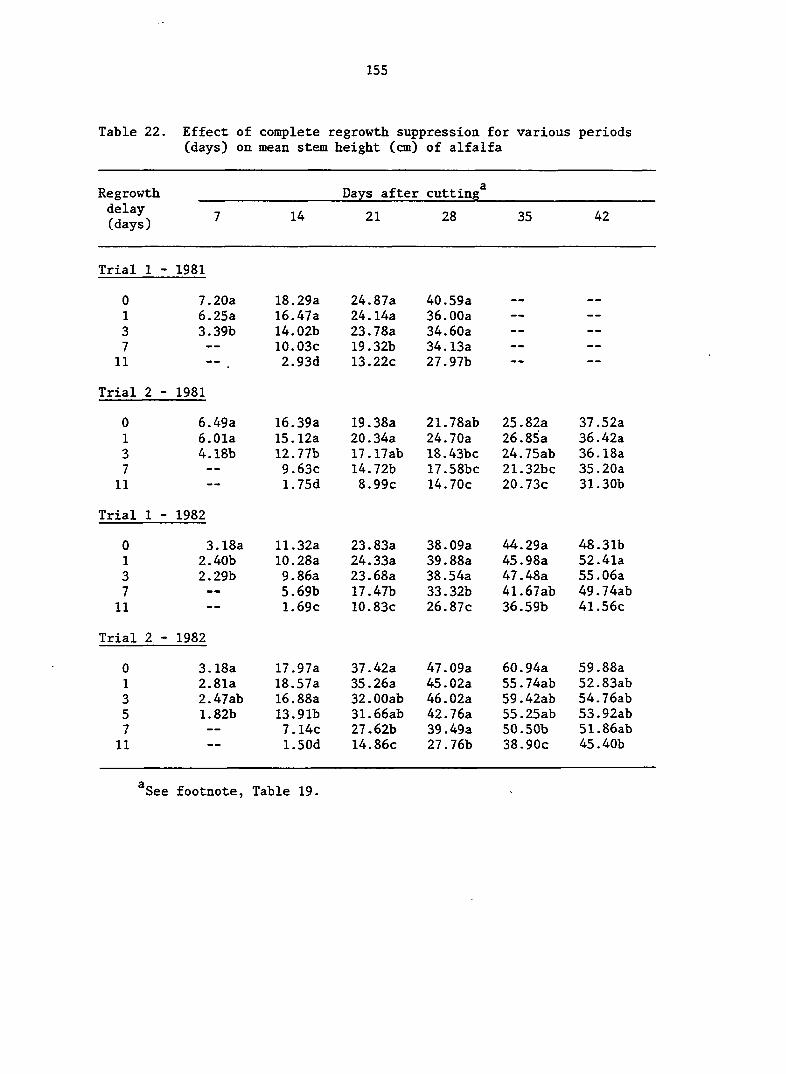
155
Table 22. Effect of complete regrowth suppression for various periods (days) on mean stem height (cm) of alfalfa
Regrowth delay (days)
Days after cutting'
14 21 28 35 42
Trial 1 - 1981
0 1 3 7
11
7.20a 6.25a 3.39b
18.29a 16.47a 14.02b 10.03c 2.93d
24.87a 24.14a 23.78a 19.32b 13.22c
40.59a 36.00a 34.60a 34.13a 27.97b
Trial 2 - 1981
0 1 3
7 11
6.49a 6.01a 4.18b
16.39a 15.12a 12.77b 9.63c 1.75d
19.38a 20.34a 17.17ab 14.72b 8.99c
21.78ab 24.70a 18.43bc 17.58bc 14.70c
25.82a 26.85a 24.75ab 21.32bc 20.73c
37.52a 36.42a 36.18a 35.20a 31.30b
Trial 1 - 1982
0 1 3 7
11
3.18a 2.40b 2.29b
11.32a 10.28a 9.86a 5.69b 1.69c
23.83a 24.33a 23.68a 17.47b 10.83c
38.09a 39.88a 38.54a 33.32b 26.87c
44.29a 45.98a 47.48a 41.67ab 36.59b
48.31b 52.41a 55.06a 49.74ab 41.56c
Trial 2 - 1982
0 1 3 5 7
11
3.18a 2.81a 2.47ab 1.82b
17.97a 18.57a 16.88a 13.91b 7.14c 1.50d
37.42a 35.26a 32.00ab 31.66ab 27.62b 14.86c
47.09a 45.02a 46.02a 42.76a 39.49a 27.76b
60.94a 55.74ab 59.42ab 55.25ab 50.50b 38.90c
59.88a 52.83ab 54.76ab 53.92ab 51.86ab 45.40b
*See footnote, Table 19.
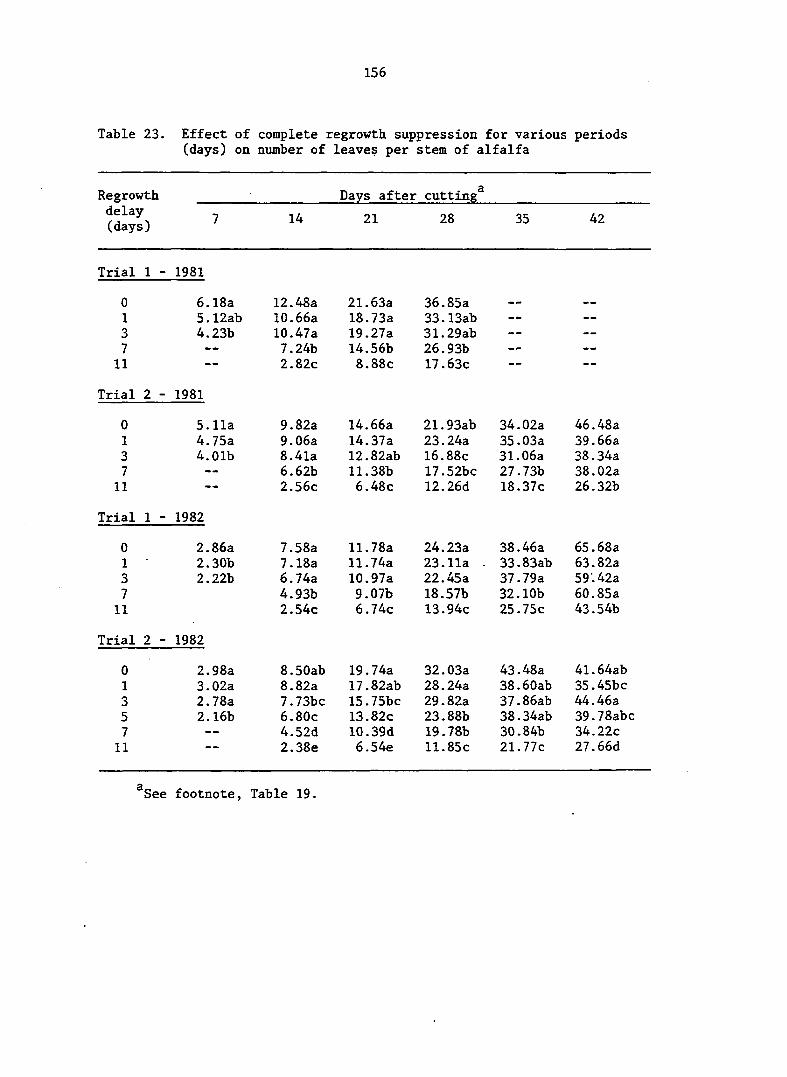
156
Table 23. Effect of complete regrowth suppression for various periods (days) on number of leaves per stem of alfalfa
Regrowth delay (days)
Days after cutting
14 21 28 35 42
Trial 1 - 1981
0 1 3
7 11
6.18a 5.12ab 4.23b
12.48a 10.66a 10.47a
7.24b
2.82c
21.63a 18.73a 19.27a 14.56b 8.88c
36.85a 33.13ab 31.29ab 26.93b 17.63c
Trial 2 - 1981
0 1 3 7
11
5.11a 4.75a 4.01b
9.82a 9.06a 8.41a 6.62b 2.56c
14.66a
14.37a
12.82ab 11.38b 6.48c
21.93ab
23.24a 16.88c 17.52bc 12.26d
34.02a 35.03a 31.06a 27.73b 18.37c
46.48a 39.66a 38.34a 38.02a 26.32b
Trial 1 - 1982
0 1 3 7
11
2.86a 2.30b 2.22b
7.58a 7.18a 6.74a 4.93b 2.54c
11.78a 11.74a 10.97a 9.07b 6.74c
24.23a 23.11a 22.45a 18.57b 13.94c
38.46a 33.83ab 37.79a 32.10b 25.75c
65.68a 63.82a 59.42a 60.85a 43.54b
Trial 2 - 1982
0 1 3 5 7
11
2.98a 3.02a 2.78a 2.16b
8.50ab 8.82a 7.73bc 6.80c 4.52d 2.38e
19.74a 17.82ab 15.75bc 13.82c 10.39d 6.54e
32.03a 28.24a 29.82a 23.88b 19.78b 11.85c
43.48a 38.60ab 37.86ab 38.34ab 30.84b 21.77c
41.64ab 35.45bc 44.46a 39.78abc 34.22c 27.66d
^See footnote, Table 19.
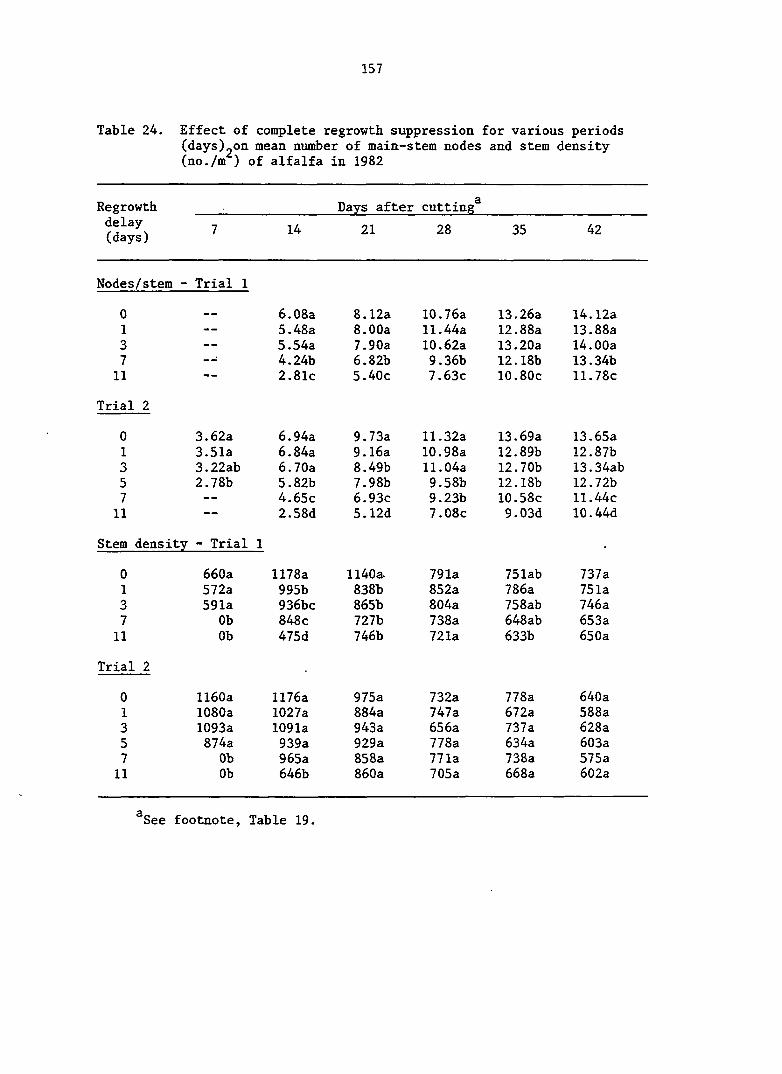
157
Table 24. Effect of complete regrowth suppression for various periods (days)2on mean number of main-stem nodes and stem density (no./m ) of alfalfa in 1982
Regrowth • Days after cutting*
(days) ' " 21 28 35 42
Nodes/stem - Trial 1
0 6.08a 8.12a 10.76a 13.26a 14.12a 1 - — 5.48a 8.00a 11.44a 12.88a 13.88a 3 — — 5.54a 7.90a 10.62a 13.20a 14.00a
7 —: 4.24b 6.82b 9.36b 12.18b 13.34b 11 2.81c 5.40c 7.63c 10.80c 11.78c
Trial 2
0 3.62a 6.94a 9.73a 11.32a 13.69a 13.65a
1 3.51a 6.84a 9.16a 10.98a 12.89b 12.87b
3 3.22ab 6.70a 8.49b 11.04a 12.70b 13.34ab 5 2.78b 5.82b 7.98b 9.58b 12.18b 12.72b 7 — — 4.65c 6.93c 9.23b 10.58c 11.44c
11 2.58d 5.12d 7.08c 9.03d 10.44d
Stem density - Trial 1 -
0 660a 1178a 1140a. 791a 751ab 737a 1 572a 995b 838b 852a 786a 751a 3 591a 936bc 865b 804a 758ab 746a
7 Ob 848c 727b 738a 648ab 653a
11 Ob 475d 746b 721a 633b 650a
Trial 2
0 1160a 1176a 975a 732a 778a 640a
1 1080a 1027a 884a 747a 672a 588a
3 1093a 1091a 943a 656a 737a 628a
5 874a 939a 929a 778a 634a 603a
7 Ob 965a 858a 771a 738a 575a
11 Ob 646b 860a 705a 668a 602a
*See footnote. Table 19.
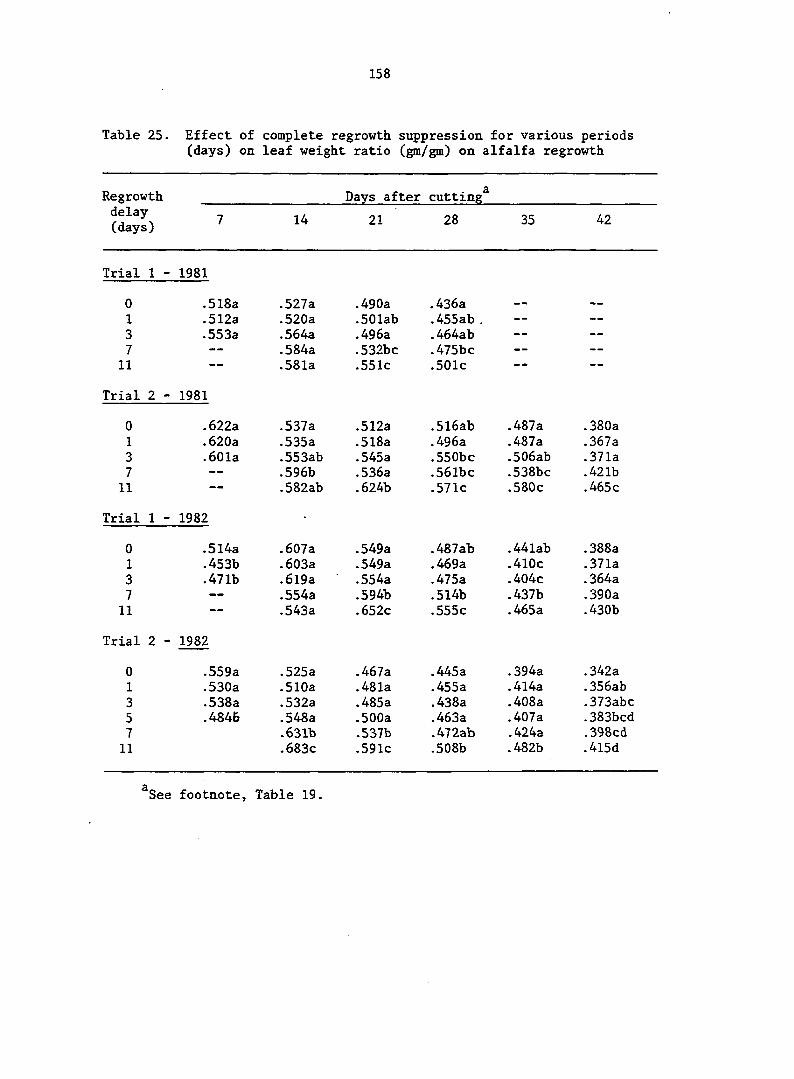
158
Table 25. Effect of complete regrowth suppression for various periods (days) on leaf weight ratio (gm/gm) on alfalfa regrowth
Days after cutting delay (days)
7 14 21 28 35 42
Trial 1 - 1981
0 .518a .527a .490a .436a — — • —
1 .512a .520a .501ab .455ab . - -
3 .553a .564a .496a .464ab - -
7 — .584a .532bc .475bc — -
11 — — .581a .551c .501c
Trial 2 - 1981
0 .622a .537a .512a .5l6ab .487a .380a
1 .620a .535a .518a .496a .487a .367a
3 .601a .553ab .545a .550bc .506ab .371a
7 — — .596b .536a .56lbc .538bc .421b
11 — — .582ab .624b .571c .580c .465 c
Trial 1 - 1982
0 .514a .607a .549a .487ab .44lab .388a
1 .453b .603a .549a .469a .410c .371a
3 .471b .619a • .554a .475a .404c .364a
7 — — .554a .594b .514b .437b .390a
11 — — .543a .652c .555c .465a .430b
Trial 2 - 1982
0 .559a .525a .467a .445a .394a .342a
1 .530a .510a .481a .455a .4l4a .356ab
3 .538a .532a .485a .438a .408a .373abc
5 .4846 .548a .500a .463a .407a .383bcd
7 .631b .537b .472ab .424a .398cd
11 .683c .591c .508b .482b .4l5d
^See footnote. Table 19.

159
Table 26. Effect of complete regrowth suppression for various periods (days) on leaf area ratio (cm /gm) on alfalfa
Regrowth delay (days)
Days after cutting
14 21 28 35 42
Trial 1 - 1981
0 1 3
7 11
82.2a 77.4a 73.1a
110.6a 111.2a 110.1a 108.6a 86.3b
83.8a 93.8b 84.0a 90.0ab 86.2ab
106.6a 107.8a 107.2a 116.8ab 131.0b
Trial 2 - 1981
0 1 3
7 11
121.5a 109.0a 105.6a
93.2a 93.8a 80.6a 93.1a 66.5a
84.2a 88.1a 85.0a 78.7a 88.4a
94.2a 103.8ab 103.7ab 113.9bc 122;8c
101.2a 111.9ab 118.9ab 121.2b 151.2c
89.5a 81.2a 85.4a
101.9b
112.5c
Trial 1 - 1982
.0 1 3 7
11
80.38a 67.72ab 63.58b
134.2a 131.3a 137.1a 135.6a 96.4b
97.4a 101.0a 96.9a 112.3b 117.5b
98.0a 102.9a 103.0a 105.5ab 113.3b
86.2a 90.6ab 91.lab 92.7ab 98.3b
79.2a 79.9a 79.0a 81.2a 94.3b
Trial 2 - 1982
0 1 3 5 7
11
87.6a 78.2ab 80.8a 64.3b
100.4a 98.6a 99.6a 101.0a 111.8a 112.4a
123.0a 127.6ab 124.Oab 139.6abc 146.9bc 156.0c
97.8a 102.9ab 98.9a 113.6b 113.6b 112.5b
96.9a 100.6a 100.5a 105.Oab
116.4bc
126.3c
88.0a 93.4a 89.3a 102.lab 112.2bc 122.9c
^See footnote, Table 19.
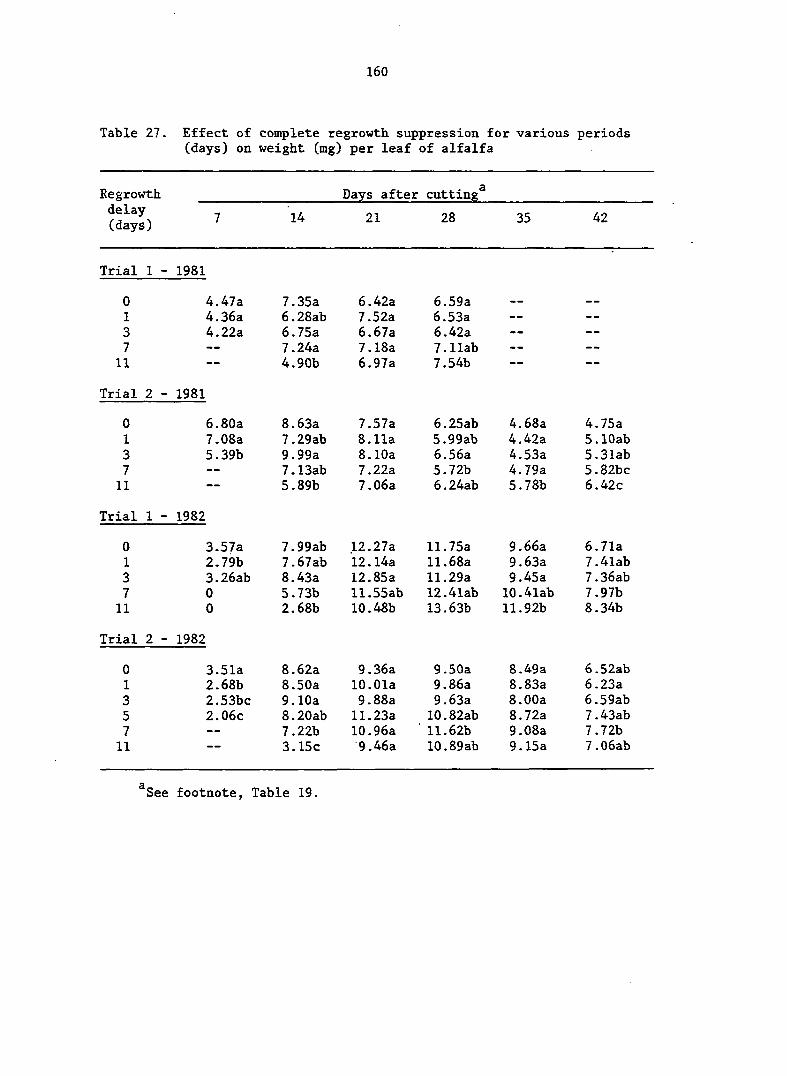
160
Table 27. Effect of con^lete regrowth suppression for various periods (days) on weight (mg) per leaf of alfalfa
Regrowth Days after cutting' delay (days) 7 14 21 28 35 42
Trial 1 - 1981
0 4.47a 7.35a 6.42a 6.59a mi — = »
1 4.36a 6.28ab 7.52a 6.53a 3 4.22a 6.75a 6.67a 6.42a — —
7 — — 7.24a 7.18a 7.11ab - —
11 -- 4.90b 6.97a 7.54b -- — -
Trial 2 - 1981
0 6.80a 8.63a 7.57a 6.25ab 4.68a 4.75a
1 7.08a 7.29ab 8.11a 5.99ab 4.42a 5.lOab
3 5.39b 9.99a 8.10a 6.56a 4.53a 5.31ab
7 7.13ab 7.22a 5.72b 4.79a 5.82bc
11 — — 5.89b 7.06a 6.24ab 5.78b 6.42c
Trial 1 - 1982
0 3.57a 7.99ab 12.27a 11.75a 9.66a 6.71a
1 2.79b 7.67ab 12.14a 11.68a 9.63a 7.41ab
3 3.26ab 8.43a 12.85a 11.29a 9.45a 7.36ab
7 0 5.73b 11.55ab 12.4lab 10.4lab 7.97b
11 0 2.68b 10.48b 13.63b 11.92b 8.34b
Trial 2 - 1982
0 3.51a 8.62a 9.36a 9.50a 8.49a 6.52ab
1 2.68b 8.50a 10.01a 9.86a 8.83a 6.23a
3 2.53bc 9.10a 9.88a 9.63a 8.00a 6.59ab
5 2.06c 8.20ab 11.23a 10.82ab 8.72a 7.43ab
7 — — 7.22b 10.96a 11.62b 9.08a 7.72b
11 — — 3.15c 9.46a 10.89ab 9.15a 7.06ab
^See footnote, Table 19.

161
Table 28. Effect of completegregrowth suppression for various periods (days) on area (cm ) per leaf of alfalfa
Regrowth delay (days)
14
Days after cutting
21 28 35 42
Trial 1 - 1981
0 1 3 7
11
0.71a 0.66a 0.56a
1.52a 1.35a 1.33a 1.34a 0.71b
1.10a 1.39b 1.13a 1.23ab 1.09a
1.64a 1.57a .151a 1.77ab 2.03b
Trial 2 - 1981
0 1 3 7
11
1.33a 1.25ab 0.95b
1.50a 1.27a 1.39ab l.llab 0.49b
1.24ab 1.38a 1.26a 1.09bc 1.00c
1.15a 1.26a 1.24ab 1.16a 1.33b
0.98a 1.02a 1.05a 1.08a 1.45b
1.12a 1.11a 1.22a 1.41b 1.55b
Trial 1 - 1982
0 1 3 7
11
0.56a 0.41b 0.43b
Oc Oc
1.75a 1.68a 1.85a 1.26b 0.47c
2.17ab 2.24a 2.25a 2.l8ab 1.89b
2.37a 2.58a 2.45a 2.54a 2.80a
1.97a 2.12ab 2.13ab 2.22ab 2.51b
1.38a 1.60ab 1.60ab 1.66ab 1.84b
Trial 2 - 1982
0 0.56a 1.64a 2.46a 2.06a 2.08a 1.68ab 1 0.40b 1.65a 2.68a 2.25ab 2.16a 1.66ab 3 0.39b 1.71a 2.51a 2.18ab 1.97a 1.58a 5 0.27c 1.51ab 3.19a 2.67bc 2.26a 2.02ab 7 — — 1.29b 2.98a 2.79c 2.51a 2.1«ab 11 — — 0.52c 2.48a 2.42abc 2.39a 2.09b
^See footnote, Table 19.
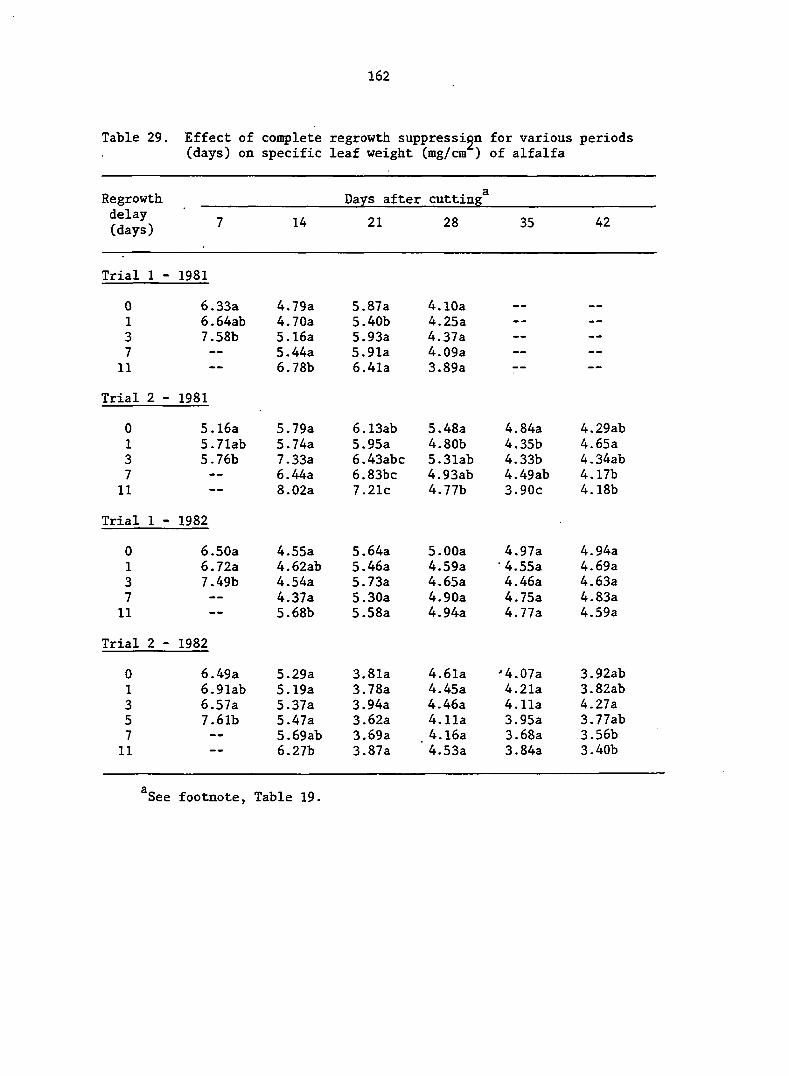
162
Table 29. Effect of complete regrowth suppression for various periods (days) on specific leaf weight (mg/cm ) of alfalfa
Days after cutting' delay (days) 7 14 21 28 35 42
Trial 1 - 1981
0 6.33a 4.79a 5.87a 4.10a — w — —
1 6.64ab 4.70a 5.40b 4.25a — -
3 7.58b 5.16a 5.93a 4.37a — — — —
7 — — 5.44a 5.91a 4.09a — —
11 6.78b 6.41a 3.89a ;—
Trial 2 - 1981
0 5.16a 5.79a 6.13ab 5.48a 4.84a 4.29ab 1 5.71ab 5.74a 5.95a 4.80b 4.35b 4.65a 3 5.76b 7.33a 6.43abc 5.31ab 4.33b 4.34ab 7 — — 6.44a 6.83bc 4.93ab 4.49ab 4.17b 11 8.02a 7.21c 4.77b 3.90c 4.18b
Trial 1 - 1982
0 6.50a 4.55a 5.64a 5.00a 4.97a 4.94a 1 6.72a 4.62ab 5.46a 4.59a •4.55a 4.69a 3 7.49b 4.54a 5.73a 4.65a 4.46a 4.63a 7 — — 4.37a 5.30a 4.90a 4.75a 4.83a 11 5.68b 5.58a 4.94a 4.77a 4.59a
Trial 2 - 1982
0 6.49a 5.29a 3.81a 4.6la '4.07a 3.92ab 1 6.91ab 5.19a 3.78a 4.45a 4.21a 3.82ab
3 6.57a 5.37a 3.94a 4.46a 4.11a 4.27a 5 7.61b 5.47a 3.62a 4.11a 3.95a 3.77ab 7 — — 5.69ab 3.69a 4.16a 3.68a 3.56b 11 — — 6.27b 3.87a " 4.53a 3.84a 3.40b
*See footnote, Table 19.

163
Table 30. Effect of complete regrowth ^upgression for various periods (days) on leaf area index (m /m of ground) of alfalfa
Regrowth Days after cutting^ delay (days)
7 14 21 28 35 42
Trial 1 - 1981
0 0.32a 1.35a 1.75a 3.65a «— — " —
1 0.26ab 1.31a 1.86a 3.32a — — - -
3 0.19b 1.09a 1.62a 3.08a — — - -
7 — — 0.68b 1.24b 2.90a - -
11 — — 0.20c 0.85c 2.68a — — - —
Trial 2 - 1981
0 0.68a 1.24a 1.37a 1.74b 2.21ab 2.72a 1 0.49b 1.13a 1.6la 2.23a 2.59a 2.42a 3 0.39b 0.88b 1.25a 1.81ab 2.42a 2.47a 7 — — 0.56c 0.70b 1.57b 1.88b 2.81a 11 0.07d 0.42c 0.99c 1.89b 2.58a
Trial 1 - 1982
0 0.10a 0.90a 1.79a • 2.49ab 3.05ab 3.59a 1 0.05b 0.70b 1.39b 2.80a 3.58a 3.64a 3 0.05b 0.65b 1.24b 2.57a 3.43a 3.46a 7 — 0.36c 0.97c 2.00bc 2.56bc 3.24ab 11 — 0.04d 0.51d 1.54c 2.11c 2.76b
Trial 2 - 1982
0 0.16a 1.07a 2.44a 2.54ab 3.74a 3.54a
1 O.llab 0.94ab 2.39a 2.91ab 3.39a 3.40a 3 O.llab 0.92ab 2.18a 2.56ab 3.48a 3.52a 5 0.07b 0.69b 2.49a 3.23a 3.36a . 4.02a 7 0.38c 1.78a 2.18bc 3.24ab 3.54a 11 0.09d 0.97b 1.44c 2.28b 3.34a
^See footnote, Table 19.
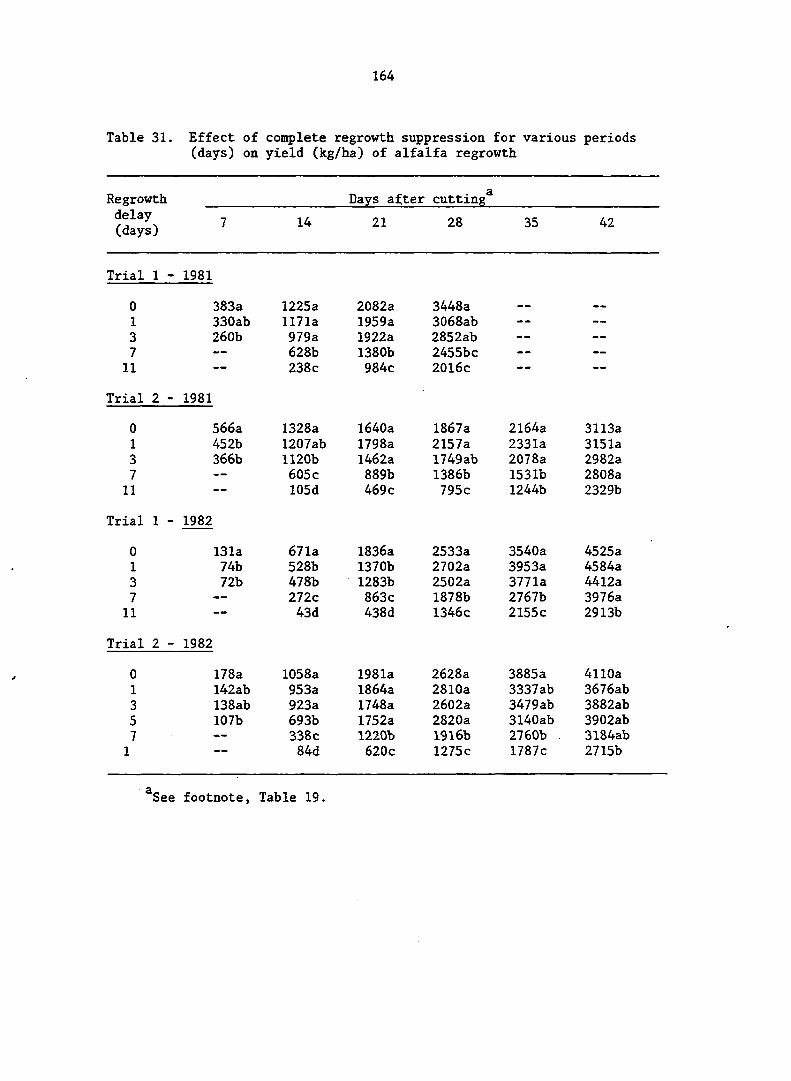
164
Table 31. Effect of complete regrowth suppression for various periods (days) on yield (kg/ha) of alfalfa regrowth
Regrowth Days after cutting* delay (days)
7 14 21 28 35 42
Trial 1 - 1981
0 383a 1225a 2082a 3448a M » « «
1 330ab 1171a 1959a 3068ab -- --
3 260b 979a 1922a 2852ab — — — —
7 628b 1380b 2455bc — — — —
11 238c 984c 2016c --
Trial 2 - 1981
0 566a 1328a 1640a 1867a 2164a 3113a 1 452b 1207ab 1798a 2157a 2331a 3151a 3 366b 1120b 1462a 1749ab 2078a 2982a 7 605 c 889b 1386b 1531b 2808a 11 105d 469 c 795c 1244b 2329b
Trial 1 - 1982
0 131a 671a 1836a 2533a 3540a 4525a 1 74b 528b 1370b 2702a 3953a 4584a 3 72b 478b 1283b 2502a 3771a 4412a 7 — — 272c 863 c 1878b 2767b 3976a 11 43d 438d 1346c 2155 c 2913b
Trial 2 - 1982
0 178a 1058a 1981a 2628a 3885a 4110a 1 I42ab 953a 1864a 2810a 3337ab 3676ab 3 138ab 923a 1748a 2602a 3479ab 3882ab
5 107b 693b 1752a 2820a 3140ab 3902ab 7 — — 338c 1220b 1916b 2760b 3184ab
1 — — 84d 620c 1275c 1787c 2715b
*See footnote. Table 19.

165
Table 32. Effect of complete regrowth suppression for various periods (days) on support component of alfalfa yield (kg/ha)
Days after cutting' delay (days)
7 14 21 28 35 42
Trial 1 - 1981
0 184a 582a 1063a 1982a • « — »
1 . I6lab 562a 985a 1692ab 3 116b 431b 977a 1556ab --
7 — 265 c 657b 1303bc — — --
11 lOld 446c 1019c
Trial 2 - 1981
0 214a 6l6a 881a 942ab 1054a 1944a 1 172b 559ab 803ab 1047a 1126a 2034a 3 146b 503b 666b 947ab 1047a 1907ab 7 -- 244c 412c 772b 824b 1639b 11 -- 45 d 179d 459c 717b 1260c
Trial 2 - 1982
0 63a 265a 829a 1299a 1979a 2765a 1 41b 210b 621b 1437a 2335a 2880a 3 38b 182b 574b 1312a 2243a 2810a 7 -- 119c 351c 913b 1526b 2429a 11 — — 20d 152d 605c 1153c 1664b
Trial 2 - 1982
0 78a 505a 1056a 1461a 2366a 2719a 1 67ab 469a 975a 1547a 1965ab 239lab 3 65 ab 434ab 897a 1460a 2060ab 2433ab 5 53b 318b 891a 1526a 1877ab 2432ab 7 — — 125c 570b 1017b 1603b I922ab 11 27c 254c 629b 932c 1596b
^See footnote. Table 19.
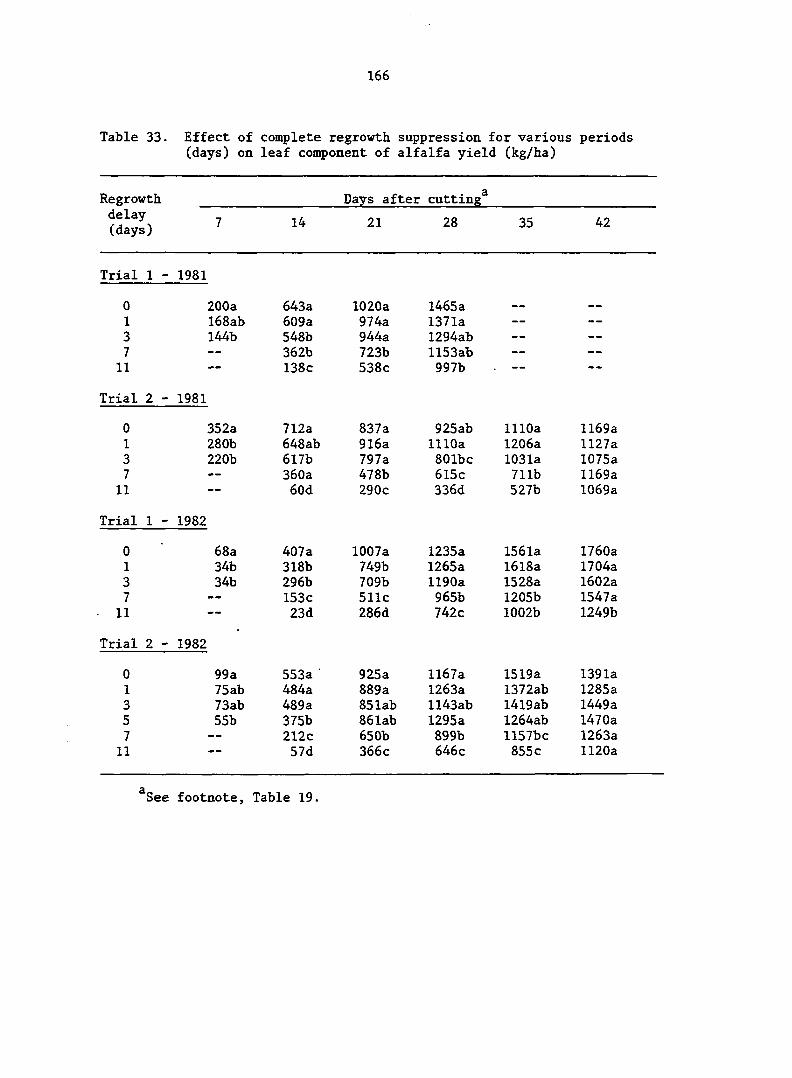
166
Table 33. Effect of complete regrowth suppression for various periods (days) on leaf component of alfalfa yield (kg/ha)
Regrowth Days after cutting^
(dayl) ' 21 28 35 42
Trial 1 - 1981
0 200a 643a 1020a 1465a 1 I68ab 609a 974a 1371a 3 144b 548b 944a 1294ab 7 — — 362b 723b 1153ab 11 — — 138c 538c 997b
Trial 2 - 1981
0 352a 712a 837a 925ab 1110a 1169a 1 280b 648ab 916a 1110a 1206a 1127a 3 220b 617b 797a 801bc 1031a 1075a 7 — — 360a 478b 615c 711b 1169a 11 60d 290c 336d 527b 1069a
Trial 1 - 1982
0 68a 407a 1007a 1235a 1561a 1760a 1 34b 318b 749b 1265a 1618a 1704a 3 34b 296b 709b 1190a 1528a 1602a 7 — — 153c 511c 965b 1205b 1547a 11 — — 23d 286d 742c 1002b 1249b
Trial 2 - 1982
0 99a 553a • 925a 1167a 1519a 1391a 1 75ab 484a 889a 1263a 1372ab 1285a 3 73ab 489a 85 lab ll43ab I4l9ab 1449a 5 55b 375b 86 lab 1295a 1264ab 1470a 7 212c 650b 899b 1157bc 1263a 11 — — 57d 366c 646c 855 c 1120a
*See footnote. Table 19.

167
Table 34. Effect of complete regrowth suppression for various periods (days) on in vitro digestible dry matter (%) of alfalfa
Regrowth Days after cutting^ delay (days)
21 28 35 42
Trial 1 - 1981
0 70.07a 69.99a — »
1 70.12a 70.92ab - -
3 74.25b 70.79ab — -
7 76.50b 72.40ab — —
11 78.02b 73.67b - - — —
Trial 2 - 1981
0 74.17ab 66.70a 66.49a 64.31a 1 73.30a 66.83a 66.48a 63.84a 3 75.62ab 65.11a 66.9lab 64.78a 7 76.43b 66.72a 69.37bc 65.18ab 11 79.68c 69.38b 70.91c 67.09b
Trial 1 - 1982
0 75.73a 69.08a 68.32ab 60.33a 1 79.51a 69.86ab 69.00ab 61.20a 3 81.51a 68.32a 67.68a 61.02a 7 79.07a 72.00b 69.58b 61.56a 11 83.97a 74.92c 71.54c 64.11b
Trial 2 - 1982
0 66.26a 62.41a 62.34a 60.73a 1 67.95ab 63.35ab 62.95ab 61.73a 3 67.78ab 62.54a 63.07ab 60.96a
5 69.31b 63.64ab 64.83ab 62.34a 7 71.46c 65.53b 62.30b 62.7lab 11 75.24d 69.94c 67.60c 64.79b
*See footnote, Table 19.

168
Table 35. Effect of complete regrowth suppression for various periods (days) on crude protein content (%) of alfalfa
Regrowth delay (days)
21
Days after cutting
28 35 42
Trial 1 - 1981
0 1 3 7
11
27.97a 27.47a 27.91a 31.59b 35.84c
24.41a 24.72ab 25.10ab 26.02b 29.32c
Trial 2 - 1981
0 1 3 7
11
24.20a 24.39a 25.05a 27.35b 32.44c
22.52a 23.47ab 23.38ab 24.68b 26.55c
24.21a 25.09a 26.39b 28.48c 30.07d
24.50a 24.56a 25.33ab 26.60bc 27.41c
Trial 1 - 1982
0 1 3 7
11
26.30a 26.26a 27.42a 30.84b 36.68c
21.90ab 20.93a 21.66ab 23.14bc 24.26c
18.68ab 17.79a 18.44ab 19.52bc 20.43c
17.71ab 17.31a l?-73ab-I8.68ab 19.13b
Trial 2 - 1982
0 1 3 7
11
24.91a 25.20a 24.96a 27.86b 32.20c
21.23a 20.66a 21.12a 23.40b 25.77c
19.27a 19.22a 20.42ab 21.22b 23.85c
18.86a I9.45ab 19.97abc 21.83c 21.27bc
^See footnote, Table 19.

169
APPENDIX B. MEANS AND ANALYSIS OF DATA FOR THE VARIEGATED
CUTWORM LARVAL INFESTATION STUDY
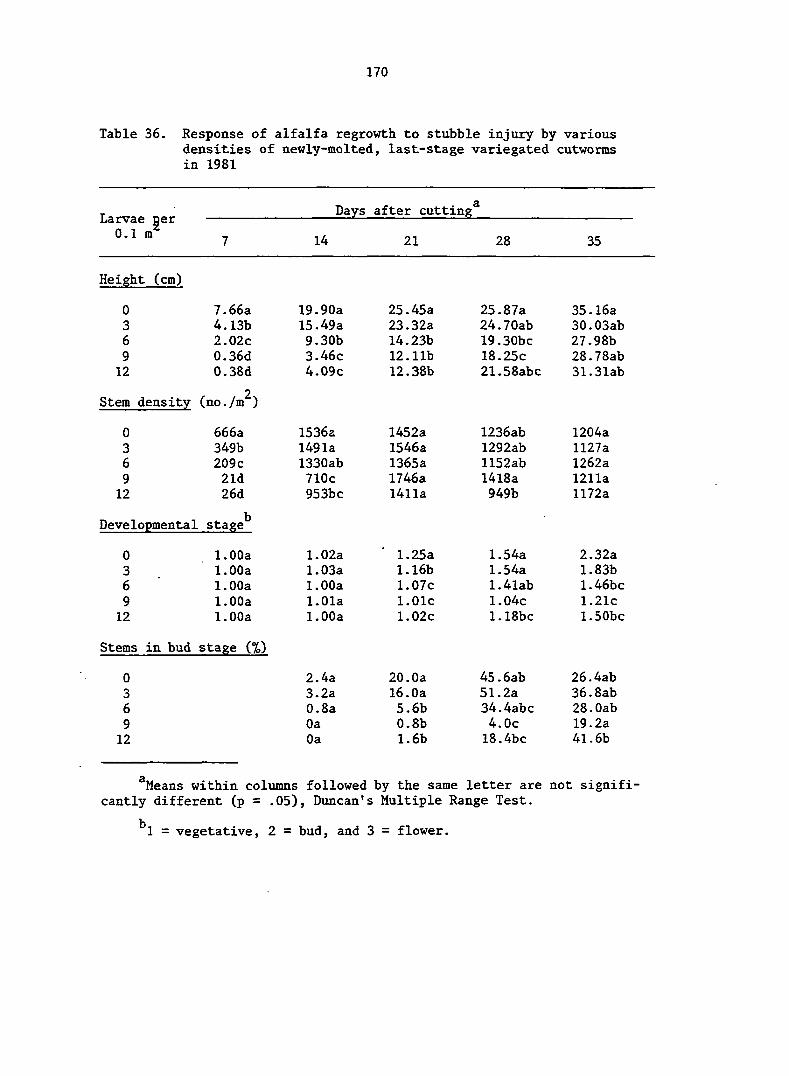
170
Table 36. Response of alfalfa regrowth to stubble injury by various densities of newly-molted, last-stage variegated cutworms in 1981
Larvae |er Bays after cutting
° 1 * 7 14 21 28 35
Height (cm)
0 7.66a 19.90a 25.45a 25.87a 35.16a 3 4.13b 15.49a 23.32a 24.70ab 30.03ab 6 2.02c 9.30b 14.23b 19.30bc 27.98b 9 0.36d 3.46c 12.11b 18.25c 28.78ab 12 0.38d 4.09c 12.38b 21.58abc 31.31ab
Stem density 2
(no./m )
0 666a 1536a 1452a 1236ab 1204a 3 349b 1491a 1546a 1292ab 1127a 6 209 c 1330ab 1365a 1152ab 1262a 9 21d 710c 1746a 1418a 1211a 12 26d 953bc 1411a 949b 1172a
Developmental stage^
0 1.00a 1.02a 1.25a 1.54a 2.32a 3 1.00a 1.03a 1.16b 1.54a 1.83b 6 1.00a 1.00a 1.07c 1.4lab 1.46bc
9 1.00a 1.01a 1.01c 1.04c 1.21c 12 1.00a 1.00a 1.02c 1.18bc l.SObc
Stems in bud stage (%)
0 2.4a 20.0a 45. 6ab 26.4ab 3 3.2a 16. Oa 51.2a 36.8ab 6 0.8a 5.6b 34.4abc 28.0ab
9 Oa 0.8b 4.0c 19.2a 12 Oa 1.6b 18.4bc 41.6b
^Means within columns followed by the same letter are not significantly different (p = .05), Duncan's Multiple Range Test.
= vegetative, 2 = bud, and 3 = flower.

171
Table 36 (continued)
Larvae per 0.1 m
Days after cutting^
14 21 28 35
Stems in flower stage (%)
0 0 3 0 6 0 9 0
12 0
2.4a Ob 0.8ab Ob Ob
6.4a 1.6ab 3.2ab Ob Ob
52.8a 23.2b 14.4bc 0.8c 4.0c
Leaves per stem
0 10.85a 3 10.89a 6 8.18a 9 5.01b 12 4.82b
2 2 Leaf area index (m /m )
16.50a 25.90a 51.37a 17.63a 24.91a 42.09b 13.24a 19.76ab 32.28c 9.54b 14.28b 25.66c 9.25b 16.16b 27.54c
0 1.50a 3 0.97b 6 0.50c 9 0.l4d 12 0.21d
1.73a 2.24a 3.51a 1.54a 2.10ab 2.77ab 0.86b 1.62ab 2.39b 0.76b 1.60b 3.00ab 0.78b 1.65ab 2.97ab
Dry weight (mg) per leaf
0 9.47a 9.19a 6.34ab 4.26a 3 8.36a 8.07ab 6.29ab 4.58a 6 5.92b 6.07b 5.79a 4.85a 9 4.36c 6.45ab 6.15ab 5.68b 12 5.I4bc 6.40ab 6.86b 5.73b
2 Area (cm ) per leaf
0 1.92a 1.49a 1.28ab 1.00a 3 1.47b 1.32a 1.31b 1.09a 6 0.88c 0.91b 1.10a 1.04a 9 0.52d 1.05b 1.41bc 1.53b 12 0.64cd 0.95b 1.59c 1.65b
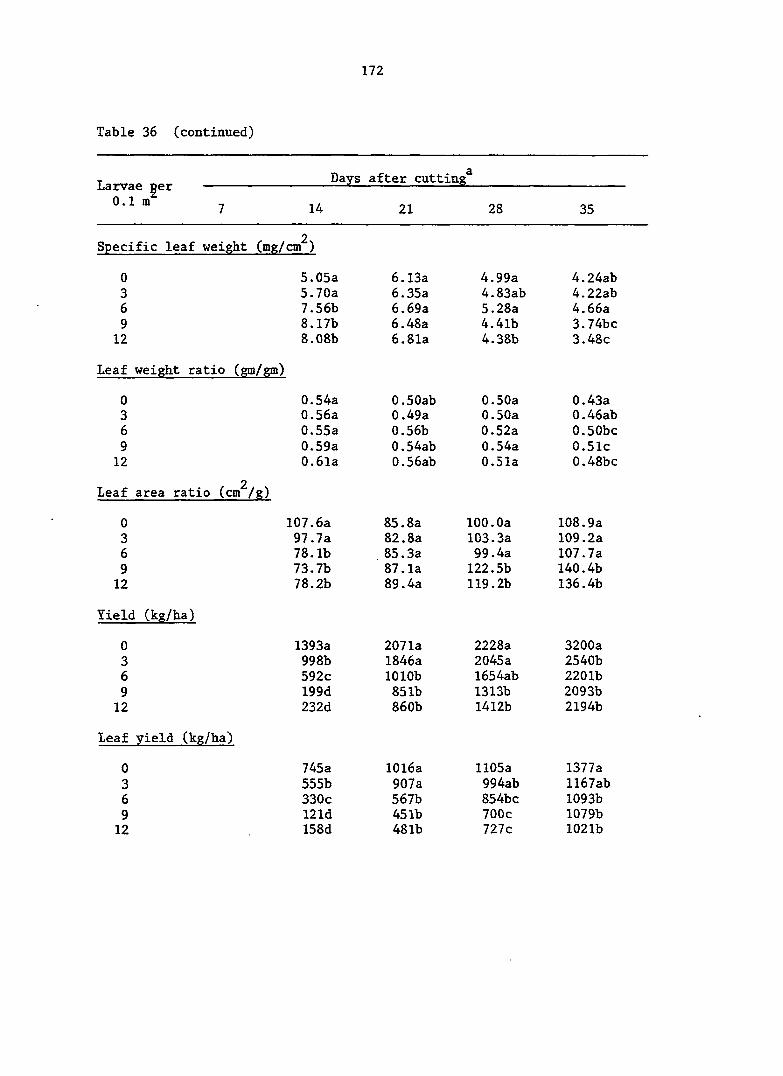
172
Table 36 (continued)
Larvae per 0.1 m
Days after cutting
14 21 28 35
Specific leaf weight (mg/cm )
0 5.05a 6.13a 4.99a 4.24ab 3 5.70a 6.35a 4.83ab 4.223b 6 7.56b 6.69a 5.28a 4.66a 9 8.17b 6.48a 4.41b 3.74bc 12 8.08b 6.81a 4.38b 3.48c
Leaf weight ratio (gm/gm)
0 0.54a 0.50ab 0.50a 0.43a 3 0.56a 0.49a 0.50a 0.46ab 6 0.55a 0.56b 0.52a 0.50bc 9 0.59a 0.54ab 0.54a 0.51c 12 0.6la 0.56ab 0.51a 0.48bc
2 Leaf area ratio (cm /g)
0 107.6a 85.8a 100.0a 108.9a 3 97.7a 82.8a 103.3a 109.2a 6 78.1b 85.3a 99.4a 107.7a 9 73.7b 87.1a 122.5b 140.4b 12 78.2b 89.4a 119.2b 136.4b
Yield (kg/ha)
0 3 6 9
12
1393a 998b 592c 199d 232d
2071a 1846a 1010b 851b 860b
2228a 2045a l654ab 1313b 1412b
3200a 2540b 2201b 2093b 2194b
Leaf yield (kg/ha)
0 745a 1016a 1105a 1377a 3 555b 907a 994ab ll67ab 6 330c 567b 854bc 1093b 9 121d 451b 700c 1079b 12 158d 481b 727c 1021b
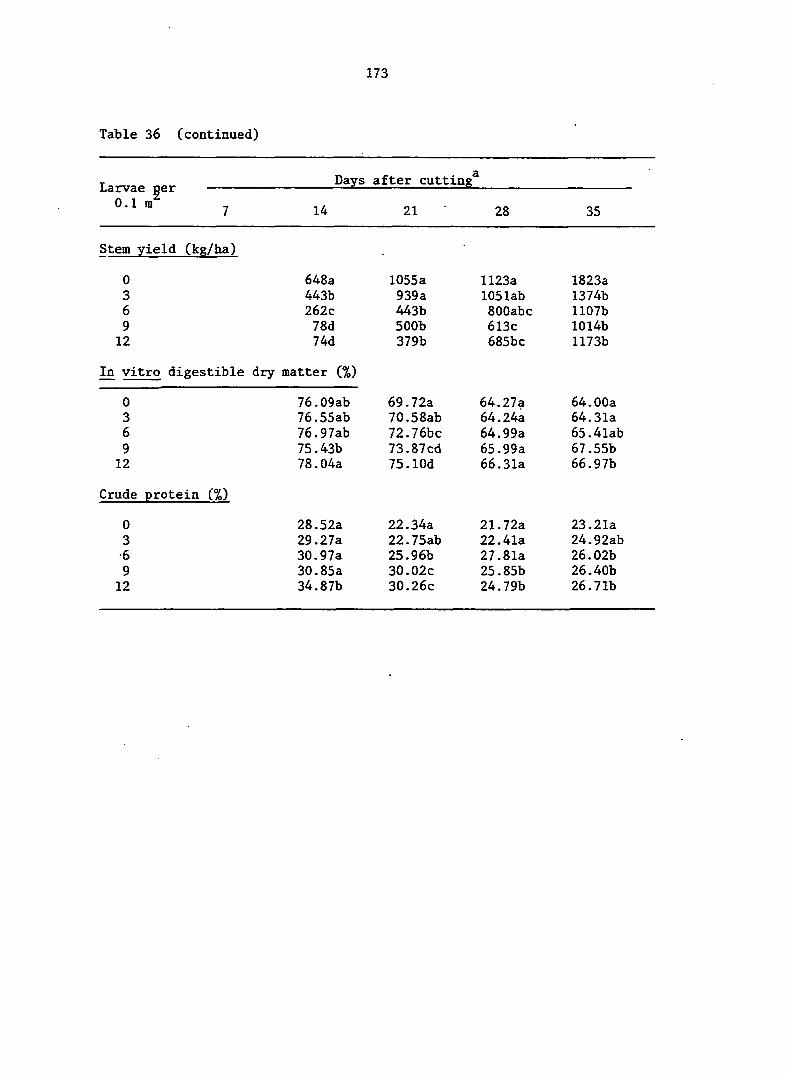
Table 36 (continued)
173
Larvae ger 0.1 m
Days after cutting
14 21 28 35
Stem yield (kg/ha)
0 648a 1055a 1123a 1823a 3 443b 939a 105lab 1374b 6 262c 443b 800abc 1107b 9 78d 500b 613c 1014b 12 74d 379b 685bc 1173b
In vitro digestible dry matter (%)
0 3 6 9
12
Crude protein (%)
0 3
• 6
9 12
76.09ab 76.55ab 76.97ab 75.43b 78.04a
28.52a 29.27a 30.97a 30.85a 34.87b
69.72a 70.58ab 72.76bc 73.87cd 75.10d
22.34a 22.75ab 25.96b 30.02c 30.26c
64.27a 64.24a 64.99a 65.99a 66.31a
21.72a 22.41a 27.81a 25.85b 24.79b
64.00a 64.31a 65.4lab 67.55b 66.97b
23.21a 24.92ab 26.02b 26.40b 26.71b
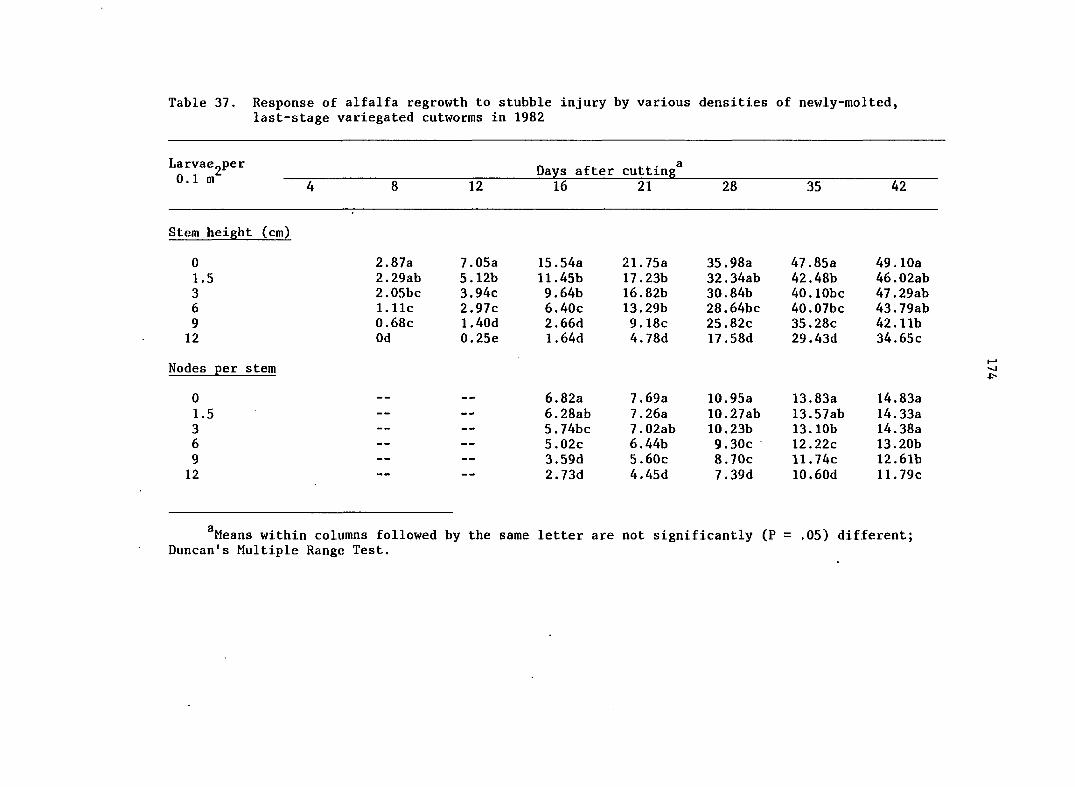
Table 37. Response of alfalfa regrowth to stubble injury by various densities of newly-molted, last-stage variegated cutworms in 1982
LARVAEGPER Days after cutting
u. 1 ni , 4 8 12 16 21 28 35 42
Stem height (cm)
0 2.87a 7.05a 15.54a 21.75a 35.98a 47.85a 49.10a 1.5 2.29ab 5.12b 11.45b 17.23b 32.34ab 42.48b 46.02ab 3 2.05bc 3.94c 9.64b 16.82b 30.84b 40.lObc 47.29ab 6 1.11c 2.97c 6.40c 13.29b 28.64bc 40.07bc 43.79ab 9 0.68c 1.40d 2.66d 9.18c 25.82c 35.28c 42.11b 12 Od 0.25e 1.64d 4.78d 17.58d 29.43d 34.65c
Nodes per stem
0 — — — — 6.82a 7.69a 10.95a 13.83a 14.83a 1.5 - - 6.28ab 7.26a 10.27ab 13.57ab 14.33a 3 — — 5.74bc 7.02ab 10.23b 13.10b 14.38a 6 - - -- 5.02c 6.44b 9.30c 12.22c 13.20b 9 - - — — 3.59d 5.60c 8.70c 11.74c 12.61b 12 — — - - 2.73d 4.45d 7.39d 10.60d 11.79c
^Means within columns followed by the same letter are not significantly (P = .05) different; Duncan's Multiple Range Test.

Table 37 (continued)
after cutting^ 12 16 21 28 35 42
Leaves per stem
0 2.6a 5.3a 8. 4a 11.2a 26,0a 46. 9a 63.6a 1.5 1.8]) 4.0b . 7. lab 10.1a 22.3b 42.0ab 54.5ab 3 1.4b 3.6b 6.0bc 10.2a 20.8bc 39.8bc 53.6b 6 0.5c 2.4c 4.7c 8.3b 18.6cd 34.6cd 46.5bc 9 0.2c 0.7d 2.8d 6.9b 17.6d 29.3de 43.0c 12 Oc <0.1d 1. 6d 5.1c 11.6e 25.7e 32.6d
Leaf area index
0 0.14a 0.99a 1.52a 1.94a 2.61a 3.82a 3.47ab 1.5 0.06b 0.43b 1.02b 1.27b 2.57a 3.21ab 3.08ab 3 0.03bc 0.25bc 0.91b 0.95bc 2.24ab 3.70a 3.15ab 6 0.015c 0.21cd 0.54c 0.65cd 1.93b 2.78bc 3.76a 9 Oc O.Old 0.12d 0.54d 1.81bc 2.64bc 2.99ab 12 Oc Od 0.03d 0.20e 1.23c 2.10c 2.47b
Leaf weight ratio, (sm/gm)
0 0.49a 0.60a 0.56ab 0.53a 0.47a 0.40a 0.38a 1.5 0.39ab 0.53ab 0.57a 0.54ab 0.48ab 0.42ab 0.4labc 3 0.28bc 0.51ab 0.62a 0.54ab 0.49abc 0.43b 0.39ab 6 0.19c 0.38bc 0.54ab 0.57b 0.51bc 0.44bc 0.42abc 9 Od 0.21cd 0.47b 0.57b 0.52c 0.46cd 0.42bc 12 - 0.07d 0.31c 0.57b 0.57d 0.48d 0.44c

Table 37 (continued)
after cutting* 12 16 21 28 35 42
2 Leaf area ratio (cm /gm)
0 92.4a 140.0a 120.5a 100,0a 91.2a 86.7a 72.0a 1.5 67.4ab 110.2ab 120.2a 100.8a 96.3ab 91.0a 76.8a 3 43.0bc 105.9ab 125.4a 100.0a 96.9ab 96.9b 73.5a 6 32.2c 75.2bc 103.8a 100.2a 100.1b 100.7b 89.6b 9 13.2c 29.0cd 78.4b 104.3a 108.2c 109.8c 94.1b 12 2.7d 49.8c 105.8a 110.7c 110.3c 94.Id
Weight (mg)/leaf
0 3.12a 6.96a 8.85a 10.15a 10.57ab 8.08a 7.22a 1.5 3.05a 5.22b 7.19b 8.17b 10.38ab 8.37ab 7.87a 3 2.40a 4.38b 7.02b 8.19b 11.21a 8.70ab 7.73a 6 1.49b 3.74b 5.03c 7.72bc 10.I6ab 9.11b 7.64a 9 Oc 2.12c 3.10d 6.39c 10.31ab 8.66ab 7.93a 12 Oc 0.83c 1.96d 4.87d 9.35b 8.72ab 7.6la
2 Area (cm) /leaf
0 0.58a 1.62a 1.91a 1.92a 2.07ab 1.76a 1.35a 1.5 0.52a 1.08b 1.50b 1.52b 2.07ab . 1.82a 1.47ab 3 0.36b 0.91bc 1.42b 1.52b 2.20a 1.95ab 1.45ab 6 0.25bc 0.69c 0.97c 1.36bc 2.01ab 2.10b 1.64c 9 0.17c 0.30d 0.53d 1.44cd 2.15a 2.06b 1.77c 12 Od 0.03d • 0.31d 0.90d 1.82b 1.97ab 1.62bc

Table 37 (continued)
LarvaCgPer Days after cutting^
4 8 12 16 21 28 35 42
2 Specific leaf weight (mg/cm )
0 5.36ab 4,30a 4.65a 5.29a 5.13a 4.61a 5.34a 1.5 6.00ab 4.86a 4.76a 5.38a 5.02a 4.6la 5.40a 3 6.98a 4.84a 4.97a 5.40a 5.11a 4.46ab 5.33a 6 4.20a 6.40a 5.40ab 5.73a 5.09a 4.35ab 4.66b 9 — 5.49a 6.06b 5.57a 4.79a 4.22b 4.52b 12 6.25a 6.08b 5.59a 5.14a 4.42ab 4.73b
Yield (kg/ha)
0 100a 469a 1075a 15l6a 2863a 4403a 4805a 1.5 57b 260b 710b 1011b 2667ab 3536ab 4037ab 3 40b 156c . 490 c 907bc 2210bc 3828a 4322ab 6 13c 123c 324c 652cd 1918c 2824bc 4180ab 9 3c 20d 98d 545d I687d 2398c 3230bc 12 Oc Id 32d 186e lll6d 1926c 2594c
;af yield (kg/ha)
0 51a 187a 473a 713a 1521a 2654a 2982a 1.5 34b 121b 303b 467b 1384ab 2062b 2393ab 3 27b 76c 177c 4l8bc 1124bc 2187ab 264lac 6 8c 60c 140c 286cd 958c I605bc 2440ab 9 3c 15d 51d 235d 820c 1290cd 1860bc 12 Oc Id 20d 79e 483d 996d 1451c

Table 37 (continued)
Days after cutting^ 0.1 m : : • "—
12 16 21 28 35 42
Stem yield (kg/ha)
0 49a 282a 602a 804a 1342a 1749a 1823a 1.5 23b 139b 407b 545b 1284a I474ab I654ab 3 13bc 80c 313bc 488bc 1086ab 1642a I681ab 6 5cd 63c 184c 366bc 960b 1220bc 1740ab 9 Od 5d 48d 310c 866bc 1108c 1370bc 12 Od <ld 12d 107d 633c 930c 1153c
2 Stem density (No./m )
0 183a 908a 1154a 1208a 1015a 954a 945a 705a 1.5 109b 618b 993ab 1176a 885b 947a 845a 706a 3 101b 495b 752bc 1077ab 833bc 806a 886a 670a 6 48c 235c 6l5c 931bc 721c 803a 788a 708a 9 40c 118c 254d 749c 799bc 778a 822a 607a 12 15c 46c 115d 449d 543d 803d 828a 634a
In vitro digestible dry matter (%)
0 — M •P* w 70.11a 65.40a 64.46ab 6l.99ab 1.5 - — 72.66bc 67.29ab 63.82a 6l.72ab 3 - - -- 71.81ab 66.99ab 65.72ab 60.39a 6 — — — 74.83c 69.86b 66.73bc 63.22b 9 — — — — 75.02c 69.80b 69.54d 6l.97ab
12 — — 78.42d 73.46c 68.99cd 65.37c

Table 37 (continued)
Larvae^pe r
0,1 m Days after cutting
12 16 21 28 35 42
Crude protein (%)
0 28.23a 22 .95a 20.45a 19.26a 1.5 31.96b 23 .33a 21.22a 19.52a
31.64b 23 .65a 20.60a 19.35a 6 — — -• 35.55c 24 .35ab 22.41b 20.34a 9 - - - - -• 36.69cd 25 .49b 23.44b 20.26a 12 -- "" 38.6ld 28 .56c 23.44b 21.69b
b c Developmental stage '
0 1.00 1. 17a 1.83a 2.45a 1.5 1.00 1. 03b 1.70ab 2.16b 3 1.00 1. 06b 1.64ab 2.10bc 6 1.00 1. 01b 1.55b 1.90c 9 1.00 1. 01b 1.13c 1.66d 12 1.00 1. 00b 1.10c 1.47d
''au stems were vegetative up to day 21.
^1 = vegetative, 2 = bud, and 3 = flower.
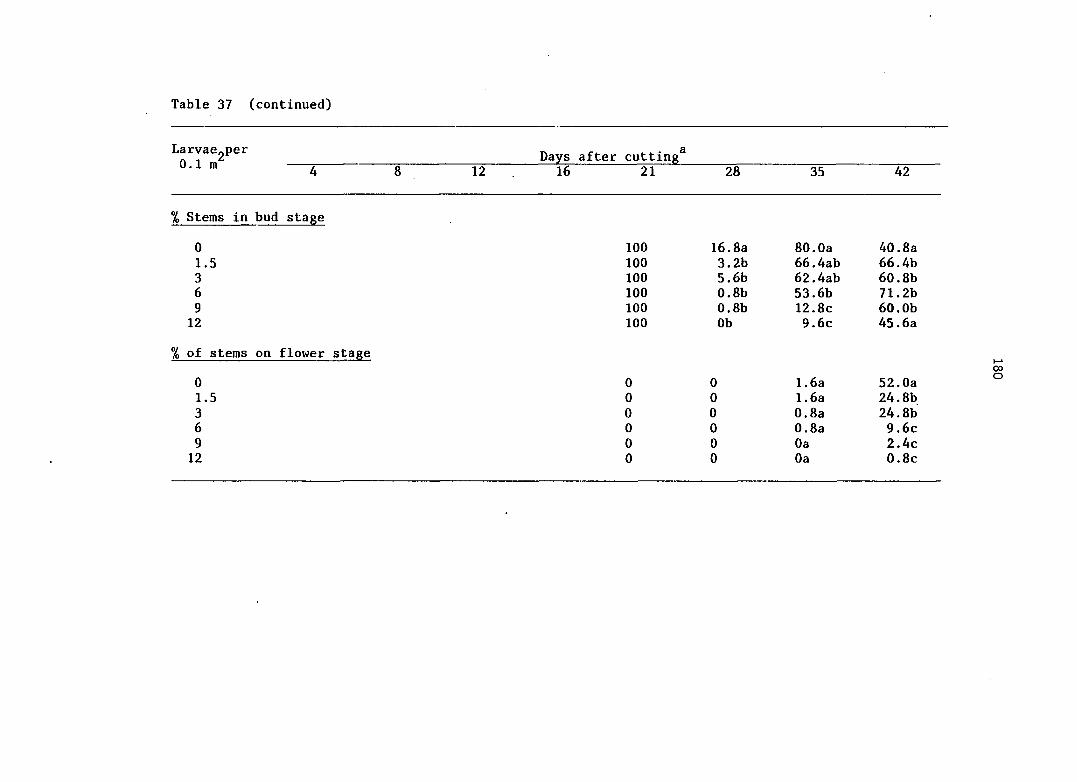
Table 37 (continued)
after cutting^ 12 16 21 28 35 42
% Stems in bud stage
0 100 16.8a 80.0a 40.8a 1.5 100 3.2b 66.4ab 66. 4b 3 100 5.6b 62.4ab 60.8b 6 100 0.8b 53.6b 71.2b 9 100 0.8b 12.8c 60.0b 12 100 Ob 9.6c 45.6a
of stems on flower stage
0 0 0 1.6a 52.0a 1.5 0 0 1.6a 24.8b 3 0 0 0.8a 24.8b 6 0 0 0.8a 9.6c 9 0 0 Oa 2.4c 12 0 0 Oa 0.8c
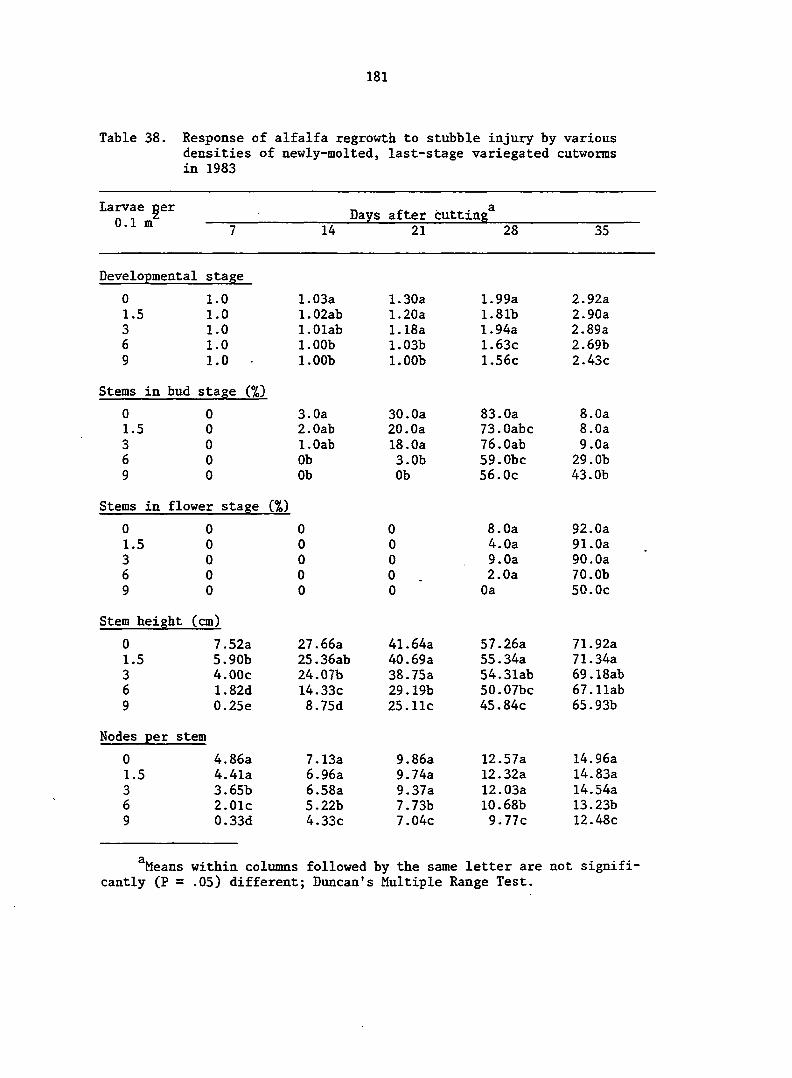
181
Table 38. Response of alfalfa regrowth to stubble injury by various densities of newly-molted, last-stage variegated cutworms in 1983
Days after cutting^ " 7 14 2i 28 sT"
Developmental stage
0 1.0 1.03a 1.30a 1.99a 2.92a 1.5 1.0 1.02ab 1.20a 1.81b 2.90a 3 1.0 l.Olab 1.18a 1.94a 2.89a 6 1.0 1.00b 1.03b 1.63c 2.69b 9 1.0 1.00b 1.00b 1.56c 2.43c
Stems in bud stage (%)
0 0 3.0a 30.0a 83.0a 8.0a 1.5 0 2.0ab 20.0a 73.0abc 8.0a 3 0 l.Oab 18.0a 76.0ab 9.0a 6 0 Ob 3.0b 59.0bc 29.0b 9 0 Ob Ob 56.0c 43.0b
Stems in flower stage (%)
0 0 0 0 8.0a 92.0a 1,5 0 0 0 4.0a 91.0a 3 0 0 0 9.0a 90.0a 6 0 0 0 2.0a 70.0b 9 0 0 0 Oa 50.0c
Stem height (cm)
0 7.52a 27.66a 41.64a 57.26a 71.92a 1.5 5.90b 25.36ab 40.69a 55.34a 71.34a 3 4.00c 24.07b 38.75a 54.31ab 69.18ab 6 1.82d 14.33c 29.19b 50.07bc 67.11ab 9 0.25e 8.75d 25.11c 45.84c 65.93b
Nodes per stem
0 4.86a 7.13a 9.86a 12.57a 14.96a 1.5 4.41a 6.96a 9.74a 12.32a 14.83a 3 3.65b 6.58a 9.37a 12.03a 14.54a 6 2.01c 5.22b 7.73b 10.68b 13.23b 9 0.33d 4.33c 7.04c 9.77c 12.48c
^Means within columns followed by the same letter are not significantly (P = .05) different; Duncan's Multiple Range Test.

182
Table 38 (continued)
P^ys after cutting^ 14 21 28 35
Leaves per stem
0 4.27a 10.27a 19.28a 47.75a 70.70a 1.5 3.60b 9.65a 18.32a 40.29b 65.66ab 3 2.95c 9.78a 19.12a 39.67b 67.93ab 6 0.96d 6.23b 12.05b 30.08c 58.67b 9 0.02e 4.87b 10.01c 24.42c 46.54c
2 2 Leaf area index (m /m )
0 .338a 1.83a 2.21a 2.98a 3.52a 1.5 .205b 1.53a 2.21a 2.62ab 3.49a 3 .126c 1.49a 2.12a 2.40b 3.68a 6 .OlOd .80b 1.27b 1.85c 3.15a 9 <.0001d .44b 1.04b 1.71c 3.22a
Leaf weight ratio (gm/gm)
0 0.53a 0.47a 0.41a 0.39ab 0.29a 1.5 0.51a O.Slab 0.41a 0.37a 0.31a 3 0.53a 0.49a 0.43a 0.39ab 0.31a 6 0.31b 0.55b 0.47b 0.39ab 0.34b 9 — 0.59c 0.49b 0.41b 0.34b
2 Leaf area ratio (cm /gm)
0 98.1a 135.8a 89.8a 74.5a 66.3a 1.5 88.7a 140.2ab 97.8b 81.2ab 77.2b 3 89.0a 149.2b 101.8bc 81.3ab 71.7ab 6 49.1b 147.7b 104.8c 80.lab 78.8b 9 — 149.9b 112.7d 90.6b 95.3c
Dry weight (mg) per leaf
0 7.17a 11.52a 11.67a 9.74ab 6.98a 1.5 6.25b 11.27a 11.59a 9.10a 7.42ab 3 5.62b 10.15ab 10.90a 8.83a 7.29ab •6 3.90c 9.53bc 11.98a 10.12ab 8.41b 9 — 8.20c 11.52a 10.95b 8.49b
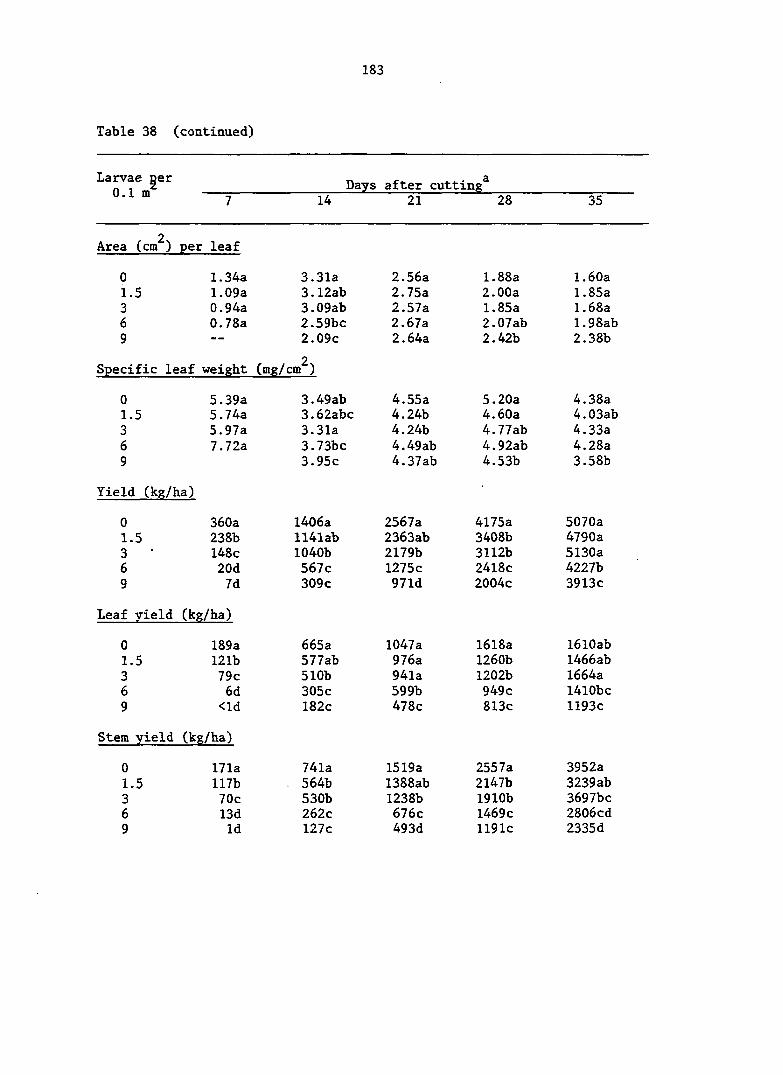
Table 38 (continued)
183
Days after cutting 0.1 m = r-r jz
14 21 28 35
Area (cm ) per leaf
0 1.34a 3.31a 2.56a 1.88a 1.60a 1.5 1.09a 3.12ab 2.75a 2.00a 1.85a 3 0.94a 3.09ab 2.57a 1.85a 1.68a 6 0.78a 2.59bc 2.67a 2.07ab 1.98ab 9 - - 2.09c 2.64a 2.42b 2.38b
Specific leaf weight (mg/ cmf)
0 5.39a 3.49ab 4.55a 5.20a 4.38a 1.5 5.74a 3.62abc 4.24b 4.60a 4.03ab 3 5.97a 3.31a 4.24b 4.77ab 4.33a 6 7.72a 3.73bc 4.49ab 4.92ab 4.28a
9 3.95c 4.37ab 4.53b 3.58b
Yield (kg/ha)
0 360a 1406a 2567a 4175a 5070a 1.5 238b ll4lab 2363ab 3408b 4790a 3 148c 1040b 2179b 3112b 5130a 6 20d 567c 1275c 2418c 4227b 9 7d 309c 971d 2004c 3913c
Leaf yield (kg/ha)
0 189a 665a 1047a 1618a I6l0ab 1.5 121b 577ab 976a 1260b I466ab 3 79c 510b 941a 1202b 1664a 6 6d 305 c 599b 949c I4l0bc 9 <ld 182c 478c 813c 1193c
Stem yield (kg/ha)
0 171a 741a 1519a 2557a 3952a
1.5 117b - 564b 1388ab 2147b 3239ab 3 70c 530b 1238b 1910b 3697bc 6 13d 262c 676c 1469c 2806cd
9 Id 127c 493d 1191Ç 2335d

184
Table 38 (continued)
Larvae per 0.1 m
Days after cutting^ Larvae per 0.1 m
7 14 21 28 35
2 Stems per m
0 879a 793a 662a 495a 458ab 1.5 756ab 750ab 650a 487a 428ab 3 676b 721ab 636a 483a 474a 6 254c 710ab 581a 443a 406b 9 76d 646b 590a 431a 427ab
In vitro digestible dry matter (%)
0 «m » — » 68.01a 64.03a 58.00ab 1.5 — — 68.94ab 64.23a 59.96bc 3 — — 66.51a 62.64a 57.03a 6 71.73bc 64.66a 61.10c 9 - - 75.15c 64.91a 61.10c
Crude protein (%)
0 " — — — 21.67a 20.23b 17.42a 1.5 — — - — 21.49a 18.82a 18.67a 3 - — 23.66a 20.79bc 18.03a 6 — — — — 26.09b 21.90cd 18.72a 9 — — — — 29.44c 22.46d 19.04a