Surface Charge of a Nanoparticle Interacting with a Flat Substrate
9
Surface Charge of a Nanoparticle Interacting with a Flat Substrate Selcuk Atalay, † Murat Barisik, ‡ Ali Beskok, ‡ and Shizhi Qian †, * † Institute of Micro and Nanotechnology, Old Dominion University, Norfolk, Virginia 23529, United States ‡ Department of Mechanical Engineering, Southern Methodist University, Dallas, Texas 75275, United States ABSTRACT: Electrostatic interactions between two charged dielectric objects highly depend on their surface charge. Most existing studies assume constant surface charge densities between the two interacting objects regardless of the separation distance between them. The surface charge of a spherical silica nanoparticle interacting with a flat silica plate is investigated numerically as a function of the separation distance normalized with the electrical double layer thickness (κh), pH, and background salt concentration. The numerical model employs Poisson− Nernst−Planck equations for ionic mass transport and considers surface charge regulation in the presence of multiple ionic species. Relatively weak interactions between the nanoparticle and the plate are observed for κh ≫ 1, resulting in uniform surface charge densities. Because of curvature, the surface charge density of the nanoparticle is higher than that of the plate. Strong interactions are observed for κh ≤ 1, leading to spatially nonuniform surface charge densities on the nanoparticle and the plate. This effect increases with decreased separation distance (κh). Enhanced proton concentration in the gap between the particle and the plate leads to reduced surface charge densities on the two objects. 1. INTRODUCTION Surface charge property of an object in contact with an aqueous solution plays a very important role in the applications of surface science, colloidal science, and electrokinetic transport. For example, electrokinetic transport of ions, fluid, and particles within nanofluidic devices highly depend on the surface charge densities of the channel wall and the nanoparticles. 1−3 Many (bio)particles such as DNA, 4−8 proteins, 9−12 biological molecules, 13,14 and synthetic particles are separated on the basis of their charge differences. Dispersion stability of colloids depends on the charge properties of the colloids, and typically, highly charged colloids are more stable. Cellular uptake of nanoparticles is also affected by the nanoparticle’s size and charge. Electrostatic interactions between two objects im- mersed in an aqueous solution also highly depend on their charge properties. Surface charge forms as a result of dissociation of ionizable groups or adsorption/reaction of ions at the interface, when an object is in contact with an electrolyte solution. 15 Because the surface reactions including adsorption of ions and protonation/ deprotonation depends on the local ionic environment (e.g., local pH and salt concentrations) at the interface, typically the surface charge of an object is not a material property and depends on the local solution properties such as pH, ionic species, and their local concentrations. 16−18 When two charged objects are close to each other, the electrical double layers (EDLs) of the two interacting objects will overlap. Therefore, the local solution properties such as ionic concentrations in the gap between the two interacting objects are different from those when the two objects are sufficiently away from each other. For example, when two negatively charged objects are very close, their EDLs with dominant cations overlap, resulting in enriched cations such as H + ions in the interaction region between them. This generates a spatially nonuniform ionic concentration of cations around the interacting objects, yielding nonuniform surface charge properties of the two interacting objects. However, many existing studies assumed that the surface charge properties of two interacting objects remain at their bulk values. For example, the surface charge properties of two interacting objects are assumed to be constants in the well- known Derjaguin−Landau−Verwey−Overbeek (DLVO) theory, 19−23 which has been widely used to fit the measured interaction forces versus separation distances and to estimate the charge properties of two interacting objects. 24−48 Nano- particles translocating through charged nanopores are com- monly observed in nanopore biosensing applications. Most such investigations assume constant surface charges on the nanoparticle and the nanopore. 49,50 Because the EDLs are significantly overlapped in the nanopore, local ionic concen- tration around the bioparticle and the nanopore can be dramatically different from the conditions when the bioparticle is absent. The objective of this study is to investigate the variation of the surface charge properties of two interacting silica objects as a function of their normalized separation distance (κh) under various pH and salt concentration. Because the silica nano- particles have been widely used in colloidal science, biomolecular transport, and drug delivery 44,46,51−59 and because many nanofluidic devices (e.g., nanopores and nanochannels) are made of silica, 60−62 we investigate the charge properties of a Received: March 7, 2014 Revised: April 20, 2014 Published: April 30, 2014 Article pubs.acs.org/JPCC © 2014 American Chemical Society 10927 dx.doi.org/10.1021/jp5023554 | J. Phys. Chem. C 2014, 118, 10927−10935
Transcript of Surface Charge of a Nanoparticle Interacting with a Flat Substrate

Surface Charge of a Nanoparticle Interacting with a Flat SubstrateSelcuk Atalay,† Murat Barisik,‡ Ali Beskok,‡ and Shizhi Qian†,*†Institute of Micro and Nanotechnology, Old Dominion University, Norfolk, Virginia 23529, United States‡Department of Mechanical Engineering, Southern Methodist University, Dallas, Texas 75275, United States
ABSTRACT: Electrostatic interactions between two charged dielectric objectshighly depend on their surface charge. Most existing studies assume constant surfacecharge densities between the two interacting objects regardless of the separationdistance between them. The surface charge of a spherical silica nanoparticleinteracting with a flat silica plate is investigated numerically as a function of theseparation distance normalized with the electrical double layer thickness (κh), pH,and background salt concentration. The numerical model employs Poisson−Nernst−Planck equations for ionic mass transport and considers surface chargeregulation in the presence of multiple ionic species. Relatively weak interactionsbetween the nanoparticle and the plate are observed for κh ≫ 1, resulting in uniformsurface charge densities. Because of curvature, the surface charge density of thenanoparticle is higher than that of the plate. Strong interactions are observed for κh≤ 1, leading to spatially nonuniform surface charge densities on the nanoparticle andthe plate. This effect increases with decreased separation distance (κh). Enhancedproton concentration in the gap between the particle and the plate leads to reduced surface charge densities on the two objects.
1. INTRODUCTION
Surface charge property of an object in contact with an aqueoussolution plays a very important role in the applications ofsurface science, colloidal science, and electrokinetic transport.For example, electrokinetic transport of ions, fluid, and particleswithin nanofluidic devices highly depend on the surface chargedensities of the channel wall and the nanoparticles.1−3 Many(bio)particles such as DNA,4−8 proteins,9−12 biologicalmolecules,13,14 and synthetic particles are separated on thebasis of their charge differences. Dispersion stability of colloidsdepends on the charge properties of the colloids, and typically,highly charged colloids are more stable. Cellular uptake ofnanoparticles is also affected by the nanoparticle’s size andcharge. Electrostatic interactions between two objects im-mersed in an aqueous solution also highly depend on theircharge properties.Surface charge forms as a result of dissociation of ionizable
groups or adsorption/reaction of ions at the interface, when anobject is in contact with an electrolyte solution.15 Because thesurface reactions including adsorption of ions and protonation/deprotonation depends on the local ionic environment (e.g.,local pH and salt concentrations) at the interface, typically thesurface charge of an object is not a material property anddepends on the local solution properties such as pH, ionicspecies, and their local concentrations.16−18 When two chargedobjects are close to each other, the electrical double layers(EDLs) of the two interacting objects will overlap. Therefore,the local solution properties such as ionic concentrations in thegap between the two interacting objects are different fromthose when the two objects are sufficiently away from eachother. For example, when two negatively charged objects arevery close, their EDLs with dominant cations overlap, resulting
in enriched cations such as H+ ions in the interaction regionbetween them. This generates a spatially nonuniform ionicconcentration of cations around the interacting objects, yieldingnonuniform surface charge properties of the two interactingobjects. However, many existing studies assumed that thesurface charge properties of two interacting objects remain attheir bulk values. For example, the surface charge properties oftwo interacting objects are assumed to be constants in the well-known Derjaguin−Landau−Verwey−Overbeek (DLVO)theory,19−23 which has been widely used to fit the measuredinteraction forces versus separation distances and to estimatethe charge properties of two interacting objects.24−48 Nano-particles translocating through charged nanopores are com-monly observed in nanopore biosensing applications. Mostsuch investigations assume constant surface charges on thenanoparticle and the nanopore.49,50 Because the EDLs aresignificantly overlapped in the nanopore, local ionic concen-tration around the bioparticle and the nanopore can bedramatically different from the conditions when the bioparticleis absent.The objective of this study is to investigate the variation of
the surface charge properties of two interacting silica objects asa function of their normalized separation distance (κh) undervarious pH and salt concentration. Because the silica nano-particles have been widely used in colloidal science,biomolecular transport, and drug delivery44,46,51−59 and becausemany nanofluidic devices (e.g., nanopores and nanochannels)are made of silica,60−62 we investigate the charge properties of a
Received: March 7, 2014Revised: April 20, 2014Published: April 30, 2014
Article
pubs.acs.org/JPCC
© 2014 American Chemical Society 10927 dx.doi.org/10.1021/jp5023554 | J. Phys. Chem. C 2014, 118, 10927−10935
silica nanoparticle interacting with a silica flat surface. Incontrast to most previous studies which neglected the surfacechemistry, we analyze the effects of local pH and saltconcentrations on the surface charge using a multi-ion chargeregulation model.24,63,64
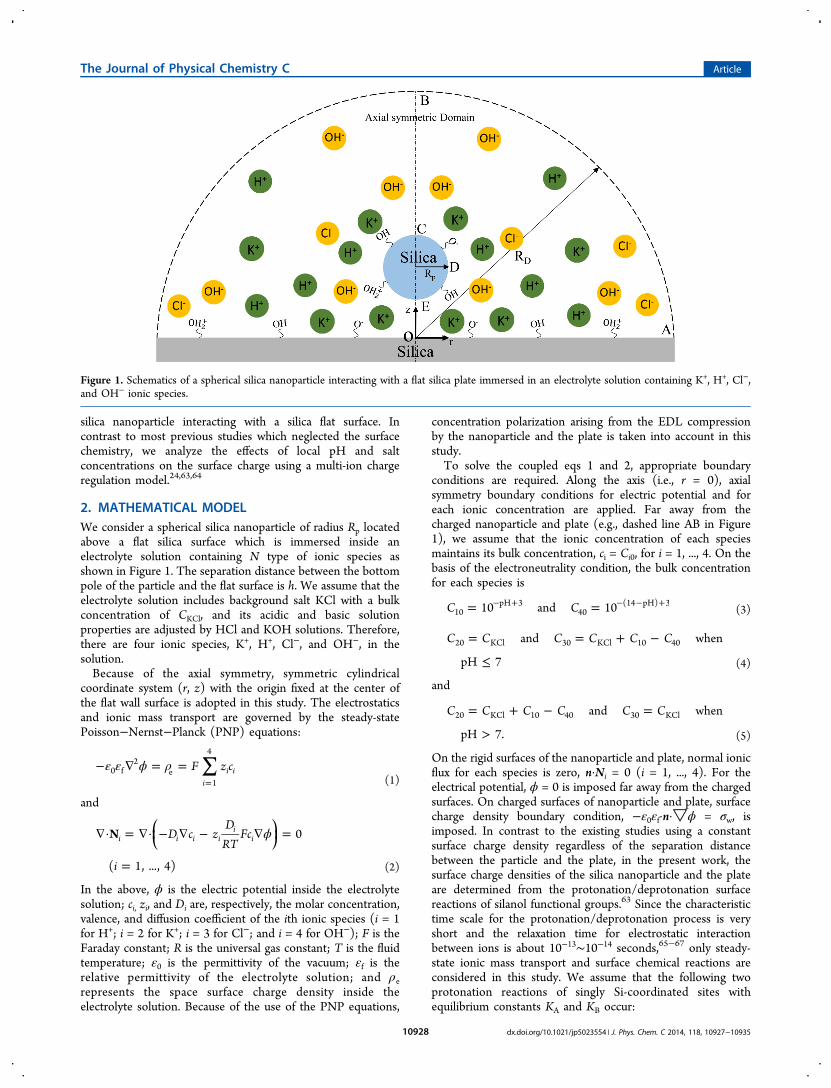
2. MATHEMATICAL MODELWe consider a spherical silica nanoparticle of radius Rp locatedabove a flat silica surface which is immersed inside anelectrolyte solution containing N type of ionic species asshown in Figure 1. The separation distance between the bottompole of the particle and the flat surface is h. We assume that theelectrolyte solution includes background salt KCl with a bulkconcentration of CKCl, and its acidic and basic solutionproperties are adjusted by HCl and KOH solutions. Therefore,there are four ionic species, K+, H+, Cl−, and OH−, in thesolution.Because of the axial symmetry, symmetric cylindrical
coordinate system (r, z) with the origin fixed at the center ofthe flat wall surface is adopted in this study. The electrostaticsand ionic mass transport are governed by the steady-statePoisson−Nernst−Planck (PNP) equations:
∑ε ε ϕ ρ− ∇ = ==
F z ci
i i0 f2
e1
4
(1)
and
ϕ∇· = ∇· − ∇ − ∇ =
=
⎜ ⎟⎛⎝
⎞⎠D c z
DRT
Fc
i
N 0
( 1, ..., 4)
i i i ii
i
(2)
In the above, ϕ is the electric potential inside the electrolytesolution; ci, zi, and Di are, respectively, the molar concentration,valence, and diffusion coefficient of the ith ionic species (i = 1for H+; i = 2 for K+; i = 3 for Cl−; and i = 4 for OH−); F is theFaraday constant; R is the universal gas constant; T is the fluidtemperature; ε0 is the permittivity of the vacuum; εf is therelative permittivity of the electrolyte solution; and ρerepresents the space surface charge density inside theelectrolyte solution. Because of the use of the PNP equations,
concentration polarization arising from the EDL compressionby the nanoparticle and the plate is taken into account in thisstudy.To solve the coupled eqs 1 and 2, appropriate boundary
conditions are required. Along the axis (i.e., r = 0), axialsymmetry boundary conditions for electric potential and foreach ionic concentration are applied. Far away from thecharged nanoparticle and plate (e.g., dashed line AB in Figure1), we assume that the ionic concentration of each speciesmaintains its bulk concentration, ci = Ci0, for i = 1, ..., 4. On thebasis of the electroneutrality condition, the bulk concentrationfor each species is
= =− + − − +C C10 and 1010pH 3
40(14 pH) 3
(3)
= = + −
≤
C C C C C Cand when
pH 720 KCl 30 KCl 10 40
(4)
and
= + − =
>
C C C C C Cand when
pH 7.20 KCl 10 40 30 KCl
(5)
On the rigid surfaces of the nanoparticle and plate, normal ionicflux for each species is zero, n·Ni = 0 (i = 1, ..., 4). For theelectrical potential, ϕ = 0 is imposed far away from the chargedsurfaces. On charged surfaces of nanoparticle and plate, surfacecharge density boundary condition, −ε0εf·n·▽ϕ = σw, isimposed. In contrast to the existing studies using a constantsurface charge density regardless of the separation distancebetween the particle and the plate, in the present work, thesurface charge densities of the silica nanoparticle and the plateare determined from the protonation/deprotonation surfacereactions of silanol functional groups.63 Since the characteristictime scale for the protonation/deprotonation process is veryshort and the relaxation time for electrostatic interactionbetween ions is about 10−13∼10−14 seconds,65−67 only steady-state ionic mass transport and surface chemical reactions areconsidered in this study. We assume that the following twoprotonation reactions of singly Si-coordinated sites withequilibrium constants KA and KB occur:
Figure 1. Schematics of a spherical silica nanoparticle interacting with a flat silica plate immersed in an electrolyte solution containing K+, H+, Cl−,and OH− ionic species.
The Journal of Physical Chemistry C Article
dx.doi.org/10.1021/jp5023554 | J. Phys. Chem. C 2014, 118, 10927−1093510928

↔ +− +SiOH SiO H (6)
and
+ ↔+ +SiOH H SiOH2 (7)
The equilibrium constants are calculated as
= =+
+− +
KN
NK
N
N[H ]
and[H ]A
SiO s
SiOHB
SiOH
SiOH s
2
(8)
In the above, NSiOH, NSiO−, and NSiOH2
+ are the surface sitedensities of SiOH, SiO−, and SiOH2
+, respectively. [H+]s is theconcentration of H+ ions at the solid/liquid interface. Theeffects of the Stern layer on determination of surface chargeproperty are neglected in the current work. The total numbersite density of silanol functional groups on the solid/liquidinterface is
= + +− +N N N Ntotal SiOH SiO SiOH2 (9)
On the basis on eqs 8 and 10, the surface charge density on thenanoparticle and the plate can be expressed as
σ = −−
+ +
+
+ +FN
K K
K K
[H ]
[H ] [H ]w total
A B s2
A s B s2
(10)
[H+]s in eq 10 is the proton concentration on the surface of theparticle and plate. Although both are made of the same materialwith the same Ntotal, KA, and KB, their surface charge densitiesmight be different if their local proton concentrations aredifferent. Equation 10 also clearly shows that the surface chargedensity is not a material property that is due to its dependenceon the local proton concentration.
3. NUMERICAL IMPLEMENTATION AND CODEVALIDATION
The PNP equations are numerically solved using a commercialfinite-element package COMSOL Multiphysics (www.comsol.
Figure 2. Surface charge densities of (a) silica nanoparticle and (b) a planar silica plate as a function of pH of the electrolyte solution. Circles andline in a represent, respectively, the experimental data from Sonnefeld et al.69 and the numerical results. Circles and line in b represent, respectively,the numerical results and the analytical results derived by Yeh et al.63
Figure 3. Distribution of the electric potential around the nanoparticle interacting with a flat surface at different κh and pH. Color bars denote theelectric potential in volts.
The Journal of Physical Chemistry C Article
dx.doi.org/10.1021/jp5023554 | J. Phys. Chem. C 2014, 118, 10927−1093510929
com) operating in a high-performance cluster. Finer mesh isused around the surfaces of charged nanoparticle and plate andin the gap between the particle and the plate. Relatively coarsemesh is used in regions far away from the charged surfaces. Inthe simulations, the far field boundary (e.g., dashed line AB inFigure 1) is set as RD = 50Rp, which is sufficiently large, and theresults do not change as RD further increases. Throughsystematic studies of mesh refinements, mesh independentresults are established using about 300 000 Lagrange-quadraticelements in the domain.Physical parameters used in the simulations are ε0εf = 7.08 ×
10−10 F/m, R = 8.31 J/(K·mol), F = 96 490 C/mol, T = 300 K,Ntotal = 4.816 sites/nm2, pKA = −log KA = 7.0, and pKB = −logKB = 1.9. The diffusivities of H+, K+, Cl−, and OH− ions are,respectively, 9.31 × 10⁻⁹, 1.96 × 10⁻⁹, 2.03 × 10⁻⁹, and 5.30 ×10⁻⁹ m2/s.68 The particle radius is Rp = 10 nm, and theseparation distance between the particle’s bottom pole and theflat surface is kept constant for all simulation cases at h = 5 nm,and the degree of interaction is adjusted by varying the bulk saltconcentration CKCl in the range of 1 −100 mM. The EDLthickness is calculated using κ−1 = λD = (ε0εfRT/∑i=1
4 F2zi2Ci0)
1/2, and the results are presented as a function ofnormalized separation distance κh. The pH of the aqueoussolution is adjusted by using H+ or OH− ionic species in therange of 4−10.For code validation purposes, we simulated the surface
charge density of a spherical silica nanoparticle of Rp = 58 nmimmersed in an infinite electrolyte medium without the plate.The obtained results illustrated in Figure 2a show goodagreement with the experimental data obtained by Sonnefeld etal.69 for bulk salt concentration CKCl = 100 mM, Ntotal = 2.1sites/nm2, pKA = 6.38, and pKB = 1.87. Therefore, the chargeregulation model for the surface charge density captures theunderlying physics. We also modeled a flat silica surface in
contact with a semi-infinite electrolyte solution. Analyticalsolution for the surface charge density of a planar surface hasbeen recently derived by Yeh et al.63 Figure 2b depicts thesurface charge density of a planar surface as a function of pH forbulk salt concentration CKCl = 100 mM. The numerical results(red circles) are in good agreement with the analytical results(solid line). Clearly, the surface charge density increases withincreased pH of the solution.
4. RESULTS AND DISCUSSION
4.1. Salt Concentration Effect. When the interactionbetween the particle and the plate is very weak, which occurswhen the separation distance is much larger than the EDLthickness (i.e., κh ≫ 1), the surface charge density along thesurface of the particle (plate) is spatially uniform. Because ofthe curvature effect, the surface charge density of thenanoparticle is different from that of the plate. We denotethe surface charge densities of the particle and the plate underthe condition of no interaction as σp∞ and σw∞, respectively.The electrostatic interaction between the particle and the
plate increases as κh decreases. Figure 3 depicts the electricpotential distribution around the nanoparticle and theinteracting plate for different pH and κh values. The EDLsare not overlapped for κh = 5; therefore, the electric potentialalong the surface of the particle and the plate is spatiallyuniform. As κh decreases, the degree of EDL overlap increases.EDLs are slightly overlapped in the gap for κh = 1.6, and themagnitude of the electrical potential in the gap region betweenthe particle and the plate is higher than that located far awayfrom the interaction region. EDLs are significantly overlappedfor κh = 0.5, resulting in a larger interaction region with anenhanced electric potential. Obviously, the electric potentialaround the particle (plate) becomes significantly nonuniformfor κh ≤ 1 because of serious EDL overlapping. On the particle
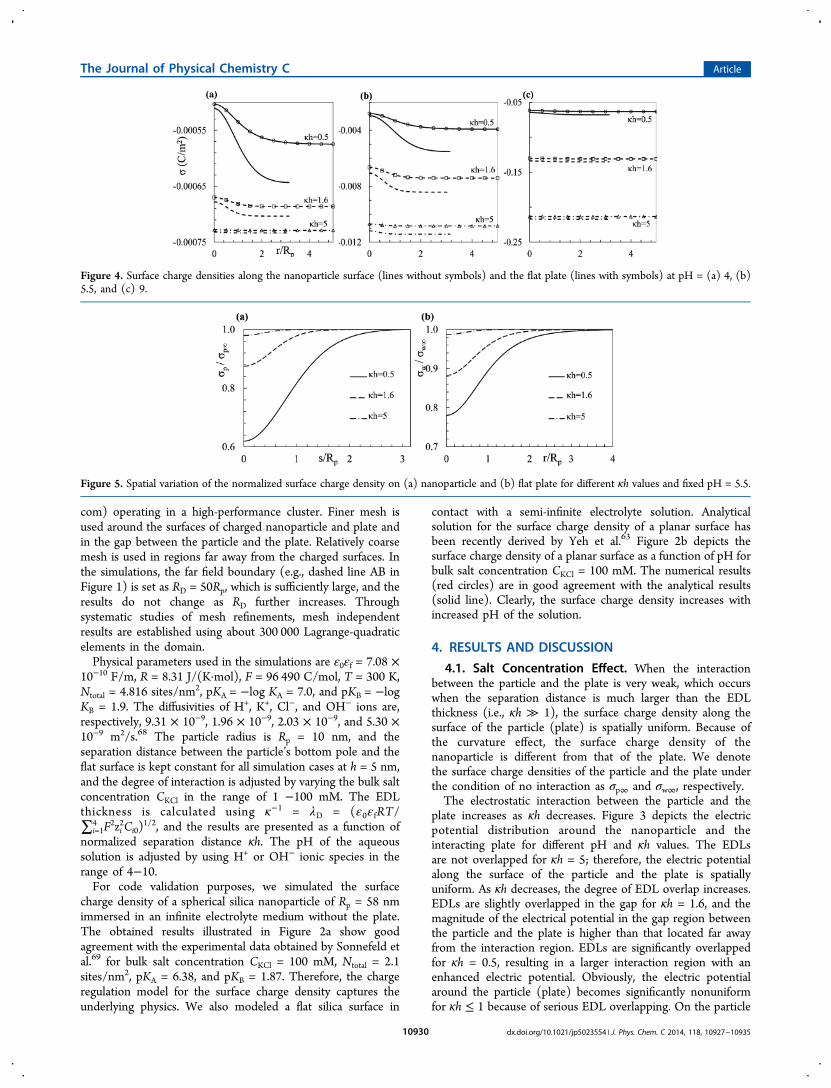
Figure 4. Surface charge densities along the nanoparticle surface (lines without symbols) and the flat plate (lines with symbols) at pH = (a) 4, (b)5.5, and (c) 9.
Figure 5. Spatial variation of the normalized surface charge density on (a) nanoparticle and (b) flat plate for different κh values and fixed pH = 5.5.
The Journal of Physical Chemistry C Article
dx.doi.org/10.1021/jp5023554 | J. Phys. Chem. C 2014, 118, 10927−1093510930

surface, the highest potential occurs at the bottom pole of theparticle, where the strongest interaction occurs, and the lowestpotential occurs at the top pole which has the weakestinteraction with the bottom flat plate. The potential differencebetween the bottom and top poles of the spherical particleincreases as κh decreases for all pH values.Figure 4 depicts the surface charge densities along the arc
length of the particle surface starting from the bottom pole tothe top pole (lines without symbols) and along the flat surface(lines with symbols) under the conditions of Figure 3. Underany given condition, the surface charge density of thenanoparticle is typically a little bit higher than that of theplate, and this is attributed to the curvature effect.64 Under thecondition of serious EDL overlap (i.e., κh = 0.5), the surfacecharge densities of the particle and the plate become spatiallynonuniform. The magnitude of the surface charge density in theinteracting region is typically lower than that far away from theinteraction region. As κh increases, the degree of thenonuniform distribution of the surface charge density decreases.In addition, the surface charge densities of the particle and theplate increase with an increase in κh. To further clearly showthe variation of the charge density along the particle and theplate, Figure 5 illustrates the spatial distributions of the surfacecharge densities along the arc length of (a) the particle surfaceand (b) the plate normalized by the corresponding surfacecharge densities for κh → ∞. In the absence of interaction, thenormalized surface charge density is 1. Because the top pole ofthe spherical particle has very weak interaction with the bottomplate under the considered conditions, the normalized surfacecharge density at the top pole is 1. However, the normalizedsurface charge density at the bottom pole significantly deviatesfrom 1, especially when the EDLs are significantly overlapped.For example, at κh = 0.5, the surface charge density at thebottom pole of the sphere is about 62% of that at the top pole
of the nanoparticle. The surface charge density on the plate at r= 0 is about 78% of the noninteracting region. Therefore, theassumption of constant surface charge densities of twointeracting objects used in previous studies is inappropria-te.50,70The normalized surface charge density increases on theparticle’s surface from the bottom toward the top pole. As κhincreases, the interaction region decreases; therefore, the regionwith normalized surface charge density smaller than 1 shrinks.For κh = 5, only a small portion of the particle and only a smallportion of the plate have very weak interaction, and theirnormalized surface charge densities are slightly smaller than 1as shown in Figure 5.The significant reduction of the surface charge densities of
the particle and the plate is attributed to the significantenrichment of positive ions in the interaction region. Under theconsidered conditions, both the nanoparticle and the plate arenegatively charged. Counterions, (K+ and H+), are accumulatedwithin each EDL, and co-ions, Cl− and OH−, are depleted.Figure 6 depicts the spatial distribution of the concentration ofH+ ions near the nanoparticle for pH = 5.5 at different κhvalues. The variation of κh is achieved by adjusting the bulkconcentration of the background salt, CKCl. Figure 6 shows thatthe concentration of H+ ions is significantly enhanced as κhdecreases. The enriched positive ions decrease the negativelycharged SiO− dissociated from the functional groups SiOH,yielding lower negative surface charge density in the interactionregion.71,72 Figure 7a depicts ionic concentration of H+ ions atthe bottom (solid line) and top (dashed line) poles of theparticle as a function of κh when the pH level is 6.5. Becausethe increase in κh is achieved by increasing the bulk saltconcentration, CKCl, the concentration of K+ ions also increaseswith an increase in κh. The increased K+ ions in the EDL of thenanoparticle repel H+ ions, resulting in a decrease in theconcentration of H+ inside the EDL. At the top pole of the
Figure 6. Spatial distribution of H+ ion concentration (in mM) near the nanoparticle for different κh values and pH = 5.5.
Figure 7. (a) H+ ion concentration on the particle’s top pole (square with dashed line) and on the particle’s bottom pole (circle with solid line). (b)H+ ion concentration on the plate at r = 0 (solid line with circles) and r → ∞ (square with dashed line).
The Journal of Physical Chemistry C Article
dx.doi.org/10.1021/jp5023554 | J. Phys. Chem. C 2014, 118, 10927−1093510931

nanoparticle, which almost has no interaction with the plate,the concentration of H+ ions decreases as κh increases, and thisis attributed to the depletion of H+ ions by the increased K+
ions. When κh ≤ 2, the concentration of H+ ions at the bottompole is much higher than that at the top pole, which is due tothe enriched positive ions in the interaction region by EDLoverlap. As κh increases, the degree of EDL overlap decreases,and the difference between the proton concentrations at thebottom and top poles decreases. Figure 7b shows theconcentration of H+ ions on the plate at the origin (solidline) and far away from the interaction region (dashed line).Similarly, the proton concentration at the origin where thestrongest interaction occurs significantly increases because ofthe EDLs overlapping. On the basis of the protonation/deprotonation reactions, the surface charge density is inverselyproportional to the local concentration of H+ ions; the enrichedH+ ions in the interaction region arising from the overlappedEDLs lead to lower surface charge density in the interactionregion as shown in Figures 4 and 5.Figure 8 shows the ratio of the surface charge density
difference at the top and bottom poles to the surface charge
density at the top pole, (σpT − σpb)/σpT, as a function of κh atpH = 4, 5.5, and 9. At each pH, the surface charge densitydifference at the top and bottom poles of the particle decreasesas κh increases. As κh exceeds a certain critical value, the surfacecharge density difference vanishes, and the surface chargedensity is uniformly distributed along the particle surface. Atthe same κh, the relative surface charge difference at pH = 5.5 ishigher than that at pH = 4 and 9, which will be explained in thefollowing section.4.2. pH Effect. Previous results clearly show that the surface
charge properties of two interacting objects vary with thedegree of their interaction, and the surface charge density in the
interaction region is dramatically reduced when the EDLs aresignificantly overlapped. In this section, the effect of pH on thesurface charge density of the particle interacting with the plateis investigated at fixed κh = 0.5, 1.6, and 5 where thecorresponding bulk salt concentrations are 1, 10, and 100 mM,respectively.Figure 9a depicts the surface charge density at the bottom
pole of the particle as a function of pH at κh = 0.5, 1.6, and 5.At fixed κh, the negative surface charge density increases withan increase in pH. This is expected since the bulk concentrationof H+ ions decreases as pH increases, leading to more SiO−
functional groups dissociated from SiOH. Figure 9b depicts thesurface charge density at the bottom pole of the particlenormalized by that for κh → ∞. At κh = 5, the normalizedsurface charge density is close to 1 because of very weakinteraction. However, for κh = 1.6 and 0.5, because of stronginteraction, the normalized surface charge density is below 1.The normalized surface charge first decreases as pH increases,attains the minimum at a critical pH, and then increases whenpH exceeds the critical value. The variation of the normalizedsurface charge density with pH can be explained by thevariation of the surface concentration of proton under theconsidered conditions. Figure 10 depicts the concentration of
H+ ions at the bottom pole normalized by that for κh → ∞ atthe same conditions of Figure 9. The normalized surfaceconcentration of H+ ions increases with an increase in pH whenthe latter is relatively low, attains a maximum at a critical pH,and then decreases as pH further increases. As pH increases,the bulk concentration of H+ ions decreases, leading to adecrease in the surface concentration of H+ ions. However, thenegative surface charge density increases as pH increases, whichattracts more H+ ions to the negatively charged surface,resulting in an increase in the surface concentration of H+ ions.
Figure 8. Ratio of the surface charge density difference at the top andbottom poles of the particle to the surface charge density at the toppole as a function of κh for different pH values.
Figure 9. (a) Surface charge density at the bottom pole of the nanoparticle as a function of pH for κh = 0.5, 1.6, and 5. (b) Surface charge density onthe bottom pole of the nanoparticle normalized by that at κh → ∞ as a function of pH for three different κh values.
Figure 10. Concentration of H+ ions at the bottom pole of the particlenormalized by that at κh → ∞ as a function of pH for different κhvalues.
The Journal of Physical Chemistry C Article
dx.doi.org/10.1021/jp5023554 | J. Phys. Chem. C 2014, 118, 10927−1093510932

The variation of the surface concentration of H+ ions with pHis the net result of the two competitions. When pH is relativelylow, because the bulk concentration of H+ ions is not very low,the increased negative charge attracts a lot of H+ ions into theoverlapped EDLs, resulting in an increase in the concentrationof H+ ions in the interaction region. However, at relatively highpH, the bulk concentration of K+ ions becomes significantlyhigher than that of H+ ions; therefore, more K+ ions than H+
ions will be accumulated in the overlapped EDLs. The enrichedK+ ions will also deplete H+ ions leading to a decrease in H+
ions inside the EDL. Therefore, the local concentration of H+
ions at the bottom pole of the particle increases with anincrease in pH at relatively low pH, attains the maximum at acritical pH, and then decreases as pH further increases. Becausethe charge density is inversely proportional to the localconcentration of H+ ions, the surface charge densities of theparticle in the interaction region decrease as pH increases andattain the minimum at the critical pH value after which theyincrease as pH further increases.
5. CONCLUSIONSSurface charge properties of interacting silica nanoparticle andplate are theoretically investigated as functions of pH,background salt concentration, and the degree of theirinteraction. The model considers multiple ionic species, chargeregulation on the interaction objects, and double layer overlap.The Stern layer effects are not considered in the current study.Without interaction, the surface charge density is homoge-neous. However, the charge densities become spatiallynonuniform, and the magnitude of the surface charge densityin the interaction region is significantly reduced when thedouble layers are overlapped. Under strong interaction, thesurface charge density in the interaction region is only about50% of the bulk value. Because the degree of interactionincreases as the ratio of the separation distance to the EDLthickness, κh, decreases, the deviation from constant chargedensities for two interacting objects increases as κh decreases.In the interaction region, the normalized surface chargedensities of the particle and the plate decrease as pH increases,attain a minimum value at a critical pH value, and then increasewith further increase in pH. This arises from the competition ofthe following two mechanisms: (1) bulk concentration of H+
ions decreases as pH increases, yielding to a decrease in thesurface concentration of H+ ions; and (2) the negative surfacecharge density increases with an increase in pH, which attractsmore counterions accumulated inside the EDLs. When moreK+ ions are accumulated than the H+ ions, the enriched K+ ionsalso deplete the H+ ions. The results demonstrate that theassumption of constant surface charge density of twointeracting objects is invalid under strong EDL interactionsbetween the particle and the surfaces in the range of κh ≤ 1.
■ AUTHOR INFORMATIONCorresponding Author*E-mail: [email protected]. Phone: 757-683-3304. Fax: 757-683-3200.NotesThe authors declare no competing financial interest.
■ REFERENCES(1) Sang, J. M.; Du, H. T.; Wang, W.; Chu, M.; Wang, Y. D.; Li, H.C.; Zhang, H. A.; Wu, W. G.; Li, Z. H. Protein Sensing by NanofluidicCrystal and its Signal Enhancement. Biomicrofluidics 2013, 7, 024112.
(2) Cheng, L. J.; Guo, L. J. Ionic Current Rectification, Breakdown,and Switching in Heterogeneous Oxide Nanofluidic Devices. ACSNano 2009, 3, 575−584.(3) Perry, J. M.; Zhou, K. M.; Harms, Z. D.; Jacobson, S. C. IonTransport in Nanofluidic Funnels. ACS Nano 2010, 4, 3897−3902.(4) Jenison, R.; Yang, S.; Haeberli, A.; Polisky, B. Interference-basedDetection of Nucleic Acid Targets on Optically Coated Silicon. Nat.Biotechnol. 2001, 19, 62−65.(5) Ullien, D.; Cohen, H.; Porath, D. The Effect of the Number ofParallel DNA Molecules on Electric Charge Transport through‘Standing DNA’. Nanotechnology 2007, 18, 424015.(6) Baumgartner, S.; Vasicek, M.; Bulyha, A.; Heitzinger, C.Optimization of Nanowire DNA Sensor Sensitivity using Self-Consistent Simulation. Nanotechnology 2011, 22, 425503.(7) Chang, H.; Kosari, F.; Andreadakis, G.; Alam, M. A.; Vasmatzis,G.; Bashir, R. DNA-Mediated Fluctuations in Ionic Current throughSilicon Oxide Nanopore Channels. Nano Lett. 2004, 4, 1551−1556.(8) Pu, Q. S.; Oyesanya, O.; Thompson, B.; Liu, S. T.; Alvarez, J. C.On-chip Micropatterning of Plastic (Cylic Olefin Copolymer, COC)Microfluidic Channels for the Fabrication of Biomolecule Microarraysusing Photografting Methods. Langmuir 2007, 23, 1577−1583.(9) Duffy, C. F.; Gafoor, S.; Richards, D. P.; Admadzadeh, H.;O’Kennedy, R.; Arriaga, E. A. Determination of properties ofIndividual Liposomes by Capillary Electrophoresis with PostcolumnLaser-Induced Fluorescence Detection. Anal. Chem. 2001, 73, 1855−1861.(10) Miura, A.; Tanaka, R.; Uraoka, Y.; Matsukawa, N.; Yamashita, I.;Fuyuki, T. The Characterization of a Single Discrete Bionanodot forMemory Device Applications. Nanotechnology 2009, 20, 125702.(11) Chen, M. Y.; Sailor, M. J. Charge-Gated Transport of Proteinsin Nanostructured Optical Films of Mesoporous Silica. Anal. Chem.2011, 83, 7186−7193.(12) Ali, M.; Bayer, V.; Schiedt, B.; Neumann, R.; Ensinger, W.Fabrication and Functionalization of Single Asymmetric Nanochannelsfor Electrostatic/Hydrophobic Association of Protein Molecules.Nanotechnology 2008, 19, 485711.(13) Liang, L.; Rulis, P.; Ching, W. Y. Mechanical Properties,Electronic Structure and Bonding of Alpha- and Beta-tricalciumPhosphates with Surface Characterization. Acta Biomater.. 2010, 6,3763−3771.(14) Lopes, M.; Candini, A.; Urdampilleta, M.; Reserbat-Plantey, A.;Bellini, V.; Klyatskaya, S.; Marty, L.; Ruben, M.; Affronte, M.;Wernsdorfer, W.; et al. Surface-Enhanced Raman Signal for TerbiumSingle-Molecule Magnets Grafted on Graphene. ACS Nano 2010, 4,7531−7537.(15) Hunter, R. J. Zeta Potential in Colloid Science: Principles andApplications; Academic Press: London, 1981; Vol. 125.(16) Barr, S. A.; Panagiotopoulos, A. Z. Interactions BetweenCharged Surfaces with Ionizable Sites. Langmuir 2011, 27, 8761−8766.(17) Prieve, D. C.; Ruckenstein, E. The Surface Potential of andDouble-Layer Interaction Force Between Surfaces Characterized byMultiple Ionizable Groups. J. Theor. Biol. 1976, 56, 205−228.(18) Baldessari, F. Electrokinetics in Nanochannels - Part II. Mobilitydependence on Ion Density and Ionic Current Measurements. J.Colloid Interface Sci. 2008, 325, 539−546.(19) Verwey, E. J. W. Theory of the Stability of Lyophobic Colloids.J. Colloid Interface Sci. 1947, 51, 631−636.(20) Derjaguin, B.; Landau, L. The Theory of Stability of HighlyCharged Lyophobic Sols and Coalescence of Highly Charged Particlesin electrolyte solutions. Zh. Eksp. Teor. Fiz. 1941, 11, 802−821.(21) Verwey, E. J. W.; Overbeek, J. T. G.; Van Nes, K. Theory of theStability of Lyophobic Colloids: The Interaction of Sol Particles Having anElectric Double Layer; Elsevier: New York, 1948.(22) Israelachvili, J. N. Intermolecular and Surface Forces: Revised, 3rded.; Academic Press: Waltham, MA, 2011.(23) Ohshima, H.; Furusawa, K. Electrical Phenomena and Interfaces:Fundamentals, Measurements, and Applications; CRC Press: Hoboken,New Jersey, 1998.
The Journal of Physical Chemistry C Article
dx.doi.org/10.1021/jp5023554 | J. Phys. Chem. C 2014, 118, 10927−1093510933

(24) Yeh, L.-H.; Zhang, M.; Hu, N.; Joo, S. W.; Qian, S.; Hsu, J.-P.Electrokinetic Ion and Fluid Transport in Nanopores Functionalizedby Polyelectrolyte Brushes. Nanoscale 2012, 4, 5169−5177.(25) Bowen, W. R.; Doneva, T. A.; Stoton, J. A. G. The Use ofAtomic Force Microscopy to Quantify Membrane Surface ElectricalProperties. Colloids Surf., A: Physicochem. Eng. Aspects 2002, 201, 73−83.(26) Chen, L.; Conlisk, A. T. DNA Nanowire TranslocationPhenomena in Nanopores. Biomed. Microdevices 2010, 12, 235−245.(27) Das, S.; Dubsky, P.; van den Berg, A.; Eijkel, J. C. ConcentrationPolarization in Translocation of DNA through Nanopores andNanochannels. Phys. Rev. Lett. 2012, 108, 138101.(28) Drelich, J.; Long, J.; Yeung, A. Determining Surface Potential ofthe Bitumen-Water Interface at Nanoscale Resolution Using AtomicForce Microscopy. Can. J. Chem. Eng. 2007, 85, 625−634.(29) Duan, J. M. Interfacial Forces between Silica Surfaces Measuredby Atomic Force Microscopy. J. Environ. Sci. 2009, 21, 30−34.(30) Wang, Y. H.; Wang, L. G.; Hampton, M. A.; Nguyen, A. V.Atomic Force Microscopy Study of Forces between a Silica Sphere andan Oxidized Silicon Wafer in Aqueous Solutions of NaCl, KCl, andCsCl at Concentrations up to Saturation. J. Phys. Chem. C 2013, 117,2113−2120.(31) Lima, E. R.; Bostrom, M.; Schwierz, N.; Sernelius, B. E.;Tavares, F. W. Attractive Double-Layer Forces between NeutralHydrophobic and Neutral Hydrophilic Surfaces. Phys. Rev. E: Stat.,Nonlinear, Soft Matter Phys. 2011, 84, 061903.(32) Xu, Z. H.; Chi, R.; Difeo, T.; Finch, J. A. Surface Forces betweenSphalerite and Silica Particles in Aqueous Solutions. J. Adhes. Sci.Technol. 2000, 14, 1813−1827.(33) Ruiz-Cabello, F. J. M.; Maroni, P.; Borkovec, M. DirectMeasurements of Forces between Different Charged ColloidalParticles and their Prediction by the Theory of Derjaguin, Landau,Verwey, and Overbeek (DLVO). J. Chem. Phys. 2013, 138, 234705.(34) Larson, I.; Drummond, C. J.; Chan, D. Y. C.; Grieser, F. DirectForce Measurements between Dissimilar Metal-Oxides. J. Phys. Chem.1995, 99, 2114−2118.(35) Miklavic, S.; Chan, D. Y.; White, L.; Healy, T. W. Double LayerForces Between Heterogeneous Charged Surfaces. J. Phys. Chem.1994, 98, 9022−9032.(36) Popa, I.; Sinha, P.; Finessi, M.; Maroni, P.; Papastavrou, G.;Borkovec, M. Importance of Charge Regulation in Attractive Double-Layer Forces between Dissimilar Surfaces. Phys. Rev. Lett. 2010, 104,228301.(37) Butt, H.-J.; Cappella, B.; Kappl, M. Force Measurements withthe Atomic Force Microscope: Technique, Interpretation andApplications. Surf. Sci. Rep. 2005, 59, 1−152.(38) Notley, S. M.; Norgren, M. Measurement of Interaction Forcesbetween Lignin and Cellulose as a Function of Aqueous ElectrolyteSolution Conditions. Langmuir 2006, 22, 11199−11204.(39) Montes Ruiz-Cabello, F. J.; Maroni, P.; Borkovec, M. DirectMeasurements of Forces Between Different Charged ColloidalParticles and Their Prediction by the Theory of Derjaguin, Landau,Verwey, and Overbeek (DLVO). J. Chem. Phys. 2013, 138, 234705.(40) Elmahdy, M. M.; Drechsler, A.; Gutsche, C.; Synytska, A.;Uhlmann, P.; Kremer, F.; Stamm, M. Forces Between Blank SurfacesAs Measured by the Colloidal Probe Technique and by OpticalTweezers - A Comparison. Langmuir 2009, 25, 12894−12898.(41) Briscoe, W. H.; Horn, R. G. Direct Measurement of SurfaceForces due to Charging of Solids Immersed in a Nonpolar Liquid.Langmuir 2002, 18, 3945−3956.(42) Velegol, D.; Thwar, P. K. Analytical Model for the Effect ofSurface Charge Nonuniformity on Colloidal Interactions. Langmuir2001, 17, 7687−7693.(43) Zhong, S.; Li, H.; Chen, X. Y.; Cao, E. H.; Jin, G.; Hu, K. S.Different Interactions between the Two Sides of Purple Membranewith Atomic Force Microscope tip. Langmuir 2007, 23, 4486−4493.(44) Butt, H. J. Measuring Electrostatic, Vanderwaals, and HydrationForces in Electrolyte-Solutions with an Atomic Force Microscope.Biophys. J. 1991, 60, 1438−1444.
(45) Butt, H.-J. Measuring Local Surface Charge Densities inElectrolyte Solutions with a Scanning Force Microscope. Biophys. J.1992, 63, 578−582.(46) Huettl, G.; Beyer, D.; Muller, E. Investigation of ElectricalDouble Layers on SiO2 Surfaces by Means of Force vs. DistanceMeasurements. Surf. Interface Anal. 1997, 25, 543−547.(47) Zhou, K.; Perry, J. M.; Jacobson, S. C. Transport and Sensing inNanofluidic Devices. Annu. Rev. Anal. Chem. 2011, 4, 321−341.(48) Pelto, J. M.; Haimi, S. P.; Siljander, A. S.; Miettinen, S. S.;Tappura, K.; Higgins, M. J.; Wallace, G. G. Surface Properties andInteraction Forces of Biopolymer Doped Conductive PolypyrroleSurfaces by Atomic Force Microscopy. Langmuir 2013, 29, 6099−6108.(49) Zhang, M.; Yeh, L.-H.; Qian, S.; Hsu, J.-P.; Joo, S. W. DNAElectrokinetic Translocation through a Nanopore: Local PermittivityEnvironment Effect. J. Phys. Chem. C 2012, 116, 4793−4801.(50) Ai, Y.; Qian, S. Electrokinetic Particle Translocation through aNanopore. Phys. Chem. Chem. Phys. 2011, 13, 4060−4071.(51) Ducker, W. A.; Senden, T. J.; Pashley, R. M. DirectMeasurement of Colloidal Forces using an Atomic Force Microscope.Nature 1991, 353, 239−241.(52) Zhmud, B.; Meurk, A.; Bergstrom, L. Evaluation of SurfaceIonization Parameters from AFM Data. J. Colloid Interface Sci. 1998,207, 332−343.(53) Rutland, M. W.; Senden, T. J. Adsorption of the Poly(oxyethylene) Nonionic Surfactant C12E5 to Silica: a Study UsingAtomic Force Microscopy. Langmuir 1993, 9, 412−418.(54) Hoh, J. H.; Revel, J.-P.; Hansma, P. K. Tip-Sample Interactionsin Atomic Force Microscopy: I. Modulating Adhesion Between SiliconNitride and Glass. Nanotechnology 1991, 2, 119.(55) Ducker, W. A.; Senden, T. J.; Pashley, R. M. Measurement ofForces in Liquids using a Force Microscope. Langmuir 1992, 8, 1831−1836.(56) Weisenhorn, A.; Maivald, P.; Butt, H.-J.; Hansma, P. MeasuringAdhesion, Attraction, and Repulsion Between Surfaces in Liquids withan Atomic-Force Microscope. Phys. Rev. B 1992, 45, 11226.(57) Lin, X. Y.; Creuzet, F.; Arribart, H. Atomic Force Microscopyfor Local Characterization of Surface Acid-Base Properties. J. Phys.Chem. 1993, 97, 7272−7276.(58) Meagher, L. Direct Measurement of Forces Between Silicasurfaces in Aqueous CaCl2 Solutions using an Atomic ForceMicroscope. J. Colloid Interface Sci. 1992, 152, 293−295.(59) Toikka, G.; Hayes, R. A.; Ralston, J. Adhesion of Iron Oxide toSilica Studied by Atomic Force Microscopy. J. Colloid Interface Sci.1996, 180, 329−338.(60) Guegan, R.; Morineau, D.; Alba-Simionesco, C. Interfacialstructure of an H-bonding Liquid Confined into Silica Nanopore withSurface Silanols. Chem. Phys. 2005, 317, 236−244.(61) Yeh, L. H.; Zhang, M. K.; Qian, S. Z. Ion Transport in a pH-Regulated Nanopore. Anal. Chem. 2013, 85, 7527−7534.(62) Yasui, T.; Rahong, S.; Motoyama, K.; Yanagida, T.; Wu, Q.; Kaji,N.; Kanai, M.; Doi, K.; Nagashima, K.; Tokeshi, M.; et al. DNAManipulation and Separation in Sublithographic-Scale NanowireArray. ACS Nano 2013, 7, 3029−3035.(63) Yeh, L.-H.; Xue, S.; Joo, S. W.; Qian, S.; Hsu, J.-P. Field EffectControl of Surface Charge Property and Electroosmotic Flow inNanofluidics. J. Phys. Chem. C 2012, 116, 4209−4216.(64) Barisik, M.; Atalay, S.; Beskok, A.; Qian, S. Size DependentSurface Charge Properties of Silica Nanoparticles. J. Phys.Chem. C2014, 118, 1836−1842.(65) Qiao, W. C.; Yang, K. J.; Thoma, A.; Dekorsy, T. DielectricRelaxation of HCl and NaCl Solutions Investigated by TerahertzTime-Domain Spectroscopy. J. Infrared, Millimeter, Terahertz Waves2012, 33, 1029−1038.(66) Renou, R.; Ding, M.; Zhu, H.; Szymczyk, A.; Malfreyt, P.;Ghoufi, A. Concentration Dependence of the Dielectric Permittivity,Structure and Dynamics of Aqueous NaCl Solutions: ComparisonBetween the Drude Oscillator and Electronic Continuum Models. J.Phys. Chem. B 2014, 118, 3931−3940.
The Journal of Physical Chemistry C Article
dx.doi.org/10.1021/jp5023554 | J. Phys. Chem. C 2014, 118, 10927−1093510934
(67) Taskiran, A.; Schirmeisen, A.; Fuchs, H.; Bracht, H.; Roling, B.Time-domain Electrostatic Force Spectroscopy on NanostructuredLithium-ion Conducting Glass Ceramics: Analysis and Interpretationof Relaxation Times. Phys. Chem. Chem. Phys. 2009, 11, 5499−5505.(68) Andersen, M. B.; Frey, J.; Pennathur, S.; Bruus, H. Surface-dependent Chemical Equilibrium Constants and Capacitances for Bareand 3-cyanopropyldimethylchlorosilane Coated Silica Nanochannels. J.Colloid Interface Sci. 2011, 353, 301−310.(69) Sonnefeld, J.; Lobbus, M.; Vogelsberger, W. Determination ofElectric Double Layer Parameters for Spherical Silica particles UnderApplication of the Triple Layer Model using Surface Charge DensityData and Results of Electrokinetic Sonic Amplitude Measurements.Colloids Surf., A 2001, 195, 215−225.(70) Zhang, M.; Ai, Y.; Sharma, A.; Joo, S. W.; Kim, D. S.; Qian, S.Electrokinetic Particle Translocation Through a Nanopore Containinga Floating Electrode. Electrophoresis 2011, 32 (14), 1864−1874.(71) Jimenez-Angeles, F. Effects of Mixed Discrete Surface Chargeson the Electrical Double Layer. Phys. Rev. E 2012, 86, 021601.(72) Atalay, S.; Ma, Y.; Qian, S. Analytical Model for ChargeProperties of Silica Particles. J. Colloid Interface Sci. 2014, 425, 128−130.
The Journal of Physical Chemistry C Article
dx.doi.org/10.1021/jp5023554 | J. Phys. Chem. C 2014, 118, 10927−1093510935