Positional stability of single double-strand breaks in mammalian cells

Supplemental Data
Donor-Strand Exchange in Chaperone-Assisted
Pilus Assembly Proceeds through a Concerted
β Strand Displacement Mechanism Han Remaut, Rebecca J. Rose, Thomas J. Hannan, Scott J. Hultgren, Sheena E. Radford, Alison E. Ashcroft, and Gabriel Waksman
Supplemental Experimental Procedures
Cloning and protein expression
A DNA fragment containing the safA and safB genes, including their natural
ribosome-binding site and signal peptidase I signal sequence, was PCR-amplified from
genomic Salmonella enterica cv. Typhimurium LT2 DNA using the following primers:
forward primer 5’-GCACCCGGGAGATTTGGTATGGCG-3’ and reverse primer 5’-
CCGCTGCAGCCGCTAAGCCCCTG-3’. The amplified fragment was inserted into the
pTrc99a vector (Pharmacia) in between the restriction sites XmaI and PstI. The constructs
for the N-terminal deletion mutants SafB-SafANtd1 and SafB-SafANtd2 were generated by
PCR-amplifying the pTrc99a-safAB clone using 5’-phosphorylated primers flanking the
region F3-Q9 and F3-Q21, respectively, followed by closure of the amplified plasmid by
blunt ligation. The SafB-SafA(F17A), SafB-SafA(I15A), SafB-SafA(V13A), SafB(A114V)-SafA
and SafB(A114F)-SafA mutants were generated from the pTrc99a-safAB clone using
standard techniques for site-directed mutagenesis. SafB-SafA, SafB-SafA mutants, SafB-
SafANtd1 and SafB-SafANtd2 were expressed in the periplasm of E. coli C600 grown on
Luria-Bertani medium and induced at an OD600 of 0.7 for 3 hours using 1 mM IPTG. The

periplasmic cell extract was loaded onto a SP column after overnight dialysis against 20
mM MES pH 6.0, 10 mM NaCl and 2.5% glycerol. Excess SafB, not in complex with the
subunit, elutes at 100 mM NaCl while the wild-type or mutant SafB-SafA, SafB-SafANtd1
or SafB-SafANtd2 complexes elute at 250 mM NaCl. A further purification step of the
respective protein fractions using a phenyl-Sepharose column at 20 mM MES pH6 and a
1 to 0 M ammonium sulphate gradient yields pure wild-type and mutant SafB-SafA,
SafB-SafANtd1 or SafB-SafANtd2 protein complexes. The SafANtd1 dimer was obtained by
incubating the purified SafB-SafANtd1 complex at room temperature in 20 mM Tris-HCl
pH 8.5 and 100 mM NaCl for 48 hours, and separated from the released SafB by an
additional pass over a phenyl-Sepharose column at pH 6. Seleno-methionine (Se-Met)
labelled SafANtd1 dimer was obtained from SafB-SafANtd1 complex produced in the
methionine auxotroph E. coli B834 DE3 grown on SelenoMet Medium Base with
Nutrient Mix (Athena Enzyme Systems) and 40 µg/ml L-Se-methionine (Sigma, St
Louis, USA).
The SafANtd2-ANte complexes with WT and mutant ANte peptides were produced
by incubating pure SafB-SafANtd2 complex with a 5-fold molar excess of the various ANte
peptides (see sequence and source in main text of Experimental Procedures) at room
temperature for 24 hours. The SafANtd2-ANte complexes were then separated from the
released SafB and any remaining SafB-SafANtd2 complex by passage over a phenyl-
Sepharose column at pH 6.
Crystallization and structure determination

Crystals of the wild-type and seleno-methionine (SeMet) -labelled SafANtd1 dimer
were obtained by sitting drop vapour diffusion against 30% PEG 4000, 100 mM Mes, pH
5.6, 200 mM ammonium acetate at a protein concentration of 2 mg/ml. X-ray diffraction
data for unlabelled and SeMet labelled crystals were measured in house and at the ID14-4
beamline at the European Synchroton Radiation Facility (ESRF, Grenoble, France),
respectively. Two crystal forms were obtained, one in space group P21 and the other in
space group C2, with cell parameters a = 50.3 Å, b = 41.2 Å, c = 59.8 Å, β = 104.1° and a
= 72.2 Å, b = 40.3 Å, c = 50.3 Å, β = 120.4° and 2 and 1 molecule per asymmetric unit,
respectively. The structure was solved on the P21 crystals using experimental phases
obtained from a single anomalous diffraction (SAD) experiment at the Se K-edge
absorption peak (see Table 1, supplementary information for details). Heavy atom sites
and phases were refined with the program SHARP/autoSHARP (de La Fortelle and
Bricogne, 1997). The initial model was build with Arp/Warp (Perrakis et al., 1999) in the
auto-trace mode, and refined against native P21 data at 1.78 Å to a final R- and free R-
factor of 18.4% and 21.7% with the program CNS (Brunger et al., 1998).
Crystals of the SafB-SafANtd2 complex were readily grown from a wide range of
PEG conditions. Crystals used for structure determination were grown from a 4 mg/ml
protein solution in 30% PEG 4000, 100 mM Tris-HCl pH8.5, 200 mM sodium acetate for
Type I crystals and 20% PEG 4000, 200 mM ammonium acetate, 10% PEG 1000 for
Type II crystals. A 2 Å and 1.8 Å dataset for Type I and Type II crystal forms was
collected at the ID23-1 beamline at the ESRF, Grenoble. Type I and II crystals are in the
C2 space group with cell parameters a = 115.3 Å, b = 40.8 Å, c = 65.9 Å, β = 106.8°
(Type I) and a = 114.4 Å, b = 40.6 Å, c = 72.0 Å, β = 95.8° (Type II). The structure of

the SafB-SafANtd2 complex was solved by molecular replacement using Type II crystals
and the SfaE chaperone as a search model (Knight et al., 2002). The resulting molecular
replacement phases from the SfaE model were used in the auto-trace mode of Arp/warp
to build 75 % of the asymmetric unit, including the SafANtd2 subunit. The structure of the
Type I SafB-SafANtd2 was solved by molecular replacement with the Type II complex as
a search model. Type I and II structures were refined to a final R- and free R-factor of
18.1 % and 22.9 %, and 19.0 % and 22.8 %, respectively, with the program Refmac
(CCP4) (CCP4, 1994).
The SafANtd2-ANte complexes with wild-type and mutant Nte peptides were
crystallized in 2 M ammonium sulphate, 100 mM sodium acetate pH 4.6 (WT, F3A,
F17A) or 30% PEG 4000, 100 mM sodium acetate pH 4.6, 200 mM ammonium sulphate
(V13A, I15A) at 1 to 4 mg/ml protein. For the complex with wild-type ANte, a 1.85 Å
dataset was collected at beam line ID23-1 (ESRF, Grenoble). Crystals are in the P6122
space group with cell parameters a = 69.0 Å, b = 69.0 Å, c = 127.3 Å. The structure was
solved by molecular replacement using a single subunit from the SafANtd1 dimer structure
and refined to a final R- and free R-factor of 17.1% and 20.0% using the program Refmac
(CCP4). Crystals for the F17A, I15A, V13A and F3A mutant complexes yielded 2.4 Å,
1.9 Å, 1.8 Å and 2.3 Å datasets, respectively (ID29 and ID23-2 ESRF, Grenoble).
Crystals belong to the P6122 space group with near identical cell parameters compared to
the wild-type SafANtd2-ANte complex. Structures for the mutant complexes were solved by
isomorphous replacement with the wild-type SafANtd2-ANte structure and refined to final
R- and free R-factors of 21.3% and 25.4% (F17A), 18.7% and 21.2% (I15A), 18.3% and

20.9% (V13A) and 23.0% and 26.6% (F3A) respectively (see Table 2 of supplementary
information for data collection and refinement statistics)
All data were collected at 100K from crystals that were cryo-protected by adding
10 to 15% glycerol to the crystallization conditions. Data were processed and scaled
using the programs Denzo and Scalepack (Otwinowski and Minor, 1997), except for data
collected on the SafB-SafANtd2 type I and II, and wild-type and mutant SafANtd2-ANte
crystals which were processed and scaled using MOSFLM and SCALA (CCP4),
respectively.
Parameters, data collection and data analysis of ESI-MS experiments
A capillary voltage of 1.0 kV was applied to the gold-plated borosilicate capillary
in the nano-ESI source, in conjunction with a sampling cone voltage of 50V, in order to
ensure that ions have sufficient energy to enter the mass analyser, but not enough to cause
dissociation. The source temperature was maintained at 30ºC, with N2 as the desolvation
gas. Data acquisition was in positive ion continuum mode over the range m/z 500-7000 at
a scan speed of 3 seconds. All parameters were kept constant throughout this
investigation. An external calibration was applied to the spectra using horse heart
myoglobin (Sigma-Aldrich, Dorset, UK) to ensure a mass accuracy of 0.02%.
Data processing was performed using the MassLynx suite of software supplied
with the Q-Tof I. Spectra across the total ion chromatogram were combined and then
smoothed twice with a Savitzky-Golay algorithm. Background subtraction was next
performed, and finally the peaks were centred by area. Each component was identified by
the presence of at least three consecutive peaks in its charge state distribution and the
molecular mass measured from these m/z values. Changes in charge state distributions
can arise from small variations in ionic strength, pH, protein concentration, desolvation
effects etc. (Guevremont et al., 1992; Verkerk et al., 2003), and the slight changes
observed were not deemed to reflect significant changes of the proteins in solution. The
intensities of all peaks (including salt adducts) for a given species were summed and
expressed as a fraction of the total intensity of all peaks present.
Data for each species were further normalized to allow direct comparison of the
DSE rate for different peptide exchange reactions. For SafB-SafANtd2, data were
normalized between the intensity at zero time (i.e. before ANte peptide was added) and the
baseline intensity once the reaction had reached completion. A similar procedure was
used to normalize the intensities of the reaction products, SafANtd2-ANte and SafB. For
reactions with F17A ANte and F3A ANte, the reaction did not reach completion after 92
hours. Since the maximum intensities of SafB and SafANtd2 as a percentage of the total
ion current for the reactions with all other peptides did reach completion and resulted in a
highly consistent relative ion intensity for the reaction products (69.2% ± 2.5% and
19.1% ± 1.8%, respectively), these values were used as the maxima for the ion intensities
of these peaks for the reaction using the F17A and F3A ANte peptides. For the ternary
complex, SafB-SafANtd2-ANte, data were normalised between the initial intensity (at 2
min) which was arbitrarily assigned a percent intensity of 100% and the baseline intensity
when no ternary complex was present. The same normalization procedure was used for
reactions with the variant SafB-SafANtd2 complexes.
Supplemental References

Brunger, A. T., Adams, P. D., Clore, G. M., DeLano, W. L., Gros, P., Grosse-Kunstleve,
R. W., Jiang, J. S., Kuszewski, J., Nilges, M., Pannu, N. S., et al. (1998). Crystallography
& NMR system: A new software suite for macromolecular structure determination. Acta
Crystallogr D Biol Crystallogr 54 (Pt 5), 905-921.
CCP4 (1994). The CCP4 (Collaborative Computational Project Number 4) suite:
programmes for protein crystallography. Acta Crystallogr D Biol Crystallogr 50, 760-
763.
de La Fortelle, E., and Bricogne, G. (1997). Maximum-likelihood heavy-atom parameter
refinement for multiple isomorphous replacement and multiwavelength anomalous
diffraction methods. Methods in Enzymology 276, 472-494.
DeLano, W. L. (2002). The PyMOL Molecular Graphics System. http://www.pymol.org.
Guevremont, R., Siu, K. W. M., Le Blanc, J. C. Y., and Berman, S. S. (1992). Are the
electrospray mass spectra of proteins related to their aqueous solution chemistry? J
Am Soc Mass Spectrom 3, 216-224.
Hodel, A., Kim, S.-H., and Brünger, A. T. (1992). Model Bias in Crystal Structures. Acta
Crystallogr, Sect A A48, 851-858.
Knight, S. D., Choudhury, D., Hultgren, S., Pinkner, J., Stojanoff, V., and Thompson, A.
(2002). Structure of the S pilus periplasmic chaperone SfaE at 2.2 A resolution. Acta
Crystallogr D Biol Crystallogr 58, 1016-1022.
Kraulis, P. J. (1991). MOLSCRIPT: A Program to Produce Both Detailed and Schematic
Plots of Proteins Structures. Journal of Apllied Crystallography 24, 946-950.
Merritt, E. A., and Bacon, D. J. (1997). Raster3D: photorealistic molecular graphics.
Methods in Enzymology 277, 505-524.

Nicholls, A., Sharp, K.A., and Honig, B. (1991). Protein folding and association: insight
from the interfacial and thermodynamic properties of hydrocarbon. Protein Struct. Funct.
Genet. 11, 281-296.
Otwinowski, Z., and Minor, W. (1997). Processing of X-ray diffraction data collected in
oscillation mode. Methods in Enzymology 276, 307-326.
Perrakis, A., Morris, R., and Lamzin, V. S. (1999). Automated protein model building
combined with iterative structure refinement. Nat Struct Biol 6, 458-463.
Verkerk, U. H., Peschke, M., and Kebarle, P. (2003). Effect of buffer cations and of H3O+
on the charge states of native proteins. Significance to determinations of stability
constants of protein complexes. J Mass Spectrom 38, 618-631.
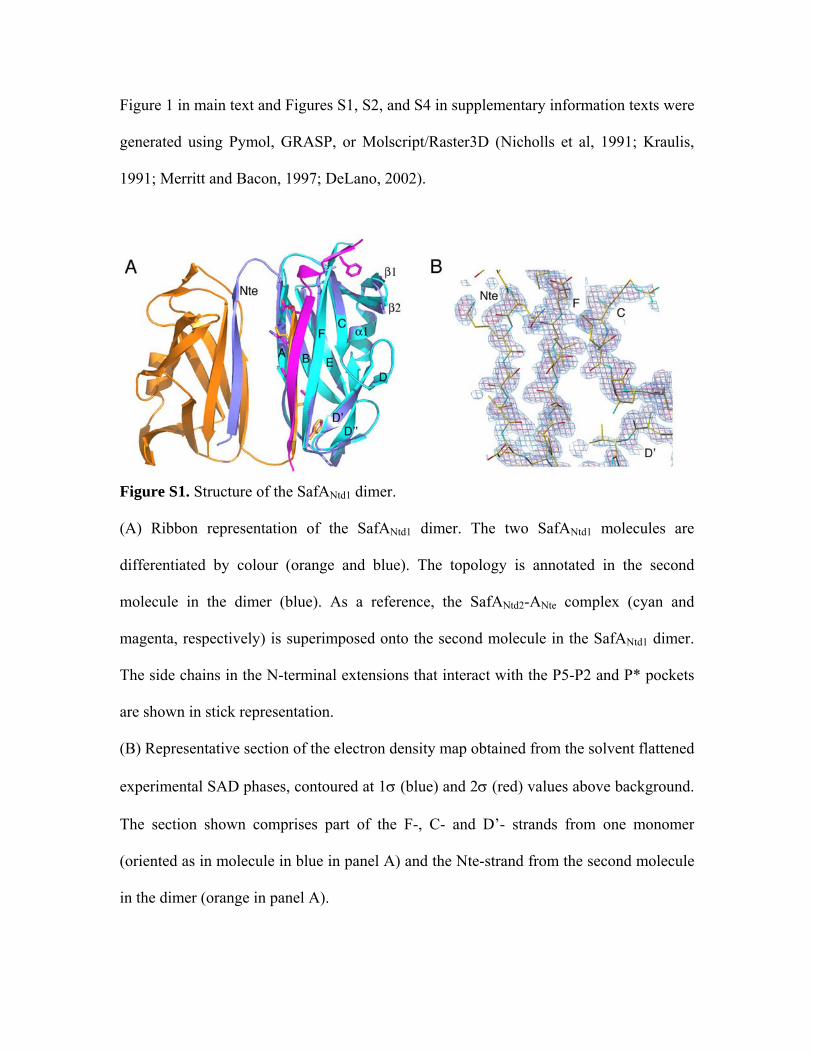
Figure 1 in main text and Figures S1, S2, and S4 in supplementary information texts were
generated using Pymol, GRASP, or Molscript/Raster3D (Nicholls et al, 1991; Kraulis,
1991; Merritt and Bacon, 1997; DeLano, 2002).
Figure S1. Structure of the SafANtd1 dimer.
(A) Ribbon representation of the SafANtd1 dimer. The two SafANtd1 molecules are
differentiated by colour (orange and blue). The topology is annotated in the second
molecule in the dimer (blue). As a reference, the SafANtd2-ANte complex (cyan and
magenta, respectively) is superimposed onto the second molecule in the SafANtd1 dimer.
The side chains in the N-terminal extensions that interact with the P5-P2 and P* pockets
are shown in stick representation.
(B) Representative section of the electron density map obtained from the solvent flattened
experimental SAD phases, contoured at 1σ (blue) and 2σ (red) values above background.
The section shown comprises part of the F-, C- and D’- strands from one monomer
(oriented as in molecule in blue in panel A) and the Nte-strand from the second molecule
in the dimer (orange in panel A).

Figure S2. Structures of the mutant SafANtd2-ANte complexes.
(A-D) Simulated annealing omit maps for the four ANte mutants (F3A (A), V13A (B),
I15A (C) and F17A (D)) bound to SafANtd2, contoured at 2σ (Hodel et al., 1992). The
omitted region include all atoms 5.0 Å around the mutated alanine residue, except for
SafANtd2 bound to the F3A ANte peptide variant where the Nte from residues 1 to 3 is
disordered and the omit map was generated for a region around 5Å of residue 4
(labelled). The refined corresponding model is shown in stick representation.
(E) Superimposition of the Cα traces of the ANte peptide variants bound to SafANtd2. The
wild-type, F17A, I15A, V13A, and F3A ANte peptides are shown in magenta, red, green,
blue, and yellow, respectively. The P*, P3, P4, and P5 residues are shown in stick
representation. For clarity, only the Cα trace of the wild-type SafANtd2 subunit is shown
(magenta). This figure demonstrates that each peptide bound with the same register as
wild-type ANte.

(F) Superimposition of the Cα traces for the SafANtd2 subunit in complex with wild-type
ANte (magenta), F17A ANte (red), I15A ANte (green), V13A ANte (blue) or F3A ANte
(yellow). The peptides have been removed for clarity. Orientation is as in E. This figure
demonstrates that the various DSE products analyzed in this study have very similar
structures.

Figure S3. ESI-MS of in vitro donor-strand exchange with SafBA114V-SafANtd2.
ESI mass spectra showing DSE for SafBA114V-SafANtd2 initiated by the binding of wild-
type ANte peptide. (A) SafBA114V-SafANtd2 complex alone; SafBA114V-SafANtd2 complex
(B) 4 min, (C) 45 min and (D) 24 hours after initiating the reaction by peptide addition.

Four species are observed during the course of the DSE reaction: the substrate
(SafBA114V-SafANtd2) (red), the ternary complex intermediate (SafBA114V-SafANtd2-ANte)
(cyan), and the products (SafBA114V) (ochre) and (SafANtd2-ANte ) (dark blue).
Figure S4. Proximity model of two SafB-SafANtd2 complexes.
Top; superposition of the SafB-SafANtd2 chaperone-subunt complex (yellow and dark
blue, respectively) and the SafANtd-SafANte subunit-peptide complex (slate blue and
magenta, respectively). Bottom; coordinates of a second SafB-SafANtd2 chaperone-
subunit complex (yellow and magenta, respectively) are reoriented such that the N-
terminus of SafANtd2 (residue 20) is brought in normal bonding distance of the C-terminal
residue of the ANte peptide (residue 19) of the top complex, thus virtually reconstituting a
full-length SafA subunit. The juxtaposition shows that an approaching SafB-SafA
complex can come in close enough proximity to start interaction at the P5 position of the
last incorporated chaperone-subunit complex without causing steric clashes. Orientation
is the same as in Figure 7.

Table S1. Data collection and Refinement of the various SafANtd2-ANte complex mutants.
Data Collection Data Set
Radiation
Resol. (Å)
Reflections Total/Unique
I/σ(I)
Completeness (%)
Rmerge
SafANtd2-ANte F17A 0.873, ID23-2 20-2.4 77814 / 13802 13.6 (3.2) 99.8 (100.0) 10.1 (52.6) SafANtd2-ANte I15A 0.976, ID29 20-1.8 111372 / 31544 9.7 (5.1) 99.2 (99.9) 12.0 (17.9) SafANtd2-ANte V13A 0.976, ID29 20-1.6 161923 / 45514 7.4 (3.2) 99.4 (100.0) 16.2 (26.1) SafANtd2-ANte F3A 0.873, ID23-2 20-2.3 82391 / 15190 11.5 (2.8) 98.4 (99.3) 12.1 (47.9) Refinement
Data Set F17A I15A V13A F3A
Resolution (Å) 20.0 – 2.4 20.0 – 1.9 20.0 – 1.8 20.0 – 2.3
Number of reflections total 7321 13903 16493 7983 work set 6946 13169 15626 7567 test set 375 734 867 416
Rwork (%) 21.3 18.7 18.3 23.0 Rfree (%) 25.4 21.2 20.9 26.6 Numbers of atoms
Protein 1054 1082 1114 1021 Solvent 18 99 120 19
Wilson B-factor (Å2) 45.1 17.3 16.1 43.1 Average B-factor (Å2)
main chain 30.1 14.6 12.4 30.9 side chain 30.8 16.3 13.9 32.4 Solvent 27.5 23.7 22.4 26.9
Rmsd stereochemistry bonds (Å) 0.013 0.009 0.009 0.013 angles (Å) 1.339 1.220 1.116 1.386
Rmsd B-factor (Å2) main chain 0.5 0.5 0.4 0.6 side chain 1.4 1.3 1.2 1.3 Values for high-resolution shell in parenthesis. Rmerge = ∑|I - <I>| / ∑I, where I = observed intensity and <I> = average intensity of multiple observations of symmetry-related reflections. Rwork = ∑|Fo - Fc| / ∑Fo, where Fo and Fc are the observed and calculated structure factors respectively. Rmsd stereochemistry is the deviation from ideal values, Rmsd B-factors is the deviation between bonded atoms.
Copyright © 2022 FDOKUMEN