A Cellular Potts model simulating cell migration on and in matrix environments
Upload
independentCategory
view
1download
0
Stochastic Simulation of Benign AvascularTumour growth using the Potts Model.Emma L. Stott1, Nick F. BrittonDepartment of Mathematical Sciences, University of Bath, Claverton Down, Bath.BA2 7AY. England.James A. Glazier, Mark ZajacDepartment of Physics, University of Notre Dame, Notre Dame, IN 46556. U.S.A.AbstractWe simulate the growth of a benign avascular tumour embedded in normal tissue,including cell sorting that occurs between tumour and normal cells, due to thevariation of adhesion between di�erent cell types.The simulation uses the Potts Model, an energy minimisation method. Trialrandom movements of cell walls are checked to see if they reduce the adhesion energyof the tissue. These trials are then accepted with Boltzmann weighted probability.The simulated tumour initially grows exponentially, then forms three concentricshells as the nutrient level supplied to the core by di�usion decreases: the outershell consists of live proliferating cells, the middle of quiescent cells and the centreis a necrotic core, where the nutrient concentration is below the critical level thatsustains life. The growth rate of the tumour decreases at the onset of shell formationin agreement with experimental observation. The tumour eventually approaches asteady state, where the increase in volume due to the growth of the proliferatingcells equals the loss of volume due to the disintegration of cells in the necrotic core.The �nal thickness of the shells also agrees with experiment.Keywords: Simulation of avascular tumour growth - Potts model - Di�erentialadhesion - Proliferation.1To whom correspondence should be directed. e-mail: [email protected]

1 Introduction1.1 Tumour GrowthA tumour is an abnormal mass of tissue, whose growth rate exceeds and is uncoor-dinated with that of surrounding normal tissues [1].Tumours usually start as a mild disorder of cell behaviour that may developslowly into a full blown cancer. The progression from the earliest induction eventto the clinically recognisable tumour can take many years and the formation of atumour is the exception, not the rule for transformed cells. Part of the reason forthis long period is that the cells have to undergo a number of changes before theybecome hyperplastic and then truly cancerous [2]. Cancer cells require a particulardevelopmental pathway. One of these requirements is to become immortal andacquire the ability to undergo almost unlimited divisions [3]. To do so the cell mustignore extracellular signals to halt cell division (both chemical and contact) and mustalso avoid the natural limit to the number of cell divisions caused by the exhaustionof telomeres [4, 5]. Normal cells have a very limited capacity for replication. Forexample, normal cells on a petri dish form a monolayer, growing until they reach theedges con uently, and then stop, whereas cancer cells carry on proliferating, lyingacross each other in a haphazard arrangement, no longer in a monolayer [1].Apoptosis is an evolutionarily conserved, innate process by which cells destroythemselves by systematically inactivating, disassembling, and degrading their ownstructural and functional components [6]. In normal tissue, apoptosis deletes unnec-essary, damaged and potentially harmful cells to ensure structural and functionalhomeostasis. Apoptosis occurs in nearly every cell type throughout developmentand maturation. Cancer cells appear to have defects in the regulation of genes(e.g. P53) that control apoptosis. These defects render the tumour cells resistant tothe induction of apoptosis by a wide variety of stimuli, including chemotherapeuticdrugs and radiotherapy [6] and also add to the cells' apparent immortality.Tumours can be divided into two classes, benign or malignant, depending on theirmethod of growth. Benign tumours grow by expansion, compressing or displacingsurrounding normal tissue, while malignant tumours grow by local in�ltration, de-stroying the tissue which they invade. Benign tumours grow at their site of originonly, but malignant tumours may spread to distant sites, with cells detaching fromthe primary tumour and migrating to remote sites via the blood stream, in thelymph nodes or across connective tissue. This process is known as metastasis andthe secondary tumours formed are metastases. The majority of deaths from cancerare due to the formation of metastases at sites remote from the primary tumour.Benign tumours may cause disease by compression of adjacent structures, or incertain circumstances by secretion of hormones. In contrast, malignant tumoursalways have the potential to cause death as a result of their aggressive growth andinvasiveness.The growth of solid tumours in animals always involves some vascularization,but the direct di�usion of nutrients and waste from and to surrounding tissue reg-ulates the earliest stages of tumour development [7]. Experiments on the growth2

of nodular carcinomas in vitro [8, 9, 10], or isolated tumours in vivo [11, 12], showthat the growth of a solid malignancy by di�usion alone leads asymptotically to adormant but viable steady state. In this dormant state, the volume increase due tocell proliferation balances cell death and volume loss in the necrotic core. In oursimpli�ed model, we assume that the availability of a single, slow-di�using nutrientis the primary limit on tumour growth, and that other nutrients and the di�usionof waste are su�ciently rapid that they do not limit the growth rate.When the tumour is tiny, every cell receives su�cient nutrient by di�usion andthe growth rate of the population is exponential [13]. The consumption of nutrientby the cells means that the concentration of nutrient decreases towards the centreof the tumour, as it is only supplied to the periphery.As the tumour grows, supplying the nutrient to the central core by di�usionbecomes more and more di�cult, so that the core nutrient concentration diminishes.Eventually, the concentration falls below the critical level at which cells becomequiescent; alive, but no longer proliferating. If the nutrient level near these cellsincreases above the critical level, they reenter the proliferation cycle [14]. Manystudies show that microenvironmental factors, such as O2 and nutrient supply, aswell as accumulation of metabolic wastes, greatly in uence cell metabolism [15].When quiescent cells appear, the growth of the tumour slows down to become linear[16, 17], because part of the tumour volume is no longer involved in the productionof new cells.The tumour then grows until it reaches another critical size, where the nutrientconcentration at the centre is not high enough to sustain life. At this stage, anecrotic core forms. This core contains cells in varying stages of disintegration.Dead cells break down into chemical compounds which are freely permeable throughcell membranes. The mass or cell volume lost this way is replaced by cells pushedinward by the forces of adhesion and surface tension in the tumour. Some cells, newlygenerated on the surface of the tumour, gradually migrate toward the core [18]. Cellscan also migrate outward by di�usion due to membrane uctuations. The growthrate decreases rapidly when the necrotic core forms because it becomes increasinglydi�cult to obtain nourishment and dispose of waste solely by di�usion. As thetumour continues to grow and develop, the outer shell of dividing cells becomesroughly constant in size - about 1-3 cells thick .Eventually, the necrotic disintegration, accumulation of mitotic wastes [19] andmitotic inhibitory factors [20] reduce the rate of growth so much that the overallvolume of the tumour remains constant [9, 13, 21]. Although the tumour volumeis in equilibrium, the cells in the outer shell still proliferate. But, the volume lostthrough necrotic disintegration cancels the volume produced by mitosis.The typical steady state con�guration of an avascular tumour is a sphere, a fewmillimetres in diameter, which histological examination shows to consist of threedistinct concentric annular shells [13, 22, 23]. In the thin, outermost shell, the cellsgrow and divide as they do in the exponential phase. In the adjoining shell, typicallythree times as thick as the proliferating layer, the quiescent cells exhibit little or noproliferation. The innermost core consists of necrotic debris [18]. The tumour mayremain in this dormant state for months or even years [24].3

1.2 Cell SortingIn a number of cell sorting experiments [25] -, cells migrate over distances muchgreater than one cell diameter in order to restore disrupted patterns or form newones. The natural con�guration of mesoderm, endoderm and ectoderm from amphib-ian embryos can be recovered from excised tissues combined in the right proportions[35]. When mixed together in suspension, chicken embryo neural and pigmentedretinal cells precipitate to produce a disordered aggregate. The initially irregularaggregate rounds over time. Pigmented cells coalesce at the centre to form a spherewhile neural cells organise to form an encompassing outer layer. Signi�cantly, theoutcome of sorting experiments is largely independent of the initial conditions [36].An aggregate of neural cells rounds in isolation but spreads to engulf a pigmentedcell aggregate if the two are placed in contact. Similarly, an intact fragment ofchicken heart ventricle will envelope a chicken cartilage fragment. The coelenterateanimal Hydra vulgaris [37, 38, 39] is basically a hollow cylinder with an extracellularmatrix sandwiched between layers of endodermal and ectodermal cells. When dis-mantled at the cellular level, hydra can recover their original state and when turnedin-side-out they are able to re-invert themselves. Mombach et al. [40, 41] showedthat there was no long range interaction in their chick embryo experiments. Theseand other observations, suggest that an underlying mechanism for local cell sort-ing based on intrinsic cell properties rather than chemical gradients or the startinglocations of cells in a tissue.1.3 Di�erential AdhesionSteinberg proposed the Di�erential Adhesion Hypothesis [25, 26, 27, 42] to explaincell sorting as a minimisation of contact energy at cell interfaces. Experiments[35, 43, 44] show that the strength of attachment between two cells which come intocontact depends on the type of cells involved. The di�erence in adhesion energyresults from the number and particular type of surface adhesion molecules presenton the cell membrane. Classes of adhesion molecules include cadherins, N-CAM andmany other varieties, some non-speci�cally adhesive, others, like N-CAM, extremelyvariable in sequence (and hence relative adhesivity) between cell types. Movement ofa cell requires work against the adhesive forces of its neighbours under the constrainton cell volume imposed by membrane elasticity. Thus, a�nity between neighbouringcells determines the energy of a cell aggregate. Interfaces between cells which havethe potential to form stronger attachments with more amenable coupling partnersstore more energy. Cytoskeletal membrane uctuations allow the cells in an aggre-gate to explore an abstract energy landscape randomly yet exhaustively. The localenergy gradient directs cell movement, leading to a con�guration with minimumenergy. As jostling causes adhesion molecules to unbind and re-bind, strong bondstend to replace weak bonds, making best use of the available binding surface andthereby maximising the work required to remove a cell from an aggregate. Di�eren-tial adhesion plays an important role in cell recognition [29], gastrulation [45, 46],cell shaping [47], control of pattern formation [48] as well as cancer metastasis [49].4
2 Computer Simulations2.1 Overview and HistoryA cellular automaton simulation represents cells as one or more discrete units withrules to describe their interactions, emphasising supercellular processes. Continuummodels are an alternative to solving the many body problem represented by cellu-lar patterns. Emphasising spatial and temporal variation of �elds, these methodsdescribe cellular patterns in terms of density functions which satisfy second ordernonlinear di�erential equations for di�usion and wave propagation. They stressthe interaction of each cell with the global environment, but cannot easily identifyindividual cells.Models in which the degrees of freedom reside on a lattice and interact locallyarise in several areas of condensed matter physics and �eld theory. The simplest ofthese is the Ising model, which can be taken as a crude description of a magneticmaterial [50]. The Ising model is a two spin version of the Potts Model.For example, using the magnetic language, the Ising model consists of a set ofspin degrees of freedom interacting with each other and with an external magnetic�eld. In a biological cell simulation, using Ising or Potts models, the spins correspondto individual cells, with the spin number being the unique index number of the cell.The large-Q Potts model (Q is the unique number of spins and cells) can be ex-tended to combine discrete and continuummethods, describing multiple interactionsbetween cells at multiple length scales. The Potts model was originally developedto simulate surface energy driven di�usion in non-biological patterns like the in-crease in mean grain size during annealing of polycrystalline aggregates [51, 52]. Itaccurately simulates the time evolution of experiments in metals and liquid foams[53, 54]. It can also simulate biological phenomena like the development of the slimemold, Dictyostelium discoideum [55], and growth of tissue [56, 57, 58].The basic Potts model simulates a pure material with a single surface energy.Mismatched bonds between di�erent cells (spins) have energy 1 and bonds betweenlike spins have energy 0. The Hamiltonian is:HPotts = Xneighbours(i;j) (i0;j0) (1� ��(i;j)�(i0 ;j0));where the neighbours, (i; j) and (i0; j 0), may be of any desired range on either asquare or hexagonal lattice. ���0 is the Kr�onicker �. At each step, a site is selectedat random and its spin is changed from � to �0 with Boltzmann probability, for atemperature T > 0,P (�(i; j)! �(i0; j 0)) = � exp(�4H=T ) if 4H > 01 if 4H � 0;where 4H is the energy gain/loss produced by the change. These dynamics allowcells to move slowly, by gradual adjustment of their boundary position. One MonteCarlo Step (MCS) is de�ned to be as many trials as the number of lattice sites.5

2.2 The Extended Potts ModelThe Extended Potts Model [59, 60, 61] uses a three-dimensional lattice with as manyas 2003 elements partitioned into cells. Clustered array elements sharing a commonvalue delineate regions belonging to di�erent unique cells. A second label, shared byall domains of the same type, distinguishes cells from di�erent tissues. Cells havea type dependent volume constraint which models membrane elasticity so that nosingle cell can grow or shrink without bound. The array can include a border ofneighbouring sites assigned to a domain of unlimited volume. This large domainrepresents a medium in which the cells exist. A homogeneous slab of sites insertedat the base of the array can represent a substrate. With domains su�ciently large,cells and tissues are free to deform almost arbitrarily as the array evolves.The patterns formed by cells and tissues correspond to an abstract stored energy.Contributions to the energy include a sum over the coupling between neighbouringarray elements together with a sum over contributions from the membrane elasticityof each cell:H = Xneighbours(i;j;k) (i0;j0 ;k0)J [� (�(i;j;k)); � (�(i0;j0;k0))](1� ��(i;j;k)�(i0 ;j0;k0))+ Xall domains�[�(�)]6=0 �[� (�)](v(�)� V )2 ,where H is the total energy (the Hamiltonian), while domain � of type � includes�(i;j;k) as a constituent array element. Coupling strengths are de�ned for every pos-sible pair of domain types. The coupling matrix elements J [�; � 0] give the energystored in a bond between a site and a neighbour. The sum over the whole latticeexcludes neighbours within the same domain so that stored energy is localised atboundaries. For each cell, the volume under stress v(�) may di�er from the targetvolume V for undeformed cells. The sum over domains excludes domains of uncon-strained volume for which the elasticity �� is zero. Cell elasticity imposes a globalconstraint on cell volume while cell couplings determine the work required to causelocal membrane deformations.The organisation of cells and tissues develops in a probabilistic manner underMonte Carlo dynamics. An array element is chosen at random and provisionally re-assigned to a neighbouring domain. A change in energy results since a modi�ed sitecouples di�erently with its neighbours and volume transfers between domains. Thechance of accepting reassignments is the same Boltzmann factor as in the standardPotts Model. The parameter T controls the amplitude of cell membrane uctuations.The possibility of accepting small energy gains allows cells to escape from locallystable con�gurations to �nd the con�guration of absolute minimum energy. Exper-iments and simulations [62, 63] have shown that epithelial cells in tissues exhibitapproximately Brownian motion and a roughly Maxwellian distribution of velocitiesconsistent with statistical mechanical dynamics. Under repeated application of this6
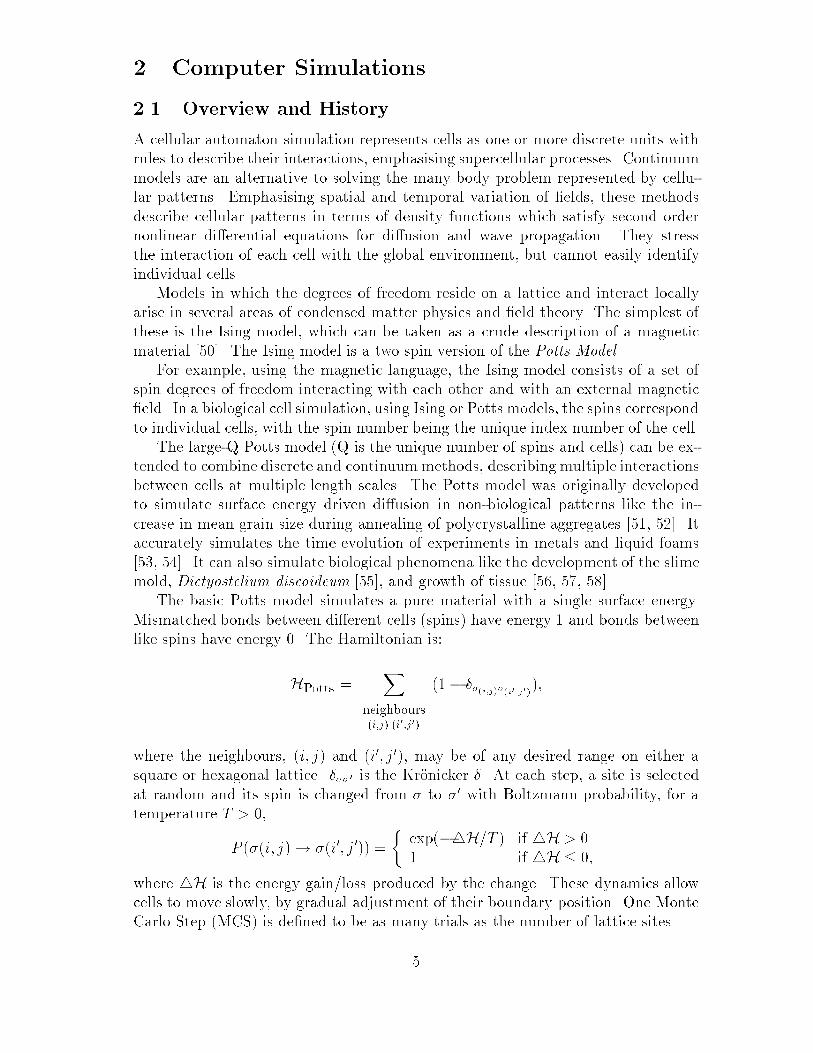
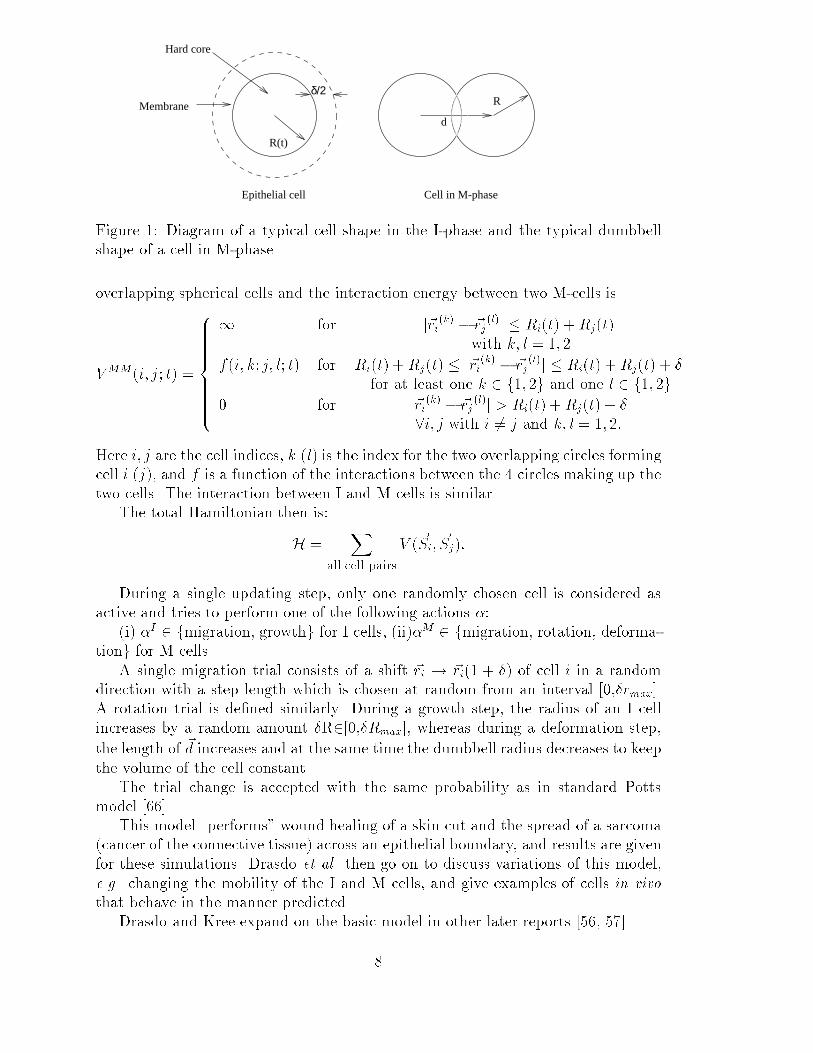
algorithm, membrane curvature evolves realistically in response to gradual di�usionof domain boundaries within the array.This model, with area constraints and di�erential adhesivity, can simulate exper-imental biological cell sorting quantitatively. Sorting shows a crossover between arapid boundary-driven stage and a slower boundary-independent stage as observedin experiments using pigmented and neural epithelial cells from the eyes of sevenday chick embryos [64, 65]. The rapid stage leads to a uniform light-cell{mediumsurface layer and partial bulk cell sorting and the slow stage leads to complete cellsorting. The simulation also reproduces other biological phenomena like chequer-board cell patterns, clumping, engulfment, partial sorting, cell dispersal and vacancynucleation [59, 60, 61, 64, 65].2.3 Other Applications of the Monte Carlo Approach totissue-cell populationsDrasdo et al. [56, 57, 58] described the stochastic dynamics of tissues of cells withemphasis on epithelial cells and �broblasts and �brocytes of the connective tissue.They investigated pattern formation and growth characteristics of such cell popu-lations in culture numerically, using two dimensional Monte Carlo simulations forquasi-two-dimensional aggregates of cells.Their models employ a simpli�ed coarse grained description of cells, which takesinto account the cell shapes only in a statistical sense. Each cell has a centre locationand an attached region in space which contains the cell volume and de�nes the cellshape.They distinguish two cell classes, inter-phase and mitotic. During the inter-phase, the cell grows steadily until it has doubled its mass, its organelles and DNAcontent. Then it enters mitosis where it deforms until it completes cell division,whereupon the daughter cells enter the inter-phase. Cells may also migrate androtate.The state ~Si of a cell i is described by its position, its age class, and its shape.The cell position is given by the vector ~ri of its centre of mass. For an I cell (cell inthe inter-phase), the shape is characterised by its radius Ri, whereas for an M cell(cell undergoing mitosis), it is the vector ~di, joining the centres of the correspondingdumbbell which �xes its shape.Cells interact via a short range potential, V . For a pair of cells i and j in theinter-phaseV II(i; j; t) = 8<: 1 for j~ri � ~rjj � Ri(t) +Rj(t)�� for Ri(t) +Rj(t) � j~ri � ~rj j � Ri(t) +Rj(t) + �0 otherwise.During all cell interactions an M-cell is treated like a composite of two, partially7
R
d
R(t)
Hard core
δ/2Membrane
Cell in M-phase Epithelial cellFigure 1: Diagram of a typical cell shape in the I-phase and the typical dumbbellshape of a cell in M-phase.overlapping spherical cells and the interaction energy between two M-cells isV MM(i; j; t) = 8>>>>>><>>>>>>: 1 for j~ri(k) � ~rj(l)j � Ri(t) +Rj(t)with k; l = 1; 2f(i; k; j; l; t) for Ri(t) +Rj(t) � j~ri(k) � ~rj(l)j � Ri(t) +Rj(t) + �for at least one k 2 f1; 2g and one l 2 f1; 2g0 for j~ri(k) � ~rj (l)j > Ri(t) +Rj(t) + �8i; j with i 6= j and k; l = 1; 2:Here i; j are the cell indices, k (l) is the index for the two overlapping circles formingcell i (j), and f is a function of the interactions between the 4 circles making up thetwo cells. The interaction between I and M cells is similar.The total Hamiltonian then is:H = Xall cell pairsV (~Si; ~Sj):During a single updating step, only one randomly chosen cell is considered asactive and tries to perform one of the following actions �:(i) �I 2 fmigration, growthg for I cells, (ii)�M 2 fmigration, rotation, deforma-tiong for M cells.A single migration trial consists of a shift ~ri ! ~ri(1 + �) of cell i in a randomdirection with a step length which is chosen at random from an interval [0,�rmax].A rotation trial is de�ned similarly. During a growth step, the radius of an I cellincreases by a random amount �R2[0,�Rmax], whereas during a deformation step,the length of ~d increases and at the same time the dumbbell radius decreases to keepthe volume of the cell constant.The trial change is accepted with the same probability as in standard Pottsmodel [66].This model \performs" wound healing of a skin cut and the spread of a sarcoma(cancer of the connective tissue) across an epithelial boundary, and results are givenfor these simulations. Drasdo et al. then go on to discuss variations of this model,e.g. changing the mobility of the I and M cells, and give examples of cells in vivothat behave in the manner predicted.Drasdo and Kree expand on the basic model in other later reports [56, 57].8

3 Mathematical Model of Avascular Tumour GrowthWe now model a three dimensional avascular tumour using an extension of the Pottsmodel used by Glazier et al. [59, 60, 61, 64, 65].3.1 The ModelTumour simulations based on the Extended Potts model include cells which growand divide, cells which shrink and decay and cells which maintain relatively con-stant volume. We consider necrotic, quiescent and proliferating tumour cells asdistinct cell types, in addition to healthy cells, with di�erent growth rates andvolume constraints for each type. Target volumes for healthy and quiescent cellsremain constant in time. Target volumes increase for proliferating cells, to simulategrowth and decrease for necrotic cells to simulate decay. The volume constraintsfor proliferating, quiescent and necrotic cells are successively weaker. Accordingly,proliferating cells can grow at the expense of quiescent cells which, in turn, recouptheir losses from decaying necrotic cells.Normal cells have the strongest adhesive bonds with normal cells and tumour-tumour bonds are the weakest, with tumour-normal bonds in between. The resultingsurface tension keeps the tumour compact. This hierarchy of binding strengthsis consistent with biological evidence, as tumour cells adhere to themselves lessstrongly than their counterpart normal cells [1, 67]. Although growth and decay ratesdi�er for proliferating, necrotic and quiescent cells, all tumour cells have the samebinding properties. Tumour cells express fewer adhesion molecules than normal cells,especially N-CAMs and E-cadherins [67, 68, 69]. In fully transformed cancer cells theexpression of cell adhesion molecules is often completely absent [70]. The progressivefailure of adhesion during transformation results in rounding of individual cells andloosening of cell-cell bonds in tumours. The intermediate value for normal-tumourcell binding is consistent with the assumption that normal and tumour cells wereoriginally of the same type and hence express the same adhesion molecules, onlyin di�erent quantity. In this case the heterotypic adhesion is expected to be thegeometric mean between the homotypic adhesivities.Proliferating tumour cells grow in response to the demands of an increasing targetvolume with mitosis occurring whenever the ratio of surface area to volume for acell drops below a threshold. This criterion for cell division re ects the fact that cellvolume determines the demand for nutrients while cell surface area limits the rateof nutrient absorption. Since tumour cells grow and divide continuously withoutobserving regulatory signals, the simplest assumption is that their growth rate isdirectly proportional to the supply of nutrients up to some saturating rate. Mombachet al. [40, 41] investigated mitosis in plants and showed that this assumption gavegood quantitative agreement with experimentally observed cell distributions in plantepithelia. The cell splits in a plane through the centre of mass corresponding to aminimal cross section with all the array elements on one side of the cell assigned apreviously unused index. After a split, each daughter cell starts with half the targetvolume of the parent cell so as not to be unduly stressed by a large deviation from9

the mandated size of the progenitor. Since, experimentally, mean tumour cell sizeis comparable to mean normal cell size, we apply mitosis at twice the typical cellsize, which corresponds to a area/volume ratio of 0.6.We do not include the growth of normal cells, since cell division in normal tissuedoes not a�ect the tissue volume. Inhibition of cell division in normal tissue keepsthe rate of cell division in homeostasis with the rate of cell death. The much slowermitosis of normal cells should not a�ect the tumour's growth, but can be includedin future simulations.Cells change type in response to a nutrient gradient within the tumour. Weassume that the normal tissue is a homogeneous source of nutrient. The concentra-tion of nutrient within the tumour is measured as a function of the distance of thecentre of mass of a particular cell from the periphery of the tumour and the totalvolume of live (and hence nutrient consuming) cells within the tumour. The volumeof proliferating cells in the tumour remains roughly constant throughout growth [18]so we require that:volume of proliferating cells = 43�(R3 �R3q) = A (constant) ;where R is the average tumour radius and Rq is the average outer radius of thequiescent shell. A can be calculated from data on spherical tumours grown in vitro[21]. The distance of the �rst quiescent cell from the edge of the tumour is R�Rq,so we choose the critical distance to be Dq, where:Dq = R �Rq = integer part of � 34� A(R2 +R2q)� :The distance of the �rst dead cell from the peripheryDd = 4Dq. This approximationis close to the true, di�usion-determined concentration but is much simpler andcomputationally faster to implement.In addition to type changes caused by shifting boundaries between regions withinthe tumour, individual cells can change type by relocating, as long as they are alive.Since cells are free to move by gradually shifting their boundaries at random, theyoccasionally migrate to an adjacent region of the tumour. When this migration hap-pens, proliferating and quiescent cells change type according to nutrient availability.Though necrotic cells may undergo passive relocation, they are no longer viable andnever revert to quiescence or proliferation.The growth rate of proliferating cells also depends on nutrient concentration.The growth rate of the cells is:growth rate = 8<: 0 if 0 � N � Nq;12(1 � NNq )2 if Nq � N � 3Nq;2 otherwise;where Nq is the critical value of nutrient, below which cells are unable to divide, andis proportional to R � Rq, while N , the level of nutrient, is proportional to R � d,where d is the depth of a cell within the tumour. The depth of a cell is the minimum10

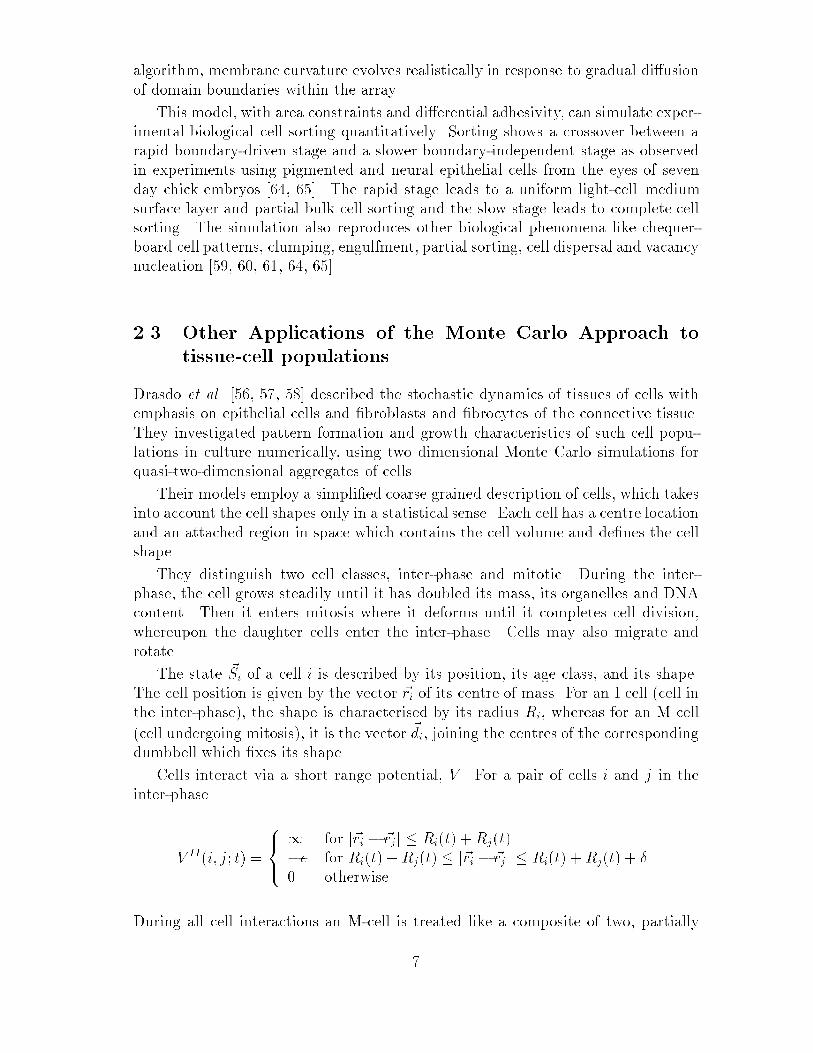
distance from the centre of mass of the cell to the outer edge of the tumour alongeach of the three orientations of the array (i.e. in the x; y and z directions). Theincrease in volume of the tumour cells is the integer part of the growth rate. Thisfunction for growth rate is the simplest continuously di�erentiable function that hasa value of 0 at the outer edge of the quiescent core and 2 at the tumour's edge.The simulated decay of necrotic cells by reduction of target volume also dependsupon depth within the tumour. We assume that cells nearer the centre of thetumour will have been dead longer than those near quiescent cells and therefore willbe more likely to have broken down into di�usible compounds and hence will losevolume more readily than those that have just died. So we take the rate of reductionof volume to be proportional to the individual cell's distance from the edge of thenecrotic core, up to some saturating rate. Necrotic cells in the outer layer of the coremaintain constant volume while cells in the fourth layer from the edge and beyondlose two units of volume at each time step with a linear increase in the decay ratefor intervening layers.Modi�cations to the Extended Potts model for the purpose of modelling tumourscan be summarised by considering changes to the functional dependence of targetvolumes, cell elasticities and cell types. Cell types and elasticities become a functionof nutrient concentration, which varies spatially within the tumour:� �! � [N ] ,�[� ] �! �[�;N ] ,where � is cell type, �[� ] the membrane elasticity and N is the nutrient concen-tration. Through dependence on cell type, elasticities have an implicit dependenceon nutrient concentration, in addition to an explicit dependence. Also, elasticitieshave an implicit dependence on position through the spatial variation in nutrientconcentration within the aggregate. The target volumes become functions of time:V �! V [�; �; t] ,dVdt > 0 if proliferating;dVdt = 0 if normal, quiescent,dVdt < 0 if necrotic,where V [� ] is the target volume, which depends on cell type as before, but nowvaries for each cell � since proliferating cells may be at di�erent stages of the mitoticcycle. Despite these modi�cations, cell con�gurations are still characterised in termsof stored energy with the usual Monte Carlo dynamics driving rearrangement.Figure (2) shows a ow diagram of the computer algorithm.The model of Drasdo et al. di�er in important respects from the Extended PottsModel. Working in two dimensions, Drasdo and his colleagues describe cells asoverlapping circles with short range attraction and hard core repulsion. They employexplicit rules for cell translation and rotation with position and orientation changingin discreet steps. Cell growth and division are handled separately. Binding dependson the proximity of neighbouring cell centres rather than the degree of contact11

Define all variables
Read in information
Read in couplingstrength file
Set up exponentialtable
Read in neighbour offsets
Read in initial scene
Measure volumesof cells
Initialize targetvolumes
Calculate cell surface areas
Calculate centres of mass ofcells and tumour. Calculate tumour volume.
Nutrient calculations
Split large cancer cells
Increase TV’s of cancer cells
Decrease TV’s of dead cells.
Write out data files
Pick a site at random.
Pick one of its neighbours atrandom
Swap colour of site to that of
its neighbour. Measure ∆E
and accept trial depending oncertain conditions
If trial accepted, update lattice
the two cellsUpdate volumes and SA’s of
Main Loop
Cell so rting loop
Figure 2: Simple ow diagram of computer algorithm.12

between attached membranes. Contrastingly, the lattice of the Extended PottsModel allows cells in three dimensions with almost arbitrary shape. Energy is storedat the boundaries between cells in order to model the binding potential of surfaceadhesion molecules more directly. Cells translate and rotate in response to gradualboundary adjustment driven by membrane uctuations without any additional rules.The Extended Potts Model treats cell growth and division as one continuous processgoverned by nutrient availability.4 Simulation of a Multicell Spheroidal AvascularSolid TumourWe start o� with a small homogeneous aggregate of tumour cells, embedded innormal tissue. All cells are initially set to be cubes, to avoid packing problems, butthe dynamics of the model allows them to round quickly to a more natural shape.The homogeneous source of nutrient models a multi-cell, spheroidal, avasculartumour. To keep the pictures simple, we show a cross section in the X-Y plane,which slices the tumour in two. Figure (3) shows only tumour cells individually andrepresents all the normal cells by a block of colour. Figure (4) shows only individualnormal cells, and represents the tumour as a solid block of colour in the centre ofthe picture.Figure (5) shows the tumour at a later time, when the surface tension has roundedboth the cells and tumour.As the tumour grows, the distance of the cells at the centre of the tumour fromthe periphery becomes large enough that su�cient nutrient can no longer di�use tothem. Inadequately supplied cells become quiescent. Figure (6) and Figure (7) showthe tumour with a quiescent core. Again, the picture shows cross sections throughthe tumour.Later, the tumour becomes so big that the distance from the edge of the aggregateto the cells at the centre is too large for enough nutrient to di�use to them and theydie. A necrotic core then forms within the quiescent shell. Figure (8) shows theproliferating cells and the position of the cells that have died. Figure (9) shows thenormal and quiescent cells, with a solid block of colour in the centre to representthe necrotic core, and a ring of colour for the proliferating cells.We measure the volume and the average radius of the tumour as it grows. Fig-ure (10) shows the tumour volume versus simulation time (MCS=Monte Carlo TimeSteps). Initially, the growth is exponential, then at around 700MCS, when quies-cent cells �rst appear, the growth slows to linear. At 8600MCS, when the necroticcore forms, the growth slows again and eventually ends as the tumour reaches itsdi�usion limited steady state. This growth is consistent with the experimental ev-idence. Figure (11) shows the average tumour radius versus simulation time. Thewidth of the shell of quiescent cells is roughly three times the width of the shell ofproliferating cells, which is in good agreement with histological data [18]. We canchange this relative thickness by varying the ratio Dq=Dd. The top picture in Figure(12) shows the growth of the outer radius of the tumour and the bottom shows the13

20 40 60 80 100 120 140
20
40
60
80
100
120
140
Figure 3: Cross section of the initial con�guration, showing cancer cells only.14

20 40 60 80 100 120 140
20
40
60
80
100
120
140
Figure 4: Cross section of the initial con�guration, showing normal cells only.15

0 50 100 1500
50
100
150Time: 300MCS, X−Y tumour and dead cells.
Figure 5: Cross section of rounded con�guration, showing proliferating tumour cellsonly.16

0 50 100 1500
50
100
150Time: 4000MCS, X−Y tumour and dead cells.
Figure 6: Cross section of tumour, showing proliferating tumour cells only.17

0 50 100 1500
50
100
150Time: 4000MCS, X−Y: normal and quiescent cells .
Figure 7: Cross section of tumour, showing normal cells and quiescent tumour cellsonly.18

0 50 100 1500
50
100
150X−Y cross−section. Time: 25000MCS
Figure 8: Cross section of tumour, showing proliferating tumour and necrotic cellsonly.19

0 50 100 1500
50
100
150X−Y cross−section. Time: 25000MCS.
Figure 9: Cross section of tumour, showing normal and quiescent cells only.20

graph obtained by Folkman and Hochberg in their experiments on the growth ofmulticellular spheroids [21].5 DiscussionThe Potts Model has proven useful in simulating cell movement. It includes featuresoften neglected in the simplest models of tumour growth, such as cell-cell adhesion.However, we have made many simpli�cations. Our model of the adhesive propertiesof cells was as simple as possible. We concentrated on the essential features of thegrowth of a solid avascular tumour in vivo. We assumed that normal tissue sur-rounding a tumour is homogeneous, that the periphery supplies nutrient uniformly,that the concentration of nutrient in the tumour depends only on the distance fromthe tumour surface and that a single nutrient largely controls tumour growth. Weneglected orientation dependent mechanical and adhesive properties of cells.Despite these assumptions, our model simulates avascular tumour growth well,reproducing experimental results for the increase of tumour volume.Also, all of our tumour cells are equally aggressive in their growth and all havethe same adhesivity. In a real tumour, some cells will be further down the malig-nant development pathway than others, so they will vary in their growth rate andadhesivity throughout the tumour. When a tumour cell divides, its daughters donot always have the same properties as the parent [67, 1]. For example, daughtercells may be more aggressive in their growth and also adhere less to other tumourcells, thus being more likely to break away from the tumour mass into the normaltissue. Our model could be developed to include metastasis by allowing the daugh-ter cells to have randomly uctuating growth rates and adhesivities with respect tothe values of their parent cell, according to a probability matrix. In this case wecould simulate the evolution of a true metastatic, though avascular cancer.Normal tissue is also not homogeneous - it contains extracellular matrix, �brin,collagen, blood vessels etc..., so normal tissue is not a homogeneous source of nu-trient. We are currently developing the model to include nutrient di�using to thetumour from nearby blood vessels, through heterogeneous tissue.When a tumour reaches its di�usive equilibrium, it can no longer increase insize, unless it gets its own blood supply. It does this by releasing a chemical calledTumour Angiogenesis Factor into the surrounding tissue, which causes nearby bloodvessels to form sprouts, which grow into new capillaries. These eventually penetratethe tumour mass and subsequent growth is exponential [8, 11, 21, 24, 71, 72]. Weplan to extend our model to include these features.AcknowledgementsE.L.S. acknowledges the support of an EPSRC studentship for this research.J.A.G. and M.Z. acknowledge support for this research from the National ScienceFoundation under grants, INT91-01345, DMR92-57011, CTS96-01691, INT96-03035and INT98-02417, and from the ACS/PRF and Royal Irish Academy.21

0 0.5 1 1.5 2 2.5 3 3.5 4
x 104
0
0.5
1
1.5
2
2.5x 10
5
Time, MCS
Vol
ume
of T
umou
r
Volume of cancer cells
Onset of quiescence occurs at time = 700
Onset of necrosis occurs at time = 8600Figure 10: Volume of the growing tumour0 0.5 1 1.5 2 2.5 3 3.5 4
x 104
0
5
10
15
20
25
30
35
40Outer, Quiescent and Necrotic Radii of the Growing Tumour
time, MCS
radi
i
Figure 11: Radii of the growing tumour22

0 50 100 150 200 250 3000
1
2
3
4
Number of days
Siz
e of
sph
eroi
d di
amet
er /m
m
Growth curve for V−79 spheroids
0 0.5 1 1.5 2 2.5 3
x 104
0
10
20
30
40
Monte Carlo Time Steps
Out
er r
adiu
s
Figure 12: Comparison of the growth of tumour Radius with Folkman andHochberg's measurementsReferences[1] A.D. Wyllie. Growth and neoplasia. In R.N.M.Macsween and K.Whaley, edi-tors, Muir's Textbook of Pathology, chapter 10. Edward Anderson, (1992).[2] L. Wolpert. The Triumph of the Embryo, chapter 11 - Cell multiplication andcancer. Oxford University Press, (1993).[3] C. Van Waes, D.M. Surh, Z. Chen, M. Kirby, J.S. Rhim, R. Brager, R.B. Ses-sions, J. Poore, G.T. Wolf, and T.E. Carey. Increase in suprabasilar integrinadhesion molecule expression in human epidermal neoplasms accompanies in-creased proliferation occurring with immortalization and tumor progression .Cancer Research, 55:5434{5444, (1995).[4] S.A. Maxwell, D. Capp, and S.A. Acosta. Telomerase activity in immortalizedendothelial cells undergoing p53-mediated apoptosis. Biochemical and Biophys-ical Research Communications, 241:642{645, (1997).[5] J.W. Shay. Telomerase in human development and cancer. Journal of CellularPhysiology, 173:266{270, (1997). 23

[6] S.H. Kau�man, editor. Apoptosis: Pharmacological Implications and Thera-peutic Opportunities, Advances in Pharmacology, volume 41. Academic Press,London, (1997).[7] R. Langer. Isolation of a cartilage factor that inhibits tumor neovascularisationand growth. Science, 193:70{72, (1976).[8] J. Folkman. Tumor angiogenesis: therapeutic implications. New England Jour-nal of Medicine, 285:1182{1186, (1971).[9] W.R. Inch, J.A. McCredie, and R.M. Sutherland. Growth of nodular carcino-mas in rodents compared with multicell spheroids in tissue culture. Growth,34:271{282, (1970).[10] R.M. Sutherland, W.R. Inch, and J.A. McCredie. Growth of multicell spheroidsin tissue culture as a model of nodular carcinomas. Journal of the NationalCancer Institute, 46:113{120, (1971).[11] J. Folkman, E. Merler, C. Abernathy, and et al. Isolation of a tumour factorresponsible for angiogenesis. Journal of Experimental Medicine, 133:275{288,(1971).[12] R.H. Thomlinson and L.H. Gray. The histological structure of some humanlung cancers and the possible implications for radio therapy. British Journalof Cancer, 9:539{549, (1955).[13] J.P. Freyer and R.M. Sutherland. Regulation of growth saturation and de-velopment of necrosis in EMT6/Ro multicellular spheroids by the glucose andoxygen supply. Cancer Research, 46:3513{3520, (1986).[14] J.P. Freyer and P.L. Schor. Regrowth of cells from multicell tumour spheroids.Cell Tissue Kinetics, 20:249, (1987).[15] K. Groebe and W. Mueller-Klieser. Distributions of oxygen, nutrient andmetabolic waste concentrations in multicellular spheroids and their dependenceon spheroid parameters. European Biophysics Journal, 19:169{181, (1991).[16] A.D. Conger and M.C. Ziskin. Growth of mammalian multicellular tumourspheroids. Cancer Research, 43:556{60, (1983).[17] J.P. Freyer, E. Tustano�, A.J. Franko, and R.M. Sutherland. In situ oxygenconsumption rates of cells in V-79 multicellular spheroids during growth. Jour-nal of Cellular Physiology, 118:53{61, (1984).[18] D.L.S McElwain and G.J. Pettet. Cell migration in multicell spheroids: swim-ming against the tide. Bulletin of Mathematical Biology, 55:655{674, (1993).[19] P.W. Vaupel, S. Frinak, and H.I. Bicher. Heterogeneous oxygen partial pressureand pH distribution in c3Hmouse mammary adenocarcinoma. Cancer Research,41:2008{13, (1981). 24

[20] J.P. Freyer. Role of necrosis in regulating the growth saturation of multicellspheroids. Cancer Research, 48:2432{9, (1988).[21] J. Folkman and M. Hochberg. Self-regulation of growth in three dimensions.Journal of Experimental Medicine, 138:745{753, (1973).[22] J.F.R. Kerr. Shrinkage necrosis; a distinct mode of cellular death. Journal ofPathology, 105:13{20, (1971).[23] J.F.R. Kerr, Wyllie, and A.R. Currie. Apoptosis: A basic biological phe-nomenon with wide-ranging implications in tissue kinetics. British Journalof Cancer, 26:239{257, (1972).[24] N. Paweletz and M. Knierim. Tumor-related angiogenesis. Critical reviews inOncology/Hematology, 9:197{242, (1989).[25] M.S. Steinberg. On the mechanism of tissue reconstruction by dissociated cells,I. Population kinetics, di�erential adhesiveness, and the absence of directedmigrations. Proceedings of the National Academy of Sciences U.S.A., 48:1577,(1962).[26] M.S. Steinberg. On the mechanism of tissue reconstruction by dissociated cells,III. Free energy relations and the reorganization of fused, heteronomic tissuefragments. Proceedings of the National Acadamy of Sciences U.S.A., 48:1769,(1962).[27] M.S. Steinberg. Mechanism of tissue reconstruction by dissociated cells, II:Time course of events. Science, 137:762{3, (1962).[28] P. Armstrong. Cell sorting out: The self-assembly of tissues in vitro. CriticalReviews in Biochemistry and molecular Biology, 24:119{149, (1989).[29] M. Dan-Sohkawa, H. Yamanaka, and K. Watanabe. Reconstruction of Bip-innaria larvae from dissociated embryonic cells of the star�sh, Asterina-Pectinifera. Journal of Embryology and Experimental Morphology, 94:47{60,(1986).[30] A. Gierer, S. Berking, H. Bode, C.N. David, K. Flok, G. Hansmann, H. Schaller,and E. Trenkner. Regeneration of hydra from reaggregated cells. Nature,239:98{101, (1972).[31] K. Noda. . Zool. Mag., 80:99, (1971).[32] P. Townes and J. Holtfreter. . Journal of Experimental Zoology, 128:53, (1955).[33] J. Holtfreter. . Review of Cancer Biology, 3:220, (1944).[34] H.V. Wilson. . Journal of Experimental Zoology, 5:245, (1907).[35] J. Holtfreter. . Arch. Exptl. Zellforsch. Gewebezuecht, 23:169, (1900).25

[36] M.S. Steinberg. Does di�erential adhesion govern self-assembly processes in his-togenesis? Equilibrium con�gurations and the emergence of a hierarchy amongpopulations of embryonic cells. Journal of Experimental Zoology, 173:395,(1970).[37] U. Technau and T.W. Holstein. Cell sorting during the regeneration of hydrafrom reaggregated cells. Developmental Biology, 151:117{127, (1992).[38] M.P. Sarras, Z. Xiaoming, J.K. Hu�, M.A. Accaviti, P.L. St John, and D.R.Abrahamson. Extracellular-matrix (mesoglea) of hydra-vulgaris .3. formationand functions during morphogenesis of hydra cell aggregates. DevelopmentalBiology, 157:383{398, (1993).[39] S.E. Fraser, C.R. Green, H.R. Bode, and N.B. Gilula. Selective disruption ofgap junctional communication interferes with a patterning precess in hydra.Science, 237:49{55, (1987).[40] J.C.M. Mombach, R.M.C. Dealmeida, and J.R. Iglesias. Mitosis and growth inbiological tissues. Physics Review E, 48:598{602, (1993).[41] J.C.M. Mombach, R.M.C. Dealmeida, and J.R. Iglesias. 2-cell correlations inbiological tissues. Physics Review, 47:3712{3716, (1993).[42] F. Graner. Can surface adhesion drive cell rearrangement? Part I: biologicalcell-sorting. Journal of Theoretical Biology, 164:455{476, (1993).[43] R.A. Foty, G. Forgacs, C.M. P eger, and M.S. Steinberg. Liquid propertiesof embryonic tissues - measurement of interfacial tensions. Physical ReviewLetters, 72:2298{2301, (1994).[44] A. Moscona. Development of heterotypic combinations of dissociated embryonicchick cells. Proceedings of the Society for Experimental Biology and Medicine,92:410{416, (1956).[45] D. McClay and C. Ettensohn. Cell adhesion in morphogenesis. Annual Reviewof Cell Biology, 3:319{345, (1987).[46] M. Robertson, J. Armstrong, and P. Armstrong. Adhesive and non-adhesivemembrane domains of amphibian embryo cells. Journal of Cell Science, 44:19{31, (1980).[47] K. Nubler-Yung and B. Mardini. Insect epidermis - polarity patterns aftergrafting result from divergent cell adhesions between host and graft tissue.Development, 110:1071{1079, (1990).[48] S. Newman and W. Comper. Generic physical-mechanisms of morphogenesisand pattern formation. Development, 110:1{18, (1990).[49] M. Takeichi. Cadherin cell-adhesion receptors as a morphogenetic regulator.Science, 251:1451{1455, (1991). 26

[50] S.E. Koonin and D.C. Meredith. Computational Physics: FORTRAN version,chapter 8 - Monte Carlo Methods, pages 197{220. Addison-Wesley, (1990).[51] F. Haessner. Recrystalization of metallic materials, page 3. Riederer Verlag,Stuttgart, (1978).[52] M.P. Anderson, D.J. Srolovitz, G.S. Grest, and P.S. Sahni. Computer simula-tion of grain growth - I. kinetics. Acta Metallica, 32:783{791, (1984).[53] J.A. Glazier, M.P. Anderson, and G.S. Grest. Coarsening in the 2-dimensionalsoap froth and the large Q-Potts-model - a detailed comparison. Philosophi-cal Magazine B-Physics of Condensed Matter Structural Electronic Optical andMagnetic Properties, 62:615{645, (1990).[54] D. Weaire, B. Bolton, P. Molho, and J.A. Glazier. Investigation of an ele-mentary model for magnetic froth. Journal of Physics: Condensed Matter,3:2101{2114, (1991).[55] N.J. Savill and P. Hogeweg. Modelling morphogenesis: From single cells tocrawling slugs. Journal of Theoretical Biology, 184:229{235, (1997).[56] D. Drasdo. Growing tissue cell populations: a stochastic model based onthe Monte Carlo method. Technical report, Max-Planck-Institut f�ur Kolloid-und Grenz �achenforschung, Kantstr. 55, D-14513 Teltow, Berlin, Germany.e-mail = [email protected], (1995).[57] D. Drasdo and R. Kree. Simulated tissue: a condensed matter approach to grow-ing cell assemblies and histological processes. Technical report, Max-Planck-Institut, Teltow and Inst.f. Theoretic. Physik, Georg-August Universit�at, ad-dress same as above, (1995).[58] D. Drasdo, R. Kree, and J.S. McCaskill. Monte Carlo approach to tissue-cellpopulations. Physical review E, 52:6635{6657, (1995).[59] F.G. Graner and J.A. Glazier. Simulation of biological cell sorting using a two-dimensional extended Potts model. Physical Review Letters, 69:2013{2016,(1992).[60] J.A. Glazier and F. Graner. Simulation of the di�erential adhesion drivenrearrangement of biological cells. Physical Review E, 47:2128{2154, (1993).[61] J.A. Glazier. The thermodynamics of cell sorting. Bussei Kenkyu, 65:691{700,(1995).[62] J.C.M. Mombach, J.A. Glazier, R.C. Raphael, and M. Zajac. Quantitativecomparison between di�erential adhesion models and cell sorting in the presenceand absence of uctuations. Physical Review Letters, 75:2244{2247, (1995).[63] J.C.M. Mombach and J.A. Glazier. Single cell motion in aggregates of embry-onic cells. Physical Review Letters, 76:3032{3035, (1996).27

[64] J.C.M. Mombach and J.A. Glazier. Single cell motion in random aggregates ofembryonic cells. Physical Review Letters, 76:3032{3035, (1995).[65] J.A. Glazier, R.C. Raphael, F Graner, and Y Sawada. The Energetics of CellSorting in Three Dimensions. In D. Beysens, M.A. Felix, G. Forgacs, andF. Gaill, editors, Interplay of Genetic and Physical Processes in the Develop-ment of Biological Form, pages 54{61. Springer, (1995).[66] N. Metropolis, A.W. Rosenbluth, M.N. Rosenbluth, A.H. Teller, and E. Teller.Equation of state calculations by fast computing machines. Journal of ChemicalPhysics, 21:1087, (1953).[67] G.L. Nicholson. Cancer metastasis: tumor cell and host organ properties im-portant in metastasis to speci�c secondary sites. Biochimica et Biophysica Acta,948:175{224, (1988).[68] Masayuki Miyasaka. Cancer metastasis and adhesion molecules. Clinical or-thopaedics and related research, 312:10{18, (1995).[69] W.G. Stetler-Stevenson, S. Aznavoorian, and L.A. Liotta. Tumor cell inter-actions with the extracellular matrix during invasion and metastasis. AnnualReview of Cell Biology, 9:541{573, (1993).[70] D.I. Kleinerman, P. Tronsco, S-H Lin, L.L Pisters, E.R. Sherwood, T. Brooks,A.C. von Eschenbach, and J-T Hsieh. Consistent expression of an epithelialcell adhesion molecule (C-CAM) during human prostate cancer developmentand loss of expression in prostrate cancer: implication as a tumour suppressor.Cancer Research, 55:1215{1220, (1995).[71] D.H. Ausprunk and J. Folkman. Migration and proliferation of endothelialcells in preformed and newly formed blood vessels during tumor angiogenesis.Microvascular Research, 14:53{65, (1977).[72] J. Folkman. Angiogenesis in cancer, vascular, rheumatoid and other diseases.Nature Medicine, 1:21{31, (1995).28
Copyright © 2022 FDOKUMEN