Association of plasminogen activator inhibitor-1 genotype with avascular osteonecrosis in...
22
Association of Plasminogen Activator Inhibitor (PAI)-1 (SERPINE1) SNPs With Myocardial Infarction, Plasma PAI-1, and Metabolic Parameters The HIFMECH Study P.E. Morange, N. Saut, M.C. Alessi, J.S. Yudkin, M. Margaglione, G. Di Minno, A. Hamsten, S.E. Humphries, D.A. Tregouet, I. Juhan-Vague Objective—The purpose of this study was to investigate the effects of plasminogen activator inhibitor-1 (PAI-1) gene (SERPINE1) single nucleotide polymorphisms (SNPs) on the risk of myocardial infarction (MI), on PAI-1 levels, and factors related to the metabolic syndrome. Methods and Results—Eleven SNPs capturing the common genetic variation of the SERPINE1 gene were genotyped in the HIFMECH study. In the 510 male cases and their 543 age-matched controls, a significant gene-smoking interaction was observed. In nonsmokers, the rs7242-G allele was more frequent in cases than in controls (0.486 versus 0.382, P0.013) whereas the haplotype derived from the rs2227631 (844AG)-G and rs2227683-A alleles was 3-fold lower in cases than in controls (0.042 versus 0.115, P0.006). SERPINE1 haplotypes explained 3.5% (P0.007) of the variability of PAI-1 levels, which was attributable to the combined effects of 3 SNPs, 844AG, rs2227666, and rs2227694. The rs6092 (Ala15Thr) and rs7242 SNPs acted additively to explain 4.4% of the variability of plasma insulin levels and 1.6% of the variability of BMI (P10 3 and P0.023, respectively). Conclusions—SERPINE1 haplotypes are mildly associated with plasma levels of PAI-1 and with the risk of MI in nonsmokers. They are also associated with insulin levels and BMI. (Arterioscler Thromb Vasc Biol. 2007;27:2250-2257.) Key Words: metabolic syndrome myocardial infarction PAI-1 SERPINE1 I n blood, fibrinolysis breaks down fibrin and maintains vessel patency, and in tissues it breaks down the extracel- lular matrix and controls cell adhesion and migration and thus participates in tissue remodeling. Fibrinolysis is primarily regulated by plasminogen activator inhibitor type-1 (PAI-1), which controls the extent of this potentially destructive protease system. 1–3 Increased PAI-1 levels may predispose patients to the formation of atherosclerosis plaque prone to rupture, with a high lipid-to-vascular smooth muscle cells ratio as a result of decreased cell migration. 4 In humans, there is clinical evi- dence that increased PAI-1 levels are associated with athero- thrombosis. 5,6 In large epidemiological studies, elevated plasma PAI-1 levels have been identified as a predictor of myocardial infarction (MI). 7–11 Remarkably, the predictive ability of PAI-1 disappears after adjustment for markers of the metabolic syndrome (MetS), 8,12–16 suggesting that the MetS is a prerequisite to high plasma PAI-1 levels in patients prone to atherothrombosis. Moreover, it has been hypothe- sized that PAI-1 participates in the development of key features of the MetS. Indeed, several studies 17–20 showed that high plasma PAI-1 levels independently predict the develop- ment of type II diabetes. Whether PAI-1 plays a direct role in MI, MetS, or diabetes, or is only a bystander, is difficult to assess in humans. One way to verify this hypothesis is to look for a relation between single nucleotide polymorphisms (SNPs) influencing PAI-1 expression or activity, MI, and parameters belonging to the MetS. Several SERPINE1 (for- merly PAI-1) gene SNPs have been identified, 21–23 among which the polymorphism 4G/5G (rs1799889) located in position 675 of the promoter region has been quite exten- sively studied. The 4G allele has been shown to be associated Original received April 25, 2007; final version accepted June 29, 2007. From INSERM, U626 (P.E.M., N.S., M.C.A., I.J.V.), Universite ´ de la Me ´diterrane ´e, Marseille, France; the Diabetes and Cardiovascular Disease Academic Unit (J.S.Y.), Archway Campus, Royal Free and University College Medical School, London, UK; Instituto di Ricovero e Cura a Carattere Scientifico (M.M., G.D.M.), Ospedale Casa Sollievo della Sofferenza, San Giovani Rotondo, Italy; King Gustaf V Research Institute and Departments of Medicine and Cardiology (A.H.), Karolinska Hospital, Karolinska Institute, Stockholm, Sweden; the Center for Cardiovascular Genetics (S.E.H.), British Heart Foundation Laboratories, Rayne Building, Royal Free and University College Medical School, London, UK; and INSERM, UMR S 525 (D.A.T.), Universite ´ Pierre et Marie Curie-Paris6, UMR S 525, Paris, F-75634 France. Correspondence to P.E. Morange, Lab. Hematology, CHU Timone. 264, Rue Saint-Pierre 13385 Marseille Cedex 05, France. E-mail pmorange@ ap-hm.fr © 2007 American Heart Association, Inc. Arterioscler Thromb Vasc Biol. is available at http://atvb.ahajournals.org DOI: 10.1161/ATVBAHA.107.149468 2250 Thrombosis by guest on December 8, 2015 http://atvb.ahajournals.org/ Downloaded from by guest on December 8, 2015 http://atvb.ahajournals.org/ Downloaded from by guest on December 8, 2015 http://atvb.ahajournals.org/ Downloaded from by guest on December 8, 2015 http://atvb.ahajournals.org/ Downloaded from by guest on December 8, 2015 http://atvb.ahajournals.org/ Downloaded from by guest on December 8, 2015 http://atvb.ahajournals.org/ Downloaded from by guest on December 8, 2015 http://atvb.ahajournals.org/ Downloaded from by guest on December 8, 2015 http://atvb.ahajournals.org/ Downloaded from by guest on December 8, 2015 http://atvb.ahajournals.org/ Downloaded from by guest on December 8, 2015 http://atvb.ahajournals.org/ Downloaded from by guest on December 8, 2015 http://atvb.ahajournals.org/ Downloaded from by guest on December 8, 2015 http://atvb.ahajournals.org/ Downloaded from by guest on December 8, 2015 http://atvb.ahajournals.org/ Downloaded from by guest on December 8, 2015 http://atvb.ahajournals.org/ Downloaded from by guest on December 8, 2015 http://atvb.ahajournals.org/ Downloaded from
Transcript of Association of plasminogen activator inhibitor-1 genotype with avascular osteonecrosis in...

Association of Plasminogen Activator Inhibitor (PAI)-1(SERPINE1) SNPs With Myocardial Infarction, Plasma
PAI-1, and Metabolic ParametersThe HIFMECH Study
P.E. Morange, N. Saut, M.C. Alessi, J.S. Yudkin, M. Margaglione, G. Di Minno, A. Hamsten,S.E. Humphries, D.A. Tregouet, I. Juhan-Vague
Objective—The purpose of this study was to investigate the effects of plasminogen activator inhibitor-1 (PAI-1) gene(SERPINE1) single nucleotide polymorphisms (SNPs) on the risk of myocardial infarction (MI), on PAI-1 levels, andfactors related to the metabolic syndrome.
Methods and Results—Eleven SNPs capturing the common genetic variation of the SERPINE1 gene were genotyped inthe HIFMECH study. In the 510 male cases and their 543 age-matched controls, a significant gene-smoking interactionwas observed. In nonsmokers, the rs7242-G allele was more frequent in cases than in controls (0.486 versus 0.382,P�0.013) whereas the haplotype derived from the rs2227631 (�844A�G)-G and rs2227683-A alleles was �3-foldlower in cases than in controls (0.042 versus 0.115, P�0.006). SERPINE1 haplotypes explained 3.5% (P�0.007) of thevariability of PAI-1 levels, which was attributable to the combined effects of 3 SNPs, �844A�G, rs2227666, andrs2227694. The rs6092 (Ala15Thr) and rs7242 SNPs acted additively to explain 4.4% of the variability of plasma insulinlevels and 1.6% of the variability of BMI (P�10�3 and P�0.023, respectively).
Conclusions—SERPINE1 haplotypes are mildly associated with plasma levels of PAI-1 and with the risk of MI innonsmokers. They are also associated with insulin levels and BMI. (Arterioscler Thromb Vasc Biol.2007;27:2250-2257.)
Key Words: metabolic syndrome � myocardial infarction � PAI-1 � SERPINE1
In blood, fibrinolysis breaks down fibrin and maintainsvessel patency, and in tissues it breaks down the extracel-
lular matrix and controls cell adhesion and migration and thusparticipates in tissue remodeling. Fibrinolysis is primarilyregulated by plasminogen activator inhibitor type-1 (PAI-1),which controls the extent of this potentially destructiveprotease system.1–3
Increased PAI-1 levels may predispose patients to theformation of atherosclerosis plaque prone to rupture, with ahigh lipid-to-vascular smooth muscle cells ratio as a result ofdecreased cell migration.4 In humans, there is clinical evi-dence that increased PAI-1 levels are associated with athero-thrombosis.5,6 In large epidemiological studies, elevatedplasma PAI-1 levels have been identified as a predictor ofmyocardial infarction (MI).7–11 Remarkably, the predictiveability of PAI-1 disappears after adjustment for markers of
the metabolic syndrome (MetS),8,12–16 suggesting that theMetS is a prerequisite to high plasma PAI-1 levels in patientsprone to atherothrombosis. Moreover, it has been hypothe-sized that PAI-1 participates in the development of keyfeatures of the MetS. Indeed, several studies17–20 showed thathigh plasma PAI-1 levels independently predict the develop-ment of type II diabetes. Whether PAI-1 plays a direct role inMI, MetS, or diabetes, or is only a bystander, is difficult toassess in humans. One way to verify this hypothesis is to lookfor a relation between single nucleotide polymorphisms(SNPs) influencing PAI-1 expression or activity, MI, andparameters belonging to the MetS. Several SERPINE1 (for-merly PAI-1) gene SNPs have been identified,21–23 amongwhich the polymorphism 4G/5G (rs1799889) located inposition �675 of the promoter region has been quite exten-sively studied. The 4G allele has been shown to be associated
Original received April 25, 2007; final version accepted June 29, 2007.From INSERM, U626 (P.E.M., N.S., M.C.A., I.J.V.), Universite de la Mediterranee, Marseille, France; the Diabetes and Cardiovascular Disease
Academic Unit (J.S.Y.), Archway Campus, Royal Free and University College Medical School, London, UK; Instituto di Ricovero e Cura a CarattereScientifico (M.M., G.D.M.), Ospedale Casa Sollievo della Sofferenza, San Giovani Rotondo, Italy; King Gustaf V Research Institute and Departmentsof Medicine and Cardiology (A.H.), Karolinska Hospital, Karolinska Institute, Stockholm, Sweden; the Center for Cardiovascular Genetics (S.E.H.),British Heart Foundation Laboratories, Rayne Building, Royal Free and University College Medical School, London, UK; and INSERM, UMR S 525(D.A.T.), Universite Pierre et Marie Curie-Paris6, UMR S 525, Paris, F-75634 France.
Correspondence to P.E. Morange, Lab. Hematology, CHU Timone. 264, Rue Saint-Pierre 13385 Marseille Cedex 05, France. E-mail [email protected]
© 2007 American Heart Association, Inc.
Arterioscler Thromb Vasc Biol. is available at http://atvb.ahajournals.org DOI: 10.1161/ATVBAHA.107.149468
2250
Thrombosis
by guest on December 8, 2015http://atvb.ahajournals.org/Downloaded from by guest on December 8, 2015http://atvb.ahajournals.org/Downloaded from by guest on December 8, 2015http://atvb.ahajournals.org/Downloaded from by guest on December 8, 2015http://atvb.ahajournals.org/Downloaded from by guest on December 8, 2015http://atvb.ahajournals.org/Downloaded from by guest on December 8, 2015http://atvb.ahajournals.org/Downloaded from by guest on December 8, 2015http://atvb.ahajournals.org/Downloaded from by guest on December 8, 2015http://atvb.ahajournals.org/Downloaded from by guest on December 8, 2015http://atvb.ahajournals.org/Downloaded from by guest on December 8, 2015http://atvb.ahajournals.org/Downloaded from by guest on December 8, 2015http://atvb.ahajournals.org/Downloaded from by guest on December 8, 2015http://atvb.ahajournals.org/Downloaded from by guest on December 8, 2015http://atvb.ahajournals.org/Downloaded from by guest on December 8, 2015http://atvb.ahajournals.org/Downloaded from by guest on December 8, 2015http://atvb.ahajournals.org/Downloaded from

with increased SERPINE1 transcription compared with the5G allele in in vitro studies21,24 and with increased plasmaPAI-1 levels in vivo.22 A large systematic review found thatthe 4G/4G genotype was associated with a modest 1.2-foldincreased risk of MI.25 We have shown, in a previous reportof the HIFMECH study, that the �675 4G/5G polymorphismis associated with the risk of MI but that this effect isconsiderably influenced by the presence of underlyingMetS.26 Results about the relation between this polymor-phism and variables related to the MetS were howevercontradictory, carriers of the 4G allele being more prone toobesity and MetS in some studies22,23,26–28 but not in oth-ers.29–32 One possible explanation for these observed discrep-ancies could be that other SERPINE1 SNPs in linkagedisequilibrium (LD) with the 4G/5G polymorphism are asso-ciated with MetS, suggesting that haplotype analysis ofSERPINE1 SNPs could be of great interest. For example,another potentially functional polymorphism of the promot-er,33 �844A�G (rs2227631), in strong LD with the 4G/5Gpolymorphism, could be responsible, instead of the 4G/5G,for the association between PAI-1, MetS, and MI. Threehaplotype association studies have recently been performedto address the influence of SERPINE1 SNPs on PAI-1 plasmalevels and on the risk of cardiovascular disease.34–36 Kathire-san et al34 have shown that SERPINE1 SNPs explained about5% of the variability of PAI-1 plasma levels and thisassociation could be attributable to 3 SNPs, rs6465787,rs2227674, and �844A�G. This haplotype analysis couldnot completely exclude the possibility that the effect of the�844A�G SNP was the consequence of its strong LD withthe �675 4G/5G. On the contrary, Ding et al,35 using asimilar approach, showed that the SERPINE1 effect on PAI-1plasma levels seems to be restricted to the �675 4G/5Gpolymorphism, however, they did not study the effect of the�844A�G. Neither of these studies found any relationbetween common haplotypes of the SERPINE1 and theoverall risk of cardiovascular disease. However, Su et al,36 ina group of Chinese subjects, detected a SERPINE1-smokinginteraction on CHD risk, such as the main haplotype carryingthe �844A and �6754G allele significantly increased therisk of CHD in nonsmokers only.
The aim of our study was to simultaneously evaluate, in acase-control study of White individuals, the association ofSERPINE1 SNPs with MI, plasma PAI-1 levels, and meta-bolic parameters using a haplotype-based approach. Weaimed to test whether the association already describedbetween the SERPINE1 variants and myocardial infarctioncould be first modulated by smoking and secondly be partlythe result of the relationship between these variants and somefeatures of the metabolic syndrome.
Materials and MethodsStudy SubjectsFull details of the study design and recruitment criteria are presentedelsewhere.26 Male survivors of a first MI aged �60 years (excludingpatients with familial hypercholesterolemia and insulin dependentdiabetes mellitus) and population-based individuals of the same agewere recruited from the 4 centers as part of the HIFMECH study:Stockholm (Sweden), London (UK), Marseille (France), and SanGiovanni Retondo (Italy). Consecutive patients were invited to
participate, along with randomly selected healthy individuals fromthe same catchment areas. In all, a total of 510 postinfarction patientsand 543 controls were included in the present study. Postinfarctionpatients were investigated 3 to 6 months after the acute event.Patients and control subjects were examined in parallel in the earlymorning after an overnight fast. Height and weight were recordedand the body mass index (BMI) was calculated as kg m�2. Smokerswere considered as current or ex-smokers at the time of the MI onset.
Determination of PAI-1 antigen was centrally performed with acommercially available kit (Asserachrom PAI-1; Stago). Eachplasma sample was run in duplicate. Interassay variation coefficientof pooled plasma from 30 healthy volunteers was 8%. Assay methodfor insulin has been described.37
Choice of PAI-1 Tag PolymorphismsSERPINE1 has been sequenced by the Seattle SNPs program forGenomics Application project in 23 individuals of European ancestry(http://pga.gs.washington.edu/). From the identified SNPs spanning13 kb of the SERPINE1 gene, the minimum number of SNPs (tagSNP) required to characterize 100% of the haplotypic diversity of theSERPINE1 gene was determined. 10 tag SNP with minor allelefrequency �0.04 were found to be enough to fully characterize thisgene and were further genotyped in the HIFMECH study. Theseare rs2227631 (�844A�G), rs6092 (Ala15Thr), rs7242, rs2227708,rs2227662, rs2227666, rs2227667, rs2227672, rs2227683,rs2227694. The rs1799889 (�675 4G/5G) was also genotyped as itis widely used in SERPINE1 genetic studies, has been shown to befunctional,24 and is associated with PAI-1 plasma levels.
Genotyping were performed under contract by Kbioscience, Cam-bridge, UK (http://www.kbioscience.co.uk), except for 4G-675 5G,which was genotyped by allele specific polymerase chain reaction(PCR), using the following primers (5��3�): forward: TCAGCCA-GACAAGGTTGTTG, reverse: TTTTCCCCCAGGGCTGTCCA,4G: GTCTGGACACGTGGGGA, 5G: GTCTGGACACGT-GGGGG. PCR conditions were an initial denaturation step of 1’30 at95°C, followed by 35 cycles of these 3 steps: 95°C: 30”, 62°C: 45”,72°C: 1’ and then a final extension step of 5’ at 72°C. PCR were thenkept at 15°C for immediate use or frozen for later use.
Statistical AnalysisAllele frequencies were estimated by gene counting, and departurefrom Hardy-Weinberg (HW) equilibrium was testing using a �2 with1 degree of freedom. Allele frequencies were compared betweencases and controls by use of a �2 with 1 degree of freedom.Conditional logistic regression analysis for matched case-controlstudy was used to investigate the association between MI andexplanatory variables. Genotypic association of SERPINE1 poly-morphisms with plasma PAI-1 and insulin levels was first investi-gated by use of a classical linear model. Plasma PAI-1 and insulinwere square-root and log-transformed to remove positive skewness,respectively.
LD analysis was carried by the THESIAS software38 (www.genecanvas.org) based on the SEM algorithm.39 The extent of LDwas expressed in terms of D�.40 THESIAS was also used forhaplotype analyses. For the haplotype analyses, systematic analysesof all possible combinations of 1 to 9 polymorphisms were carriedout to reduce the haplotype dimension and to search for the mostinformative and parsimonious haplotype configuration in terms ofprediction of the phenotypes variability using the previously de-scribed Akaike’s Information Criterion-based strategy.41,42 The ho-mogeneity of allelic and haplotypic effects across North and South oracross cases and controls was assessed by the Mantel-Haenszelstatistics.43 All analyses were adjusted for age, gender, smoking,center, and case-control status when appropriate. A probability valueof �0.05 was taken as statistically significant.
ResultsBaseline Characteristics of Cases and ControlsCases were more likely to be smokers and suffer fromdiabetes. Parameters of the MetS such as BMI, plasma
Morange et al SERPINE1 Haplotypes and Myocardial Infarction 2251
by guest on December 8, 2015http://atvb.ahajournals.org/Downloaded from
insulin, and triglycerides (TG) levels were significantlyhigher in cases than in controls (supplemental Table I,available online at http://atvb.ahajournals.org). PAI-1 levelswere significantly higher in cases than in controls(40.10�28.46 versus 29.48�22.50 ng/mL, P�10�4), an ef-fect seen in both the North (42.64 versus 31.85 ng/mL) andSouth (38.28 versus 27.82 ng/mL). As expected, plasmaPAI-1 levels were highly correlated with insulin levels,‚�0.44 and ‚�0.37 in controls and cases, respectively (bothP�10�4), but also to BMI (‚�0.43 and ‚�0.24, P�10�4,
respectively) and with TG (‚�0.38 and ‚�0.30, P�10�4,respectively).
Description of Studied SERPINE1 SNPsAmong the 11 genotyped polymorphisms, 1 was found to benonpolymorphic (rs2227662), whereas the rs2227708 wasrelatively rare (frequency of 0.012 in the whole HIFMECHstudy). Therefore, as shown in Figure 1, the present analysisfocused on 9 polymorphisms, rs2227631 (�844A�G),rs1799889 (�675 4G/5G), rs6092 (Ala15Thr), rs2227666,rs2227667, rs2227672, rs2227683, rs2227694, and rs7242(�11061 T�G). The genotype distribution of all the SNPswere in HW equilibrium and their allele frequencies werevery similar in North and South (supplemental Table II).Pairwise LD was relatively strong between all polymor-phisms, except for the rs2227683 and rs2227694 that showedmoderate LD with the �844A�G and �675 4G/5G SNPs.As a consequence, 9 haplotypes with frequency greater than3% were inferred and accounted for about 93% of the wholechromosomes (see below). As the pattern of LD and theresulting haplotypic structure were very similar in North andSouth (supplemental Table III), the following analyses wereperformed on the whole HIFMECH sample, while checkingfor this homogeneity of the associations across regions.
Association of SERPINE1 SNPs With MIIn the whole sample, none of the polymorphisms was signif-icantly associated with MI either using single-locus (supple-
mental Table IV) or haplotype (Table 1) analyses. Thers6092-Thr allele was carried by only 1 haplotype and tendedto be less frequent in cases than in controls (0.099 versus0.125), but this difference failed to reach significance(P�0.07). However, the association of SERPINE1 SNPs withMI was found to be modulated by smoking. Two SNPs wereassociated with MI only in nonsmokers (supplemental TableV). Although SERPINE1 haplotypes were not associated withMI in smokers (P�0.42), they were highly associated withMI in nonsmokers (P�0.004). The best model in terms ofpredicting MI status in nonsmokers included 3 polymor-phisms, �844A�G, rs2227683, and rs7242 (Table 2). Table2 also includes the information on the �675 4G/5G, toexamine in more detail its contribution on the risk of MI.Consistent with univariate analysis, the rs7242-G allele car-ried by 1 frequent haplotype (H2) was more frequent in casesthan in controls (0.486 versus 0.383, P�0.013). Because theeffect of this haplotype that also carries the �844A allele wasnot significantly different from the 3 other haplotypes carry-ing the �844A allele (H1, H3, H4; P�0.27), it cannot becompletely excluded that the effect of the rs7242 SNP wasattributable to its LD with the �844A�G. In addition, thefrequency of the haplotype carrying the �844G andrs2227683-A alleles (H6) was �3-fold lower in nonsmokercases than in nonsmoker controls (0.042 versus 0.115,P�0.006). It is important to note that the �6754G/5G doesnot participate in this gene x smoking interaction.
Association of SERPINE1 SNPs With PAI-1 LevelsAlthough effects were generally larger in cases than control(supplemental Table VI), there was no significant evidencefor genetic effect heterogeneity (all P�0.15) nor acrosssmokers and non-smokers (data not shown). Therefore, Table3 provides a full description of the single-SNP associationanalyses in the whole HIFMECH study. Four SNPs,�844A�G, �675 4G/5G, rs2227667, and rs2227672, weresignificantly associated with PAI-1 levels. Overall, the per-centage of variance explained by these SNPs were 1.25%
Figure 1. Location of the 11 polymorphisms analyzed in the SERPINE1 gene. Usual names, when existing, are given with the rs num-bers. The exons are denoted as squares (white: untranslated, black: coding region). The 9th exon contains the end of the codingsequence and the 3�UTR.
2252 Arterioscler Thromb Vasc Biol. October 2007
by guest on December 8, 2015http://atvb.ahajournals.org/Downloaded from

(P�0.002), 1.12% (P�0.004), 0.77% (P�0.02), and 0.72%(P�0.03), respectively. SERPINE1 haplotypes were signifi-cantly associated with PAI-1 levels (P�0.007) and explained3.8% (P�0.05) and 3.1% (P�0.11) of the variability ofPAI-1 levels in controls and cases, respectively (supplementalTable VII). The best model found in the systematic explora-tion of haplotype effects in relation to PAI-1 levels includedthe �844A�G (already found to be associated with the riskof MI in nonsmokers), rs2227666, and rs2227694 poly-morphisms. Detailed haplotype analysis of these 3 poly-morphisms is summarized in Figure 2. The information on the�6754G/5G SNP is also provided to get better insight into itscontribution on PAI-1 levels variability. Firstly, the �844Gallele was carried by 2 haplotypes that differed only atposition rs2227694 and were both associated with similarPAI-1 levels (2.33 versus 2.14, P�0.51). By comparison tothe most frequent A[4G]GG haplotype, these 2 haplotypeswere associated with lower PAI-1 levels (2.55 versus2.30,P�0.02), a result compatible with an increasing effecton PAI-1 levels of the �844A allele. The observation that theunique haplotype pair A[4G]GG and A[5G]GG that differed
only at the �6754G/5G locus did not show difference inPAI-1 levels (2.55 versus 2.59, P�0.87) would additionallysuggest that the effect of the �675 to 4G/5G polymorphismobserved in univariate analysis was the consequence of its LDwith other SERPINE1 SNPs. In addition, 2 haplotypes,A[4G]GA and A[4G]AG, were associated with higher meanPAI-1 levels than the most frequent haplotype (3.02 versus2.55 and 3.01 versus 2.55, respectively; P�0.03 for both).Because the A[4G]AG haplotype is the only one carrying thers2227666 A allele, these results would suggest an increasingeffect on PA-I levels of the rs2227666A allele in addition toan increasing effect of the rs222794 A allele when associatedwith the �844A allele on the same haplotype. These effectswere similar in controls and cases, in North and South, and insmokers and nonsmokers (data not shown).
Association of SERPINE1 SNPs WithMetabolic ParametersIn univariate analysis, the rs7242 was found to be signifi-cantly associated with insulin levels in cases only (supple-mental Table VIII). No single locus nor haplotype effects
Table 1. Association of Main SERPINE1 Haplotypes With MI in the HIFMECH Study
Polymorphisms Haplotype Frequency
rs2227631(A/G)
rs1799889(4G/5G)
rs6092(Ala/Thr)
rs2227666(G/A)
rs2227667(A/G)
rs2227672(G/T)
rs2227683(G/A)
rs2227694(G/A)
rs7242(T/G)
Wholen�997
Controlsn�519
Casesn�478
A 4G Ala G A G G G G 0.347 0.338 0.356
A 4G Ala G A G G A T 0.064 0.067 0.061
A 4G Ala G A G A G T 0.042 0.039 0.046
A 4G Ala A A G G G G 0.048 0.052 0.044
A 5G Ala G A G A G T 0.049 0.042 0.056
G 5G Ala G G G G G T 0.079 0.076 0.083
G 5G Ala G A G G A T 0.066 0.069 0.063
G 5G Ala G A G A G T 0.120 0.119 0.122
G 5G Thr G G T G G T 0.110 0.123 0.101
Global likelihood ratio test of association �2 � 6.25 with8 df, P�0.62
9 haplotypes with frequency greater than 3% were inferred and accounted for 93% of all chromosomes.
Table 2. Association Between MI and Main SERPINE1 Haplotypes Derived From thers2227631, rs1799889, rs2227683, and rs7242 Polymorphisms According to Smoking
Polymorphisms
Haplotype Frequency
Nonsmokers Smokers
rs2227631(A/G)
rs1799889(4G/5G)
rs2227683(G/A)
rs7242(T/G)
Controlsn�201
Casesn�84
Controlsn�319
Casesn�391
H1 A 4G G T 0.095 0.068 0.081 0.066
H2 A 4G G G 0.383 0.486 0.401 0.379
H3 A 4G A T 0.037 0.030 0.035 0.052
H4 A 5G A T 0.042 0.077 0.045 0.053
H5 G 5G G T 0.303 0.277 0.266 0.276
H6 G 5G A T 0.115 0.042 0.133 0.137
Likelihood ratio test of association �2 � 15.082 with5 df, P�0.01
�2 � 2.914 with5 df, P�0.71
Tests were performed on values adjusted for age, center, and alcohol.
Morange et al SERPINE1 Haplotypes and Myocardial Infarction 2253
by guest on December 8, 2015http://atvb.ahajournals.org/Downloaded from

were observed in controls (test for homogeneity betweencases and controls for the rs7242 P�0.039, supplementaldata). Conversely, haplotype analysis revealed that theAla15Thr and the rs7242 SNPs were strongly associated withinsulin levels in cases. These 2 SNPs defined 3 haplotypes
(Table 4) that were highly associated with insulin (R2�4.4%,�2�15.89 with 2 df, P�10�3). By comparison to the mostfrequent Ala-T haplotype, both Ala-G and Thr-T haplotypeswere associated with higher insulin levels (Table 4). Theseresults were compatible with independent and increasing
Figure 2. Association between plasmaPAI-1 levels and SERPINE1 haplotypesderived from the rs2227631 (A/G),rs1799889 (4G/5G), rs2227666 (G/A), andrs2227694 (G/A) polymorphisms. Poly-morphisms are ordered according to theirposition on the genomic sequence. Eachbar and its 95% CI brackets correspondsto the expected mean of PAI-1 levels(square rooted) associated with 1 dose ofhaplotype under the assumption of addi-tive haplotype effects.
Table 3. Association Between PAI-1 Gene Polymorphisms and PAI-1 Levels in the HIFMECHStudy (n�948)
Polymorphism
Genotype*
R2 Test†11 12 22
rs2227631 (A�G) n�293 n�478 n�164 1.25% P�0.002
38.77 (27.1) 33.97 (27.18) 29.92 (20.13)
rs1799889 (4G�5G) n�244 n�490 n�201 1.12% P�0.004
38.23 (26.92) 35.14 (27.85) 29.63 (19.65)
rs6092 (Ala�Thr) n�730 n�196 n�6 0.61% P�0.05
35.98 (27.23) 30.37 (21.70) 19.98 (6.84)
rs2227666 (G�A) n�828 n�90 n�3 0.59% P�0.06
34.17 (25.95) 40.42 (28.81) 47.83 (32.68)
rs2227667 (A�G) n�543 n�351 n�38 0.77% P�0.02
36.99 (28.81) 32.54 (22.24) 23.27 (12.80)
rs2227672 (G�T) n�652 n�245 n�8 0.72% P�0.03
36.71 (27.70) 30.85 (22.75) 20.72 (6.79)
rs2227683 (G�A) n�591 n�291 n�46 0.01% P�0.94
34.36 (25.78) 35.29 (25.98) 36.02 (32.57)
rs2227694 (G�A) n�702 n�221 n�8 0.16% P�0.47
34.22 (25.02) 36.56 (29.28) 29.55 (20.96)
rs7242 (T�G) n�271 n�497 n�149 0.49% P�0.10
31.78 (23.92) 35.78 (27.39) 36.55 (26.59)
Mean (STD).*1 for common allele and 2 for rare allele.†Test of genotypic association (df�2) performed on square-rooted values adjusted for age, alcohol, smoking,
centre, and case–control status.
2254 Arterioscler Thromb Vasc Biol. October 2007
by guest on December 8, 2015http://atvb.ahajournals.org/Downloaded from

effects of the Thr15 (�0.24 [0.05 to 0.43], P�0.015) andrs7242 G (�0.17 [0.08 to 0.27], P�10�3) alleles. Theseeffects were similar in smokers and nonsmokers (data notshown), and were independent of other SERPINE1 SNPssuch as the �844A�G, �675 4G/5G, and rs227683 (supple-mental Table IX). The same pattern of association wasobserved with BMI, the rs6092 and rs7242 SNPs explaining1.6% of the variability of BMI (P�0.023) in cases only(supplemental Table X). No SERPINE1 genotype or haplo-type was associated with a significant effect on TG levels.
DiscussionThe main findings of the study are that different SERPINE1haplotypes are associated with the risk of MI in nonsmokersand with plasma levels of PAI-1 in both cases and controlsand with insulin and BMI in cases. In all, 6 SNPs wereassociated with these different clinical and biological pheno-types (Figure 1). The �844A�G is particularly of interest asit is both related with MI in nonsmokers and with plasmaPAI-1 levels. As previously reported in Chinese Han sub-jects,36 a highly significant gene x smoking interaction wasdetected, characterized by a strong association of SERPINE1haplotypes with MI in nonsmokers only. In nonsmokers, thers7242 SNP was associated with MI, as the rs7242-G allelewas more frequent in cases than in controls (0.51 versus0.41). This allele was carried out by only 1 haplotype, ahaplotype that also carries the �844A and �675 to 4Galleles, and that was found to be associated with higher risk ofMI in nonsmoking Chinese.36 Because of the strong LD, it isnot possible to determine whether rs7242 or the �844A�G isresponsible for the observed association. However, haplotypeanalysis revealed that the �675 4G/5G is unlikely to explainthis association. In addition, we observed that the frequencyof the haplotype defined by the �844-G and rs2227683-Aalleles was �3-fold lower in cases than in controls. Thus, the�844A�G polymorphism is more relevant than the �6754G/5G for the association with MI in nonsmokers.
The fact that the impact of the SERPINE1 polymorphismson MI was only observed in nonsmokers remains puzzling.We can hypothesize that SERPINE1 SNPs effect is relatively
modest so that it is overwhelmed by the strong effect ofsmoking on risk. However, only 84 cases and 201 controlswere nonsmokers, and this result must be replicated in alarger study conducted in nonsmokers. In HIFMECH, besidesits effect on the risk of MI in nonsmokers, the �844A�GSNP was also associated with PAI-1 plasma levels. It must beunderlined that this SNP explained only a small amount ofPAI-1 levels variability (1.25%) and that this association maynot be of clinical relevance. As it has been also implicated inthe regulation of the SERPINE1 gene, as a part of an Etsnuclear protein consensus sequence binding site,33 the effectof the �844A�G could be attributable to modifications ofSERPINE1 expression. In the present study, the observationthat adjustment for PAI-1 plasma levels did not modify therelation between SERPINE1 haplotypes and the MI risk innonsmokers suggests that PAI-1 plasma levels might notreflect the local expression of PAI-1. This latter hypothesis issupported by the fact that PAI-1 mRNA expression isincreased in the endothelial cells located in the vicinity ofthrombi, and that this overexpression is not correlated withplasma PAI-1 antigen levels.44
Besides a direct effect via modification of PAI-1 expres-sion in the arterial wall, SERPINE1 polymorphisms couldinfluence the risk of MI by influencing well-known cardio-vascular risk factors such as the MetS. Indeed, several studiesconducted in vitro and in vivo support a role of SERPINE1 inthe development MetS (reviewed in45). This led us to studythe association between SERPINE1 SNPs and several vari-ables of the MetS such as BMI, insulin, and TG. Haplotypeanalysis revealed that 2 polymorphisms, rs6092 and rs7242,independently affect BMI and plasma insulin levels in cases.The rs6092 could be of functional importance as it is anAla15Thr located in the central hydrophobic core of thePAI-1 signal peptide.23 The Ala15 allele increases hydropho-bicity and �-helix propensity, indicating that it could stabilizethe �-helix confirmation of the signal peptide. These 2properties are known to be important in signal peptidefunction and, therefore, the mutations might modulate thesecreted PAI-1 level. Lopes et al23 have shown that the Ala15allele tended to be associated with a higher risk of CHD in
Table 4. SERPINE1 Haplotype Analysis of the rs6092 and rs7242 Polymorphisms in Relation to InsulinLevels According to Case–Control Status
Polymorphisms
Controlsn�414
Casesn�350
HaplotypeFrequency
PhenotypicMean*
HaplotypeFrequency
PhenotypicMean*
rs6092 (Ala�Thr) rs7242 (T�G)
Ala T 0.470 1.828 1.767–1.888 0.464 1.845 1.785–1.904
Ala G 0.416 1.782 1.725–1.839 0.437 2.019 1.959–2.078P�0.32 †P�10�3
Thr T 0.114 1.889 1.761–2.019 0.099 2.085 1.907–2.263
†P�0.44 †P�0.02
Likelihood ratio test of association �2 � 2.43 with 2 df, P�0.30 �2 � 15.89 with 2 df, P�10�3
*Unadjusted expected log-insulin levels associated with 1 dose of haplotype under the assumption of additive haplotype effects.†Tests for difference of phenotypic mean by comparison to the reference (Ala)T haplotype. Tests were performed on values adjusted
for age, center, alcohol, and smoking.
Morange et al SERPINE1 Haplotypes and Myocardial Infarction 2255
by guest on December 8, 2015http://atvb.ahajournals.org/Downloaded from

diabetic subjects. In the present study, in univariate analysis,the Ala15 allele tended to be more frequent in individualswith MI as compared with those without, however thisdifference did not reach significance (P�0.06). As regardsthe rs7242 polymorphism located in the 3� untranslatedregion of the SERPINE1 gene, no specific information on afunctional role is available; however, studies to investigate itsfunctional impact could be useful because this polymorphismwas also found associated with MI in nonsmokers.
It is of note that these associations were not modified byadjustment for circulating PAI-1 levels. The reason for therestriction of the relation between insulin and SERPINE1polymorphisms to cases with MI is not understood. It couldbe attributable to the effect of another factor, overrepresentedin MI and more generally in a stressed inflammatory situationthat reinforces the link between SERPINE1 and the MetS, butsuch a factor has yet to be identified.
In the first report of the HIFMECH study,26 only the �6754G/5G polymorphism was studied in relation with the risk ofMI and was found to interact with insulin to modulate the riskof MI, such that the risk mediated by higher insulin levels wasonly observed in 4G carriers. The haplotype analysis per-formed in this report suggested that this interaction was infact the consequence of the joint effects of the rs6092 andrs7242 on insulin observed in cases only.
SERPINE1 haplotypes explained about 3.5% of the vari-ability of PAI-1 levels, which is similar to that observed in theFramingham Heart Study.34 The present study confirmedresults from this latter study by demonstrating that otherpolymorphisms located outside the SERPINE1 promoterinfluence PAI-1 levels, but this is in disagreement with resultsfrom the study of Ding et al35 which exclusively observed aneffect of the �675 4G/5G polymorphism. The analysis heresuggested that the observed haplotype effects were attribut-able to the combined effects of 3 SNPs, �844A�G,rs2227666, and rs2227694. In the Framingham Heart Study,it was impossible to distinguish which of the 2 poly-morphisms (A�844G and �675 4G/5G) was responsible forthe association with PAI-1 levels. In the present study, thedata suggest that the effect of the �675 4G/5G polymorphismobserved in univariate analysis was the consequence of its LDwith the �844A�G. In view of the results of the Framing-ham Heart Study,34 2 others polymorphisms, rs6465787 andrs2227692, were also found associated with PAI-1 plasmalevels. The rs6465787 SNP was not genotyped in our studybecause of its minor allele frequency (2%, 34) and itscomplete LD with the �844A�G, which meant it would beimpossible to distinguish its potential effect on PAI-1 levelsfrom that of the �844A�G SNP. The rs2227692 was notgenotyped in our study as it is completely tagged by thers2227667 and rs2227672 SNPs, the rs2227692-T allelebeing equivalent to the haplotype defined by the rs2227667-Gand rs2227672-G alleles (see HapMap database at www.hapmap.org).
It is to note that, because of the LD among the 9 SNPsstudied, a standard Bonferroni correction for multiple testingwould not be appropriate because it would have been tooconservative. Using the method proposed by Li and Ji,46 thenumber of independent components underlying the LD struc-
ture of the set of SNPs was estimated to be 7. Correcting forthis number, which corresponds to consider significant anyprobability value �0.007 should be considered as significant,would not have altered the main conclusions of our analyses.
ConclusionsSERPINE1 haplotypes are not associated with the risk of MIin the overall cohort. However, they are mildly associatedwith plasma levels of PAI-1 and with the risk of MI innonsmokers. They are also mildly associated with insulinlevels and BMI. Six SNPs are associated with these differentclinical and biological phenotypes, suggesting that modifica-tions of SERPINE1 expression involved in these processesare regulated via different pathways. Besides, our haplotypeanalysis suggested that among the 2 promoter polymorphismsrs2227631 (�844A�G) and rs1799889 (�675 4G/5G)which are in tight LD, the former associated with MI, is morelikely to be associated with PAI-1 levels.
AppendixHIFMECH InvestigatorsStockholm: A. Hamsten (coordinator), S. Boquist, C.G. Ericsson, P.Lundman, A. Samnegard, A. Silveira, P. Tornvall; London: J.S.Yudkin, V. Mohamed-Ali, A. Holmes; Marseille: I. Juhan-Vague,M.F. Aillaud, P.E. Morange, M.C. Alessi, P. Ambrosi, I. Canavy. F.Paganelli, R. Didelot, J. Ansaldi, M. Billerey; San Giovanni Ro-tondo: G. Di Minno, M. Margaglione, D. Cimino, N. Dello Iacono,A. Cimino, G. Gaeta, C. Blasich, G. Pucciarelli; London: S.E.Humphries; Leiden: V. van Hinsbergh, T. Kooistra; Milan: E.Tremoli, C. Banfi, L. Mussoni.
Sources of FundingThe HIFMECH Study was also supported by the EuropeanCommission (BMH4-CT96–0272), the Swedish Medical Re-search Council, the Swedish Heart-Lung Foundation, IN-SERM, and Universite de la Mediterranee (INSERM U626),Fondation pour la Recherche Medicale (FRM) and Pro-gramme Hospitalier de Recherche Clinique (PHRC 1996).Steve Humphries is supported by the British Heart Founda-tion (RG2005/014).
DisclosuresNone.
References1. Lijnen HR, Collen D. Mechanisms of physiological fibrinolysis. Bail-
lieres Clin Haematol. 1995;8:277–290.2. Dellas C, Loskutoff DJ. Historical analysis of PAI-1 from its discovery to its
potential role in cell motility and disease. Thromb Haemost. 2005;93:631–640.3. Lijnen HR. Pleiotropic functions of plasminogen activator inhibitor-1.
J Thromb Haemost. 2005;3:35–45.4. Sobel BE. Increased plasminogen activator inhibitor-1 and vasculopathy.
A reconcilable paradox. Circulation. 1999;99:2496–2498.5. Kohler HP, Grant PJ. Plasminogen-activator inhibitor type 1 and coronary
artery disease. N Engl J Med. 2000;342:1792–1801.6. Sobel BE, Taatjes DJ, Schneider DJ. Intramural plasminogen activator
inhibitor type-1 and coronary atherosclerosis. Arterioscler Thromb VascBiol. 2003;23:1979–1989.
7. Hamsten A, de Faire U, Walldius G, Dahlen G, Szamosi A, Landou C,Blomback M, Wiman B. Plasminogen activator inhibitor in plasma: Riskfactor for recurrent myocardial infarction. Lancet. 1987;2:3–9.
8. Juhan-Vague I, Pyke SDM, Alessi MC, Jespersen J, Haverkate F,Thompson SG. Fibrinolytic factors and the risk of myocardial infarctionor sudden death in patients with angina pectoris. Circulation. 1996;94:2057–2063.
2256 Arterioscler Thromb Vasc Biol. October 2007
by guest on December 8, 2015http://atvb.ahajournals.org/Downloaded from

9. Thogersen AM, Jansson JH, Boman K, Nilsson TK, Weinehall L,Huhtasaari F, Hallmans G. High plasminogen activator inhibitor andtissue plasminogen activator levels in plasma precede a first acute myo-cardial infarction in both men and women: evidence for the fibrinolyticsystem as an independent primary risk factor. Circulation. 1998;98:2241–2247.
10. Collet JP, Montalescot G, Vicaut E, Ankri A, Walylo F, Lesty C,Choussat R, Beygui F, Borentain M, Vignolles N, Thomas D. Acuterelease of plasminogen activator inhibitor-1 in ST-segment elevationmyocardial infarction predicts mortality. Circulation. 2003;108:391–394.
11. Smith A, Patterson C, Yarnell J, Rumley A, Ben-Shlomo Y, Lowe G.Which hemostatic markers add to the predictive value of conventionalriskfactors for coronary heart disease and ischemic stroke? The Caer-philly Study. Circulation. 2005;112:3080–3087.
12. Salomaa V, Riley W, Kark JD, Nardo C, Folsom AR. Non-insulin-dependent diabetes mellitus and fasting glucose and insulin concen-trations are associated with arterial stiffness indexes. The ARIC Study.Circulation. 1995;91:1432–1443.
13. Bavenholm P, de Faire U, Landou C, Efendic S, Nilsson J, Wiman B,Hamsten A. Progression of coronary artery disease in young male post-infarction patients is linked to disturbances of carbohydrate andlipoprotein metabolism and to impaired fibrinolytic function. Eur Heart J.1998;19:402–410.
14. Folsom AR, Pankow JS, Williams RR, Evans GW, Province MA,Eckfeldt JH. Fibrinogen, plasminogen activator inhibitor-1, and carotidintima-media wall thickness in the NHLBI Family Heart Study. ThrombHaemost. 1998;79:400–404.
15. de Maat MP, Bladbjerg EM, Drivsholm T, Borch-Johnsen K, Moller L,Jespersen J. Inflammation, thrombosis and atherosclerosis: results of theGlostrup study. J Thromb Haemost. 2003;1:950–957.
16. Anand SS, Yi Q, Gerstein H, Lonn E, Jacobs R, Vuksan V, Teo K, DavisB, Montague P, Yusuf S. Study of Health Assessment and Risk in EthnicGroups; Study of Health Assessment and Risk Evaluation in AboriginalPeoples Investigators. Relationship of metabolic syndrome andfibrinolytic dysfunction to cardiovascular disease. Circulation. 2003;108:420–425.
17. Festa A, D’Agostino R Jr, Tracy RP, Haffner SM. Insulin ResistanceAtherosclerosis Study. Elevated levels of acute-phase proteins and plas-minogen activator inhibitor-1 predict the development of type II diabetes:the insulin resistance atherosclerosis study. Diabetes. 2002;51:1131–1137.
18. Festa A, Williams K, Tracy RP, Wagenknecht LE, Haffner SM. Pro-gression of plasminogen activator inhibitor-1 and fibrinogen levels inrelation to incident type II diabetes. Circulation. 2006;113:1753–1759.
19. Meigs JB, O’donnell CJ, Tofler GH, Benjamin EJ, Fox CS, Lipinska I,Nathan DM, Sullivan LM, D’Agostino RB, Wilson PW. Hemostaticmarkers of endothelial dysfunction and risk of incident type 2 diabetes:the Framingham Offspring Study. Diabetes. 2006;55:530–537.
20. Kanaya AM, Wassel Fyr C, Vittinghoff E, Harris TB, Park SW, Good-paster BH, Tylavsky F, Cummings SR. Adipocytokines and incidentdiabetes mellitus in older adults: the independent effect of plasminogenactivator inhibitor 1. Arch Intern Med. 2006;166:350–356.
21. Dawson SJ, Wiman B, Hamsten A, Green F, Humphries S, Henney AM.The two allele sequences of a common polymorphism in the promoter oftheplasminogen activator inhibitor-1 (PAI-1) gene respond differently tointerleukin-1 in HepG2 cells. J Biol Chem. 1993;268:10739–10745.
22. Henry M, Chomiki N, Scarabin PY, Alessi MC, Peiretti F, Arveiler D,Ferrieres J, Evans A, Amouyel P, Poirier O, Cambien F, Juhan-Vague I.Five frequent polymorphisms of the PAI-1 gene: lack of associationbetween genotypes, PAI activity, and triglyceride levels in a healthypopulation. Arterioscler Thromb Vasc Biol. 1997;17:851–858.
23. Lopes C, Dina C, Durand E, Froguel P. PAI-1 polymorphisms modulatephenotypes associated with the metabolic syndrome in obese and diabeticCaucasian population. Diabetologia. 2003;46:1284–1290.
24. Eriksson P, Kallin B, van ’t Hooft FM, Bavenholm P, Hamsten A.Allele-specific increase in basal transcription of the plasminogen-activa-torinhibitor 1 gene is associated with myocardial infarction. Proc NatlAcad Sci U S A. 1995;92:1851–1855.
25. Boekholdt SM, Bijsterveld NR, Moons AH, Levi M, Buller HR, PetersRJ. Genetic variation in coagulation and fibrinolytic proteins and theirrelation with acute myocardial infarction: a systematic review. Circulation.2001;104:3063–3068.
26. Juhan-Vague I, Morange PE, Aubert H, Henry M, Aillaud MF, AlessiMC, Samnegard A, Hawe E, Yudkin J, Margaglione M, Di Minno G,
Hamsten A, Humphries SE; HIFMECH Study Group. Plasma thrombin-activatable fibrinolysis inhibitor antigen concentration and genotype inrelation to myocardial infarction in the north and south of Europe. Arte-rioscler Thromb Vasc Biol. 2002;22:867–873.
27. Panahloo A, Mohamed-Ali V, Lane A, Green F, Humphries SE, YudkinJS. Determinants of plasminogen activator inhibitor 1 activity in treatedNIDDM and its relation to a polymorphism in the plasminogen activatorinhibitor 1 gene. Diabetes. 1995;44:37–42
28. Mansfield MW, Stickland MH, Grant PJ. Environmental and geneticfactors in relation to elevated circulating levels of plasminogen activatorinhibitor-1 in Caucasian patients with non-insulin-dependent diabetesmellitus. Thromb Haemost. 1995;74:842–847.
29. Hoffstedt J, Andersson IL, Persson L, Isaksson B, Arner P. The common�675 4G/5G polymorphism in the plasminogen activator inhibitor�1gene isstrongly associated with obesity. Diabetologia. 2002;45:584–587.
30. McCormack LJ, Nagi DK, Stickland MH, Mansfield MW, Mohamed-AliV, Yudkin JS, Knowler WC, Grant PJ. Promoter (4G/5G) plasminogenactivator inhibitor-1 genotype in Pima Indians: relationship to plasmino-gen activator inhibitor-1 levels and features of the insulin resistancesyndrome. Diabetologia. 1996;39:1512–1518.
31. Viitanen L, Pihlajamaki J, Halonen P, Lehtonen M, Kareinen A, Lehto S,Laakso M. Association of angiotensin converting enzyme and plasmino-gen activatorinhibitor-1 promoter gene polymorphisms with features ofthe insulin resistance syndrome in patients with premature coronary heartdisease. Atherosclerosis. 2001;157:57–64.
32. Freeman MS, Mansfield MW. The common �675 4G/5G polymorphismin the plasminogen activator inhibitor-1 gene is strongly associated withobesity. Diabetologia. 2002;45:1602–1603.
33. Grubric N, Stegnar M, Peternel P, Kaider A, Binder BR. A novel G/A andthe 4G/5G polymorphism within the promoter the plasminogen activatorinhibitor-1 gene in patients with deep vein thrombosis. Thromb Res.1996;84:431–443.
34. Kathiresan S, Gabriel SB, Yang Q, Lochner AL, Larson MG, Levy D,Tofler GH, Hirschhorn JN, O’Donnell CJ. Comprehensive survey ofcommon genetic variation at the plasminogen activator inhibitor-1 locusand relations to circulating plasminogen activator inhibitor-1 levels.Circulation. 2005;112:1728–1735.
35. Ding J, Nicklas BJ, Fallin MD, de Rekeneire N, Kritchevsky SB, PahorM, Rodondi N, Li R, Zmuda JM, Harris TB. Plasminogen activatorinhibitor type 1 gene polymorphisms and haplotypes are associated withplasma plasminogen activator inhibitor type 1 levels but not with myo-cardial infarction or stroke. Am Heart J. 2006;152:1109–1115.
36. Su S, Chen S, Zhao J, Huang J, Wang X, Chen R, Gu D. Plasminogenactivator inhibitor-1 gene: selection of tagging single nucleotide poly-morphisms and association with coronary heart disease. ArteriosclerThromb Vasc Biol. 2006;26:948–954.
37. Mohamed-Ali V, Gould MM, Gillies S, Goubet S, Yudkin JS, Haines AP.Association of proinsulin-like molecules with lipids and fibrinogen innon-diabetic subjects evidence against a modulating role for insulin.Diabetologia. 1995;38:1110–1116.
38. Tregouet D, Garelle V. A new JAVA interface implementation ofTHESIAS: Testing haplotype effects in association studies. Bioinformatics.In press.
39. Tregouet DA, Escolano S, Tiret L, Mallet A, Golmard JL. A newalgorithm for haplotype-based association analysis: the SEM algorithm.Ann Hum Genet. 2004;68:165–177.
40. Nei M. Molecular Evolutionary Genetics. New York, NY: ColumbiaUniversity Press; 1987.
41. Tregouet DA, Ricard S, Nicaud V, Arnould I, Soubigou S, Rosier M,Duverger N, Poirier O, Mace S, Kee F, Morrison C, Denefle P, Tiret L,Evans A, Deleuze JF, Cambien F. In depth haplotype analysis of ABCA1gene polymorphisms in relation to plasma ApoA1 levels and myocardialinfarction. Arterioscler Thromb Vasc Biol. 2004;24:775–781.
42. Pearce E, Tregouet DA, Samnegard A, Morgan AR, Cox C, Hamsten A,Eriksson P, Ye S. Haplotype effect of the matrix metalloproteinase-1 geneon risk of myocardial infarction. Circ Res. 2005;97:1070–1076.
43. Paul SR, Donner A. A comparison of tests of homogeneity of odds rationin k 2x2 tables. Stat Med. 1989;8:1455–1468.
44. Lang IM, Marsh JJ, Olman MA, Moser KM, Loskutoff DJ, Schleef RR.Expression of type 1 plasminogen activator inhibitor in chronic pulmo-nary thromboemboli. Circulation. 1994;89:2715–2721.
45. Alessi MC, Juhan-Vague I. PAI-1 and the metabolic syndrome: links, causes,and consequences. Arterioscler Thromb Vasc Biol. 2006;26:2200–2207.
46. Li J, Ji L. Adjusting multiple testing in multilocus analysis using theeigenvalues of a correlation matrix. Heredity. 2005;95:221–227.
Morange et al SERPINE1 Haplotypes and Myocardial Infarction 2257
by guest on December 8, 2015http://atvb.ahajournals.org/Downloaded from

Online Supplemental Tables I. General characteristics of the HIFMECH population Variables Controls
N = 543 Cases
N = 510 P
Age (years) 51.57 (5.46) 51.91 (5.44) - BMI (kg m-2) 26.41 (3.26) 27.21 (3.48) p<10-4
Diabetes 0% 11.3% p<10-4
Systolic blood pressure (mmHg) 128.9 (14.85) 129.2 (17.27) p = 0.73
Diastolic blood pressure (mmHg) 84.04 (8.48) 81.89 (10.12) p<10-3
Smoking (1) 61.5% 81.9% p<10-4
Cholesterol (mmol L-1) 5.53 (0.98) 5.42 (1.17) p = 0.12 Triglycerides (mmol L-1) (2) 1.57 (0.77) 2.06 (1.01) p<10-4
Insulin (pmol L-1) 45.01 (30.42) 60.10 (44.30) p<10-4
PAI-1 (ng mL-1) (2) 29.48 (22.50) 40.10 (28.46) p<10-4
Fibrinogen (mg dL-1) 345.1 (72.6) 376.0 (91.3) p<10-4
Values (SD) are given. BMI: Body Mass Index (1) Percentage of current or ex smokers (2) Test performed on log-transformed values

II. Allele frequencies distribution of the nine PAI-1 gene polymorphisms in controls subjects of the HIFMECH study (N = 543)
Polymorphisms North (N = 222)
South (N = 321)
rs2227631 (A>G) 0.576 / 0.424 0.557 / 0.443 rs1799889 (4G>5G) 0.521 / 0.479 0.519 / 0.481
rs6092 (Ala>Thr) 0.878 / 0.122 0.874 / 0.126 rs2227666 (G>A) 0.944 / 0.056 0.949 / 0.051 rs2227667 (A>G) 0.826 / 0.174 0.722 / 0.278 rs2227672 (G>T) 0.867 / 0.133 0.832 / 0.168 rs2227683 (G>A) 0.751 / 0.249 0.823 / 0.177 rs2227694 (G>A) 0.850 / 0.150 0.875 / 0.125
rs7242 (T>G) 0.574 / 0.426 0.573 / 0.427

III. Linkage disequilibrium, expressed in terms of D', between PAI-1 gene polymorphisms in the HIFMECH study
South / Control rs2227631 rs1799889 rs6092 rs2227666 rs2227667 rs2227672 rs2227683 rs2227694
rs2227631 1 **** **** **** **** **** NS * rs1799889 0.9785 1 **** **** **** **** **** NS
rs6092 0.9233 0.9096 1 NS **** **** *** ** rs2227666 -1.0000 -1.0000 -1.0000 1 NS NS *** NS rs2227667 0.8300 0.7879 0.9579 -1.0000 1 **** **** **** rs2227672 0.8074 0.7746 0.9519 -0.9993 1.0000 1 **** ** rs2227683 0.1446 0.4697 -1.0000 -1.0000 -1.0000 -1.0000 1 **** rs2227694 0.2702 0.2020 -1.0000 -1.0000 -1.0000 -0.9999 -1.0000 1
rs7242 -0.8267 -0.8558 -0.9250 0.9117 -0.9135 -0.9520 -1.0000 -1.0000 South / Cases
rs2227631 rs1799889 rs6092 rs2227666 rs2227667 rs2227672 rs2227683 rs2227694 rs2227631 1 **** **** ** **** **** * NS rs1799889 -0.9835 1 **** *** **** **** **** NS
rs6092 1.0000 -1.0000 1 NS **** **** ** NS rs2227666 -1.0000 1.0000 -1.0000 1 * NS NS NS rs2227667 0.9686 -0.9620 0.9715 -1.0000 1 **** **** *** rs2227672 0.9379 -0.9254 0.9565 -1.0000 1.0000 1 *** * rs2227683 0.1895 0.5195 -1.0000 -1.0000 -0.9999 -1.0000 1 *** rs2227694 0.1941 -0.1311 -1.0000 -1.0000 -1.0000 -1.0000 -1.0000 1
rs7242 -0.9075 0.8925 -0.9133 1.0000 -0.9729 -1.0000 -1.0000 -1.0000 North / Controls
rs2227631 rs1799889 rs6092 rs2227666 rs2227667 rs2227672 rs2227683 rs2227694 rs2227631 1 **** **** *** **** **** **** NS rs1799889 0.9890 1 **** *** **** **** **** NS
rs6092 1.0000 1.0000 1 * **** **** ** ** rs2227666 -1.0000 -1.0000 -1.0000 1 * * * * rs2227667 0.9668 0.9593 0.9263 -1.0000 1 **** **** ** rs2227672 0.9566 0.9479 0.9336 -1.0000 0.9777 1 ** ** rs2227683 0.4121 0.8084 -1.0000 -1.0000 -0.9999 -0.7931 1 *** rs2227694 -0.1576 -0.1930 -1.0000 -1.0000 -1.0000 -1.0000 -1.0000 1
rs7242 -0.8547 -0.8677 -0.9113 1.0000 -0.9438 -0.9228 -1.0000 -1.0000 North / Cases
rs2227631 rs1799889 rs6092 rs2227666 rs2227667 rs2227672 rs2227683 rs2227694 rs2227631 1 **** **** *** **** **** ** NS rs1799889 0.9771 1 **** **** **** **** **** NS
rs6092 1.0000 1.0000 1 * **** **** *** * rs2227666 -0.8733 -0.8893 -1.0000 1 ** * NS ** rs2227667 1.0000 1.0000 0.9677 -1.0000 1 **** **** *** rs2227672 1.0000 1.0000 0.9716 -1.0000 1.0000 1 *** ** rs2227683 0.2919 0.6658 -1.0000 -1.0000 -1.0000 -1.0000 1 **** rs2227694 0.0912 0.0823 -1.0000 -1.0000 -1.0000 -1.0000 -1.0000 1
rs7242 -0.8313 -0.8750 -1.0000 1.0000 -1.0000 -1.0000 -0.9344 -1.0000 D' values are given in the lower-left part of the LD matrix with corresponding p-values given in the upper-right part . ***: p <10-3; **: p < 10-2; * p <0.05; NS: Not Significant
3

IV. Association of SERPINE1 polymorphisms with MI in the HIFMECH study
Polymorphisms Allele frequency Allelic Association
Controls N = 543
Cases N = 510
rs2227631 (A>G) 0.564 / 0.436 0.572 / 0.428 p = 0.73 rs1799889 (4G>5G) 0.520 / 0.480 0.518 / 0.482 p = 0.94 rs6092 (Ala>Thr) 0.875 / 0.125 0.901 / 0.099 p = 0.07 rs2227666 (G>A) 0.947 / 0.053 0.954 / 0.046 p = 0.44 rs2227667 (A>G) 0.764 / 0.236 0.783 / 0.217 p = 0.30 rs2227672 (G>T) 0.847 / 0.153 0.870 / 0.130 p = 0.13 rs2227683 (G>A) 0.794 / 0.206 0.777 / 0.223 p = 0.33 rs2227694 (G>A) 0.865 / 0.135 0.874 / 0.126 p = 0.55 rs7242 (T>G) 0.574 / 0.426 0.576 / 0.424 p = 0.91
4

5
V. Association between PAI-1 gene polymorphisms with MI according to smoking NonSmokers Smokers
Polymorphisms Controls N = 200
Cases N = 87
Allelic Association
Controls N = 319
Cases N = 391
AAs
rs2227631 (A/G) 0.565 / 0.435 0.656 / 0.344 p = 0.03 0.564 / 0.436 0.554 / 0.446 p
rs1799889 (4G/5G) 0.519 / 0.481 0.572 / 0.428 p = 0.23 0.520 / 0.480 0.506 / 0.494 p
rs6092 (Ala/Thr) 0.879 / 0.121 0.928 / 0.072 p = 0.08 0.873 / 0.127 0.895 / 0.105 p
rs2227666 (G/A) 0.954 / 0.046 0.920 / 0.080 p = 0.11 0.943 / 0.057 0.962 / 0.038 p
rs2227667 (A/G) 0.756 / 0.244 0.794 / 0.206 p = 0.31 0.769 / 0.231 0.780 / 0.220 p
rs2227672 (G/T) 0.866 / 0.134 0.888 / 0.112 p = 0.46 0.834 / 0.166 0.866 / 0.134 p
rs2227683 (G/A) 0.809 / 0.191 0.847 / 0.153 p = 0.28 0.785 / 0.215 0.762 / 0.238 p
rs2227694 (G/A) 0.850 / 0.150 0.867 / 0.133 p = 0.59 0.875 / 0.125 0.875 / 0.125 p
rs7242 (T/G) 0.589 / 0.411 0.494 / 0.506 p = 0.04 0.563 / 0.437 0.593 / 0.407 p

VI. Association between PAI-1 gene polymorphisms and PAI-1 levels in the HIFMECH study according to case-control status
Controls Cases Polymorphisms Genotype(a) Genotype
11 12 22 R2 Test(b) 11 12 22 R2 Test N = 148 N = 244 N = 82 N = 145 N = 234 N = 82 2.43% p = 0.004 rs2227631
(A/G) 31.97 (24.03) 29.19 (22.80) 26.25 (18.58) 0.48% p = 0.319 45.72 (28.28) 38.95 (30.35) 33.59 (21.04) N = 124 N = 254 N = 96 N = 120 N = 236 N = 105 1.77% p = 0.017 rs1799889
(4G/5G) 31.44 (24.54) 30.36 (22.94) 24.96 (18.11) 0.88% p = 0.121 45.25 (27.56) 40.28 (31.57) 33.91 (20.11) N = 359 N = 109 N = 4 N = 371 N = 87 N = 2 0.59% p = 0.260 rs6092
(Ala/Thr) 30.73 (23.82) 26.13 (18.05) 17.47 (5.29) 0.77% p = 0.163 41.06 (29.30) 35.68 (24.65) 25.00 (8.63) N = 414 N = 52 N = 1 N = 414 N = 38 N = 2 0.84% p = 0.150 rs2227666
(G/A) 28.97 (22.20) 35.53 (25.76) 12.40 0.85% p = 0.137 39.37 (28.31) 47.11 (31.65) 65.55 (15.91) N = 268 N = 183 N = 21 N = 275 N = 168 N = 17 1.09% p = 0.082 rs2227667
(A/G) 31.09 (25.29) 28.09 (18.49) 20.24 (8.22) 0.63% p = 0.228 42.74 (30.85) 37.40 (24.87) 27.01 (16.37) rs N = 319 N = 131 N = 7 N = 333 N = 114 N = 1 0.57% p = 0.279 rs2227672
(G/T) 31.33 (24.44) 26.13 (18.66) 19.24 (5.77) 0.89% p = 0.132 41.86 (29.63) 36.28 (25.71) 31.10 N = 308 N = 144 N = 18 N = 283 N = 147 N = 28 0.31% p = 0.498 rs2227683
(G/A) 28.48 (21.19) 31.72 (25.11) 31.77 (25.91) 0.31% p = 0.480 40.77 (28.69) 38.79 (26.43) 38.75 (36.41) N = 351 N = 119 N = 2 N = 351 N = 102 N = 6 0.19% p = 0.645 rs2227694
(G/A) 29.06 (21.40) 31.59 (25.83) 16.00 (7.21) 0.23% p = 0.588 39.37 (27.25) 42.36 (32.01) 34.07 (22.51) N = 132 N = 261 N = 77 N = 139 N = 236 N = 72 1.37% p = 0.047 rs7242 (T/G) 28.24 (22.35) 30.35 (22.46) 29.60 (23.87) 0.17% p = 0.675 35.15 (24.94) 41.79 (30.93) 43.99 (27.50)
Mean (STD) (a) 1 for common allele and 2 for rare allele (b) Test of genotypic association (df = 2) performed on square-rooted values adjusted for age, alcohol, smoking, and centre The test for homogeneity of the allele effects between controls and cases were not significant (p = 0.206, p = 0.421, p = 0.977, p = 0.786, p = 0.438, p = 0.921, p = 0.193, p = 0.950 and p = 0.168, respectively)
6

7

VII. Association between main PAI-1 haplotypes and PAI-1 in the HIFMECH study
Polymorphisms Haplotype phenotypic mean rs2227631
(A/G) rs1799889(4G/5G)
rs6092 (Ala/Thr)
rs2227666 (G/A)
rs2227667(A/G)
rs2227672(G/T)
rs2227683(G/A)
rs2227694(G/A)
rs7242(T/G)
Pooled N = 948
Controls N = 479
Cases N = 469
A 4G Ala G A G G G G 2.808 [2.656 – 2.961]
2.493 [2.302 – 2.684]
3.135 [2.896 – 3.374]
A 4G Ala G A G G A T 3.288 [2.925 – 3.652]
3.203 [2.768 – 3.639]
3.331 [2.739 – 3.922]
A 4G Ala G A G A G T 2.936 [2.385 – 3.487]
2.896 [2.009 – 3.783]
2.947 [2.223 – 3.671]
A 4G Ala A A G G G G 3.222 [2.846 – 3.598]
3.019 [2.560 – 3.478]
3.590 [2.987 – 4.192]
A 5G Ala G A G A G T 2.938 [2.493 – 3.383]
2.477 [1.818 – 3.136]
3.216 [2.598 – 3.835]
G 5G Ala G G G G G T 2.588 [2.270 – 2.906]
2.474 [2.020 – 2.928]
2.633 [2.190 – 3.076]
G 5G Ala G A G G A T 2.448 [1.991 – 2.904]
2.143 [1.544 – 2.742]
2.904 [2.286 – 3.523]
G 5G Ala G A G A G T 2.738 [2.472 – 3.004]
2.777 [2.474 – 3.080]
2.716 [2.270 – 3.162]
G 5G Thr G G T G G T 2.375 [2.057 – 2.692]
2.212 [1.800 – 2.623]
2.651 [2.175 – 3.127]
Global test of association χ2 = 21.06 with 8 df,p = 0.007
χ2 = 15.34 with 8 df,p = 0.053
χ2 = 13.01 with 8 df, p = 0.111
Unadjusted square rooted PAI-1 mean associated with one dose of each haplotype. Tests were performed on square rooted values adjusted for age, smoking, population and case/controls status where appropriate. PAI gene haplotypes explained 3.8% and 3.1% of the variability of PAI-1 levels in the controls and cases, respectively, similarly in North and South
8

VIII. Association between PAI-1 gene polymorphisms and insulin levels in the HIFMECH study (N = 780)
Controls Cases Polymorphism Genotype(a) Genotype
11 12 22 R2 Test(b) 11 12 22 R2 Test N = 126 N = 210 N = 72 N = 120 N = 173 N = 67 1.39% p = 0.079 rs2227631
(A/G) 41.87 (27.52) 46.83 (31.01) 46.38 (34.23) 0.88% p = 0.168 68.04 (54.34) 55.95 (40.69) 57.93 (31.54) N = 104 N = 219 N = 86 N = 98 N = 179 N = 83 0.82% p = 0.225 rs1799889
(4G/5G) 40.27 (27.40) 47.61 (31.08) 44.80 (32.54) 1.41% p = 0.056 66.64 (51.97) 58.07 (45.27) 57.84 (31.33) N = 317 N = 88 N = 2 N = 294 N = 67 N = 1 1.10% p = 0.133 rs6092
(Ala/Thr) 44.18 (30.14) 48.43 (32.31) 31.96 (24.19) 0.77% p = 0.210 58.46 (43.60) 66.35 (45.85) 48.28 N = 357 N = 44 N = 1 N = 317 N = 38 N = 2 0.45% p = 0.448 rs2227666
(G/A) 45.24 (31.09) 46.36 (28.54) 49.17 0.12% p = 0.793 60.96 (45.83) 52.77 (28.00) 80.36 (2.15) N = 244 N = 149 N = 14 N = 230 N = 117 N = 14 1.13% p = 0.129 rs2227667
(A/G) 44.88 (34.09) 46.98 (25.22) 33.58 (10.93) 1.22% p = 0.084 59.95 (46.47) 59.57 (33.76) 50.64 (45.10) rs N = 285 N = 107 N = 4 N = 272 N = 82 N = 1 0.26% p = 0.625 rs2227672
(G/T) 44.65 (32.65) 45.28 (22.31) 31.76 (13.97) 0.82% p = 0.196 59.47 (44.39) 62.40 (44.79) 48.28 N = 253 N = 135 N = 18 N = 214 N = 124 N = 20 1.54% p = 0.062 rs2227683
(G/A) 43.24 (27.30) 48.18 (35.81) 47.27 (32.53) 0.35% p = 0.492 63.42 (47.63) 55.92 (41.12) 53.64 (27.75) N = 286 N = 116 N = 5 N = 271 N = 82 N = 6 1.37% p = 0.084 rs2227694
(G/A) 46.04 (31.09) 44.03 (29.93) 30.72 (10.29) 0.35% p = 0.492 62.22 (46.29) 55.88 (38.95) 33.73 (15.90) N = 127 N = 218 N = 62 N = 109 N = 178 N = 65 2.49% p = 0.012 rs7242
(T/G) 43.86 (26.03) 47.48 (33.52) 40.34 (28.24) 0.87% p = 0.172 51.43 (31.68) 60.55 (44.22) 72.31 (58.20) Mean (STD) (a) 1 for common allele and 2 for rare allele (b) Test of genotypic association (df = 2) performed on log-transformed values adjusted for age, alcool, smoking, and center The tests for homogeneity of genotypic associations between cases and controls were significant for rs2227631 (p = 0.021), rs1799889 (p = 0.017), rs2227683 (p = 0.039) and rs7242 (p = 0.013) polymorphisms.
9

IXa. Haplotype analysis of the rs2227631, rs6092, rs2227683 and rs7242 polymorphisms with insulin levels according to case-control status
Polymorphisms Controls N = 414 Cases
N = 350
rs2227631 rs6092 rs2227683 rs7242 Haplotype frequency Phenotypic mean [95%CI] Haplotype
frequency Phenotypic mean [95%CI]
A Ala G G 0.389 1.781 [1.724 - 1.839] 0.419 2.018 [1.957 - 2.079]
A Ala G T 0.094 1.819 [1.657 - 1.981] 0.063 1.886 [1.715 - 2.057]
A Ala A T 0.081 1.867 [1.684 - 2.050] 0.092 1.842 [1.654 - 2.030]
G Ala G T 0.171 1.797 [1.685 - 1.910] 0.167 1.829 [1.706 - 1.952]
G Thr G T 0.100 1.882 [1.729 - 2.035] 0.100 2.0850 [1.902 - 2.268]
G Ala A T 0.131 1.878 [1.762 - 1.995] 0.134 1.814 [1.686 - 1.943]
10
IXb. Haplotype analysis of the rs1799889, rs6092 and rs7242 polymorphisms in relation to insulin levels according to case-control status
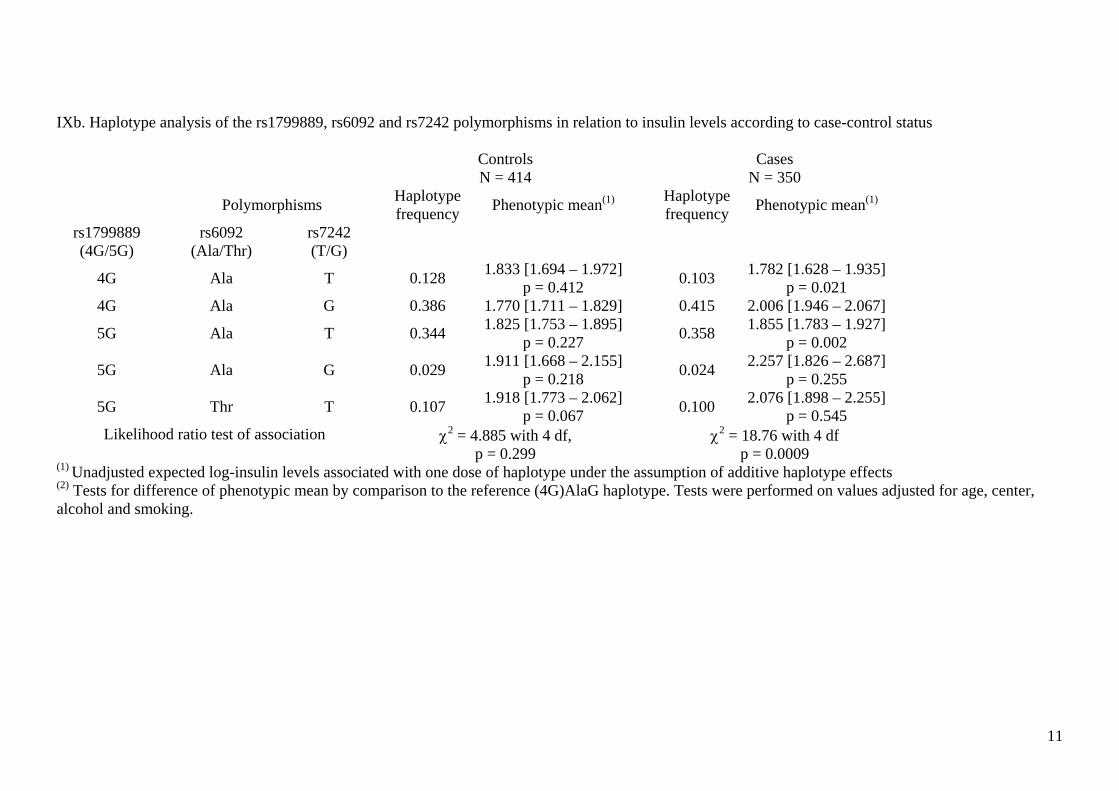
Controls N = 414
Cases N = 350
Polymorphisms Haplotype frequency Phenotypic mean(1) Haplotype
frequency Phenotypic mean(1)
rs1799889 (4G/5G)
rs6092 (Ala/Thr)
rs7242 (T/G)
4G Ala T 0.128 1.833 [1.694 – 1.972] p = 0.412 0.103 1.782 [1.628 – 1.935]
p = 0.021 4G Ala G 0.386 1.770 [1.711 – 1.829] 0.415 2.006 [1.946 – 2.067]
5G Ala T 0.344 1.825 [1.753 – 1.895] p = 0.227 0.358 1.855 [1.783 – 1.927]
p = 0.002
5G Ala G 0.029 1.911 [1.668 – 2.155] p = 0.218 0.024 2.257 [1.826 – 2.687]
p = 0.255
5G Thr T 0.107 1.918 [1.773 – 2.062] p = 0.067 0.100 2.076 [1.898 – 2.255]
p = 0.545 Likelihood ratio test of association χ2 = 4.885 with 4 df,
p = 0.299 χ2 = 18.76 with 4 df p = 0.0009
(1) Unadjusted expected log-insulin levels associated with one dose of haplotype under the assumption of additive haplotype effects (2) Tests for difference of phenotypic mean by comparison to the reference (4G)AlaG haplotype. Tests were performed on values adjusted for age, center, alcohol and smoking.
11

Xa. Haplotype analysis of the rs1799889, rs6092 and rs7242 polymorphisms in relation with BMI according to case-control status
Controls N = 524
Cases N = 473
Polymorphisms Haplotype frequency Phenotypic mean(1) Haplotype
frequency Phenotypic mean(1)
rs1799889 (4G/5G)
rs6092 (Ala/Thr)
rs7242 (T/G)
4G Ala T 0.121 1.634 [1.613 – 1.655] p = 0.756 0.117 1.644 [1.619 – 1.669]
p = 0.575
4G Ala G 0.396 1.634 [1.622 – 1.645] p = 0.787 0.399 1.657 [1.645 – 1.669]
p = 0.023 5G Ala T 0.334 1.631 [1.618 – 1.643 0.360 1.634 [1.623 – 1.646]
5G Ala G 0.025 1.632 [1.573 – 1.691] p = 0.954 0.021 1.674 [1.613 – 1.735]
p = 0.245
5G Thr T 0.119 1.637 [1.615 – 1.659] p = 0.621 0.100 1.664 [1.639 – 1.689]
p = 0.047 Likelihood ratio test of association χ2 = 0.265 with 4 df,
p = 0.992 χ2 = 7.699 with 4 df p = 0.103
(1) Unadjusted expected log-BMI associated with one dose of haplotype under the assumption of additive haplotype effects (2) Tests for difference of phenotypic mean by comparison to the (5G)AlaT haplotype. Tests were performed on values adjusted for age, center, alcohol and smoking.
12

Xb. SERPINE1 haplotype analysis of the rs6092 and rs7242 polymorphisms in relation to BMI according to case-control status
Controls N = 524
Cases N = 473
Polymorphisms Haplotype frequency Phenotypic mean(1) Haplotype
frequency Phenotypic mean(1)
rs6092 (Ala/Thr)
rs7242 (T/G)
Ala T 0.455 1.632 [1.622 – 1.642] 0.478 1.636 [1.626 – 1.646]
Ala G 0.420 1.634 [1.623 – 1.644] (2) p = 0.895 0.420 1.658 [1.646 – 1.669]
(2) p = 0.027
Thr T 0121 1.634 [1.613 – 1.655] (2) p = 0.847 0.100 1.665 [1.640 – 1.690]
(2) p = 0.042 Likelihood ratio test of
association χ2 = 0.043 with 2 df,
p = 0.979 χ2 = 7.518 with 2 df p = 0.023
(1) Unadjusted expected log-BMI associated with one dose of haplotype under the assumption of additive haplotype effects (2) Tests for difference of phenotypic mean by comparison to the reference (Ala)T haplotype. Tests were performed on values adjusted for age, center, alcohol and smoking.
13

S.E. Humphries, D.A. Tregouet and I. Juhan-VagueP.E. Morange, N. Saut, M.C. Alessi, J.S. Yudkin, M. Margaglione, G. Di Minno, A. Hamsten,Myocardial Infarction, Plasma PAI-1, and Metabolic Parameters: The HIFMECH Study
Association of Plasminogen Activator Inhibitor (PAI)-1 (SERPINE1) SNPs With
Print ISSN: 1079-5642. Online ISSN: 1524-4636 Copyright © 2007 American Heart Association, Inc. All rights reserved.
Greenville Avenue, Dallas, TX 75231is published by the American Heart Association, 7272Arteriosclerosis, Thrombosis, and Vascular Biology
doi: 10.1161/ATVBAHA.107.1494682007;27:2250-2257; originally published online July 26, 2007;Arterioscler Thromb Vasc Biol.
http://atvb.ahajournals.org/content/27/10/2250World Wide Web at:
The online version of this article, along with updated information and services, is located on the
http://atvb.ahajournals.org/content/suppl/2007/09/20/ATVBAHA.107.149468.DC1.htmlData Supplement (unedited) at:
http://atvb.ahajournals.org//subscriptions/
at: is onlineArteriosclerosis, Thrombosis, and Vascular Biology Information about subscribing to Subscriptions:
http://www.lww.com/reprints
Information about reprints can be found online at: Reprints:
document. Question and AnswerPermissions and Rightspage under Services. Further information about this process is available in the
which permission is being requested is located, click Request Permissions in the middle column of the WebCopyright Clearance Center, not the Editorial Office. Once the online version of the published article for
can be obtained via RightsLink, a service of theArteriosclerosis, Thrombosis, and Vascular Biologyin Requests for permissions to reproduce figures, tables, or portions of articles originally publishedPermissions:
by guest on December 8, 2015http://atvb.ahajournals.org/Downloaded from