Molecular Heterogeneity in Acute Renal Allograft Rejection Identified by DNA Microarray Profiling
14
n engl j med 349;2 www.nejm.org july 10, 2003 The new england journal of medicine 125 original article Molecular Heterogeneity in Acute Renal Allograft Rejection Identified by DNA Microarray Profiling Minnie Sarwal, M.D., Ph.D., Mei-Sze Chua, Ph.D., Neeraja Kambham, M.D., Szu-Chuan Hsieh, M.S., Thomas Satterwhite, B.S., Marilyn Masek, M.S., and Oscar Salvatierra, Jr., M.D. From the Departments of Pediatrics (M.S., M.-S.C., S.-C.H., T.S., O.S.), Pathology (N.K., M.M.), and Surgery (O.S.), Stanford Uni- versity, Stanford, Calif. Address reprint re- quests to Dr. Sarwal at the Department of Pediatrics, G320, 300 Pasteur Dr., Stanford, CA 94305, or at [email protected]. N Engl J Med 2003;349:125-38. Copyright © 2003 Massachusetts Medical Society. background The causes and clinical course of acute rejection vary, and it is not possible to predict graft outcome reliably on the basis of available clinical, pathological, and genetic mark- ers. We hypothesized that previously unrecognized molecular heterogeneity might un- derlie some of the variability in the clinical course of acute renal allograft rejection and in its response to treatment. methods We used DNA microarrays in a systematic study of gene-expression patterns in biopsy samples from normal and dysfunctional renal allografts. A combination of exploratory and supervised bioinformatic methods was used to analyze these profiles. results We found consistent differences among the gene-expression patterns associated with acute rejection, nephrotoxic effects of drugs, chronic allograft nephropathy, and normal kidneys. The gene-expression patterns associated with acute rejection suggested at least three possible distinct subtypes of acute rejection that, although indistinguishable by light microscopy, were marked by differences in immune activation and cellular prolif- eration. Since the gene-expression patterns pointed to substantial variation in the com- position of immune infiltrates, we used immunohistochemical staining to define these subtypes further. This analysis revealed a striking association between dense CD20+ B-cell infiltrates and both clinical glucocorticoid resistance (P = 0.01) and graft loss (P<0.001). conclusions Systematic analysis of gene-expression patterns provides a window on the biology and pathogenesis of renal allograft rejection. Biopsy samples from patients with acute rejec- tion that are indistinguishable on conventional histologic analysis reveal extensive dif- ferences in gene expression, which are associated with differences in immunologic and cellular features and clinical course. The presence of dense clusters of B cells in a biopsy sample was strongly associated with severe graft rejection, suggesting a pivotal role of infiltrating B cells in acute rejection. abstract Copyright © 2003 Massachusetts Medical Society. All rights reserved. Downloaded from www.nejm.org by J A. ROBINSON MD on January 18, 2007 .
-
Upload
independent -
Category
Documents
-
view
1 -
download
0
Transcript of Molecular Heterogeneity in Acute Renal Allograft Rejection Identified by DNA Microarray Profiling

n engl j med
349;2
www.nejm.org july
10, 2003
The
new england journal
of
medicine
125
original article
Molecular Heterogeneity in Acute Renal Allograft Rejection Identified by DNA
Microarray Profiling
Minnie Sarwal, M.D., Ph.D., Mei-Sze Chua, Ph.D., Neeraja Kambham, M.D., Szu-Chuan Hsieh, M.S., Thomas Satterwhite, B.S., Marilyn Masek, M.S.,
and Oscar Salvatierra, Jr., M.D.
From the Departments of Pediatrics (M.S.,M.-S.C., S.-C.H., T.S., O.S.), Pathology (N.K.,M.M.), and Surgery (O.S.), Stanford Uni-versity, Stanford, Calif. Address reprint re-quests to Dr. Sarwal at the Department ofPediatrics, G320, 300 Pasteur Dr., Stanford,CA 94305, or at [email protected].
N Engl J Med 2003;349:125-38.
Copyright © 2003 Massachusetts Medical Society.
background
The causes and clinical course of acute rejection vary, and it is not possible to predictgraft outcome reliably on the basis of available clinical, pathological, and genetic mark-ers. We hypothesized that previously unrecognized molecular heterogeneity might un-derlie some of the variability in the clinical course of acute renal allograft rejection andin its response to treatment.
methods
We used DNA microarrays in a systematic study of gene-expression patterns in biopsysamples from normal and dysfunctional renal allografts. A combination of exploratoryand supervised bioinformatic methods was used to analyze these profiles.
results
We found consistent differences among the gene-expression patterns associated withacute rejection, nephrotoxic effects of drugs, chronic allograft nephropathy, and normalkidneys. The gene-expression patterns associated with acute rejection suggested at leastthree possible distinct subtypes of acute rejection that, although indistinguishable bylight microscopy, were marked by differences in immune activation and cellular prolif-eration. Since the gene-expression patterns pointed to substantial variation in the com-position of immune infiltrates, we used immunohistochemical staining to define thesesubtypes further. This analysis revealed a striking association between dense CD20+B-cell infiltrates and both clinical glucocorticoid resistance (P=0.01) and graft loss(P<0.001).
conclusions
Systematic analysis of gene-expression patterns provides a window on the biology andpathogenesis of renal allograft rejection. Biopsy samples from patients with acute rejec-tion that are indistinguishable on conventional histologic analysis reveal extensive dif-ferences in gene expression, which are associated with differences in immunologic andcellular features and clinical course. The presence of dense clusters of B cells in a biopsysample was strongly associated with severe graft rejection, suggesting a pivotal role ofinfiltrating B cells in acute rejection.
abstract
Copyright © 2003 Massachusetts Medical Society. All rights reserved. Downloaded from www.nejm.org by J A. ROBINSON MD on January 18, 2007 .

n engl j med
349;2
www.nejm.org july
10
,
2003
The
new england journal
of
medicine
126
cute rejection is a complex pro
C
-ess of injury to the allograft caused by in-filtrating cells of the host immune system.
It leads to multiple responses within the graft andis a major risk factor for chronic rejection and lossof the graft.
1-3
Acute rejection typically developssoon after transplantation and is thought to be sec-ondary to cell-mediated immune responses involv-ing delayed mechanisms of hypersensitivity andcytotoxicity. Despite efforts at systematization,
4,5
clinical and pathological diagnosis and classifica-tion of acute rejection remain unreliable in predict-ing responses to therapy and graft outcomes.
6-10
Thus, there is a great need to improve risk stratifica-tion and modes of early treatment. We investigatedthe possibility that variations in gene-expressionpatterns in allograft-biopsy samples from patientswith acute rejection and related disorders wouldpermit the identification of molecularly distinct sub-types of acute rejection that may be related to differ-ences in clinical behavior.
patient information
We analyzed 67 allograft-biopsy samples from50 patients (1.4 to 22 years of age). Immunosup-pressive therapy consisted of glucocorticoids, acalcineurin inhibitor (tacrolimus or cyclosporine),an antimetabolite (azathioprine or mycophenolatemofetil), and induction therapy with daclizumab.Nine graft losses occurred between 1.5 and 8.0 yearsafter transplantation, a mean of 10 months after abiopsy was performed because of acute rejection.Written informed consent was obtained from allstudy patients, and the study was approved by theinstitutional review board of Stanford University.
biopsy samples
A total of 52 biopsy samples were obtained be-tween 1 month and 10 years after transplantationduring acute allograft dysfunction (defined by anincrease of more than 10 percent in the serum creat-inine concentration from base line) or chronic allo-graft dysfunction (defined by a glomerular filtrationrate
11
of 50 ml per minute per 1.73 m
2
of body-sur-face area); 8 biopsy samples were obtained at thetime of engraftment; and 7 samples were obtainedat times when graft function was stable (as definedby a glomerular filtration rate of more than 80 ml perminute per 1.73 m
2
). All biopsy samples were snap-frozen. All but five biopsy samples were obtained
before the intensification of treatment for rejec-tion. Microscopical analyses were performed by in-vestigators who were unaware of the clinical out-comes.
5,12,13
No biopsy sample contained evidenceof post-transplantation lymphoproliferative disor-der or viral inclusions.
microarray hybridization and data analysis
Each microarray was a lymphochip
14
gridded atStanford University, and each contained 28,032DNA spots representing approximately 12,440 hu-man genes. Total RNA was isolated from frozenbiopsy samples (TRI Reagent, Molecular ResearchCenter). A common reference pool of RNA
15
wasused as an internal standard. Sample or referenceRNA was subjected to two successive rounds ofamplification
16
before undergoing hybridization tomicroarrays.
All 67 biopsy samples were used for initial un-supervised, hierarchical clustering (i.e., analysiswithout prior knowledge of sample identity).
17
Forsubsequent supervised analyses (i.e., comparativeanalyses between defined sample groups), with theuse of significance analysis of microarrays,
18
thefive samples from patients with partially treatedacute rejection were excluded in order to eliminatepossible bias due to the effects of drugs. The enrich-ment of specific functional groups of genes wasassessed in our data set on the basis of the hyper-geometric distribution,
19
with the use of 86 T-cell–specific genes,
20
2610 T-cell–inducible transcripts,
21
and 874 cell-cycle–related genes.
22
Kaplan–Meiersurvival analyses, based on the Cox log-rank meth-od, were used to determine the relation betweengraft survival or recovery of graft function (definedas the return of the serum creatinine concentrationto the base-line level one month after the treatmentof acute rejection) and the density of CD20+ cells.
immunohistochemistry
Immunohistochemical staining for CD20, CD4,CD8, and proliferating-cell nuclear antigen (PCNA)was performed on samples from patients with un-treated acute rejection. In addition, an independentset of 31 archived biopsy samples from patients withacute rejection was also analyzed by CD20 staining.
Entire cores were scanned in a blinded fashionby a single observer to determine the density ofCD20+, CD4+, and CD8+ cells. Cell density per high-power field and the number of high-power fieldscounted per core were documented. For each spec-
a
methods
Copyright © 2003 Massachusetts Medical Society. All rights reserved. Downloaded from www.nejm.org by J A. ROBINSON MD on January 18, 2007 .

n engl j med
349;2
www.nejm.org july
10, 2003
dna profiling of renal allograft rejection
127
imen, the single high-power field with the highestCD20+ cell count was identified, and cell counts ofmore than 275 and less than 100 were chosen arbi-trarily as definitions of CD20+ and CD20¡ status,so that the high threshold was more than 2.5 timesthe low threshold.
supplemental information
Additional information on methods, immuno-histochemical images, and analytic methods areavailable as supplementary appendixes at http://genome-www.stanford.edu/rejection/ or from theNational Auxiliary Publications Service (NAPS).*Data are available at the Gene Expression Omni-bus (http://www.ncbi.nlm.nih.gov/geo).
clustering of samples
The gene-expression profiles of 67 allograft-biop-sy samples were compared by the hierarchical clus-tering of samples according to the correlation intheir patterns of expression in 1340 selected com-plementary DNA (cDNA) fragments, representingapproximately 912 genes (Fig. 1 and supplementa-ry appendixes). In general, biopsy samples frompatients with similar clinical diagnoses clusteredtogether on the basis of corresponding similaritiesin gene expression, irrespective of the immunosup-pressive regimen the patient was receiving. The pos-sibility that differential sampling of the medullaryand cortical regions might account for the observedmolecular variation was addressed through the com-parison of these data with those obtained from anexamination of variation in gene expression in dis-tinct regions of the kidney. Patterns of gene expres-sion in normal cortex and medulla were character-ized in samples obtained from the gross dissectionof normal kidneys (supplementary appendixes). Theexclusion of data from genes whose expression washighly correlated with the depth of the biopsy didnot change the composition of the clusters of sam-ples (supplementary appendixes).
clustering of allograft biopsies according to gene-expression profile
We identified four clusters of expression patternsin the biopsy samples, which generally correspond-ed closely with clinicopathological categories (Fig. 1
and Table 1). Biopsy samples from patients withacute rejection were observed to have relative mo-lecular heterogeneity. Unlike the samples from nor-mal kidney or those from patients with chronic al-lograft nephropathy, toxic drug effects, or infection,the samples from patients with acute rejection weredispersed among three of the four major clusters.Although one distinct cluster (cluster A) consistedonly of samples from patients with acute rejection,the remaining 14 of the 26 samples from such pa-tients were dispersed in clusters B and C.
All samples from patients with a clinicopath-ological diagnosis of toxic drug effects or infec-tion were grouped in cluster B. All samples frompatients with chronic allograft nephropathy weregrouped in cluster C, and all the samples in this clus-ter showed clinicopathological evidence of chron-ic allograft nephropathy (in some cases, with ac-companying acute rejection). All biopsy samplesfrom normal kidneys were grouped in cluster D, andonly normal samples were found in this cluster. Thedivision of the samples into these four clusters re-flects only a fraction of the molecular variationsamong them: within each of these clusters, exten-sive residual variation in gene expression was ob-served (the gene-expression signatures of each clus-ter are available at http://genome-www.stanford.edu/rejection/ or from the National Auxiliary Publi-cations Service (NAPS).* We focused our detailedanalysis on the molecular characterization of thesamples from patients with acute rejection.
molecular heterogeneity of acute rejection
We examined the characteristic gene-expressionpatterns that distinguished the 26 biopsy samplesfrom patients with acute rejection. There were sig-nificant differences between these samples andthose from normal kidney in the expression of 586genes, representing 64 percent of all 912 uniquegenes analyzed; the median false discovery rate was12 percent, or 68 genes (the false discovery rate, orthe percentage of genes identified by chance, is cal-culated as the median number [or 90th percentile]of falsely identified genes divided by the number ofgenes achieving significance levels for differentialexpression
18
). The varying levels of expression ofmany of these genes suggests a varying abundanceof distinctive cell populations, such as T and B lym-phocytes, natural killer cells, macrophages, and en-dothelial cells.
At least three different groups of biopsy sam-
results
*See NAPS document no. 05611 for 56 pages of supplementarymaterial. To order, contact NAPS, c/o Microfiche Publications, 248Hempstead Tpke., West Hempstead, NY 11552.
Copyright © 2003 Massachusetts Medical Society. All rights reserved. Downloaded from www.nejm.org by J A. ROBINSON MD on January 18, 2007 .
n engl j med
349;2
www.nejm.org july
10
,
2003
The
new england journal
of
medicine
128
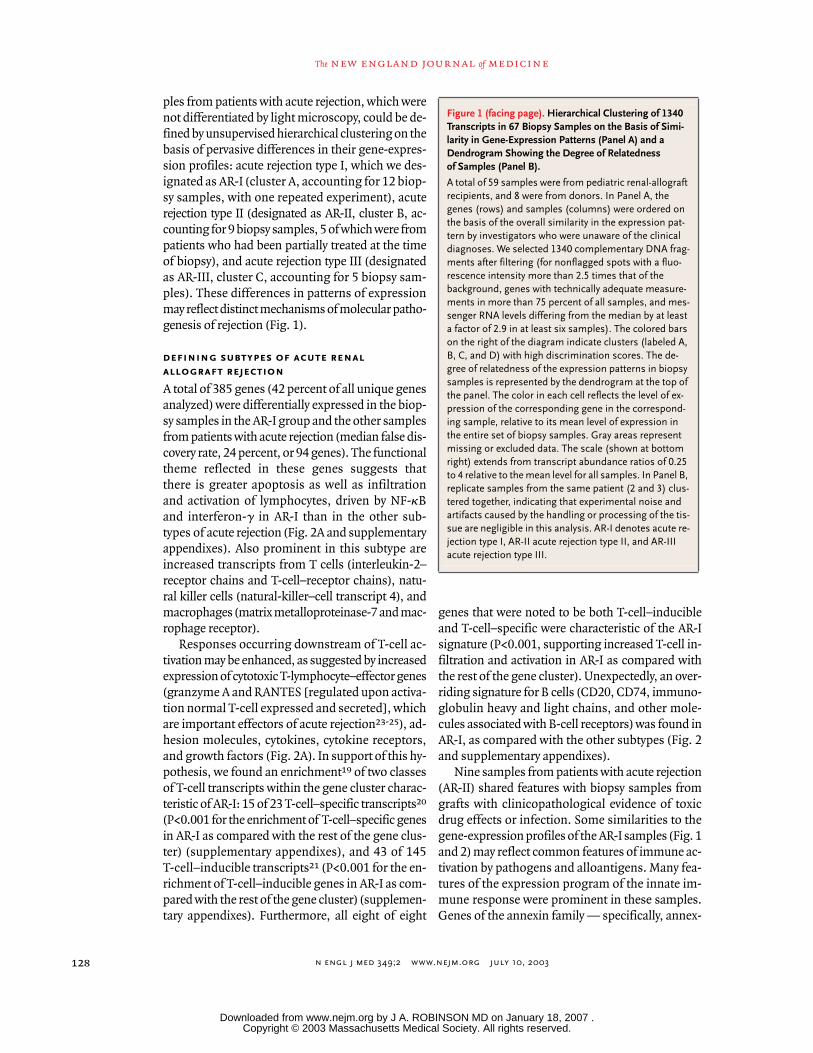
Figure 1 (facing page). Hierarchical Clustering of 1340 Transcripts in 67 Biopsy Samples on the Basis of Simi-larity in Gene-Expression Patterns (Panel A) and a Dendrogram Showing the Degree of Relatedness of Samples (Panel B).
A total of 59 samples were from pediatric renal-allograft recipients, and 8 were from donors. In Panel A, the genes (rows) and samples (columns) were ordered on the basis of the overall similarity in the expression pat-tern by investigators who were unaware of the clinical diagnoses. We selected 1340 complementary DNA frag-ments after filtering (for nonflagged spots with a fluo-rescence intensity more than 2.5 times that of the background, genes with technically adequate measure-ments in more than 75 percent of all samples, and mes-senger RNA levels differing from the median by at least a factor of 2.9 in at least six samples). The colored bars on the right of the diagram indicate clusters (labeled A, B, C, and D) with high discrimination scores. The de-gree of relatedness of the expression patterns in biopsy samples is represented by the dendrogram at the top of the panel. The color in each cell reflects the level of ex-pression of the corresponding gene in the correspond-ing sample, relative to its mean level of expression in the entire set of biopsy samples. Gray areas represent missing or excluded data. The scale (shown at bottom right) extends from transcript abundance ratios of 0.25 to 4 relative to the mean level for all samples. In Panel B, replicate samples from the same patient (2 and 3) clus-tered together, indicating that experimental noise and artifacts caused by the handling or processing of the tis-sue are negligible in this analysis. AR-I denotes acute re-jection type I, AR-II acute rejection type II, and AR-III acute rejection type III.
ples from patients with acute rejection, which werenot differentiated by light microscopy, could be de-fined by unsupervised hierarchical clustering on thebasis of pervasive differences in their gene-expres-sion profiles: acute rejection type I, which we des-ignated as AR-I (cluster A, accounting for 12 biop-sy samples, with one repeated experiment), acuterejection type II (designated as AR-II, cluster B, ac-counting for 9 biopsy samples, 5 of which were frompatients who had been partially treated at the timeof biopsy), and acute rejection type III (designatedas AR-III, cluster C, accounting for 5 biopsy sam-ples). These differences in patterns of expressionmay reflect distinct mechanisms of molecular patho-genesis of rejection (Fig. 1).
defining subtypes of acute renal allograft rejection
A total of 385 genes (42 percent of all unique genesanalyzed) were differentially expressed in the biop-sy samples in the AR-I group and the other samplesfrom patients with acute rejection (median false dis-covery rate, 24 percent, or 94 genes). The functionaltheme reflected in these genes suggests thatthere is greater apoptosis as well as infiltrationand activation of lymphocytes, driven by NF-
k
Band interferon-
g
in AR-I than in the other sub-types of acute rejection (Fig. 2A and supplementaryappendixes). Also prominent in this subtype areincreased transcripts from T cells (interleukin-2–receptor chains and T-cell–receptor chains), natu-ral killer cells (natural-killer–cell transcript 4), andmacrophages (matrix metalloproteinase-7 and mac-rophage receptor).
Responses occurring downstream of T-cell ac-tivation may be enhanced, as suggested by increasedexpression of cytotoxic T-lymphocyte–effector genes(granzyme A and RANTES [regulated upon activa-tion normal T-cell expressed and secreted], whichare important effectors of acute rejection
23-25
), ad-hesion molecules, cytokines, cytokine receptors,and growth factors (Fig. 2A). In support of this hy-pothesis, we found an enrichment
19
of two classesof T-cell transcripts within the gene cluster charac-teristic of AR-I: 15 of 23 T-cell–specific transcripts
20
(P<0.001 for the enrichment of T-cell–specific genesin AR-I as compared with the rest of the gene clus-ter) (supplementary appendixes), and 43 of 145T-cell–inducible transcripts
21
(P<0.001 for the en-richment of T-cell–inducible genes in AR-I as com-pared with the rest of the gene cluster) (supplemen-tary appendixes). Furthermore, all eight of eight
genes that were noted to be both T-cell–inducibleand T-cell–specific were characteristic of the AR-Isignature (P<0.001, supporting increased T-cell in-filtration and activation in AR-I as compared withthe rest of the gene cluster). Unexpectedly, an over-riding signature for B cells (CD20, CD74, immuno-globulin heavy and light chains, and other mole-cules associated with B-cell receptors) was found inAR-I, as compared with the other subtypes (Fig. 2and supplementary appendixes).
Nine samples from patients with acute rejection(AR-II) shared features with biopsy samples fromgrafts with clinicopathological evidence of toxicdrug effects or infection. Some similarities to thegene-expression profiles of the AR-I samples (Fig. 1and 2) may reflect common features of immune ac-tivation by pathogens and alloantigens. Many fea-tures of the expression program of the innate im-mune response were prominent in these samples.Genes of the annexin family — specifically, annex-
Copyright © 2003 Massachusetts Medical Society. All rights reserved. Downloaded from www.nejm.org by J A. ROBINSON MD on January 18, 2007 .

n engl j med
349;2
www.nejm.org july
10, 2003
dna profiling of renal allograft rejection
129
A
B
1 2 3 4 5 6 7 8 9 10
11
12
13
14
15
16
17
18
19
20
21
22
23
24
25
26
27
28
29
30
31 53
54
55
56
57
58
59
60
61
62
63
64
65
66
67
32
33
34
35
36
37
38
39
40
41
42
43
44
45
46
47
48
49
50
51
52
Cluster A
Cluster B
Sample Clusters
Cluster C
Cluster D
Cluster A (AR-I)
Cluster B (AR-II)
Cluster B (toxic drug effects, infection)
Cluster D (normal)
Cluster C (chronic allograft nephropathy)
Cluster C (AR-III)
>4.0
>2.0
1:1
>2.0
>4.0
Copyright © 2003 Massachusetts Medical Society. All rights reserved. Downloaded from www.nejm.org by J A. ROBINSON MD on January 18, 2007 .

n engl j med
349;2
www.nejm.org july
10
,
2003
The
new england journal
of
medicine
130
Table 1. Pathological and Clinical Characteristics of 52 Biopsy Samples from Dysfunctional Kidneys.*
SampleNo. Diagnosis
Banff AcuteRejection
Grade InfectionTreatment of Acute
Rejection†
Recovery ofFunction after
Acute Rejection
Graft Loss atMost Recent
Follow-upCD20
StainingPCNA
Staining
Cluster A
1 Acute rejection 1A Urinary tract infection
Glucocorticoid pulse No No +
2 Acute rejection 1A Glucocorticoid pulse Yes No –
3 Acute rejection 1A Glucocorticoid pulse Yes No –
4 Acute rejection 1A Glucocorticoid pulse No Yes +
5 Acute rejection 1B Glucocorticoid pulse, antibody therapy
No Yes +
6 Acute rejection 1A Glucocorticoid pulse No No –
7 Acute rejection 2A Glucocorticoid pulse, antibody therapy
No No +
8 Acute rejection 1B Glucocorticoid pulse, antibody therapy
No Yes +
9 Acute rejection 2A Antibody therapy No Yes +
10 Acute rejection 1A Glucocorticoid pulse Yes No –
11 Acute rejection 2A Glucocorticoid pulse No Yes +
12 Acute rejection 1A Glucocorticoid pulse No Yes –
Cluster B
13 Acute rejection 1A Glucocorticoid pulse, antibody therapy
No No –
14 Acute rejection 1A Glucocorticoid pulse No No –
15 Acute rejection, toxic drug ef-fects, infection
Urinary tract infection
Glucocorticoids‡ Yes No –
16 Toxic drug effects,infection
Urinary tract infection
No –
17 Acute rejection, toxic drug ef-fects, infection
Septicemia Glucocorticoids‡ Yes No –
18 Acute rejection, toxic drug ef-fects, infection
Urinary tract infection
Glucocorticoids‡ Yes No –
19 Acute rejection 1A Urinary tract infection
Glucocorticoid pulse Yes No ¡
20 Acute rejection, toxic drug ef-fects, infection
Urinary tract infection
Glucocorticoids‡ Yes No –
21 Toxic drug effects, infection
Urinary tract infection
No –
Copyright © 2003 Massachusetts Medical Society. All rights reserved. Downloaded from www.nejm.org by J A. ROBINSON MD on January 18, 2007 .

n engl j med
349;2
www.nejm.org july
10, 2003
dna profiling of renal allograft rejection
131
Table 1. (Continued.)
SampleNo. Diagnosis
Banff AcuteRejection
Grade InfectionTreatment of Acute
Rejection‡
Recovery ofFunction after
Acute Rejection
Graft Loss atMost Recent
Follow-upCD20
StainingPCNA
Staining
22 Toxic drug effects, infection
Urinary tract infection
No –
23 Acute rejection 1A Glucocorticoid pulse No Yes +
24 Toxic drug effects, infection
Septicemia No –
25 Toxic drug effects No –
26 Toxic drug effects, infection
Urinary tract infection
No –
27 Toxic drug effects, infection
Urinary tract infection
No –
28 Toxic drug effects No –
29 Toxic drug effects, infection
Urinary tract infection
No –
30 Acute rejection, toxic drug ef-fects, infection
Urinary tract infection
Glucocorticoids‡ Yes No –
31 Toxic drug effects, infection
Urinary tract infection
No –
Cluster C
32 Chronic allograft nephropathy
No – –
33 Chronic allograft nephropathy
No – –
34 Chronic allograft nephropathy
No – –
35 Chronic allograft nephropathy
No – –
36 Chronic allograft nephropathy
No – –
37 Chronic allograft nephropathy
No – –
38 Chronic allograft nephropathy
No – –
39 Chronic allograft nephropathy
No – –
40 Chronic allograft nephropathy
No – –
41 Chronic allograft nephropathy
No – –
42 Chronic allograft nephropathy
No – –
Copyright © 2003 Massachusetts Medical Society. All rights reserved. Downloaded from www.nejm.org by J A. ROBINSON MD on January 18, 2007 .

n engl j med
349;2
www.nejm.org july
10
,
2003
The
new england journal
of
medicine
132
in V, a potential marker of acute rejection
26
— wereexpressed at a particularly high level in this groupof biopsy samples. Expression of transforminggrowth factor
b
(induced by calcineurin-inhibitordrugs)
27
was relatively elevated, supporting the clus-tering of samples from patients with toxic drug ef-fects in this group of biopsy samples.
Five AR-III samples clustered with samples frompatients with chronic allograft nephropathy in clus-ter C, despite the fact that they met the Banff histo-logic criteria for acute rejection. Perhaps the moststriking feature of these samples was the expres-sion of genes involved in cellular proliferation andcell cycling (Fig. 2), suggesting active tissue repair
and regeneration. Sixty of the 1340 transcripts in ourdata set were related to cell-cycle functions,
22
and14 of these 60 genes were among the genes whoseexpression was significantly elevated in AR-III,
Figure 2 (facing page). Expanded View of the Gene Clus-ters, Showing Specific Features of the Gene-Expression Patterns within the Signatures in the Various Subtypes of Acute Rejection.
Panel A shows samples in the AR-I group, Panel B the AR-II group, and Panel C the AR-III group. RANTES de-notes regulated upon activation normal T-cell expressed and secreted, AR-I acute rejection type I, AR-II acute re-jection type II, and AR-III acute rejection type III.
* Samples 2 and 3 are replicate samples from the same biopsy. The primary diagnosis associated with samples 37 and 42 was chronic allograft nephropathy, but the patients also had some toxic drug effects. The patient with sample 28 had recurrent diabetes, and the patient with sam-ple 44 had recurrent Wegener’s granulomatosis. Immunohistochemical staining for CD20 was performed on all 52 samples, including the 21 samples from patients with untreated acute rejection; a positive result was defined by more than 275 cells per high-power field. Staining for proliferating-cell nuclear antigen (PCNA) was performed on all samples in cluster C (chronic allograft nephropathy and acute rejection type III [AR-III]). Scattered plasma cells were seen in biopsy specimens 4, 5, 8, and 9 in acute rejection type I (AR-I), occupying between 5 and 10 percent of the core. A plus sign indicates a positive result, and a minus sign a negative result.
† Glucocorticoid pulse treatment consisted of three doses of 10 mg per kilogram of body weight. Treatment was given after biopsy in most patients but before biopsy in the patients with samples 15, 17, 18, 20, and 30. These samples were associated with a predominant histologic diagnosis of toxic drug effects or infections and were not given a Banff grade because they had already been treated. Antibody therapy consisted of muromonab-CD3 (OKT3) and was given to one patient for vascular rejection and to four patients for glucocorticoid resistance.
‡ Clinical graft dysfunction was treated with high-dose glucocorticoids before biopsy.
Table 1. (Continued.)
SampleNo. Diagnosis
Banff AcuteRejection
Grade InfectionTreatment of Acute
Rejection‡
Recovery ofFunction after
Acute Rejection
Graft Loss atMost Recent
Follow-upCD20
StainingPCNA
Staining
43 Chronic allograft nephropathy
No – –
44 Chronic allograft nephropathy
No – –
45 Chronic allograft nephropathy
No – –
46 Chronic allograft nephropathy, acute rejection
2A Glucocorticoid pulse Yes No – +
47 Chronic allograft nephropathy
No – –
48 Chronic allograft nephropathy
No – –
49 Chronic allograft nephropathy, acute rejection
1A Glucocorticoid pulse Yes Yes + +
50 Acute rejection 1A Glucocorticoid pulse Yes No – +
51 Acute rejection 1A Glucocorticoid pulse Yes No – +
52 Chronic allograft nephropathy, acute rejection
1A Glucocorticoid pulse Yes Yes – +
Copyright © 2003 Massachusetts Medical Society. All rights reserved. Downloaded from www.nejm.org by J A. ROBINSON MD on January 18, 2007 .

n engl j med
349;2
www.nejm.org july
10, 2003
dna profiling of renal allograft rejection
133
– HLA class II
– Insulin-like growth factor 1 receptor
– MIC3 leukocyte antigen CD9
A
B
Cluster A (AR-I)
Cluster B (AR-II)
Cluster B (toxic drug effects, infection)
Cluster D (normal)
Cluster C (chronic allograft nephropathy)
Cluster C (AR-III)
C
– Natural-killer-cell transcript 4– Duffy antigen/receptor for chemokine– Interferon-stimulated gene factor 3 (interferon-responsive)– STAT1 (interferon-responsive)– Transforming growth factor receptor 1– Granzyme A– Interleukin-2 receptor
– CD53– Lymphotoxin– T-cell receptor
– HLA class I
– Immunoglobulins
– Lactotransferrin
– RANTES– CD20
– CD34
– Tumor necrosis factor receptor
– Macrophage stimulating 1– Epidermal growth factor
– Nuclear factor-kB1
– CD59
– Interferon-g receptor 1
– Annexin– Lymphotoxin receptor
– Leukocyte receptor cluster–encoded novel gene 4 (LENG4)– B-cell translocation gene BTG1– C4B– Transforming growth factor b receptor 2
– CC chemokine receptor 5
– Cell division cycle 27– Cyclin B1– Cyclin A2– Cell division cycle 20
Sample Clusters
Copyright © 2003 Massachusetts Medical Society. All rights reserved. Downloaded from www.nejm.org by J A. ROBINSON MD on January 18, 2007 .

n engl j med
349;2
www.nejm.org july
10
,
2003
The
new england journal
of
medicine
134
representing a statistically significant enrichment
19
(P<0.001, for the enrichment of cell-cycle genes inAR-III as compared with the rest of the gene clus-ter). The molecular features of lymphocyte infiltra-tion and activation were minimal in this subtype(Fig. 2 and supplementary appendixes), suggestinga relatively quiescent rejection process and ongoingrecovery from previous or chronic tubulointerstitialinflammation or tubular necrosis.
immunohistochemical features of samples from patients with acute rejection
Because we observed not only a robust T-cell signa-ture, but also a B-cell signature in the AR-I group,we used immunohistochemical analysis to investi-gate whether variation in the cellular compositionof infiltrating lymphocytes in the 20 unique biopsysamples from patients with untreated acute rejectionmight account for some of the differences amonggroups in the observed gene-expression patterns;one sample in AR-I was examined twice by microar-ray analysis (Table 1). We were particularly interest-ed in further study of B cells, since B cells have nothistorically been reported to be key players in acuterejection.
28
We chose CD20, a marker for B cellsthat is present in AR-I, to corroborate the observa-tion of B-cell enrichment independently by immu-nohistochemical analysis.
On staining, we found that there was a greaterabundance of CD8+ T lymphocytes than of CD4+T lymphocytes in biopsy samples from patients withacute rejection. There were no overall quantitativedifferences in these patterns among the subtypes ofacute rejection, although two biopsy samples withglucocorticoid resistance from patients in the AR-Igroup had a higher density of CD8+ cells (Fig. 3Aand supplementary appendixes). The apparent ab-sence of major differences in the density of CD4+cells and CD8+ cells among the subtypes of acuterejection suggests that the relatively prominentT-cell signature in AR-I is largely attributable to anactivated T-cell phenotype (evidenced by markers ofearly and late T-cell activation) rather than to in-creased numbers of infiltrating T cells and that, con-versely, infiltrating T cells in AR-III are relatively qui-escent.
CD20 staining revealed unexpected large aggre-gates of B cells without formation of follicles (Fig.3A and supplementary appendixes) in 9 of 20 bi-opsy samples from patients with acute rejection: 7 of11 in the AR-I group, 1 of 4 in the AR-II group, and
1 of 5 in the AR-III group (Table 1). This findingcontrasts with a previous report of few B cells insamples from patients with acute rejection.
28
CD20 staining of 31 archived biopsy samples frompatients with acute rejection that were not exam-ined by microarray also revealed a similar propor-tion of CD20+ lymphocyte aggregates in 9 biopsysamples (supplementary appendixes). Immuno-fluorescence staining of biopsy samples for immu-noglobulin and complement deposition was nega-tive, despite the presence of the B-cell aggregates;in situ hybridization for Epstein–Barr virus andsimian virus 40 was negative, ruling out an associ-ation between B-cell infiltrates and viral infectionor post-transplantation lymphoproliferative disor-der (data not shown).
The presence of proliferating-cell nuclear anti-gen, a marker of cell proliferation, was confirmedin all 5 AR-III samples but not in any of the samplesfrom patients with chronic allograft nephropathy(Fig. 3B), distinguishing these groups of biopsysamples with otherwise similar expression profiles.
clinical correlates of the subtype of acute rejection and cd20+ cell density
Analysis of the recovery of graft function over timerevealed that grafts that were clustered in the AR-Igroup had significantly poorer functional recov-ery than those classified as either AR-II or AR-III(P=0.02) (Table 2 and supplementary appendixes).When data from the five samples from partiallytreated patients in the AR-II group were removedfrom the data set, a trend toward a correlation re-mained, despite reduced numbers of samples (P=0.06) (Table 2 and supplementary appendixes). Inaddition, four of five samples from patients with
Figure 3 (facing page). Immunohistochemical Staining of Tissues.
Panel A shows staining with periodic acid–Schiff (PAS) and monoclonal antibodies against CD4, CD8, and CD20 in representative samples from patients with acute rejec-tion of each subtype (AR-I, AR-II, and AR-III). The AR-I sam-ple shows the presence of large B-cell clusters. Panel B shows staining for proliferating-cell nuclear antigen (PCNA) in cluster C revealing the presence of PCNA in tubular and interstitial cells in a representative AR-III bi-opsy sample but the absence of PCNA in a representative sample from a patient with chronic allograft nephropathy (CAN). AR-I denotes acute rejection type I, AR-II acute rejection type II, and AR-III acute rejection type III.
Copyright © 2003 Massachusetts Medical Society. All rights reserved. Downloaded from www.nejm.org by J A. ROBINSON MD on January 18, 2007 .

n engl j med
349;2
www.nejm.org july
10, 2003
dna profiling of renal allograft rejection
135
A
B
CD4
CD8
CD20
PAS
PCNA
AR-I
AR-III CAN
AR-II AR-III
Copyright © 2003 Massachusetts Medical Society. All rights reserved. Downloaded from www.nejm.org by J A. ROBINSON MD on January 18, 2007 .

n engl j med
349;2
www.nejm.org july
10
,
2003
The
new england journal
of
medicine
136
glucocorticoid-resistant acute rejection (defined bythe absence of a clinical response to glucocorticoidpulse treatment) clustered in the AR-I group.
A strong association between the density ofCD20+ cells on immunostaining and the clinicalphenotype of glucocorticoid resistance was observedamong patients in the AR-I group: all four biopsysamples from patients in this group who had glu-cocorticoid-resistant acute rejection had a high den-sity of CD20+ cells (one patient required antibodytherapy with muromonab-CD3 [OKT3] at the out-set for presumed vascular rejection, and the othersrequired such therapy after the failure of glucocorti-coid pulse therapy) (Table 1). The density of CD20+cells was strongly correlated with graft loss whenall samples from patients with acute rejection wereconsidered together (P<0.001) (Table 2 and supple-mentary appendixes). To provide an independenttest of the significance of this result, we examinedthe clinical correlates of the retrospective series of31 biopsy samples from patients with acute rejec-tion and confirmed that dense aggregates of CD20+cells at the time of biopsy were strongly associated
with glucocorticoid resistance (P<0.001) and poorgraft outcomes (Table 3).
None of the other variables we studied correlat-ed with either the density of CD20+ lymphocytes orthe assignment of a subtype of acute rejection de-fined according to the pattern of gene expression.These variables were the weight of the donor or therecipient, the age of the recipient, the number ofHLA mismatches, the use of a transplant from a liv-ing or cadaveric donor, whether or not there wererepeated transplantations, the presence or absenceof panel-reactive antibody before transplantation,the occurrence or nonoccurrence of delayed graftfunction, the interval since transplantation, the typeof immunosuppression, the presence or absence ofhypertension, the presence or absence of anemia,the type of immunosuppressive therapy, or the pres-ence or absence of humoral rejection as determinedby complement C4d staining.
We examined the global transcript profiles of kid-ney-biopsy samples to help us to understand andclassify acute allograft rejection. Using DNA mi-croarrays, we identified molecular variation suggest-ing the existence of distinct molecular and prog-nostic variants of acute rejection, which could notpreviously be clearly defined on the basis of clinicalor pathological criteria. Many of the observed differ-ences in gene-expression patterns among samplesfrom patients with acute rejection appear to reflectdifferences in the composition and activation of in-filtrating lymphocytes. Confounding influences oftime may be involved in the ostensible disparitiesin gene expression that we report here, since therewas residual heterogeneity within the subtypes ofacute rejection that we defined by cluster analysis.A prospective and extensive longitudinal study ofmore samples by a variety of methods is needed torefine the classification of acute rejection, with clear-er connections between patterns of gene expres-sion, pathophysiology, and clinical course. Sinceour study is based largely on pediatric patients, sim-ilar analyses should be conducted in adult renal-transplant recipients.
The molecular and immunohistochemical evi-dence of B-cell infiltration in a subgroup of samplesfrom patients with acute rejection was the most un-expected and important finding in this study. DenseCD20 staining was observed in approximately onethird of the 52 biopsy samples from patients with
discussion
* Data are for grafts with incomplete functional recovery in the analyses accord-ing to subtype of acute rejection and for grafts lost in the analysis according to CD20 status.
† P values were calculated from Kaplan–Meier survival analyses.
Table 2. Correlations between Acute Rejection (AR) Subtype or CD20 Status and Graft Outcome.
VariableNo. of
Patients
MedianDuration of Follow-
Up
No. ofGrafts Lost
or withIncompleteFunctionalRecovery*
PValue†
mo
Subtype (25 samples from patients with acute rejection)
AR-IAR-IIAR-III
1195
111313
930
0.02
Subtype (20 samples from patients with untreated acute rejection)
AR-IAR-IIAR-III
1145
111613
930
0.06
CD20 status (20 samples from patients with untreated acute rejection)
CD20+CD20–
911
1310
81
<0.001
Copyright © 2003 Massachusetts Medical Society. All rights reserved. Downloaded from www.nejm.org by J A. ROBINSON MD on January 18, 2007 .

n engl j med
349;2
www.nejm.org july
10, 2003
dna profiling of renal allograft rejection
137
acute rejection that underwent immunohistochemi-cal analysis and was significantly associated withglucocorticoid resistance and eventual graft fail-ure. Staining for CD20 may make possible a rapidclinical test that will permit the definition of a high-risk group of patients with acute rejection who maywarrant more aggressive and specific treatment.The association between CD20+ lymphocyte infil-tration and graft loss was unexpected. We speculatethat in patients who have such an infiltration, ear-ly treatment with a monoclonal antibody againstCD20 (rituximab) may be beneficial.
29
The associ-ation of CD20 staining with glucocorticoid resist-ance does not suggest that these cases are neces-sarily humorally mediated despite the presence ofC1s, C1r, and C4b in some biopsy samples: stainingfor complement C4d, which was used as a putativemarker of humoral rejection in the biopsy samplesfrom patients with acute rejection in our study,showed poor correlation with CD20 staining(P=1.00) (data not shown).
A preponderance of CD8+ T cells and plasma-cell infiltrates has been associated with glucocorti-coid resistance and poor outcomes,
30-33
whereasB cells have been reported to be infrequent or ab-sent in acute rejection. The pathophysiological roleof B-cell infiltrates in this study requires furtherinvestigation; their presence does not seem to re-sult in direct allograft injury, since immunofluo-rescence staining of biopsy samples for immuno-globulin and complement deposition was negativein out study (data not shown). As pharmacologicsuppression of T cells has improved over the pastdecade (with the introduction of tacrolimus, myco-phenolate mofetil, sirolimus, and monoclonal an-tibodies against the interleukin-2 receptor), B cellsmay have evolved as efficient antigen-presentingcells for indirect allorecognition, and their contin-ued presence in the graft, unaffected by currentimmunosuppressive management, may be result-ing in a large fraction of episodes of refractory re-jection.
34,35
In conclusion, molecular profiling of transplantsin patients with acute rejection identified new sub-types of acute rejection and a correlation betweenCD20+ lymphoid aggregates and poorer graft out-
comes; these findings may point toward improve-ments in the individualization of therapy. Gene-expression profiling thus opens a new door for thestudy of acute rejection and may provide a means toa better understanding of other categories of graftdysfunction.
Supported by grants from the National Institutes of Health(NIH5P3-05 and NIH3P3-05S1, to Dr. Sarwal), the Clinical Centerfor Immunological Studies at Stanford University (to Dr. Sarwal),the Packard Foundation, Roche Pharmaceuticals, and the HowardHughes Medical Institute.
We are indebted to Dr. Patrick O. Brown for scientific directionand support, without which this work would not have been possi-ble; to Drs. Xin Chen, Ash A. Alizadeh, and Maximilian Diehn for in-valuable scientific assistance; to Addie Whitney for printing of theDNA microarrays and for helpful advice; to Stella Chang for assist-ance with RNA amplification; to Dr. John Higgins for the cortex andmedulla samples; to the Pediatric Nephrology team for their assist-ance with sample collection; to Dr. Alan Krensky for his support; toWijan Prapong for assistance with the supplementary material;to Dr. Robert Colvin at Harvard University for conducting C4dstaining; to Jennifer Boldrick for helpful advice, discussions, and re-view of the manuscript; and to the staff at the Stanford MicroarrayDatabase for their support and assistance with Web-site mainte-nance.
references
1.
Meier-Kriesche HU, Ojo AO, HansonJA, et al. Increased impact of acute rejectionon chronic allograft failure in recent era.Transplantation 2000;70:1098-100.
2.
Madden RL, Mulhern JG, Benedetto BJ,
et al. Completely reversed acute rejection isnot a significant risk factor for the develop-ment of chronic rejection in renal allograftrecipients. Transpl Int 2000;13:344-50.
3.
Guyot C, Nguyen JM, Cochat P, et al.
Risk factors for chronic rejection in pediat-ric renal allograft recipients. Pediatr Neph-rol 1996;10:723-7.
4.
Furness PN, Taub N. International varia-tion in the interpretation of renal transplant
* All four CD20+ samples from patients with glucocorticoid resistance were in
the AR-I group.
Table 3. Clinical Correlates of CD20 Status in Renal-Biopsy Samplesfrom Patients with Acute Rejection.
Variable
RetrospectiveSeries
of Biopsy Samples (N=31)
Biopsy Samples
Included in theMicroarray
Analysis (N=20)
CD20+ on staining — no./total no. (%) 9/31 (29) 9/20 (45)
Graft lossIn patients with CD20+ sample —
no./total no. (%)In patients with CD20– sample —
no./total no. (%)P value
7/9 (78)
9/22 (41)
0.11
8/9 (89)
1/11 (9)
<0.001
Glucocorticoid resistanceIn patients with CD20+ sample —
no./total no. (%)In patients with CD20– sample —
no./total no. (%)P value
8/9 (89)
1/22 (5)
<0.001
4/9 (44)*
1/11 (9)
0.01
Copyright © 2003 Massachusetts Medical Society. All rights reserved. Downloaded from www.nejm.org by J A. ROBINSON MD on January 18, 2007 .

n engl j med
349;2
www.nejm.org july
10
,
2003
138
dna profiling of renal allograft rejection
biopsies: reports of the CERTPAP Project.Kidney Int 2001;60:1998-2012. [Erratum,Kidney Int 2001;60:2429.]
5.
Racusen LC, Solez K, Colvin RB, et al.The Banff 97 working classification of re-nal allograft pathology. Kidney Int 1999;55:713-23.
6.
Tullius SG, Nieminen M, Bechstein WO,et al. Prompt treatment of initial acute rejec-tion episodes may improve long-term graftoutcome. Transpl Int 1998;11:Suppl 1:S3-S4.
7.
Humar A, Kerr S, Gillingham KJ, MatasAJ. Features of acute rejection that increaserisk for chronic rejection. Transplantation1999;68:1200-3.
8.
Matas AJ, Gillingham KJ, Payne WD,Najarian JS. The impact of an acute rejectionepisode on long-term renal allograft sur-vival (t1/2). Transplantation 1994;57:857-9.
9.
Shinn C, Malhotra D, Chan L, Cosby RL,Shapiro JI. Time course of response to pulsemethylprednisolone therapy in renal trans-plant recipients with acute allograft rejec-tion. Am J Kidney Dis 1999;34:304-7.
10.
Humar A, Payne WD, Sutherland DE,Matas AJ. Clinical determinants of multipleacute rejection episodes in kidney trans-plant recipients. Transplantation 2000;69:2357-60.
11.
Schwartz GJ, Haycock GB, EdelmannCM Jr, Spitzer A. A simple estimate of glo-merular filtration rate in children derivedfrom body length and plasma creatinine.Pediatrics 1976;58:259-63.
12.
Colvin RB, Cohen AH, Saiontz C, et al.Evaluation of pathologic criteria for acuterenal allograft rejection: reproducibility,sensitivity, and clinical correlation. J Am SocNephrol 1997;8:1930-41.
13.
Randhawa PS, Shapiro R, Jordan ML,Starzl TE, Demetris AJ. The histopatholog-ical changes associated with allograft rejec-tion and drug toxicity in renal transplantrecipients maintained on FK506: clinical sig-nificance and comparison with cyclospor-ine. Am J Surg Pathol 1993;17:60-8.
14.
Alizadeh A, Eisen M, Davis RE, et al. Thelymphochip: a specialized cDNA microarrayfor the genomic-scale analysis of geneexpression in normal and malignant lym-
phocytes. Cold Spring Harb Symp QuantBiol 1999;64:71-8.
15.
Perou CM, Sorlie T, Eisen MB, et al. Molec-ular portraits of human breast tumours.Nature 2000;406:747-52.
16.
Wang E, Miller LD, Ohnmacht GA, LiuET, Marincola FM. High-fidelity mRNA ampli-fication for gene profiling. Nat Biotechnol2000;18:457-9.17. Eisen MB, Spellman PT, Brown PO, Bot-stein D. Cluster analysis and display of ge-nome-wide expression patterns. Proc NatlAcad Sci U S A 1998;95:14863-8.18. Tusher VG, Tibshirani R, Chu G. Signif-icance analysis of microarrays applied to theionizing radiation response. Proc Natl AcadSci U S A 2001;98:5116-21. [Erratum, ProcNatl Acad Sci U S A 2001;98:10515.]19. Jakt LM, Cao L, Cheah KS, Smith DK.Assessing clusters and motifs from geneexpression data. Genome Res 2001;11:112-23.20. Su AI, Cooke MP, Ching KA, et al. Large-scale analysis of the human and mouse tran-scriptomes. Proc Natl Acad Sci U S A 2002;99:4465-70.21. Diehn M, Alizadeh AA, Rando OJ, et al.Genomic expression programs and the inte-gration of the CD28 costimulatory signal inT cell activation. Proc Natl Acad Sci U S A2002;99:11796-801. [Erratum, Proc NatlAcad Sci U S A 2002;99:15245.]22. Whitfield ML, Sherlock G, Saldanha AJ,et al. Identification of genes periodicallyexpressed in the human cell cycle and theirexpression in tumors. Mol Biol Cell 2002;13:1977-2000.23. Kummer JA, Wever PC, Kamp AM, tenBerge IJ, Hack CE, Weening JJ. Expression ofgranzyme A and B proteins by cytotoxic lym-phocytes involved in acute renal allograftrejection. Kidney Int 1995;47:70-7.24. Strehlau J, Pavlakis M, Lipman M, et al.Quantitative detection of immune activationtranscripts as a diagnostic tool in kidneytransplantation. Proc Natl Acad Sci U S A1997;94:695-700.25. Li B, Hartono C, Ding R, et al. Noninva-sive diagnosis of renal-allograft rejection bymeasurement of messenger RNA for per-
forin and granzyme B in urine. N Engl J Med2001;344:947-54.26. Ogura Y, Krams SM, Martinez OM, et al.Radiolabeled annexin V imaging: diagnosisof allograft rejection in an experimentalrodent model of liver transplantation. Radi-ology 2000;214:795-800.27. Olyaei AJ, de Mattos AM, Bennett WM.Nephrotoxicity of immunosuppressive drugs:new insight and preventive strategies. CurrOpin Crit Care 2001;7:384-9.28. Platt JL, LeBien TW, Michael AF. Intersti-tial mononuclear cell populations in renalgraft rejection: identification by monoclonalantibodies in tissue sections. J Exp Med1982;155:17-30.29. Aranda JM Jr, Scornik JC, NormannSJ, et al. Anti-CD20 monoclonal antibody(rituximab) therapy for acute cardiac humoralrejection: a case report. Transplantation2002;73:907-10.30. Meehan SM, Domer P, Josephson M, etal. The clinical and pathologic implicationsof plasmacytic infiltrates in percutaneousrenal allograft biopsies. Hum Pathol 2001;32:205-15.31. Charney DA, Nadasdy T, Lo AW, Ra-cusen LC. Plasma cell-rich acute renal allo-graft rejection. Transplantation 1999;68:791-7.32. Bishop GL, Hall BM, Duggin GG, Hor-vath JS, Sheil AG, Tiller DJ. Immunopathol-ogy of renal allograft rejection analyzed withmonoclonal antibodies to mononuclear cellmarkers. Kidney Int 1986;29:708-17.33. Hancock WW. Analysis of intragrafteffector mechanisms associated with humanrenal allograft rejection: immunohistologi-cal studies with monoclonal antibodies.Immunol Rev 1984;77:61-84.34. von Willebrand E, Hayry P. Compositionand in vitro cytotoxicity of cellular infiltratesin rejecting human kidney allografts. CellImmunol 1978;41:358-72.35. Brandle D, Joergensen J, Zenke G, BurkiK, Hof RP. Contribution of donor-specificantibodies to acute allograft rejection: evi-dence from B cell-deficient mice. Transplan-tation 1998;65:1489-93.Copyright © 2003 Massachusetts Medical Society.
electronic access to the journal’s cumulative index
At the Journal’s site on the World Wide Web (http://www.nejm.org) you can search an index of all articles published since January 1975 (abstracts 1975–1992, full-text 1993–present). You can search by author, key word, title, type of article, and date. The results will include the citations for the articles plus links to the abstracts of articles published since 1993. For nonsubscribers, time-limited access to single articles and 24-hour site access can also be ordered for a fee through the Internet (http://www.nejm.org).
Copyright © 2003 Massachusetts Medical Society. All rights reserved. Downloaded from www.nejm.org by J A. ROBINSON MD on January 18, 2007 .