Food rejection and the development of food categorization in ...
43
HAL Id: hal-01464659 https://hal.archives-ouvertes.fr/hal-01464659 Submitted on 2 May 2018 HAL is a multi-disciplinary open access archive for the deposit and dissemination of sci- entific research documents, whether they are pub- lished or not. The documents may come from teaching and research institutions in France or abroad, or from public or private research centers. L’archive ouverte pluridisciplinaire HAL, est destinée au dépôt et à la diffusion de documents scientifiques de niveau recherche, publiés ou non, émanant des établissements d’enseignement et de recherche français ou étrangers, des laboratoires publics ou privés. Food rejection and the development of food categorization in young children Camille Rioux, Delphine Picard, Jérémie Lafraire To cite this version: Camille Rioux, Delphine Picard, Jérémie Lafraire. Food rejection and the development of food categorization in young children. Cognitive Development, Elsevier, 2016, 40, pp.163 - 177. 10.1016/j.cogdev.2016.09.003. hal-01464659
-
Upload
khangminh22 -
Category
Documents
-
view
0 -
download
0
Transcript of Food rejection and the development of food categorization in ...

HAL Id: hal-01464659https://hal.archives-ouvertes.fr/hal-01464659
Submitted on 2 May 2018
HAL is a multi-disciplinary open accessarchive for the deposit and dissemination of sci-entific research documents, whether they are pub-lished or not. The documents may come fromteaching and research institutions in France orabroad, or from public or private research centers.
L’archive ouverte pluridisciplinaire HAL, estdestinée au dépôt et à la diffusion de documentsscientifiques de niveau recherche, publiés ou non,émanant des établissements d’enseignement et derecherche français ou étrangers, des laboratoirespublics ou privés.
Food rejection and the development of foodcategorization in young children
Camille Rioux, Delphine Picard, Jérémie Lafraire
To cite this version:Camille Rioux, Delphine Picard, Jérémie Lafraire. Food rejection and the development of foodcategorization in young children. Cognitive Development, Elsevier, 2016, 40, pp.163 - 177.�10.1016/j.cogdev.2016.09.003�. �hal-01464659�

Food rejection and the development of food categorization in young children 1
2
Camille Riouxa,b*
, Delphine Picardb & Jérémie Lafraire
a 3
4
a Center for Food and Hospitality Research, Paul Bocuse Institute, Ecully, France 5
b Aix Marseille Université, PSYCLE EA3273, 13621 Aix en Provence, France 6
7
1 Introduction 8
Food is of central biological importance to humans, but while “trying new foods is at the core 9
of omnivorousness (…) so is being wary of them” (Rozin, 1976). As insightfully stated by 10
Rozin, humans, along with other omnivorous species, are caught on the horns of this 11
omnivore’s dilemma. Humans need to have a diverse diet to ensure their nutritional health, 12
survival, and reproduction. To satisfy this dietary diversity, they must therefore continually 13
sample new food resources, as they move away from a mono diet, namely their mother’s 14
milk, to a diverse food repertoire. However, this search for variety can prove hazardous, as 15
new substances may be toxic, and a single mistake in this search could potentially lead to 16
death, and thus hinder reproduction (generally associated with evolutionary success; Dawkins, 17
1976). 18
Two design features appear to have emerged through natural selection to solve this adaptive 19
problem1. Grasping the first horn of the dilemma, a categorization system allowing for a 20
food/nonfood distinction and discrimination between different food items enables efficient 21
sampling of new food resources and enrichment of the food repertoire. Categorization is a 22
fundamental cognitive process that allows us to organize objects into groups (Vauclair, 2004). 23
Without such abilities, each item would be perceived as new, and it would be impossible to 24
1 An adaptive problem is a problem, like this omnivore’s dilemma, whose solution can affect reproduction, and
hence evolutionary success (Cosmides, Tooby, & Barkow, 1992).
generalize its properties (such as assuming that because a carrot is edible, other carrots will be 25
too; Murphy, 2002). 26
Grasping the second horn of the dilemma, food neophobia (defined as the reluctance to eat 27
novel food items; Pliner & Hobden, 1992) and food pickiness (defined as the rejection of a 28
substantial amount of familiar foods, the consumption of an inadequate amount of food, and 29
the rejection of certain food textures; Rydell, Dahl, & Sundelin, 1995; Smith, Roux, Naidoo, 30
& Venter, 2005; Taylor, Wernimont, Northstone, & Emett, 2015) prevent individuals from 31
ingesting substances that are potentially poisonous (Cashdan, 1994; Pliner, Pelchat, & 32
Grasbski, 1993; Rozin, 1977). It has been reported that these rejection behaviors are mainly 33
targeting plants, fruits and vegetables (Dovey, Staples, Gibson, & Halford, 2008). This is in 34
line with recent evidence showing that infants as young as eight months old exhibit greater 35
reluctance to touch basil and parsley plants, compared to plastic artefacts in the absence of 36
social information (Wertz & Wynn, 2014a). 37
However, while these food rejection behaviors had an adaptive value in Pleistocene hunter-38
gatherers’ hostile food environment, in our modern societies, where food safety is controlled 39
in food supply chains, they are less useful. Indeed, as food rejection behaviors lead to a low 40
consumption of fruit and vegetables by young children (Dovey,et al., 2008), they are 41
responsible for a reduction in dietary variety (Birch & Fisher, 1998; Falciglia, Couch, 42
Gribble, Pabst, & Frank, 2000) needed for normal and healthy child development (Carruth, 43
Skinner, Houck, Moran, Coletta, & Ott, 1998; Cashdan, 1998). 44
The assumption that food rejection and food categorization processes are natural selection’s 45
solutions to the omnivore’s dilemma led us to compare the scientific literature on food 46
rejection and on children’s cognitive development, in particular the development of a food 47
categorization system (Lafraire, Rioux, Giboreau, & Picard, 2016). This comparison, which 48
we expected to shed light on the mechanisms underlying food rejection behaviors from the 49
perspective of overcoming them, uncovered several interesting outcomes or hypotheses. 50
First, an increasing number of research studies have related eating disorders to abnormal 51
cognitive development, such as in autism spectrum disorder (Postorino et al., 2015; Rochedy 52
& Poulain, 2015; Stough, Gillette Roberts, Jorgensen, & Patton, 2015). Children with autism 53
are known to have cognitive deficits (Frith & Happé, 1994; Ozonoff, Pennington, & Rogers, 54
1991), and interestingly eating problems are common in this clinical population (Ahearn, 55
Castine, Nault, & Green, 2001). Approximately 80% of young children on the autism 56
spectrum are described as picky eaters, and 95% of them are reported by parents to be 57
resistant to trying new foods (Lockner, Crowe, & Skipper, 2008) while prevalence of picky 58
eating in young neurologically typical children usually ranges from 25% to 50% (Taylor et al. 59
2015). Moreover, Bandini et al. (2010) found that children with autism had more limited food 60
repertoires than typically developing children. 61
Second, the sensitive period for food rejection starts at around 2 years, when children become 62
mobile and begin to reason about food items other than through their caregivers2 (Cashdan, 63
1994; Dovey et al., 2008; Lafraire et al., 2016). It is precisely at this point that a food 64
categorization system is assumed to take its place within the child’s cognitive system. Before 65
the age of 2 years, infants exhibit very limited food categorization abilities. For instance, 66
using a sequential touching procedure, Brown (2010) found that 20-month infants did not 67
systematically distinguish between food and animal categories. In the same vein, using a 68
looking time procedure, Shutts, Condry, Santos, and Spelke (2009) showed that 9-month-old 69
infants direct their attention equally to domain-relevant properties (e.g., color and texture) and 70
to domain-irrelevant properties (e.g., shape of the food’s container) when reasoning about 71
2 Before this age, food reasoning and selection seem to be mainly driven by social information (Wertz & Wynn,
2014b). For example infants preferentially reach for food that had been endorsed by native speaker of their
native language (Shutts, Kinzler, McKee & Spelke, 2009). See Lafraire et al. (2016), Lumeng (2013) and Shutts,
Kinzler & DeJesus (2013) for reviews of the social influences on food selection.

food. However, a rapid change occurs between 2 and 3 years of age. Using a sorting task 72
procedure, Bovet, Vauclair, and Blaye (2005) found that 3-year-olds systematically 73
distinguished between toy items and food items, demonstrating that these toddlers had 74
developed a conceptual food category. Moreover, Brown (2010) established that, at this age, 75
children also differentiate between categories within the food domain, such as biscuit and 76
fruit. These results are in line with Nguyen and Murphy’s claim that taxonomic categories3 77
are available to children quite early in development (Nguyen & Murphy, 2003). 78
Third, rejection usually occurs at the mere sight of the food (Carruth et al., 1998), leading 79
some authors to hypothesize that as children wish to recognize the foods they are given (to be 80
sure of the consequences of ingestion), there is a perceptual mismatch between the meal that 81
is presented and the prototypical food representations in their mind, possibly leading to food 82
rejection (Brown, 2010; Dovey et al., 2008). For instance, Dovey et al. (2008, p. 183) 83
hypothesized that “children build up schemata of how an acceptable food should look, and 84
perhaps smell, and so foods not sufficiently close to this stimulus set will be rejected”. 85
Fourth and last, one important finding in the domain of food categorization is that children 86
from the age of 2-3 years attend to information about color or texture, rather than shape 87
(Landau, Smith, & Jones, 1988; Yoshida & Smith, 2003) when discriminating between edible 88
and inedible substances or between different kinds of foods (Lavin & Hall, 2001; Macario, 89
1991, Ross & Murphy, 1999; Shutts et al., 2009). For example, in a conflicting picture triad 90
procedure4, Macario (1991, Exp. 4) showed 3- to 4-year-old children a novel object, described 91
as either a thing to eat (food condition) or a thing to play with (toy condition). The children 92
were then introduced to two other novel objects: a color match with the target object; and a 93
shape match with the target object. When asked which one was like the target object, children 94
3 Taxonomic categories are based on common properties and are organized into hierarchies, such as
apple-fruit-food (Nguyen & Murphy, 2003). 4 In a conflicting triad procedure, a target and two test items are pitted against each other. Children are required
to match one of the test items with the target.

were more likely to choose the color-match object in the food condition, whereas they were 95
more likely to choose the shape-match object in the toy condition. These data speak in favor 96
of a domain specificity5 effect on categorization, and this domain specificity effect is relevant 97
not only in nonlinguistic categorization tasks, as Macario established, but also in children’s 98
novel word extensions (Lavin & Hall, 2001). 99
Thus, if food rejection is a behavioral consequence of an immature food categorization system 100
(Brown, 2010; Dovey et al., 2008; Lafraire et al., 2016) and food categorization is mainly 101
color-dependent (Lavin & Hall, 2001; Macario, 1991), then some food colors should trigger 102
food rejection. There is already some evidence to support this idea. Compared with orange 103
vegetables (Gerrish & Mennella, 2001), green vegetables are often rejected more (Harris, 104
1993), and their acceptance is more difficult to foster (Mennella, Nicklaus, Jagolino, & 105
Yourshaw, 2008). Additionally, Macario (1991) reported that many parents have anecdotally 106
noted that their children can reject all foods of a particular color. To explain these 107
mechanisms, Macario (1991, Exp. 2-3) showed 2- to 4-year-old children two photographs of 108
familiar foods: one normally colored (e.g., a green lettuce) and one anomalously colored (e.g., 109
a purple lettuce). The children were then asked which one was not for people to eat, and 110
consistently chose the anomalously colored photograph. The author concluded that the 111
toddlers had a hypothesis about the predictive validity of color in the food domain, and 112
rejected foods were those that were not the color they were supposed to be. 113
To summarize, our comparison of the scientific literature on food rejection and the 114
development of a food categorization system uncovered the following three outcomes and 115
hypotheses: 116
(i) Children’s ability to perform categorization in the food domain appears to improve from 117
the age of 2-3 years. However, further studies are greatly needed, as there is still far too little 118
5 According to Fodor (1983), many aspects of cognition are supported by specialized and specified learning
devices.

research on food categorization in children, especially children over 3 years, when the food 119
categorization system is thought to develop; 120
(ii) Food rejection may be a manifestation of a developing food categorization system that 121
generates a large number of mismatches between food items and early food categories. 122
Nevertheless, though promising, the explanation that food is rejected on account of its visual 123
properties, through a mismatch between a prototypical category and a particular food item 124
(proposed by Brown, 2010, and Dovey et al., 2008) needs further elaboration and refinement. 125
These authors seemed to rely on the prototype theory of categorization proposed by Rosh and 126
Mervis (1975), as they used notions proposed by this theory, such as schemata and prototype 127
(Murphy, 2002). However, in this theory, a category is represented by a unified and summary 128
representation of the different exemplars, rather than by separate representations for each 129
member of the category (Murphy, 2002; Rosh & Mervis, 1975). Therefore, there is 130
necessarily a mismatch between a new item and the prototype of the category (since it is not 131
an exemplar but rather a feature list), and acceptance of a new item in the category is 132
therefore based not on an exact match but rather on an acceptable similarity to the prototype 133
(Murphy, 2002); 134
(iii) Food categorization is mainly color dependent, and some food colors trigger food 135
rejection. However the precise mechanism linking food color and food rejection has yet to be 136
identified. In our view, color is important mainly because it conveys information about the 137
typicality of a given food exemplar contrary to shape or texture (which vary more across 138
recipes and preparations). We would expect atypical items of a given category to be 139
frequently excluded from that category (Murphy, 2002), and the anomalously colored 140
photographs in Macario’s experiments described above (1991), which were atypical items, 141
were indeed excluded from the food category. 142

The present study was designed to investigate these three interesting outcomes and the gaps in 143
these fields that would be well worth filling in, so as to shed light on the mechanisms 144
underlying food rejection behaviors and possibly overcome them. The literature described 145
above led us to formulate the following three hypotheses: 146
147
H1 = Children’s abilities to perform categorization in the food domain start improving at age 148
2-3 years. More specifically, discrimination abilities in the food domain should improve 149
between 2-4 years and 4-6 years, and up to adulthood. 150
151
H2 = Food rejection in young children is closely intertwined with the development of a food 152
categorization system, with food rejection being the behavioral consequence of an immature 153
food categorization system. From this perspective, we would expect children with poor 154
discrimination abilities in the food domain to demonstrate higher food rejection tendencies 155
than children with high discrimination abilities. 156
157
H3 = Food categorization is mainly color dependent, but color is not important per se. Rather, 158
it conveys information about the typicality of a given food exemplar. As a result, we would 159
expect food items with atypical colors to be more prone to categorization errors than food 160
items with typical colors. 161
162
To investigate these three hypotheses, we conducted a food categorization task with children 163
aged 2-4 and 4-6 years (plus an additional control group of adults), involving the use of fruit 164
and vegetable categories. We chose these categories because by this age, children have 165
usually encountered several exemplars of these food items and developed the corresponding 166
taxonomic categories (Nguyen & Murphy, 2003). Fruit and vegetables were also chosen 167

because they are likely to be rejected by children in this age range. Moreover, to gain a 168
sensitive measure of children’s categorization abilities, we needed two categories that were 169
not too distant from each other, regarding false relatedness effects (it is more difficult to 170
answer “No” to the question “Is a vegetable a fruit?” than to the question “Is a vegetable a 171
car?”; see Smith & Medin, 1981). It has been argued that from an early age, children 172
distinguish accurately between natural items (e.g., food) and artificial items (Mandler & 173
McDonough, 1993) and between categories within the food domain such as biscuit and fruit 174
(Brown, 2010). 175
2 Methods 176
2.1 Participants 177
The participants were 79 children: 40 children aged between 27 and 46 months (M = 36.1 178
months, SD = 5.7; 24 girls and 16 boys) and 39 children aged between 48 and 78 months (M = 179
63.7 months, SD = 8.7; 20 girls and 19 boys). The children were pupils at a preschool in the 180
Lyons urban area (France), and were predominately European and recruited from middle-181
class communities. Prior to the study, the children’s parents filled out a questionnaire about 182
their food rejection (Child Food Rejection Scale6, CFRS; Rioux, Lafraire, & Picard, 183
submitted) and exposure to the fruits and vegetables presented to the children during the 184
experiment. The children’s scores on the CFRS ranged from 16 to 50 (M = 33.5, SD = 7.8), 185
and were normally distributed (Shapiro-Wilk test, W = 0.98, p = 0.42). These scores obtained 186
via parental report were used as the predictive measure of children’s own food rejection 187
tendencies. Their exposure scores ranged from 3 to 107 (M = 8.4, SD = 1.5) and were not 188
normally distributed (W = 0.8, p < 0.05). Neither of these scores (CFRS and exposure scores) 189
6 The Child Food Rejection Scale is a short and easy-to-administer scale, in which caregivers respond for their
child. It was developed to enable the assessment of food neophobia and pickiness in children aged 2-7 years, and
includes two subscales: one measuring children’s food neophobia and one measuring their pickiness. 7 Children’s scores on the Child Food Rejection Scale can range from 11 to 55. Their exposure scores can range
from 0 to 10.

were correlated with age (Pearson’s correlation, r = -0.13, p = 0.24, and Spearman’ 190
correlation r = 0.06, p = 0.6) and neither varied according to sex (as attested by a Student’s t 191
test, both ps > 0.06). It is interesting to note that the absence of any influence of age on food 192
rejection scores within this age range (2-6 years old) is consistent with previous findings 193
(Adessi, Galloway, Visalberghi & Birch, 2005; Cook, Wardle & Gibson, 2003; Koivisto & 194
Sjöden, 1996; Rioux et al. submitted). It suggests that food rejections increase rapidly around 195
the age of two years, when children are liable to ingest toxic compounds because of their 196
growing mobility, remains quite stable until 6-7 years and slowly decrease thereafter when 197
fewer foods are novel to children. 198
A control group of adults (n = 30) also performed the categorization task (Adult sample 1). 199
These participants were either recruited from a university or were preschool employees. Two 200
additional adult samples (Sample 2: n = 79 (children’s parents); and Sample 3: n = 10) were 201
used to rate the kind and color typicality of our food set. 202
2.2 Stimuli 203
Following Macario’s lead (1991, Exp. 2 and 3), we tested the children with photographs of 204
some familiar fruit and vegetables. Some photographs had typical colors (e.g., a purple 205
beetroot), while some had atypical, but still real, colors (e.g., a yellow beetroot). The main 206
difference between Macario’s experiment and the present study was the use of only real food, 207
that is to say, even if yellow is an atypical color for a beetroot, this variety can still be found 208
in supermarkets and greengrocer’s stores. None of our colors were anomalous for a given type 209
of food. 210
To generate our set of foods, we first visited a school canteen to see which foods were 211
available to children, and which recipes were usually proposed. On this basis, we selected six 212
vegetables that were commonly served and were available in different colors (carrots, 213

tomatoes, eggplants, beetroots, bell peppers and zucchinis), and three fruits (apples, pears and 214
citrus fruits)8. Next, to control for fruit and vegetable typicality, as several authors have 215
demonstrated that typical items are easier to recognize and categorize (Hayes & Taplin, 1993; 216
Mervis & Pani, 1980; Murphy, 2002), we followed Barsalou (1985)’s and Chrea, Valentin, 217
Sulmont-Rossé, Hoang Nguyen &Abdi (2005)’s methodologies. The parents of the children 218
in our sample (Adult sample 2) were therefore asked to indicate on a 7-point scale for each of 219
the nine food items whether they were good examples of the fruit or vegetable category in 220
question. No pictures were used for this procedure. For example, we asked adult participants 221
to imagine a carrot and then rate its typicality compared to other vegetables on the 7-point 222
scale. The purpose of this first assessment was to determine whether in general, carrots were 223
judged to be more typical than beetroots for instance. The results are set out in Table 1 and 224
showed for instance, that carrots were judged to be more typical vegetables than beetroots 225
because typicality’s rating for carrot was judged to be 6.30 while it was judged to be 3.91 for 226
beetroots. 227
Table1 (single column fitting image): Typicality rated by adults (on a 7-point scale) for the 228
entire food set. 229
Food items
Typicality
rating
Typicality
ranking
carrot 6.30 1
zucchini 6.14 2
tomato 5.33 3
bell pepper 4.60 4
eggplant 4.41 5
beetroot 3.91 6
apple 6.55 1
pear 6.29 2
citrus fruit 5.12 3
Note. For citrus fruit, we averaged the typicality rates for orange and grapefruit. 230
8 We chose the citrus fruit family (and not just orange or grapefruit) because of the limited availability of fruits
in different colors in the season the experiment was conducted.

For each of the six vegetables and three fruits, we chose four varieties differing in color. We 231
then asked 10 adults (Adult sample 3) to indicate the typicality (either typical or atypical) of 232
the color chosen for each vegetable and fruit (the typicality of the color for each food item 233
was independent of its kind typicality assessed with the adult sample 2).9. From this 234
assessment we were able to know that the orange carrot was typically colored while the 235
purple carrot was atypically colored for instance. 236
Finally, to control for shape effects, each food item was cut either into quarters, slices or 237
cubes, ensuring that the chosen shape was the one in which a given vegetable/fruit was most 238
commonly served in the school canteen we visited (e.g., beetroots were commonly served cut 239
into small cubes, so this was the shape we chose for this vegetable; see Table 2). We decided 240
to use cut fruit and vegetables instead of whole food items to gain in ecological validity. 241
Indeed, as the purpose of the study was to understand how children perceived and categorized 242
their food in the plate and to determine the factors that trigger rejections, we wanted to 243
present them with food they actually can encounter in everyday life, for example in school 244
canteens. In such settings, children encounter starters composed of beetroots cut in small 245
cubes rather than whole beetroots for instance, and sometimes they don’t know what the 246
whole vegetable resembles. 247
Table 2 (1.5 column fitting image): Description of the entire food set. 248
Zucchini
(slice)
Carrot
(slice)
Tomato
(quarter)
Bell pepper
(quarter)
Eggplant
(cube)
Beetroot
(cube)
Green (T) Orange (T) Red (T) Green (T)
Dark purple
(T) Purple (T)
Dark green
(T)
Dark orange
(T) Dark red Yellow (T) Light purple White
Light green Yellow Yellow Red (T) White Pink
9 We chose a 7-point scale to assess fruit and vegetable typicality because we wanted to arrange the items
according to their typicality in the different blocks of pictures. However, we followed Macario’s lead and
assessed color typicality with a binary scale, in order to gain an initial impression of the role of color typicality in
food categorization.

Yellow Purple Green Orange Green Yellow
Apple
(quarter)
Pear
(cube)
Citrus fruit
(slice)
Green (T) Yellow (T) Green (T)
Red (T) Green (T) Yellow (T)
Brown Brown Pink (T)
Yellow (T) Red Orange (T)
Note. (T) = typical color. The colors reported here are the skin colors of each fruit or 249
vegetable. 250
251
The different foods were then cooked (but not peeled, as we wanted to retain the differences 252
in colors) and photographed, controlling for contrast and luminosity. The visual stimuli were 253
then printed separately on cards measuring 10 x 15 cm (see Appendix for the 36 food 254
pictures), and divided into three blocks of 12 pictures each (eight vegetable pictures and four 255
fruit pictures per block; see Table 3). 256
Table 3 (single column fitting image): Characteristics of the three blocks of food pictures. 257
Block A Block B Block C
4 carrots (1) 4 zucchinis (2) 4 tomatoes (3)
4 bell peppers (4) 4 eggplants (5) 4 beetroots (6)
4 pears (2) 4 apples (1) 4 citrus fruits (3)
258
Note. The numbers in brackets are the typicality rankings for each type of vegetable and fruit. 259
Each block contained the same number of food items, cut in quarters, slices or cubes. For 260
example, in Block A the four colored varieties of carrots were cut into slices, the varieties of 261
bell peppers were cut into quarters, and the varieties of pears were cut into cubes. Moreover, 262
in each block, the two kinds of vegetables differed considerably in typicality. Twelve 263
additional stimuli, which were neither fruit nor vegetables, were used in a practice session 264

(four pictures of cats, four pictures of dogs, and four pictures of cars, differing in terms of 265
their overall colors). 266
2.3 Procedure 267
Children were tested individually for approximately 15 minutes in a quiet room at their 268
school. They sat at a table, with the experimenter on their left side. There were three parts to 269
the experiment, run successively and in a constant order for all the children. 10
270
Part 1- Forced sorting task. The experimenter explained to the child that they were going to 271
play a game with pictures and the rule was to sort them into two different boxes according to 272
their categories. The game began with a familiarization phase where eight pictures of animals 273
and four pictures of cars were shown simultaneously to the children (see Fig. 1). The 274
experimenter explained that the child first had to find the animal pictures, and put them in the 275
same box. Then the car pictures had to go in the other box. During this familiarization phase, 276
the experimenter gave the children feedback and corrected their mistakes. Afterwards, the 277
experimenter introduced the fruit and vegetable pictures, and asked the child to find the 278
vegetable pictures first and put them in the same box, and then put the fruit pictures in the 279
other box. Each child carried out this sorting task for two blocks of food pictures without any 280
feedback from the experimenter. The order in which the pictures were placed on the table was 281
randomized for each participant. Additionally, the order in which the blocks were provided 282
was counterbalanced across participants (e.g., Participant 1 sorted blocks A and B, while 283
Participant 2 sorted blocks A and C, etc.). 284
Figure 1 (single column fitting image): Arrangement of cards on the table. 285
10
It should be noted that the adult control group (Sample 1) only completed the first part of the study (forced
sorting task).
Fruit box

286
287
288
289
290
291
Note. This arrangement allowed the children to see all the pictures rapidly without having to 292 make large exploratory eye or body movements. This drawing was realised based on 293 illustrations from « Clic images 2.0 - Canopé académie de Dijon » : http://www.cndp.fr/crdp-294
dijon/clic-images/. 295
The experimenter recorded the type of response for each vegetable (hit or miss) and for each 296
fruit (correct rejection or false alarm). We then assigned to each participant a hit score (i.e., 297
number of cards placed in the vegetable box when the picture was a vegetable) and a false 298
alarm score (i.e., number of cards placed in the vegetable box when the picture was a fruit). 299
Hit scores could vary between 0 and 16, and false alarm scores between 0 and 8. Both these 300
scores were important to take into account to evaluate children performances to the task. For 301
example a child who would have placed the twelve pictures of block A in the vegetable box 302
would have a high hit score (because she put in the right box all the vegetables from block A). 303
However her categorization performances would be nevertheless poor as she would have put 304
also all the fruit pictures from block A in the vegetable box and it will be indicated by a high 305
rate of false alarms. Based on these two scores (hit and false alarm), we measured an index of 306
discriminability (A’), and an index of the child’s decision criterion (B’’) (these indexes are 307
widely used within the signal detection theory, see Grier, 1971; Stanislaw & Todorov, 1999). 308
A’ ranged from 0 to 1, with .50 indicating responses at chance level, and 1 indicating 309
maximum discriminability. B’’ ranged from -1 to +1, with -1 indicating a liberal criterion 310

(e.g., children tending to place cards in the vegetable box whatever the pictures), and 1 311
indicating a conservative criterion (e.g., children tending to place cards in the fruit box 312
whatever the picture). Both indices were computed according to Grier’s formulas (Grier, 313
1971): A’ = ½ + [(y - x)(1 + y - x) / 4y(1 - x)], and B’’ = [y(1 - y) - x(1 - x)]/[(y(1 - y) + x(1 - 314
x)] where y stood for the probability of a hit and x corresponded to the probability of a false 315
alarm. 316
Part 2- Food rejection task. In the second part of the experiment, children were shown a third 317
block of food pictures (arranged in a manner similar to that of the sorting task). In this task, 318
children were asked to put the different foods they were unwilling to taste in the bin. The 319
main objective of this task was to associate food rejection behaviors with performances on the 320
sorting task. In order to make the test more tangible to the children, we used an actual small 321
bin that was already present in the room and therefore familiar to them. For each child, the 322
number and type of items placed in the bin was recorded by the experimenter. 323
Part 3- Color naming task. Following Macario (1991, Exp. 2 and 3)’s work, the last part of 324
the experiment consisted of an examination of color naming abilities, so as to assess the 325
potential relationship between color naming and the categorization of colored vegetables. 326
Eleven monochrome pictures in colors extracted from the fruit and vegetable pictures (light 327
green, dark green, light purple, dark purple, red, dark red, yellow, orange, brown, pink and 328
white) were printed separately on 5 x 5-cm cards and shown to the child. In a color-word 329
production subtask, we asked the children to name each color. In a color-word comprehension 330
subtask, we told the children the name of a color and asked them to point out the 331
corresponding picture card. The order of the two subtasks was counterbalanced across 332
children. For each subtask, we credited a child with knowing a particular color word if she 333
produced or understood the correct color word (scoring 0 when the child did not know the 334
color word and 1 when the child did know it). Note that, for the color-word production 335

subtask children labeling the "light green" panel as just "green", or the “dark purple” panel as 336
just “purple” were counted as correct responders. Each child could thus score between 0 and 337
11 on the word production subtask and on the word comprehension subtask. As scores on the 338
two subtasks were closely correlated (as attested with Spearman’s coefficient: r = 0.70, p < 339
0.001), we averaged these two scores. Each child was therefore assigned a single color-word 340
knowledge score between 0 and to 11. 341
3 Results 342
3.1 Sorting task 343
To test the hypothesis that children’s ability to perform categorization in the food domain 344
improves with age, for each of the three age groups (2-4 years, 4-6 years, and adults), we 345
assessed mean hit and false alarm responses, as well as A’ and B” (results set out in Table 4). 346
Table 4 (2- column fitting image): Type of response and signal detection indices for each age 347
group. 348
Age
group
Hit
percentage
False alarm
percentage
discriminability
A'
Decision criterion
B"
2-4 years 73.4 44.0 0.72 -0.07
4-6 years 75.6 29.1 0.81 -0.05
adults 88.1 9.2 0.94 0.12
349
3.1.1 Type of response 350
Overall, children had a high rate of hits (M = .74, SD = .14), and a moderate rate of false 351
alarms (M = .36, SD = .23). 352
More specifically, the results set out in Table 4 indicate that the average hit rate for children 353
aged 2-4 years was 0.73 (SD = .08), while the average hit rate for children aged 4-6 years was 354
0.75 (SD = .15). The adults performed better on the task, with higher hit rates (M = .88, SD = 355

.08). An analysis of variance (ANOVA) on the percentage of hits, with age (3 groups) as a 356
predictive variable, indicated an effect of age (F = 11.94, p < 0.0001). A post hoc LSD 357
analysis revealed that hit rates for the two children’s groups did not differ significantly, 358
whereas there was a significant difference between the 2- to 4-year-old children and the adults 359
(p < 0.0001), as well as between the 4- to 6-year-old children and the adults (p = 0.0004). 360
The mean false alarm rate for children aged 2-4 years was 0.44 (SD = .14), while the average 361
false alarm rate for children aged 4-6 years was 0.29 (SD = .23). The adults performed better 362
on the task, with lower false alarm rates (M = .09, SD = .09). A one-way ANOVA also 363
indicated an effect of age (F = 28.96, p < 0.0001). More specifically, a post hoc LSD analysis 364
revealed that false alarm rates differed significantly between the two children’s groups (p = 365
0.002), as well as between the children and the adult participants (p < 0.0001 for 2-4 years vs. 366
adults, and p < 0.0001 for 4-6 years vs. adults). 367
3.1.2 Discriminability A’ 368
A’ for children was .77 (SD = .13; range = .50-1). Results (see Table 4) indicated that mean 369
A’ for children aged 2-4 years was 0.72 (SD = .11), while the mean hit rate for children aged 370
4-6 years was 0.81 (SD = .12). The adults performed better on the task (M = .94, SD = .04). 371
An ANOVA on A’ with age (3 groups) as a predictive variable indicated an effect of age (F = 372
36.7, p < 0.0001; Fig. 2). Post hoc LSD analysis revealed significant differences between the 373
groups (p = 0.002 between the two children’s groups, p < 0.0001 between the adults and 374
younger children, and p < 0.0001 between the adults and older children). 375
Figure 2 (single column fitting image): Discriminability A’ for each of the age groups. 376

377
Note. Significant differences between the age groups are marked * for p < 0.05, ** for p<0.01 378
and *** for p < 0.001. 379
To identify the variables that were most predictive of discriminability variation among the 380
children, we carried out a stepwise procedure using the AIC11 as our criterion for model 381
selection. The predictive variables we retained were sex (boy/girl), age (younger/older), order 382
of block presentation (AB/AC/BA/BC/CA/CB), food rejection (scores obtained to the CFRS 383
questionnaire possibly ranging from 11 to 55) and exposure to fruit and vegetables (scores 384
possibly ranging from 0 to 11). The first variables were discontinuous, and the last two 385
continuous. This model significantly predicted discriminability variation across our sample (p 386
= 0.0003) and explained 26% of this variation, as demonstrated by the adjusted R². It revealed 387
effects of age (F = 6.11, p = 0.016) and rejection (F = 4.99, p = 0.029). As attested by post 388
hoc LSD analyses, the older children performed significantly better than the younger children 389
11
The Akaike information criterion (AIC) is a measure of the relative quality of different statistical models. The
retained model is usually the one with the lowest AIC (Hu, 2007).

(see Fig. 2). Furthermore, the highly neophobic and picky children performed more poorly on 390
the task than the less neophobic and picky children (see Fig. 3). 391
Figure 3 (single column fitting image) : Discriminability A’ as a function of children’s food 392
rejection scores. 393
394
Note. The Pearson coefficient correlation indicated a significant and negative correlation 395
between the children’s food rejection scores and discriminability A’ (r = -0.27, p = 0.014). 396
397
3.1.3 Decision criterion B’’ 398
The mean B’’ for children was -.06 (SD = .037; range = -1 to 1), meaning that overall, the 399
children were neither liberal nor conservative in their responses. Results (see Table 4) 400
indicated that the mean B’’ for children aged 2-4 years was -0.07 (SD = .41), while the mean 401
B’’ for children aged 4-6 years was -0.05 (SD = .34). The adults’ mean B’’ was quite similar 402
(M = .12, SD = .63), indicating that, like the children, they were neither liberal nor 403
conservative in their responses. An ANOVA on B’’, with age (3) as the predictive variable, 404
did not indicate any age effect. 405

As with A’, to select the predictive variables that best explained variations in B” across our 406
child sample, we carried out a stepwise procedure using the AIC as the criterion for model 407
selection. The sole predictive variable we retained was food rejection score (possibly ranging 408
from 11 to 55). However, this model did not significantly predict variation in B’’ (p = 0.069). 409
Unlike A’, therefore, neither the children’s characteristics nor the experimental setting 410
affected B”. 411
3.1.4 Influence of A’ and B” on food rejection scores 412
To test the hypothesis that food rejection is the behavioral consequence of an immature food 413
categorization system, we conducted a regression analysis with A’ and B” as predictive 414
variables, and food rejection score obtained from the CFRS questionnaire as the predicted 415
variable12
. This model significantly predicted variation in the food rejection score across our 416
child sample (p = 0.019), but explained rather a low proportion (7.5%) of this variability, as 417
demonstrated by the adjusted R². Results revealed an effect of A’ on food rejection scores (F 418
= 4.79, p = 0.031). This effect indicated that children who performed poorly on the sorting 419
task were more neophobic and picky than children who performed well on it (see Fig. 2). 420
3.2 Food rejection task 421
Spearman’s correlation coefficients failed to reveal any significant correlation between the 422
number of pictures binned during the food rejection task and either children’s food rejection 423
scores obtained from the CFRS questionnaire (r = 0.06, ns) or their fruit and vegetable 424
exposure scores (r = 0.10, ns). To assess the potential influence of picture characteristics on 425
the decision to place them in the bin, we ran an ANOVA (with post hoc LSD analysis) on the 426
12
A’ represented children’s sensitivity to stimulus differences, that is to say, their ability to distinguish between
fruit and vegetables in the present experiment (MacMillan & Creelman, 2005). By contrast, B” reflected their
leaning toward one response or the other, that is to say, their inclination to favor the vegetable box over the fruit
box in the present experiment (MacMillan & Creelman, 2005). These indices therefore captured the degree of
maturity of their food categorization system and the types of classification strategy that might be involved.
binning percentage for each picture, with category (2), shape (3), color (11) and color 427
typicality (2) as predictive variables. This model did not significantly predict the proportion of 428
times a picture was binned and did not reveal any effect of picture characteristics. 429
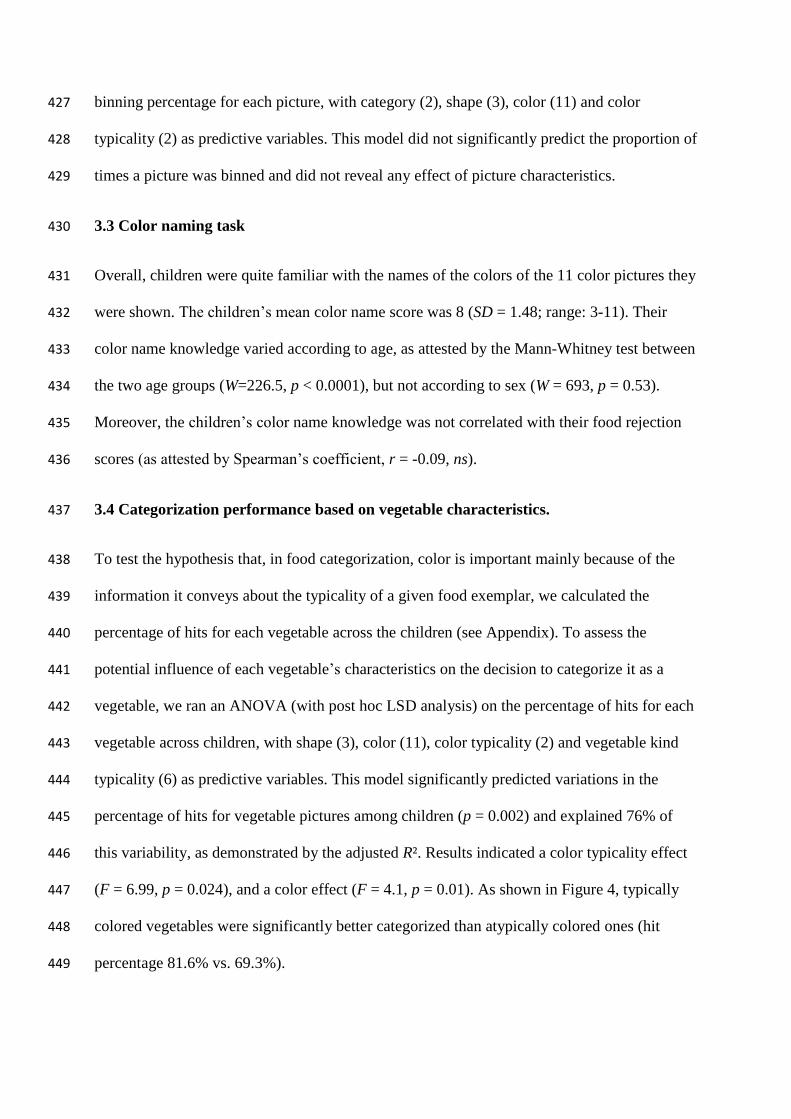
3.3 Color naming task 430
Overall, children were quite familiar with the names of the colors of the 11 color pictures they 431
were shown. The children’s mean color name score was 8 (SD = 1.48; range: 3-11). Their 432
color name knowledge varied according to age, as attested by the Mann-Whitney test between 433
the two age groups (W=226.5, p < 0.0001), but not according to sex (W = 693, p = 0.53). 434
Moreover, the children’s color name knowledge was not correlated with their food rejection 435
scores (as attested by Spearman’s coefficient, r = -0.09, ns). 436
3.4 Categorization performance based on vegetable characteristics. 437
To test the hypothesis that, in food categorization, color is important mainly because of the 438
information it conveys about the typicality of a given food exemplar, we calculated the 439
percentage of hits for each vegetable across the children (see Appendix). To assess the 440
potential influence of each vegetable’s characteristics on the decision to categorize it as a 441
vegetable, we ran an ANOVA (with post hoc LSD analysis) on the percentage of hits for each 442
vegetable across children, with shape (3), color (11), color typicality (2) and vegetable kind 443
typicality (6) as predictive variables. This model significantly predicted variations in the 444
percentage of hits for vegetable pictures among children (p = 0.002) and explained 76% of 445
this variability, as demonstrated by the adjusted R². Results indicated a color typicality effect 446
(F = 6.99, p = 0.024), and a color effect (F = 4.1, p = 0.01). As shown in Figure 4, typically 447
colored vegetables were significantly better categorized than atypically colored ones (hit 448
percentage 81.6% vs. 69.3%). 449

Figure 4 (single column fitting image): Hit percentages for atypically and typically colored 450
vegetables. 451
452
Note. * p < 0.05, ** p < 0.01. 453
Concerning the color effect, yellow, white and pink vegetables were poorly categorized (see 454
Fig. 5), compared with, red, orange and dark green vegetables. However, post hoc LSD 455
analysis revealed that none of the colors was significantly less well recognized as a potential 456
color for vegetables.457

Figure 5 (2-column fitting image): Hit percentage for each vegetable color. 458
459
460

24
4 Discussion 461
The present study had a threefold aim: (i) investigate 2- to 6-year-old children’s ability to 462
distinguish between fruit and vegetable items in a categorization task; (ii) find evidence for 463
the putative relationship between food rejection and food categorization performance in 464
young children; and (iii) shed light on the mechanisms behind the central role of color in food 465
categorization. To our knowledge, it was the first study to investigate the potential 466
relationship between food rejection and the typical development of the food categorization 467
system, as well as the first attempt to examine the role of color typicality in children’s food 468
categorization. 469
4.1 Do children’s food categorization performances improve with age? 470
Results indicated that children as young as 2 years were able to distinguish fairly efficiently 471
between different food categories (mean discriminability for 2- to 4-year-olds: .73), even with 472
complex food stimuli that varied in shape and color. This result proved that our methodology 473
was appropriate for this age range, and extended the findings reported by Nguyen and 474
Murphy (2003), who reported that children can acquire both fruit and vegetable taxonomic 475
categories as early as 3 years. However, while the younger children (2-4 years) displayed a 476
high rate of hits (73%), they also displayed a high rate of false alarms (44%). As Cashdan 477
pointed out (1994), this meant that their food categorization system was rather crude and still 478
under construction. Results also indicated a clear developmental effect. The children’s ability 479
to correctly categorize items on the basis of their basic visual properties increased with age. 480
While both younger and older children had hit rates of around 0.74, there was a clear and 481
significant fall in the mean false alarm rate for older children (0.44 for 2- to 4–year-olds vs. 482
0.29 for 4- to 6-year-olds). Consequently, discriminability was greater at 4-6 years (as shown 483
in Fig. 2), suggesting that categorization abilities improve between the ages of 2 and 6 years. 484

25
This finding is consistent with previous studies of food categorization development in 485
children (see Bovet et al., 2005; Nguyen & Murphy, 2003). However, the food categorization 486
system was still under construction at 4-6 years, as attested by the adults’ significantly better 487
performances (both hit and false alarm rates were significantly higher for adults, and 488
consequently discriminability as well). As food taxonomic categorization does not take place 489
solely at a perceptual level (where items are classified according to their physical 490
resemblance), but rather at a conceptual level (where items are classified according to 491
functional or conceptual knowledge, with little perceptual resemblance between category 492
members; Rosch & Mervis, 1975; Tomikawa & Dodd, 1980), we can assume that the children 493
had not yet completely developed taxonomic categories within the food domain and mostly 494
used perceptual cues to categorize items. 495
Across the children, we did not observe a clear response bias toward one answer (“It’s a 496
vegetable”) rather than another (“It’s a fruit”), as attested by a mean B” of -0.06. Moreover 497
we failed to observe any changes with age: no difference in mean B” between either the two 498
age groups (2-4 and 4-6 years) or the children and adult controls. As a consistent pattern was 499
found in adults and children, we can reasonably rule out the possibility that children’s 500
responses in our study were elicited by the mere presence of the experimenter and social 501
desirability effects, as can be the case in studies with young children (Lavin & Hall, 2001). 502
4.2 Is food rejection the behavioral consequence of an immature food categorization 503
system? 504
Our findings showed that children’s food rejection scores and sorting task performances were 505
significantly correlated (Pearson’s correlation coefficient: r = -0.27, p = .014; see Fig. 3). 506
Further statistical analyses indicated that highly neophobic-picky children performed more 507
poorly than the other children on the sorting task (as attested by the retained model predicting 508
A’ variation among children), suggesting that the children’s level of food rejection partly 509

26
predicted their performance on the fruit and vegetable categorization task. From this 510
perspective, we could argue that food neophobia and pickiness acted as restraining factors on 511
food discriminability, that is to say, they behaved as dampers on the development of the food 512
categorization system. At a given age, strongly neophobic and picky children will thus have 513
poorer food category content than other children, because they do not accept new items in the 514
food category as easily and have fewer learning opportunities with food categories. Indeed 515
caregivers of children who display high food rejection tendencies, are often discouraged to 516
present fruit and vegetables to their children (Heath, Houston-Price & Kennedy, 2011), 517
leading to fewer experiences and it is known that children’s categorization abilities differ as a 518
function of their experience (Chi, Hutchinson & Robin in 1989). This claim was supported by 519
the fact that neophobic-picky children performed the same as the younger children in terms of 520
hit and false alarm rates (mean hit and false alarm rates for neophobic-picky children: 0.76 521
and 0.41). Furthermore, the non-neophobic-picky children performed just as well as the older 522
children in terms of hit and false alarm rates (mean hit and false alarm rates for non-523
neophobic-picky children: 0.77 and 0.31). These results were especially striking, given that 524
food rejection scores were not correlated with age. 525
Statistical analyses also revealed that children with a poor ability to distinguish between fruits 526
and vegetables (i.e., low A’) tended to be more neophobic and picky than the children with 527
high discrimination abilities (as attested by the model predicting variations in food rejection 528
scores across children). This additional finding indicated that children’s discrimination 529
abilities were predictive of their level of food rejection, thus supporting the premise that food 530
rejection is partly the behavioral consequence of an immature food categorization system 531
(Brown, 2010; Lafraire et al., 2016). This finding possibly accounts for the recognized 532
positive effect of visual food exposure on food rejection and attitudes towards food (Birch, 533
McPhee, Shoba, Pirok, & Steinberg, 1987; Birch & Fisher, 1998). Exposure would facilitate 534

27
the recognition process (Lafraire et al., 2016; Zajonc, 1968), by enriching food category 535
content and food prototypes and therefore reduces the probability that food items will not be 536
judged as food category members because they are not close enough to the food prototype. 537
Finally, we could be facing a vicious circle: food rejections seem to be the behavioral 538
consequences of a developing categorization system. Consequently, caregivers may be 539
discouraged to present fruit and vegetables to their children, leading to fewer learning 540
opportunities and to hinder the development of the food categorization system. Focusing on 541
conceptual development could then be an efficient manner to tackle food rejections behaviors 542
as demonstrated by a recent study from Grishover and Markmann (2013). Indeed, in their 543
research they compared usual educational programs about nutrition to a knowledge based- 544
approach nutritional education program (which provided children with a rich conceptual 545
framework about food) and found that, children who attended to the latter program ate more 546
vegetables at snack time. 547
However, contrasting with these promising results linking food rejection to categorization 548
development in children, scores on the food rejection scale were not correlated with their 549
binning behaviors, leading us to conclude that, contrary to parental reports, the food rejection 550
task was not a relevant measure for associating food rejection behaviors with sorting 551
performances. Two main reasons may explain this negative result. First, this task was often 552
regarded as a game by the children, as they were allowed to thrown food away-a behavior 553
banned in the school canteen. Moreover, some of the comments made during this task by 554
nursery staff indicated that the children did not display their normal food rejection behaviors 555
(e.g., while one child was throwing away almost all the pictures into the garbage, a staff 556
member told the experimenter that this child usually ate nearly everything). Secondly another 557
reason to have some doubt regarding the reliability of the binning behaviors as an appraisal of 558
the food rejection behaviors is that, we assessed the predictive validity of the food rejection 559

28
questionnaire in a previous study (Rioux, et al. submitted) and found that caregivers were 560
relevant predictors of their children’s behaviors toward foods. 561
4.3 Is color important because it conveys information about the typicality of a given food 562
item? 563
Our results replicated Macario’s findings (1991) about the importance of color in food 564
categorization. Indeed, contrary to shape, color information was a salient variable predicting 565
the hit percent of a given vegetable (as attested by the model we retained predicting the 566
variation in the hit percentage across vegetables). Possibly explaining this result is that within 567
the food domain, shape usually changes across serving and recipes for a given food item, 568
while color is a more constant feature. 569
Results also indicated that colors are important in food categorization mainly because they 570
convey information on typicality. Indeed, among the children, color typicality was the most 571
salient variable predicting the hit percentage of a given vegetable (as attested by the model we 572
retained predicting the variation in the hit percentage across vegetables). Moreover, the effect 573
of color per se described above may also have been partly explained by typicality. Yellow, 574
pink and white vegetables were the least well recognized vegetables (i.e., lowest hit 575
percentages for these vegetables; see Appendix). Interestingly, in our vegetable sample 576
(carrots, tomatoes, eggplants, beetroots, bell peppers and zucchinis), white, pink and yellow 577
were the only colors that were never typical for a given vegetable (compared with dark green, 578
red or orange, for example, which were typical for zucchinis, tomatoes and carrots). 579
Concerning the color naming task, we did not replicate Macario’s finding (1991, Exp. 3), 580
which associated children’s ability to name colors with their discrimination of anomalously 581
colored objects, as we failed to find any significant correlations between color name 582
knowledge and sorting task performances across children. However, as even young children 583

29
were quite familiar with color names (mean color name knowledge for the youngest group of 584
children: 7/11), it was maybe not possible to distinguish between children on this basis. 585
Moreover, some comments made during this task by nursery staff indicated that the very 586
young children often did know almost every color they were shown, but were too shy or 587
intimidated by the experimenter to name them (it should be recalled that this was the only part 588
of the experiment where the children had to talk), thereby artificially lowering their color 589
knowledge scores. 590
4.4 Conclusion and perspectives 591
In conclusion, our results validated the three experimental hypotheses, by providing evidence 592
in favor of (i) an improvement in children’s food categorization abilities from the age of 2-3 593
years, (ii) a negative correlation between food rejection and food categorization performances 594
in young children; and (iii) the central role of typicality in explaining the importance of color 595
in food categorization. 596
Nonetheless, our study had several limitations. First, we did not control for color preferences 597
or fruit/vegetable preferences, whereas Carey (2009) and Murphy (2002) pointed out that a 598
priori preferences for one of the categories tested in categorization task should be assessed. 599
Second, color typicality was assessed by an external sample of 10 adults, rather than by the 600
children themselves. In future, it would be worthwhile assessing children’s preferences and 601
opinions about color typicality. When children are as young as 2 years, it is rather difficult to 602
ask them directly if they think that a color is typical for a given vegetable, as we did for 603
adults. It might therefore be helpful to implement a puppet procedure (e.g., Lavin & Hall, 604
2001), by asking children to describe a tomato to a puppet that does not know what it is, and 605
noting which colors the children use to describe it. Third, the blocks of food pictures 606
contained different numbers of typically and atypically colored food items, as we used real 607

30
fruit and vegetables for our stimulus sample and were therefore constrained by the availability 608
of fruit and vegetable varieties at the time of the experiment. It would thus be interesting to 609
balance typically and atypically colored food items more evenly in future experiments testing 610
this effect on children’s food categorization. 611
Despite these limitations, we believe that the present experiment opened up promising new 612
avenues of research, and shed light on the cognitive mechanisms underlying different kinds of 613
food rejection (neophobia and pickiness), as well as on the central role of color in food 614
categorization processes. However these are only preliminary conclusions and more research 615
is needed to gain a better understanding of the mechanisms that come into play. For instance, 616
it will be of interest to investigate children categorization performances with other food 617
categories that are less prone to rejections (such as starchy foods) and investigate whether the 618
negative correlations between categorization performances and food rejections scores 619
continue to exist. Another line of research would be to investigate category-based induction in 620
children in relation to their level of food rejection. As it is often stated that “one important 621
function of categories is to allow inferences that extend beyond surface appearances” 622
(Gelman & O’Reilly, 1988, p. 876) and highly neophobic and picky children in our study 623
performed poorly on the food categorization task, category-based induction and food 624
rejections scores may as well be correlated. Finally, it would be worth exploring the effect of 625
visual food exposure (in an ecological setting such as a school canteen, where food rejection 626
behaviors are commonly observed) on pupils’ attitudes towards foods in the light of the 627
present experiment’s results. If food rejection acts as a damper on the development of the 628
food categorization system, and if exposure to food variety (foods differing in color, shape, 629
texture, etc.) enriches food category content and facilitates the recognition process (Lafraire et 630
al., 2016), highly neophobic-picky children with weak discriminability and recognition 631
abilities should greatly benefit from this type of exposure. 632

31
Acknowledgments 633
The authors would like to acknowledge the financial support they received from the Daniel 634
and Nina Carasso Foundation. We would also like to thank Thomas Arciszewski (PsyCLE 635
research center) for his help with the color photographs used in the study. We are also grateful 636
to the nursery staff, the children and their parents for their helpful collaboration. Finally, we 637
would like to thank E. Wiles-Portier who proofread our article. 638
639
32
References 640
Addessi, E., Galloway, A. T., Visalberghi, E., & Birch, L. L. (2005). Specific social 641
influences on the acceptance of novel foods in 2–5-year-old children. Appetite, 45(3), 642
264-271. 643
Ahearn, W. H., Castine, T., Nault, K., & Green, G. (2001). An assessment of food acceptance 644
in children with autism or pervasive developmental disorder-not otherwise specified. 645
Journal of Autism and Developmental Disorders, 31, 505-511. 646
Bandini L. G., Anderson S. E., Curtin C., Cermak S., Evans E. W., Scampini R., Maslin M., 647
& Must A. (2010). Food selectivity in children with autism spectrum disorders and 648
typically developing children. Journal of Pediatrics, 157(2), 259-264. 649
Barsalou, L. W. (1985). Ideals, central tendency, and frequency of instantiation as 650
determinants of graded structure in categories. Journal of Experimental Psychology: 651
Learning, Memory, and Cognition, 11, 629-654. 652
Birch, L. L., & Fisher, J. O. (1998). Development of eating behaviors among children and 653
adolescents. Pediatrics, 101(3), 539-549. 654
Birch, L. L., McPhee, L., Shoba, B. C., Pirok, E., & Steinberg, L. (1987). What kind of 655
exposure reduces children’s food neophobia? Looking vs. tasting. Appetite, 9(3), 656
171-178. 657
Bovet, D., Vauclair, J., & Blaye, A. (2005). Categorization and abstraction abilities in 3-year-658
old children: A comparison with monkey data. Animal Cognition, 8(1), 53-59. 659
Brown, S. D. (2010). The rejection of known and previously accepted foods in early 660
childhood. (Doctoral Dissertation). University of Birmingham Research Archive. 661

33
Carey, S. (2009). The origin of concepts. New York, NY: Oxford University Press. 662
Carruth, B. R., Skinner, J. D., Houck, K., Moran, J., Coletta, F., & Ott, D. (1998). The 663
phenomenon of ‘‘picky eater”: A behavioral marker in eating patterns of toddlers. 664
Journal of the American College of Nutrition, 17, 180-186. 665
Cashdan, E. (1994). A sensitive period for learning. Human Nature, 5(3), 279-291. 666
Cashdan, E. (1998). Adaptiveness of food learning and food aversions in children. Social 667
Science Information, 37(4), 613-632. 668
Chi, M. T. H., Hutchinson, J., & Robin, A. F. (1989). How inferences about novel domain-669
related concepts can be constrained by structured knowledge. Merrill-Palmer Quarterly, 670
35, 27–62 671
Chrea, C., Valentin, D., Sulmont-Rossé, C., Hoang Nguyen, D., & Abdi, H. (2005). Odeurs et 672
catégorisation: Notre représentation mentale des odeurs est-elle universelle ou 673
dépendante de notre culture ? Actes de la 3ème Journée du Sensolier, Paris. 674
Cooke, L., Wardle, J., & Gibson, E. L. (2003). Relationship between parental report of food 675
neophobia and everyday food consumption in 2–6-year-old children. Appetite, 41(2), 676
205-206. 677
Cosmides, L., Tooby, J., & Barkow, J. H. (1992). Introduction: Evolutionary psychology and 678
conceptual integration. In L. Cosmides, J. Tooby, & J. H. Barkow (Eds.), The adapted 679
mind (pp. 3-15). Oxford: Oxford University Press. 680
Dakwins, R. (1976). The selfish gene. Oxford: Oxford University Press. 681
Dovey, T. M., Staples, P. A, Gibson, E. L., & Halford, J. C. G. (2008). Food neophobia and 682
“picky/fussy” eating in children: A review. Appetite, 50(2-3), 181-193. 683

34
Falciglia, G. A., Couch, S. C., Gribble, L. S., Pabst, S. M., & Frank, R. (2000). Food 684
neophobia in childhood affects dietary variety. Journal of the American Dietetic 685
Association, 100(2), 1474-1481. 686
Fodor, J. A. (1983). The modularity of mind. Cambridge, MA: MIT Press. 687
Frith, U., & Happé, F. (1994) Autism: Beyond “theory of mind”. Cognition, 50, 115-132. 688
Gelman, S. A., & O’Reilly, A. W. (1988). Children’s inductive inferences within 689
superordinate categories: The role of language and category structure. Child 690
Development, 59, 876–887. 691
Gerrish, C. J., & Mennella, J. A. (2001). Flavor variety enhances food acceptance in formula-692
fed infants. The American Journal of Clinical Nutrition, 73, 1080-1085. 693
Grier, J. B. (1971). Nonparametric indexes for sensitivity and bias: Computing formulas. 694
Psychological Bulletin, 75, 424-429. 695
Gripshover, S. J., & Markman, E. M. (2013). Teaching young children a theory of nutrition 696
conceptual change and the potential for increased vegetable consumption. 697
Psychological Science, 24(8), 1541–1553. 698
Harris, G. (1993). Introducing the infant’s first solid food. British Food Journal, 95(9), 7-10. 699
Hayes, B. K., & Taplin, J. E. (1993). Developmental differences in the use of prototype and 700
exemplar-specific information. Journal of Experimental Child Psychology, 55, 329-352. 701
Heath, P., Houston-Price, C., & Kennedy, O. (2011). Increasing food familiarity without the 702
tears: a role for visual exposure? Appetite 57, 832–838. 703
Hu, S. (2007). Akaike information criterion. Retrieved from 704
http://www4.ncsu.edu/~shu3/Presentation/AIC.pdf 705

35
Koivisto, U. K., & Sjöden, P. O. (1996). Food and general neophobia in Swedish families: 706
Parent–child comparisons and relationships with serving specific foods. Appetite, 26, 707
107–118. 708
Lafraire, J., Rioux, C., Giboreau, A., & Picard, D. (2016). Food rejections in children: 709
Cognitive and social/environmental factors involved in food neophobia and picky/fussy 710
eating behavior. Appetite, 96, 347-357. 711
Landau, B., Smith, L. B., & Jones, S. S. (1988). The importance of shape in early lexical 712
learning. Cognitive Development, 3, 299-321. 713
Lavin, T. A., & Hall, D. G. (2001). Domain effects in lexical development: Learning words 714
for foods and toys. Cognitive Development, 16(4), 929-950. 715
Lockner, D. W., Crowe, T. K., & Skipper, B. J. (2008). Dietary intake and parents' perception 716
of mealtime behaviors in preschool-age children with autism spectrum disorder and in 717
typically developing children. Journal of the American Dietetics Association, 108, 718
1360-1363. 719
Lumeng, J. C. (2013). Food as a unique domain of social cognition. In M. R. Banaji & S. A. 720
Gelman (Eds.), Navigating the social world (pp. 245-249). Oxford University Press. 721
Macario, J. F. (1991). Young children’s use of color in classification: Foods and canonically 722
colored objects. Cognitive Development, 6(1), 17-46. 723
MacMillan, N. A., & Creelman, C. D. (2005). Detection theory: a user’s guide (second 724
edition). 725
Mandler, J. M., & McDonough, L. (1993). Concept formation in infancy. Cognitive 726
Development, 8, 291-318. London : Lawrence Erlbaum associates Press. 727
Mennella, J. A., Nicklaus, S., Jagolino, A. L., & Yourshaw, L. M. (2008). Variety is the spice 728
of life: Strategies for promoting fruit and vegetable acceptance during infancy. 729

36
Physiology and Behavior, 94(1), 29-38. 730
Mervis, C. B., & Pani, J. R. (1980). Acquisition of basic object categories. Cognitive 731
Psychology, 12, 496-522. 732
Murphy, G. L. (2002). The big book of concepts. Cambridge: MIT Press. 733
Nguyen, S. P., & Murphy, G. L. (2003). An apple is more than just a fruit: Cross-734
classification in children’s concepts. Child Development, 74(6), 1783-1806. 735
Ozonoff, S., Pennington, B., & Rogers, S. J. (2015). Executive function deficits in high-736
functioning autistic individuals: Relationship to theory of mind. Journal of Child 737
Psychology and Psychiatry, 32(7), 1081-1105. 738
Pliner, P., & Hobden, K. (1992). Development of a scale to measure the trait of food 739
neophobia in humans. Appetite, 19(2), 105-120. 740
Pliner, P., Pelchat, M., & Grabski, M. (1993). Reduction of neophobia in humans by exposure 741
to novel foods. Appetite, 20, 111-123. 742
Postorino, V., Sanges, V., Giovagnoli, G., Fatta, L. M., De Peppo, L., Armando, M., … 743
Mazzone. L. (2015). Clinical differences in children with autism spectrum disorder with 744
and without food selectivity. Appetite, 92, 126-132. 745
Rioux, C., Lafraire, L., & Picard, D. (submitted). Development and validation of a new scale 746
to assess food neophobia and pickiness among 2- to 7-years old French children. 747
Rochedy, A., & Poulain, J.-P. (2015). Approche sociologique des néophobies alimentaires 748
chez l’enfant. Dialogue, 209, 55-68. 749
Rosch, E., & Mervis, C. B. (1975). Family resemblance: Studies in the internal structure of 750
categories. Cognitive Psychology, 7, 573-605. 751

37
Ross, B. H., & Murphy, G. L. (1999). Food for thought: Cross-classification and category 752
organization in a complex real-world domain. Cognitive Psychology, 38, 495-553. 753
Rozin, P. (1976). The selection of food by rats, humans and other animals. In J. S. Rosenblatt, 754
R. A. Hinde, E. Shaw, & C. Beers (Eds.), Advances in the study of behavior (pp 21-76). 755
New York: Academic Press. 756
Rozin, P. (1977). The use of characteristic flavorings in human culinary practice. In C. M. 757
Apt (Ed.), Flavor: Its chemical, behavioural, and commercial aspects (pp. 101-127). 758
Boulder, CO: Westview Press. 759
Rydell, A.-M., Dahl, M., & Sundelin, C. (1995). Characteristics of school children who are 760
choosy eaters. The Journal of Genetic Psychology: Research and Theory on Human 761
Development, 156(2), 217-299. 762
Shutts, K., Condry, K. F., Santos, L. R., & Spelke, E. S. (2009). Core knowledge and its 763
limits: The domain of food. Cognition, 112(1), 120-140. 764
Shutts, K., Kinzler, K. D., McKee, C. B., & Spelke. E. S. (2009). Social information guides 765
infants’ selection of foods. Journal of Cognition and Development, 10, 1-17. 766
Shutts, K., Kinzler, K. D., & DeJesus, J. M. (2013). Understanding infants’ and children’s 767
social learning about foods: previous research and new prospects. Developmental 768
Psychology, 49(3), 419-425. 769
Smith, E. E., & Medin, D. L. (1981). Categories and concepts. Cambridge, MA: Harvard 770
University Press. 771
Smith, A. M., Roux, S., Naidoo, N. T., & Venter, D. J. L. (2005). Food choices of tactile 772
defensive children. Nutrition, 21(1), 14-19. 773

38
Stanislaw, H., & Todorov, N. (1999). Calculation of signal detection theory measures. 774
Behavior Research Methods, Instruments, & Computers, 31, 137-149. 775
Stough, C. O., Gillette, M. L. D., Roberts, M., C., Jorgensen, T. D., & Patton, S. R. (2015). 776
Mealtime behaviors associated with consumption of unfamiliar foods by young children 777
with autism spectrum disorder. Appetite, 95, 324-333. 778
Taylor, C. M., Wernimont, S. M., Northstone, K., & Emmet, P. M. (2015) Picky/fussy eating 779
in children: Review of definitions, assessment, prevalence and dietary intakes. Appetite, 780
95, 349-359. 781
Tomikawa, S. A., & Dodd, D. H. (1980). Early word meanings: Perceptually or functionally 782
based? Child Development, 51, 1103-1109. 783
Vauclair, J. (2004). Développement du jeune enfant : Motricité, perception, cognition. Paris: 784
Belin. 785
Wertz, A. E., & Wynn, K. (2014a). Thyme to touch: Infants possess strategies that protect 786
them from dangers posed by plants. Cognition, 130(1), 44-49. 787
Wertz, A. E., & Wynn, K. (2014b). Selective social learning of plant edibility in 6- and 18- 788
month-old infants. Psychological Science, 25(4), 874-882. 789
Yoshida, H., & Smith L. B. (2003). Known and novel noun extensions: Attention at two 790
levels of abstraction. Child Development, 74(2), 564-577. 791
Zajonc, R. B. (1968). Attitudinal effects of mere exposure. Journal of Personality and Social 792
Psychology, 9(2), 1-27.793

39
Appendix . Color photographs of the 36 pictures and hit or false alarm rate for each of them.
Hit rates concern the vegetable pictures and false alarm rates concern the fruit pictures.
Block A
Dark purple carrot
Hit rate : 71.4
Orange carrot
Hit rate : 92.5
Orange carrot
Hit rate : 80.3
Yellow carrot
Hit rate : 58.9
Orange bell pepper
Hit rate : 67.8
Yellow bell pepper
Hit rate : 64.2
Red bell pepper
Hit rate : 82.1
Dark green bell pepper
Hit rate 80.3
Light green pear
False alarm rate : 58.9
Red pear
False alarm rate : 44.6
Brown pear
False alarm rate : 44.6
Yellow pear :
False alarm rate : 39.3

40
Block B
Light green eggplant Hit rate : 81.1
Light purple eggplant Hit rate : 75.5
Dark purple eggplant Hit rate : 83.0
White eggplant Hit rate : 67.9
Yellow zuchini Hit rate : 64.1
Dark green Zuchini Hit rate : 83.0
Light green zuchini Hit rate : 71.7
Dark green zuchini Hit rate : 83.0
Red apple False alarm rate : 13.2
Brown apple False alarm rate : 17.0
Yellow apple False alarm rate : 30.2
Light green apple False alarm rate : 35.8

41
Block C
Red tomato Hit rate : 89.8
Dark red tomato Hit rate : 77.5
Light green tomato Hit rate : 73.5
Yellow tomato Hit rate : 57.1
Pink beetroot Hit rate : 63.2
White beetroot Hit rate : 73.5
Yellow beetroot Hit rate : 67.3
Dark purple beetroot Hit rate : 77.5
Yellow lemon False alarm : 32.5
Dark green lime False alarm : 71.4
Red grapefruit False alarm rate : 30.6
Orange False alarm : 20.4

42