Statistical characterisation of spread F over South Africa
10
Statistical characterisation of spread F over South Africa Emirant Bertillas Amabayo a,b,⇑ , Lee-Anne McKinnell a,b , Pierre J. Cilliers b a Department of Physics and Electronics, Rhodes University, Grahamstown, South Africa b South African National Space Agency (SANSA) Space Science, P.O. Box 32, Hermanus 7200, South Africa Received 11 July 2011; received in revised form 16 August 2011; accepted 27 August 2011 Available online 5 September 2011 Abstract The occurrence of mid-latitude spread F (SF) over South Africa has not been extensively studied since the installation of the DPS-4 digisondes in 1996 and 2000 at Grahamstown (33.32 °S, 26.50 °E) and Madimbo (22.38 °S, 30.88 °E) respectively. This study is intended to quantify the probability of occurrence of F region disturbances associated with SF over South Africa. A study was conducted using data for 8 years (2001–2008) over Madimbo (with a time resolution of 30 min) and Grahamstown (with a variable time resolution of 15 and 30 min). In this study, SF has been classified into frequency SF (FSF), range SF (RSF) and mixed SF (MSF). The SF events were identified by manually identifying ionograms showing SF and tabulating them according to type for further statistical analysis. The results show that the diurnal pattern of SF peaks strongly between 01:00 and 02:00 local time, LT (LT = UT + 2 h), where UT is the universal time. This pattern is true for all seasons and types of SF at Madimbo and Grahamstown in 2001 and 2005, except for RSF which had peaks during autumn and spring in 2001 at Madimbo. The probability of both MSF and FSF tends to increase with decreas- ing solar activity, with a peak in 2005 (a moderate solar activity period). The seasonal peaks of MSF and FSF are more frequent during winter months at both Madimbo and Grahamstown. In this study, SF was evident in 0.03% and 0.06% of the available ionograms at Madimbo and Grahamstown respectively during the 8 years. Ó 2011 COSPAR. Published by Elsevier Ltd. All rights reserved. Keywords: Mid-latitude spread F; Diurnal variation; Seasonal variation; Ionospheric irregularities 1. Introduction Mid-latitude spread F (SF) has been investigated in a number of studies such as, e.g., Lambert (1988), Bowman (1991), Oliver et al. (1994), Hajkowicz (2007), Bhaneja et al. (2009), Earle et al. (2010) and Huang et al. (2011). This paper presents the development of a database of SF occurrence and its statistical characterisation for two South African ionosonde stations for the period 2001–2008. SF is a type of ionospheric phenomenon in which the pulses returned from the ionosphere are of a much greater dura- tion than the transmitted pulses. SF can be observed by either radio techniques such as ionosonde, radar, and scin- tillation or optical techniques. This follows from previous reports that the use of HF radar (Cecile et al., 1996), scin- tillation data (Rao et al., 2005), ground-based optical mea- surements and satellite topside sounders may assist in creating a database that will unambiguously identify the different types of SF (McKinnell et al., 2010). However, for the work reported in this paper ionograms measured by ionosondes were used for detecting SF. Ionosondes use vertical sounding of radio waves to study the behaviour and structure of the ionosphere. In the F region of the ion- osphere night-glow emissions can be observed optically by using conventional photometers or wide-angle imaging sys- tems (Fagundes et al., 1999). SF affects radio communica- tion and navigation systems utilising the Earth-space propagation environment. Although the probability of SF occurrence is small at mid-latitudes, there is still need to study the SF characteristics at mid-latitudes because of 0273-1177/$36.00 Ó 2011 COSPAR. Published by Elsevier Ltd. All rights reserved. doi:10.1016/j.asr.2011.08.029 ⇑ Corresponding author. Tel.: +27 (28) 312 1196; fax: +27 (28) 312 2039. E-mail addresses: [email protected] (E.B. Amabayo), [email protected] (L.-A. McKinnell), [email protected] (P.J. Cilliers). www.elsevier.com/locate/asr Available online at www.sciencedirect.com Advances in Space Research 48 (2011) 2043–2052
-
Upload
independent -
Category
Documents
-
view
5 -
download
0
Transcript of Statistical characterisation of spread F over South Africa
Available online at www.sciencedirect.com
www.elsevier.com/locate/asr
Advances in Space Research 48 (2011) 2043–2052
Statistical characterisation of spread F over South Africa
Emirant Bertillas Amabayo a,b,⇑, Lee-Anne McKinnell a,b, Pierre J. Cilliers b
a Department of Physics and Electronics, Rhodes University, Grahamstown, South Africab South African National Space Agency (SANSA) Space Science, P.O. Box 32, Hermanus 7200, South Africa
Received 11 July 2011; received in revised form 16 August 2011; accepted 27 August 2011Available online 5 September 2011
Abstract
The occurrence of mid-latitude spread F (SF) over South Africa has not been extensively studied since the installation of the DPS-4digisondes in 1996 and 2000 at Grahamstown (33.32 �S, 26.50 �E) and Madimbo (22.38 �S, 30.88 �E) respectively. This study is intendedto quantify the probability of occurrence of F region disturbances associated with SF over South Africa. A study was conducted usingdata for 8 years (2001–2008) over Madimbo (with a time resolution of 30 min) and Grahamstown (with a variable time resolution of 15and 30 min). In this study, SF has been classified into frequency SF (FSF), range SF (RSF) and mixed SF (MSF). The SF events wereidentified by manually identifying ionograms showing SF and tabulating them according to type for further statistical analysis. Theresults show that the diurnal pattern of SF peaks strongly between 01:00 and 02:00 local time, LT (LT = UT + 2 h), where UT is theuniversal time. This pattern is true for all seasons and types of SF at Madimbo and Grahamstown in 2001 and 2005, except for RSFwhich had peaks during autumn and spring in 2001 at Madimbo. The probability of both MSF and FSF tends to increase with decreas-ing solar activity, with a peak in 2005 (a moderate solar activity period). The seasonal peaks of MSF and FSF are more frequent duringwinter months at both Madimbo and Grahamstown. In this study, SF was evident in �0.03% and �0.06% of the available ionograms atMadimbo and Grahamstown respectively during the 8 years.� 2011 COSPAR. Published by Elsevier Ltd. All rights reserved.
Keywords: Mid-latitude spread F; Diurnal variation; Seasonal variation; Ionospheric irregularities
1. Introduction
Mid-latitude spread F (SF) has been investigated in anumber of studies such as, e.g., Lambert (1988), Bowman(1991), Oliver et al. (1994), Hajkowicz (2007), Bhanejaet al. (2009), Earle et al. (2010) and Huang et al. (2011).This paper presents the development of a database of SFoccurrence and its statistical characterisation for two SouthAfrican ionosonde stations for the period 2001–2008. SF isa type of ionospheric phenomenon in which the pulsesreturned from the ionosphere are of a much greater dura-tion than the transmitted pulses. SF can be observed by
0273-1177/$36.00 � 2011 COSPAR. Published by Elsevier Ltd. All rights rese
doi:10.1016/j.asr.2011.08.029
⇑ Corresponding author. Tel.: +27 (28) 312 1196; fax: +27 (28) 3122039.
E-mail addresses: [email protected] (E.B. Amabayo),[email protected] (L.-A. McKinnell), [email protected](P.J. Cilliers).
either radio techniques such as ionosonde, radar, and scin-tillation or optical techniques. This follows from previousreports that the use of HF radar (Cecile et al., 1996), scin-tillation data (Rao et al., 2005), ground-based optical mea-surements and satellite topside sounders may assist increating a database that will unambiguously identify thedifferent types of SF (McKinnell et al., 2010). However,for the work reported in this paper ionograms measuredby ionosondes were used for detecting SF. Ionosondesuse vertical sounding of radio waves to study the behaviourand structure of the ionosphere. In the F region of the ion-osphere night-glow emissions can be observed optically byusing conventional photometers or wide-angle imaging sys-tems (Fagundes et al., 1999). SF affects radio communica-tion and navigation systems utilising the Earth-spacepropagation environment. Although the probability ofSF occurrence is small at mid-latitudes, there is still needto study the SF characteristics at mid-latitudes because of
rved.

2044 E.B. Amabayo et al. / Advances in Space Research 48 (2011) 2043–2052
its strong influence on trans-ionospheric radio communica-tion and satellite navigation. The mid-latitude ionosphereis highly dynamic and this makes it difficult to predictoccurrence of ionospheric phenomenon such as SF. SF isalso closely related to the scintillation of radio signals fromsatellites and radio stars (Davies, 1990), thus disruptingradio signals from astronomical sources, and possiblyaffecting radio astronomy studies (Fagundes et al., 1999).The probability of SF is an important parameter in the pre-diction and modelling of SF (McKinnell et al., 2010).
The occurrence of nighttime irregularities in the mid-lat-itude F region which produce SF originate from electrondensity perturbations, which in turn are believed to becaused by gravity waves (GWs) propagating in the F region(Abdu, 2001; Bhaneja et al., 2009; Hoang et al., 2010).Some parts of South Africa lie within the low mid-latituderegion and hence can be affected by mechanisms that trig-ger irregularities in the equatorial region. Such irregulari-ties can propagate to the mid-latitudes. SF echoes areapparently caused by spatial variations in the electron den-sity of the ionosphere that scatters the signals. The develop-ment of SF may be enhanced when GWs raise the height ofthe F layer. The nighttime scintillation has been attributedto TIDs (Hajkowicz et al., 1981) or SF (Hajkowicz, 1977;Radicella and Ezquer, 2002) mainly in the F region, mean-while the daytime events are attributed to the presence ofsporadic E (Es) layer events. The F region of the nighttimemid-latitude ionosphere often exhibits irregular plasmastructures that impose a dispersion on the delay and dura-tion of returned echoes from the ionosphere. Echoes on theionograms from multiple altitudes at the same incident fre-quency give rise to range SF (RSF). When the reflectionsoccur at different frequencies from the same altitude, it istermed as frequency SF (FSF), and simultaneous occur-rence of RSF and FSF yields mixed SF (MSF).
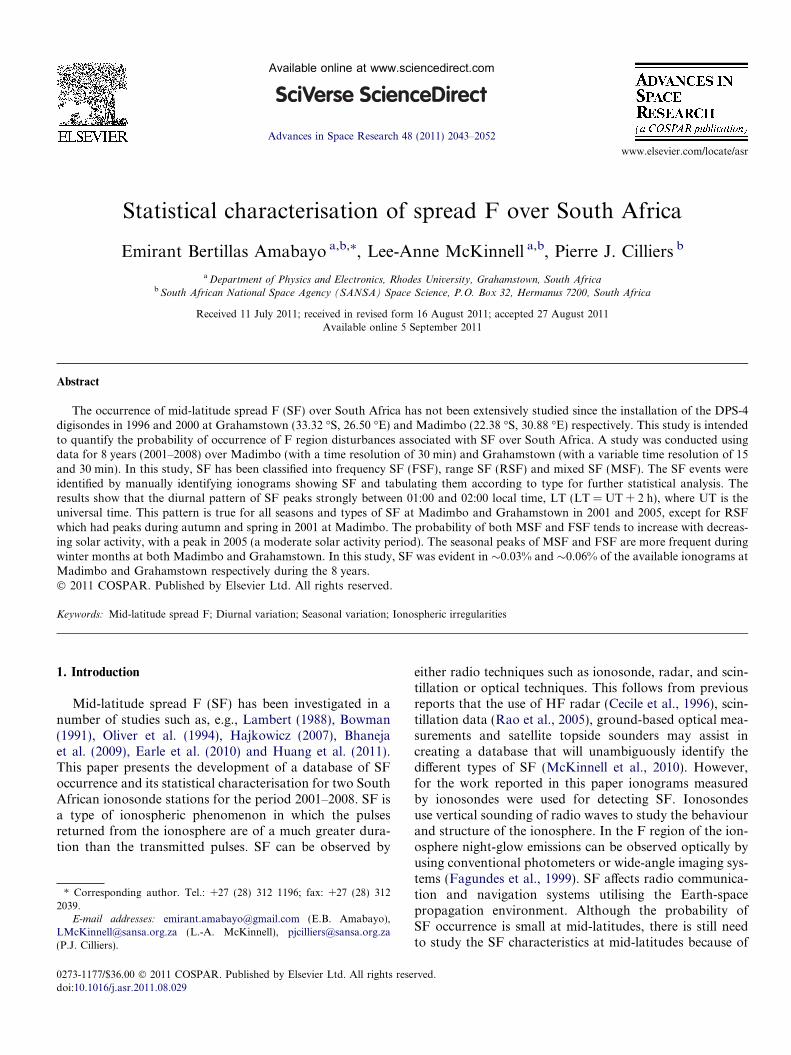
SF identification is usually independent of the physicalmechanisms by which it forms. The presence of SF is iden-tified in terms of the appearance of the ordinary (O) andextraordinary (X)-ray traces on the ionogram. An iono-gram with no SF displays only two thin traces showingthe O and X-ray traces. In the presence of SF, an ionogramdisplays a band of reflections on both the O and X-raytraces, which often merge as they spread either horizontallyor vertically. Examples of the three classes of SF (i.e. FSF,RSF and MSF) are shown in Fig. 1. The classification isbased on the classification described by several authors(e.g., Lambert, 1988; Davies, 1990; Wang et al., 2008).Besides the regular layers of the ionosphere, there are occa-sional irregular layers that affect the propagation of radiowaves. The most significant of these is the sporadic E(Es) as shown in Fig. 1(d), which is outside the scope of thispaper. Fig. 2. The FSF appearance is characterised by dif-fuse echoes near foF2, thus making this parameter undefin-able (Davies, 1990; Wang et al., 2008, 2010). FSF occursdue to a range of densities at the same altitude that causespulses of different carrier frequency to be reflected fromthat altitude. RSF is associated with the diffusiveness of
the echoes near the horizontal part of the trace (Davies,1990; Wang et al., 2008). The RSF is as a result of reflec-tions from multiple altitudes at a given incident frequency(Bhaneja et al., 2009) during the period of observation.Lambert (1988) conducted the first South African mid-lat-itude seasonal statistical SF study by comparing data fromtwo Kel IPS-4A pulse ionosondes located at Johannesburg(26.07 �S, 28.10 �E) and Hermanus (34.42 �S, 19.22 �E),South Africa. Lambert (1988) used ionosonde data at5 min resolution from these two stations in order to resolveshort period travelling ionospheric disturbances (TIDs).The study included data from a single solar minimum year(1985) for all seasons. Earlier low mid-latitude studies ofSF was conducted by Singleton (1957) at Brisbane (lat.275 �S, long. 1529 �E). Measurements done during theSingleton (1957, 1962) demonstrated that at equatorialand high latitude stations there is a strong correlationbetween vertical movement of the ionosphere and spreadF, and that such movement was found to be independentof geomagnetic activity, time of day and season of the year.However, these results differ from what this study demon-strated at mid-latitudes.
The present study is an extension of the workdone by Lambert (1988). Ionosonde data from Madimbo(22.38 �S, 30.88 �E) and Grahamstown (33.32 �S,26.50 �E) were considered for an extended period rangingfrom the solar maximum year (2001) to the solar cycle min-imum (2008). The SF data obtained were used to investi-gate diurnal, seasonal and solar activity patterns of SFover South Africa. Bowman (1991) stated clearly that theextent of range and frequency spread are controlled bythe excess ranges to scattering regions displaced horizon-tally from the zenith position and the amount of excess ion-isation in the small scale structures respectively. Further,Bowman (1991) expressed that atmospheric conditionsassociated with ionospheric F2 region heights and upperatmosphere neutral particle densities seem to favour thegeneration of frequency spread. In addition, Bowman(1991) also added that a horizontal gradient of maximumelectron density is an additional requirement to create fre-quency spread.
The cause of mid-latitude SF has been investigated byseveral researchers such as, e.g., Kelley and Fukao(1991), Oliver et al. (1994) and Earle et al. (2010) and theyhave attributed SF with TIDs and GWs. According tothese authors, TIDs and GWs could produce such struc-tures and might also help to initiate development of thePerkins instability (Kelley, 2009). This instability has beenpreferred by some researchers for reconciling the lowgrowth rate of GWs, with the sometimes abrupt appear-ance of SF at mid-latitudes (Bhaneja et al., 2009). Huanget al. (1994) also suggested that seeding by atmosphericGWs is pivotal in the generation of mid-latitude SF irreg-ularities. The Perkins linear instability was shown tobecome significantly enhanced due to GWs seeding themid-latitude ionosphere. However, the cause of mid-lati-tude SF has not yet been conclusively identified (Davies,
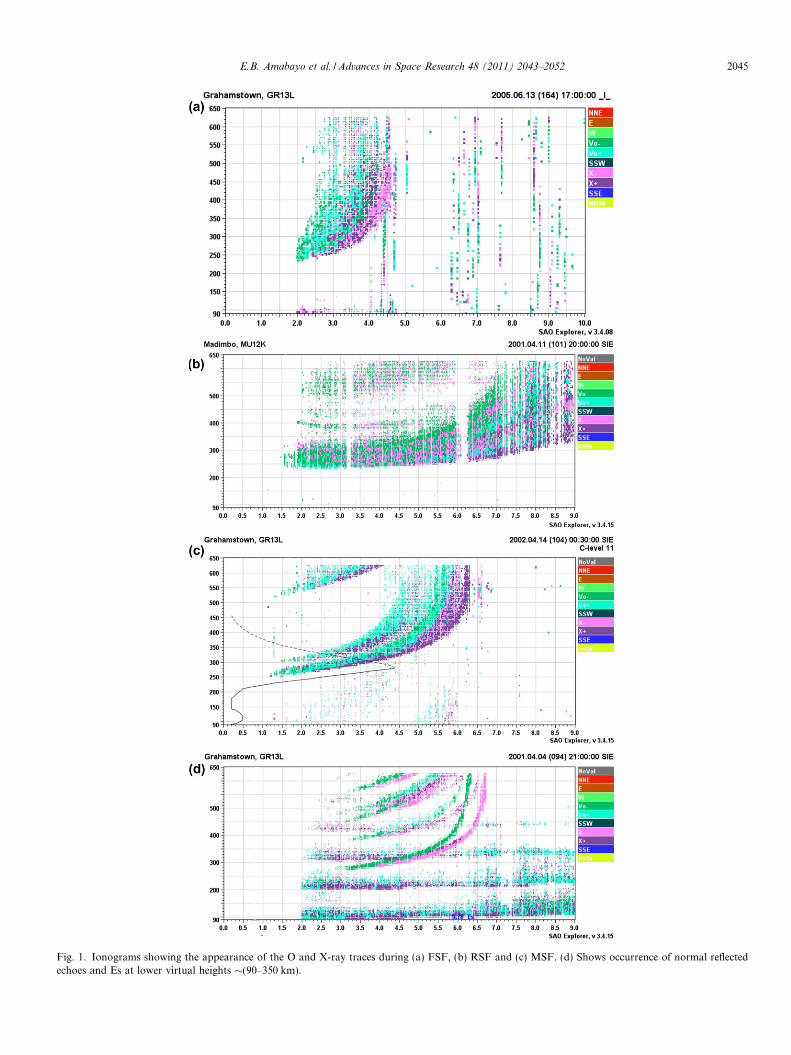
Fig. 1. Ionograms showing the appearance of the O and X-ray traces during (a) FSF, (b) RSF and (c) MSF. (d) Shows occurrence of normal reflectedechoes and Es at lower virtual heights �(90–350 km).
E.B. Amabayo et al. / Advances in Space Research 48 (2011) 2043–2052 2045
12 14 16 18 20 22 24 26 28 30 32 34 36−35
−33
−31
−29
−27
−25
−23
−21
Latit
ude
(deg
)
GrahamstownHermanus
Louisvale
Madimbo
Longitude (deg)
Fig. 2. Map of South Africa showing the four ionosonde stations. Datafrom only Madimbo and Grahamstown have been analysed in this study.
2046 E.B. Amabayo et al. / Advances in Space Research 48 (2011) 2043–2052
1990; Bhaneja et al., 2009). The study of the mid-latitudeionosphere by Kelley and Miller (1997) revealed the inter-connections between GWs, TIDs, elongated bands ofraised ionosphere density depletions and the turbulentupwelling of mid-latitude plasma (Hajkowicz, 2007). Thesephenomena have been extensively used to explain thecauses of mid-latitude SF and scintillation irregularitiesin the F region. In a similar study, Bowman (1992) pointedout that mid-latitude SF is primarily caused by off-verticalreflections of radio waves from tilted isoionic surfaces pro-duced by the passage of moderate scale TIDs (MSTIDs).Thus many different mechanisms have been proposed tocontribute to SF occurrence at mid-latitudes, but thisremains inconclusive. The study presented here does notexplicitly address mechanisms of SF formation.
1.1. Data and methods
Much of today’s understanding of the ionosphere hasbeen derived from ionosonde studies, for example, e.g.,Davies (1990), Reinisch et al. (2005) and McKinnell et al.(2010). About 17,500 ionograms from each station wereviewed to identify SF events. Madimbo and Grahamstownionosonde stations are separated by a distance of 1287 km(McNamara, 2009). The geographical and geomagneticcoordinates of the ionosonde stations used to obtain iono-spheric SF information over South Africa are provided inTable 1. The magnetic coordinates of the stations shown
Table 1Geophysical parameters of the ionosonde stations.
Station Station code Geographic coordinates long. (�E)
Grahamstown GR13L 26.50Madimbo MU12K 30.88Hermanus HE13N 19.22Louisvale LV12P 21.24
in Table 1 are computed using a facility obtained fromhttp://wdc.kugi.kyoto-.ao.jp/igrf/gggm/.
The SAO Explorer software (Reinisch et al., 2004) wasused for the analysis of the ionosonde data. Both the rawand processed (SAO) data were loaded into the SAOExplorer software to display ionograms. The ionosondemeasurements were recorded at 15 min intervals atGrahamstown in 2003 and 2006–2008. At all other times,the measurements at both stations were recorded at30 min intervals. The number of the observed SF eventsat Madimbo and Grahamstown ionosonde stations wereused to calculate the monthly probability of the three typesof SF using Eq. (1). The calculation of the probability takesinto account data gaps by only considering availableionograms in calculating the sums
Probability¼ Sum of SF occurrences
Total number of observed ionograms� 100%
ð1Þ
Probability is consistently expressed as a percentage (%) inthis study. The period of this study corresponds to thedeclining solar cycle 23. Diurnal variation of SF over SouthAfrica was conducted for all seasons using data from thetwo ionosonde stations. The years 2001 (high solar activity)and 2005 (moderate solar activity) were chosen to presentthe diurnal pattern of SF for both Madimbo and Grahams-town. The number of SF events at a particular hour is ob-tained by adding all events sampled within that hour.
2. Results and discussion
The ionosonde database at Madimbo and Grahams-town stations enabled the analysis of the annual, diurnal,seasonal and solar cycle statistics of mid-latitude SF eventsover South Africa.
2.1. Annual SF statistics
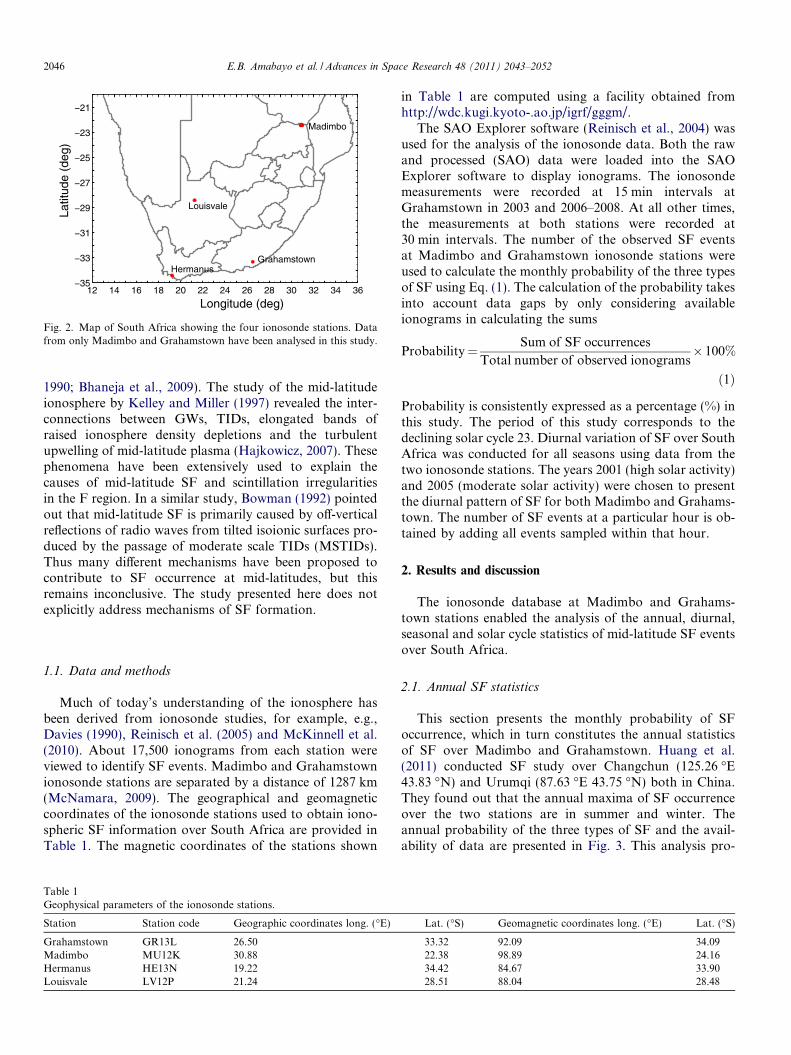
This section presents the monthly probability of SFoccurrence, which in turn constitutes the annual statisticsof SF over Madimbo and Grahamstown. Huang et al.(2011) conducted SF study over Changchun (125.26 �E43.83 �N) and Urumqi (87.63 �E 43.75 �N) both in China.They found out that the annual maxima of SF occurrenceover the two stations are in summer and winter. Theannual probability of the three types of SF and the avail-ability of data are presented in Fig. 3. This analysis pro-
Lat. (�S) Geomagnetic coordinates long. (�E) Lat. (�S)
33.32 92.09 34.0922.38 98.89 24.1634.42 84.67 33.9028.51 88.04 28.48
0
10
20
30
35
% o
ccur
renc
e of
SF 2001 2002 2003 2004 2005 2006 2007 2008
a
Madimbo
0 6 12 6 12 6 12 6 12 6 12 6 12 6 12 6 120
400
800
1200
1600
Month
Num
ber
of io
nogr
ams b
RSF
MSF
FSF
0
10
20
30
% o
ccur
renc
e of
SF 2001 2002 2003 2004 2005 2007 20082006
c
Grahamstown
0 6 12 6 12 6 12 6 12 6 12 6 12 6 12 6 120
1000
2000
3000
Month
Num
ber
of io
nogr
ams
d
RSFMSFFSF
Fig. 3. Monthly probability of total SF from 2001 to 2008 with sub bars for each type of SF observed at (a) Madimbo and (c) Grahamstown. Monthlynumber of available ionograms observed at (b) Madimbo and (d) Grahamstown. The months are represented by numbers 1 (for January) up to 12 (forDecember).
E.B. Amabayo et al. / Advances in Space Research 48 (2011) 2043–2052 2047
vides the trend of monthly, seasonal and annual probabil-ity of SF.
Fig. 3(a) shows that RSF probability was very low forthe observed period, but the peaks occurred in 2002 (Sep-tember, �0.88%) and 2001 (November, �0.76% andAugust �0.67%). The MSF peak probability were observedin 2007 (June, 5.14%) and 2005 (April, 4.53%), while thepeaks for FSF occurred in 2007 (May, 4.37%) and 2001(July, 4.03%). The annual peak of the probability of alltypes of SF at Madimbo was 4.0 % in 2001, increased from2002 to the maximum value of �8.0% in 2006 and 2007,and then decreased in 2008. On the other hand, Fig. 3(c)shows that RSF at Grahamstown station was observedonly in 2001 (April, 0.56%) and 2004 (November, 0.56%).Both MSF and FSF attained their peak occurrences of20.30% and 11.02%, and secondary peaks of 19.93% and7.64% in the months of August and June respectively in2005. The annual probability peak of all types of SFobserved at Grahamstown is higher (August, 31.32%) in2005. Meanwhile at Madimbo, it increased to the maxi-mum value of �8.0% in 2006 and 2007, and then furtherdecreased in 2008. No SF events were observed duringsummer in 2001 at Madimbo as reflected in Fig. 3.
The important observation here is that MSF and FSFare the most dominant SF irregularities over South Africa,with much higher occurrences at Grahamstown comparedto Madimbo. The difference in the SF probability at thesetwo stations could be attributed to the difference in the lev-els of atmospheric GWs in the ionospheric F regions overthe two stations. This may be further influenced by the lat-itude difference of the two stations, since SF is latitudedependent. Absence of SF occurrence in Fig. 3 means lackof data or unreliable data. This is evident in December2006 at Madimbo in Fig. 3(b), December 2003, Augustto December 2007 and June to December 2008 at Gra-hamstown in Fig. 3(d).
Table 2 gives a summary of the annual probabilityresults of SF for Madimbo and Grahamstown ionosondestations. Table 2 shows that RSF occurs more rarely atGrahamstown than at Madimbo, although the probabil-ity is the same for the two stations in 2004. MSF andFSF occurred more at Grahamstown than Madimbofor all the observed years. The most important featurederived from this table is that MSF and FSF are thedominant forms of ionospheric SF irregularities overSouth Africa.
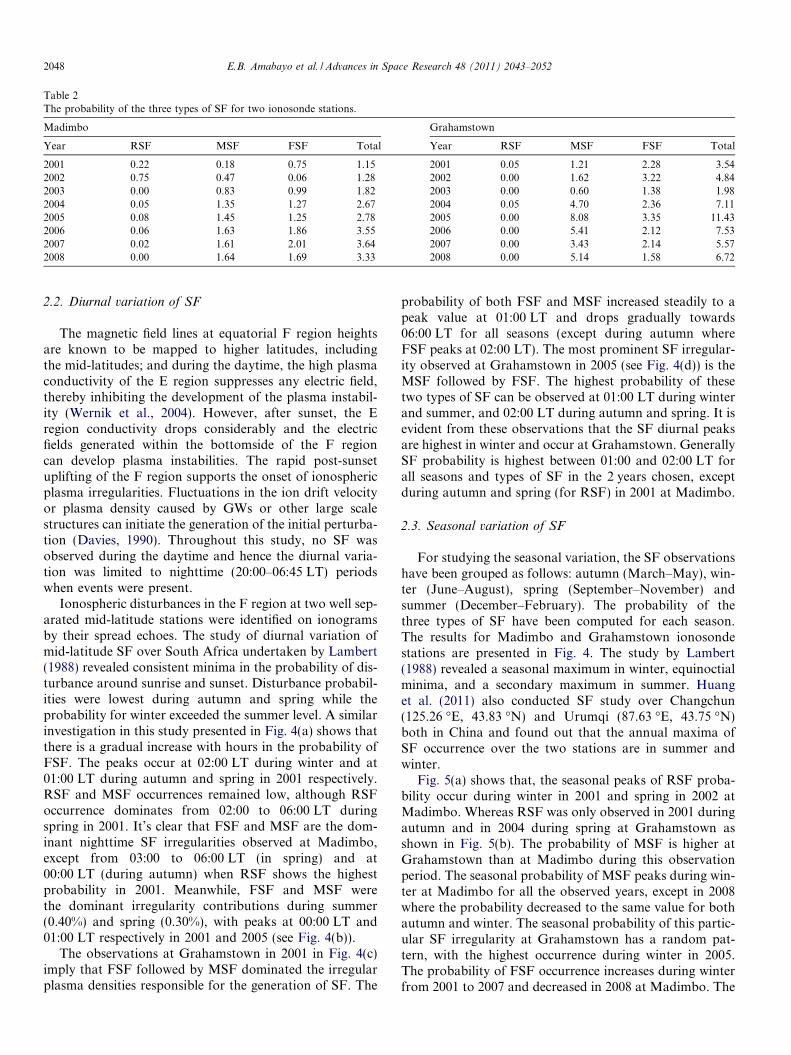
Table 2The probability of the three types of SF for two ionosonde stations.
Madimbo Grahamstown
Year RSF MSF FSF Total Year RSF MSF FSF Total
2001 0.22 0.18 0.75 1.15 2001 0.05 1.21 2.28 3.542002 0.75 0.47 0.06 1.28 2002 0.00 1.62 3.22 4.842003 0.00 0.83 0.99 1.82 2003 0.00 0.60 1.38 1.982004 0.05 1.35 1.27 2.67 2004 0.05 4.70 2.36 7.112005 0.08 1.45 1.25 2.78 2005 0.00 8.08 3.35 11.432006 0.06 1.63 1.86 3.55 2006 0.00 5.41 2.12 7.532007 0.02 1.61 2.01 3.64 2007 0.00 3.43 2.14 5.572008 0.00 1.64 1.69 3.33 2008 0.00 5.14 1.58 6.72
2048 E.B. Amabayo et al. / Advances in Space Research 48 (2011) 2043–2052
2.2. Diurnal variation of SF
The magnetic field lines at equatorial F region heightsare known to be mapped to higher latitudes, includingthe mid-latitudes; and during the daytime, the high plasmaconductivity of the E region suppresses any electric field,thereby inhibiting the development of the plasma instabil-ity (Wernik et al., 2004). However, after sunset, the Eregion conductivity drops considerably and the electricfields generated within the bottomside of the F regioncan develop plasma instabilities. The rapid post-sunsetuplifting of the F region supports the onset of ionosphericplasma irregularities. Fluctuations in the ion drift velocityor plasma density caused by GWs or other large scalestructures can initiate the generation of the initial perturba-tion (Davies, 1990). Throughout this study, no SF wasobserved during the daytime and hence the diurnal varia-tion was limited to nighttime (20:00–06:45 LT) periodswhen events were present.
Ionospheric disturbances in the F region at two well sep-arated mid-latitude stations were identified on ionogramsby their spread echoes. The study of diurnal variation ofmid-latitude SF over South Africa undertaken by Lambert(1988) revealed consistent minima in the probability of dis-turbance around sunrise and sunset. Disturbance probabil-ities were lowest during autumn and spring while theprobability for winter exceeded the summer level. A similarinvestigation in this study presented in Fig. 4(a) shows thatthere is a gradual increase with hours in the probability ofFSF. The peaks occur at 02:00 LT during winter and at01:00 LT during autumn and spring in 2001 respectively.RSF and MSF occurrences remained low, although RSFoccurrence dominates from 02:00 to 06:00 LT duringspring in 2001. It’s clear that FSF and MSF are the dom-inant nighttime SF irregularities observed at Madimbo,except from 03:00 to 06:00 LT (in spring) and at00:00 LT (during autumn) when RSF shows the highestprobability in 2001. Meanwhile, FSF and MSF werethe dominant irregularity contributions during summer(0.40%) and spring (0.30%), with peaks at 00:00 LT and01:00 LT respectively in 2001 and 2005 (see Fig. 4(b)).
The observations at Grahamstown in 2001 in Fig. 4(c)imply that FSF followed by MSF dominated the irregularplasma densities responsible for the generation of SF. The
probability of both FSF and MSF increased steadily to apeak value at 01:00 LT and drops gradually towards06:00 LT for all seasons (except during autumn whereFSF peaks at 02:00 LT). The most prominent SF irregular-ity observed at Grahamstown in 2005 (see Fig. 4(d)) is theMSF followed by FSF. The highest probability of thesetwo types of SF can be observed at 01:00 LT during winterand summer, and 02:00 LT during autumn and spring. It isevident from these observations that the SF diurnal peaksare highest in winter and occur at Grahamstown. GenerallySF probability is highest between 01:00 and 02:00 LT forall seasons and types of SF in the 2 years chosen, exceptduring autumn and spring (for RSF) in 2001 at Madimbo.
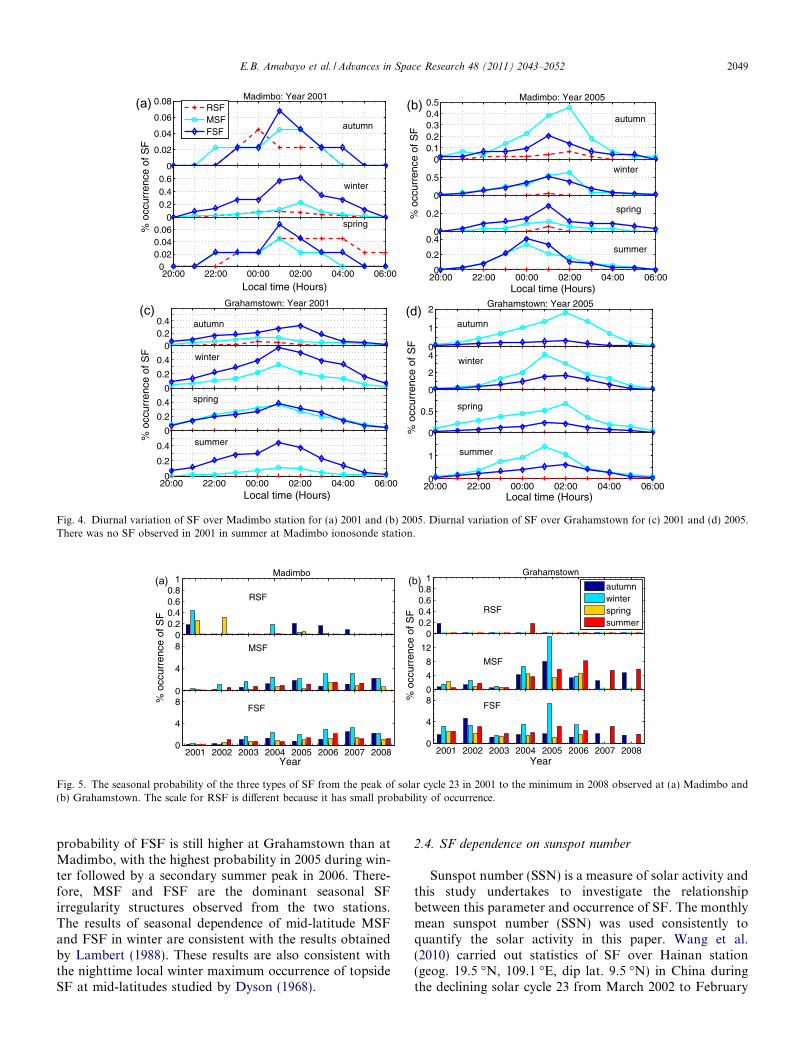
2.3. Seasonal variation of SF
For studying the seasonal variation, the SF observationshave been grouped as follows: autumn (March–May), win-ter (June–August), spring (September–November) andsummer (December–February). The probability of thethree types of SF have been computed for each season.The results for Madimbo and Grahamstown ionosondestations are presented in Fig. 4. The study by Lambert(1988) revealed a seasonal maximum in winter, equinoctialminima, and a secondary maximum in summer. Huanget al. (2011) also conducted SF study over Changchun(125.26 �E, 43.83 �N) and Urumqi (87.63 �E, 43.75 �N)both in China and found out that the annual maxima ofSF occurrence over the two stations are in summer andwinter.
Fig. 5(a) shows that, the seasonal peaks of RSF proba-bility occur during winter in 2001 and spring in 2002 atMadimbo. Whereas RSF was only observed in 2001 duringautumn and in 2004 during spring at Grahamstown asshown in Fig. 5(b). The probability of MSF is higher atGrahamstown than at Madimbo during this observationperiod. The seasonal probability of MSF peaks during win-ter at Madimbo for all the observed years, except in 2008where the probability decreased to the same value for bothautumn and winter. The seasonal probability of this partic-ular SF irregularity at Grahamstown has a random pat-tern, with the highest occurrence during winter in 2005.The probability of FSF occurrence increases during winterfrom 2001 to 2007 and decreased in 2008 at Madimbo. The
0
0.02
0.04
0.06
0.08
autumn
Madimbo: Year 2001
00.20.40.6
winter
% o
ccur
renc
e of
SF
20:00 22:00 00:00 02:00 04:00 06:000
0.020.040.06
spring
Local time (Hours)
RSFMSFFSF
00.10.20.30.40.5
autumn
Madimbo: Year 2005
0
0.5winter
% o
ccur
renc
e of
SF
0
0.2 spring
20:00 22:00 00:00 02:00 04:00 06:000
0.2
0.4summer
Local time (Hours)
00.20.4 autumn
UT (Hours)
0
0.2
0.4 winter
0
0.2
0.4 spring
% o
ccur
renc
e of
SF
20:00 22:00 00:00 02:00 04:00 06:000
0.2
0.4 summer
Local time (Hours)
Grahamstown: Year 2001
0
1
2
autumn
UT (Hours)
Grahamstown: Year 2005
0
2
4 winter
0
0.5 spring%
occ
urre
nce
of S
F
20:00 22:00 00:00 02:00 04:00 06:000
1 summer
Local time (Hours)
(c) (d)
(b)(a)
Fig. 4. Diurnal variation of SF over Madimbo station for (a) 2001 and (b) 2005. Diurnal variation of SF over Grahamstown for (c) 2001 and (d) 2005.There was no SF observed in 2001 in summer at Madimbo ionosonde station.
00.20.40.60.8
1Madimbo
RSF
0
4
8
% o
ccur
renc
e of
SF
MSF
2001 2002 2003 2004 2005 2006 2007 20080
4
8
Year
FSF
00.20.40.60.8
1
RSF
Grahamstown
0
4
8
12
% o
ccur
renc
e of
SF
MSF
autumnwinterspringsummer
2001 2002 2003 2004 2005 2006 2007 20080
4
8
Year
FSF
(a) (b)
Fig. 5. The seasonal probability of the three types of SF from the peak of solar cycle 23 in 2001 to the minimum in 2008 observed at (a) Madimbo and(b) Grahamstown. The scale for RSF is different because it has small probability of occurrence.
E.B. Amabayo et al. / Advances in Space Research 48 (2011) 2043–2052 2049
probability of FSF is still higher at Grahamstown than atMadimbo, with the highest probability in 2005 during win-ter followed by a secondary summer peak in 2006. There-fore, MSF and FSF are the dominant seasonal SFirregularity structures observed from the two stations.The results of seasonal dependence of mid-latitude MSFand FSF in winter are consistent with the results obtainedby Lambert (1988). These results are also consistent withthe nighttime local winter maximum occurrence of topsideSF at mid-latitudes studied by Dyson (1968).
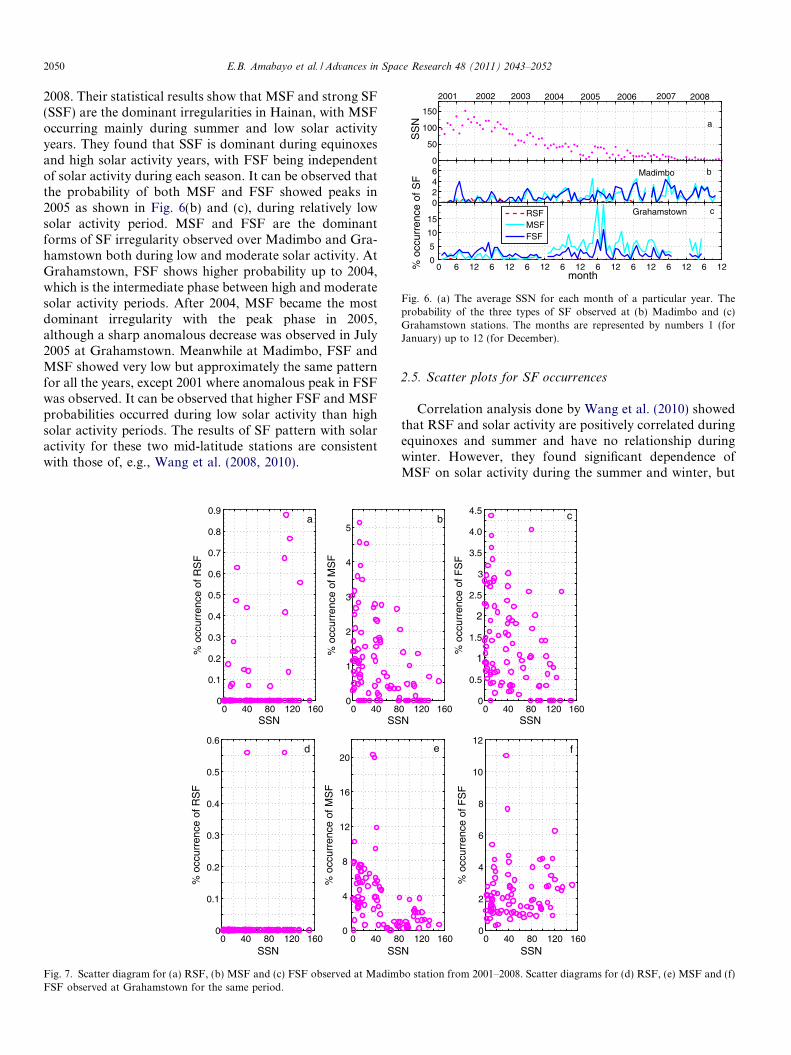
2.4. SF dependence on sunspot number
Sunspot number (SSN) is a measure of solar activity andthis study undertakes to investigate the relationshipbetween this parameter and occurrence of SF. The monthlymean sunspot number (SSN) was used consistently toquantify the solar activity in this paper. Wang et al.(2010) carried out statistics of SF over Hainan station(geog. 19.5 �N, 109.1 �E, dip lat. 9.5 �N) in China duringthe declining solar cycle 23 from March 2002 to February
0
50
100
150
SS
N a
2001 2002 2003 2004 2005 2006 2007 2008
0246
month
bMadimbo
0 6 12 6 12 6 12 6 12 6 12 6 12 6 12 6 120
5
10
15
month
% o
ccur
renc
e of
SF
cGrahamstownRSFMSFFSF
Fig. 6. (a) The average SSN for each month of a particular year. Theprobability of the three types of SF observed at (b) Madimbo and (c)Grahamstown stations. The months are represented by numbers 1 (forJanuary) up to 12 (for December).
2050 E.B. Amabayo et al. / Advances in Space Research 48 (2011) 2043–2052
2008. Their statistical results show that MSF and strong SF(SSF) are the dominant irregularities in Hainan, with MSFoccurring mainly during summer and low solar activityyears. They found that SSF is dominant during equinoxesand high solar activity years, with FSF being independentof solar activity during each season. It can be observed thatthe probability of both MSF and FSF showed peaks in2005 as shown in Fig. 6(b) and (c), during relatively lowsolar activity period. MSF and FSF are the dominantforms of SF irregularity observed over Madimbo and Gra-hamstown both during low and moderate solar activity. AtGrahamstown, FSF shows higher probability up to 2004,which is the intermediate phase between high and moderatesolar activity periods. After 2004, MSF became the mostdominant irregularity with the peak phase in 2005,although a sharp anomalous decrease was observed in July2005 at Grahamstown. Meanwhile at Madimbo, FSF andMSF showed very low but approximately the same patternfor all the years, except 2001 where anomalous peak in FSFwas observed. It can be observed that higher FSF and MSFprobabilities occurred during low solar activity than highsolar activity periods. The results of SF pattern with solaractivity for these two mid-latitude stations are consistentwith those of, e.g., Wang et al. (2008, 2010).
0 40 80 120 1600
0.1
0.2
0.3
0.4
0.5
0.6
0.7
0.8
0.9
SSN
% o
ccur
renc
e of
RS
F
a
0 40 80
1
2
3
4
5
SS
% o
ccur
renc
e of
MS
F
0 40 80 120 1600
0.1
0.2
0.3
0.4
0.5
0.6
SSN
% o
ccur
renc
e of
RS
F
d
0 40 80
4
8
12
16
20
SS
% o
ccur
renc
e of
MS
F
Fig. 7. Scatter diagram for (a) RSF, (b) MSF and (c) FSF observed at MadimFSF observed at Grahamstown for the same period.
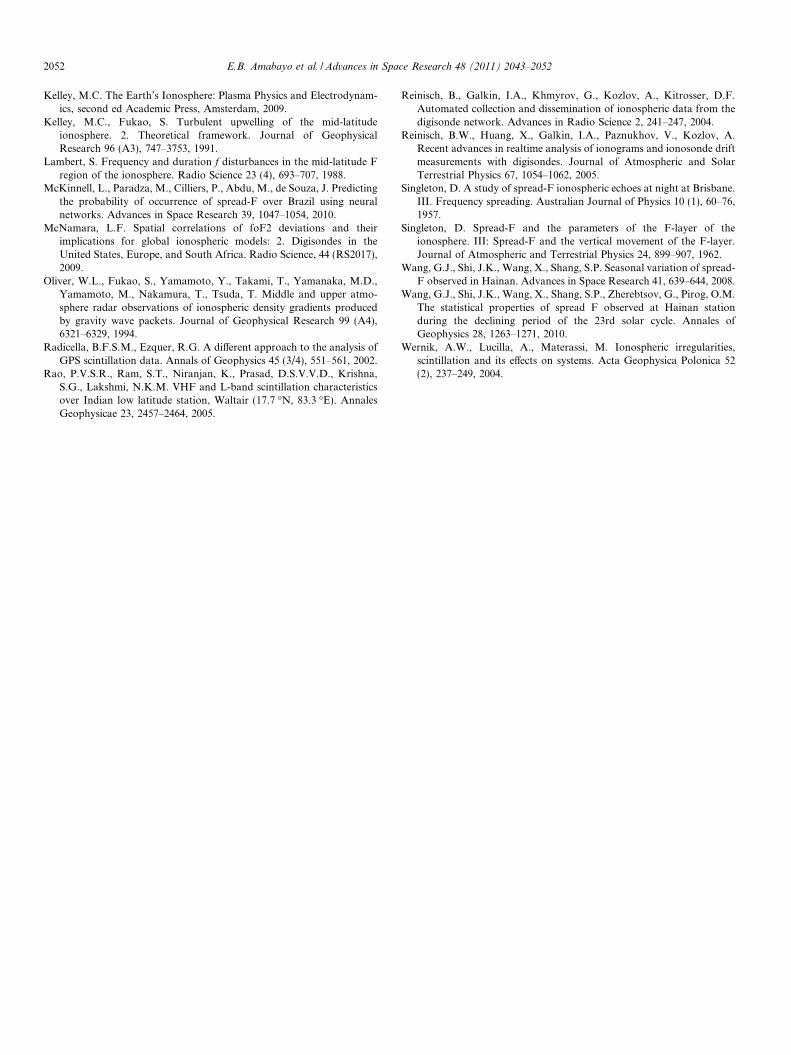
2.5. Scatter plots for SF occurrences
Correlation analysis done by Wang et al. (2010) showedthat RSF and solar activity are positively correlated duringequinoxes and summer and have no relationship duringwinter. However, they found significant dependence ofMSF on solar activity during the summer and winter, but
0 120 160N
b
0 40 80 120 1600
0.5
1
1.5
2
2.5
3
3.5
4.0
4.5
SSN
% o
ccur
renc
e of
FS
F
c
0 120 160N
e
0 40 80 120 1600
2
4
6
8
10
12
SSN
% o
ccur
renc
e of
FS
F
f
bo station from 2001–2008. Scatter diagrams for (d) RSF, (e) MSF and (f)

E.B. Amabayo et al. / Advances in Space Research 48 (2011) 2043–2052 2051
it does not relate to solar activity during the equinoxes.FSF was found to clearly increase with solar activity duringequinoxes and summer, but independent of solar activityduring the winter. The relationship between the three typesof SF and solar activity in this particular study are shownin Fig. 7. The monthly SF statistics was combined for eachtype of SF for all the years to investigate the relationshipbetween solar activity and SF. The scatter plots inFig. 7(b) and (c) show that the probability of both MSFand FSF increases with decreasing solar activity, while ina few cases RSF occurrence increases with increasing solaractivity (see Fig. 7(a)). On the other hand, there was almostno (except two cases) of RSF observed at Grahamstown(during the available period of data in this study, henceno conclusion about its pattern). The probability of MSFis observed to decrease with increasing solar activity,although a few anomalous cases were found betweenSSN of 30 and 50 (see Fig. 7(e)). It can also be observedin Fig. 7(f) that the probability of FSF as a function ofsolar activity is fairly random, with a few outlier casesbetween SSN values ranging from 30 to 50. Therefore, thisstudy found out a weak negative relationship between solaractivity and the probability of MSF at both stations. Aweak positive relationship is also proposed between solaractivity and RSF occurrence as observed for Madimbo sta-tion only. No relationship was found between FSF andsolar activity for both Madimbo and Grahamstownstations.
2.6. Conclusions
The statistical features of SF observed in ionogramsrecorded by the ionosondes at Madimbo and Grahams-town stations during the 8 year period (2001–2008) havebeen analysed. SF occurrences were classified into threetypes (i.e. RSF, MSF and FSF). These types of SF showdifferent characteristic patterns with some similarities.MSF and FSF are the most prevalent irregularities at Mad-imbo and Grahamstown stations, with both occurringmostly during winter and low solar activity years. RSFonly reached levels above 0.40% in autumn (2001) at Mad-imbo. The diurnal peaks of SF occurrence were observedduring the post-midnight stage (01:00–02:00 LT). The timeof maximum diurnal occurrence of RSF is earlier inautumn than during spring. This time delay may be causedby the earlier sunset-linked reversal time of the E � B drift.MSF and FSF dependence on solar activity showed differ-ent patterns at the two stations. At Madimbo MSF andFSF has about the same probability irrespective of theSSN, while at Grahamstown (further south) the MSFprobability was higher than the FSF probability duringlow SSN and vice versa during high SSN. The MSF prob-ability has significant dependence on solar activity duringmoderate (2005) and low (2006–2008) solar activity years,while it does not relate so well to SSN during high solaractivity. The difference in the diurnal, seasonal and solar
activity patterns of SF at the two stations may be attrib-uted to the latitude difference of the two stations.
Acknowledgements
This study was financially supported by the NationalAstrophysics and Space Science Programme (NASSP) ofUniversity of Cape Town and the South African NationalSpace Agency (SANSA): Space Science. The authorsacknowledge the management of Lowell DIDBase for pro-viding ionosonde data. The authors also acknowledge thereviewers for their striking contributions towards improv-ing the quality of this paper.
References
Abdu, M.A. Outstanding problems in the equatorial ionosphere–thermo-sphere electrodynamics relevant to spread F. Journal of Atmosphericand Solar-Terrestrial Physics 63, 869–884, 2001.
Bhaneja, P., Earle, G.D., Bishop, R.L., Bullett, T.W., Mabie, J., Redmon,R. A statistical study of midlatitude spread F at Wallops Island,Virginia. Journal of Geophysical Research, 114 (A04301), 2009.doi:10.1029/2008JA013212.
Bowman, G.G. Ionospheric frequency spread and its relationship withrange spread in mid-latitude regions. Journal of Geophysical Research96 (A6), 9745–9753, 1991.
Bowman, G.G. Upper atmosphere neutral-particle variations comparedwith spread-F occurrence rates at locations around the world. AnnalesGeophysicae 10, 676–682, 1992.
Cecile, J.F., Vila, P., Blanc, E. HF radar observations of equatorialspread-F over West Africa. Annales Geophysicae 14, 411–418, 1996.
Davies, K. Ionospheric Radio. Peter Peregrinus, London, 1990.Dyson, P.L. Topside spread F at midlatitudes. Journal of Geophysical
Research 73, 2441–2446, 1968.Earle, G.D., Bhaneja, P., Roddy, P.A., Swenson, C.M., Barjatya, A.,
Bishop, R.L., Bullett, T.W., Crowley, G., Redmon, R., Groves, K.,Cosgrove, R., Vadas, S.L. A comprehensive rocket and radar study ofmidlatitude spread F. Journal of Geophysical Research, 115 (A12339),2010.
Fagundes, P.R., Sahai, Y., Batista, I.S., Abdu, M.A., Bittencourt, J.A.,Takahashi, H. Observations of day-to-day variability in precursorsignatures to equatorial F-region plasma depletions. Annales Geo-physicae 17, 1053–1063, 1999.
Hajkowicz, L.A. Morphological and ionospheric aspects of quasiperiodicscintillations. Journal of Atmospheric and Terrestrial Physics 39, 833–841, 1977.
Hajkowicz, L.A. Morphology of quantified ionospheric range spread-Fover a wide range of midlatitudes in the Australian longitudinal sector.Annales of Geophysics 25, 1125–1130, 2007.
Hajkowicz, L.A., Bramley, E.L., Browing, R. Drift analysis of randomand quasiperiodic scintillations in the ionosphere. Journal of Atmo-spheric and Terrestrial Physics 43 (7), 723–733, 1981.
Hoang, T.L., Abdu, M., MacDougall, J., Batista, I.S. Longitudinaldifferences in the equatorial spread F characteristics between Vietnamand Brazil. Advances in Space Research 45, 351–360, 2010.
Huang, C.S., Miller, C.A., Kelley, M.C. Basic properties and gravity waveinitiation of the midlatitude F-region instability. Radio Science 29,395–405, 1994.
Huang, W.Q., Xiao, Z., Xiao, S.G., Zhang, D.H., Hao, Y.Q., Suo, Y.C.Case study of apparent longitudinal differences of spread F occurrencefor two midlatitude stations. Radio Science 46, 2011.
Kelley, M., Miller, C. Mid-latitude thermospheric plasma physics andelectrodynamics: a review. Journal of Atmospheric Terrestrial Physics59 (13), 1643–1654, 1997.
2052 E.B. Amabayo et al. / Advances in Space Research 48 (2011) 2043–2052
Kelley, M.C. The Earth’s Ionosphere: Plasma Physics and Electrodynam-ics, second ed Academic Press, Amsterdam, 2009.
Kelley, M.C., Fukao, S. Turbulent upwelling of the mid-latitudeionosphere. 2. Theoretical framework. Journal of GeophysicalResearch 96 (A3), 747–3753, 1991.
Lambert, S. Frequency and duration f disturbances in the mid-latitude Fregion of the ionosphere. Radio Science 23 (4), 693–707, 1988.
McKinnell, L., Paradza, M., Cilliers, P., Abdu, M., de Souza, J. Predictingthe probability of occurrence of spread-F over Brazil using neuralnetworks. Advances in Space Research 39, 1047–1054, 2010.
McNamara, L.F. Spatial correlations of foF2 deviations and theirimplications for global ionospheric models: 2. Digisondes in theUnited States, Europe, and South Africa. Radio Science, 44 (RS2017),2009.
Oliver, W.L., Fukao, S., Yamamoto, Y., Takami, T., Yamanaka, M.D.,Yamamoto, M., Nakamura, T., Tsuda, T. Middle and upper atmo-sphere radar observations of ionospheric density gradients producedby gravity wave packets. Journal of Geophysical Research 99 (A4),6321–6329, 1994.
Radicella, B.F.S.M., Ezquer, R.G. A different approach to the analysis ofGPS scintillation data. Annals of Geophysics 45 (3/4), 551–561, 2002.
Rao, P.V.S.R., Ram, S.T., Niranjan, K., Prasad, D.S.V.V.D., Krishna,S.G., Lakshmi, N.K.M. VHF and L-band scintillation characteristicsover Indian low latitude station, Waltair (17.7 �N, 83.3 �E). AnnalesGeophysicae 23, 2457–2464, 2005.
Reinisch, B., Galkin, I.A., Khmyrov, G., Kozlov, A., Kitrosser, D.F.Automated collection and dissemination of ionospheric data from thedigisonde network. Advances in Radio Science 2, 241–247, 2004.
Reinisch, B.W., Huang, X., Galkin, I.A., Paznukhov, V., Kozlov, A.Recent advances in realtime analysis of ionograms and ionosonde driftmeasurements with digisondes. Journal of Atmospheric and SolarTerrestrial Physics 67, 1054–1062, 2005.
Singleton, D. A study of spread-F ionospheric echoes at night at Brisbane.III. Frequency spreading. Australian Journal of Physics 10 (1), 60–76,1957.
Singleton, D. Spread-F and the parameters of the F-layer of theionosphere. III: Spread-F and the vertical movement of the F-layer.Journal of Atmospheric and Terrestrial Physics 24, 899–907, 1962.
Wang, G.J., Shi, J.K., Wang, X., Shang, S.P. Seasonal variation of spread-F observed in Hainan. Advances in Space Research 41, 639–644, 2008.
Wang, G.J., Shi, J.K., Wang, X., Shang, S.P., Zherebtsov, G., Pirog, O.M.The statistical properties of spread F observed at Hainan stationduring the declining period of the 23rd solar cycle. Annales ofGeophysics 28, 1263–1271, 2010.
Wernik, A.W., Lucilla, A., Materassi, M. Ionospheric irregularities,scintillation and its effects on systems. Acta Geophysica Polonica 52(2), 237–249, 2004.