Statistical Analysis and Modeling of Heterogeneous ...
10
Statistical Analysis and Modeling of Heterogeneous Workloads on Amazon’s Public Cloud Infrastructure Frederick Nwanganga University of Notre Dame [email protected] Nitesh V. Chawla University of Notre Dame [email protected] Gregory Madey University of Notre Dame [email protected] Abstract Workload modeling in public cloud environments is challenging due to reasons such as infrastructure abstraction, workload heterogeneity and a lack of defined metrics for performance modeling. This paper presents an approach that applies statistical methods for distribution analysis, parameter estimation and Goodness-of-Fit (GoF) tests to develop theoretical (estimated) models of heterogeneous workloads on Amazon’s public cloud infrastructure using compute, memory and IO resource utilization data. 1. Introduction As more organizations migrate their technology services from local data centers to public cloud infrastructure, the need to minimize cost while maintaining Quality of Service (QoS) guarantees becomes critically important. However, due to the opaqueness, heterogeneity, scale and tenancy issues with public cloud environments, the development of resource management policies for optimal workload resource allocation is difficult. The evaluation of these policies is even more challenging because of the difficulty in reproducing and controlling the environment in which they can be evaluated. As a result, cloud workload resource allocation is often a heuristic process. This approach increases the risk of over-provisioning and under-provisioning of resources which consequently result in increased Total Cost of Ownership (TCO) and Service Level Agreement (SLA) violations, respectively. Rather than relying on heuristics for the allocation of workloads to cloud resources, the adoption of an analytic approach is likely to yield better long term results. There are two critical requirements for this to be successful. The first is that the environment requires extensive and continuous analysis in order for its characteristics to be understood and quantified. The second is that the quantified parameters have to be exploited in order to develop simulation models which accurately represent operational conditions. 2. Problem Definition & Importance Several prior efforts have attempted to address workload analysis and modeling by developing mechanisms to characterize workload patterns in public cloud infrastructure [1], [2], [3]. However, most of these efforts are predominantly based on coarse-grained statistics [4] over a short period of time [5] and simply focus on analyzing cloud workload diversity by classifying tasks using critical characteristics [6], [7], [8]. Most of the approaches lack a comprehensive model that has sufficient detail about the parameters derived from the analyses. The first objective of this paper is to present an approach for the in-depth empirical analysis and modeling of public cloud workloads. Building on the previous work done by [9] and [10], our effort uses metrics gathered over a 14 month period from an Amazon Web Services (AWS) Virtual Private Cloud (VPC) to develop statistical distributions of the workload patterns, estimate the parameters of the distributions in order to create a target function (model) and validate the simulated theoretical model against the empirical data. An important contribution of the simulated models is that they are not a simple replay of the collected data but rather models with random patterns based on realistic parameters. This allows for a dynamic simulation of the operational environment in order to understand the impact of proposed optimization policies so they can be validated before being implemented in real world environments. The second objective of this research is the development of a pipeline for the continuous extraction, transform and load (ETL) of utilization metrics for the cloud workloads. The final objective of this research is the practical application of the models developed in this work as input to our previous work [11]. In our previous effort, Proceedings of the 52nd Hawaii International Conference on System Sciences | 2019 URI: hps://hdl.handle.net/10125/59626 ISBN: 978-0-9981331-2-6 (CC BY-NC-ND 4.0) Page 1865
-
Upload
khangminh22 -
Category
Documents
-
view
0 -
download
0
Transcript of Statistical Analysis and Modeling of Heterogeneous ...

Statistical Analysis and Modeling of Heterogeneous Workloads on Amazon’sPublic Cloud Infrastructure
Frederick NwangangaUniversity of Notre Dame
Nitesh V. ChawlaUniversity of Notre Dame
Gregory MadeyUniversity of Notre Dame
Abstract
Workload modeling in public cloud environmentsis challenging due to reasons such as infrastructureabstraction, workload heterogeneity and a lack ofdefined metrics for performance modeling. This paperpresents an approach that applies statistical methodsfor distribution analysis, parameter estimation andGoodness-of-Fit (GoF) tests to develop theoretical(estimated) models of heterogeneous workloads onAmazon’s public cloud infrastructure using compute,memory and IO resource utilization data.
1. Introduction
As more organizations migrate their technologyservices from local data centers to public cloudinfrastructure, the need to minimize cost whilemaintaining Quality of Service (QoS) guaranteesbecomes critically important. However, due to theopaqueness, heterogeneity, scale and tenancy issueswith public cloud environments, the development ofresource management policies for optimal workloadresource allocation is difficult. The evaluation ofthese policies is even more challenging becauseof the difficulty in reproducing and controlling theenvironment in which they can be evaluated. As aresult, cloud workload resource allocation is often aheuristic process. This approach increases the risk ofover-provisioning and under-provisioning of resourceswhich consequently result in increased Total Cost ofOwnership (TCO) and Service Level Agreement (SLA)violations, respectively.
Rather than relying on heuristics for the allocationof workloads to cloud resources, the adoption of ananalytic approach is likely to yield better long termresults. There are two critical requirements for thisto be successful. The first is that the environmentrequires extensive and continuous analysis in order forits characteristics to be understood and quantified. Thesecond is that the quantified parameters have to be
exploited in order to develop simulation models whichaccurately represent operational conditions.
2. Problem Definition & Importance
Several prior efforts have attempted to addressworkload analysis and modeling by developingmechanisms to characterize workload patterns in publiccloud infrastructure [1], [2], [3]. However, most ofthese efforts are predominantly based on coarse-grainedstatistics [4] over a short period of time [5] andsimply focus on analyzing cloud workload diversityby classifying tasks using critical characteristics [6],[7], [8]. Most of the approaches lack a comprehensivemodel that has sufficient detail about the parametersderived from the analyses.
The first objective of this paper is to presentan approach for the in-depth empirical analysis andmodeling of public cloud workloads. Building onthe previous work done by [9] and [10], our effortuses metrics gathered over a 14 month period froman Amazon Web Services (AWS) Virtual PrivateCloud (VPC) to develop statistical distributions ofthe workload patterns, estimate the parameters of thedistributions in order to create a target function (model)and validate the simulated theoretical model againstthe empirical data. An important contribution ofthe simulated models is that they are not a simplereplay of the collected data but rather models withrandom patterns based on realistic parameters. Thisallows for a dynamic simulation of the operationalenvironment in order to understand the impact ofproposed optimization policies so they can be validatedbefore being implemented in real world environments.
The second objective of this research is thedevelopment of a pipeline for the continuous extraction,transform and load (ETL) of utilization metrics for thecloud workloads.
The final objective of this research is the practicalapplication of the models developed in this work asinput to our previous work [11]. In our previous effort,
Proceedings of the 52nd Hawaii International Conference on System Sciences | 2019
URI: https://hdl.handle.net/10125/59626ISBN: 978-0-9981331-2-6(CC BY-NC-ND 4.0)
Page 1865

we developed an Integer Linear Programming (ILP)model for resource allocation based on the location(mean) and spread (standard deviation) of the workloaddata. The simplifying assumption in that effort wasthat the workload parameters of CPU, Memory and IOare normally distributed. However, in this research, weuse a more fine-grained approach to modeling workloaddata by fitting them against theoretical distributions andestimating their parameters. This allows us to generatesimulations that help validate the resource managementpolicies generated by our ILP model before makingthem operational.
The remainder of this paper is organized as follows:In the rest of this section we discuss some of thechallenges and importance of workload modeling in theCloud. Section III presents some of the previous workon cloud workload modeling. Section IV describes ourdata set and the relevant metrics used in our analysis.In sections V, VI and VII we discuss our methodologyfor cluster and distribution analysis. Our results arepresented in section VIII, followed by our conclusionand future work in sections IX and X, respectively.
2.1. Challenges of Workload Modeling in theCloud
Workload modeling and analysis is especiallychallenging in a heterogeneous, large and highlydynamic environment such as a public cloud data centerfor several reasons. Some of these reasons include:
• Opaqueness: While users are able to interactwith their services in AWS, they have no visibilityor access to the physical infrastructure thathosts them. As a result, a user has limitedknowledge about which specific servers, networkcomponents and storage devices service theirworkloads. This lack of visibility can leadto inaccurate assumptions about the capacityof compute, memory or IO when attemptingto develop resource management or allocationpolicies.
• Tenancy: Amazon, like most public cloudproviders, makes use of an over-subscriptionmodel [12]. With this approach, the underlyinghardware is shared by multiple service subscriberswhich in turn, can result in competition for sharedresources (such as storage and networking). Usershave no knowledge of the behavioral patternsor resource needs of the other workloads onthe shared platform. While over-subscriptionis useful for cloud providers in order toleverage under utilized capacity, it can lead to
overload conditions which have adverse impacton subscribers [12]. Multi-tenancy can resultin unexplained or unpredictable behaviors inworkload performance patterns.
• Scale: As a leader in the IaaS (Infrastructureas a Service) space [13], AWS operates at amassive scale in terms of the number of physicaldata centers and devices managed. An empiricalfailure-analysis of large-scale cloud computingenvironments shows that with an increase inthe number components managed, the failurecharacteristics for workloads and servers arehighly variable [14]. This leads to an issueof differential observability, which is a keycomponent of gray failure [15]. Differentialobservability implies that due to scale, systemfailures may not be apparent to consumers evenif their services are being affected by the failures.This can manifest as unpredictable performancepatterns in services.
• Heterogeneity: Workloads can be broadlyclassified according to their consumption of CPU,memory and IO resources [16]. Workloads canalso be classified based on their interaction withend-users as either latency-sensitive or batch [17].Cloud workloads can be submitted at any timeand have different characteristics and profiles withdifferent resource needs. This high degree ofvariability makes it difficult to predict patternsover time.
2.2. Importance of Workload Modeling in theCloud
As an abstraction of reality, cloud workloadmodeling increases the understanding of the behavioralpatterns of workloads, consequently leading to moreinformed decision making with regards to resourceallocation policies [8], [4]. As mentioned previously,workload modeling also allows for the simulation andevaluation of resource management policies withoutdeploying them in production environments.
Modeling permits sensitivity analysis, which allowsa focus on the assumptions and parameters which impactperformance in a meaningful way, and not on those thatdo not.
In order to generate realistic models, it is critical thatthe data used to create the workload models are curatedfrom real-world cloud metrics. This helps to capture theintrinsic diversity, dynamism and nuanced interactionbetween the components of the system, within the limitsof the challenges mentioned in the previous section.
Page 1866

Table 1. Summary of related workAuthors Trace Size Modeling Approach Workload Type Model Parameters Parameters Analyzed
Kavulya [4] 10 months Distribution analysis MapReduce Yes Duration
Zhang [5]30 days
(5 day sample) Coarse-grain MapReduce Yes (partially) CPU, Memory and Disk
Mishra [6] 4 days Cluster centroids MapReduce No CPU, Memory and Disk
Aggarwal [7] 24 hours Cluster centroids MapReduce No Disk Usage
Moreno [8][9] 29 days Cluster centroids & distribution analysis MapReduce Yes CPU, Memory, Length
Maghalhaes [10] - Distribution analysis Web Yes CPU, Memory, Disk, Response time
Smith [18] 7 hours Distribution analysis MapReduce No Duration
Our Approach 14 months(3 month sample) Distribution analysis Heterogenous Yes CPU, Memory and Disk IO
3. Related Work
Several prior efforts have engaged in the analysis andmodeling of workload patterns on cloud infrastructurefrom different perspectives. In this section, we willdiscuss the most relevant approaches to our work, aswell as their limitations and gaps.
Based on the analysis of the first version of theGoogle tracelog, both [1] and [19] classify jobs andtasks by duration using statistical data from cloudcomputing workloads on the Hadoop ecosystem. Thiswork is limited in application to the study of timingproblems and unsuitable to the analysis of cloudresource utilization patterns.
The statistical analysis of 10 months of MapReducetraces done by [4] presents a description of distributionsas they relate to job completion times. Though the workpresents the statistical characteristics of the data as itrelates to resource utilization, job patterns and sourceof failures, it fails to go into enough detail in exploringother factors that impact resource consumption such ascapacity constraints and user demand patterns.
In [5], the authors present a study which evaluatesthe suitability of the mean values for task waitingtime, CPU, memory and disk consumption to therepresentation of the performance characteristics of realtraces. The work is based on historical trace datafrom six Google compute clusters spanning five daysof operations. While the work shows that overall taskusage can be described using mean values of runtimetasks, it does not address how the boundaries for taskclassification were made.
The authors of [6] use task resource consumptiondata generated by five Google clusters over four daysto develop cloud computing workload classifications.The work proposes an approach that identifies workloadcharacteristics, constructs the task classification,
identifies the qualitative boundaries of each clusterand merges adjacent clusters to reduce the number ofclusters. While very useful in classifying tasks, thiswork does not perform an analysis of the actual clustersformed.
Using data from one of Yahoo’s production clustersover a 24 hour period, the work done by [7] describesan approach to characterize Hadoop jobs. The mainobjective of this effort was to use clustering techniquesto group jobs with similar characteristics. The work islimited to a focus on the storage system and neglectsother critical resources such as CPU and memory.
[8] and [9] provide an approach for characterizingcloud workloads in the context of both users and tasksusing Google tracelog. While this work does use realproduction data curated from Google tracelogs [8], itis limited to a two day sample and [9] ignores storageresource utilization.
The work done by [10] presents an approach tomodel resource utilization for interactive applicationssuch as a web server. The work makes use ofthe RUBiS [20] benchmark to evaluate the impact ofusers on resource consumption patterns. While themodel developed by the work defines distributions andparameter estimates, it is based on a simulation of userbehavior on a private cloud environment.
From the analysis of the related work, it is clearthat previous analyses present gaps and limitations thatneed to be addressed in order to achieve more realisticworkload patterns. Table 1 presents a summary of therelated work and how each compares to our approach.
Page 1867

4. Data
4.1. CloudWatch Metrics
Amazon CloudWatch [21] is a service formonitoring AWS resources such as Amazon ElasticCloud Compute (EC2) instances, Amazon Elastic BlockStore (EBS) volumes, Load Balancers, and AmazonRelational Database Service (RDS) instances. Bydefault, CloudWatch provides metrics such as CPUutilization, latency, and request. Alarms can alsobe set using CloudWatch and it can also be used toautomatically react to predefined conditions.
For our research, we collected and curated AmazonCloudWatch metrics for both Windows and LinuxEC2 instances on a weekly basis. These metrics areextracted from CloudWatch into an S3 bucket and thentransformed and downloaded using a combination ofPython and R scripts. For the Linux-based instances,a locally installed monitoring perl script was used tocollect memory, swap, and disk space utilization data,which was then remotely reported to CloudWatch ascustom metrics [22]. EC2Config was used for theWindows systems, to collect and send memory and diskmetrics to CloudWatch Logs [23].
Our working data set includes CloudWatch metricscollected from 522 Windows and Linux servers runningindividually unique workloads over a 14 month period.From the overall data set, we analyze subsets of datawhich represent metrics for the previous one-weekperiod, previous two-week period, previous one-monthperiod and the previous three-month period.
The EC2 CloudWatch metrics collected and used inour work are as follows:
• EC2 Compute Utilization: The averagepercentage compute units that are used by an EC2instance for a defined period (every 30 minutes).This is the processing power required to run anapplication or workload on a particular instance[24]. Over the last 14 months, we have collected8,070,886 records for this metric. We normalizethis metric for our work as the variable CPU.
• EC2 Memory Utilization: The averagepercentage memory capacity used by anEC2 instance for a defined period (every 30minutes). This is the memory consumed to run anapplication or workload on a particular instance[24]. Over the last 14 months, we have collected5,173,491 records for this metric. We normalizethis metric for our work as the variable MEM.
Similar to the EC2 CloudWatch metrics, we alsocollect data for each of the EBS volumes attached to an
EC2 instance. EBS metrics are reported to CloudWatchonly when the volume is attached to an instance andactive. The EBS CloudWatch metrics collected and usedin our work are as follows:
• EBS Disk Read Operations: The averagenumber of completed read operations from anEBS device for a defined period (every 5 minutes).We can determine the average read I/O operationsper second (IOPS) from this metric by dividingby 300 [25]. This metric is only available forinstances and instance types that use instancestore volumes. Over the last 14 months, we havecollected 15,363,265 records for this metric.
• EBS Disk Write Operations: The averagenumber of completed write operations to an EBSdevice for a defined period (every 5 minutes). Wecan determine the average write I/O operationsper second (IOPS) from this metric by dividingby 300 [25]. This metric is only available forinstances and instance types that use instancestore volumes. Over the last 14 months, we havecollected 15,363,258 records for this metric.
For our work, we use the sum of these two metrics ateach collection period as the variable IOPS.
4.2. AWS Price List Service
Amazon provides an API (AWS Price List Service)for users to get up-to-date data on pricing and otherattributes of specific AWS services [26]. Using thisservice, we extracted the following EC2 and EBSattributes: Instance Family, vCPU, Clock Speed,Elastic Compute Units (ECU) and Memory Capacity.
5. Methodology
Reliable performance evaluations require the use ofrepresentative workloads [27]. As we mention in sectionII, this is a difficult task because of the variations andcomplexity in user workloads and the great number ofinterrelated attributes and structures of workloads. Ourobjective is to present an approach for capturing andmodeling the behavioral patterns of different applicationworkloads on production public cloud infrastructure.Our effort can be described in three phases: datacollection, data exploration and preparation, and datamodeling and evaluation (see Figure 1). In the nexttwo sections of our paper, we will focus on the lasttwo phases of our process, which deal with cluster anddistribution analysis.
Page 1868
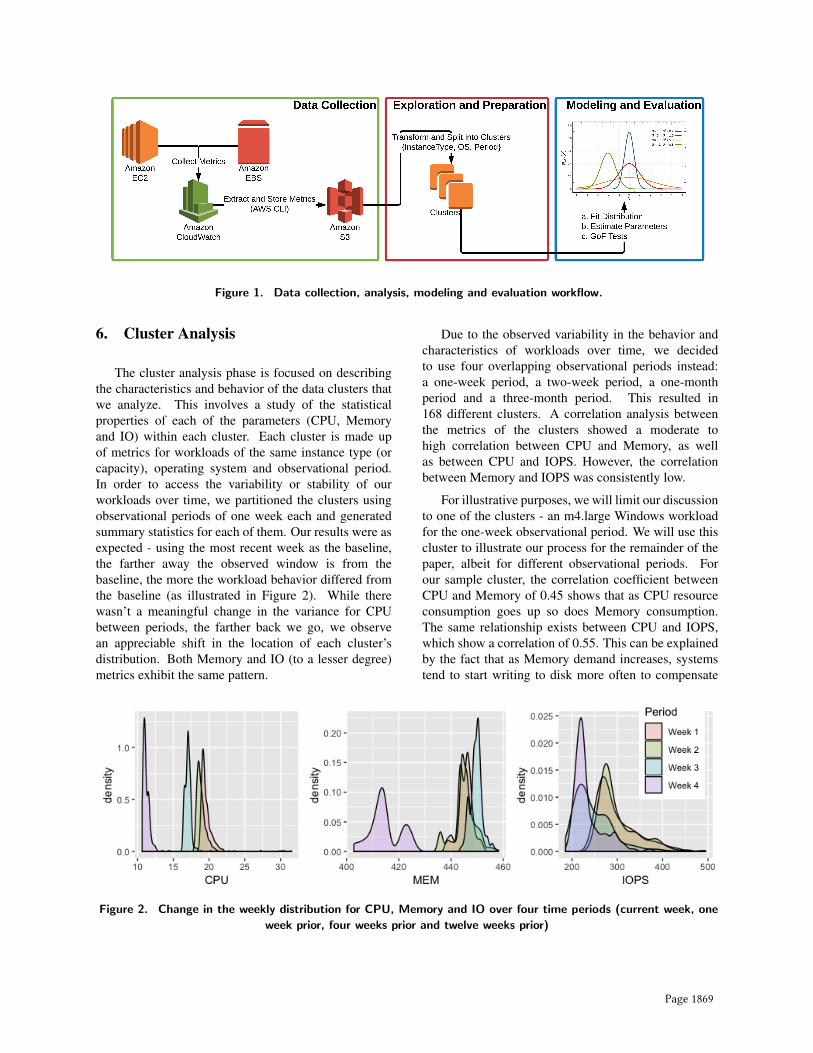
Figure 1. Data collection, analysis, modeling and evaluation workflow.
6. Cluster Analysis
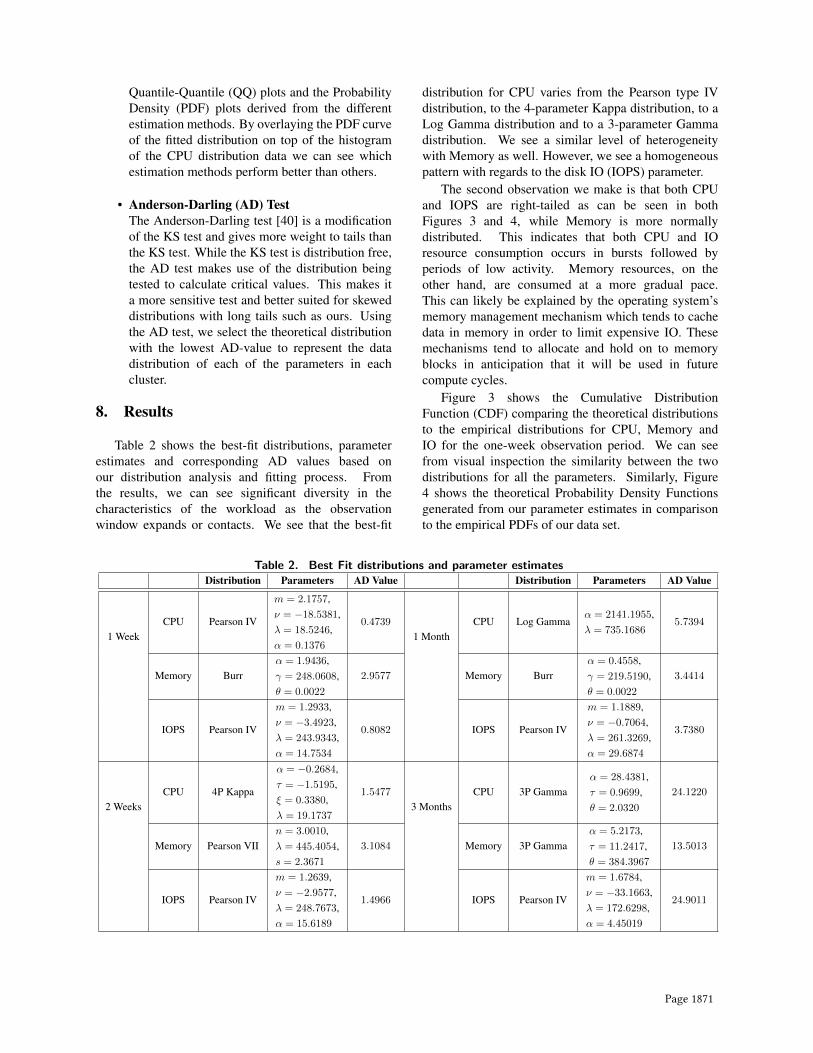
The cluster analysis phase is focused on describingthe characteristics and behavior of the data clusters thatwe analyze. This involves a study of the statisticalproperties of each of the parameters (CPU, Memoryand IO) within each cluster. Each cluster is made upof metrics for workloads of the same instance type (orcapacity), operating system and observational period.In order to access the variability or stability of ourworkloads over time, we partitioned the clusters usingobservational periods of one week each and generatedsummary statistics for each of them. Our results were asexpected - using the most recent week as the baseline,the farther away the observed window is from thebaseline, the more the workload behavior differed fromthe baseline (as illustrated in Figure 2). While therewasn’t a meaningful change in the variance for CPUbetween periods, the farther back we go, we observean appreciable shift in the location of each cluster’sdistribution. Both Memory and IO (to a lesser degree)metrics exhibit the same pattern.
Due to the observed variability in the behavior andcharacteristics of workloads over time, we decidedto use four overlapping observational periods instead:a one-week period, a two-week period, a one-monthperiod and a three-month period. This resulted in168 different clusters. A correlation analysis betweenthe metrics of the clusters showed a moderate tohigh correlation between CPU and Memory, as wellas between CPU and IOPS. However, the correlationbetween Memory and IOPS was consistently low.
For illustrative purposes, we will limit our discussionto one of the clusters - an m4.large Windows workloadfor the one-week observational period. We will use thiscluster to illustrate our process for the remainder of thepaper, albeit for different observational periods. Forour sample cluster, the correlation coefficient betweenCPU and Memory of 0.45 shows that as CPU resourceconsumption goes up so does Memory consumption.The same relationship exists between CPU and IOPS,which show a correlation of 0.55. This can be explainedby the fact that as Memory demand increases, systemstend to start writing to disk more often to compensate
Figure 2. Change in the weekly distribution for CPU, Memory and IO over four time periods (current week, one
week prior, four weeks prior and twelve weeks prior)
Page 1869

for resource constraints. This increase in read andwrite activity consequently results in an increase inCPU utilization. There is little to no direct correlationbetween Memory and IOPs (-0.02). While we doobserve some correlation between our measures, tosimplify our model, we decided to apply a naiveindependence to them. Therefore, we limit ourselves inthe distribution analysis phase to univariate theoreticaldistributions.
7. Distribution Analysis
This phase consists of analyzing the datadistributions for each of the 3 measures of eachcluster and fitting the data to a theoretical distributionusing a statistical Goodness-of-Fit (GoF) test [28].From the parameters of the distribution we developa Probabilistic Distribution Function (PDF), which isused as a representative target function (or model) forthe data distribution of each cluster.
Building on the work done by [10], [29] and [27],the analysis was done in three major steps:
1. Statistical analysis of the data characteristics todetermine the candidate distributions to representthe model;
2. Parameter estimation to set the parameters ofthe model using estimation methods against theselected distribution from the sample data;
3. GoF tests to evaluate whether the selecteddistributions and their respective parametersapproximate the empirical data adequately.
We evaluated the usefulness of 21 differenttheoretical univariate distributions against our data.Some of the distributions evaluated include: Lambda,Generalized Lambda (GLD) [30], Burr, Kappa,4-parameter Kappa (4P-Kappa), Generalized ExtremeValue (GEV) [31], Generalized Weibull (GWD) [32],3-parameter Error distribution (3P-Error) [33], and 6types of the Pearson distribution system.
7.1. Parameter Estimation
Building on the work done by [34], we used sevendifferent parameter estimation methods: MaximumLog-Likelihood (MLE), Histogram Fitting (HIST),Quantile Matching (QM), Probability WeightedMoments (PWM) [35], Method of Moments (MoM),Method of L-Moments (MoL) and Maximum Productof Spacing Estimator (MPS) [36]. Here we discuss fourof the methods we used:
• Method of Moments (MoM)We start by using the Method of Momentsparameter estimation approach to fit a distributionto the CPU utilization data (empirical data). Wethen compare the four moments of the fitteddistribution with those of the empirical data.
• Method of Maximum Likelihood (MLE)According to [37], the method of maximumlikelihood is the preferred method for providingdefinitive fits to data using distributions such asGLD. Using this approach against our data, wealso get the four moments of the fit.
• Method of L-Moments (MoL)Another promising parameter estimationapproach introduced in [38] and [39] is themethod of L-moments. According to [39], thisis a more suitable technique when dealing withheavy-tailed distributions.
• Quantile Matching (QM)We also apply quantile matching in our parameterestimation process, with the goal of numericallyminimizing the sum of squared differencesbetween our observed and theoretical quantiles.
7.2. Goodness of Fit
After we identify a potential representativedistribution and its parameters, we then test if themodel fits the data. The goal is to verify that theempirical and theoretical data belong to the samedistribution. We use three tests: the Q-Q plots technique(graphical method), the Kolmogorov-Smirnoff (KS) testas described in [27] and the Anderson-Darling (AD)test.
• Kolmogorov-Smirnoff (KS) TestWe use the Kolmogorov-Smirnoff (KS) resampletest as described in [27]. This test is based on thesample statistic Kolmogorov-Smirnoff Distance(D) between the data in the sample and the fitteddistribution. The null hypothesis is that thesample data is drawn from the same distributionas the fitted distribution. We run two differenttests based on this method. The first functionwe use counts the number of times (out of a1,000) that the KS test p-value exceeds 0.05 forthe null hypothesis. The second function runs aone-sample KS test and returns the test statistic(D) as well as the p-value.
• Graphical ComparisonTo further evaluate goodness of fit, we look at the
Page 1870
Quantile-Quantile (QQ) plots and the ProbabilityDensity (PDF) plots derived from the differentestimation methods. By overlaying the PDF curveof the fitted distribution on top of the histogramof the CPU distribution data we can see whichestimation methods perform better than others.
• Anderson-Darling (AD) TestThe Anderson-Darling test [40] is a modificationof the KS test and gives more weight to tails thanthe KS test. While the KS test is distribution free,the AD test makes use of the distribution beingtested to calculate critical values. This makes ita more sensitive test and better suited for skeweddistributions with long tails such as ours. Usingthe AD test, we select the theoretical distributionwith the lowest AD-value to represent the datadistribution of each of the parameters in eachcluster.
8. Results
Table 2 shows the best-fit distributions, parameterestimates and corresponding AD values based onour distribution analysis and fitting process. Fromthe results, we can see significant diversity in thecharacteristics of the workload as the observationwindow expands or contacts. We see that the best-fit
distribution for CPU varies from the Pearson type IVdistribution, to the 4-parameter Kappa distribution, to aLog Gamma distribution and to a 3-parameter Gammadistribution. We see a similar level of heterogeneitywith Memory as well. However, we see a homogeneouspattern with regards to the disk IO (IOPS) parameter.
The second observation we make is that both CPUand IOPS are right-tailed as can be seen in bothFigures 3 and 4, while Memory is more normallydistributed. This indicates that both CPU and IOresource consumption occurs in bursts followed byperiods of low activity. Memory resources, on theother hand, are consumed at a more gradual pace.This can likely be explained by the operating system’smemory management mechanism which tends to cachedata in memory in order to limit expensive IO. Thesemechanisms tend to allocate and hold on to memoryblocks in anticipation that it will be used in futurecompute cycles.
Figure 3 shows the Cumulative DistributionFunction (CDF) comparing the theoretical distributionsto the empirical distributions for CPU, Memory andIO for the one-week observation period. We can seefrom visual inspection the similarity between the twodistributions for all the parameters. Similarly, Figure4 shows the theoretical Probability Density Functionsgenerated from our parameter estimates in comparisonto the empirical PDFs of our data set.
Table 2. Best Fit distributions and parameter estimatesDistribution Parameters AD Value Distribution Parameters AD Value
1 WeekCPU Pearson IV
m = 2.1757,ν = −18.5381,λ = 18.5246,α = 0.1376
0.4739
1 MonthCPU Log Gamma
α = 2141.1955,λ = 735.1686
5.7394
Memory Burrα = 1.9436,γ = 248.0608,θ = 0.0022
2.9577 Memory Burrα = 0.4558,γ = 219.5190,θ = 0.0022
3.4414
IOPS Pearson IV
m = 1.2933,ν = −3.4923,λ = 243.9343,α = 14.7534
0.8082 IOPS Pearson IV
m = 1.1889,ν = −0.7064,λ = 261.3269,α = 29.6874
3.7380
2 WeeksCPU 4P Kappa
α = −0.2684,τ = −1.5195,ξ = 0.3380,λ = 19.1737
1.5477
3 MonthsCPU 3P Gamma
α = 28.4381,τ = 0.9699,θ = 2.0320
24.1220
Memory Pearson VIIn = 3.0010,λ = 445.4054,s = 2.3671
3.1084 Memory 3P Gammaα = 5.2173,τ = 11.2417,θ = 384.3967
13.5013
IOPS Pearson IV
m = 1.2639,ν = −2.9577,λ = 248.7673,α = 15.6189
1.4966 IOPS Pearson IV
m = 1.6784,ν = −33.1663,λ = 172.6298,α = 4.45019
24.9011
Page 1871

Figure 3. Empirical and theoretical CDF of CPU, Memory and IO for the one-week observation period.
In order to validate the accuracy and usefulnessof our simulated models, we need to compare thedata generated by our model to the real data. Thisrequires that we compare the simulated distributionsfrom each of our models against the corresponding datafor each of the observation periods our models are basedon. To do this, we use the Wilcox Mann-Whitneystatistical test (WMW) [41] [42]. This test is commonlyapplied instead of the two-sample t-test to non-gaussiandistributions, which is the case with our dataset. TheWMW test is based on the null hypothesis (H0) that thedistributions of two unspecified populations are equalagainst the hypothesis that the distributions have thesame shape but are shifted. So if the p-value is greaterthan 0.05, then we can accept the hypothesis H0 ofstatistical equality of the data distributions.
From the WMW test results in Table 3, it canbe observed that the simulated parameters for CPU,Memory and IOPS follow the distributions of the realdata. The exception to this are the Memory parametersof the 3-month observation period, for which wehave no statistical evidence to support the WMW nullhypothesis. This is as a result of the multimodal nature
of the 3-month memory distribution. Fitting it with asingle theoretical distribution is unsuitable.
9. Conclusion
This paper presents an approach for the analysisand modeling of workloads on production public cloudinfrastructure. It describes the challenges that areinherent with such an effort as well as the importance.With Amazon Web Services as the IaaS serviceprovider, the work explains the CloudWatch metricsand additional data relevant to successfully quantifyingworkload behavior. Using different overlappingobservational period data clusters, this paper presents adetailed process for developing a representative modelof a workload with the use of distribution analysis,parameter estimation and GoF tests.
From the observations made and the results obtained,we can make some reasonable conclusions. Thefirst is that workload patterns vary significantly acrossobservation periods. Secondly, CPU and IO behaviorare more sensitive to user patterns than Memory.The third conclusion is that developing representativesimulation models that mimic actual cloud workload
Figure 4. Empirical and theoretical PDF of CPU, Memory and IO for the one-week observation period.
Page 1872

behavior within a one-month window is possible. Thissupports the evaluation of new operational resourcemanagement policies before they are deployed inproduction environments.
Table 3. Wilcox Mann-Whitney Test: Empirical vs
Theoretical DistributionsWMW Test CPU Memory IOPS
1 weekW 57696 55506 58075
p-value 0.6199 0.7081 0.5179
2 weeksW 225720 226910 227030
p-value 0.9918 0.8747 0.8622
1 monthW 922290 888160 911880
p-value 0.3419 0.4555 0.6652
3 monthsW 7976400 1.6e+ 07 7819200
p-value 0.8196 <2.2e− 16 0.8009
10. Future Work
As we observed in our model validation results, themultimodal nature of the Memory distribution presentssome challenges to the approach used in this paperwhich tries to fit the data to a single theoreticaldistribution. Future work will include looking at theuse of multi-peak histogram analysis for region splitting[43] in order to fit the derived dataset sub-regions to newparametric distributions.
We also intend to continue building on ourprevious work [11] by implementing a workflowwhere we simulate and evaluate the resource allocationrecommendations from our Integer Linear Programming(ILP) mechanism by using the techniques described inthis paper. This helps support better decision makingin the allocation of resources to workloads in the Cloudenvironment.
Besides the usefulness of distribution fitting andparameter estimation in the simulation and modeling offuture workloads, the work presented in this paper alsoserves as a foundation for the classification of workloadsin order to better forecast future behavior patterns whencapacity constraints change. This work is in progress.
Acknowledgments
The authors would like to thank Brian Perri fromthe Office of Information Technologies at the Universityof Notre Dame for his assistance in the extraction andcuration of the AWS CloudWatch metrics used in thisresearch.
This research was supported in part by the NationalScience Foundation (NSF) Grant IIS-1447795.
References
[1] Google, “Google Cluster Data V1,” 2010. [Online].Available: http://code.google.com/p/googleclusterdata/wiki/TraceVersion1
[2] ——, “Google Cluster Data V2,” 2011. [Online].Available: http://code.google.com/p/googleclusterdata/wiki/ClusterData2011\ 1
[3] Yahoo, “Yahoo! M45 Supercomputing Project.” 2007.[Online]. Available: http://research.yahoo.com/node/1884
[4] S. Kavulya, J. Tan, R. Gandhi, and P. Narasimhan,“An analysis of traces from a production mapreducecluster,” in Proceedings of the 2010 10th IEEE/ACMInternational Conference on Cluster, Cloud and GridComputing. IEEE Computer Society, 2010, pp. 94–103.
[5] Q. Zhang, J. L. Hellerstein, R. Boutaba et al.,“Characterizing task usage shapes in googles computeclusters,” in Proceedings of the 5th internationalworkshop on large scale distributed systems andmiddleware. sn, 2011, pp. 1–6.
[6] A. K. Mishra, J. L. Hellerstein, W. Cirne, andC. R. Das, “Towards characterizing cloud backendworkloads: insights from google compute clusters,”ACM SIGMETRICS Performance Evaluation Review,vol. 37, no. 4, pp. 34–41, 2010.
[7] S. Aggarwal, S. Phadke, and M. Bhandarkar,“Characterization of hadoop jobs using unsupervisedlearning,” in Cloud Computing Technology andScience (CloudCom), 2010 IEEE Second InternationalConference on. IEEE, 2010, pp. 748–753.
[8] I. S. Moreno, P. Garraghan, P. Townend, and J. Xu, “Anapproach for characterizing workloads in google cloud toderive realistic resource utilization models,” in ServiceOriented System Engineering (SOSE), 2013 IEEE 7thInternational Symposium on. IEEE, 2013, pp. 49–60.
[9] ——, “Analysis, modeling and simulation ofworkload patterns in a large-scale utility cloud,”IEEE Transactions on Cloud Computing, vol. 2, no. 2,pp. 208–221, 2014.
[10] D. Magalhaes, R. N. Calheiros, R. Buyya, and D. G.Gomes, “Workload modeling for resource usage analysisand simulation in cloud computing,” Comput. Electr.Eng., vol. 47, no. C, pp. 69–81, Oct. 2015. [Online].Available: https://doi.org/10.1016/j.compeleceng.2015.08.016
[11] F. Nwanganga, M. Saebi, G. Madey, and N. Chawla, “Aminimum-cost flow model for workload optimization oncloud infrastructure,” in 2017 IEEE 10th InternationalConference on Cloud Computing (CLOUD), June 2017,pp. 480–487.
[12] S. A. Baset, L. Wang, and C. Tang, “Towardsan understanding of oversubscription in cloud,” inProceedings of the 2Nd USENIX Conference on HotTopics in Management of Internet, Cloud, and EnterpriseNetworks and Services, ser. Hot-ICE’12. Berkeley, CA,USA: USENIX Association, 2012, pp. 7–7. [Online].Available: http://dl.acm.org/citation.cfm?id=2228283.2228293
[13] L. Lydia et al., “Gartner, magic quadrantfor cloud infrastructure as a service.”Gartner Research, 28 May 2014. [Online].Available: http://www.gartner.com/technology/reprints.do?id=1-1UKQQA6&ct=140528&st=sb
Page 1873

[14] P. Garraghan, P. Townend, and J. Xu, “An empiricalfailure-analysis of a large-scale cloud computingenvironment,” in Proceedings of the 2014 IEEE 15thInternational Symposium on High-Assurance SystemsEngineering, ser. HASE ’14. Washington, DC, USA:IEEE Computer Society, 2014, pp. 113–120. [Online].Available: http://dx.doi.org/10.1109/HASE.2014.24
[15] P. Huang, C. Guo, L. Zhou, J. R. Lorch, Y. Dang,M. Chintalapati, and R. Yao, “Gray failure: Theachilles’ heel of cloud-scale systems,” in Proceedingsof the 16th Workshop on Hot Topics in OperatingSystems, ser. HotOS ’17. New York, NY, USA:ACM, 2017, pp. 150–155. [Online]. Available: http://doi.acm.org/10.1145/3102980.3103005
[16] V. Vasudevan, D. Andersen, M. Kaminsky, L. Tan,J. Franklin, and I. Moraru, “Energy-efficient clustercomputing with fawn: Workloads and implications,”in Proceedings of the 1st International Conference onEnergy-Efficient Computing and Networking. ACM,2010, pp. 195–204.
[17] T. N. B. Duong, X. Li, R. S. M. Goh, X. Tang,and W. Cai, “Qos-aware revenue-cost optimization forlatency-sensitive services in iaas clouds,” in Proceedingsof the 2012 IEEE/ACM 16th International Symposiumon Distributed Simulation and Real Time Applications.IEEE Computer Society, 2012, pp. 11–18.
[18] J. W. Smith and I. Sommerville, “Workload classification& software energy measurement for efficientscheduling on private cloud platforms,” arXiv preprintarXiv:1105.2584, 2011.
[19] G. Wang, A. R. Butt, H. Monti, and K. Gupta,“Towards synthesizing realistic workload traces forstudying the hadoop ecosystem,” in Modeling, Analysis& Simulation of Computer and TelecommunicationSystems (MASCOTS), 2011 IEEE 19th InternationalSymposium on. IEEE, 2011, pp. 400–408.
[20] Rubis, “Rice University Bidding System,” 2013.[Online]. Available: http://rubis.ow2.org/
[21] Amazon Web Services, Inc, “Amazon CloudWatch,”2016. [Online]. Available: https://aws.amazon.com/cloudwatch/
[22] ——, “Monitoring memory and disk metrics foramazon ec2 linux instances,” 2016. [Online].Available: http://docs.aws.amazon.com/AWSEC2/latest/UserGuide/mon-scripts.html
[23] ——, “Sending performance counters tocloudwatch and logs to cloudwatchlogs using ec2config,” 2016. [Online].Available: http://docs.aws.amazon.com/AWSEC2/latest/WindowsGuide/send\ logs\ to\ cwl.html
[24] ——, “Amazon ec2 metrics anddimensions,” 2016. [Online]. Available:http://docs.aws.amazon.com/AmazonCloudWatch/latest/monitoring/ec2-metricscollected.html
[25] ——, “Amazon ebs metrics anddimensions,” 2017. [Online]. Available:http://docs.aws.amazon.com/AmazonCloudWatch/latest/monitoring/ebs-metricscollected.html
[26] ——, “Using the AWS Price List Service,”2017. [Online]. Available: http://docs.aws.amazon.com/awsaccountbilling/latest/aboutv2/price-changes.html
[27] D. G. Feitelson, Workload Modeling for ComputerSystems Performance Evaluation, 1st ed. New York,NY, USA: Cambridge University Press, 2015.
[28] N. Sematech, “Engineering statistics handbook,” NISTSEMATECH, 2006.
[29] A. Ganapathi, Y. Chen, A. Fox, R. Katz, andD. Patterson, “Statistics-driven workload modeling forthe cloud,” in Data Engineering Workshops (ICDEW),2010 IEEE 26th International Conference on. IEEE,2010, pp. 87–92.
[30] C. Hastings Jr, F. Mosteller, J. W. Tukey, andC. P. Winsor, “Low moments for small samples: acomparative study of order statistics,” The Annals ofMathematical Statistics, pp. 413–426, 1947.
[31] A. F. Jenkinson, “The frequency distribution ofthe annual maximum (or minimum) values ofmeteorological elements,” Quarterly Journal of theRoyal Meteorological Society, vol. 81, no. 348, pp.158–171, 1955.
[32] H. Pham and C.-D. Lai, “On recent generalizations of theweibull distribution,” IEEE transactions on reliability,vol. 56, no. 3, pp. 454–458, 2007.
[33] A. M. Mineo, M. Ruggieri et al., “A software tool for theexponential power distribution: The normalp package,”Journal of Statistical Software, vol. 12, no. 4, pp. 1–24,2005.
[34] Y. Chalabi, “New directions in statistical distributions,parametric modeling and portfolio selection,” 2012.
[35] J. A. Greenwood, J. M. Landwehr, N. C. Matalas, andJ. R. Wallis, “Probability weighted moments: definitionand relation to parameters of several distributionsexpressable in inverse form,” Water Resources Research,vol. 15, no. 5, pp. 1049–1054, 1979.
[36] R. Cheng and N. Amin, “Estimating parameters incontinuous univariate distributions with a shifted origin,”Journal of the Royal Statistical Society. Series B(Methodological), pp. 394–403, 1983.
[37] S. Su et al., “Fitting single and mixture of generalizedlambda distributions to data via discretized andmaximum likelihood methods: Gldex in r,” Journal ofStatistical Software, vol. 21, no. 9, pp. 1–17, 2007.
[38] J. Karvanen and A. Nuutinen, “Characterizing thegeneralized lambda distribution by l-moments,”Computational Statistics & Data Analysis, vol. 52, no. 4,pp. 1971–1983, 2008.
[39] W. H. Asquith, “L-moments and tl-moments ofthe generalized lambda distribution,” ComputationalStatistics & Data Analysis, vol. 51, no. 9, pp. 4484–4496,2007.
[40] M. A. Stephens, “Edf statistics for goodness of fit andsome comparisons,” Journal of the American statisticalAssociation, vol. 69, no. 347, pp. 730–737, 1974.
[41] D. Brown, P. Rothery et al., Models in biology:mathematics, statistics and computing. John Wiley &Sons Ltd., 1993.
[42] A. Gold, “Understanding the mann-whitney test,”Journal of Property Tax Assessment and Administration,vol. 4, no. 3, p. 55, 2007.
[43] S. Pal and P. Bhattacharyya, “Multipeak histogramanalysis in region splitting: a regularisation problem,”IEE Proceedings E-Computers and Digital Techniques,vol. 138, no. 4, pp. 285–288, 1991.
Page 1874