Measurement and Characterization of Network Traffic Utilization between Real Network and Simulation...
12
IJCSNS International Journal of Computer Science and Network Security, VOL.8 No.3, March 2008 326 Manuscript received March 5, 2008 Manuscript revised March 20, 2008 Measurement and Characterization of Network Traffic Utilization between Real Network and Simulation Modeling in Heterogeneous Environment 1 Mohd Nazri Ismail and 2 Abdullah Mohd Zin 1 Faculty of MIIT, University Kuala Lumpur, Malaysia 2 Faculty of Computer Science, UKM, Malaysia ABSTRACT We present a novel approach for the measurement and estimation of network traffic utilization between network nodes in heterogeneous environment. This research investigates performance evaluation of network interface port on heterogeneous services and technologies environment. We propose an enhanced equation to evaluate the performance of network interface port via Little Law and Queuing theories to improve the evaluation algorithm. To get accuracy results on the performance of simulation model, we measure (verify and validate) data from lab experiment and real network environment. We use network management tool to capture those data and Fluke Optiview device to generate traffic. As a result, this simulation model can provide a good approximation of the real traffic observed in the real network environment. Through laboratory and field experiments, it shows that the model via simulation is capable of approximating the performance of network utilization and traffic over heterogeneous services and techniques within a minimum error range. 1. INTRODUCTION Considerable research has been conducted to model and quantify the performance of heterogeneous services and technologies (e.g [25], [26], [27]). Accurate measurements and analyses of network characteristics are essential for robust network performance and management. However, no current research specifically focuses on using queuing theory to measure heterogeneous services and technologies performance, which is the object of this research. Queuing theory [3] has been used as an effective tool to model performance in several technical and social contexts. Evaluating the performance of a computer networking usually involves constructing an appropriate model to predict the heterogeneous environment behaviour via simulation model. The heterogeneous environment model is then analyzed and simulated using mathematical techniques. Mathematical models describe the heterogeneous environment with a set of equations. For example, several flow-level network traffic models have been proposed to describe/stimulate [21], [23], [24]. These models have been used to study fairness, response times, queue lengths and loss probabilities under different assumptions and using a variety of mathematical techniques. Queuing theory has been widely used to model and analyze the network performance of complex systems involving services, communication systems, computer networks and vehicular traffic. In contrast to other works in the literature (e.g., [7], [8], [9]), we developed simulation model to measure the performance of heterogeneous environment. Our model can be used to generate representative packet traffic in a live network environment or in a simulated environment. The benefits include the effective bandwidth and traffic over heterogeneous environment with and without considering the networks packet loss ratio of the current traffic (real traffic). The significant of this study was to develop a simulation model to measure the performance of network traffic utilization in heterogeneous network environment using Queuing theory. This model could assist network administrators to design and manage heterogeneous network systems. This simulation model can be used in various services and technologies to measure heterogeneous environment. Therefore, this simulation model is designed to: i) predict the performance of various services (e.g. video, audio, voice and message) in order to aid technology assessment and capacity planning; ii) predict the expected behavior of new services and designs through qualitative or quantitative estimates of network performance; iii) assist network administrator to prepare, propose, plan and design network topology more effective and systematic; and iv) conduct ‘What-If’ analysis for evaluating heterogeneous network environment performance. Moreover, in the future, the integration of data and communication services, almost every ‘Internet Ready’ device will be a communicable device [11]. With the availability of this infrastructure, users are now demanding and expecting more services [19], [20]. Convergence is pushing towards an
Transcript of Measurement and Characterization of Network Traffic Utilization between Real Network and Simulation...
IJCSNS International Journal of Computer Science and Network Security, VOL.8 No.3, March 2008
326
Manuscript received March 5, 2008
Manuscript revised March 20, 2008
Measurement and Characterization of Network Traffic Utilization between Real Network and Simulation Modeling in
Heterogeneous Environment
1Mohd Nazri Ismail and 2Abdullah Mohd Zin
1Faculty of MIIT, University Kuala Lumpur, Malaysia 2Faculty of Computer Science, UKM, Malaysia
ABSTRACT We present a novel approach for the measurement and estimation of network traffic utilization between network nodes in heterogeneous environment. This research investigates performance evaluation of network interface port on heterogeneous services and technologies environment. We propose an enhanced equation to evaluate the performance of network interface port via Little Law and Queuing theories to improve the evaluation algorithm. To get accuracy results on the performance of simulation model, we measure (verify and validate) data from lab experiment and real network environment. We use network management tool to capture those data and Fluke Optiview device to generate traffic. As a result, this simulation model can provide a good approximation of the real traffic observed in the real network environment. Through laboratory and field experiments, it shows that the model via simulation is capable of approximating the performance of network utilization and traffic over heterogeneous services and techniques within a minimum error range. 1. INTRODUCTION Considerable research has been conducted to model and quantify the performance of heterogeneous services and technologies (e.g [25], [26], [27]). Accurate measurements and analyses of network characteristics are essential for robust network performance and management. However, no current research specifically focuses on using queuing theory to measure heterogeneous services and technologies performance, which is the object of this research. Queuing theory [3] has been used as an effective tool to model performance in several technical and social contexts. Evaluating the performance of a computer networking usually involves constructing an appropriate model to predict the heterogeneous environment behaviour via simulation model. The heterogeneous environment model is then analyzed and simulated using mathematical techniques. Mathematical models describe the heterogeneous environment with a set of equations. For example, several
flow-level network traffic models have been proposed to describe/stimulate [21], [23], [24]. These models have been used to study fairness, response times, queue lengths and loss probabilities under different assumptions and using a variety of mathematical techniques. Queuing theory has been widely used to model and analyze the network performance of complex systems involving services, communication systems, computer networks and vehicular traffic. In contrast to other works in the literature (e.g., [7], [8], [9]), we developed simulation model to measure the performance of heterogeneous environment. Our model can be used to generate representative packet traffic in a live network environment or in a simulated environment. The benefits include the effective bandwidth and traffic over heterogeneous environment with and without considering the networks packet loss ratio of the current traffic (real traffic). The significant of this study was to develop a simulation model to measure the performance of network traffic utilization in heterogeneous network environment using Queuing theory. This model could assist network administrators to design and manage heterogeneous network systems. This simulation model can be used in various services and technologies to measure heterogeneous environment. Therefore, this simulation model is designed to: i) predict the performance of various services (e.g. video, audio, voice and message) in order to aid technology assessment and capacity planning; ii) predict the expected behavior of new services and designs through qualitative or quantitative estimates of network performance; iii) assist network administrator to prepare, propose, plan and design network topology more effective and systematic; and iv) conduct ‘What-If’ analysis for evaluating heterogeneous network environment performance. Moreover, in the future, the integration of data and communication services, almost every ‘Internet Ready’ device will be a communicable device [11]. With the availability of this infrastructure, users are now demanding and expecting more services [19], [20]. Convergence is pushing towards an
IJCSNS International Journal of Computer Science and Network Security, VOL.8 No.3, March 2008 327
environment that requires new investment in infrastructure and able to support the delivery of rich services (various services), applications and content. For example, connecting computers to phone, browsing websites with cell phones or reading emails on TV screens to illustrate idea of convergence [17], [21]. In addition, more people are using multimedia services such as MMS, WAP, i-mode or push-to-talk. GPRS (General Packet Radio Service) is an overlay on GSM networks that allows this kind of end-to-end IP-based packet traffic from mobile devices to the Internet [5]. Network deployment is growing increasing complex as the industry lashes together a mix of wired and wireless technologies into large-scale heterogeneous network architecture and as user applications and traffic continue to evolve. Faced with this growing complexity, network designers and researchers almost universally use simulation in order to predict the expected performance of complex networks [2]. Modeling the Intranet or Internet traffic is an important issue. It is unlikely that we will be able to understand the traffic characteristics, predict network performance, or design dimensioning tools without simulation models. The successful evolution of the Internet is tightly coupled to the ability to design simple and accurate models [6]. Many factors may contribute to the congestion of network interface, such as a heavy load in the network that usually generates higher traffic. Once the number of requests exceeds the maximum capability of network, many clients will not able to receive responses from the network [1]. Thus, this research is critical to be conducted in order to predict and measure of network traffic utilization in heterogeneous environment. 2. PROBLEM STATMENTS In the 21 century, a network infrastructure is based on multi-service implementation over convergence of network medium such as ISP, PSTN and GSM [12], [15]. Availability of various services has produced multi-traffic in network infrastructure. Therefore, multi-traffic in the network infrastructure has become more complex to observe and analyze [13], [16], [17]. Today, retrieving and sending information can be done using a variety of technologies such as PC, PDA, fix and mobile phones via the wireless, high speed network, ISDN and ADSL lines that are more prone to heterogeneous environment, but unfortunately the optimal capability of technologies are not fully realized. The main factors of network congestion are related to network design and bandwidth capacity [18]. Nevertheless, few studies have been conducted to evaluate the application of computer network technologies and services over heterogeneous environment especially in Higher Education Institutes. Algorithms for actively
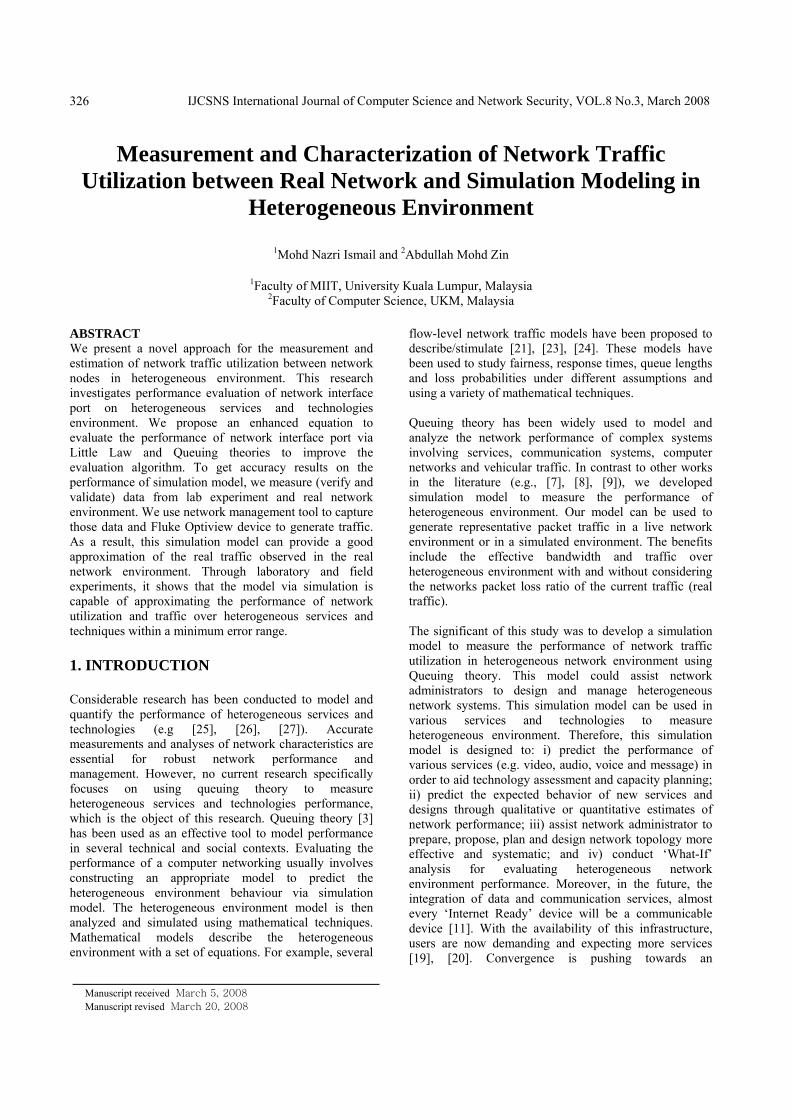
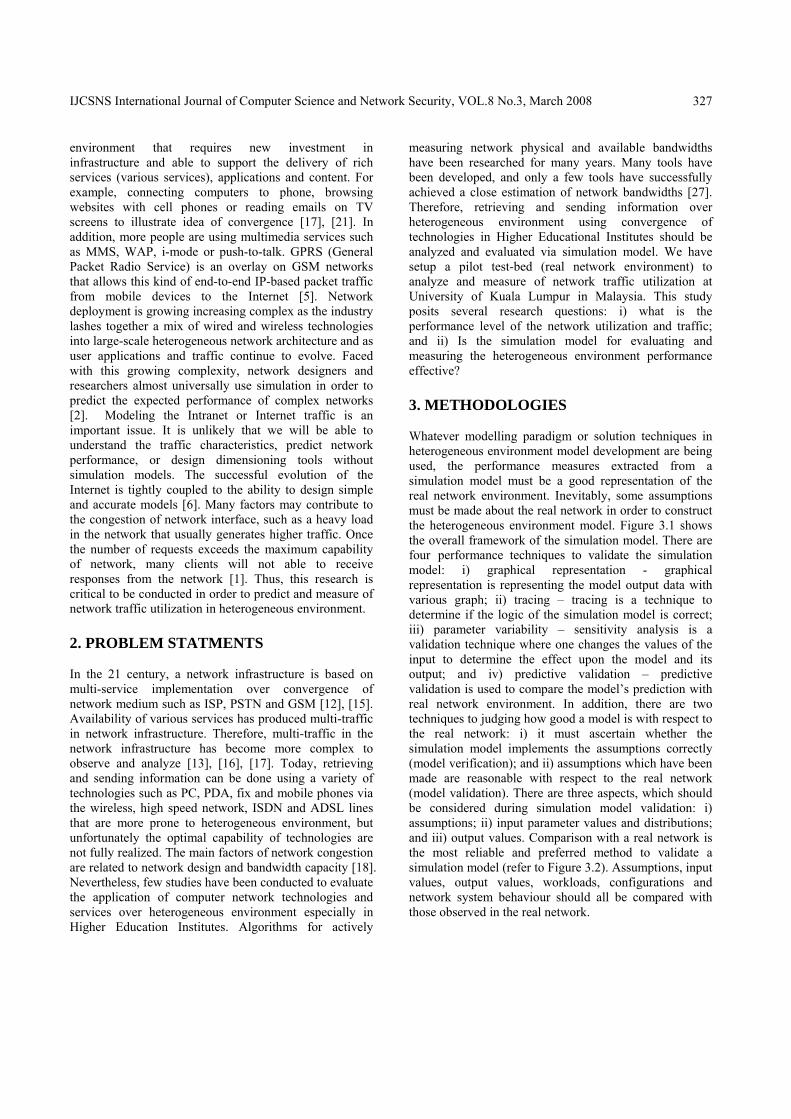
measuring network physical and available bandwidths have been researched for many years. Many tools have been developed, and only a few tools have successfully achieved a close estimation of network bandwidths [27]. Therefore, retrieving and sending information over heterogeneous environment using convergence of technologies in Higher Educational Institutes should be analyzed and evaluated via simulation model. We have setup a pilot test-bed (real network environment) to analyze and measure of network traffic utilization at University of Kuala Lumpur in Malaysia. This study posits several research questions: i) what is the performance level of the network utilization and traffic; and ii) Is the simulation model for evaluating and measuring the heterogeneous environment performance effective? 3. METHODOLOGIES Whatever modelling paradigm or solution techniques in heterogeneous environment model development are being used, the performance measures extracted from a simulation model must be a good representation of the real network environment. Inevitably, some assumptions must be made about the real network in order to construct the heterogeneous environment model. Figure 3.1 shows the overall framework of the simulation model. There are four performance techniques to validate the simulation model: i) graphical representation - graphical representation is representing the model output data with various graph; ii) tracing – tracing is a technique to determine if the logic of the simulation model is correct; iii) parameter variability – sensitivity analysis is a validation technique where one changes the values of the input to determine the effect upon the model and its output; and iv) predictive validation – predictive validation is used to compare the model’s prediction with real network environment. In addition, there are two techniques to judging how good a model is with respect to the real network: i) it must ascertain whether the simulation model implements the assumptions correctly (model verification); and ii) assumptions which have been made are reasonable with respect to the real network (model validation). There are three aspects, which should be considered during simulation model validation: i) assumptions; ii) input parameter values and distributions; and iii) output values. Comparison with a real network is the most reliable and preferred method to validate a simulation model (refer to Figure 3.2). Assumptions, input values, output values, workloads, configurations and network system behaviour should all be compared with those observed in the real network.
IJCSNS International Journal of Computer Science and Network Security, VOL.8 No.3, March 2008 328
Figure 3.1: Simulation Model Development Methodology
Figure 3.2: Simulation Model Verification and Validation
Methodology 4. PROPOSE SIMULATION MODEL DEVELOPMENT FOR NETWORK UTILIZATION AND TRAFFIC Many different types of modeling and simulation applications are used in various disciplines such as acquisition, analysis, education, entertainment, research and training [14]. In the Figure 4.1, theoretical model is based on a random distribution of service duration. “Request” defines the way clients use the computer network to request services, while, “Response” represents the way clients receive services from the server. Simulation model is divided as follows: i) to study
physical of real heterogeneous network environment; ii) transform physical of real heterogeneous network environment into logical model; and iii) develop and implement the heterogeneous simulation model.
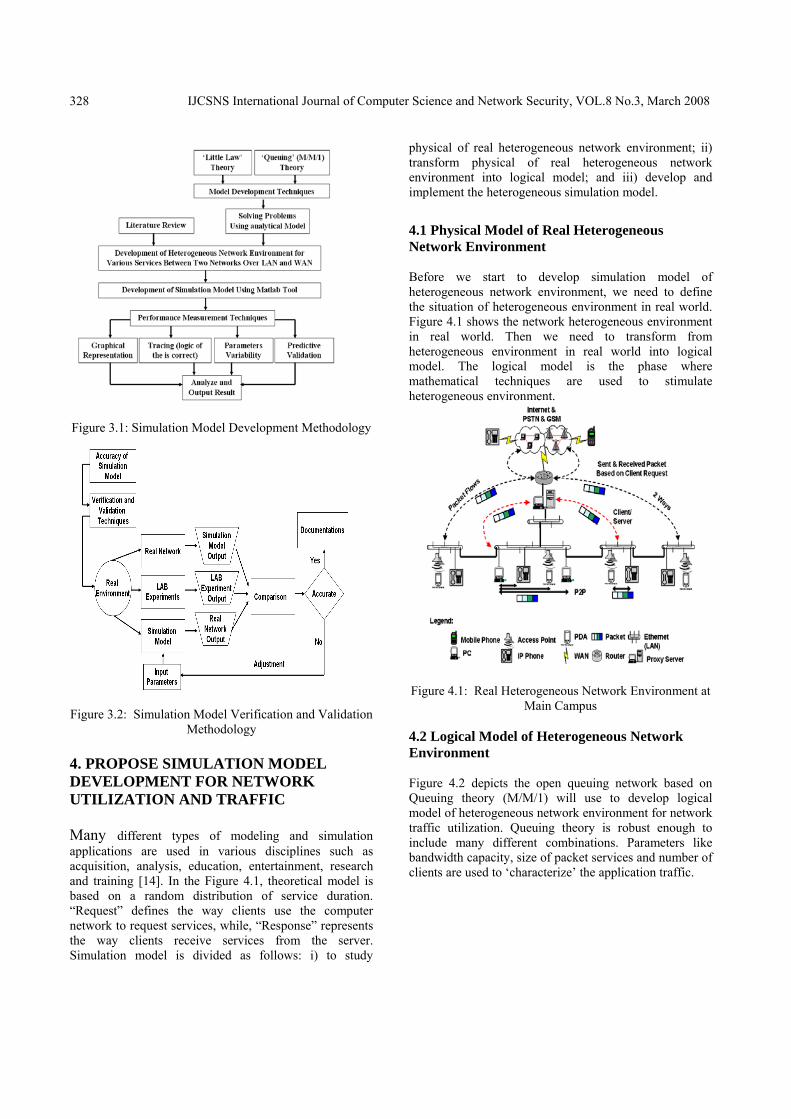
4.1 Physical Model of Real Heterogeneous Network Environment Before we start to develop simulation model of heterogeneous network environment, we need to define the situation of heterogeneous environment in real world. Figure 4.1 shows the network heterogeneous environment in real world. Then we need to transform from heterogeneous environment in real world into logical model. The logical model is the phase where mathematical techniques are used to stimulate heterogeneous environment.
Figure 4.1: Real Heterogeneous Network Environment at
Main Campus 4.2 Logical Model of Heterogeneous Network Environment Figure 4.2 depicts the open queuing network based on Queuing theory (M/M/1) will use to develop logical model of heterogeneous network environment for network traffic utilization. Queuing theory is robust enough to include many different combinations. Parameters like bandwidth capacity, size of packet services and number of clients are used to ‘characterize’ the application traffic.
IJCSNS International Journal of Computer Science and Network Security, VOL.8 No.3, March 2008 329
Figure 4.2: Logical model of Heterogeneous
Environment at Main Campus
4.3 Development of Heterogeneous Network Environment Model This section describes a simple analytical queuing and little law theories that capture the performance characteristics of network utilization and traffic operations. A link refers to a single connection between routers and hosts. The link bandwidth is the rate at which bits can be inserted into the medium. The faster bandwidth the more bits can be placed on the medium in a given time frame [22]. At this stage, we assume the data are transported between the two network sites (source and destination) as previously shown in Figures 4.1 and Figure 4.2. Table 4.1 shows the parameters that have been used in the model development. In open queuing network, the throughput of the heterogeneous network environment is determined by the input rate in the system. Table 4.2 summarizes all the parameters used in the model. Table 4.3 also shows the input and output parameters.
Table 4.1 Notations for Original Queuing and Little Theories
Model Parameters
Meaning
N Average number of clients in the system
T Average time a client spends in the system (second)
Clients arrival rates μ Service rate in second
1/μ Mean service times ρ Traffic intensity
Table 4.2: Notations for Model Development
Model Parameters
Meaning
N Average number of traffics on the network
T Average time of clients arrive on the network (second)
P (P1,P2,P3,...Pm) Various of services P1 Client uses single service
Size of packet service request by client ( traffic)
Traffic response from server to clients
Nklient + server Number of clients in second over single service
U klient + server Network traffic utilization usage based on number of clients in second over single service
C (CLAN, CWAN) Size of Bandwidth on LAN and WAN interface ports
Uhetergenes Network traffic utilization usage for heterogeneous environment
Heter klient + server Number of clients and traffics over heterogeneous environment
Total size of packet services request by clients (traffic)
Jum_klient Number of clients Tjum Total number of clients access on
the network in second
Table 4.3: Input and Output Metrics Use for Model Development
Input Parameters Output Parameters Users request services from server in bytes
(Bytes)
Traffic rates is used in bit per second (bps) and bytes
per second (bytes/sec) Server response to users in
bytes (Bytes) Network traffic utilization at network interface server
(%) Type of services request
Total number of clients use services
The original Queuing theory is defined as an average number of clients in the system (variable name is ‘N’) in equation 1. Equation 2 is defined as traffic intensity use by clients in the system. Equation 1 and 2 are derived based on logical model that has been designed to meet requirements for heterogeneous network environment. Logical model is derived and formulated in a single service (homogeneous concept) as in equations 3, 4, 5, 6 and 7. Then, the logical model is derived to the heterogeneous network environment in equations 8, 9, 10, 11, 12 and 13.
λ
Jumlahμ
klientμserverμ
IJCSNS International Journal of Computer Science and Network Security, VOL.8 No.3, March 2008 330
----- (1) ----- (2)
Client uses single service for accessing network server
N = µklient * (Jum_klient * T) --- (3) N klient + server = P1 * (Jum_klient * T) --- (4) Nklient + server = (Request+Response)*(Jum_klient*T) -- (5) Nklient + server = (µklient + µserver)* (Jum_klient*T) --- (6) U klient + server = N klient + server / C ---- (7) Client uses various services for accessing network server
in Heterogeneous Environment TJum = Jum_klient * T ---- (8)
Heterklient + server = (P1+P2+P3+….+ Pm)*TJum
--- (9)
Heterklient + server = (µklient1+µklient2+µklient3 +..+µklient_m)*TJum ---- (10) Heterklient + server = (µJumlah) + (µserver) * TJum --- (11) Where P1+P2+P3+…+Pm = Uklient1+Uklient2+ Uklient3+…+Uklient_m = jumlahμ --- (12) Uhetergenes = Heter klient + server / C --- (13) Figure 4.3 shows how the model has been formulated from real network environment to simulation model. The main valuable aspects of the simulation study is to explain and understand real world phenomena that are costly to perform in the laboratory or difficult to collect in field experiments. A successful simulation model that is able to provide a sufficiently credible solution that can be used for prediction. Since it is not feasible to construct a simulation model that represents all the details and behaviors of the real network, some assumptions must be
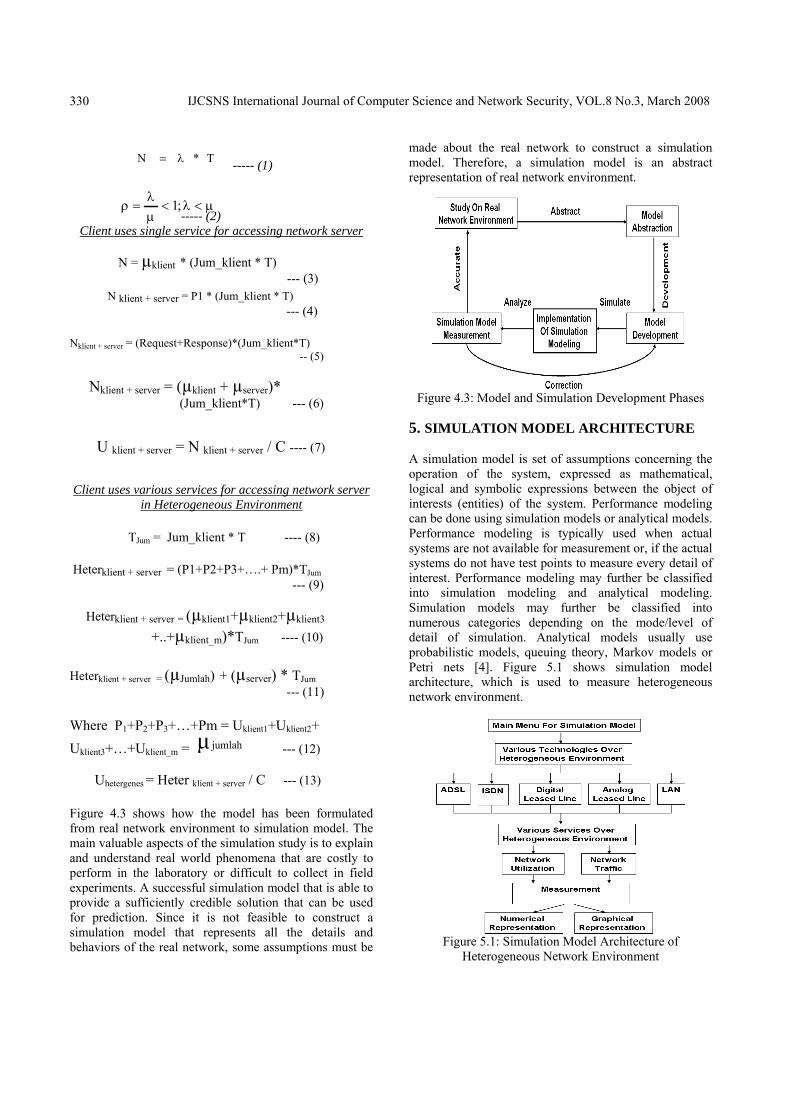
made about the real network to construct a simulation model. Therefore, a simulation model is an abstract representation of real network environment.
Figure 4.3: Model and Simulation Development Phases 5. SIMULATION MODEL ARCHITECTURE A simulation model is set of assumptions concerning the operation of the system, expressed as mathematical, logical and symbolic expressions between the object of interests (entities) of the system. Performance modeling can be done using simulation models or analytical models. Performance modeling is typically used when actual systems are not available for measurement or, if the actual systems do not have test points to measure every detail of interest. Performance modeling may further be classified into simulation modeling and analytical modeling. Simulation models may further be classified into numerous categories depending on the mode/level of detail of simulation. Analytical models usually use probabilistic models, queuing theory, Markov models or Petri nets [4]. Figure 5.1 shows simulation model architecture, which is used to measure heterogeneous network environment.
Figure 5.1: Simulation Model Architecture of
Heterogeneous Network Environment
T*N λ=
μ<λ<μλ
=ρ ;1
IJCSNS International Journal of Computer Science and Network Security, VOL.8 No.3, March 2008 331
This simulation model allows fast evaluation of important performance measures, such as network utilization and traffic, in terms of measurable or controllable parameters; it also can be used as a system management tool. Our model is based on 0.1% - 1.0% utilization values. Outputs of the simulation model represent an estimate of the real outputs for the physical real network. Network utilization rate is the ratio of current network traffic to the maximum traffic that the port can handle. It indicates the bandwidth use in the network. High network utilization rate indicates the network is busy whereas low utilization rate indicates the network is idle. Four sets of experiments were conducted in lab and real network environment with different scenarios at University of Kuala Lumpur. Table 5.1 and Table 5.2 show several variables bytes were performed from source (client) to destination (server) to access network server. A congested network can be modeled by increasing the number of clients, reducing the bandwidth link, or by adding size of services. Table 5.1: Type and Size of Services Parameters Using in
Real Network (Fluke Optiview device) for 100 Mbps
Frame Size (Client + Server) in Bytes
Clients Arrival Rates (one second)
512 262 778 1633 831 149 1042 3961 1518 1726
Table 5.2: Type and Size of Services Parameters Using in
Real Network (Fluke Optiview device) for 10 Mbps
Frame Size (Client + Server); (Bytes)
Clients Arrival Rates (one second)
778 812 831 393 1033 393 1518 180
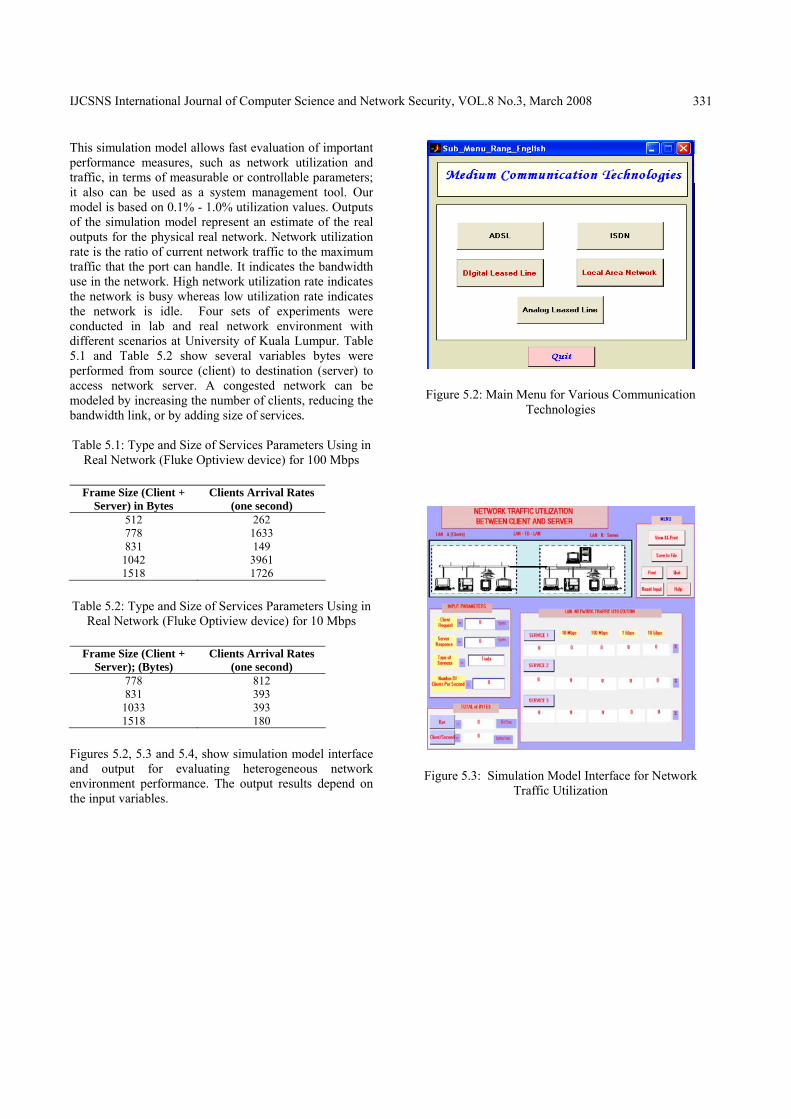
Figures 5.2, 5.3 and 5.4, show simulation model interface and output for evaluating heterogeneous network environment performance. The output results depend on the input variables.
Figure 5.2: Main Menu for Various Communication Technologies
Figure 5.3: Simulation Model Interface for Network Traffic Utilization
IJCSNS International Journal of Computer Science and Network Security, VOL.8 No.3, March 2008 332
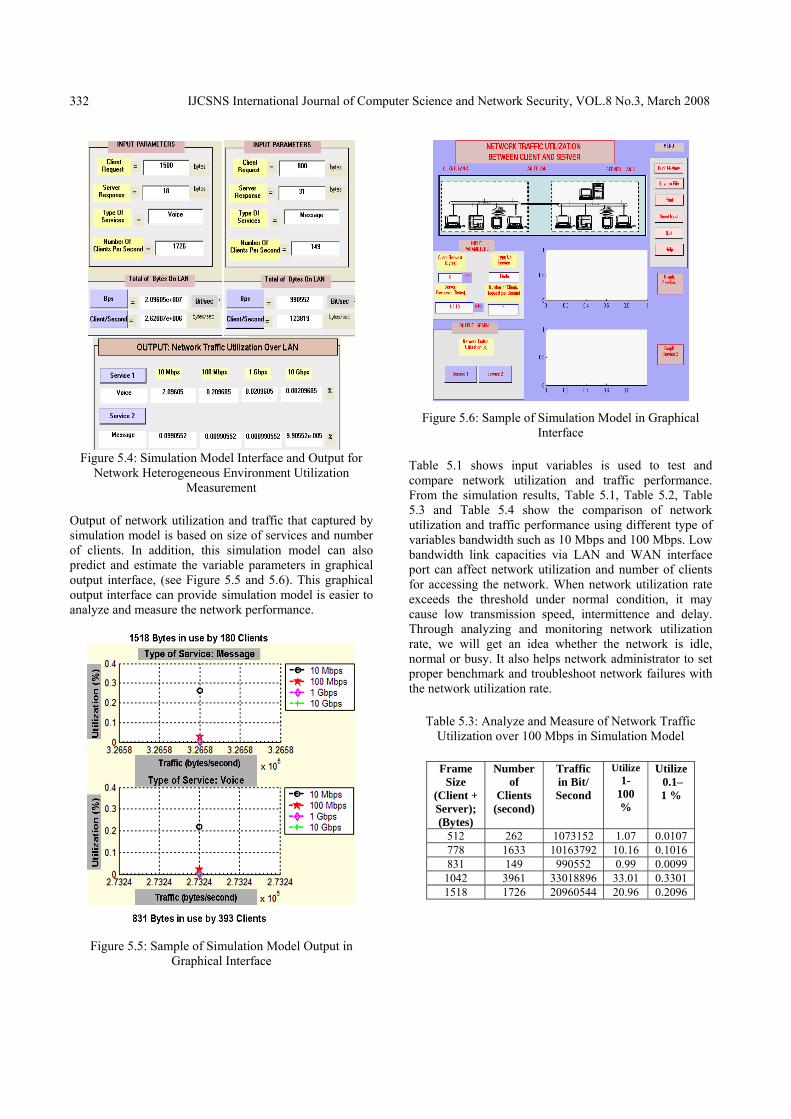
Figure 5.4: Simulation Model Interface and Output for
Network Heterogeneous Environment Utilization Measurement
Output of network utilization and traffic that captured by simulation model is based on size of services and number of clients. In addition, this simulation model can also predict and estimate the variable parameters in graphical output interface, (see Figure 5.5 and 5.6). This graphical output interface can provide simulation model is easier to analyze and measure the network performance.
Figure 5.5: Sample of Simulation Model Output in Graphical Interface
Figure 5.6: Sample of Simulation Model in Graphical
Interface
Table 5.1 shows input variables is used to test and compare network utilization and traffic performance. From the simulation results, Table 5.1, Table 5.2, Table 5.3 and Table 5.4 show the comparison of network utilization and traffic performance using different type of variables bandwidth such as 10 Mbps and 100 Mbps. Low bandwidth link capacities via LAN and WAN interface port can affect network utilization and number of clients for accessing the network. When network utilization rate exceeds the threshold under normal condition, it may cause low transmission speed, intermittence and delay. Through analyzing and monitoring network utilization rate, we will get an idea whether the network is idle, normal or busy. It also helps network administrator to set proper benchmark and troubleshoot network failures with the network utilization rate.
Table 5.3: Analyze and Measure of Network Traffic Utilization over 100 Mbps in Simulation Model
Frame
Size (Client + Server); (Bytes)
Number of
Clients (second)
Traffic in Bit/ Second
Utilize 1-
100 %
Utilize 0.1–1 %
512 262 1073152 1.07 0.0107778 1633 10163792 10.16 0.1016831 149 990552 0.99 0.00991042 3961 33018896 33.01 0.33011518 1726 20960544 20.96 0.2096
IJCSNS International Journal of Computer Science and Network Security, VOL.8 No.3, March 2008 333
Table 5.4: Analyze and Measure of Network Traffic Utilization over 10 Mbps in Simulation Model
Frame
Size (Client + Server); (Bytes)
Number of
Clients (second)
Traffic in Bit/ Second
Utilize 1-
100 %
Utilize 0.1–1 %
778 812 5053888 50.53 0.5053831 393 2612664 26.12 0.26121033 393 3247752 32.47 0.32471518 180 2185920 21.85 0.2185
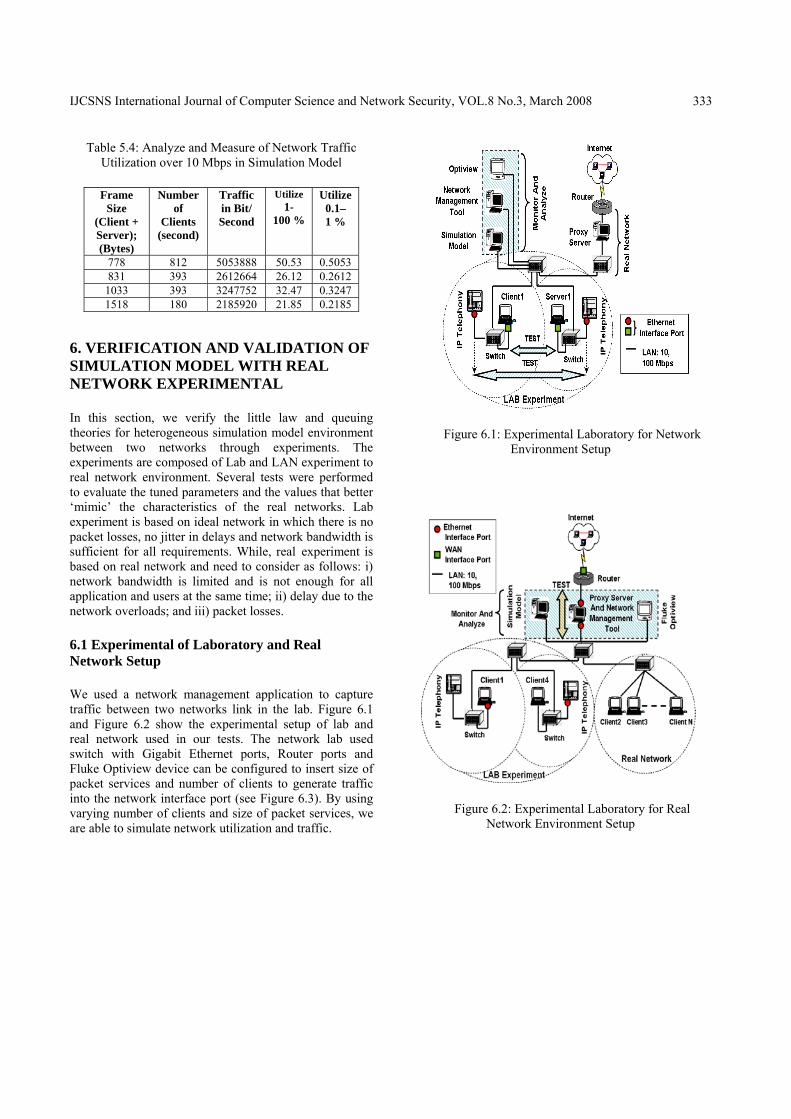
6. VERIFICATION AND VALIDATION OF SIMULATION MODEL WITH REAL NETWORK EXPERIMENTAL In this section, we verify the little law and queuing theories for heterogeneous simulation model environment between two networks through experiments. The experiments are composed of Lab and LAN experiment to real network environment. Several tests were performed to evaluate the tuned parameters and the values that better ‘mimic’ the characteristics of the real networks. Lab experiment is based on ideal network in which there is no packet losses, no jitter in delays and network bandwidth is sufficient for all requirements. While, real experiment is based on real network and need to consider as follows: i) network bandwidth is limited and is not enough for all application and users at the same time; ii) delay due to the network overloads; and iii) packet losses. 6.1 Experimental of Laboratory and Real Network Setup We used a network management application to capture traffic between two networks link in the lab. Figure 6.1 and Figure 6.2 show the experimental setup of lab and real network used in our tests. The network lab used switch with Gigabit Ethernet ports, Router ports and Fluke Optiview device can be configured to insert size of packet services and number of clients to generate traffic into the network interface port (see Figure 6.3). By using varying number of clients and size of packet services, we are able to simulate network utilization and traffic.
Figure 6.1: Experimental Laboratory for Network Environment Setup
Figure 6.2: Experimental Laboratory for Real Network Environment Setup
IJCSNS International Journal of Computer Science and Network Security, VOL.8 No.3, March 2008 334
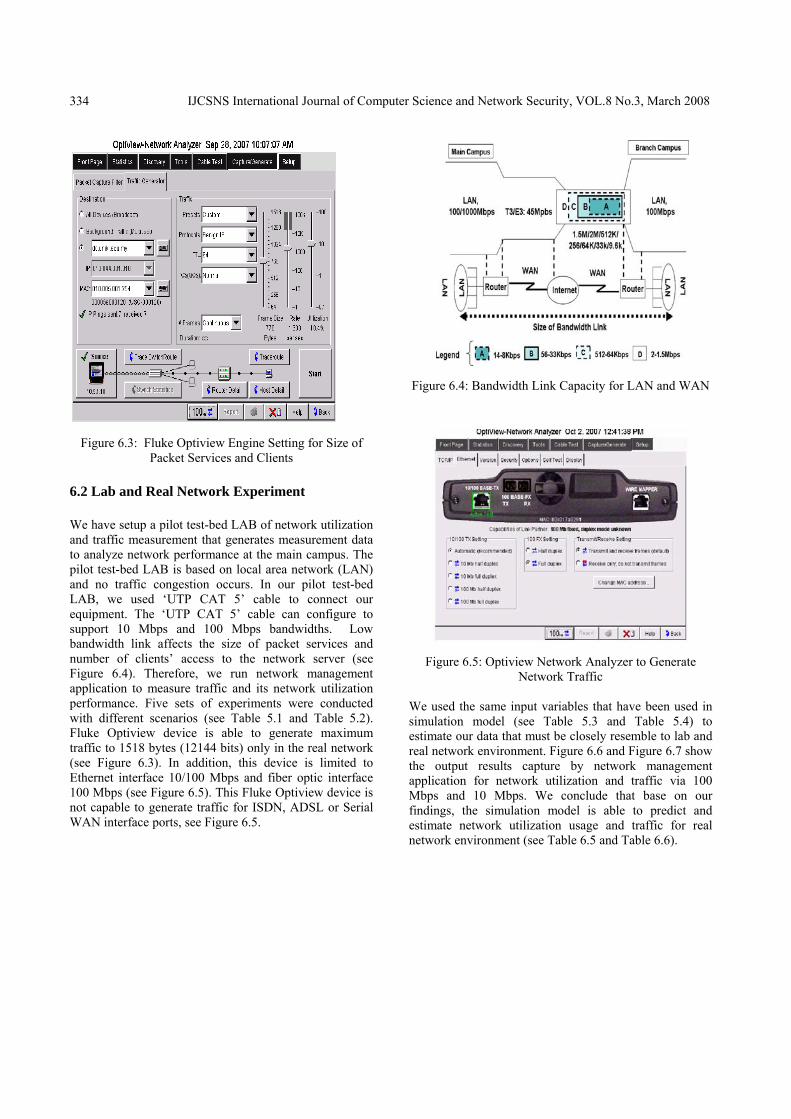
Figure 6.3: Fluke Optiview Engine Setting for Size of Packet Services and Clients
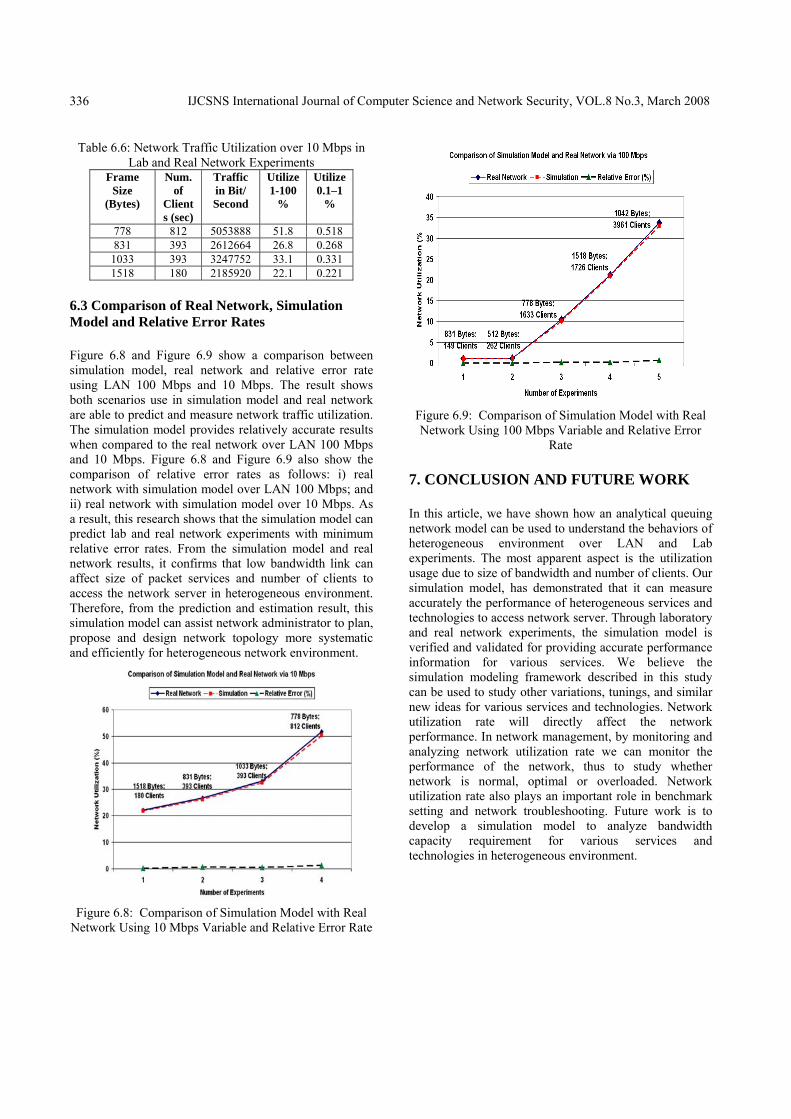
6.2 Lab and Real Network Experiment We have setup a pilot test-bed LAB of network utilization and traffic measurement that generates measurement data to analyze network performance at the main campus. The pilot test-bed LAB is based on local area network (LAN) and no traffic congestion occurs. In our pilot test-bed LAB, we used ‘UTP CAT 5’ cable to connect our equipment. The ‘UTP CAT 5’ cable can configure to support 10 Mbps and 100 Mbps bandwidths. Low bandwidth link affects the size of packet services and number of clients’ access to the network server (see Figure 6.4). Therefore, we run network management application to measure traffic and its network utilization performance. Five sets of experiments were conducted with different scenarios (see Table 5.1 and Table 5.2). Fluke Optiview device is able to generate maximum traffic to 1518 bytes (12144 bits) only in the real network (see Figure 6.3). In addition, this device is limited to Ethernet interface 10/100 Mbps and fiber optic interface 100 Mbps (see Figure 6.5). This Fluke Optiview device is not capable to generate traffic for ISDN, ADSL or Serial WAN interface ports, see Figure 6.5.
Figure 6.4: Bandwidth Link Capacity for LAN and WAN
Figure 6.5: Optiview Network Analyzer to Generate Network Traffic
We used the same input variables that have been used in simulation model (see Table 5.3 and Table 5.4) to estimate our data that must be closely resemble to lab and real network environment. Figure 6.6 and Figure 6.7 show the output results capture by network management application for network utilization and traffic via 100 Mbps and 10 Mbps. We conclude that base on our findings, the simulation model is able to predict and estimate network utilization usage and traffic for real network environment (see Table 6.5 and Table 6.6).

IJCSNS International Journal of Computer Science and Network Security, VOL.8 No.3, March 2008 335
Figure 6.6: Lab and Real Network Experiment Result
Capture by Network Management Application over 100 Mbps
Table 6.5: Network Traffic Utilization over 100 Mbps in
Lab and Real Network Experiments
Frame Size; Bytes
Num. of
Clients (sec)
Traffic in Bit/ Second
Utilize 1-100
%
Utilize 0.1–1
%
512 262 1073152 1.11 0.0111778 1633 1016379 10.4 0.104831 149 990552 1.01 0.01011042 3961 3301889 33.7 0.3371518 1726 2096054 21.2 0.212
Figure 6.7: Lab and Real Network Experiment Result Capture by Network Management Application over 10
Mbps
IJCSNS International Journal of Computer Science and Network Security, VOL.8 No.3, March 2008 336
Table 6.6: Network Traffic Utilization over 10 Mbps in Lab and Real Network Experiments
Frame Size
(Bytes)
Num. of
Clients (sec)
Traffic in Bit/ Second
Utilize 1-100
%
Utilize 0.1–1
%
778 812 5053888 51.8 0.518831 393 2612664 26.8 0.2681033 393 3247752 33.1 0.3311518 180 2185920 22.1 0.221
6.3 Comparison of Real Network, Simulation Model and Relative Error Rates Figure 6.8 and Figure 6.9 show a comparison between simulation model, real network and relative error rate using LAN 100 Mbps and 10 Mbps. The result shows both scenarios use in simulation model and real network are able to predict and measure network traffic utilization. The simulation model provides relatively accurate results when compared to the real network over LAN 100 Mbps and 10 Mbps. Figure 6.8 and Figure 6.9 also show the comparison of relative error rates as follows: i) real network with simulation model over LAN 100 Mbps; and ii) real network with simulation model over 10 Mbps. As a result, this research shows that the simulation model can predict lab and real network experiments with minimum relative error rates. From the simulation model and real network results, it confirms that low bandwidth link can affect size of packet services and number of clients to access the network server in heterogeneous environment. Therefore, from the prediction and estimation result, this simulation model can assist network administrator to plan, propose and design network topology more systematic and efficiently for heterogeneous network environment.
Figure 6.8: Comparison of Simulation Model with Real
Network Using 10 Mbps Variable and Relative Error Rate
Figure 6.9: Comparison of Simulation Model with Real Network Using 100 Mbps Variable and Relative Error
Rate 7. CONCLUSION AND FUTURE WORK In this article, we have shown how an analytical queuing network model can be used to understand the behaviors of heterogeneous environment over LAN and Lab experiments. The most apparent aspect is the utilization usage due to size of bandwidth and number of clients. Our simulation model, has demonstrated that it can measure accurately the performance of heterogeneous services and technologies to access network server. Through laboratory and real network experiments, the simulation model is verified and validated for providing accurate performance information for various services. We believe the simulation modeling framework described in this study can be used to study other variations, tunings, and similar new ideas for various services and technologies. Network utilization rate will directly affect the network performance. In network management, by monitoring and analyzing network utilization rate we can monitor the performance of the network, thus to study whether network is normal, optimal or overloaded. Network utilization rate also plays an important role in benchmark setting and network troubleshooting. Future work is to develop a simulation model to analyze bandwidth capacity requirement for various services and technologies in heterogeneous environment.
IJCSNS International Journal of Computer Science and Network Security, VOL.8 No.3, March 2008 337
REFERENCES [1] J.kontio & R.Conradi, “Evaluating the Performance of a
Web Site via Queuing Theory” Software Quality - ECSQ 2002: 7th International Conference, Helsinki, Finland, June 9-13, 2002, pp. 63-72. Springer-Verlag Berlin Heideberg.
[2] John Heidemann, Kevin Mills, Sri Kumar. 2001.”Expanding Confidence in Network Simulation”, IEEE computer, Vol. 15 (5), p.p 58-63.
[3] Ramon Puigjaner ,“Performance Modelling of Computer Networks”, IFIP/ACM Latin America Networking Conference 2003, October 3 - 5, 2003, La Paz, Bolivia. ACM 2003.
[4] Performance analysis of distributed information retrieval architectures using an improved network simulation model”. Information Processing and Management 43 (2007) 204-224, Science Direct, 2006.
[5] Georges Nogueira. ‘Measurement based validation of GPRS/EDGE Analytical Models’
[6] Chadi Barakat, Patrick Thiran, Gianluca Iannaccone, Christophe Diot, Philippe Owezarski “A flow-based model for Internet backbone traffic”. Proceedings of the 2nd ACM SIGCOMM Workshop on Internet measurment , p.p: 35 – 47,2002, Marseille, France.
[7] S. Ben Fredj, T. Bonald, A. Proutiere, G. Regnie and J. Roberts, “Statistical Bandwidth Sharing: A Study of Congestion at Flow Level”, ACM SIGCOMM, August 2001.
[8] T. Bu and D. Towsley, “Fixed Point Approximation for TCP behavior in an AQM Network”, ACM SIGMETRICS, Jun. 2001.
[9] A.A. Kherani and A. Kumar, “Performance Analysis of TCP with Nonpersistent Sessions”, Workshop on Modeling of Flow and Congestion Control, INRIA, Ecole Normale Superieure, Paris, September 4-6, 2000.
[10] Osman Balci. ‘Quality Assessment, Verification and Validation of Modeling and Simulation Applications’. Proceeding of the 2004 Winter Simulation Conference. Simulation Conference, 2004. Proceedings of the 2004 Winter Vol. 1, Issue , 5-8 Dec. 2004 Page(s): - 129
[11] Qigang Zhao; Xuming Fang; Qunzhan Li; Zhengyou He. 2005. “WNN-based NGN traffic Prediction”. ISADS 2005. Proceedings Autonomous Decentralized Systems: 230-234.
[12] Kyung-Hyu .L; Kyu-Ok .L; Kwon-Chul .P; Jong-Ok .L & Yoon-Hak .B.2003. “Architecture to be deployed on strategies of next-generation networks”. Communications ICC '03. The IEEE,Vol. 2, ms:819 – 822.
[13] Xianxin Jiang; Fangchun Yang; Hua Zou. 2003. “A novel architecture to customer service management for the NGN”. ICCT 2003. International Conference, 1: 123-126.
[14] David R.Gerhan & Stephen M. Mutula. 2005. “Bandwidth bottlenecks at the University of Botswana”, Published by Emerald Group, Vol. 23 (1), p.g 102-117.
[15] Jianqiang Li; Zhaohao Sun. 2004. “Internet/Web technology in higher education in China”. Advanced Learning Technologies, 2004. Proceedings. IEEE International Conference,:993 – 997.
[16] Binh Thai, Rachel Wan, Aruna Seneviratne, Thierry Rakotoarivelo.2003. “Integrated Personal Mobility Architecture: A Complete Personal Mobility Solution”.Kluwer Academic Publishers.
[17] Podhradsky, P. 2004.” Migration scenarios and convergence processes towards NGN (present state and future trends)”. Electronics in Marine Proceedings Elmar. 46th International Symposium, :39-46.
[18] J. Curtis and T. McGregor, "Review of bandwidth estimation techniques, " in Proc. New Zealand Computer Science Research Students' Conf., vol. 8, New Zealand, Apr. 2001.
[19] C. Barakat, P. Thiran, G. Iannaccone, C. Diot, and P. Owezarski. “Modeling Internet backbone traffic at the flow Level”. IEEE Transactions on Signal Processing (Special Issue on Networking), August 2003.
[20] T. Bu and D. Towsley. “Fixed point approximation for TCP behavior in an AQM network”. In Proceedings of ACM SIGMETRICS ’01, San Diego, CA, June 2001.
[21] S. Fredj, T. Bonald, A. Proutiere, G. Regnie, and J. Roberts. “Statistical bandwidth sharing: A study of congestion at flow level”. In Proceedings of ACM SIGCOMM ’01, San Diego, CA, August 2001.
[22] Sommers, Joel; Barford, Paul. Self-Configuring Network Traffic Generation, In Proceedings of ACM Internet Measurement Conference, October, 2004.
[23] Guojun Jin & Brian L. Tierney. 2003. ‘System capability effects on algorithms for network bandwidth measurement’. Proceedings of the 3rd ACM SIGCOMM conference on Internet measurement, p.g 27-38.
[24] Jing Cong & Bernd E. Wolfinger. 2006. “A unified load generator based on formal load specification and load transformation”, Proceedings of the 1st international conference on Performance evaluation methodolgies and tools, ACM International Conference Proceeding Series, Pisa, Italy,Vol. 180 (53).
[25] Kawasaki, S., Niwa, et. al. 2006. “A Study on Formulation of the Ubiquitous Cloud Model”, Mobile Data Management, 2006. MDM 2006. 7th International Conference, pg:148 – 148.
[26] A. Tsalgatidou, G. Athanasopoulos & et. al. 2006. Developing scientific workflows from heterogeneous services, ACM SIGMOD, Vol. 35 (2 ), pg: 22 - 28
[27] Qingwen Liu, Shengli Zhou, et. al,. 2006. “Cross-layer modeling of adaptive wireless links for QoS support in heterogeneous wired-wireless networks”, Wireless Networks, Vol. 12 (4), Kluwer Academic Publishers.


![Transmission Distribution and Utilization [15EE52T]](https://static.fdokumen.com/doc/165x107/6328d58109048e4b7c061729/transmission-distribution-and-utilization-15ee52t.jpg)