Predicting urban growth of a developing country city using a statistical modeling approach
11
INTERNATIONAL JOURNAL OF GEOMATICS AND GEOSCIENCES Volume 5, No 4, 2015 © Copyright by the authors - Licensee IPA- Under Creative Commons license 3.0 Research article ISSN 0976 – 4380 Submitted on January 2015 published on May2015 603 Predicting urban growth of a developing country city using a statistical modeling approach Andrew Manu 1 , Yaw A. Twumasi 2 , Kang Shou Lu 3 , Tommy L. Coleman 4 1- Department of Agronomy, Iowa State University, IA 50011, U.S.A. 2- Department of Urban & Regional Planning, Jackson State University, MS 39211, U.S.A. 3- Department of Geography & Environmental Planning, Towson University, MD 21252, U.S.A. 4- Department of Biological & Environmental Sciences, Alabama A&M University, AL 35762, U.S.A. [email protected] ABSTRACT Rapid population growth is pushing African cities to unprecedented sizes. The negative social and environmental consequences of the uncontrolled urban expansion have been documented. The purpose of this project was to develop appropriate databases to study the temporal land use changes in urban expansion and predict future urban growth for the city of Niamey, Niger. Land use transition was obtained from satellite imagery of 1973, 1988, and 2001. Spatial layers of driving forces of urban growth were derived from a digital orthophoto and extensive GPS mapping. A multinomial binary logistic regression was used to derive urban transition probabilities and simulated maps of future urban growth were subsequently generated. This study suggests that urbanized areas of the city will increase by 65.64 km 2 between 1988 and 2010 and the population will increase from 397,437 to 2,063,894. The implications will include overcrowding, destruction of scarce farmlands and deforestation of the surrounding plateaus. Deforestation of the fragile uplands results in the generation of uncontrolled runoff that provokes serious erosion. Sediment carried in the runoff creates unproductive alluvial fans at the footslopes of the plateau. Keywords: Urban growth, remote sensing, urban growth model, land use 1. Introduction Africa is experiencing tremendous urban growth with an annual urbanization rate estimated at 5% (Denis and Moriconi-Ebrard, 2009). Nairobi, Dar es Salaam, Lagos and Kinshasa grew sevenfold from 1950-1980 (Olivera et al., 2003). The rapid population growth and subsequent expansion of African cities are the result of high birth rates and rural–to–urban migration, the latter of which accounts for between 40 to 60% of the annual urban population growth. The rural–to–urban migration is often fueled by prospects of jobs, higher incomes and a higher standard of living. This is the result of many African cities remaining administrative centers and simultaneously serving as national and regional engines of economic growth. On the other hand, people are pushed out of rural areas by poverty, lack of opportunities, declining agriculturally related work, war and famine (Lipton, 1977). The rapid growth rates of many cities in Africa are pushing cities to unprecedented sizes. The development of these mega cities has associated social and environmental implications. Local, regional and national legislature has been enacted to assist with improving urban planning and environmental management in many African cities. Sustained investments in urban
Transcript of Predicting urban growth of a developing country city using a statistical modeling approach

INTERNATIONAL JOURNAL OF GEOMATICS AND GEOSCIENCES
Volume 5, No 4, 2015
© Copyright by the authors - Licensee IPA- Under Creative Commons license 3.0
Research article ISSN 0976 – 4380
Submitted on January 2015 published on May2015 603
Predicting urban growth of a developing country city using a statistical
modeling approach Andrew Manu1, Yaw A. Twumasi2, Kang Shou Lu3, Tommy L. Coleman4
1- Department of Agronomy, Iowa State University, IA 50011, U.S.A.
2- Department of Urban & Regional Planning, Jackson State University,
MS 39211, U.S.A.
3- Department of Geography & Environmental Planning, Towson University,
MD 21252, U.S.A.
4- Department of Biological & Environmental Sciences, Alabama A&M University,
AL 35762, U.S.A.
ABSTRACT
Rapid population growth is pushing African cities to unprecedented sizes. The negative social
and environmental consequences of the uncontrolled urban expansion have been documented.
The purpose of this project was to develop appropriate databases to study the temporal land
use changes in urban expansion and predict future urban growth for the city of Niamey, Niger.
Land use transition was obtained from satellite imagery of 1973, 1988, and 2001. Spatial
layers of driving forces of urban growth were derived from a digital orthophoto and extensive
GPS mapping. A multinomial binary logistic regression was used to derive urban transition
probabilities and simulated maps of future urban growth were subsequently generated. This
study suggests that urbanized areas of the city will increase by 65.64 km2 between 1988 and
2010 and the population will increase from 397,437 to 2,063,894. The implications will
include overcrowding, destruction of scarce farmlands and deforestation of the surrounding
plateaus. Deforestation of the fragile uplands results in the generation of uncontrolled runoff
that provokes serious erosion. Sediment carried in the runoff creates unproductive alluvial
fans at the footslopes of the plateau.
Keywords: Urban growth, remote sensing, urban growth model, land use
1. Introduction
Africa is experiencing tremendous urban growth with an annual urbanization rate estimated at
5% (Denis and Moriconi-Ebrard, 2009). Nairobi, Dar es Salaam, Lagos and Kinshasa grew
sevenfold from 1950-1980 (Olivera et al., 2003). The rapid population growth and
subsequent expansion of African cities are the result of high birth rates and rural–to–urban
migration, the latter of which accounts for between 40 to 60% of the annual urban population
growth. The rural–to–urban migration is often fueled by prospects of jobs, higher incomes
and a higher standard of living. This is the result of many African cities remaining
administrative centers and simultaneously serving as national and regional engines of
economic growth. On the other hand, people are pushed out of rural areas by poverty, lack of
opportunities, declining agriculturally related work, war and famine (Lipton, 1977). The rapid
growth rates of many cities in Africa are pushing cities to unprecedented sizes. The
development of these mega cities has associated social and environmental implications. Local,
regional and national legislature has been enacted to assist with improving urban planning
and environmental management in many African cities. Sustained investments in urban

Predicting urban growth of a developing country city using a statistical modeling approach
Andrew Manu et al.,
International Journal of Geomatics and Geosciences
Volume 5 Issue 4, 2015 604
upgrading and development of infrastructure have become priorities for most of these
countries. Prior to the inaction of these legislatures and action plans, however, planners and
policy makers should be knowledgeable about historical and chronological trends in urban
expansion, identify and map spatial distribution of driving forces of urbanization such as
socioeconomic amenities and infrastructure networks, and use appropriate simulation models
to compare potential future scenarios to make informed decisions. (Klostermann, 1999).
There has been a long research tradition in urban geography and urban modeling (Batty,
1989; Batty and Xie, 1994; Knox, 1994; Verburget al. 1999; Wang and Zhang, 2001; Manu
et al. 2004). Research on urban growth and land use change may have one of two objectives:
(1) to develop an understanding of urban dynamics, both spatial and temporal (Allen, 1997);
or (2) to provide better decision support for urban planning (Brail and Klosterman, 2001). A
model that can make appropriate projections about future urban growth and expansion will
serve both educational and scientific purposes. The model will help scientists understand how
growth occurs. The model can also serve as an educational tool for the general public,
politicians and city planners who can take advantage of the visualization of different growth
scenarios (Wu 1988; Strange et al., 1999).
Several urban growth models have been tested in several areas of the developed world and
models have been evaluated and compared on the basis of their data demands. In general the
data inputs are spatial, temporal and thematic (Herold et al., 2003). The application of urban
growth models is in its infancy in Africa. One of the significant bottlenecks in addressing
urbanization issues in the continent using these models is the dearth of information. This
could be the result of unavailability of appropriate databases, unreliability of existing
information, and the lack of economic resources for research and data collection (Stren,
1994).
Multivariate logistic regression models are used to represent the non-linear nature of urban
growth problems (Landis and Zhang, 1997; Hua and Lo, 2007;Al-sharif and Pradhan, 2014).
This is a special case of the multinomial logit model developed by MacFadden (1973) and it
is conceptually based on the random utility theory and discrete choice theory in urban
economics and behavior science. Whether the utility of land is measured in terms of
consumer benefit, bid-rent, land price, or developer’s profit, it is a function of attributes of
land use choices and characteristics of land decision-makers. The utility function can be
defined as a linear combination of attributes of land use choices as per Landis and Zhang
(1997):
[1]
with constant α, coefficients β j ( j = 1, 2, · · · , k), and predictors X j for k predictor variables
( j = 1, 2, · · · , k).
Once the landowners or developers make their land use decisions independently with the
objective to maximize the utility of their lands, the probability of land transition can be
calculated using the following equation
[2]
where P i is the estimated probability that the ith land cell unit ( i = 1,· · · , n) is urban and u is
the utility function usually defined as a linear regression equation.
This linear regression equation creates the logit or log of the odds:
Predicting urban growth of a developing country city using a statistical modeling approach
Andrew Manu et al.,
International Journal of Geomatics and Geosciences
Volume 5 Issue 4, 2015 605
[3]
Thus, the linear regression equation is the natural log of the probability of being urban
divided by the probability of being non-urban. The procedure employed for estimating
coefficients was maximum likelihood, with a goal to find the best linear combination of
predictors to maximize the likelihood of obtaining the observed outcome of land use
frequencies. Compared with the multinomial logit model, this binary logistic model is
extremely flexible and easily applicable (Hosmer and Lemeshow 1989).
The goal of this paper is to evaluate the operational implementation of a representative
statistical urban growth model in investigating the long-term growth of a developing country
city. The objectives are to; (1) develop spatial and aspatial database for the city; (2)
parameterize and calibrate a composite urban growth model developed by Allen and Lu
(2003); and (3) to forecast the growth of the city through to the year 2030.
2. Materials and Method
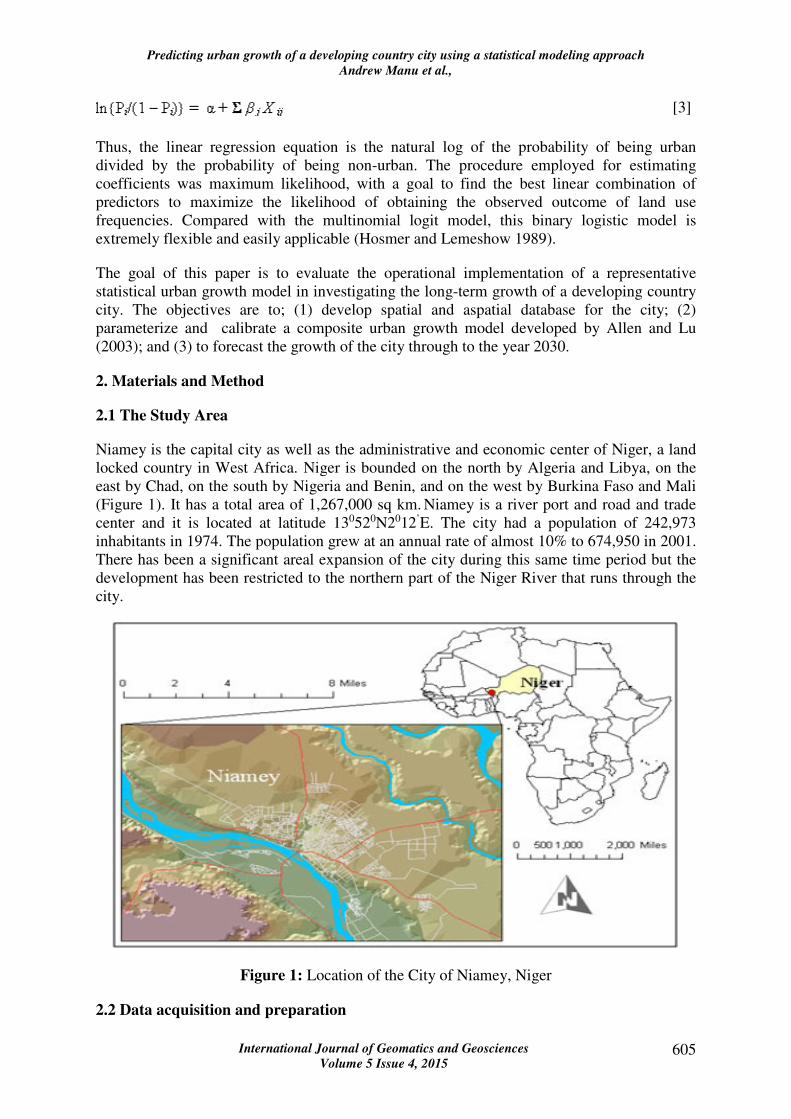
2.1 The Study Area
Niamey is the capital city as well as the administrative and economic center of Niger, a land
locked country in West Africa. Niger is bounded on the north by Algeria and Libya, on the
east by Chad, on the south by Nigeria and Benin, and on the west by Burkina Faso and Mali
(Figure 1). It has a total area of 1,267,000 sq km. Niamey is a river port and road and trade
center and it is located at latitude 130520N2012’E. The city had a population of 242,973
inhabitants in 1974. The population grew at an annual rate of almost 10% to 674,950 in 2001.
There has been a significant areal expansion of the city during this same time period but the
development has been restricted to the northern part of the Niger River that runs through the
city.
Figure 1: Location of the City of Niamey, Niger
2.2 Data acquisition and preparation

Predicting urban growth of a developing country city using a statistical modeling approach
Andrew Manu et al.,
International Journal of Geomatics and Geosciences
Volume 5 Issue 4, 2015 606
Urban Growth Evaluation of the growth and land use transition of the city was carried out
from satellite imagery. Landsat Multispectral Scanner (MSS), Thematic Mapper TM) and
Enhanced Thematic Mapper (ETM+) images were acquired for 1973, 1986, and 2001,
respectively. The images were geometrically corrected and ground control points obtained
through intensive ground surveys permitted the co-registration of all images to a Universal
Transverse Mercator (UTM). A supervised classification was performed on false color
composites (bands 2, 3, and 4) into different land use classes. Information collected during
field surveys was combined with the digital orthophoto base which was developed for the city
to assess the accuracy of the classification. A binary land use classification system (Anderson
et al., 1976) was used in which “urban” was categorized as areas built up by humans,
including residential, industrial, transportation industrial complexes and mixed urban. Other
land uses, including protected areas, were put into the non-urban category. This included
areas occupied by the Niger River, the green belt, rice paddies along the river, areas within
the airport, gully systems, (a 600 m buffer was put around all gullies), areas in and around the
airport and high elevation plateau surfaces.
2.3 Selection and preparation of driving forces of urban growth
Driving forces are most often considered exogenous to the land use system to facilitate
modeling. These include socio-economic and biophysical drivers as well as proximate causes.
There are a lack of accurate databases on driving forces of urbanization for socioeconomic
amenities and infrastructure networks for the city of Niamey. It was, therefore, essential to
identify, document and prepare predictor variables that influence the growth and development
of the city. Table 1 gives the list of predictor variables used for the urban modeling. Contour
lines were digitized from a topographic map to create a (Triangular Integrated Network) TIN
coverage in order to generate digital elevation model (DEM) and slope grids.
Table 1: Predictor variables used for urban growth modeling of Niamey, Niger
Variable Years Source
Digital Elevation
Model 1989
1989 topographic map
(1:50,0000)
Road network 1973, 1988, 2001 Satellite imagery, topographic
map, Digital orthophoto
Water bodies 1973, 1988, 2001 Satellite imagery, Digital
orthophoto
Green belt 1973, 1988, 2001 Satellite imagery, topographic
map, Digital orthophoto
Gullies 1973, 1988, 2001 Satellite imagery, topographic
map, Digital orthophoto
Open markets 1973, 1999, 2000 Field surveys, Digital orthophoto
Water towers 1973, 1999, 2000 Field surveys, Digital orthophoto
A geometrically corrected digital orthophoto base of Niamey was developed from black and
white aerial photos and the DEM of the city and its surroundings. The orthophoto was used to
derive the road network, water bodies, the green belt, gullies, and plateau surfaces. Point
locations of marketplaces, water towers and water bodies and wells were obtained using
Trimble handheld global positioning systems. These points were converted into shape files
Predicting urban growth of a developing country city using a statistical modeling approach
Andrew Manu et al.,
International Journal of Geomatics and Geosciences
Volume 5 Issue 4, 2015 607
from which proximity and cost distance variable grids were derived to measure the effects of
infrastructure, facilities, and services on urban expansions.
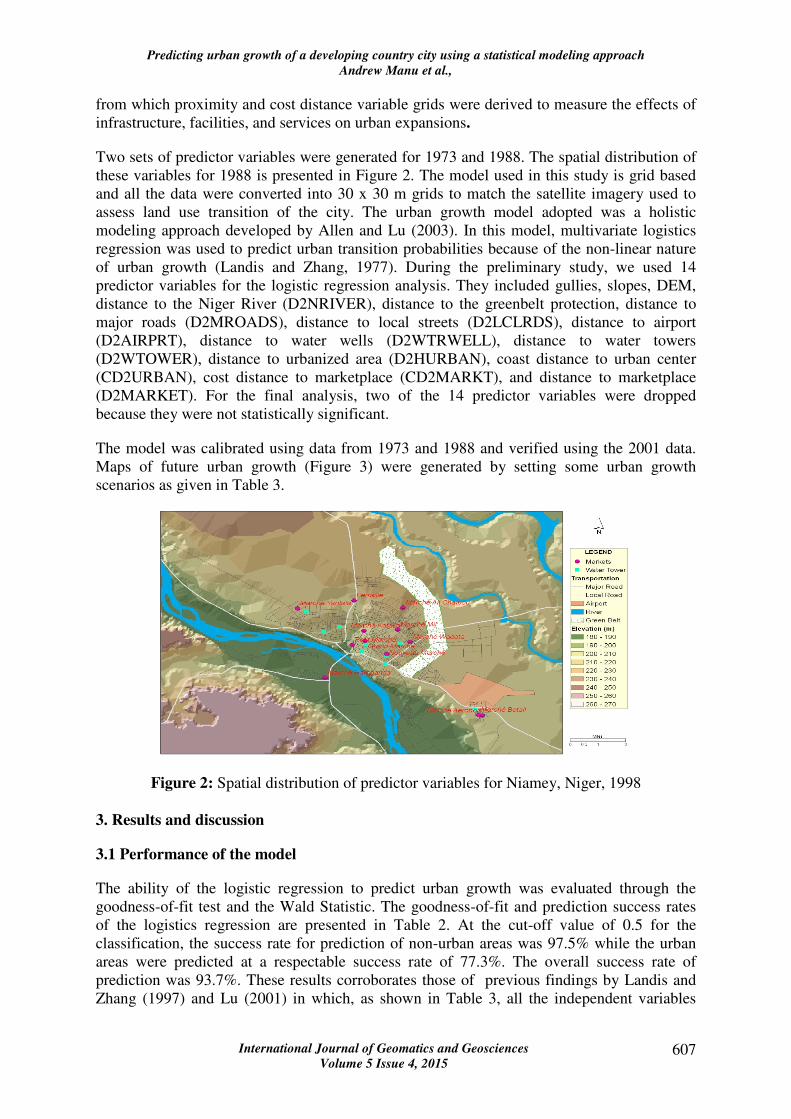
Two sets of predictor variables were generated for 1973 and 1988. The spatial distribution of
these variables for 1988 is presented in Figure 2. The model used in this study is grid based
and all the data were converted into 30 x 30 m grids to match the satellite imagery used to
assess land use transition of the city. The urban growth model adopted was a holistic
modeling approach developed by Allen and Lu (2003). In this model, multivariate logistics
regression was used to predict urban transition probabilities because of the non-linear nature
of urban growth (Landis and Zhang, 1977). During the preliminary study, we used 14
predictor variables for the logistic regression analysis. They included gullies, slopes, DEM,
distance to the Niger River (D2NRIVER), distance to the greenbelt protection, distance to
major roads (D2MROADS), distance to local streets (D2LCLRDS), distance to airport
(D2AIRPRT), distance to water wells (D2WTRWELL), distance to water towers
(D2WTOWER), distance to urbanized area (D2HURBAN), coast distance to urban center
(CD2URBAN), cost distance to marketplace (CD2MARKT), and distance to marketplace
(D2MARKET). For the final analysis, two of the 14 predictor variables were dropped
because they were not statistically significant.
The model was calibrated using data from 1973 and 1988 and verified using the 2001 data.
Maps of future urban growth (Figure 3) were generated by setting some urban growth
scenarios as given in Table 3.
Figure 2: Spatial distribution of predictor variables for Niamey, Niger, 1998
3. Results and discussion
3.1 Performance of the model
The ability of the logistic regression to predict urban growth was evaluated through the
goodness-of-fit test and the Wald Statistic. The goodness-of-fit and prediction success rates
of the logistics regression are presented in Table 2. At the cut-off value of 0.5 for the
classification, the success rate for prediction of non-urban areas was 97.5% while the urban
areas were predicted at a respectable success rate of 77.3%. The overall success rate of
prediction was 93.7%. These results corroborates those of previous findings by Landis and
Zhang (1997) and Lu (2001) in which, as shown in Table 3, all the independent variables
Predicting urban growth of a developing country city using a statistical modeling approach
Andrew Manu et al.,
International Journal of Geomatics and Geosciences
Volume 5 Issue 4, 2015 608
were found to be significant predictors of urban land use and growth at the probability of α =
0.05.
Table 2: Performance of Logistic Regression
Statistic Value
-2 log Likelihood 30873.3
Cox and Snell R2 0.48
Nagelkerke R2 0.77
Prediction Success Rate (%)
Urban 77.3
Non-urban 97.5
Overall 93.7
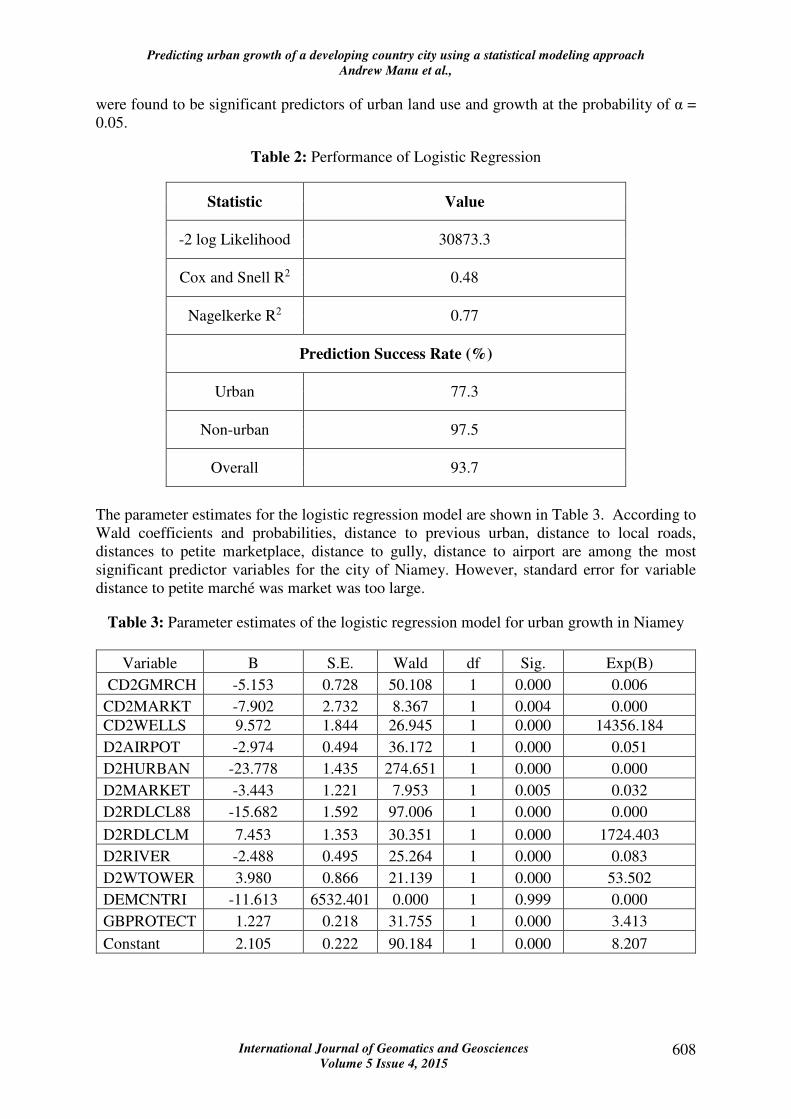
The parameter estimates for the logistic regression model are shown in Table 3. According to
Wald coefficients and probabilities, distance to previous urban, distance to local roads,
distances to petite marketplace, distance to gully, distance to airport are among the most
significant predictor variables for the city of Niamey. However, standard error for variable
distance to petite marché was market was too large.
Table 3: Parameter estimates of the logistic regression model for urban growth in Niamey
Variable B S.E. Wald df Sig. Exp(B)
CD2GMRCH -5.153 0.728 50.108 1 0.000 0.006
CD2MARKT -7.902 2.732 8.367 1 0.004 0.000
CD2WELLS 9.572 1.844 26.945 1 0.000 14356.184
D2AIRPOT -2.974 0.494 36.172 1 0.000 0.051
D2HURBAN -23.778 1.435 274.651 1 0.000 0.000
D2MARKET -3.443 1.221 7.953 1 0.005 0.032
D2RDLCL88 -15.682 1.592 97.006 1 0.000 0.000
D2RDLCLM 7.453 1.353 30.351 1 0.000 1724.403
D2RIVER -2.488 0.495 25.264 1 0.000 0.083
D2WTOWER 3.980 0.866 21.139 1 0.000 53.502
DEMCNTRI -11.613 6532.401 0.000 1 0.999 0.000
GBPROTECT 1.227 0.218 31.755 1 0.000 3.413
Constant 2.105 0.222 90.184 1 0.000 8.207
Predicting urban growth of a developing country city using a statistical modeling approach
Andrew Manu et al.,
International Journal of Geomatics and Geosciences
Volume 5 Issue 4, 2015 609
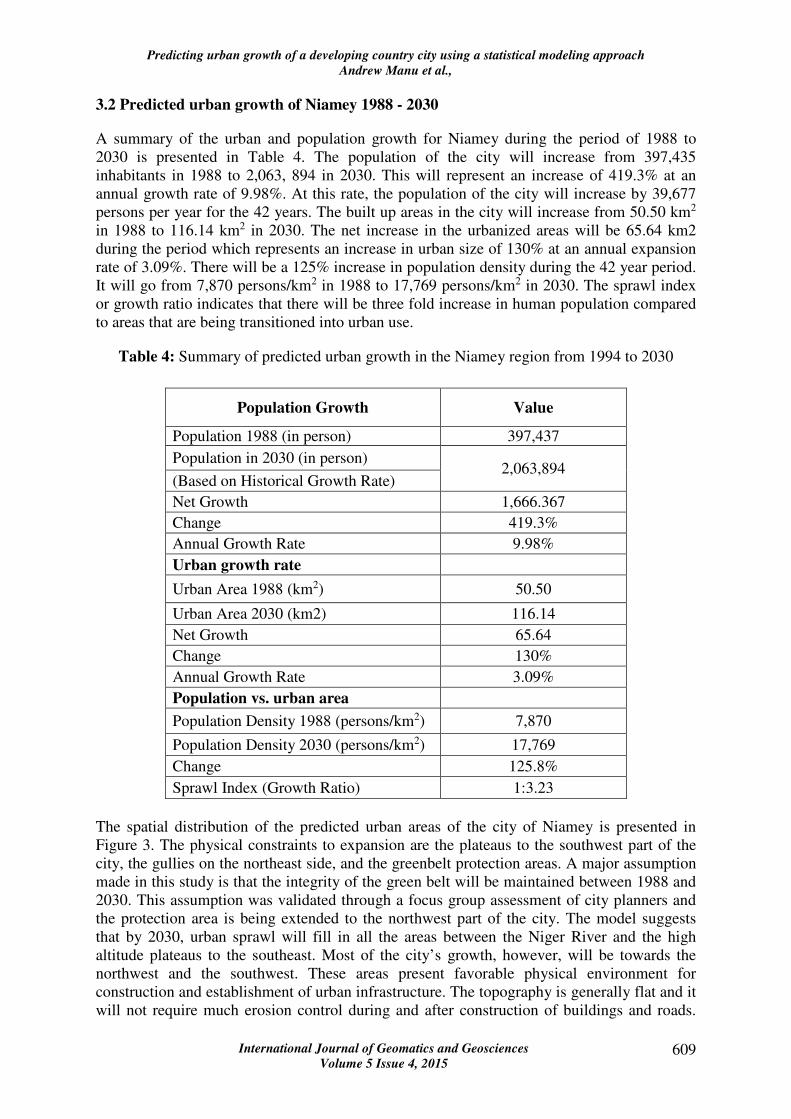
3.2 Predicted urban growth of Niamey 1988 - 2030
A summary of the urban and population growth for Niamey during the period of 1988 to
2030 is presented in Table 4. The population of the city will increase from 397,435
inhabitants in 1988 to 2,063, 894 in 2030. This will represent an increase of 419.3% at an
annual growth rate of 9.98%. At this rate, the population of the city will increase by 39,677
persons per year for the 42 years. The built up areas in the city will increase from 50.50 km2
in 1988 to 116.14 km2 in 2030. The net increase in the urbanized areas will be 65.64 km2
during the period which represents an increase in urban size of 130% at an annual expansion
rate of 3.09%. There will be a 125% increase in population density during the 42 year period.
It will go from 7,870 persons/km2 in 1988 to 17,769 persons/km2 in 2030. The sprawl index
or growth ratio indicates that there will be three fold increase in human population compared
to areas that are being transitioned into urban use.
Table 4: Summary of predicted urban growth in the Niamey region from 1994 to 2030
Population Growth Value
Population 1988 (in person) 397,437
Population in 2030 (in person) 2,063,894
(Based on Historical Growth Rate)
Net Growth 1,666.367
Change 419.3%
Annual Growth Rate 9.98%
Urban growth rate
Urban Area 1988 (km2) 50.50
Urban Area 2030 (km2) 116.14
Net Growth 65.64
Change 130%
Annual Growth Rate 3.09%
Population vs. urban area
Population Density 1988 (persons/km2) 7,870
Population Density 2030 (persons/km2) 17,769
Change 125.8%
Sprawl Index (Growth Ratio) 1:3.23
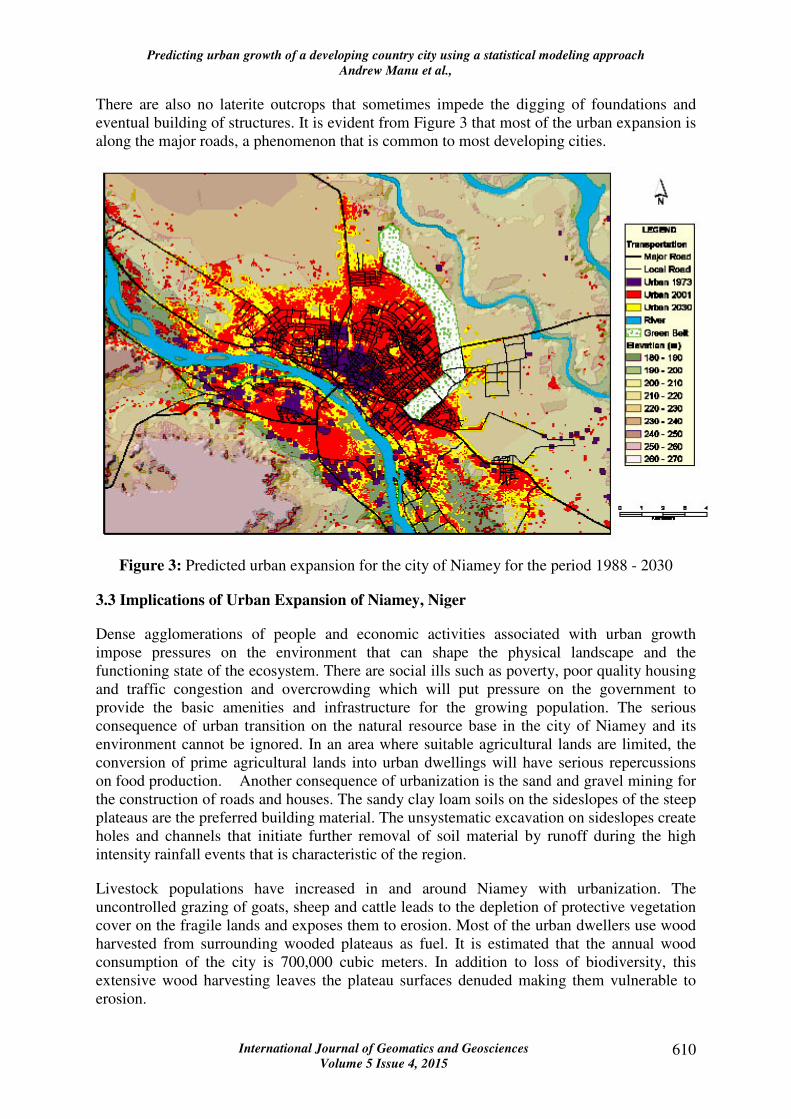
The spatial distribution of the predicted urban areas of the city of Niamey is presented in
Figure 3. The physical constraints to expansion are the plateaus to the southwest part of the
city, the gullies on the northeast side, and the greenbelt protection areas. A major assumption
made in this study is that the integrity of the green belt will be maintained between 1988 and
2030. This assumption was validated through a focus group assessment of city planners and
the protection area is being extended to the northwest part of the city. The model suggests
that by 2030, urban sprawl will fill in all the areas between the Niger River and the high
altitude plateaus to the southeast. Most of the city’s growth, however, will be towards the
northwest and the southwest. These areas present favorable physical environment for
construction and establishment of urban infrastructure. The topography is generally flat and it
will not require much erosion control during and after construction of buildings and roads.
Predicting urban growth of a developing country city using a statistical modeling approach
Andrew Manu et al.,
International Journal of Geomatics and Geosciences
Volume 5 Issue 4, 2015 610
There are also no laterite outcrops that sometimes impede the digging of foundations and
eventual building of structures. It is evident from Figure 3 that most of the urban expansion is
along the major roads, a phenomenon that is common to most developing cities.
Figure 3: Predicted urban expansion for the city of Niamey for the period 1988 - 2030
3.3 Implications of Urban Expansion of Niamey, Niger
Dense agglomerations of people and economic activities associated with urban growth
impose pressures on the environment that can shape the physical landscape and the
functioning state of the ecosystem. There are social ills such as poverty, poor quality housing
and traffic congestion and overcrowding which will put pressure on the government to
provide the basic amenities and infrastructure for the growing population. The serious
consequence of urban transition on the natural resource base in the city of Niamey and its
environment cannot be ignored. In an area where suitable agricultural lands are limited, the
conversion of prime agricultural lands into urban dwellings will have serious repercussions
on food production. Another consequence of urbanization is the sand and gravel mining for
the construction of roads and houses. The sandy clay loam soils on the sideslopes of the steep
plateaus are the preferred building material. The unsystematic excavation on sideslopes create
holes and channels that initiate further removal of soil material by runoff during the high
intensity rainfall events that is characteristic of the region.
Livestock populations have increased in and around Niamey with urbanization. The
uncontrolled grazing of goats, sheep and cattle leads to the depletion of protective vegetation
cover on the fragile lands and exposes them to erosion. Most of the urban dwellers use wood
harvested from surrounding wooded plateaus as fuel. It is estimated that the annual wood
consumption of the city is 700,000 cubic meters. In addition to loss of biodiversity, this
extensive wood harvesting leaves the plateau surfaces denuded making them vulnerable to
erosion.
Predicting urban growth of a developing country city using a statistical modeling approach
Andrew Manu et al.,
International Journal of Geomatics and Geosciences
Volume 5 Issue 4, 2015 611
Sediment eroded from the steep plateaus also causes environmental problems. Materials
carried in waters are eventually deposited on the adjacent flat valley floors between the Niger
River and the plateaus. These form several acres of sandy alluvial fans that consummate
productive farmlands. Large amounts of sediments carried in runoff water also empty into the
Niger River. This is leading to serious sediment loading problems of the river that is
receiving national and international attention.
4. Conclusions
Rapid population growth is pushing African cities to unprecedented sizes. The negative social
and environmental consequences of the uncontrolled urban expansion have been documented.
Efforts are being made at the local, regional and national levels to improve urban planning
and promote sound and sustainable urban environments. For these legislatures to be
successful, city planners and policy makers should be cognizant of historical trends of land
use and they should also have prior understanding of the driving forces of urbanization.
Appropriate urban growth simulation models will also be necessary to compare present land
use to future scenarios. Urban growth models have been tested for several developed country
cities in terms of data demands. In general, data inputs are spatial, temporal and thematic.
Modeling of urban expansion for African cities has often been constrained by the dearth of
such inputs. The purpose of this paper was to develop appropriate databases to study the
temporal land use changes, evaluate spatial dependence the relationships among driving
factors that influence urban expansion, and predict future urban growth for the city of
Niamey, Niger.
Data for land use transition of the city was obtained from satellite imagery of 1973, 1988, and
2001. Some spatial layers of driving forces of urban growth were derived from a previously
produced digital orthophoto. Others were obtained from extensive GPS mapping. A
multinomial binary logistic regression was used to derive urban transition probabilities using
the predictor variables. Simulated maps of future urban growth were subsequently generated.
This study suggests that urbanized areas of the city will increase by 65.64 km2 between 1988
and 2030 and the population will also increase from 397,437 in 1988 to 2,063,894 in 2030.
We obtained a 97.5% success rate for the prediction of non-urban areas was predicted at a
respectable success rate of 77.3%. The overall success rate of prediction was 93.7%.
Simulation of the areal expansion of the city suggests that most of the cities expansion will be
mostly towards the northwest and southeast where physical conditions are favorable for
infrastructure development.
Implications of the expansion of the city could be varied. They include the use of the scarce
favorable farm lands, de-vegetation and loss of biodiversity from the surrounding plateaus.
Deforestation of the fragile uplands in turn results in the generation uncontrolled runoff that
provokes serious erosion. Sediment carried in the runoff creates unproductive alluvial fans at
the footslopes and on the level arable lands. Eroded sediments are eventually silting the Niger
River which is leading to serious sediment loading problems of the river that is receiving
national and international attention.
Acknowledgment
This paper was supported in part by Department of Agronomy, Iowa State University, and
Alabama A&M University Center for Hydrology, Soil Climatology, and Remote Sensing
(HSCaRS) through the National Aeronautics and Space Administration (NASA) Grant No.
Predicting urban growth of a developing country city using a statistical modeling approach
Andrew Manu et al.,
International Journal of Geomatics and Geosciences
Volume 5 Issue 4, 2015 612
NAG5-10721. The authors greatly acknowledge the support Ms. Kristen Klaphake of the GIS
Lab of the Agronomy Department of Iowa State University. Any use of trade, product, or
firm names is for descriptive purpose only and does not imply endorsement by the U.S.
Government.
5. References
1. Al-sharif, A.A.A., and Pradhan, B.,(2014), Urban sprawl analysis of Tripoli
Metropolitan City (Libya) using remote sensing data and multivariate logistic
regression model, Journal of the Indian Society of Remote Sensing, 42(1), pp 149-163.
2. Allen, P., (1997), Cities and Regions as Self-organizing Systems. London, UK:
Gordon and Breach Science Publication.
3. Allen, J., and Lu, K, (2003), Modeling and prediction of future urban growth in the
Charleston region of South Carolina: a GIS based integrated approach, Conservation
Ecology, 8(2), 2. [online] URL: http://www.consecol.org/vol8/iss2/art2
4. Batty, M., (1989), Urban modeling and planning: reflections, retrodictions and
prescriptions. In: B. Macmillan, Editor, Remodeling geography, Basil Blackwell,
Oxford, UK, pp 147-169, Abstract-Geobase.
5. Batty, M., and Xie, Y, (1994), From cells to cities. Environment and Planning B, 21,
pp 531-548.
6. Brail, R., and Klosterman, R, (2001), Planning Support Systems. Redlands, CA: ESRI
Press.
7. Denis, E., and Moriconi-Ebrard, F., (2009), Africa polis : Urbanization Trends 1950-
2020 : a Geo-statistical Approach, West Africa. Paris: Agency française de
development. EBook: Document: English. [Online] URL:
http://www.afd.fr/webdav/shared/PUBLICATIONS/THEMATIQUES/autres-
publications/BT/0808ProjetFicheResumeeAfricapolisV4-en.pdf
8. Herold M., Goldstein, N.C. and Clarke, K.C, (2003), Remote Sensing of Environment,
86(3), pp 286-302.
9. Hosmer, J. D. W., and Lemeshow, S, (1989), Applied logistic regression. New York:
Wiley.
10. Hua, Z., and Lo, C.P., (2007), Modeling urban growth in Atlanta using logistic
regression. Computers, Environment and Urban Systems, 31(6), pp 667–688.
11. Klostermann, R.E., (1990), The what if? Collaborative planning support system.
Environment and Planning B, Planning and Design, 26, pp 393–408.
12. Knox, P.L., (1994), Urbanization: Introduction to urban geography. New Jersey:
Prentice-Hall.
Predicting urban growth of a developing country city using a statistical modeling approach
Andrew Manu et al.,
International Journal of Geomatics and Geosciences
Volume 5 Issue 4, 2015 613
13. Landis, J. D., and Zhang, M., (1997), Modeling urban land use change: the next
generation of the California urban future model. Paper submitted to the Land Use
Modeling Workshop, USGS.
14. Lipton, M., (1977), Why Poor People Stay Poor: Urban Bias in World Development.
Cambridge: Harvard University Press.
15. Manu, A., Twumasi, Y.A., Coleman, T.L., Lu, K.S., and Maiga, I.A., (2004),
Modeling urban growth of a developing country city using remote sensing and GIS. In
Proceedings of the 5th African Association of Remote Sensing of the Environment
(AARSE) International Conference: Geoinformation sciences in support of Africa's
development (on CD ROM). 18-21 October. United Nations Environment Programme
(UNEP) Headquarters, Gigiri, Nairobi, Kenya.
16. McFadden, D., (1973), Conditional logit analysis of quantitative choice behavior. In P.
Zarembka, editor. Frontiers in econometrics. New York: Academic Press.
17. Olivera, L.D., Plat, D., and Pochet, P., (2003), Transportation conditions and access to
services in a context of urban sprawl and deregulation:the case of Dar es Salaam.
Transportation Policy, 10, pp 287-298.
18. Strange, E. M., Fraussch K. D. and Covich A.D., (1999), Sustaining ecosystem
services in human-dominated watersheds: Biohydrology and ecosystem processes in
South Platte River Basin, Environmental Management 24, pp 39-54.
19. Stren, R.F. ed., (1994), Urban Research in the Developing World, 2, Africa, Toronto:
University of Toronto Press.
20. Verburg, P.H., A. Veldkamp, and Fresco, I.O, (1999), Simulation of changesin the
spatial pattern of land use in China, Applied Geography, 19, pp 211-233.
21. Vitousek, P., (1994), Beyond global warming: ecology and global change, Ecology,
75(7), pp 1861-1876.
22. Wang, Yy and Zhang, X., (2001)., A dynamic modeling approach to simulating
socioeconomic effects on landscape changes. Ecological Modelling, 140, pp 141-162.
23. Wu, F., (1988), An empirical model of intra-metropolitan landuse changes in a
Chinese City. Environment and Planning B:Planning and Design, 25, pp 245-263.
24. World Bank, (1977), World Development Report 1977. The State in a Changing
World. New York: Oxford University Press.