
Predicting Earnings Among Immigrants To Canada: The Role Of Source Country: Immigrant Origins and...
26
Predicting Earnings Among Immigrants To Canada: The Role Of Source Country Kelli Phythian*, David Walters** and Paul Anisef*** ABSTRACT The current study examines the importance of country of origin in predict- ing the labour market earnings among recent immigrants to Canada. The authors argue that, in addition to individual-level characteristics associated with immigrant capital, macro-level features associated with immigrant ori- gins must be taken into account when considering the economic perfor- mance of immigrants in their host country. Country-level factors are said to accompany immigrants to their destination country, which generate dis- parities in the ‘‘quality’’ of immigrants’ human and social capital across origin groups, as well as differences in how they are received by the resi- dent population. The present study uses random effects multilevel model- ling to investigate the extent to which immigrant incomes vary randomly across source country while taking into consideration individual-level characteristics selected on the basis of human capital, social capital, and discrimination theories. Multilevel regression analysis confirms that immi- grant incomes indeed vary significantly by country of origin, though the effect is small. Furthermore, it is revealed that the gross domestic product (GDP) of the sending country explains much of the level 2 variability in the labour market earnings of recent immigrants, as well as the relation- ship between racial minority status and immigrant incomes. The practical significance and policy implications of these findings are discussed. INTRODUCTION In recent decades, scholars and policymakers across Canada, the United States, and Australia have been paying considerable attention to the new immigration * Department of Sociology, University of Western Ontario, London, Ontario, Canada. ** Department of Sociology, University of Guelph, Guelph, Ontario, Canada. *** Department of Sociology, York University, Toronto, Ontario, Canada. Ó 2010 The Authors Published by Blackwell Publishing Ltd., International Migration Ó 2010 IOM 9600 Garsington Road, Oxford OX4 2DQ, UK, International Migration Vol. 49 (6) 2011 and 350 Main Street, Malden, MA 02148, USA. ISSN 0020-7985 doi:10.1111/j.1468-2435.2010.00626.x MIGRATION Edited by Elzbieta Gozdziak, Georgetown University
Transcript of Predicting Earnings Among Immigrants To Canada: The Role Of Source Country: Immigrant Origins and...
Predicting Earnings AmongImmigrants To Canada: The Role
Of Source Country
Kelli Phythian*, David Walters** and Paul Anisef***
ABSTRACT
The current study examines the importance of country of origin in predict-ing the labour market earnings among recent immigrants to Canada. Theauthors argue that, in addition to individual-level characteristics associatedwith immigrant capital, macro-level features associated with immigrant ori-gins must be taken into account when considering the economic perfor-mance of immigrants in their host country. Country-level factors are saidto accompany immigrants to their destination country, which generate dis-parities in the ‘‘quality’’ of immigrants’ human and social capital acrossorigin groups, as well as differences in how they are received by the resi-dent population. The present study uses random effects multilevel model-ling to investigate the extent to which immigrant incomes vary randomlyacross source country while taking into consideration individual-levelcharacteristics selected on the basis of human capital, social capital, anddiscrimination theories. Multilevel regression analysis confirms that immi-grant incomes indeed vary significantly by country of origin, though theeffect is small. Furthermore, it is revealed that the gross domestic product(GDP) of the sending country explains much of the level 2 variability inthe labour market earnings of recent immigrants, as well as the relation-ship between racial minority status and immigrant incomes. The practicalsignificance and policy implications of these findings are discussed.
INTRODUCTION
In recent decades, scholars and policymakers across Canada, the United States,and Australia have been paying considerable attention to the new immigration
* Department of Sociology, University of Western Ontario, London, Ontario, Canada.
** Department of Sociology, University of Guelph, Guelph, Ontario, Canada.
*** Department of Sociology, York University, Toronto, Ontario, Canada.
� 2010 The AuthorsPublished by Blackwell Publishing Ltd., International Migration � 2010 IOM9600 Garsington Road, Oxford OX4 2DQ, UK, International Migration Vol. 49 (6) 2011and 350 Main Street, Malden, MA 02148, USA. ISSN 0020-7985
doi:10.1111/j.1468-2435.2010.00626.x
MIGRATIONEdited by Elzbieta Gozdziak, Georgetown University

and its effect on host societies, their ability to incorporate newcomers, and howimmigrants are received by the native-born population. In Canada, the shift tonon-traditional source countries following the removal of explicit discriminationfrom national immigration policies in the 1960s had the effect of radically alter-ing the racial, cultural, and language composition of later immigrant cohorts.This trend is also evident in the United States and Australia, and has raisedquestions about the ability of newcomers to integrate both socially and econom-ically. Research has revealed that the new immigrants have not experienced thesame reception as previous cohorts; indeed, newcomers arriving to the threemajor immigrant-receiving countries in recent decades have experienced unprec-edented obstacles to success, including a lack of credential recognition, decliningat-entry earnings, and higher rates of unemployment and poverty (Picot andSweetman, 2005; Baker and Benjamin, 1994; Abbott and Beach, 1993).Probably the most widely discussed concern on the subject of recent immigra-
tion to Canada is the deteriorating labour market performance of new arrivals.Census data show that the at-entry earnings of immigrants arriving in the late1990s were 47 per cent lower than those for immigrants who arrived in the late1960s (Aydemir and Skuterud, 2005). The decline in immigrant earnings com-menced at the time when the annual influx of immigrants from non-traditionalsource countries began to rise. Major changes to Canadian immigration policyin the 1960s brought with it a persistent rise in the number of non-white, non-European immigrants, such that the proportion of racial minorities in Canadahas increased threefold since 1981 (Statistics Canada, 2003). Moreover, non-whites earn significantly less, on average, than their white counterparts and theyare substantially more likely to live in poverty (Lian and Matthews, 1991; Satze-wich and Li, 1987). It is little wonder, then, that the rise in the number of immi-grants of non-European origins has corresponded to a drop in overallimmigrant earnings. Poor English or French language skills, failure to recognizecredentials attained in non-traditional source countries, lower returns to foreignwork experience, and region of origin and associated ethnic and racial discrimi-nation have all been cited as causes of immigrants’ declining economic well-being. With few exceptions (see, for example, Bratsberg and Ragan, 2002; Reitz,1998; Borjas, 1987), the characteristics of immigrants themselves have been thefocus of immigration research; less attention has been given to the characteris-tics of the sending region as an influential factor in the economic integration ofimmigrants in their host country.This paper focuses specifically on the foreign-born population and employs
hierarchical linear modelling (HLM) to evaluate the effect of source countryon the economic performance of new immigrants to Canada, while takinginto account micro-level characteristics related to theories of human capital,social capital, ethnic attachments, and discrimination. Using data from the2002 Ethnic Diversity Survey (EDS), we assess both the statistical and practi-cal importance of country of origin to immigrant labour market earnings byexamining the variance at the level of source country, as well as the effectsof theoretically informed macro-level variables associated with immigrantorigins.
130 Phythian, Walters and Anisef
� 2010 The Authors. International Migration � 2010 IOM
REVIEW OF LITERATURE
Micro theories of immigrants’ economic performance
There are a number of competing explanations for the poor economic perfor-mance of recent immigrants to Canada and other countries of migration, themost popular of which focuses on the human capital attainment of new arrivals(see, e.g., Chiswick et al., 2005; Coulson and Devoretz, 1994; Borjas, 1991).According to human capital theory, economic outcomes are determined by theskills and credentials one brings to the labour market. Among immigrants,human capital includes but is not limited to language fluency, work experience,and education. At the individual level, then, the economic performance of immi-grants is determined by the skills they have to offer potential employers. Specifi-cally, those who are more highly educated and who have more extensive workexperience, who have a good command of the host language, and who havelocally obtained credentials and experience, will have better labour market out-comes than those lacking in such capital. This perspective thus explains the eco-nomic position of immigrants in terms of the labour market value of theirhuman capital, whereby those with skills that are deemed more essential to theCanadian labour market outperform immigrants with less applicable or poorerquality human capital (Bloom et al., 1995; Green and Green, 1995; Wright andMaxim, 1993).While there is little doubt that education, work experience, and language abil-
ity are fundamental to the employment prospects of newcomers, the human cap-ital model is incomplete. No labour market is wholly meritocratic; rather,workers must negotiate the market worth of their credentials, the success ofwhich often depends on factors beyond their control (Anisef et al., 2003). Atthe micro level, such factors include social capital and discrimination. Socialcapital can be understood as the ability of individuals to command access toscarce resources by virtue of membership to particular social groups (Portes,1995). The relevance of social capital to the study of immigrants’ economic per-formance is clear: immigrants, particularly those from countries with a shorthistory of migration flows to Canada, often lack the social capital needed toattain well-paying employment in the mainstream economy. Furthermore, thepreservation of foreignness, including ethnicity and the cultural practices associ-ated with one’s origins, carries with it economic penalties having to do with lostjob opportunities and reduced earnings. This is John Porter’s (1965) thesis of‘‘ethnically blocked mobility,’’ which states that occupational mobility is hin-dered by both ethnic origins and ethnic affiliations; once ethnic assimilationoccurs, the barriers to occupational success break down.Research findings generally support Porter’s thesis. Kalbach and Kalbach
(2000), for instance, revealed that high levels of ethnic attachment, as measuredby language retention and religious affiliation, inhibited social and economicmobility of post World War II immigrant groups in Canada (see also, Kalbachet al., 2002; Reitz and Sklar, 1997). The current economic situation of recent
Immigrant Origins and Employment Earnings 131
� 2010 The Authors. International Migration � 2010 IOM

immigrants may further serve to reinforce ethnic attachments. Foreign creden-tials often go unrecognized and foreign work experience is heavily devalued inthe Canadian labour market (Ferrer and Riddell, 2004; Friedberg, 2000); assuch, newcomers come together in search of social support and economic sur-vival (Kazemipur, 2004: 18). This may in turn bolster a sense of ethnic identityand attachment to the origin group, thereby sustaining social and economicmarginalization.In addition to human and social capital, discrimination is thought to be a
salient feature of the host society that has profound effects on the economicoutcomes of new immigrants. The change in immigrant source countries hasaltered the racial composition of newcomers, meaning that immigrants todayare more easily identifiable than in the past. More than ever, immigrants are vis-ible targets for racial, cultural, or ethnic discrimination. To be sure, the newerimmigrant cohorts, comprised primarily of persons of non-European back-grounds, experience lower economic achievement than immigrants of Europeanorigins (Beaujot et al., 1988; Hou and Balakrishnan, 1996; Reitz and Breton,1994). Newcomers from African, Asian, and Latin American countries are, onaverage, more highly educated than both foreign- and native-born whites, yetthey have greater difficulties securing employment and comparable wages. Intheir effort to explain poverty among immigrants to Canada, Kazemipur andHalli (2001) revealed that, even after age, education, language skills, and age atmigration were held constant, visible minority status had a strong and signifi-cant impact on the odds of living in poverty. That the earnings disadvantagepersists among racial minorities in Canada despite relatively high levels of edu-cation suggests that race carries with it a ‘‘market value’’ (Li, 2001), wherebyimmigrants and non-immigrants alike are penalized for their non-white status.
Origin effects: a macro account of immigrants’ economic performance
Increasingly, students of immigration have been paying attention to macro-levelfactors that shape the economic situation of immigrants in their host society.One such factor is country of origin. The cultural and economic conditions ofimmigrant-sending countries, such as language, level of economic development,educational quality, and the degree of economic inequality leave an impressionthat accompanies immigrants to their host society (see, e.g., Antecol, 2000,2001; Boyd and Thomas, 2002). Home country characteristics generate dispari-ties in human and social capital across immigrant groups and evoke differencesin the way in which they are received by the resident population. Such dispari-ties are thought to determine to some degree the economic position of immi-grants across origin groups.Differences in the economic performance of immigrants according to region
of origin have received much attention of late. Using census data to examinecompeting explanations for deteriorating immigrant earnings in Canada, Ayd-emir and Skuterud (2005) revealed that fully one-third of the decline can beexplained by compositional shifts in the sending countries of recent immigrants.
132 Phythian, Walters and Anisef
� 2010 The Authors. International Migration � 2010 IOM
In the United States, as much as 90 per cent of the decline in earnings acrosssuccessive immigrant cohorts has been attributed to changes in the national ori-gin mix (Borjas, 1992). Generally, persons of northern, western, and southernEuropean origins report significantly higher earnings than comparable workersof Asian, Middle Eastern, and Latin American origins (Lian and Matthews,1998). Thus, as the annual proportion of immigrants of traditional Europeanorigins has declined, so too has the overall economic position of recent immi-grant cohorts. Yet, despite empirical research that has established a linkbetween immigrant origins and labour market outcomes (Borjas, 1994, 1985;Boyd, 1984; Hou and Balakrishnan, 1996), the reasons for the link are not fullyunderstood.Within the human capital framework described above, the origin effect is
thought to result from the overall skill composition of recent immigrant waves(van Tubergen et al., 2004). Features of its sending countries determine the stockof human capital entering Canada at any given time, whereby the skills ofmigrants from some regions are presumed to be of poorer quality than those ofothers (see, e.g., Sweetman, 2004). Proponents of the human capital explanationsuggest that the quality of human capital is lower among persons from less-devel-oped countries relative to those from more economically advanced nations due todifferences in education quality, training, and skill requirements (Borjas, 1987;Ferrer et al., 2006). Thus, the shift away from European origins toward Asian andAfrican countries following World War II means that immigrants entering Can-ada today are largely from manufacturing and agricultural economies that requireskills not obviously transferable to Canada’s high-tech industrial economy.Accordingly, the human capital stock of today’s immigrants is believed to be oflower quality than their Canadian-born counterparts, and their position in thelabour market suffers as a result.From a social capital perspective, the origin effect can be attributed to the
benefits associated with belonging to certain social groups. Generally speaking,immigrants from countries that are more socially ‘‘distant’’ from the host coun-try tend to do more poorly in the labour market relative to persons fromsocially similar societies (van Tubergen et al., 2004). Social distance can beunderstood as a subjective feeling of affinity towards certain individuals orgroups (Bogardus, 1959). Low social distance implies a sense of common iden-tity, acceptance, and shared experiences, whereas high social distance occurswhen people are perceived as outsiders, bringing about feelings of mistrust anddetachment among the dominant group that persist even after extended contact.As such, the institutionalization of social distance creates and sustains a systemof stratification that determines access to opportunities based on group member-ship. Social distance thus increases or decreases social capital because peoplewho are more alike are more willing to interact with and help one another (Gi-orgas, 2000).According to Portes and Rumbaut (2001) the degree of social distance
between groups coincides with distinctions in race, class, and language. Thedefining feature of contemporary immigration is its diversity: the new immi-grants are from industrialized and developing economies; they are from
Immigrant Origins and Employment Earnings 133
� 2010 The Authors. International Migration � 2010 IOM
wealthy countries and poor countries; they bring with them a range of occu-pational skills, educational credentials, and career goals; and they are raciallyand linguistically diverse. Thus, the national origins mix of contemporaryimmigrants means that the amount of social distance relative to the nativemajority varies widely across immigrant groups. Because of their social simi-larity, migrants from European source countries are presumed to possess moresocial capital than those from non-traditional source countries of Asia andAfrica, and they have comparatively little trouble gaining access to the main-stream as a result.Closely related to social distance theory, discrimination hypotheses blame
the origin effect specifically on the visibly identifiable character of the newimmigration. The removal of explicit racial discrimination from Canadianimmigration policy in 1967 brought about a fundamental shift in the racialand ethnic composition of the immigrant population, a trend that is certainto continue well into the future. Data from the 2001 census indicate that13.4 per cent of Canadians are racial minorities, up from 4.7 per cent in1981 (Statistics Canada 2003). By 2016, it is projected that one in five Cana-dians will be non-white (Chard and Renaud, 1999). Increased visibility meansthat newcomers are easy targets for discrimination. Discriminatory practicesin the host country privilege or diminish the labour market value of immi-grants’ human and social capital; thus, certain immigrant groups are penal-ized for their origin status, which is evidenced in hiring practices,occupational positions, and remuneration. However, problems with observa-tion and measurement make discrimination a difficult concept to measure1
and its effect often cannot be disentangled from interrelated factors, such ascultural characteristics and unobservable human capital.Several studies investigating the association between source country and the
economic position of immigrants in their host society support the view thatorigins indeed matter. Wanner (1998), for instance, reported substantiallylower returns to post-secondary schooling among immigrants from less-devel-oped countries, as measured by gross national product (GNP). Van Tubergenet al. (2004) found that immigrants from countries characterized by higher lev-els of political suppression and greater income inequality relative to the desti-nation country participate less often in the labour market and are more likelyto be unemployed. And Sweetman (2004) revealed that, on average, immi-grants from countries with higher quality education systems, as measured byinternational test scores in math and science, receive better economic returnsto schooling than those from countries that produce lower test scores.Though the significance of source country has been empirically established,
both its practical and substantive importance to the economic position of immi-grants remains to be seen. Much research has documented a statistically signifi-cant association between source country and labour market outcomes (see, forexample, Boyd and Thomas, 2002) yet the relative importance of origins to theeconomic performance of immigrants in their host country is unknown. Stillmore studies indicate a significant interaction between features of the sendingcountry and micro-level variables on measures of economic outcomes (see, for
134 Phythian, Walters and Anisef
� 2010 The Authors. International Migration � 2010 IOM
example, Bratsberg and Ragan, 2002; Wanner, 1998), but once again the magni-tude origin effect in and of itself is left unexamined. Nor is it clear what manyorigin variables are intended to represent theoretically. Wanner’s (1998) study,for instance, revealed that GNP per capita explained a substantial proportion ofthe association between post-secondary education and earnings for immigrantseducated abroad. As the author points out, the GNP effect may be the result ofinferior human capital attained in less economically developed countries. Alter-natively, the effect may be a form of discrimination, given that poorer labourmarket outcomes are more heavily concentrated among non-white immigrantsfrom less-developed countries (1998: 37-38). A third explanation is that GNPmay be a measure of social distance, whereby persons from less-developed coun-tries are more distant from, and hence have less social capital than, personsfrom more highly developed countries.The purpose of the present study is to examine the importance of source
country to the labour market performance of immigrants in Canada. In particu-lar, immigrant earnings are regressed onto measures of human capital, socialcapital and ethnic attachment, and discrimination, while permitting immigrantearnings to vary randomly across country of origin. From there, features of thesending country believed to influence the way in which immigrants’ individual-level characteristics are applied to the labour market are introduced. By usingthis multilevel approach, the overall magnitude of the macro-level effect can beassessed and the effects of theoretically informed origin variables can be analy-sed. However, given the theoretical complexity of origin effect described above,the substantive significance of their effects can only be speculated.
DATA, PROCEDURES, AND VARIABLES
Data for the present study are taken from Statistics Canada’s 2002 Ethnic Diver-sity Survey (EDS).2 The EDS is a comprehensive data source that contains infor-mation about various ethnic groups, including countries of origin, socio-demographic characteristics, and labour market outcomes. The EDS also includesvariables that capture dimensions of human and social capital, as well as percep-tions of discrimination. The target population for the EDS is persons aged15 years and older living in private households in each of Canada’s ten provinces.As with most previous studies of immigrant earnings in Canada, our analysis isrestricted to respondents who report having full-time, full-year employment.3
Because we focus only on recent immigrants, our analysis is also limited to themost recent immigrant cohort: those arriving to Canada between 1991 and 2001.Since a key objective of this paper is to identify the extent to which source countrycharacteristics influence the earnings of immigrants, native-born respondents areexcluded from the analysis. The data used here consist of 1,301 immigrants from44 sending countries.Fixed and random (mixed) effects models were both considered for the statisti-
cal analysis. Both are very flexible techniques for analysing data with a nested
Immigrant Origins and Employment Earnings 135
� 2010 The Authors. International Migration � 2010 IOM
structure. As with many statistical decisions, the choice between a fixed or randomeffects approach is a trade-off between bias and efficiency. Fixed effects modelsare especially popular in the econometrics literature, largely because they do notrequire the assumption that unobserved characteristics are uncorrelated with theobserved predictor variables and the error terms. In fact, the primary advantageof the fixed effects approach is that it explicitly controls for all level 2 characteris-tics, whether those characteristics are observed or unobserved. The key disadvan-tage of fixed effects regression models, however, is that they are only capable ofcontrolling for variables at level 1 (Allison, 2005: 17). Thus, it is not possible withthe fixed effects approach to obtain parameter estimates for variables at level 2.With the random effects method, on the other hand, it is possible to obtain esti-mates for level 2 variables, yet the model assumes that the unmeasured level 2characteristics are uncorrelated with the measured predictor variables and theerror terms. If this assumption is violated, the parameter estimates may be biased(Hausman, 1978). Another advantage of the random effects model is that it gener-ally has less sampling variability then the fixed effects approach.A key objective of this paper is to examine the impact of source country char-
acteristics on immigrant earnings. To do this, a multilevel linear model withboth fixed and random components is required.4 In the behavioural sciences,this method is commonly referred to as hierarchical linear modelling (Rauden-bush and Bryk, 2002).5 Multilevel models provide a flexible framework whenobservations are nested within hierarchies, such that the behaviour of a level 1outcome is a function of both level 1 and level 2 predictors. The classic exampleof a two-level model is an organizational hierarchy in which students are nestedwithin classrooms or within schools. Hierarchical models are also commonlyused in studies where individuals are nested within countries (Curtis et al., 2001;Entwisle et al., 1986; Hutchison and Gibler, 2007; Peffley and Rohrschneider,2003; Schofer and Fourcade-Gourinchas, 2001). The present study uses a multi-level framework to model the earnings of recent immigrants to Canada as afunction of both individual-level characteristics as well as their countries oforigin.The dependent variable in this analysis is the natural logarithm of the respon-
dents reported annual income.6 Demographic control variables include sex, mar-ital status, census metropolitan area of residence, number of children, mother’seducation, father’s education, age at migration, and years since migration.7 Theindependent variables are categorized according to the theoretical orientationthat guided their selection.The human capital independent variables in this analysis are highest level of
schooling, the region in which education was attained, and language used in thehome. Highest level of schooling is a categorical variable that measures the pointat which respondents completed their education, including whether a degree ordiploma was received. To take into account where education credentials wereattained, region of schooling is coded as Canada, United States, Europe, andOther. The language variable is coded to consider whether respondents are able tospeak at least one of Canada’s official languages. Those who spoke English orFrench in the home were grouped into the ‘‘Official language’’ category and all
136 Phythian, Walters and Anisef
� 2010 The Authors. International Migration � 2010 IOM
others make up the ‘‘Non official language’’ category. Consistent with human cap-ital theory, it is hypothesized that immigrants with lower levels of education whoattained their education from countries outside of Canada, the United States, andEurope, and who do not speak an official language in the home, will have poorerlabour market outcomes, as measured by yearly income.As with previous research, both behavioural and attitudinal variables that
measure social capital and ethnic attachment are used in the analysis (Reitz andSklar, 1997). Behavioural variables include religion; number of friends belongingto the same ethnic group; and whether the respondent voted in the last provin-cial, federal, or municipal election.8 Higher social distance, and hence lowersocial capital, is presumed to exist for those immigrants belonging to a non-Christian religion and for those who a report a greater number of friends whobelong to the same ethnic group. Thus, it is hypothesized that the religion andethnic friends variables will be significantly correlated with income, wherebythose who belong to a Christian denomination and those who have friendshipsoutside of their own ethnic group will have higher labour market earnings. Vot-ing behaviour is used as a measure of ethnic attachment, whereby those whovoted in the past federal, provincial, or municipal election are presumed to havestronger attachments to Canada than immigrants who did not or were not eligi-ble to vote.In terms of the attitudinal variables that represent social capital and ethnic
attachment, a subjective measure of the respondents’ sense of ethnic belongingto their own ethnic group and a variable that identifies the extent to whichrespondents’ trust people in their neighbourhood are included. While the formeris an obvious measure of ethnic attachment, the latter is an indicator of socialinclusion, and hence social capital (Anisef et al., 2003). Both variables are mea-sured on a five point Likert-type scale that ranges from very weak to verystrong. It is expected that immigrants who report a stronger sense of belongingto their ethnic group, and who report lower levels of trust in their neighbours,will have lower annual incomes than those who report weaker attachments andstronger feelings of trust.The EDS also includes a measure of whether respondents’ felt that they had
experienced discrimination in the workplace. This variable is included in themodel as a subjective measure of discrimination. Visible minority status is alsoused as an indicator of discrimination, albeit an imperfect one. The most com-mon approach to testing discrimination hypotheses is based on the notion that apersistent effect of race on economic well-being, after holding constant group dif-ferences in socio-demographic characteristics and human capital, can be attrib-uted to discrimination (see, e.g., Kazemipur and Halli, 2001). While thisapproach is flawed in that it assumes discrimination has been adequately cap-tured by the racial minority indicator, it is commonly used in the research litera-ture simply because objective measures of discrimination are not available. Thesame approach is used here. Furthermore, the visible minority indicator is analy-sed first and the magnitude of its effect is inspected as each of the remaininggroups of variables is added. This is done to determine which set of variables helpexplain the visible minority effect.
Immigrant Origins and Employment Earnings 137
� 2010 The Authors. International Migration � 2010 IOM
Finally, one country of origin variable that represents our level 2 indicator ofsocial and economic development is employed: Gross Domestic Product (GDP)per capita.9 GDP data were obtained from the World Bank’s World Develop-ment Indicators. Wherever possible, data from 2002 were obtained. For thosecountries without 2002 data, the closest year for which information was avail-able is used. Consistent with human capital, social distance, and discriminationhypotheses, it is expected that lower earnings will be associated with thoseimmigrants from less-developed countries, as measured by GDP.
RESULTS
All of the independent variables except age at migration, time since migration,and the level 2 indicators of social and economic development are treated as cate-gorical. The quantitative independent variables are centred at their grand means.The categories and coding of the variables can be found in Tables 1 and 2.Descriptive results are provided in Table 1.10
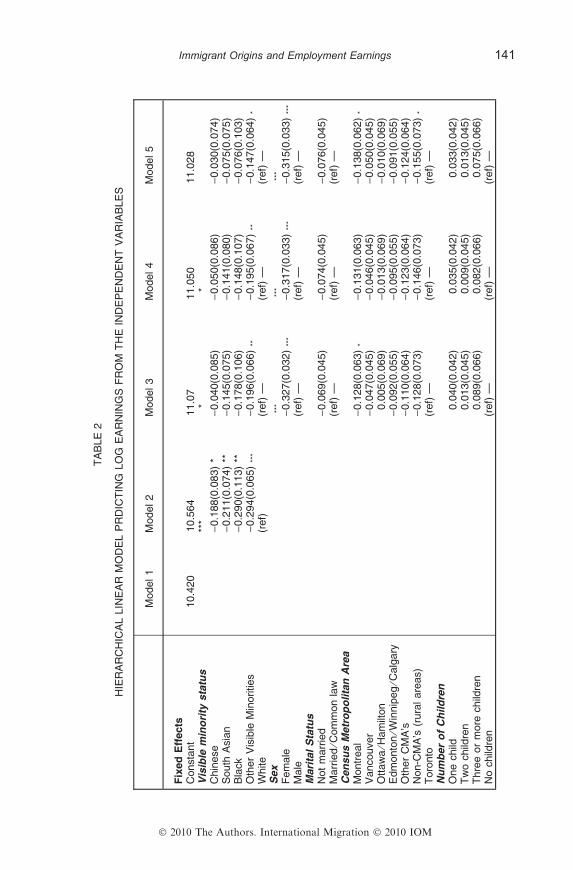
Findings indicate that recent immigrants earn, on average, just under US$40,000 per annum (CAD). It must be pointed out, however, that the restrictionto those with full-year full-time employment exaggerates the labour market posi-tion of recent immigrants. Because those who are unemployed, who work parttime, and who are not in the labour force are excluded from the sample, itappears that new immigrants perform better than they otherwise would if abroader sample were employed. Nonetheless, it is the predictors of immigrantearnings that are of interest here, and it is to those findings that we now turn.Regression results are provided in Table 2. For Model 1, the level 1 or indi-
vidual-level regression equation is
Yij ¼ b0j þ eij; where eij � Nð0; r2Þ
In this equation, each respondent’s log income Yij is the sum of an interceptfor the respondent’s country of origin and a random error associated with theith respondent who emigrated from the jth source country. At level 2 (country oforigin) the intercepts are expressed as an overall mean and a series of deviationsfrom the mean
b0j ¼ c00 þ l0j; where l0j~Nð0; s00Þ:
The fixed effect coefficient c00 represents the average earnings of recent immi-grants (the overall intercept), and l0j represents the random component for theintercept. A mixed or multilevel model is obtained by substituting the secondequation into the first:
Yij ¼ c00 þ l0j þ e0j
The fixed effects estimates are displayed in the top portion of Table 2, andthe bottom of Table 2 reveals the estimates of the variance components whichassess the amount of variability in earnings at level 1 and level 2.11 The randomeffects estimates from Model 1 – the unconditional means model – reveal that
138 Phythian, Walters and Anisef
� 2010 The Authors. International Migration � 2010 IOM
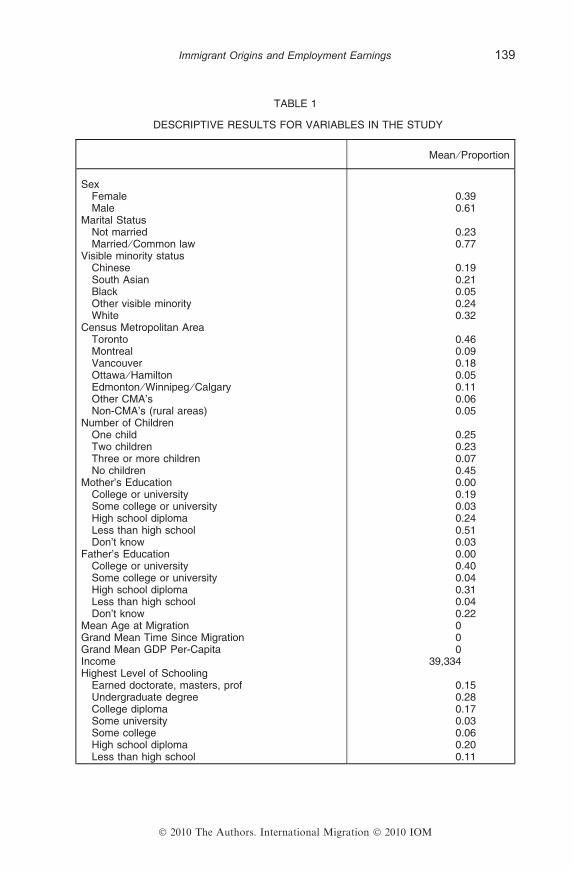
TABLE 1
DESCRIPTIVE RESULTS FOR VARIABLES IN THE STUDY
Mean ⁄ Proportion
SexFemale 0.39Male 0.61
Marital StatusNot married 0.23Married ⁄ Common law 0.77
Visible minority statusChinese 0.19South Asian 0.21Black 0.05Other visible minority 0.24White 0.32
Census Metropolitan AreaToronto 0.46Montreal 0.09Vancouver 0.18Ottawa ⁄ Hamilton 0.05Edmonton ⁄ Winnipeg ⁄ Calgary 0.11Other CMA’s 0.06Non-CMA’s (rural areas) 0.05
Number of ChildrenOne child 0.25Two children 0.23Three or more children 0.07No children 0.45
Mother’s Education 0.00College or university 0.19Some college or university 0.03High school diploma 0.24Less than high school 0.51Don’t know 0.03
Father’s Education 0.00College or university 0.40Some college or university 0.04High school diploma 0.31Less than high school 0.04Don’t know 0.22
Mean Age at Migration 0Grand Mean Time Since Migration 0Grand Mean GDP Per-Capita 0Income 39,334Highest Level of Schooling
Earned doctorate, masters, prof 0.15Undergraduate degree 0.28College diploma 0.17Some university 0.03Some college 0.06High school diploma 0.20Less than high school 0.11
Immigrant Origins and Employment Earnings 139
� 2010 The Authors. International Migration � 2010 IOM
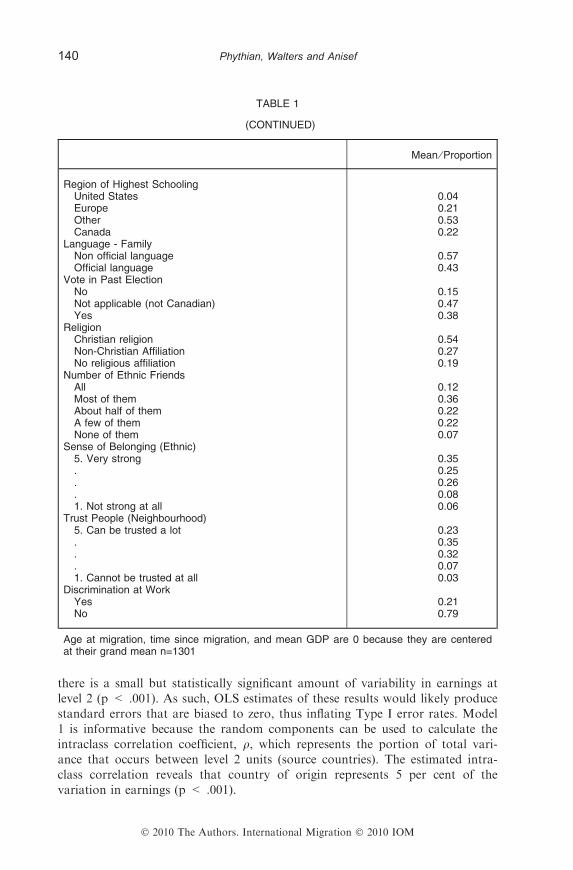
there is a small but statistically significant amount of variability in earnings atlevel 2 (p < .001). As such, OLS estimates of these results would likely producestandard errors that are biased to zero, thus inflating Type I error rates. Model1 is informative because the random components can be used to calculate theintraclass correlation coefficient, q, which represents the portion of total vari-ance that occurs between level 2 units (source countries). The estimated intra-class correlation reveals that country of origin represents 5 per cent of thevariation in earnings (p < .001).
TABLE 1
(CONTINUED)
Mean ⁄ Proportion
Region of Highest SchoolingUnited States 0.04Europe 0.21Other 0.53Canada 0.22
Language - FamilyNon official language 0.57Official language 0.43
Vote in Past ElectionNo 0.15Not applicable (not Canadian) 0.47Yes 0.38
ReligionChristian religion 0.54Non-Christian Affiliation 0.27No religious affiliation 0.19
Number of Ethnic FriendsAll 0.12Most of them 0.36About half of them 0.22A few of them 0.22None of them 0.07
Sense of Belonging (Ethnic)5. Very strong 0.35. 0.25. 0.26. 0.081. Not strong at all 0.06
Trust People (Neighbourhood)5. Can be trusted a lot 0.23. 0.35. 0.32. 0.071. Cannot be trusted at all 0.03
Discrimination at WorkYes 0.21No 0.79
Age at migration, time since migration, and mean GDP are 0 because they are centeredat their grand mean n=1301
140 Phythian, Walters and Anisef
� 2010 The Authors. International Migration � 2010 IOM
TA
BLE
2
HIE
RA
RC
HIC
AL
LIN
EA
RM
OD
EL
PR
DIC
TIN
GLO
GE
AR
NIN
GS
FR
OM
TH
EIN
DE
PE
ND
EN
TV
AR
IAB
LE
S
Model1
Model2
Model3
Model4
Model5
Fix
ed
Eff
ects
Consta
nt
10.4
20
10.5
64
11.0
711.0
50
11.0
28
Vis
ible
min
ori
tysta
tus
***
**
Chin
ese
)0.1
88(0
.083)
*)
0.0
40(0
.085)
)0.0
50(0
.086)
)0.0
30(0
.074)
South
Asia
n)
0.2
11(0
.074)
**)
0.1
45(0
.075)
)0.1
41(0
.080)
)0.0
75(0
.075)
Bla
ck
)0.2
90(0
.113)
**)
0.1
78(0
.106)
)0.1
48(0
.107)
)0.0
76(0
.103)
Oth
er
Vis
ible
Min
orities
)0.2
94(0
.065)
***
)0.1
96(0
.066)
**)
0.1
95(0
.067)
**)
0.1
47(0
.064)
*
White
(ref)
(ref)
—(r
ef)
—(r
ef)
—S
ex
***
***
***
Fem
ale
)0.3
27(0
.032)
***
)0.3
17(0
.033)
***
)0.3
15(0
.033)
***
Male
(ref)
—(r
ef)
—(r
ef)
—M
ari
tal
Sta
tus
Not
marr
ied
)0.0
69(0
.045)
)0.0
74(0
.045)
)0.0
76(0
.045)
Marr
ied
⁄Com
mon
law
(ref)
—(r
ef)
—(r
ef)
—C
en
su
sM
etr
op
oli
tan
Are
aM
ontr
eal
)0.1
28(0
.063)
*)
0.1
31(0
.063)
)0.1
38(0
.062)
*
Vancouver
)0.0
47(0
.045)
)0.0
46(0
.045)
)0.0
50(0
.045)
Ott
aw
a⁄H
am
ilton
0.0
05(0
.069)
)0.0
13(0
.069)
)0.0
10(0
.069)
Edm
onto
n⁄W
innip
eg
⁄Calg
ary
)0.0
92(0
.055)
)0.0
95(0
.055)
)0.0
91(0
.055)
Oth
er
CM
A’s
)0.1
10(0
.064)
)0.1
23(0
.064)
)0.1
24(0
.064)
Non-C
MA
’s(r
ura
lare
as)
)0.1
28(0
.073)
)0.1
46(0
.073)
)0.1
55(0
.073)
*
Toro
nto
(ref)
—(r
ef)
—(r
ef)
—N
um
ber
of
Ch
ild
ren
One
child
0.0
40(0
.042)
0.0
35(0
.042)
0.0
33(0
.042)
Tw
ochild
ren
0.0
13(0
.045)
0.0
09(0
.045)
0.0
13(0
.045)
Thre
eor
more
child
ren
0.0
89(0
.066)
0.0
82(0
.066)
0.0
75(0
.066)
No
child
ren
(ref)
—(r
ef)
—(r
ef)
—
Immigrant Origins and Employment Earnings 141
� 2010 The Authors. International Migration � 2010 IOM
TA
BLE
2
(CO
NT
INU
ED
)
Model1
Model2
Model3
Model4
Model5
Mo
ther’
sE
du
cati
on
Colle
ge
or
univ
ers
ity
0.1
72(0
.111)
0.1
38(0
.110)
0.1
28(0
.110)
Som
ecolle
ge
or
univ
ers
ity
0.2
22(0
.139)
0.2
00(0
.138)
0.1
92(0
.138)
Hig
hschooldip
lom
a0.1
41(0
.105)
0.1
09(0
.105)
0.0
98(0
.105)
Less
than
hig
hschool
0.1
28(0
.101)
0.1
03(0
.101)
0.0
96(0
.101)
Don’t
know
(ref)
—(r
ef)
—(r
ef)
—F
ath
er’
sE
du
cati
on
Colle
ge
or
univ
ers
ity
)0.0
03(0
.094)
)0.0
09(0
.094)
)0.0
14(0
.094)
Som
ecolle
ge
or
univ
ers
ity
)0.1
58(0
.121)
)0.1
73(0
.121)
)0.1
76(0
.121)
Hig
hschooldip
lom
a)
0.0
78(0
.092)
)0.0
81(0
.092)
)0.0
85(0
.092)
Less
than
hig
hschool
)0.0
78(0
.089)
)0.0
84(0
.089)
)0.0
87(0
.089)
Don’t
know
(ref)
—(r
ef)
—(r
ef)
—Y
ears
inC
an
ad
a0.0
28
(0.0
03)
***
0.0
23
(0.0
04)
***
0.0
22
(0.0
04)
***
Ag
eto
Mig
rati
on
)0.0
01
(0.0
02)
)0.0
02
(0.0
02)
)0.0
02
(0.0
02)
Hig
hest
Level
of
Sch
oo
lin
g**
***
***
*U
nderg
raduate
degre
e)
0.2
29
(0.0
52)
***
)0.2
18
(0.0
52)
***
)0.2
11
(0.0
52)
***
Colle
ge
dip
lom
a)
0.4
22
(0.0
58)
***
)0.4
03
(0.0
58)
***
)0.4
06
(0.0
58)
***
Som
euniv
ers
ity
)0.4
45
(0.1
12)
***
)0.4
34
(0.1
12)
***
)0.4
33
(0.1
12)
***
Som
ecolle
ge
)0.4
32
(0.0
84)
***
)0.3
91
(0.0
84)
***
)0.3
86
(0.0
84)
***
Hig
hschooldip
lom
a)
0.5
51
(0.0
60)
***
)0.5
08
(0.0
61)
***
)0.5
04
(0.0
61)
***
Less
than
hig
hschool
)0.6
10
(0.0
72)
***
)0.5
70
(0.0
74)
***
)0.5
58
(0.0
73)
***
Earn
ed
docto
rate
,m
aste
rs,
pro
!(r
ef)
—(r
ef)
—(r
ef)
—R
eg
ion
of
Hig
hest
Sch
oo
lin
gU
nited
Sta
tes
0.0
18
(0.0
99)
0.0
57
(0.5
80)
)0.0
12
(0.0
99)
Euro
pe
0.0
09
(0.0
63)
0.0
17
(0.2
70)
0.0
04
(0.0
62)
Oth
er
)0.0
56
(0.0
53)
)0.0
41
(0.7
60)
)0.0
35
(0.0
53)
Canada
(ref)
—(r
ef)
—(r
ef)
—
142 Phythian, Walters and Anisef
� 2010 The Authors. International Migration � 2010 IOM
TA
BLE
2
(CO
NT
INU
ED
)
Model1
Model2
Model3
Model4
Model5
Lan
gu
ag
e-
Fam
ily
***
***
Non
offi
cia
lla
nguage
)0.1
99
(0.0
38)
***
)0.1
83
(0.0
39)
***
)0.1
87
(0.0
38)
***
Offi
cia
lla
nguage
(ref)
—(r
ef)
—V
ote
inP
ast
Ele
cti
on
*N
o0.0
09
(0.0
48)
0.0
06
(0.0
48)
Not
applic
able
(not
Canadia
ncitiz
en)
)0.0
88
(0.0
43)
*)
0.0
98
(0.0
43)
*
Yes
(ref)
—(r
ef)
—R
eli
gio
nC
hristian
relig
ion
0.0
25
(0.0
49)
0.0
31
(0.0
49)
Non-C
hristian
Affi
liation
0.0
14
(0.0
62)
0.0
30
(0.0
61)
No
relig
ious
affi
liation
(ref)
—(r
ef)
—N
um
ber
of
Eth
nic
Fri
en
ds
Most
of
them
0.0
66
(0.0
51)
0.0
71
(0.0
52)
About
half
of
them
0.1
13
(0.0
57)
*0.1
21
(0.0
57)
*A
few
of
them
0.0
90
(0.0
60)
0.0
95
(0.0
60)
None
of
them
0.0
14
(0.0
83)
0.0
21
(0.0
83)
All
(ref)
—(r
ef)
—S
en
se
of
Belo
ng
ing
(Eth
nic
)*
5.
Very
str
ong
)0.1
85
(0.0
71)*
*)
0.1
79
(0.0
71)
*.
)0.1
51
(0.0
73)
*)
0.1
43
(0.0
73)
*.
)0.1
98
(0.0
71)
**)
0.1
90
(0.0
71)
**.
)0.0
98
(0.0
85)
)0.0
94
(0.0
85)
1.
Not
str
ong
at
all
(ref)
—(r
ef)
—T
rust
Peo
ple
(Neig
hb
ou
rho
od
)5.
Can
be
truste
da
lot
0.1
34
(0.0
93)
0.1
31
(0.0
93)
.0.1
66
(0.0
92)
0.1
60
(0.0
92)
Immigrant Origins and Employment Earnings 143
� 2010 The Authors. International Migration � 2010 IOM
TA
BLE
2
(CO
NT
INU
ED
)
Model1
Model2
Model3
Model4
Model5
.0.1
13
(0.0
91)
0.1
10
(0.0
91)
.0.0
61
(0.1
06)
0.0
49
(0.1
06)
1.
Cannot
be
truste
dat
all
(ref)
—(r
ef)
—D
iscri
min
ati
on
at
Wo
rkN
o)
0.0
24
(0.0
40)
)0.0
27
(0.0
40)
Yes
(ref)
—(r
ef)
—L
evel
IIG
DP
Per-
Cap
ita
⁄100
0.0
06
(0.0
02)
**R
an
do
mE
ffects
Sta
ndard
Devia
tion
of
the
Random
Inte
rcept-
m0.1
5**
*0.1
0**
*0.1
0**
*0.0
9**
*0.0
5
Sta
ndard
Devia
tion
of
Level1
Resid
uals
-e
0.6
50.6
40.5
60.5
50.5
5
Intr
acla
ss
Corr
ela
tion
r0.0
51
0.0
22
0.0
30
0.0
18
0.0
05
Log
Lik
elih
ood
)1294
)1284
)1094
)1081
)1078
*p-v
alu
e<
.05;
**p-v
alu
ea<
.01;
***
p-v
alu
e<
.001.
Sta
ndard
err
ors
are
inpare
nth
eses.
n=
1301.
144 Phythian, Walters and Anisef
� 2010 The Authors. International Migration � 2010 IOM
The remaining models are estimated in series of stages to identify the way inwhich the various sets of variables impact the effect of racial minority status onimmigrant earnings. For Models 2 through 4, the level 1 equation isYij ¼ b0j þ
Pk1 bkjXkijþeij , where eij � Nð0; r2Þ.
The level 2 equation isb0j ¼ c00 þ l0j
bkj ¼ ck0
wherel0j � Nð0; s00Þ:
The parameter ck represents the regression slope, and the equation bkj = ck0implies that the effect of each variable is invariant across level 2 units. Only thefixed effects estimates for racial minority status are included in Model 2. Theeffect of this variable is statistically significant (p < .001),12 and the parameterestimates indicate that non-minority immigrants, the reference category, reportthe highest earnings followed by Chinese, South Asians, Blacks, and then finallyother racial minorities, who report the lowest earnings of all racial ⁄ ethnicgroups. The level 2 (country of origin) variability in earnings is reduced slightlywhen racial minority status is added to the model, but remains highly significant(p < .001).Model 3 adds the socio-demographic and human capital variables. Among
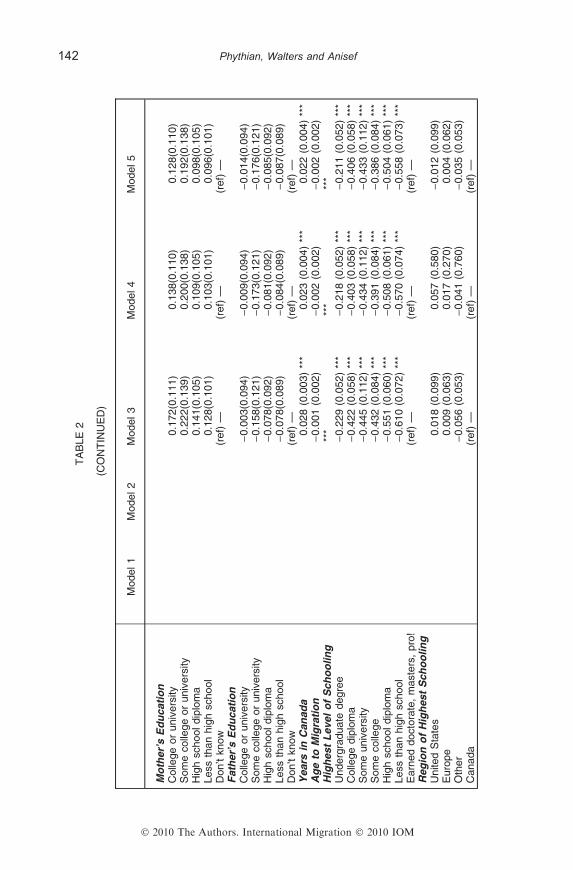
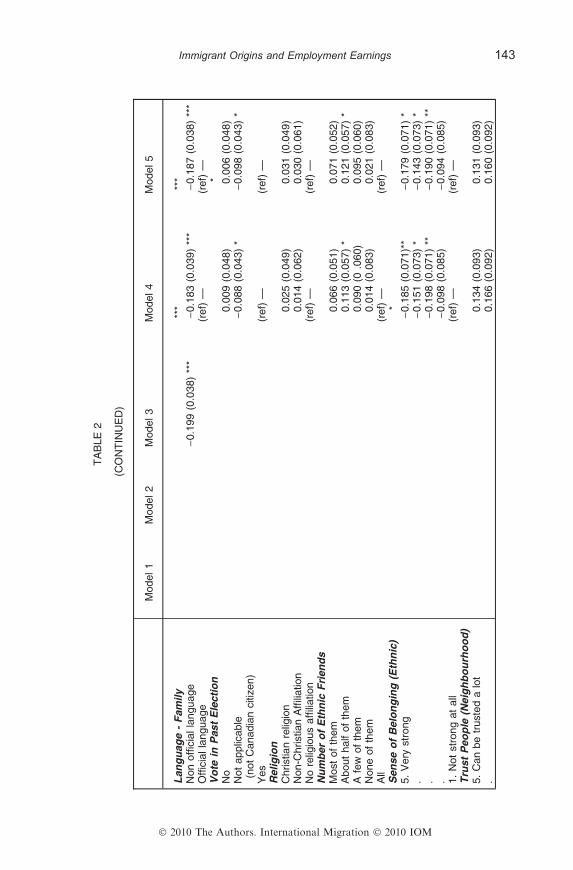
the socio-demographic variables, only sex and years in Canada are statisticallysignificant (p < .001). As expected, the parameter estimates for these variablesindicate that men earn more than women, and the number of years an immi-grant lives in Canada is positively related to his or her earnings. Of the two edu-cation variables, level of schooling has a particularly strong impact on earnings(p < .001), whereas the effect of region of schooling is, interestingly, not statis-tically significant. The parameter estimates for level of schooling are in theexpected direction, indicating that immigrants with higher levels of schoolinggenerally report higher earnings. With respect to language use, the parameterestimate indicates that recent immigrants who speak an official language athome report considerably higher earnings than immigrants who speak a non-official language in the home. Consistent with previous research, this variable ishighly significant (p < .001). The socio-demographic and human capital vari-ables somewhat mediate the impact of racial minority status, as its effectremained statistically significant but at a slightly less conservative level(p < .01). The chi-square test for the residual variability at level 2 remained sta-tistically significant (p < .001).Model 4 includes the variables related to social capital, ethnic attachments,
and discrimination. Surprisingly, none of the behavioural measures of socialcapital and ethnic attachments are statistically significant, yet one of the attitu-dinal measures is significant. Estimates for sense of belonging to ones ethnicgroup reveal a negative association with labour market earnings (p < .05), suchthat those with the strongest sense of belonging to their ethnic group have thelowest reported earnings, and vice versa. When this group of variables is
Immigrant Origins and Employment Earnings 145
� 2010 The Authors. International Migration � 2010 IOM

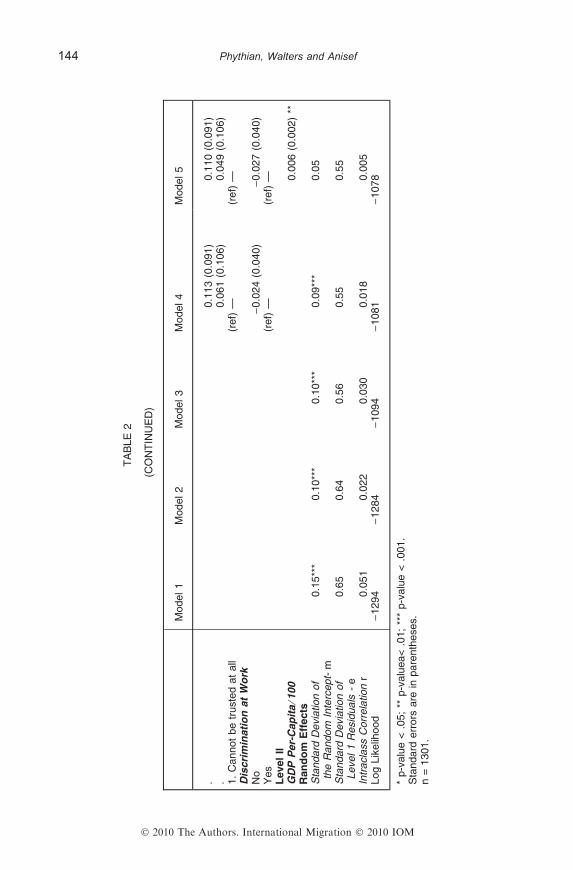
included in the model, the effect of racial minority status on earnings declinesyet again, but remains statistically significant (p < .05). The amount of variabil-ity in earnings at level 2 also remains statistically significant (p<.001).Model 5 provides the results for the level 2 variable, GDP per-capita. For
Model 5, the level 1 equation remains Yij ¼ b0j þPk
1 bkjXkijþeij, whereeij � Nð0; r2Þ:The level 2 model becomes
b0j ¼ c00 þ c01Wþ l0j
bkj ¼ ck0
where l0j � Nð0; s00Þ.The parameter c01 is the slope coefficient for the level 2 predictor W, which is
GDP per capita. In this model, lj represents an independent and identically dis-tributed random variable with a mean of 0 and a normal distribution, which isassumed to be uncorrelated with Xi, Wj, and eij.
13
The effect of GDP per capita on earnings is statistically significant, indicatingthat immigrants have higher earnings if they come from countries with higherper capita GDP (p < .01). Particularly noteworthy is the finding that whenGDP per capita is added to the model, racial minority status and sense ofbelonging to one’s ethnic group are no longer statistically significant. Moreover,the variability in earnings at level 2 is no longer statistically significant afterGDP per capita is added to the model.14 Thus, the remaining source countryvariability in the earnings of recent Canadian immigrants is explained by thelevel of economic development of their source country, as measured by GDP.
DISCUSSION AND CONCLUSIONS
Differential labour market outcomes across immigrant groups are of growingconcern among scholars and policymakers, particularly in the context of thenew immigration. Immigrants today are performing less well economically thenprevious cohorts, and there is evidence that this trend will not reverse itself inthe foreseeable future (see, e.g., Massey, 1995). Much of the research addressingthis issue has centred on human capital theory: the shift away from Europeansource countries in the late 1960s is said to have brought about the shift in thestock of human capital. The human capital model proposes that, because thenew immigrants are arriving primarily from less-developed economies, theirskills are of poorer quality and hence not easily transferable to the Canadianlabour market. While the human capital model has garnered a good deal ofsupport, it is insufficient on its own to explain immigrant labour market out-comes. Alternative theories point out the importance of social capital and dis-crimination in determining the economic performance of immigrants, thoughthe importance of these factors has been more difficult to assess due to prob-lems associated with observation and measurement.
146 Phythian, Walters and Anisef
� 2010 The Authors. International Migration � 2010 IOM
More recently, students of immigration are recognizing the importance ofmacro-level factors that shape the experience of immigrants in their host society.One such factor is country of origin. More specifically, the societal backgroundsfrom which they originate condition the extent to which immigrants are able toeffectively utilize their capital in the local economy. Related research suggeststhat as much as one-third of the earnings decline experienced by new immigrantcohorts over the past three decades can be attributed to compositional shifts inthe sending countries of recent immigrant cohorts (Aydemir and Skuterud,2005). These findings imply that country of origin is likely to have some bearingon the economic performance of immigrants within cohorts.In this study, hierarchical linear models were employed to assess the relative
effects of individual and source country characteristics on the annual earningsof recent immigrants, paying special attention to racial minority status and howits impact on earnings is affected by the inclusion of human capital, social capi-tal, perceptions of discrimination, and source country GDP. It is necessary toemphasize the importance of racial minority status because declining immigrantearnings began at roughly the same time that the proportion of non-white immi-grants entering Canada annually began to rise. The new immigration hasbrought with it an increase in racial diversity and, as mentioned above, therehas been much speculation about the role discrimination has played in deter-mining immigrant labour market earnings. Nonetheless, significant effects ofracial minority status on the economic position of immigrants, which are typi-cally attributed to discrimination, may instead be a result of unmeasured vari-ables having to do with country of origin.The parameter estimates for our initial models confirm results obtained in
previous research. Subjective feelings of discrimination do not appear to impactimmigrant incomes, though personal reports of workplace discrimination do notnecessarily translate into observable outcomes (for a more detailed discussionand empirical analysis, see Antecol and Kuhn, 2000). Race, however, has a sig-nificant and persistent impact on immigrant labour market earnings when con-trolling for demographic characteristics and human and social capital.Nonetheless, the race effect is reduced after these variables are held constant,indicating that they explain in part the relationship between race and income.The analysis also supports the theories of economic integration described
above. Consistent with human capital theory, level of education and languageuse are significant predictors of immigrant incomes. The magnitude and signifi-cance levels of the human capital variables remain consistent after other vari-ables are controlled, indicating that they are perhaps the most reliablepredictors of immigrant incomes. Ethnic attachments in the form of votingbehaviour also significantly impact labour market earnings, whereby immigrantswho are not eligible to vote have lower wages than others. This variable is alsoa proxy for citizenship, suggesting that immigrants who become citizens havebetter labour market outcomes than those do not become citizens. The individ-ual-level measures of social capital do not have a significant impact on immi-grant labour market earnings after measures of human capital, discrimination,and level of development are controlled.
Immigrant Origins and Employment Earnings 147
� 2010 The Authors. International Migration � 2010 IOM

With respect to macro-level theories, our findings show a small but statisti-cally significant amount of variability in immigrant incomes according to coun-try of origin. More specifically, the initial model indicates that 5 per cent of thevariation in income can be attributed to country of origin. The intraclass corre-lation is reduced to about 2 per cent after controlling for all of the individual-level variables, and disappears entirely once GDP is introduced into the modelat level 2. The nonsignificant variability due to country of origin means that thelevel of development of immigrant origins, as measured by GDP, explains theorigin effect on immigrant incomes in Canada.Though analyses confirm that both micro- and macro-level characteristics con-
tribute to immigrant earnings, the origin effect is small. Two per cent of the vari-ability in immigrant labour market earnings can be attributed to country oforigin. Thus, one must be cautious when interpreting the practical implications ofthese findings. While level of development explains much of the origin effect, itsrelatively weak association with income means that skill selection based on coun-try of origin is unlikely to offset the earnings disadvantage experienced by recentimmigrant groups, as is implied by proponents of human capital theory andhypotheses related to immigrant ‘‘quality.’’ That is not to say that source countryGDP is not an important predictor of immigrant labour market outcomes. Itseffect, though small, is a highly significant predictor of income for immigrantswho work full year, full time. Further research is needed to ascertain the magni-tude of its impact on alternative indicators of immigrants’ economic position, suchas unemployment status, labour force participation, and low-income status.The findings of the present study fail to support or refute any of the theories
related to the macro-level features of the sending country described above. TheGDP effect is especially complex from a theoretical perspective because of itshigh statistical correlation with other origin variables, including GINI score, theproportion of the population with a post-secondary education, and the propor-tion who work in the service industry. Others have pointed out that level of eco-nomic development is also an indicator of education quality, literacy, and socialwelfare, making it extremely difficult to determine precisely why GDP affectsimmigrant labour market outcomes. This combined with its apparently minorrole in determining the labour market earnings of recent immigrants, means thatselection criteria and settlement policies intended to improve the economic per-formance of newcomers to Canada may be ineffective if based on the sourcecountry composition of new arrivals. Nevertheless, further research into the wayin which immigrant origins determine labour market performance, however it ismeasured, is urgently needed to better inform programme and policy develop-ment, and to provide theoretical insight into the integration process.The disappearance of the significant racial minority effect after controlling for
GDP is noteworthy, given the sociological emphasis on racial discrimination in theCanadian labour market. This finding suggests that the association between racialminority status and income is partly explained by the GDP of the sending country.Though the result by no means refutes discrimination theories, it more readily per-mits alternative explanations for the race effect. For instance, the finding that GDPexplains the race effect may be the result of less pertinent human capital attained in
148 Phythian, Walters and Anisef
� 2010 The Authors. International Migration � 2010 IOM
less economically developed countries, from which immigrants are more often visi-ble minorities. GDP may also be a measure of social distance, whereby non-whiteimmigrants from less-developed countries are more distant from, and hence haveless social capital than, persons from more highly developed countries. Schaafsmaand Sweetman (2001), for instance, reported that racial minority status interactsstrongly with age at immigration, whereby non-whites who migrate at a young agedo not have an earnings deficit relative to comparable Canadian-born workers.This suggests that acculturation is an important component of labour market per-formance. The findings observed here and in previous studies are therefore encour-aging from a cultural standpoint in that they suggest discrimination may not play aconsiderable role in determining immigrant labour market outcomes in Canada.Additional research is needed to examine the intricacies of the racial minority sta-tus and how its impact on immigrant labour market outcomes is complicated bymicro- and macro-level differences between origin groups.Given that the findings of the present study are confined to the Canadian pop-
ulation, it is important for researchers to examine the source country effect inother immigrant receiving countries. With its long history of immigration, itslarge and diverse immigrant population accompanied by legally enshrined equal-ity rights and a rather generous social safety net, Canada can be described as arelatively ‘‘warm’’ destination country that may serve to offset origin effects.Such effects may be stronger in nations that are ethnically defined, such as Japan,Germany, and Israel (see, e.g., Friedberg, 2000; Reitz et al., 1999; Schuck andMunz, 1998; Tsuda et al., 2003); in more individualistic countries with a minimal-ist approach to social welfare, such as the United States (see, e.g., Reitz, 1998);and in regions with a shorter history of migration and a smaller racial minoritypopulation (Galloway and Aaberge, 2005). Thus, macro-level research is neededto determine the extent to which country of origin shapes immigrant economicoutcomes while taking into consideration the reception immigrants are accordedat their destination and existing strategies intended to promote (or obstruct) theirintegration. In any given host country, the success of a modern integrative immi-gration policy meant to address the labour market performance of immigrantswill depend upon the degree to which context matters.
ACKNOWLEDGMENT
We thank the Social Sciences and Humanities Research Council of Canada forgenerously providing funding for this study. This paper represents the views ofthe authors and does not necessarily reflect the opinions of Statistics Canada.
NOTES
1. For an insightful discussion of the difficulties associated with measuring the impact ofracial minority status on labour market outcomes, see Waslander (2002) and Li (2002).
Immigrant Origins and Employment Earnings 149
� 2010 The Authors. International Migration � 2010 IOM

2. The EDS data used in this analysis are from the confidential file available at Statis-tics Canada’s Research Data Centres.
3. Thus, as with most studies that employ data on full-time workers who are employedfull year who report positive earnings, our results may not apply to immigrants whowork part time.
4. The fixed effects approach to estimating the models was also used (results notshown). Very similar estimates were obtained and substantive interpretations wereidentical.
5. The terms hierarchical model, multilevel model, and mixed model are treatedsynonymously.
6. EDS respondents were asked to estimate their total personal income, before taxesand deductions, from all sources, in the past 12 months.
7. By including both age at migration and time since migration, the effect of age onincome cannot be analysed due to perfect collinearity between the variables (ageequals the sum of age at migration and time since migration). Age was therefore notincluded in the model (see Schaafsma and Sweetman, 2001). Similarly, the associa-tion between Canadian labour market experience and income cannot be identified.However, the time-since migration variable may be considered a proxy for labourmarket experience in Canada.
8. This variable also contains a category for those who were not eligible to vote (e.g.,immigrants without Canadian citizenship). Thus, this variable may serve as a proxyfor any non-linearities in the relationship between years since migration and income.
9. Initially, we intended to include four source country measures: GDP, GINI score,the proportion of the population with tertiary education, and the percentage work-ing in the service industry. However, with the exception of GDP, there were toomany missing cases on the level 2 variables. The level 2 sample was reduced bynearly 25 per cent when the GINI, education, and service sector variables wereincluded. Typically, source countries with missing data had missing values for mul-tiple level 2 variables. The key exception was GDP, for which we were able toobtain data for all 44 countries. Further, collinearity diagnostics for preliminarymodels indicate that the sampling variances of the regression coefficients for eachcountry-of-origin variable were severely inflated, rendering them useless as estima-tors. We considered all combinations of these variables. As well, the pairwise cor-relations among the four country-of-origin level variables are high, ranging from.65 to .87. Thus, three of the four source country variables were excluded from theanalysis.
10. The earnings figure in Table 1 is for immigrants who report having full-time andfull-year employment.
11. The random effects estimates in Table 2 are presented as standard deviations.12. Tests of statistical significance for categorical variables with more than two catego-
ries are based on the likelihood ratio chi-square test.13. All regression models depend on the tenability of the assumptions. If a component
in the error term is associated with any of the predictors in the model then theestimates will be biased. All linear models assume that the structural part of themodel is properly specified, and that the outcome is a linear function of thepredictors.
14. Identical results were obtained when we estimated the final model without a randomcomponent via OLS.
150 Phythian, Walters and Anisef
� 2010 The Authors. International Migration � 2010 IOM

REFERENCES
Abbot, M.G., and C.M. Beach1993 ‘‘Immigrant earning differentials and birth-year effects for men in Canada:
post-war 1972’’, Canadian Journal of Economics, 25: 505–524.Anisef, P., R. Sweet, and G. Frempong2003 ‘‘Labour market outcomes of immigrant and racial minority university gradu-
ates in Canada’’, Journal of International Migration and Integration, 4(4): 499–522.
Antecol, H.2000 ‘‘An examination of cross-country differences in the gender gap in labor force
participation rates’’, Labour Economics, 7: 409–426.2001 ‘‘Why is there interethnic variation in the gender wage gap? The role of cul-
tural factors’’, The Journal of Human Resources, 36(1): 119–143.2000 ‘‘Gender as an impediment to labor market success: why do young women
report greater harm?’’ Journal of Labor Economics, 18(4): 702–728.Aydemir, A., and M. Skuterud2004 Explaining the Deteriorating Entry Earnings of Canada’s Immigrant Cohorts:
1966-2000, Statistics Canada, Ottawa.Baker, M., and D. Benjamin1994 ‘‘The performance of immigrants in the Canadian labour market’’, Journal of
Labour Economics, 12: 369–405.Beaujot, R., K.G. Basavarajappa, R.B.P. Verma, and J. Dumas1988 Income of Immigrants in Canada: A Census Data Analysis, Statistics Canada,
Ottawa.Bloom, D.E., G. Grenier, and M. Gunderson1995 ‘‘The changing labour market positions of Canadian immigrants’’, Canadian
Journal of Economics, 28: 987–1005.Bogardus, E.S.1959 Social Distance, Antioch Press, Los Angeles, California.
Borjas, G.J.1985 ‘‘Assimilation, changes in cohort quality, and the earnings of immigrants’’,
Journal of Labor Economics, 3(4): 463–489.1987 ‘‘Self selection and the earnings of immigrants’’, The American Economic
Review, 77(4): 531–553.1991 ‘‘Immigrants in the U.S. labor market: 1940-1980’’, The American Economic
Review, 81(2): 287–291.1992 ‘‘National origins and the skills of immigrants in the postwar period,’’ in G.J.
Borjas and R.B. Freeman (Eds), Immigration and the Workforce: EconomicConsequences for the United States and Source Areas, University of ChicagoPress, Chicago, Illinois: 17–47.
1994 ‘‘The economics of immigration’’, Journal of Economic Literature, 32(4): 1667–1717.
Boyd, M.1984 ‘‘At a disadvantage: the occupational attainments of foreign born women in
Canada’’, International Migration Review, 18(4): 1091–1119.2002 ‘‘Skilled immigrant labour: country of origin and the occupational locations of
male engineers’’, Canadian Studies in Population, 29(1): 71–99.Bratsberg, B., and J.F. Ragan Jr2002 ‘‘The impact of host-country schooling on earnings’’, Journal of Human
Resources, 37(1): 63–105.
Immigrant Origins and Employment Earnings 151
� 2010 The Authors. International Migration � 2010 IOM

Chard, J., and V. Renaud1999 ‘‘Visible minorities in Toronto, Vancouver, and Montreal’’, Canadian Social
Trends, 54: 20–25.Chiswick, B.R., Y.L. Lee, and P.W. Miller2005 ‘‘Immigrant earnings: a longitudinal analysis’’, Review of Income and Wealth,
51(4): 485–503.Coulson, R.G., and P. Devoretz1994 ‘‘Human capital content of Canadian immigrants’’, Canadian Public Pol-
icy ⁄Analyse de Politiques, 19(4): 357–366.Curtis, J., D.E. Baer, and E.G. Grab2001 ‘‘Nations of joiners: explaining voluntary association membership in demo-
cratic societies’’, American Sociological Review, 66(6): 783–805.Entwisle, B., W.M. Mason, and A.I. Hermalin1986 ‘‘The multilevel dependence of contraceptive use on socioeconomic develop-
ment and family planning program’’, Demography, 23(2): 199–216.Ferrer, A., and W.C. Riddell2004 ‘‘Education, credentials, and immigrant earnings,’’ TARGET Working Paper
Series, http://www.econ.ubc.ca/ine/papers/wp020.pdf.2005 ‘‘The effect of literacy on immigrant earnings’’, Journal of Human Resources,
41(2): 380–410.Friedberg, R.M.2000 ‘‘You can’t take it with you? Immigrant assimilation and the portability of
human capital’’, Journal of Labor Economics, 18(2): 221–251.Galloway, T.A., and R. Aaberge2005 ‘‘Assimilation effects on poverty among immigrants in Norway’’, Journal of
Population Economics, 18: 691–718.Giorgas, D.2000 ‘‘Social capital within ethnic communities,’’ Sociological Sites, The Sociological
Association of Australia (TASA) 2000 Conference: 1–12.Green, A.G., and D.A. Green1995 ‘‘Canadian immigration policy: the effectiveness of the point system and other
instruments’’, The Canadian Journal of Economics, 28(4b): 1006–1041.Hausman, J.A.1978 ‘‘Specification tests in econometrics’’, Econometrica, 46(6): 1251–1271.
Hou, F., and T.R. Balakrishnan1996 ‘‘The integration of visible minorities in contemporary Canadian society’’,
Canadian Journal of Sociology, 21(3): 307–326.Hutchinson, M., and D.M. Gibler2007 ‘‘Political tolerance and territorial threat: a cross-national study’’, Journal of
Politics, 69(1): 128–142.Kalbach, M.A., and W.E. Kalbach2000 ‘‘The importance of ethnic-connectedness for Canada’s postwar immigrants,’’
in M.A. Kalbach and W.E. Kalbach (Eds), Perspectives on Ethnicity in Can-ada, Harcourt, Toronto: 182–206.
2002 ‘‘Ethnic-connectedness and economic inequality: a persisting relationship’’,Canadian Studies in Population, 29(2): 245–264.
Kazemipur, A.2004 An Economic Sociology of Immigrant Life in Canada, Nova Science Publishers,
Inc., New York.2001 ‘‘The changing colour of poverty in Canada’’, Canadian Review of Sociology
and Anthropology, 38(2): 217–238.
152 Phythian, Walters and Anisef
� 2010 The Authors. International Migration � 2010 IOM
Li, P.S.2001 ‘‘The market worth of immigrants’ educational credentials’’, Canadian Public
Policy ⁄Analyse de Politiques, 27(1): 23–38.2002 ‘‘Immigrants’ educational worth and years in Canada: a reply’’, Canadian Pub-
lic Policy ⁄Analyse de Politiques, 28(2): 321–325.Lian, J.Z., and D.R. Matthews1991 ‘‘Does the vertical mosaic still exist? Ethnicity and income in Canada, 1991’’,
The Canadian Review of Sociology and Anthropology, 35(4): 461–481.Massey, D.S.1995 ‘‘The new immigration and ethnicity in the United States’’, Population and
Development Review, 21(3): 631–652.Peffley, M., and R. Rohrschneider2003 ‘‘Democratization and political tolerance in seventeen countries: a multilevel
model of democratic learning’’, Political Research Quarterly, 56(3): 243–257.Picot, G., and A. Sweetman2005 The Deteriorating Economic Welfare of Immigrants and Possible Causes:
Update 2005, Analytical Studies Branch Research Paper Series, Statistics Can-ada, Cat. no. 11F0019MIE-No. 262.
Porter, J.1965 The Vertical Mosaic, University of Toronto Press, Toronto.
Portes, A.1995 ‘‘Economic sociology and the sociology of immigration: a conceptual over-
view,’’ in A. Portes (Ed.), The Economic Sociology of Immigration, RussellSage Foundation, New York: 1–41.
2001 Legacies: The Story of the Immigrant Second Generation, Russell Sage Founda-tion, New York.
Raudenbush, S.W., and A.S. Bryk2002 Hierarchical Linear Models: Applications and Data Analysis Methods, Sage,
Newbury Park.Reitz, J.G.1998 Warmth of the Welcome: The Social Causes of Economic Success for Immi-
grants in Different Nations and Cities, Westview Press, Boulder.1994 The Illusion of Difference: Realities of Ethnicity in Canada and the United
States, C.D. Howe Institute, Toronto.1997 ‘‘Culture, race, and the economic assimilation of immigrants’’, Sociological
Forum, 12(2): 233–277.1999 ‘‘The institutional framework of ethnic employment disadvantage: a compari-
son of Germany and Canada’’, Journal of Ethnic and Migration Studies, 25(3):397–444.
Satzewich, V., and P.S. Li1987 ‘‘Immigrant labour in Canada: the cost and benefit of ethnic origin in the job
market’’, Canadian Journal of Sociology, 12(3): 229–241.Schaafsma, J., and A. Sweetman2001 ‘‘Immigrant earnings: age at immigration matters’’, The Canadian Journal of
Economics, 34(4): 1066–1099.Schofer, E., and M. Fourcade-Gourinchas2001 ‘‘The structural context of civic engagement: voluntary association membership
in comparative perspective’’, American Sociological Review, 66: 806–828.Schuck, P.H., and R. Munz1998 Paths to Inclusion: The Integration of Migrants in the United States and Ger-
many, Berghahn Books, New York.
Immigrant Origins and Employment Earnings 153
� 2010 The Authors. International Migration � 2010 IOM
Statistics Canada2003 ‘‘Update on cultural diversity’’, Canadian Social Trends, 70: 19–23.
Sweetman, A.2004 Immigrant Source Country Educational Quality and Labour Market Outcomes,
Statistics Canada, Ottawa.Tsuda, T., Z. Valdez, and W.A. Cornelius2003 ‘‘Human versus social capital: immigrant wages and labor market incorporation
in Japan and the United States,’’ in J.G. Reitz (Ed.), Host Societies and theReception of Immigrants, Center for Comparative Immigration Studies, Universityof California, San Diego: 215–252.
van Tubergen, F., I. Maas, and H. Flap2004 ‘‘The economic incorporation of immigrants in 18 western societies: origin,
destination, and community effects’’, American Sociological Review, 69(5):704–727.
Wanner, R.A.1998 ‘‘Prejudice, profit, or productivity: explaining returns to human capital among
male immigrants to Canada’’, Canadian Ethnic Studies, 30(3): 24–55.Waslander, B.2002 ‘‘The market worth of immigrants’ educational credentials: a comment’’, Cana-
dian Public Policy ⁄Analyse de Politiques, 28(2): 315–320.Wright, R.E., and P.S. Maxim1993 ‘‘Immigration policy and immigrant quality: empirical evidence from Canada’’,
Journal of Population Economics, 6: 337–352.
154 Phythian, Walters and Anisef
� 2010 The Authors. International Migration � 2010 IOM