Species Composition, Abundance, and Growth of Three Common Fish Species of the Volta Estuary, Ghana
20
International Journal of Fisheries and Aquaculture Sciences. ISSN 2248-9975 Volume 3, Number 1 (2013), pp. 79-97 © International Research Publication House http://www.irphouse.com Species Composition, Abundance, and Growth of Three Common Fish Species of the Volta Estuary, Ghana Segbefia Jennifer a , Nunoo K.E. Francis b and Dankwa R. Hederick c* a Department of Marine and Fisheries Sciences, University of Ghana, P. O Box LG 99, Legon, Accra. Ghana. b Department of Marine and Fisheries Sciences, University of Ghana, P. O Box LG 99, Legon, Accra. Ghana. Email:[email protected] c CSIR-Water Research Institute, P.O Box AH 38, Achimota, Ghana Abstract There is growing concern over observed declines in fish catch and therefore catch rate in coastal water bodies in Ghana which have been attributed, in part, to changes in the environment and excessive pressure on exploited fish populations. This research examined biological performance measures (abundance and growth) of estuarine fish under varying physico–chemical factors such as temperature, salinity, dissolved oxygen and pH. Experimental fishing with seine net was done while specified water quality parameters were also collected simultaneously on a monthly basis for eight months in three identified salinity zones of the Volta estuary. The results indicated that temperature and salinity caused most variation in fish abundance. There were a total of 2,333 individual fishes caught in the survey. Most species examined were juveniles of marine migrants; these species ranged from 2.5 to 10 cm. This reinforces the fact that the estuarine environment serves as breeding and nursery ground for a number of fishes. The dominant fish species by number encountered were Caranx hippos, Mugil cephalus and Ethmalosa fimbriata. Fish growth was estimated using length-weight relationships and condition factor. The von Bertalanffy growth function determined for the dominant fishes indicated slow growth. Precautionary management measures should be implemented to regulate their exploitation to help sustain fish populations in the estuary and the adjacent freshwater and marine environments. Keywords: Well-mixed estuary, Juvenile fish, Growth, Dominant, Nursery, Marine migrants, Volta estuary, Ghana.
Transcript of Species Composition, Abundance, and Growth of Three Common Fish Species of the Volta Estuary, Ghana

International Journal of Fisheries and Aquaculture Sciences. ISSN 2248-9975 Volume 3, Number 1 (2013), pp. 79-97 © International Research Publication House http://www.irphouse.com
Species Composition, Abundance, and Growth of Three Common Fish Species of the Volta Estuary,
Ghana
Segbefia Jennifera, Nunoo K.E. Francisb and Dankwa R. Hederickc*
aDepartment of Marine and Fisheries Sciences, University of Ghana, P. O Box LG 99, Legon, Accra. Ghana.
bDepartment of Marine and Fisheries Sciences, University of Ghana, P. O Box LG 99, Legon, Accra. Ghana.
Email:[email protected]
cCSIR-Water Research Institute, P.O Box AH 38, Achimota, Ghana
Abstract
There is growing concern over observed declines in fish catch and therefore catch rate in coastal water bodies in Ghana which have been attributed, in part, to changes in the environment and excessive pressure on exploited fish populations. This research examined biological performance measures (abundance and growth) of estuarine fish under varying physico–chemical factors such as temperature, salinity, dissolved oxygen and pH. Experimental fishing with seine net was done while specified water quality parameters were also collected simultaneously on a monthly basis for eight months in three identified salinity zones of the Volta estuary. The results indicated that temperature and salinity caused most variation in fish abundance. There were a total of 2,333 individual fishes caught in the survey. Most species examined were juveniles of marine migrants; these species ranged from 2.5 to 10 cm. This reinforces the fact that the estuarine environment serves as breeding and nursery ground for a number of fishes. The dominant fish species by number encountered were Caranx hippos, Mugil cephalus and Ethmalosa fimbriata. Fish growth was estimated using length-weight relationships and condition factor. The von Bertalanffy growth function determined for the dominant fishes indicated slow growth. Precautionary management measures should be implemented to regulate their exploitation to help sustain fish populations in the estuary and the adjacent freshwater and marine environments. Keywords: Well-mixed estuary, Juvenile fish, Growth, Dominant, Nursery, Marine migrants, Volta estuary, Ghana.

80 Segbefia Jennifer et al
1. Introduction Ghana, a country found between Cote d’Ivoire and Benin is located along the western Gulf of Guinea. The sub-region suffers from excessive fisheries pressure as in most other parts of the world resulting in changes in ecosystem structure, reflected in declining catch of targeted species in short-lived outbursts of normally uncommon species (Koranteng, 1998, 2002). Ghana has a long tradition of a very active fishing industry which has made tremendous strides over the years, developing from a predominantly traditional canoe fleet to a mix of traditional and modern fleet, including industrial trawlers (Atta-Kesson and Atuguba, 2008). Five distinct fisheries operate along the coast of Ghana and these are the artisanal fishing in lagoons and estuaries, artisanal fishing in the marine environment, inshore trawling (including shrimping), offshore (industrial) trawling and tuna fishing (Koranteng and Pauly, 2004). Marine fisheries are the largest component of the fishing industry in Ghana (Seini, 2000). The coastal artisanal fisheries are divided into two major sectors: the brackish water fisheries (estuaries and lagoons); and the artisanal inshore fisheries with fishermen operating in waters of less than 36 m depth (Koranteng and Pauly, 2004). Fish provides the Ghanaian consumer with about 60% of animal protein in the diet. The fisheries sector contributes significantly to national economic development objectives relating to food security, employment, poverty reduction, and gross domestic product and foreign exchange earnings. Fish supplies naturally augment food availability, ensuring good nutritional outcomes, particularly, for the poor and rural populations. It also provides the vast number of people engaged in the fishing industry incomes that improve on their access to food and livelihood (Seini, 2000). Literature concerning the length-weight relationship, condition factor, abundance and growth of estuarine fishes in Ghana is limited, and the Volta estuary is no exception. Dankwa, 2011 studied the Length-weight relationship and growth parameters of grey mullets (Pisces: Mugilidae) in two estuaries in Ghana. Estuarine fish communities have been extensively studied in other parts of the world (Potter et al., 1983; Loneragan et al., 1986; Tremain and Adams, 1995). Length-weight relationship is of great importance in fishery assessment (Haimovici and Velasco, 2000)because they allow the conversion of growth in length equation assessment model; the estimation of biomass from the length observation; the estimation of the condition of the fish and are useful for between regions comparison of life histories of certain species (Moutopoulos and Stegious, 2000).The simultaneous recording of length and weight measurements with age data can give information on the stock composition, age at maturity, life span, mortality, growth and reproduction (Diaz et al., 2000). The aim of this research was to study the aspects of the biology including the composition, length-weight and growth of some commercial fish species of the Volta estuary and how their abundance and distribution are influenced by changes in environmental conditions.

Species Composition, Abundance, and Growth of Three Common Fish Species 81
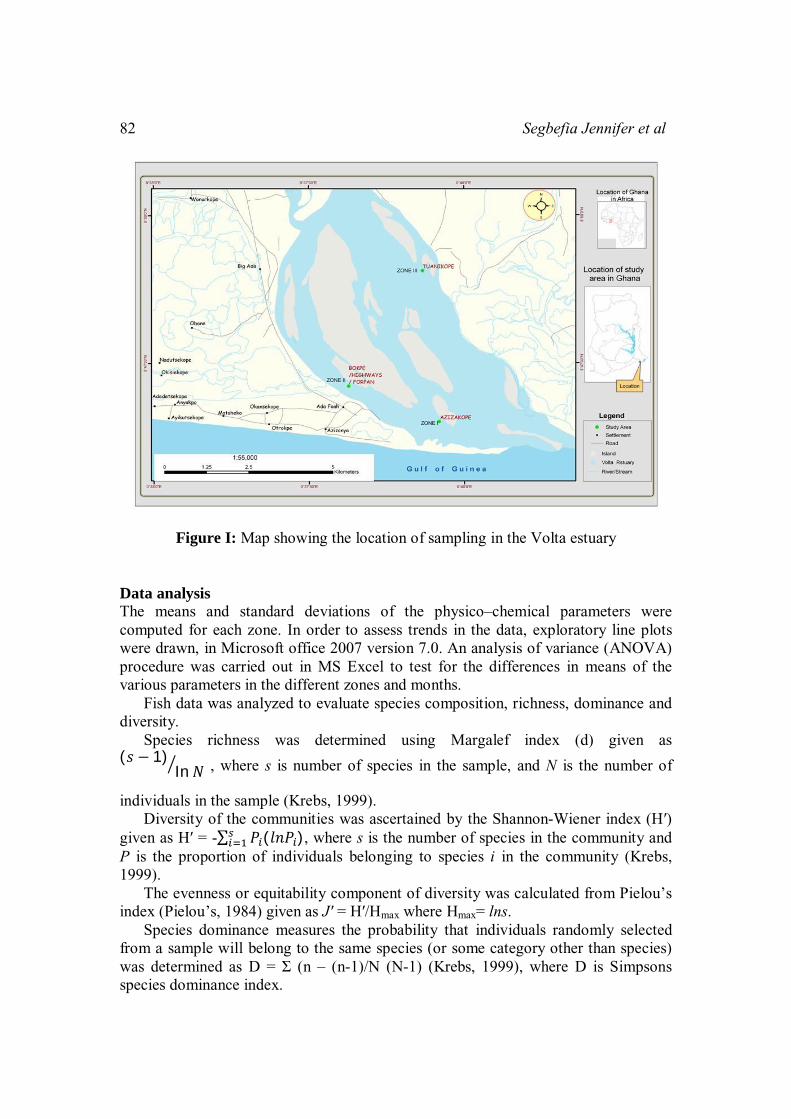
Materials and methods Study area The study was conducted for eight months, from September 2010 to April 2011 in the Volta estuary at Ada Foah in Ghana. The entire Volta basin spans six countries, (Togo, Burkina Faso, Benin, Mali, Côte d'Ivoire and Ghana) and has a catchment of 165,700 km2. The estuary was stratified into three zones according to salinity. Zone I (upstream, Azizakope) was 3,000 m away from Zone II (midstream, Bokpe) which was 4,200 m away from Zone III (downstream, Tuanikope) (Fig. I).It is actually located between latitude 50 301 and 600 N and longitude 00 301 and 10 01E and lies within a coastal Savanna zone that has rainfall of between 750 and 1250 mm annually (Dickson and Benneh, 1997). Two major townships, Big Ada and Ada Foah are located close to the estuary to the western bank. On the eastern bank there are vegetation such as Typha domingensis (cat tail weed), Polygonum senegalensis (knot weed) and Cyperus artculatus (mat weed).Portions of the estuary was fringed with mangroves, red (Rizophora spp.) and white (Avicennia spp) at some portions. Water quality Water quality sampling was done at different depths, surface (down to 20 cm) and bottom (average depth of 7 m). Two replicate water samples were taken in each of the zones per monthly visit. Salinity and Temperature measurements were taken in-situ using multi parameter electronic probe. Dissolved oxygen was analyzed using Winkler titration (Strickland and Parsons, 1968). Measurement of pH was also done in-situ using an electronic pH meter. Fish sample Each site was fished using seine net. The seine net had the following dimensions: length of net 200 m, mesh sizes of 1.5 cm (main net) and 0.8 cm (codend). Fishing was done in each of the zones for a maximum of 27 ± 6.24 minutes. Two hauls were made at each sampling site per month. Commercial catches were sampled from fishermen who were also fishing in the same zones at the same time in order to augment and confirm the catch from the experimental fishing. Fish specimens were put on ice and brought to the laboratory for identification and enumeration. At the laboratory, fish samples were sorted and classified to the species level using taxonomic keys and guides by Edwards et al. (2001), Dankwa et al. (1999), Kwei and Ofori Adu (2005), and Schneider (1990). The species composition by weight and number were determined and the dominant species by number selected for further enumeration. Standard biological data, consisting of total length (TL in cm), standard length (SL in cm) were measured to the nearest 0.1 cm, and weight (g) to the nearest 0.01g was routinely collected. All length and weight of dominant fishes were taken using a measuring board and a top loading digital balance respectively. Fulton’s condition factor was calculated to help in determining the physiological well-being of the fish.
82 Segbefia Jennifer et al
Figure I: Map showing the location of sampling in the Volta estuary Data analysis The means and standard deviations of the physico–chemical parameters were computed for each zone. In order to assess trends in the data, exploratory line plots were drawn, in Microsoft office 2007 version 7.0. An analysis of variance (ANOVA) procedure was carried out in MS Excel to test for the differences in means of the various parameters in the different zones and months. Fish data was analyzed to evaluate species composition, richness, dominance and diversity. Species richness was determined using Margalef index (d) given as (푠 − 1)
In 푁 , where s is number of species in the sample, and N is the number of
individuals in the sample (Krebs, 1999). Diversity of the communities was ascertained by the Shannon-Wiener index (H′) given as H′ = -∑ 푃 (푙푛푃 ), where s is the number of species in the community and P is the proportion of individuals belonging to species i in the community (Krebs, 1999). The evenness or equitability component of diversity was calculated from Pielou’s index (Pielou’s, 1984) given as J′ = H′/Hmax where Hmax= lns. Species dominance measures the probability that individuals randomly selected from a sample will belong to the same species (or some category other than species) was determined as D = Σ (n – (n-1)/N (N-1) (Krebs, 1999), where D is Simpsons species dominance index.

Species Composition, Abundance, and Growth of Three Common Fish Species 83
Due to insufficient specimens of each fish species for all months, length frequency and length weight plots of the three most dominant species, ≥ 4% by number, were plotted to examine changes in size over the study period and also to determine the relationship between length and weight of the species considered. The condition factor (K) of the species was also considered, K = 100 * body weight/ total length3. All data were first tested to ensure normality and homogeneity of variances. Where variances were heterogeneous, log (x + 1) transformed data were used. This served to reduce the effect on statistical analysis of zeros and huge numbers in record. In addition, biota–environmental matching (Bioenv) and Principal Component Analysis (PCA)were performed to determine the relationship between biological data and the environmental variables to establish how these variables influence the abundance of the fish fauna in the Volta estuary. These analyses were done using PRIMER 6 for windows version 6.1.6 computer software (PRIMER-E Ltd., 2006). FAO ICLARM stock assessment tool version 1.2.0 Electronic Length–Frequency Analysis I (ELEFAN I)as incorporated in the FISAT software according to von Bertalanffy growth function (VBGF= Lt = L∞ (1-e k (t-t
0))was used to plot a VBGF
growth curve for the three most dominant fish species using length –frequency data. ELEFAN I is a routine that can be used to identify the (seasonally oscillating) growth curve that "best" fits a set of length-frequency data, using the value of Rn (goodness of fit index) as a criterion (Pauly and David, 1981; Pauly, 1987; Gayanilo and Pauly, 1997). In the above equation Lt = the length at age t, L∞ = the asymptotic length, K= the growth coefficient and t0= theoretical age at which fish would have had zero length if they had grown according to the equation. The most optimized L∞ and K values were obtained by ELEFAN I-automatic search routine and the restructured length frequency histograms were also obtained. The growth performance index (Φ) was computed using the following equation (Pauly and Munro, 1984): Φ =log10K + 2log10 L∞ As ELEFAN cannot estimate the t0 value from the length frequency data, a very approximate value of ‘t0’ was estimated by substituting the L∞ (in cm) and K (year-1) in the following equation log (-t0) ≈ -0.3922 - 0.2752 log L∞- 1.038log K (Pauly, 1983). Results Environmental Analysis Salinity Salinity in the estuary ranged from fresh water to brackish; it was basically oligohaline (0.5 to 5 parts per thousand) or mesohaline (5 to 8 parts per thousand). In Zone I, salinity was highest both at the surface and bottom. Surprisingly, for Zone I the lowest salinity of 0 ppt was recorded in December 2010 both at the surface and bottom. It is worth noting that the salinity in the entire estuary for all three zones was almost 0 ppt in the month of December 2010. Zone II had its highest salinity 2.96 ppt in October 2010 and the lowest salinity of 0 ppt recorded was in September 2010 and December 2010 for both the surface and bottom water. In Zone III, salinity was highest 3.33 ppt and 6.09 in March and February 2011 for the surface and bottom

84 Segbefia Jennifer et al
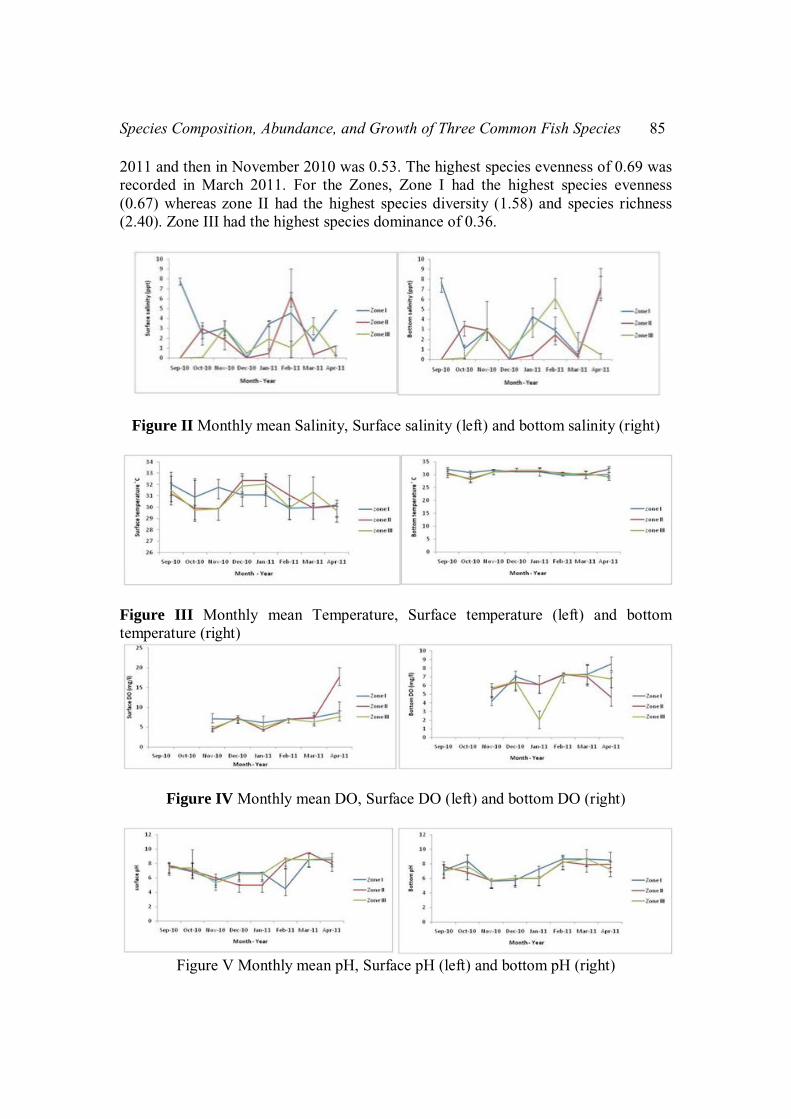
respectively whereas the lowest salinity of 0 ppt for this zone was recorded in September 2010 for both the surface and bottom water. Overall the highest salinity recorded was in the surface water and in Zone I, September 2010 and Zone II and III recorded the lowest salinity in September and December 2010. This is represented in Fig II. However, there was no significant difference in salinity among the three zones (Student’s t-test, p > 0.05). Temperature The surface temperature of the Volta estuary was less than 1˚C higher than the bottom temperature (mean surface temperature 30.8˚C± 0.7, mean bottom temperature 30.6˚C±0.8). The highest temperature was recorded in September, December 2010, and in January 2011 when the surface temperature was a little above 30 ˚C in all the zones. The water temperature was lowest in October 2010 with a minimum value of 28 ˚C (Fig 3). However, there was no significant difference (ANOVA, p > 0.05 and a Student t test, p> 0.05) in temperature among the three zones. Dissolved oxygen Dissolved oxygen was never a limiting factor for fish in the Volta estuary in all the three zones, even at the bottom water layer (mean surface water DO was 7.19 ± 1.21 and mean bottom water DO was 6.28 ± 0.68). Oxygen values were highest in April 2011 with a very high peak especially in the surface water layer at 17.71 mg/l. Dissolved oxygen was lowest in January 2011, in the bottom water layer. There was no significant difference in dissolved oxygen among the zones (ANOVA p > 0.05 and a Student’s t test, p > 0.05). pH In general, the pH values of the Volta estuary fluctuated greatly with time, space and tide in all the three sampling zones. It ranged from mean surface pH 7.12 ± 0.58 and the mean bottom pH 7.18 ± 0.57. From Fig. V the highest pH of 9.52 was found in the surface water in the month of March whereas the lowest pH of 4.53 was also in the surface water in the month of February. The pH of the surface water had the higher values when compared to the pH of the bottom water layer. However, there was no significant difference (ANOVA, p> 0.05 and a Student’s t test, p> 0.05) in pH among the three zones. Fish Species Composition In the forty-eight samples collected, 2,333 individuals (total biomass of 47,942 kg) were captured, corresponding to 21 taxonomic families and 32 finfish species; and three shell-fishes from three taxonomic families. They were dominated by marine species (25%) followed by both the estuarine and freshwater species (9%). Zones I and II were mostly dominated by marine fish species (Table 1). The most species rich families in the estuary were Cichlidae (five species) and Carangidae (four species). With the exception of October 2010 when 16 taxonomic families with 20 species were recorded, the species richness per sample remained relatively stable throughout the sampling period. The highest species dominance of 0.60 was recorded in January
Species Composition, Abundance, and Growth of Three Common Fish Species 85
2011 and then in November 2010 was 0.53. The highest species evenness of 0.69 was recorded in March 2011. For the Zones, Zone I had the highest species evenness (0.67) whereas zone II had the highest species diversity (1.58) and species richness (2.40). Zone III had the highest species dominance of 0.36.
Figure II Monthly mean Salinity, Surface salinity (left) and bottom salinity (right)
Figure III Monthly mean Temperature, Surface temperature (left) and bottom temperature (right)
Figure IV Monthly mean DO, Surface DO (left) and bottom DO (right)
Figure V Monthly mean pH, Surface pH (left) and bottom pH (right)
86 Segbefia Jennifer et al
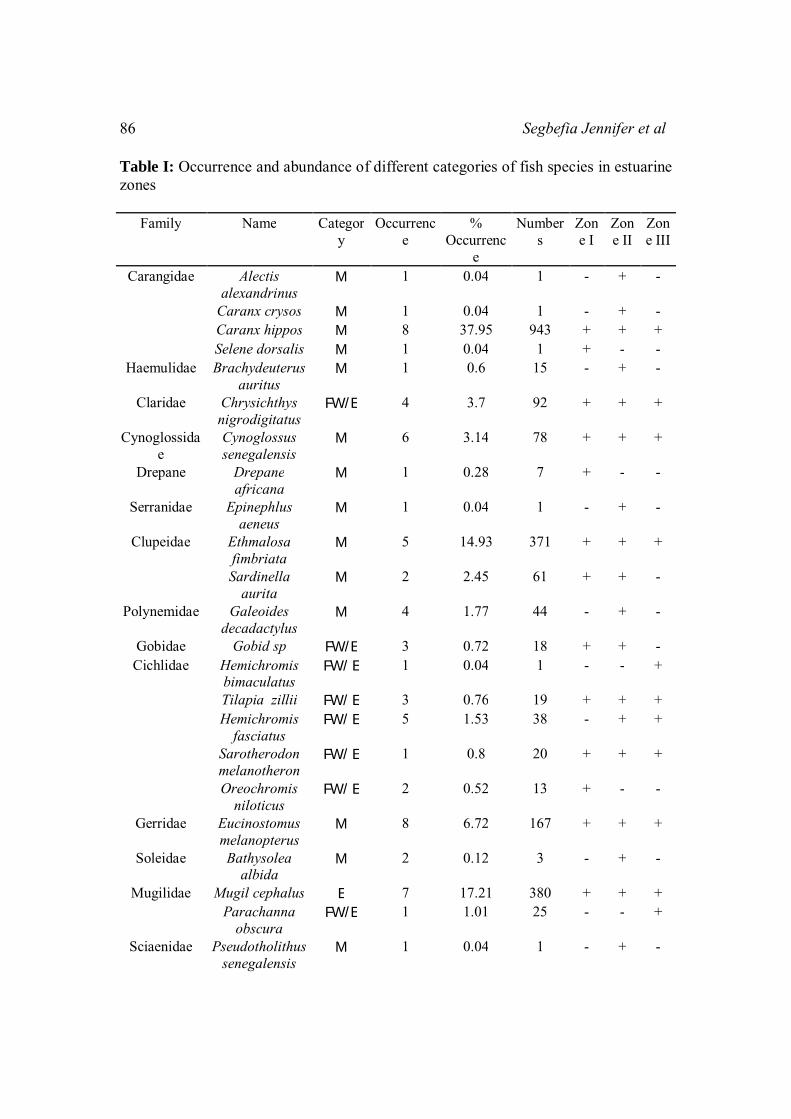
Table I: Occurrence and abundance of different categories of fish species in estuarine zones
Family Name Categor
y Occurrenc
e %
Occurrence
Numbers
Zone I
Zone II
Zone III
Carangidae Alectis alexandrinus
M 1 0.04 1 - + -
Caranx crysos M 1 0.04 1 - + - Caranx hippos M 8 37.95 943 + + + Selene dorsalis M 1 0.04 1 + - -
Haemulidae Brachydeuterus auritus
M 1 0.6 15 - + -
Claridae Chrysichthys nigrodigitatus
FW/E 4 3.7 92 + + +
Cynoglossidae
Cynoglossus senegalensis
M 6 3.14 78 + + +
Drepane Drepane africana
M 1 0.28 7 + - -
Serranidae Epinephlus aeneus
M 1 0.04 1 - + -
Clupeidae Ethmalosa fimbriata
M 5 14.93 371 + + +
Sardinella aurita
M 2 2.45 61 + + -
Polynemidae Galeoides decadactylus
M 4 1.77 44 - + -
Gobidae Gobid sp FW/E 3 0.72 18 + + - Cichlidae Hemichromis
bimaculatus FW/ E 1 0.04 1 - - +
Tilapia zillii FW/ E 3 0.76 19 + + + Hemichromis
fasciatus FW/ E 5 1.53 38 - + +
Sarotherodon melanotheron
FW/ E 1 0.8 20 + + +
Oreochromis niloticus
FW/ E 2 0.52 13 + - -
Gerridae Eucinostomus melanopterus
M 8 6.72 167 + + +
Soleidae Bathysolea albida
M 2 0.12 3 - + -
Mugilidae Mugil cephalus E 7 17.21 380 + + + Parachanna
obscura FW/E 1 1.01 25 - - +
Sciaenidae Pseudotholithus senegalensis
M 1 0.04 1 - + -

Species Composition, Abundance, and Growth of Three Common Fish Species 87
Tetraodontidae
Ephippion guttifer
M 1 0.04 1 - + -
Lagocephalus laevigatus
M 4 0.6 15 + + -
Synodontidae Trachinocephalus myops
M 2 0.72 18 - + -
Scombridae Scomberomorus tritor
M 1 0.48 12 - + -
Scombridae (juveniles)
M 6 4.19 104 + + -
Bothidae Scyacium micrurum
M 1 0.08 2 + - -
Sygnathidae Hippocampus sp.
M 1 0.08 2 + + -
Lethinidae Lethrinus atlanticus
M 3 0.4 10 - + -
Lutjanidae Lutjanus goreensis
M 5 1.29 31 + + +
Others
Tympanostonus fuscatus
E 1 0.04 1 - + -
Decapods Callinectes amnicola
E/ FW/ M
8 4.12 + + +
Penaeidae Panaeus notialis E/ FW/ M
3 0.48 10 + + -
(M = Marine, FW = Freshwater, E = Estuarine; + presence of species, - absence of species) The six most caught species made up 85% of the total fish catch in number and 90% in biomass. The fish fauna was dominated in numbers by the Caranx hippos (38%), Ethmalosa fimbriata (15%), Mugil Cephalus (17%), Eucinostomus melanopterus (7%), Scombrid juveniles (4%) and Chrysicthys nigrodigitatus (4%) in decreasing abundance. Even though the cichlids were the most species rich family caught, each species had few individuals present. Some species appeared only once in the catch during the study. These were Scyacium micrurum caught in Zone I in October 2010, Drepane africana caught also in October 2010 in Zone I. Caranx crysos and Bathysolea albida were both caught in Zone II in January 2011, Selene dorsalis, Alectes alexandrinus and Pseudotholithus senegalensis were also caught in Zone II in the month of March 2011, and then Epinephelus aeneus was caught in October 2010 in Zone II. Parachanna obscura and Hemichromis bimaculatus were caught in Zone III in the month of March 2011. Monthly trends in catch There was no catch in the hauls of the drag net in November, 2010, January 2011 and

88 Segbefia Jennifer et al
again in April 2011 in Zone III. The highest catch per haul was 10300.83 kg at Zone I in February 2011. The monthly trend in the catch was similar for most of the sampling months, though fish catch per zone fluctuated slightly through the sampling season (Fig VI).
Figure VI: Monthly trend of catch in the Volta estuary from September 2010 – April 2011.
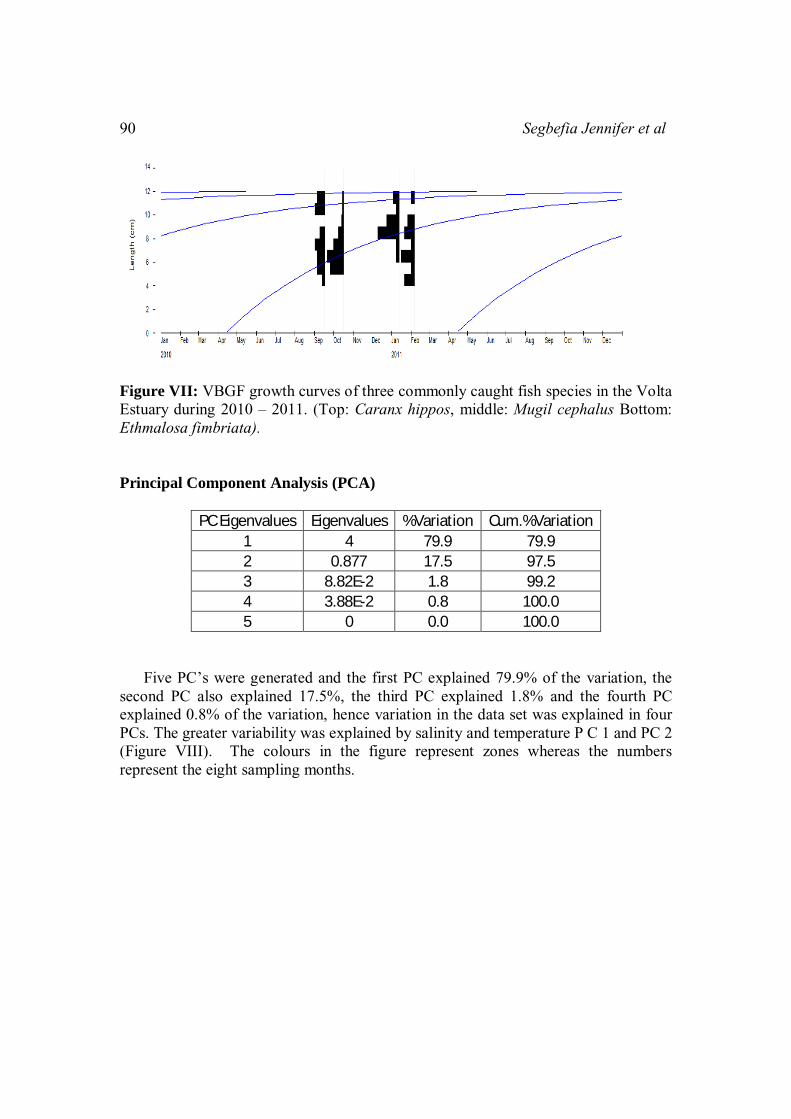
Sizes of fish The Volta estuary fish fauna comprised some small sized fishes of no commercial importance together with the juveniles of mainly big-sized commercial species. Generally, over 90% of the fish caught were relatively small-sized; these sizes fluctuated markedly within the eight months of sampling. The monthly length distribution for the three most commonly caught fishes in the catch showed a majority of small-sized fishes throughout the months. The dominant fish sizes were between 2.50 cm and 10.00 cm and a few ranged between 11.00 cm and 30.00 cm TL. However, a few relatively large fishes were caught; this was Chrysichthys nigrodigitatus of total length 42.00 cm but these had relatively fewer individuals and so were not of great importance. Growth Growth was also modeled using the ELEFAN I programme as incorporated in the FISAT software according to VBGF function. The asymptotic length, curvature parameter and their growth performance index are represented in Table II and III as well as Fig VII

Species Composition, Abundance, and Growth of Three Common Fish Species 89
Table II: Length - weight relationship for the three fish species
Table II: Fish species, asymptotic length, curvature parameter and their growth performance index
90 Segbefia Jennifer et al
Figure VII: VBGF growth curves of three commonly caught fish species in the Volta Estuary during 2010 – 2011. (Top: Caranx hippos, middle: Mugil cephalus Bottom: Ethmalosa fimbriata). Principal Component Analysis (PCA)
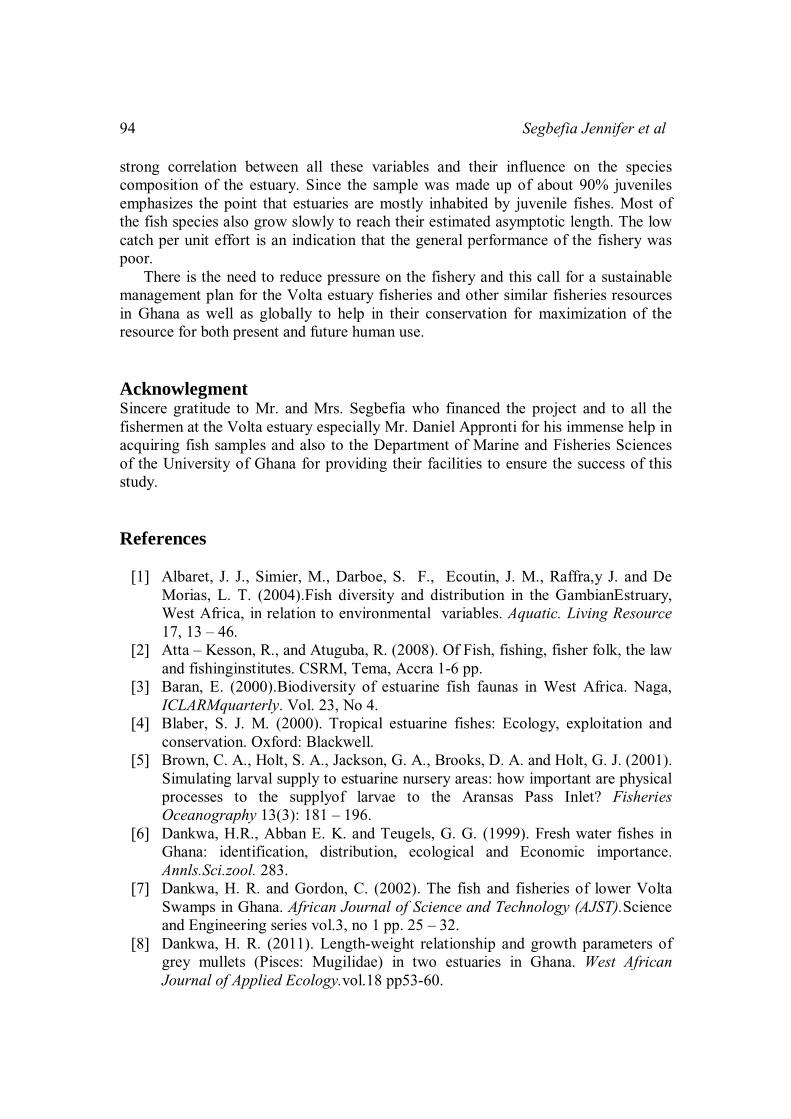
PC Eigenvalues Eigenvalues %Variation Cum.%Variation
1 4 79.9 79.9 2 0.877 17.5 97.5 3 8.82E-2 1.8 99.2 4 3.88E-2 0.8 100.0 5 0 0.0 100.0
Five PC’s were generated and the first PC explained 79.9% of the variation, the second PC also explained 17.5%, the third PC explained 1.8% and the fourth PC explained 0.8% of the variation, hence variation in the data set was explained in four PCs. The greater variability was explained by salinity and temperature P C 1 and PC 2 (Figure VIII). The colours in the figure represent zones whereas the numbers represent the eight sampling months.

Species Composition, Abundance, and Growth of Three Common Fish Species 91
BIOENV BIOENV performed on environmental (water quality) and fish abundance data indicated a strong correlation (0.9) between all the water quality parameters and the fish species abundance under study. Figure VIII is a PCA plot showing water quality and fishing zones. Discussion This study revealed that temperature and salinity, as primary driving forces, amongst a host of other interacting factors, influence fish abundance in the Volta estuary. Water quality of all the sites show little fluctuations in sampled parameters spatially and temporally indicating a well circulated and mixed estuary. Although Albaret et al. (2004), also concluded that the Gambian estuary was a well mixed estuary based on its water quality parameters which seemed to be much stable than that of other estuaries. Several authors have reported that distribution, abundance and composition of estuarine fish communities are determined by the physico-chemical characteristics of the water (Marshall and Elliot, 1998;Paperno and Brodie, 2004; Vega – Cendejas and Hennandez-de Santillana, 2004). This is an indication that diversity is dependent on ecosystem characteristics such as salinity, temperature, dissolved oxygen concentration and consequently is affected by ecological processes (Brown et al., 2001; Kupsichus, 2004). Therefore the impact analysis of water quality properties and the distribution and abundance patterns of estuarine fish populations is very important in understanding the ecology of fishes (Lekve et al., 2003; Prista et al., 2003). Some tropical estuarine fish families were unusually poorly represented. For example, for the mugilids, only Mugil cephalus was present in the estuary during the time of sampling out of the about eight known species belonging to this family in the coastal waters of Ghana (Kwei and Ofori- Adu, 2001). Generally, the fish composition, abundance and distribution of fish species found in the Volta estuary is

92 Segbefia Jennifer et al
in agreement with previous studies emphasizing the importance of estuaries to fish and other organisms which use the estuary (Dankwa and Gordon 2002; Albaret et al., 2004; Mendoza et al., 2009). The present study recorded 32 fish species over a period of eight months. Similar studies by Dankwa and Gordon (2002) in the mangrove swamps of the Lower Volta estuary over a six months period found 38 fin fishes whereas in Mexico in the Tropical Eastern Pacific, over a twelve month period 33 species were found by Mendoza et al.(2009). On the other hand, a study conducted in the Gambian estuary in West Africa resulted in 70 fish species (Albaret et al., 2004). These studies stress the species richness of estuaries and also the fact that the estuarine environments are mostly used as nursery or feeding sites. However, this species richness is due mostly to a succession of species temporarily using this environment for feeding, spawning and shelter. Fish species caught in each particular zone had similarity index that indicated their ability to withstand existing conditions. Monthly catches and catch rates in the Volta estuary were found to be relatively low; and consisted of mainly juveniles. It was therefore not surprising that getting fishermen to fish was a herculean task during the study. Similarly, Sakumo II lagoon, near Tema, studied in some detail in 1971 (Pauly, 1975, 1976) has much deteriorated since (Ntiamoah–Badu, 1991; Pauly, 1994) and this appears to be representative of other lagoons and estuaries along the Ghanaian coast (Entsua- Mensah, 2002). Catch data which could be used to evaluate how the lagoon and estuary fisheries are performing in comparison to other fisheries are sadly lacking nationwide. The dominance of juveniles (> 90%) of commercially important species found in the catch in the Volta estuary during the study was an indication of the dependence on the area as a nursery ground. This finding agrees with that of Baran (2000) for biodiversity of estuarine fish fauna in West Africa. Estuarine fish assemblages show cyclical variations in abundance and composition, and include species of fresh and marine waters, they can indicate sedentary or migratory behaviors that are present in diverse stages of their development (Albaret et al., 2004) as well as seasonal changes in fish habitat types, because of coastal processes, it is not strange that the Volta estuary exhibited similar characteristics. The diversity indices as present in the Volta estuary are indication that the estuary has a great sample diversity and that the fish community diversity is a basic ecological aspect, knowledge of which is necessary for the correct exploitation, regulation and management of fishery resources since it can provide a first approach to the health level of the estuarine system and allows for the identification of response patterns to possible environmental impacts. Similarly, other studies throughout the world have stressed the importance of the estuarine environment as a nursery or feeding grounds for most marine fish species (Blaber, 2000; Sheaves et al., 2006). Perhaps the assemblage of organisms in the estuary of the Volta takes advantage of the excessive amount of food items as well as the reduced number of predators in these waters. Despite the fishing being done at various points in the estuary and also the separation of the estuary into zones (seaward, middle and freshwater end) there were no significant changes in the species abundance, biomass and occurrence. This could be due to the fact that there were mostly juveniles present in the estuary, or that the fish species caught in relation to

Species Composition, Abundance, and Growth of Three Common Fish Species 93
size were not very fast swimmers and hence unskilled in avoiding the net, or that the fish species did not have much experience in avoiding the net since basically they were juveniles. Similarly, the drag net gear is a non-selective gear which is capable of catching every sized fish present in the water. The high species richness, dominance of juveniles in the catch, seasonality of species dominance and occurrence at the Volta estuary has resource and habitat conservation implications. For sustainable freshwater, estuarine and marine fisheries exploitation, effective management plans should be enunciated and implemented for the Volta estuary and other similar fisheries in Ghana. Even with fluctuations in salinity and DO, the relative composition of the fish fauna of the Volta estuary did not vary greatly during the eight months of sampling. It was dominated by Caranx hippos a marine species which probably uses the estuary as a nursery ground. Studies in the tropical Eastern Pacific, Mexico showed that even with fluctuations in water quality the fish species present did not vary greatly (Mendoza et al., 2009). The values obtained from the length-weight relationship showed that all the three species were positively allometric. Several authors have reported both isometric and allometric growth for different fish species from various water bodies. Dankwa (2011) reported allometric growth for gray mullets from two different estuaries. Marcus (1984) also reported allometric growth for E. fimbriata from the coastal and brackish water of Akwa Ibom state. A fish exhibits isometric growth only when its length increases in equal proportion with its body weight assuming there is constant specific gravity. The reverse of the statement is true for fish species that have allometric growth. The R2 for isometric growth is 3 and hence values that fall below or above 3 are indications of allometric growth (Gayanilo and Pauly, 1997). The condition factor (K) provides information on the general well being of the fish. A lower K value could be an indication of resource transfer during the reproductive period (Vazzoler, 1996). Values obtained for K could very well vary according to seasons as well as environmental conditions. The values obtained in this study showed that all species studied were not in good condition. Gayanilo and Pauly, (1997) observed that certain factors such as data pulling, sorting into classes, sex, stages of maturity and state of the stomach affect the condition factor of fish species. The L∞ and curvature parameter (K) for all the species varied slightly from that of other studies. Rudnick et al. (1999) reported L∞ of 124 cm for Caranx hippos as compared to the 19.43 cm of the current study. Solari et al., 2010 had L∞ of 40 cm for E. fimbriata while the current study had 17.38 cm. Greeley et al. (1987) had K value for M. Cephalus ranging from 30 – 40 cm, hence that of the current study falls within the range. In general however, larger species do not appear to be as abundant as smaller individuals nor are they as large as has previously been observed by other researchers in different locations as within the habitats and locations that were sampled during the study. Similarly, larger sizes may have not been sampled as effectively as smaller individuals due to factors such as habitat association and behavioural characteristics. Temperature and salinity are the driving factors that influence the greater variability in the abundance of the fish species in the Volta estuary and also there is a
94 Segbefia Jennifer et al
strong correlation between all these variables and their influence on the species composition of the estuary. Since the sample was made up of about 90% juveniles emphasizes the point that estuaries are mostly inhabited by juvenile fishes. Most of the fish species also grow slowly to reach their estimated asymptotic length. The low catch per unit effort is an indication that the general performance of the fishery was poor. There is the need to reduce pressure on the fishery and this call for a sustainable management plan for the Volta estuary fisheries and other similar fisheries resources in Ghana as well as globally to help in their conservation for maximization of the resource for both present and future human use. Acknowlegment Sincere gratitude to Mr. and Mrs. Segbefia who financed the project and to all the fishermen at the Volta estuary especially Mr. Daniel Appronti for his immense help in acquiring fish samples and also to the Department of Marine and Fisheries Sciences of the University of Ghana for providing their facilities to ensure the success of this study. References
[1] Albaret, J. J., Simier, M., Darboe, S. F., Ecoutin, J. M., Raffra,y J. and De Morias, L. T. (2004).Fish diversity and distribution in the GambianEstruary, West Africa, in relation to environmental variables. Aquatic. Living Resource 17, 13 – 46.
[2] Atta – Kesson, R., and Atuguba, R. (2008). Of Fish, fishing, fisher folk, the law and fishinginstitutes. CSRM, Tema, Accra 1-6 pp.
[3] Baran, E. (2000).Biodiversity of estuarine fish faunas in West Africa. Naga, ICLARMquarterly. Vol. 23, No 4.
[4] Blaber, S. J. M. (2000). Tropical estuarine fishes: Ecology, exploitation and conservation. Oxford: Blackwell.
[5] Brown, C. A., Holt, S. A., Jackson, G. A., Brooks, D. A. and Holt, G. J. (2001). Simulating larval supply to estuarine nursery areas: how important are physical processes to the supplyof larvae to the Aransas Pass Inlet? Fisheries Oceanography 13(3): 181 – 196.
[6] Dankwa, H.R., Abban E. K. and Teugels, G. G. (1999). Fresh water fishes in Ghana: identification, distribution, ecological and Economic importance. Annls.Sci.zool. 283.
[7] Dankwa, H. R. and Gordon, C. (2002). The fish and fisheries of lower Volta Swamps in Ghana. African Journal of Science and Technology (AJST).Science and Engineering series vol.3, no 1 pp. 25 – 32.
[8] Dankwa, H. R. (2011). Length-weight relationship and growth parameters of grey mullets (Pisces: Mugilidae) in two estuaries in Ghana. West African Journal of Applied Ecology.vol.18 pp53-60.

Species Composition, Abundance, and Growth of Three Common Fish Species 95
[9] Diaz, L.S., Roa, A., Garcia, C.B., Acero, A. and Navas, G. (2000). Length-weight relationship of demersal fishes from the upper continental slope off Colombia.The ICLARM Quarterly 23(3): 23-25.
[10] Dickson, B. K. and Benneh, G. (1977). A new geography of Ghana. Longman Group Ltd. 173 pp.
[11] Edwards, A. J., Gill, A. C., and Abohweyere, P. O. (2001). A revision of Irvines marine fishes of tropical West Africa. Daring Initiative Report 2.Ref. 162/7/45. 157pp.
[12] Entsua – Mensah, M., (2002).The contribution of Coastal lagoons to the continental shelf ecosystem of Ghana pp 161 – 169.In: J. M.McGlade, P. Cury, K.A.Koranteng and N. J Hardman (Eds). The gulf of guinea large marine ecosystem: Environmental forcing and sustainable development of marine resources. Elsevier.
[13] Gayanilo Jr. F. C. and Pauly D. (1997).The FAO-ICLARM Fish Stock Assessment Tools (FISAT): Reference manual. FAO Computerised Information Series Fisheries No. 8. FAO, Rome, 262pp.
[14] Greeley, M. S., Calder D. R., and Wallace, R. A. (1987). Oocyte growth and development in the mullet, Mugil cephalus, during seasonal ovarian recrudescence: relation to fecundity and size at maturity. FisheriesBulletin. 85: 187 – 200.
[15] Haimovici, M. and Velasco, G. (2000).Length-weight relationship of marine fishes from Southern Brazil. The ICLARM quarterly, 23 (1): 14-16.
[16] Koranteng, K. A. (1998).The Impacts of Environmental forcing on the Dynamics of Demersal Fishery Resources of Ghana, PhDTh., University of Warwick (U.K.), 376 p.
[17] Koranteng, K. A. (2002).Status of Demersal Fishery on the Inner Continental Shelf of Ghana in MCGLADE et al. (ed.) Guinea Large Marine ecosystem pp. 261-274.Elsevier
[18] Koranteng, K. A. and Pauly, D. (2004). Long term trends in demersal fish resources in Ghana in response to fishing pressure. P.75-81 In: M.L.D. Palomares and D. Pauly (eds.) West African Marine Ecosystems: Models and Fisheries Impacts. Fisheries Centre Research Report 12(7).
[19] Krebs, C. J. (1999). Ecological Methodology. HarperCollins, New York. 321pp.
[20] Kwei, E. A. and Ofori – Adu, W. D. (2005). Fishes in the coastal waters of Ghana. Ronna Publishers, Ghana.10-78 pp.
[21] Kupsichus, S. (2004). A temperature-dependent reproductive model for spotted sea trout (Cynoscion nebulosus) explaining spatio – temporal variations in reproduction and young – of –the – year recruitment in Florida estuaries. Journal of Marine Science. 61, 3 – 11.
[22] Lekve, K., Stenseth, N. C. and Gjoæter, J. (2003).Regulation of species richness by advection and richness dependent processes in a coastal community.Hydrobiologia 503, 93 – 103.

96 Segbefia Jennifer et al
[23] Loneragan, N.R., Potter, I.C., Lenanton, R.C.J. and Caputi, N. (1986).Spatial and seasonal differences in the fish fauna in the shallows of a large Australian estuary. Marine Biology92: 575-586.
[24] Marcus, C. (1984). Biology of bonga fish, Ethmalosa fimbriata (Bowdich). In: The Nigeria Coastal and brackish waters project (NF) 1,2. Annual Report,Nigeria Institute for Oceanography and MarineResearch Lagos, pp: 232.
[25] Marshall, S. and Elliot, M. (1998). Environmental influences on the fish assemblage of the Humber estuary, UK Estuary Coastal shelf Science 46: 175 – 184
[26] Mendoza, E., Castillo – Rivera, M., Zarate – Hernandez, R. and Ortiz-Burgos, S. (2009). Seasonal variations in the diversity, abundance and composition of species in an estuarine fish community in the tropical Eastern Pacific, Mexico. Ichthyological Research.56:330 – 339.
[27] Moutopolous, A. K. and Stergious, K. I. (2000). Length – weight relationship for 40 species of the Aegean Sea (Hellas). Journal of Applied Ichthyology, 29 (2): 204.
[28] Ntiamoah – Baidu, Y. (1991). Conservation of coastal lagoons in Ghana the traditional approach. Landscape urban ecology. 20: 40 - 46.
[29] Pauly, D. and David, N. (1981).ELEFAN I, a BASIC program for the objective extraction of growth parameters from length-frequency data. Meeresforschung, 28: 205-211.
[30] Paperno, R. and Brodie, R. B. (2004).Effects of environmental variables upon the spatial and temporal structure of a fish community in a small, fresh water tributary of the Indian River Lagoon, Florida.Estuarine Coast Shelf Science. 61, 229-241.
[31] Pauly, D. (1975). Investigations in Sakumo Lagoon. Fishery research unit. Tema, Ghana. Report for the Biennium 1973-1974.
[32] Pauly, D. (1976).“The biology of small West African Lagoon”. Br-dt.wiss./comm. Meeresforschung, 24, 273-287.
[33] Pauly, D. (1983).Some simple methods for the assessment of tropical fish stocks. FAO Fisheries Technical Paper 234, Food and Agriculture Organization of the United Nations, Rome, pp 52.
[34] Pauly, D. and J.L. Munro, (1984).Once more on growth comparison in fish and invertebrates. Fishbyte, 2: 21-23
[35] Pauly, D., (1987).A review of the ELEFAN system for analysis of length-frequency data in fish and aquatic invertebrates. ICLARM Conf. Proc., 13: 7-34.
[36] Pauly.D. (1994). On Reason, Mythologies and Natural Resource Conservation, Essay 14, in PAULY (ed., 1994): pp. 118-122.
[37] Pielou, E. C. (1984). The Interpretation of Ecological Data: a primer on Classification and Ordination. Wiley, New York.
[38] Potter, I.C., N.R. Loneragan, C.J. Lenanton, P.J. Chrystal, and C. J. Grant (1983). Abundance, distribution and age structure of fish populations in a Western Australian estuary. Journal of ZoologyLondon, 200: 21-50.
Species Composition, Abundance, and Growth of Three Common Fish Species 97
[39] Prista, N., Vasioncela, R. P., Costa, M. J. and Cabral, H. (2003). The demersal fish assemblage of the coastal area adjacent to the Tagus estuary (Portugal): Relationship with environmental conditions. Oceanol.Acta. 26, 525-536.
[40] Rudnick, D.T., Chen, Z., Childers, J. B. and Fontaire, T. (1999). Phosphorus and nitrogen inputs to Florida Bay: the importance of everglades, watershed. Estuaries 25:34-67.
[41] Seini, N. A. (2000). Economics of Marine Canoe Fisheries in Ghana. ISSER, University of Ghana.pp 378-394.
[42] Sheaves, M., Brodie J., Brook B., Dale, P., Lovelock, C., Waycott, M., Gehrke, P., Johnston R. and Baker R. (2006).Vulnerability of Coastal and Estuarine habitats in the Great Barrier Reef to Climate change.pp 594-620.
[43] Strickland, J. D. H. and Parsons, T. R. (1968). Determination of dissolved oxygen in a practical handbook of seawater analysis. Fisheries research board of Canada, Bulletin, 167, 71-75.
[44] Solari, A., Garcia, M. L. and Jaureguizar, J. A. (2010).First record of Eucinostomus melanopterus Bleeker (perciformes, Gerridae) from the Rio de la Plata estuary, Journal of Applied Ichthyology, 26: 485-487.
[45] Tremain, M. D. and Adams, D. H. (1995).Seasonal variations in species diversity, abundance, and composition of fish communities in the northern Indian River lagoon, Florida .Bulletin Marine Science, 57 (1): 171-192.
[46] Vazzoler, A.E.A.(1996). Biologia da reprodução de peixesTeleósteos: teoria e prática. EDUEM, SBI, Maringá,pp: 169.
[47] Vega – Cendejas, M. E. and Hernandez, M. (2004). Fish community structure and dynamics in a coastal hypersaline lagoon: Rio Legatos, Yucatan, Mexico. EstuarineCoast Shelf Science, 60: 285 – 299.