Distribution, partitioning and mixing behavior of phosphorus species in the Jiulong River estuary
13
Distribution, partitioning and mixing behavior of phosphorus species in the Jiulong River estuary Peng Lin a,b , Laodong Guo b, ⁎, Min Chen a , Yihua Cai a a College of Ocean and Earth Sciences, State Key Lab of Marine Environmental Science, Xiamen University, Xiamen 361005, China b School of Freshwater Sciences, University of Wisconsin—Milwaukee, 600 East Greenfield Avenue, Milwaukee WI 53204, USA abstract article info Article history: Received 8 February 2013 Received in revised form 26 August 2013 Accepted 5 September 2013 Available online 13 September 2013 Keywords: Phosphorus Nutrients Estuarine mixing Chemical speciation Jiulong River estuary Surface and bottom water samples were collected along a salinity gradient from the Jiulong River estuary during May 2010 to examine the distribution and mixing behavior of dissolved and particulate phosphorus (P) species. Particulate P was further fractionated into five operationally defined phases through a sequential extraction method. In addition to field studies, laboratory experiments were carried out to examine key processes regulating the distribution and partitioning of P during estuarine mixing. Dissolved inorganic P (DIP) was the main species in the total dissolved P (TDP) pool, comprising up to 83 ± 3% at river end-member station and 32 ± 21% at coastal stations. While the concentration of dissolved organic P (DOP) changed little with salinity, DIP concentra- tions varied dramatically between stations, especially in the low-salinity (S b 3) and high-salinity regions, indi- cating intensive removal/addition and transformation between P species in the water column. The predominance of DIP and low abundance of DOP reflected a profound influence of anthropogenic inputs from the Jiulong River. The total particulate P (TPP) contributed up to 70 ± 10% of the total phosphorus (TP = TDP + TPP) in the low- salinity area, showing a quasi-negative correlation with DIP during early estuarine mixing (S b 3), but the TPP decreased sharply with salinity, comprising 39 ± 19% of the TP pool in middle and higher salinity regions. River inputs, biological production (mostly for biogenic apatite and organic P), and repartitioning of P between dissolved and particulate (labile P) phases were major factors responsible for the dynamic variations in P species in the estuary. Deviation in results of laboratory mixing experiments from those of the field investigation indicat- ed that, in addition to physicochemical and biological processes, additional end-member waters and sediment resuspension also play a role in controlling the mixing behavior and biogeochemical cycling of P in the Jiulong River estuary. Values of the distribution coefficient of P (in terms of logK d ) were consistently high, but they were similar among stations with different salinities and had a poor correlation with suspended particulate matter concentration, likely due to the relatively long flushing time, elevated DIP, and lower colloidal effect in the Jiulong River estuary. Compared with results from early studies, elevated DIP from anthropogenic sources seemed to have altered the mixing behavior of P species in the estuarine environment. © 2013 Elsevier B.V. All rights reserved. 1. Introduction Phosphorus (P), one of the most important nutrient elements need- ed by all living organisms, can control primary productivity in estuarine and marine environments (Benitez-Nelson, 2000; Karl and Björkman, 2001; Paytan and McLaughlin, 2007). Knowledge about the dynamics of P species in estuarine systems is needed to better understand the biogeochemical cycling of P and its role in regulating water and envi- ronmental quality in coastal marine environments (Rabalais et al., 2002; Dagg et al., 2007; Boesch et al., 2009). Particulate and organic P can be the dominant species exported from rivers, especially in more pristine and undammed rivers (Howarth et al., 1995; Guo et al., 2004; Cai et al., 2008; Lin et al., 2012a). Therefore, the transformation and mixing behavior of particulate P may play an important role in controlling the distribution, speciation, and biological availability of dissolved P species in estuarine systems (Mayer et al., 1998; Cai et al., 2012; Lin et al., 2012a). However, nutrient studies considering all P species, including dissolved, particulate, inorganic and organic forms, are still few. Phosphorus in aquatic environments can be actively partitioned between particulate and dissolved phases and could exist in organic and inorganic forms. Therefore, in addition to the abundance of P, knowledge of its chemical speciation is needed. Recent evidence has shown possible utilization of dissolved organic phosphorus (DOP) by organisms and exchange of DOP with particles in aquatic environments (Mortazavi et al., 2000; Kolowith et al., 2001; Sylvan et al., 2006; Huang and Zhang, 2010). Furthermore, P in different particulate species may play different roles in the biogeochemical cycling of P and other trace elements. Thus, in addition to dissolved inorganic phosphorus (DIP), the fate and transport of DOP, as well as the transformation of these forms with various particulate P species in estuarine environments Marine Chemistry 157 (2013) 93–105 ⁎ Corresponding author. Tel.: +1 414 382 1742. E-mail address: [email protected] (L. Guo). 0304-4203/$ – see front matter © 2013 Elsevier B.V. All rights reserved. http://dx.doi.org/10.1016/j.marchem.2013.09.002 Contents lists available at ScienceDirect Marine Chemistry journal homepage: www.elsevier.com/locate/marchem
Transcript of Distribution, partitioning and mixing behavior of phosphorus species in the Jiulong River estuary

Marine Chemistry 157 (2013) 93–105
Contents lists available at ScienceDirect
Marine Chemistry
j ourna l homepage: www.e lsev ie r .com/ locate /marchem
Distribution, partitioning and mixing behavior of phosphorus species inthe Jiulong River estuary
Peng Lin a,b, Laodong Guo b,⁎, Min Chen a, Yihua Cai a
a College of Ocean and Earth Sciences, State Key Lab of Marine Environmental Science, Xiamen University, Xiamen 361005, Chinab School of Freshwater Sciences, University of Wisconsin—Milwaukee, 600 East Greenfield Avenue, Milwaukee WI 53204, USA
⁎ Corresponding author. Tel.: +1 414 382 1742.E-mail address: [email protected] (L. Guo).
0304-4203/$ – see front matter © 2013 Elsevier B.V. All rihttp://dx.doi.org/10.1016/j.marchem.2013.09.002
a b s t r a c t
a r t i c l e i n f oArticle history:Received 8 February 2013Received in revised form 26 August 2013Accepted 5 September 2013Available online 13 September 2013
Keywords:PhosphorusNutrientsEstuarine mixingChemical speciationJiulong River estuary
Surface and bottomwater samples were collected along a salinity gradient from the Jiulong River estuary duringMay 2010 to examine the distribution and mixing behavior of dissolved and particulate phosphorus (P) species.Particulate P was further fractionated into five operationally defined phases through a sequential extractionmethod. In addition tofield studies, laboratory experimentswere carried out to examine key processes regulatingthe distribution and partitioning of P during estuarine mixing. Dissolved inorganic P (DIP) was the main speciesin the total dissolved P (TDP) pool, comprising up to 83 ± 3% at river end-member station and 32 ± 21% atcoastal stations.While the concentration of dissolved organic P (DOP) changed little with salinity, DIP concentra-tions varied dramatically between stations, especially in the low-salinity (S b 3) and high-salinity regions, indi-cating intensive removal/addition and transformation betweenP species in thewater column. The predominanceof DIP and low abundance of DOP reflected a profound influence of anthropogenic inputs from the Jiulong River.The total particulate P (TPP) contributed up to 70 ± 10% of the total phosphorus (TP = TDP + TPP) in the low-salinity area, showing a quasi-negative correlation with DIP during early estuarine mixing (S b 3), but the TPPdecreased sharply with salinity, comprising 39 ± 19% of the TP pool in middle and higher salinity regions.River inputs, biological production (mostly for biogenic apatite and organic P), and repartitioning of P betweendissolved and particulate (labile P) phases weremajor factors responsible for the dynamic variations in P speciesin the estuary. Deviation in results of laboratorymixing experiments from those of the field investigation indicat-ed that, in addition to physicochemical and biological processes, additional end-member waters and sedimentresuspension also play a role in controlling the mixing behavior and biogeochemical cycling of P in the JiulongRiver estuary. Values of the distribution coefficient of P (in terms of logKd) were consistently high, but theywere similar among stations with different salinities and had a poor correlation with suspended particulatematter concentration, likely due to the relatively long flushing time, elevated DIP, and lower colloidal effect inthe Jiulong River estuary. Compared with results from early studies, elevated DIP from anthropogenic sourcesseemed to have altered the mixing behavior of P species in the estuarine environment.
© 2013 Elsevier B.V. All rights reserved.
1. Introduction
Phosphorus (P), one of the most important nutrient elements need-ed by all living organisms, can control primary productivity in estuarineand marine environments (Benitez-Nelson, 2000; Karl and Björkman,2001; Paytan and McLaughlin, 2007). Knowledge about the dynamicsof P species in estuarine systems is needed to better understand thebiogeochemical cycling of P and its role in regulating water and envi-ronmental quality in coastal marine environments (Rabalais et al.,2002; Dagg et al., 2007; Boesch et al., 2009). Particulate and organic Pcan be the dominant species exported from rivers, especially in morepristine and undammed rivers (Howarth et al., 1995; Guo et al., 2004;Cai et al., 2008; Lin et al., 2012a). Therefore, the transformation andmixing behavior of particulate P may play an important role in
ghts reserved.
controlling the distribution, speciation, and biological availability ofdissolved P species in estuarine systems (Mayer et al., 1998; Cai et al.,2012; Lin et al., 2012a). However, nutrient studies considering all Pspecies, including dissolved, particulate, inorganic and organic forms,are still few.
Phosphorus in aquatic environments can be actively partitionedbetween particulate and dissolved phases and could exist in organicand inorganic forms. Therefore, in addition to the abundance of P,knowledge of its chemical speciation is needed. Recent evidence hasshown possible utilization of dissolved organic phosphorus (DOP) byorganisms and exchange of DOPwith particles in aquatic environments(Mortazavi et al., 2000; Kolowith et al., 2001; Sylvan et al., 2006; Huangand Zhang, 2010). Furthermore, P in different particulate species mayplay different roles in the biogeochemical cycling of P and other traceelements. Thus, in addition to dissolved inorganic phosphorus (DIP),the fate and transport of DOP, as well as the transformation of theseforms with various particulate P species in estuarine environments
94 P. Lin et al. / Marine Chemistry 157 (2013) 93–105
need to be better understood. It is also important to understand thelinkage between increasing nutrient inputs and biogeochemical behav-ior of P in estuarine environments (Conley et al., 1995; van der Zee et al.,2007; Shen et al., 2008).
Many estuaries are suffering from eutrophication and metal pollu-tion due to increasing human impacts in Chinese coastal regions(Duan et al., 2008; Pan and Wang, 2012; Yan et al., 2012). The JiulongRiver estuary is a shallow estuarine system on the coast of FujianProvince, China. Previous studies have demonstrated both conservativeand non-conservative behaviors for different nutrients including P inthe Jiulong River estuary (e.g., Zhang et al., 1999; Yan et al., 2012).However, the mixing behavior of DOP and various particulate P species,as well as their relationship with DIP, remain poorly understood. Inaddition, more baseline studies are needed to examine changes in thebiogeochemical cycling of P species due to increasing population andhuman activities in the Jiulong River basin and its surrounding areas.
Our goals were to examine the variation and partitioning of P be-tween particulate and dissolved phases during estuarine mixing in theJiulong River estuary, an anthropogenically influenced estuary. Bothfield study and laboratory mixing experiments were carried out toevaluate the mixing behavior of P species and the relative importanceof different processes in the biogeochemical cycling of P in the estuarineenvironment.
2. Materials and methods
2.1. Study site
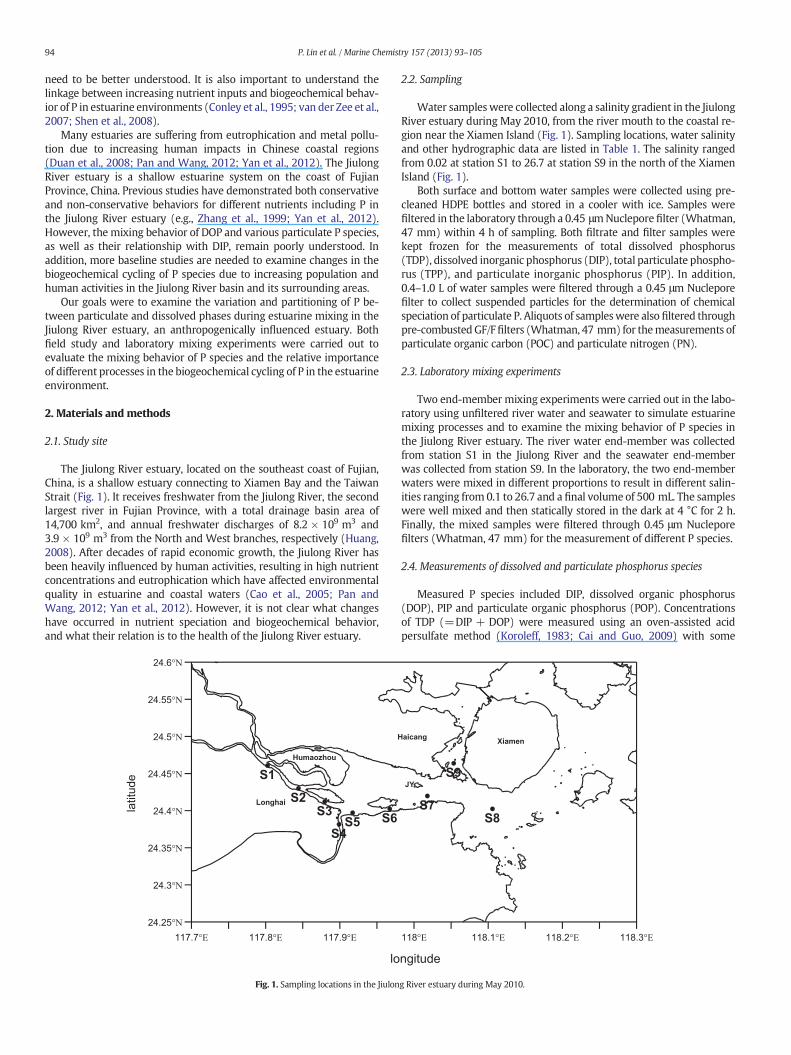
The Jiulong River estuary, located on the southeast coast of Fujian,China, is a shallow estuary connecting to Xiamen Bay and the TaiwanStrait (Fig. 1). It receives freshwater from the Jiulong River, the secondlargest river in Fujian Province, with a total drainage basin area of14,700 km2, and annual freshwater discharges of 8.2 × 10⁹ m3 and3.9 × 109 m3 from the North and West branches, respectively (Huang,2008). After decades of rapid economic growth, the Jiulong River hasbeen heavily influenced by human activities, resulting in high nutrientconcentrations and eutrophication which have affected environmentalquality in estuarine and coastal waters (Cao et al., 2005; Pan andWang, 2012; Yan et al., 2012). However, it is not clear what changeshave occurred in nutrient speciation and biogeochemical behavior,and what their relation is to the health of the Jiulong River estuary.
Fig. 1. Sampling locations in the Jiulon
2.2. Sampling
Water sampleswere collected along a salinity gradient in the JiulongRiver estuary during May 2010, from the river mouth to the coastal re-gion near the Xiamen Island (Fig. 1). Sampling locations, water salinityand other hydrographic data are listed in Table 1. The salinity rangedfrom 0.02 at station S1 to 26.7 at station S9 in the north of the XiamenIsland (Fig. 1).
Both surface and bottom water samples were collected using pre-cleaned HDPE bottles and stored in a cooler with ice. Samples werefiltered in the laboratory through a 0.45 μmNucleporefilter (Whatman,47 mm) within 4 h of sampling. Both filtrate and filter samples werekept frozen for the measurements of total dissolved phosphorus(TDP), dissolved inorganic phosphorus (DIP), total particulate phospho-rus (TPP), and particulate inorganic phosphorus (PIP). In addition,0.4–1.0 L of water samples were filtered through a 0.45 μm Nucleporefilter to collect suspended particles for the determination of chemicalspeciation of particulate P. Aliquots of sampleswere also filtered throughpre-combustedGF/Ffilters (Whatman, 47 mm) for themeasurements ofparticulate organic carbon (POC) and particulate nitrogen (PN).
2.3. Laboratory mixing experiments
Two end-member mixing experiments were carried out in the labo-ratory using unfiltered river water and seawater to simulate estuarinemixing processes and to examine the mixing behavior of P species inthe Jiulong River estuary. The river water end-member was collectedfrom station S1 in the Jiulong River and the seawater end-memberwas collected from station S9. In the laboratory, the two end-memberwaters were mixed in different proportions to result in different salin-ities ranging from 0.1 to 26.7 and a final volume of 500 mL. The sampleswere well mixed and then statically stored in the dark at 4 °C for 2 h.Finally, the mixed samples were filtered through 0.45 μm Nucleporefilters (Whatman, 47 mm) for the measurement of different P species.
2.4. Measurements of dissolved and particulate phosphorus species
Measured P species included DIP, dissolved organic phosphorus(DOP), PIP and particulate organic phosphorus (POP). Concentrationsof TDP (=DIP + DOP) were measured using an oven-assisted acidpersulfate method (Koroleff, 1983; Cai and Guo, 2009) with some
g River estuary during May 2010.

Table 1Sampling locations and the concentrations of dissolved P species in surface and bottom waters from the Jiulong River estuary during May 2010. Errors of DIP and DOP are ≤2%.
Sample ID Latitude (°N) Longitude (°E) Depth (m) Salinity DIP (μM) DIP/TDP (%) DOP (μM) DOP/TDP (%)
Surface watersS1 24°27′44.4″ 117°48′8.1″ 9.1 0.02 2.14 80 0.55 20S2 24°25′55.5″ 117°51′31.1″ 9.4 1.0 1.26 68 0.60 32S3 24°24′46.4″ 117°52′45.7″ 6.9 2.4 1.59 74 0.57 26S4 24°22′54.6″ 117°54′10.3″ 6.3 7.4 1.49 73 0.55 27S5 24°23′48.5″ 117°55′0.8″ 8.5 11.7 1.26 69 0.56 31S6 24°24′10.1″ 117°57′42.8″ 11.9 17.7 1.02 63 0.60 37S7 24°25′12.4″ 118°01′3.6″ 12.0 19.9 0.69 53 0.62 47S8 24°24′9.8″ 118°06′19.5″ 15.3 22.8 0.52 46 0.61 54S9 24°27′50.8″ 118°03′10.2″ 14.7 26.7 0.82 64 0.47 36
Bottom watersS1 24°27′44.4″ 117°48′8.1″ 9.1 0.1 2.12 86 0.34 14S2 24°25′55.5″ 117°51′31.1″ 9.4 1.0 1.19 71 0.49 29S3 24°24′46.4″ 117°52′45.7″ 6.9 4.3 1.62 82 0.37 18S4 24°22′54.6″ 117°54′10.3″ 6.3 7.6 1.49 75 0.51 25S5 24°23′48.5″ 117°55′0.8″ 8.5 15.2 1.05 70 0.46 30S6 24°24′10.1″ 117°57′42.8″ 11.9 19.3 0.92 67 0.45 33S7 24°25′12.4″ 118°01′3.6″ 12.0 23.3 0.40 46 0.46 54S8 24°24′9.8″ 118°06′19.5″ 15.3 25.5 0.12 17 0.58 83S9 24°27′50.8″ 118°03′10.2″ 14.7 25.2 0.65 58 0.48 42
95P. Lin et al. / Marine Chemistry 157 (2013) 93–105
modifications (Lin et al., 2012a,b). In short, 10 mL of the water samplewas first mixed well with 1 mL of acidified K2S2O8 solution (50 g/L,pH = 1) in a Teflon vial, and the mixed solution was digested in anoven at 140 °C for 4 h. After digestion, TDP concentrations weremeasured by the standard phosphomolybdenum blue method using aCary 300 UV–visible spectrophotometer and 5 cm quartz cuvettes(Parsons et al., 1984). DIP concentrations were directly measured with-out digestion. Concentrations of DOP were calculated from the differ-ence between TDP and DIP. Standard solutions were treated assamples during sample processing and analysis to ensure data quality.The detection limit was 8–10 nM based on replicate blank samplemeasurements, with a precision better than 2% for both DIP and TDP(Cai and Guo, 2009; Lin et al., 2012a).
Concentrations of total particulate P (TPP = PIP + POP) weredetermined after high temperature combustion and acid hydrolysis offilter samples (Solórzano and Sharp, 1980). Briefly, the filter sampleswere first wetted with 0.5 M MgCl2 solution and heated in an oven at95 °C until dried, followed by ashing in a furnace at 550 °C for 2 h todecompose organic P compounds. The residue was extracted using1 M HCl solution in the dark at room temperature for 24 h. PIP wasdirectly extracted from filter samples with 1 M HCl solution at roomtemperature in the dark for 24 h (Aspila et al., 1976). After neutraliza-tion and dilution, TPP and PIP were quantified as DIP through thestandard phosphomolybdenum blue method, and the concentrationsof POP were calculated from the difference between TPP and PIP(Lin et al., 2012a,b).
2.5. Sequential extraction of particulate phosphorus
The sequential extraction (SEDEX) technique has been frequentlyused to quantify various particulate P species in sediments, sinkingparticles, and suspended particulate matter in aquatic environments(e.g. van der Zee et al., 2002; Faul et al., 2005; Lin et al., 2012b). Usingthe SEDEX technique (Ruttenberg, 1992; Zhang et al., 2010), TPP couldbe operationally divided into five particulate P phases: (1) looselyadsorbed (exchangeable) P (Labile-P), (2) ferric bound P (Fe-P),(3) authigenic carbonate fluorapatite + biogenic apatite + CaCO3-associated P (CFA-P), (4) detrital apatite P (Detr-P), and (5) refractoryorganic P (Org-P).
The extraction of particulate P was carried out in a 25 mL Tefloncentrifuge tube with 10 mL of extraction solution based on proceduresdescribed in Zhang et al. (2010) and Lin et al. (2012b). After each extrac-tion and centrifugation, the supernatant solution containing theextracted P was determined as DIP using the phosphomolybdenum
blue method with a modified chromogenic agent to avoid interferencefrom the extraction solution. The extract solutions from the Labile-Pand CFA-P phases were measured for both DIP and TDP to quantifythe abundance of organic P in these two particulate P phases. The detec-tion limit was 0.2 nM for particulate P measurements with a highconcentration factor (25–55, the ratio of the water sample volume tothe volume of extraction solution) in a 5 cm quartz cuvette.
2.6. Measurements of particulate organic matter (POM) and SPM
GF/F filter samples were treated with HCl acid fumes overnight andmeasured for POC and PN concentrations on an elemental analyzer(Chen et al., 2006; Guo and Macdonald, 2006). Concentrations of POCand PN were used along with POP to determine particulate organicC/N and C/P ratios, respectively.
The weight difference between filter samples and blank filters wasused to calculate suspended particulate matter (SPM) concentrations.In brief, aliquots of whole water samples were filtered through a pre-weighed 0.45 μm polycarbonate membrane (Whatman) and rinsedwith nanopure water 3–4 times to remove salts. Filter sampleswere weighed after drying at 60 °C until achieving a constant weight(Lin et al., 2012b).
3. Results
3.1. Variations in dissolved inorganic and organic phosphorus
Table 1 summarizes the concentrations of dissolved P species insurface and bottom waters from the Jiulong River estuary. Surfacewater DIP concentrations generally increased from0.52 μMat the coast-al station S8 to 2.14 μM at the river end-member station S1 with anaverage of 1.20 ± 0.50 μM. Bottom water DIP concentrations weremore variable, ranging from 0.12 to 2.12 μM, with an average of1.06 ± 0.63 μM. These data indicated a strong riverine DIP sourcealthough there seemed to be a slight removal during early mixing(Fig. 2). Concentrations of DOP were generally lower and less variablethan those of DIP, ranging from 0.47 to 0.62 μM with an average of0.57 ± 0.05 μM for surface waters, and from 0.34 to 0.58 μM with anaverage of 0.46 ± 0.07 μM for bottom waters, respectively. Differencesin DIP and DOP concentrations between surface and bottom watersat each station are generally small (Table 1), especially in the lowersalinity area, showing a fairly well mixed water column in the JiulongRiver estuary.

0
0.5
1
1.5
2
2.5
0.3
0.4
0.5
0.6
0.7
0.8
0 5 10 15 20 25 30
Sur DIP
DOP
DIP
(µM
) DO
P (µM
)
Salinity
0
0.5
1
1.5
2
2.5
0.2
0.3
0.4
0.5
0.6
0.7
0 5 10 15 20 25 30
Bot DIP
DOP
DIP
(µM
) DO
P (µM
)
Salinity
0
20
40
60
80
100
0 5 10 15 20 25 30
DIPDOP
Per
cent
age
Salinity
0
20
40
60
80
100
0 5 10 15 20 25 30
DIPDOP
Per
cent
age
Salinity
Fig. 2.Variations in concentration and percentage of DIP and DOPwith salinity in the Jiulong River estuary from surfacewater (Sur, left panels) and bottomwater samples (Bot, right panels)during May 2010.
96 P. Lin et al. / Marine Chemistry 157 (2013) 93–105
Within the total dissolved phosphorus (TDP) pool, DIP contributedup to 66 ± 10%, ranging from 46% to 80% in surface waters, whileDOP comprised 34 ± 10% of the TDP, varying from 20% to 54%. Inbottom waters, 63 ± 21% of the TDP was DIP and 37 ± 21% was DOP.As expected, DIP was the major dissolved P species in the JiulongRiver estuary for both surface and bottom waters except two highersalinity (S N 20) stations (Fig. 2).
The river end-member DIP concentrations were up to 2.14 μM,which are within the concentration ranges (1.7–7.7 μM) for anthropo-genically influenced and eutrophic rivers, such as the Mississippi River(Turner et al., 2003; Cai and Guo, 2009; Shim et al., 2012), Lorie River(Meybeck et al., 1988) and Tamar River (Monbet et al., 2009), andthey are considerably higher than those observed for more pristinerivers, such as the Yukon River (Guo et al., 2004, 2012), the ChenaRiver in interior Alaska (Cai et al., 2008), and the Jourdan River inMississippi (Lin et al., 2012a). Furthermore, these updated DIP concen-trations (2.12–2.14 μM) are over 50–100% higher than those measuredfor the Jiulong River before recent economic development (0.5–1.0 μMbetween 1982 and 1997, as compiled by Yan et al., 2012), demonstrat-ing an increasing nutrient input from the Jiulong River.
3.2. Variations in particulate inorganic and organic phosphorus
Concentrations of suspended particulate matter (SPM) in surfacewaters ranged from 8.0 to 112 mg/L, with the highest concentration atstation S2 and a slight increase at station S7 (Fig. 3). For bottomwaters,SPM decreased in general with salinity with a maximum concentrationof 123 mg/L at station S7 (Fig. 3), showing a significant sedimentresuspension or lateral particulate source at this station. Concentrationsof PIP ranged from 0.12 to 4.38 μM (average of 1.35 ± 1.66 μM) and
concentrations of POP varied from 0.09 to 1.81 μM (average of0.59 ± 0.58 μM), with elevated concentrations at stations S2 and S7(Table 2). Both particulate P species showed a monotonic decreasewith increasing salinity, with elevated concentrations in bottomwatersat stations S6 and S7 (Fig. 3). The highest TPP, PIP and POP concentra-tions observed at station S2 coincided with the highest SPM at thesame station. In addition, the evident deviation in SPM and TPP concen-trations from the conservative mixing line (Fig. 3) demonstrated strongparticle settling or a sinkwithin the estuarinemixing zone, especially inlower salinity areas.
While surface water TPP concentrations (in μM) decreased withincreasing salinity and showed a predominant river influence, concen-trations of PIP and POP expressed as an intensive property (in mg-P/g-particles) became less variable in surface waters (Fig. 3). This indicatedsimilar particulate P sources, although bottomwaters hadmore variableTPP concentrations. For example, both PIP and POP in surface waterschanged little before salinity reached 20 (Fig. 3). Interestingly, contentsof particulate P (in mg-P/g-particles) were also generally higher atupper estuarine stations except at those influenced by sedimentresuspension. However, samples with lower particulate P contentsseemed to have lower particulate C/N ratios (Table 2). Higher concen-trations of particulate P species (in both μMandmg-P/g) at lower salin-ity (b2) stations and stations influenced by sediment suspension pointto a profound influence of anthropogenic and terrestrial P sources.Variations in PIP and POP concentrations (in mg-P/g-particles) wereconsistent with high terrestrial particle inputs from the river andsediment resuspension occurring in the lower estuary region assupported by the elevated SPM concentration (Fig. 3). The averageTPP concentration (1.59 ± 0.39 mg-P/g) for surface waters in theJiulong River estuary was evidently higher than those reported for

0
20
40
60
80
100
120
0 5 10 15 20 25 30
Sur
SPM
(m
g/L
)
Salinity
0
30
60
90
120
150
0 5 10 15 20 25 30
SPM
(m
g/L
)
Bot
0
2
4
6
8
0 5 10 15 20 25 30
PIPPOPTPP
Par
ticu
late
P (
µM)
Salinity
0
2
4
6
8
0 5 10 15 20 25 30
PIPPOPTPP
Par
ticu
late
P (
µM)
0
0.5
1
1.5
2
2.5
0 5 10 15 20 25 30
PIPPOPTPP
Par
ticu
late
P (
mg-
P/g
)
Salinity
0
1
2
3
4
5
6
0 5 10 15 20 25 30
PIPPOPTPP
Par
ticu
late
P (
mg-
P/g
)
0
20
40
60
80
100
0 5 10 15 20 25 30
%TPP%TDP
Per
cent
age
Salinity
Salinity
Salinity
Salinity
Salinity
0
20
40
60
80
100
0 5 10 15 20 25 30
%TPP%TDP
Per
cent
age
Fig. 3.Variations in suspendedparticulatematter (SPM), particulate inorganic and organic P concentrations (in both μMandmg-P/g-particles), and the partitioning of P betweendissolvedand particulate phases with salinity for surface water (Sur, left panels) and bottom waters (Bot, right panels) in the Jiulong River estuary during May 2010.
97P. Lin et al. / Marine Chemistry 157 (2013) 93–105

Table 2Concentrations of suspendedparticulatematter (SPM), particulate organic carbon (POC), particulate nitrogen (PN), particulate inorganic P (PIP), and particulate organic P (POP), aswell asthe particulate organic C:P and C:N ratios for surface and bottom waters in the Jiulong River estuary during May 2010. Both PIP and POP concentrations are given in extensive (μM) andintensive units (mg-P/g-particles and μmol/g-particles), with errors ≤2%.
Sample ID SPM (mg/L) POC (μM) PN (μM) POP (μM) PIP (μM) Par-C:N Par-C:P POP (mg-P/g) PIP (mg-P/g) POP (μmol/g) PIP (μmol/g)
Surface watersS1 70.6 120 15.5 1.16 3.95 7.8 104 0.51 1.73 16.4 223.7S2 112.1 129 14.9 1.81 4.38 8.7 72 0.50 1.21 16.1 134.7S3 44.9 81 12.0 0.83 1.59 6.7 97 0.58 1.10 18.6 107.5S4 19.2 40 6.2 0.41 0.66 6.5 98 0.66 1.07 21.2 101.4S5 14.6 36 6.2 0.32 0.54 5.8 111 0.68 1.15 22.0 92.7S6 11.4 22 3.8 0.25 0.37 5.8 90 0.66 1.01 21.4 75.7S7 18.5 18 3.2 0.29 0.37 5.6 63 0.48 0.61 15.5 41.9S8 4.9 10 1.5 0.11 0.12 6.8 93 0.70 0.78 22.5 45.6S9 8.0 10 1.6 0.09 0.14 6.0 104 0.36 0.56 11.7 36.7
Bottom watersS1 58.9 – – 1.28 4.35 – – 0.67 2.29 21.7 308.1S2 46.1 – – 1.82 5.76 – – 1.22 3.87 39.5 499.6S3 35.2 – – 1.50 3.48 – – 1.32 3.07 42.7 319.0S4 32.0 – – 0.47 1.26 – – 0.45 1.22 14.7 119.1S5 17.2 – – 0.32 0.67 – – 0.58 1.20 18.6 110.8S6 23.7 – – 0.95 1.94 – – 1.24 2.54 40.0 227.4S7 123.4 – – 0.95 2.01 – – 0.24 0.50 7.7 54.2S8 32.3 – – 0.25 0.66 – – 0.24 0.63 7.7 49.6S9 17.0 – – 0.17 0.44 – – 0.30 0.80 9.8 54.7
“–” denotes “data not available”.
98 P. Lin et al. / Marine Chemistry 157 (2013) 93–105
other estuarine systems, e.g., 1.24–1.55 mg-P/g in Delaware estuary(Lebo, 1991); 0.60–0.81 mg-P/g in Changjiang estuary (Yan andZhang, 2003), and the global average of 1.20 mg-P/g (Froelich, 1988).
3.3. Variations in chemical speciation of particulate P
In addition to measurements of PIP and POP, total particulate P wasoperationally divided into five particulate P species, including Labile-P,Fe-P, CFA-P, Detr-P and Org-P (Table 3). In surface waters, the concen-tration of Labile-P varied from 0.04 to 0.93 μM with an average of0.32 ± 0.34 μM, and Fe-P had an average concentration of 0.66 ±0.81 μM, ranging from 0.05 μM to 2.09 μM in the Jiulong River estuary.In general, concentrations of particulate apatite P were lower comparedwith the other three particulate P phases, ranging from 0.03 to 1.04 μMwith an average of 0.28 ± 0.34 μM for CFA-P, and varying from 0.02 to0.66 μMwith an average of 0.18 ± 0.23 μM for Detr-P (Table 3). Org-Phad an average concentration of 0.47 ± 0.50 μM, ranging from 0.06 to
Table 3Results of sequential extraction analyses with concentrations of different particulate P phases itrations of organic P in CFA-P fraction were below the detection limit during the sampling per
Sample ID Particle mass (mg) Labile-IP (μM) Labile-OP (μM) Labile-P (μM) IP/TP
Surface watersS1 17.7 0.84 0.09 0.93 91S2 32.5 0.76 0.06 0.82 92S3 14.8 0.39 0.06 0.45 87S4 6.5 0.15 0.04 0.19 76S5 5.8 0.14 0.05 0.19 74S6 4.9 0.09 0.04 0.13 68S7 8.7 0.07 BD 0.07 100S8 2.7 0.03 0.02 0.05 56S9 3.9 0.03 0.01 0.04 73
Bottom watersS1 14.1 0.50 0.03 0.53 95S2 11.5 0.72 0.04 0.76 95S3 10.9 0.53 0.05 0.58 91S4 10.6 0.24 0.02 0.26 93S5 6.0 0.11 0.01 0.12 92S6 8.5 0.18 0.02 0.20 91S7 37.0 0.14 0.01 0.15 92S8 13.2 0.05 0.01 0.06 92S9 8.0 0.04 0.02 0.06 61
“BD” denotes below the detection limit.
1.54 μM in surface waters. Overall, concentrations of all particulate Pspecies in surface waters decreased with increasing salinity, but anevident increase in CFA-P, Detr-P and Org-P occurred in lower andhigher salinity areas (Fig. 4).
For bottomwaters, all five particulate P species also showed a gener-al decrease with increasing salinity, with the highest concentration inriver waters and slightly elevated concentrations in the lower estuary(Fig. 4). Compared with surface waters, bottom waters generally hadhigher concentrations except for Labile-P (Table 3) and had a similarvariation trend for all particulate P species (Fig. 4).
Among the five particulate P species, Fe-P had the highest abun-dance in surface waters, comprising on average 30 ± 6% of the TPP,ranging from 22% at coastal stations to 42% at the river end-memberstation, followed by Org-P (28 ± 5%), Labile-P (18 ± 4%), CFA-P(15 ± 4%) and Detr-P (8 ± 2%). For bottom waters, Fe-P and Org-Pwere the two most abundant particulate P species, comprising 30 ±8% and 28 ± 4% of the TPP pool, respectively, followed by CFA-P
n surface and bottomwaters from the Jiulong River estuary duringMay 2010. The concen-iod. Errors of concentrations of particulate P species are ≤2%.
-Labile (%) OP/TP-Labile (%) Fe-P (μM) CFA-P (μM) Detr-P (μM) Org-P (μM)
9 2.09 0.59 0.44 0.988 2.00 1.04 0.66 1.54
13 0.79 0.40 0.22 0.6624 0.36 0.13 0.07 0.3226 0.27 0.13 0.06 0.2132 0.19 0.07 0.03 0.17BD 0.16 0.13 0.06 0.2544 0.05 0.03 0.02 0.0827 0.06 0.06 0.02 0.06
5 2.53 0.77 0.44 1.265 2.92 1.24 0.77 1.809 1.33 1.02 0.63 1.397 0.51 0.30 0.14 0.418 0.30 0.15 0.07 0.249 0.57 0.68 0.40 0.928 0.56 0.76 0.45 0.938 0.22 0.23 0.10 0.24
39 0.16 0.12 0.05 0.14

0
0.5
1
1.5
2
2.5
0 5 10 15 20 25 30
Sur
Lable-PFe-PCFA-PDetr-POrg-P
Par
ticu
late
P (
µM)
Salinity
0
0.2
0.4
0.6
0.8
1
0 5 10 15 20 25 30
Labile-PFe-PCFA-PDetr-POrg-P
Par
ticu
late
P (
mg-
P/g
)
Salinity
0
0.8
1.6
2.4
3.2
4
0 5 10 15 20 25 30
Bot
Labile-PFe-PCFA-PDetr-POrg-P
Par
ticu
late
P (
µM)
Salinity
0
0.5
1
1.5
2
2.5
0 5 10 15 20 25 30
Labile-PFe-PCFA-PDetr-POrg-P
Par
ticu
late
P (
mg-
P/g
)
Salinity
0
20
40
60
80
100
S=0.1 S=1 S=4.3 S=7.6 S=15 S=19 S=23 S=25 S=26
Labile-PFe-PCFA-PDetr-POrg-P
Per
cent
age
0
20
40
60
80
100
S=0 S=1 S=2.4 S=7.4 S=12 S=18 S=20 S=23 S=27
Labile-PFe-PCFA-PDetr-POrg-P
Per
cent
age
Fig. 4.Abundance and partitioning of different particulate P species (in μM andmg-P/g-particles) and their variations with salinity in surface (Sur, left panels) and bottomwaters(Bot, right panels) in the Jiulong River estuary.
99P. Lin et al. / Marine Chemistry 157 (2013) 93–105
(21 ± 5%) and Detr-P (11 ± 3%). Labile-P was the least abundantparticulate P species (10 ± 3%) in bottom waters, compared to 18 ±4% in surface waters (Fig. 4), suggesting the influence of sedimentresuspension on the particulate P composition in bottom waters, asalso supported by the relatively higher Detr-P abundance, especially atstations S6 and S7 in the Jiulong River estuary.
3.4. Results from mixing experiments
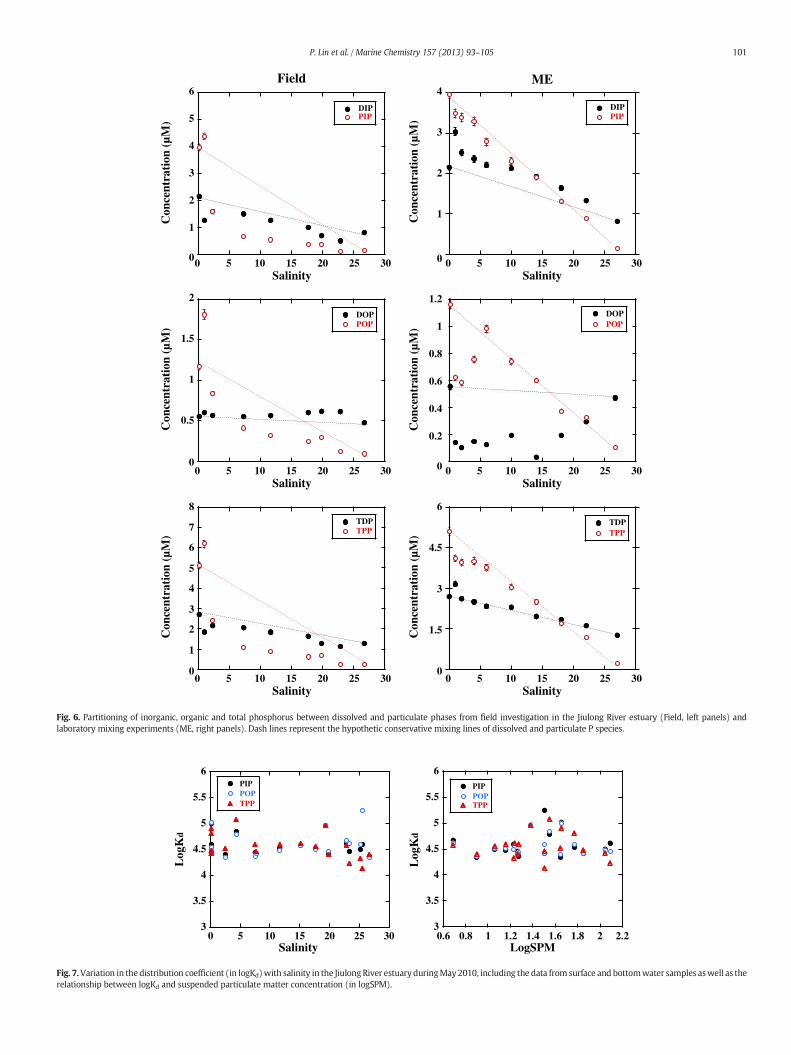
Results of the laboratory mixing experiment showed a significantaddition of DIP, especially when the salinity was b15, suggesting the re-lease of particulate P (Figs. 5 and 6, and see detailed discussion below).The DOP concentration demonstrated an initial dramatic decreaseshowing considerable removal of DOP before S = 15 (Fig. 5). Withinthe dissolved P pool, the DIP/TDP ratio was generally higher than theDOP/TDP ratio during the entire mixing experiment even though the
DIP/TDP ratio began to decrease when the salinity was higher than~20 (Fig. 5).
Accompanying the increase in DIP, concentrations of PIP decreasedwith increasing salinity during the laboratory mixing experiment(Fig. 6), showing an instantaneous transformation between PIP andDIP. However, the increase in DIP was not balanced out by the decreasein PIP during mixing, suggesting that the transformation betweenorganic and inorganic P species could also play a role in controllingthe partitioning and speciation of P in the estuary. As shown in Fig. 6,both POP and DOP had much lower abundance than DIP and PIP, andthey showed significant removal during mixing, especially DOP whensalinity was b5. This indicated that the loss of organic P species couldcontribute to the increase in DIP during mixing.
Interestingly, while specific P species had non-conservative mixingbehavior with a dynamic transformation between dissolved and partic-ulate, inorganic and organic phases, both TDP and TPP showed seeming-ly conservative behavior during laboratory mixing experiments, except

0
1
2
3
4
0
0.15
0.3
0.45
0.6
0 5 10 15 20 25 30
DIP DOP
DIP
(µM
) DO
P (µM
)
Salinity
0
20
40
60
80
100
0 5 10 15 20 25 30
%DIP%DOP
Per
cent
age
Salinity
0
0.5
1
1.5
2
2.5
0 5 10 15 20 25 30
Labile-PFe-PCFA-PDetr-POrg-P
Con
cent
rati
on (
µM)
Salinity
0
20
40
60
80
100
S=0 S=1 S=2 S=4 S=6 S=10 S=14 S=18 S=22 S=27
Labile-PFe-PCFA-PDetr-POrg-P
Per
cent
age
Fig. 5. Results of end-member river–seawatermixing experiments, showing the concentrations and partitioning of DIP and DOP, aswell as the concentrations and percentage of differentparticulate P species based on sequential extraction analyses.
100 P. Lin et al. / Marine Chemistry 157 (2013) 93–105
in the lower salinity region (Fig. 6). The overall decrease in TPP and in-crease in TDP in the lower salinity region during mixing experimentspointed to the fact that the upper estuary (S b 5)was themost dynamicregion where physicochemical processes were prevalent.
Similar to TPP or PIP, almost all particulate P species decreasedconsistently with increasing salinity, except Org-P (Fig. 5). However,the abundance of each particulate P species in the mixing experimentwas also variable, suggesting a dynamic transformation between differ-ent particulate P phases during mixing experiments.
3.5. Partitioning of P between dissolved and particulate phases
Considering both particulate and dissolved P phases, particulate Pwas the predominant phase in the total phosphorus pool (TP =TDP + TPP) at lower salinity stations (S b 5), ranging from 54% to77% for surface waters and from 69% to 71% for bottom waters (Fig. 3),indicating that riverine export of P was mainly in the particulate form.As salinity increased to N5, the TPP/TP ratio sharply decreased andTDP became the predominant P species in surface waters (Fig. 3). Forbottom waters, in addition to higher TPP/TP ratios at the river stationand lower salinity stations, elevated TPP/TP ratios were also observedin the lower estuary due to the influence of sediment resuspension(Fig. 3).
The partitioning of P between dissolved and particulate phases andits particle reactivity can be quantitatively evaluated using its distribu-tion coefficient (Kd). This approach has been used in previous studiesto examine the partitioning and adsorption behavior of P in differentaquatic environments (e.g., Morris, 1986; Santschi, 1995; Prastka
et al., 1998; Lin et al., 2012a). Similarly, Kd is defined as the partitioningof P between filtrate solution and filter retained particles in a givenP pool:
Kd ¼ Cp
Cd � SPM½ �
where Cp is the concentration of particulate P (μM); Cd is the concentra-tion of dissolved P in the organic, inorganic, or total P pool (μM);and SPM is the concentration of suspended particulate matter (kg/L org/mL). Thus, the dimension of Kd becomes mL/g or L/kg. Hereafter, Kd
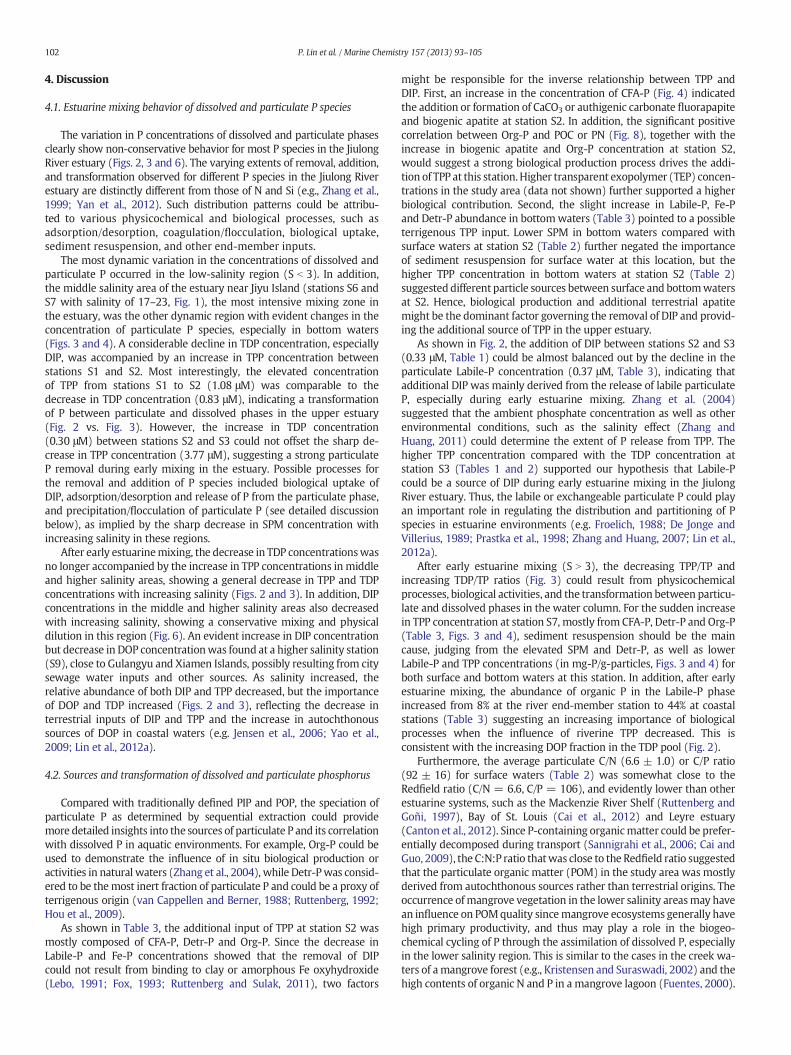
values are reported in logKd.logKd values of inorganic, organic, and total P changed little with
salinity in the Jiulong River estuary, ranging from 4.34 to 4.68 in surfacewaters (Fig. 7). For bottom waters, the resultant logKd values had arelatively higher variability, varying from 4.13 to 5.24, possibly due tothe effect of sediment resuspension, especially in the lower estuary(see discussion in previous sections). Although concentrations of TPPor TDP varied considerably (Figs. 2 and 3), nearly constant logKd valuesacross the whole salinity gradient in the Jiulong River estuary weresomewhat unexpected (Fig. 7) and different from other estuarieswhere the partitioning of P between dissolved and particulate phasescould be evidently affected by salinity (e.g., Caraco et al., 1990;Santschi, 1995; Turner and Tyler, 1997; Lin et al., 2012a), but agreedwell with previous reports for some estuarine systems (e.g., Fang,2000). Additionally, the average logKd value from both surface andbottom waters (4.57) was similar to those reported for the Humberestuary (4.51–4.66), Amazon estuary (4.62) and Tay estuary (4.89), ascompiled by Prastka et al. (1998).
0
1
2
3
4
5
6
0 5 10 15 20 25 30
Field
DIPPIP
Con
cent
rati
on (
µM)
Salinity
0
0.5
1
1.5
2
0 5 10 15 20 25 30
DOPPOP
Con
cent
rati
on (
µM)
Salinity
0
1
2
3
4
0 5 10 15 20 25 30
DIPPIP
Con
cent
rati
on (
µM)
ME
0
0.2
0.4
0.6
0.8
1
1.2
0 5 10 15 20 25 30
DOPPOP
Con
cent
rati
on (
µM)
0
1.5
3
4.5
6
0 5 10 15 20 25 30
TDPTPP
Con
cent
rati
on (
µM)
0
1
2
3
4
5
6
7
8
0 5 10 15 20 25 30
TDPTPP
Con
cent
rati
on (
µM)
Salinity
Salinity
Salinity
Salinity
Fig. 6. Partitioning of inorganic, organic and total phosphorus between dissolved and particulate phases from field investigation in the Jiulong River estuary (Field, left panels) andlaboratory mixing experiments (ME, right panels). Dash lines represent the hypothetic conservative mixing lines of dissolved and particulate P species.
3
3.5
4
4.5
5
5.5
6
0 5 10 15 20 25 30
PIPPOPTPP
Log
Kd
Salinity
3
3.5
4
4.5
5
5.5
6
0.6 0.8 1 1.2 1.4 1.6 1.8 2 2.2
PIPPOPTPP
Log
Kd
LogSPM
Fig. 7.Variation in the distribution coefficient (in logKd)with salinity in the JiulongRiver estuary duringMay2010, including the data from surface and bottomwater samples aswell as therelationship between logKd and suspended particulate matter concentration (in logSPM).
101P. Lin et al. / Marine Chemistry 157 (2013) 93–105
102 P. Lin et al. / Marine Chemistry 157 (2013) 93–105
4. Discussion
4.1. Estuarine mixing behavior of dissolved and particulate P species
The variation in P concentrations of dissolved and particulate phasesclearly show non-conservative behavior for most P species in the JiulongRiver estuary (Figs. 2, 3 and 6). The varying extents of removal, addition,and transformation observed for different P species in the Jiulong Riverestuary are distinctly different from those of N and Si (e.g., Zhang et al.,1999; Yan et al., 2012). Such distribution patterns could be attribu-ted to various physicochemical and biological processes, such asadsorption/desorption, coagulation/flocculation, biological uptake,sediment resuspension, and other end-member inputs.
The most dynamic variation in the concentrations of dissolved andparticulate P occurred in the low-salinity region (S b 3). In addition,the middle salinity area of the estuary near Jiyu Island (stations S6 andS7 with salinity of 17–23, Fig. 1), the most intensive mixing zone inthe estuary, was the other dynamic region with evident changes in theconcentration of particulate P species, especially in bottom waters(Figs. 3 and 4). A considerable decline in TDP concentration, especiallyDIP, was accompanied by an increase in TPP concentration betweenstations S1 and S2. Most interestingly, the elevated concentrationof TPP from stations S1 to S2 (1.08 μM) was comparable to thedecrease in TDP concentration (0.83 μM), indicating a transformationof P between particulate and dissolved phases in the upper estuary(Fig. 2 vs. Fig. 3). However, the increase in TDP concentration(0.30 μM) between stations S2 and S3 could not offset the sharp de-crease in TPP concentration (3.77 μM), suggesting a strong particulateP removal during early mixing in the estuary. Possible processes forthe removal and addition of P species included biological uptake ofDIP, adsorption/desorption and release of P from the particulate phase,and precipitation/flocculation of particulate P (see detailed discussionbelow), as implied by the sharp decrease in SPM concentration withincreasing salinity in these regions.
After early estuarinemixing, the decrease in TDP concentrationswasno longer accompanied by the increase in TPP concentrations in middleand higher salinity areas, showing a general decrease in TPP and TDPconcentrations with increasing salinity (Figs. 2 and 3). In addition, DIPconcentrations in the middle and higher salinity areas also decreasedwith increasing salinity, showing a conservative mixing and physicaldilution in this region (Fig. 6). An evident increase in DIP concentrationbut decrease in DOP concentrationwas found at a higher salinity station(S9), close to Gulangyu and Xiamen Islands, possibly resulting from citysewage water inputs and other sources. As salinity increased, therelative abundance of both DIP and TPP decreased, but the importanceof DOP and TDP increased (Figs. 2 and 3), reflecting the decrease interrestrial inputs of DIP and TPP and the increase in autochthonoussources of DOP in coastal waters (e.g. Jensen et al., 2006; Yao et al.,2009; Lin et al., 2012a).
4.2. Sources and transformation of dissolved and particulate phosphorus
Compared with traditionally defined PIP and POP, the speciation ofparticulate P as determined by sequential extraction could providemore detailed insights into the sources of particulate P and its correlationwith dissolved P in aquatic environments. For example, Org-P could beused to demonstrate the influence of in situ biological production oractivities in natural waters (Zhang et al., 2004), while Detr-Pwas consid-ered to be themost inert fraction of particulate P and could be a proxy ofterrigenous origin (van Cappellen and Berner, 1988; Ruttenberg, 1992;Hou et al., 2009).
As shown in Table 3, the additional input of TPP at station S2 wasmostly composed of CFA-P, Detr-P and Org-P. Since the decrease inLabile-P and Fe-P concentrations showed that the removal of DIPcould not result from binding to clay or amorphous Fe oxyhydroxide(Lebo, 1991; Fox, 1993; Ruttenberg and Sulak, 2011), two factors
might be responsible for the inverse relationship between TPP andDIP. First, an increase in the concentration of CFA-P (Fig. 4) indicatedthe addition or formation of CaCO3 or authigenic carbonate fluorapapiteand biogenic apatite at station S2. In addition, the significant positivecorrelation between Org-P and POC or PN (Fig. 8), together with theincrease in biogenic apatite and Org-P concentration at station S2,would suggest a strong biological production process drives the addi-tion of TPP at this station.Higher transparent exopolymer (TEP) concen-trations in the study area (data not shown) further supported a higherbiological contribution. Second, the slight increase in Labile-P, Fe-Pand Detr-P abundance in bottomwaters (Table 3) pointed to a possibleterrigenous TPP input. Lower SPM in bottom waters compared withsurface waters at station S2 (Table 2) further negated the importanceof sediment resuspension for surface water at this location, but thehigher TPP concentration in bottom waters at station S2 (Table 2)suggested different particle sources between surface and bottomwatersat S2. Hence, biological production and additional terrestrial apatitemight be the dominant factor governing the removal of DIP and provid-ing the additional source of TPP in the upper estuary.
As shown in Fig. 2, the addition of DIP between stations S2 and S3(0.33 μM, Table 1) could be almost balanced out by the decline in theparticulate Labile-P concentration (0.37 μM, Table 3), indicating thatadditional DIP was mainly derived from the release of labile particulateP, especially during early estuarine mixing. Zhang et al. (2004)suggested that the ambient phosphate concentration as well as otherenvironmental conditions, such as the salinity effect (Zhang andHuang, 2011) could determine the extent of P release from TPP. Thehigher TPP concentration compared with the TDP concentration atstation S3 (Tables 1 and 2) supported our hypothesis that Labile-Pcould be a source of DIP during early estuarine mixing in the JiulongRiver estuary. Thus, the labile or exchangeable particulate P could playan important role in regulating the distribution and partitioning of Pspecies in estuarine environments (e.g. Froelich, 1988; De Jonge andVillerius, 1989; Prastka et al., 1998; Zhang and Huang, 2007; Lin et al.,2012a).
After early estuarine mixing (S N 3), the decreasing TPP/TP andincreasing TDP/TP ratios (Fig. 3) could result from physicochemicalprocesses, biological activities, and the transformation between particu-late and dissolved phases in the water column. For the sudden increasein TPP concentration at station S7, mostly from CFA-P, Detr-P and Org-P(Table 3, Figs. 3 and 4), sediment resuspension should be the maincause, judging from the elevated SPM and Detr-P, as well as lowerLabile-P and TPP concentrations (in mg-P/g-particles, Figs. 3 and 4) forboth surface and bottom waters at this station. In addition, after earlyestuarine mixing, the abundance of organic P in the Labile-P phaseincreased from 8% at the river end-member station to 44% at coastalstations (Table 3) suggesting an increasing importance of biologicalprocesses when the influence of riverine TPP decreased. This isconsistent with the increasing DOP fraction in the TDP pool (Fig. 2).
Furthermore, the average particulate C/N (6.6 ± 1.0) or C/P ratio(92 ± 16) for surface waters (Table 2) was somewhat close to theRedfield ratio (C/N = 6.6, C/P = 106), and evidently lower than otherestuarine systems, such as the Mackenzie River Shelf (Ruttenberg andGoñi, 1997), Bay of St. Louis (Cai et al., 2012) and Leyre estuary(Canton et al., 2012). Since P-containing organicmatter could be prefer-entially decomposed during transport (Sannigrahi et al., 2006; Cai andGuo, 2009), the C:N:P ratio thatwas close to the Redfield ratio suggestedthat the particulate organic matter (POM) in the study area was mostlyderived from autochthonous sources rather than terrestrial origins. Theoccurrence ofmangrove vegetation in the lower salinity areasmay havean influence on POMquality sincemangrove ecosystems generally havehigh primary productivity, and thus may play a role in the biogeo-chemical cycling of P through the assimilation of dissolved P, especiallyin the lower salinity region. This is similar to the cases in the creek wa-ters of amangrove forest (e.g., Kristensen and Suraswadi, 2002) and thehigh contents of organic N and P in a mangrove lagoon (Fuentes, 2000).

0
40
80
120
160
200
0 0.4 0.8 1.2 1.6 2
y = 9.12 + 90.0x R2= 0.92
POC
(µM
)
Org-P (µM)
0
4
8
12
16
20
0 0.4 0.8 1.2 1.6 2
y = 2.39 + 10.2x R2= 0.84
PN (
µM)
Org-P (µM)
Fig. 8. Relationship between Org-P and particulate organic carbon (POC) or particulate nitrogen (PN) in the Jiulong River estuary during May 2010.
103P. Lin et al. / Marine Chemistry 157 (2013) 93–105
4.3. Comparisons between field studies and laboratory mixing experiments
As shown in Fig. 6 and the deviations from the hypothetic conserva-tive mixing lines, the specific addition/removal of P species and theiroverall mixing behavior in the Jiulong River estuary could not be entire-ly simulated with the short-term laboratory mixing experiments, espe-cially for the processes such as the removal of DIP and strong particlesettling in the upper estuary, as well as the sediment resuspensionand biological processes in the lower estuary. The difference in resultsbetween the field studies and laboratorymixing experiments suggestedthat the mixing behavior of P in the Jiulong River estuary was not solelycontrolled by physicochemical processes. Instead, biological and longerterm processes, sediment resuspension, and additional end-memberwaters from north of Xiamen Island may all play a role in regulatingthe concentration, speciation, and distribution of P species in the JiulongRiver estuary. For example, the distinct variation pattern of POP (Fig. 6)or Org-P (Fig. 4 vs. Fig. 5) between field and laboratory studies alsosupported the linkage between organic P and biological processes inthe Jiulong River estuary (Fig. 8).
Short-term laboratory mixing experiments have been used to simu-late estuarine mixing and to examine key processes in regulatingmixing behavior of different chemical species (e.g. Wang et al., 2010;Lin et al., 2012a). In a previous study, little difference was observed forthe mixing behavior of P species between field studies and laboratoryexperiments in the Bay of St Louis in the northern Gulf of Mexico(Lin et al., 2012a). As pointed out above, the Jiulong River has experi-enced increasing anthropogenic influence over the past several decades.In contrast, the Jourdan andWolf rivers, both discharging into the Bay ofSt. Louis, remained rather pristine with much lower DIP abundance.Thus, in addition to physical conditions such as mixing/flushing time,and primary production in a specific estuary, the abundance of DIPand particulate P composition in river end-member and coastal watersare likely important factors controlling the mixing behavior of P in theJiulong River estuary.
4.4. Variations in distribution coefficient (Kd) and its relation to theconcentration of suspended particles
The partitioning of P between particulate and dissolved phases maybe largely determined by the chemical properties and the compositionsof particulate P or biological processes in the estuary. The correlationbetween Kd values and salinity might depend on the flushing time ofestuarine waters. For example, Caraco et al. (1990) and Lin et al.(2012a) have shown a decrease in logKd values of P with increasingsalinity in estuaries with shorter flushing times compared with thetime-scale of equilibrium between dissolved and particulate P (Morris,1990). Thus, less variable Kd values of P in the Jiulong River estuary
might result from the relatively longer flushing time of estuarinewaters, as also observed in other estuaries (e.g., Fox et al., 1986; Fang,2000) and relatively high concentrations of DIP in the water column.In addition, even though concentrations of different particulate Pspecies varied sharply with salinity, the relative abundance of eachparticulate P species in the TPP pool changed little (Section 3.3, Fig. 4),suggesting little change in particle composition along the salinity gradi-ent and thus similar Kd values in the Jiulong River estuary (Fig. 7).
Furthermore, logKd values had a weak correlationwith SPM concen-tration (in logSPM, Fig. 7), showing a weak “particle concentrationeffect” on the partitioning of P in the Jiulong River estuary. This is some-what different from those observed for other estuarine systems(e.g., Balls, 1989; Santschi, 1995; Lin et al., 2012a). Weak particle con-centration effect observed here also suggested a minor role of colloidalmaterials in the partitioning of P between particulate and dissolvedphases, consistent with generally low colloidal P abundance in theJiulong River estuary (Chen et al., 2010; Cai et al., unpublished data).
4.5. Changing mixing behavior of P in the estuary
Elevated inputs of P and other nutrients through river to estuarineand coastal environments could result in “cultural eutrophication”,and thus lead to considerable attention to changing biogeochemicalbehavior of P in estuarine systems with increasing anthropogenic influ-ence (Ruttenberg, 2003; Stathan, 2011). Results of our field study in theJiulong River estuary clearly showed a strong riverine DIP source, ageneral removal of DIP during early estuarine mixing, and conservativemixing behavior after early estuarine mixing (Figs. 2 and 6), similar toestuaries with anthropogenic influences, such as the Humber andTanshui river estuaries and the Mississippi River plume (e.g., Prastkaand Malcolm, 1994; Fang, 2000; Shim et al., 2012), but distinctly differ-ent from more pristine estuaries, such as the Bay of St. Louis and Leyreestuary (e.g., Canton et al., 2012; Lin et al., 2012a). Even though theslight addition or release of DIP from labile and exchangeable particu-late P species occurred during early estuarine mixing (see Section 4.2),the extent of DIP addition or the buffering of DIP concentrations bysuspended particulate matter (i.e., “P-buffering” mechanism) was evi-dently reduced and became insignificant in most areas of the estuary,compared with the observation in more pristine estuaries (e.g., Linet al., 2012a) and the Jiulong River estuary before the recent economicdevelopment over the past 20 years (e.g., Yang et al., 1998; Zhanget al., 1999; Yan et al., 2012). Additionally, since the release of DIPcould be seen in the laboratory experiment (see Section 3.4), as inmore pristine estuaries (e.g., Lin et al., 2012a), rapid removal of particu-late P in the upper Jiulong River estuarymight be another factor respon-sible for the lack of a “P-buffering” mechanism in the study area.Consequently, in general, increasing DIP inputs and human impacts on

104 P. Lin et al. / Marine Chemistry 157 (2013) 93–105
the Jiulong River estuary had evidently reduced the relative role ofphysicochemical processes and buffering capacity of particulate Pduring estuarine mixing and thus altered the transformation andmixing behavior of P species in the estuary. This is consistent with re-sults observed in the Chesapeake Bay (Conley et al., 1995) and resultsfrom model prediction (Prastka et al., 1998).
5. Conclusions
The distribution and partitioning of P species and their mixingbehavior in the Jiulong River estuary were investigated during May2010. Phosphate (DIP) was the dominant species in the total dissolvedP pool in both surface (66 ± 10%) and bottom waters (63 ± 21%),while DOP predominated only at a coastal station, reflecting a profoundinfluence of anthropogenic inputs from the Jiulong River. Compared tohistorical data, the concentration of DIP in Jiulong River waters seemedto increase continuously with time, suggesting an increasing impact ofnutrients on coastal waters off the Jiulong River estuary.
The DIP concentration generally decreased with increasing salinity,showing removal in lower (S b 3) salinity regions but conservativemixing in middle and higher salinity regions. In contrast, DOP concen-tration was highly variable with a general increase in the DOP/TDPratio with increasing salinity. The highest (up to 82%) and dramaticallydecreasing TPP/TP ratio in lower salinity areas as well as the negativecorrelation between TPP and DIP or TDP support a strong river inputof particulate P and an intensive transformation between P speciesduring estuarine mixing, although less so in middle and higher salinityregions. Phase speciation of particulate P characterized using thesequential extraction technique elucidated a biological source for CFA-Pand Org-P, a terrestrial input for Detr-P, and a release of P from theLabile-P phase, especially in the upper estuary.
Most P species behaved non-conservatively during estuarinemixingin both field studies and laboratory experiments, showing a dynamictransformation between dissolved and particulate organic and inorgan-ic P species in the Jiulong River estuary. However, the apparent mixingbehavior of P species observed during short-term laboratory experi-ments was not the same as that observed in the field with a longerflushing time. It seemed that, in addition to physicochemical processes,strong riverine inputs, biological processes, and hydrological condi-tions/sediment resuspension all play a role in controlling the mixingbehavior of P species and their biogeochemical cycling in the JiulongRiver estuary. Values of distribution coefficient of P (in terms of logKd)changed little with salinity in the estuary. A poor correlation betweenlogKd and logSPM or a weak “particle concentration effect” was foundin the Jiulong River estuary, consistent with the relatively constantlogKd values, long estuarine flushing time, and low colloidal abundancein the study area. Overall, the elevated input of P and increasing anthro-pogenic influences may alter the transformation mechanism between Pspecies and the mixing behavior of P in the Jiulong River estuary.
Acknowledgments
We gratefully acknowledge Lili Ma and Liangshi Lin for their assis-tance during sample collection, Feng Lin, Wangjiang Hu and WentaoHe for their help in sample processing and analyses, Dr. Weidong GuoandXiuli Yan for discussion, andDr. Sarah Cooley atWoods Hole Ocean-ographic Institution for technical editing. We also thank the AssociateEditor, Dr. Claudia Benitez-Nelson, and two anonymous reviewers fortheir constructive comments, which improved the presentation of themanuscript. Thisworkwas supported in part by ChineseNatural ScienceFoundation (#40906040 and #41125020), State Oceanic Administra-tion of China through a special scientific research project for publicwelfare (#2010050012-3), U.S. NSF (OCE #0850957), Natural ScienceFoundation of Fujian Province (2011J01277), and the FundamentalResearch Funds for the Central Universities of China.
References
Aspila, K.I., Agemian, H., Chau, A.S.Y., 1976. A semi-automatedmethod for the determinationof inorganic, organic and total phosphate in sediments. Analyst 101, 187–197.
Balls, P.W., 1989. The partition of trace metals between dissolved and particulate phasesin European coastal waters: a compilation of field data and comparison with laboratorystudies. Neth. J. Sea Res. 23, 7–14.
Benitez-Nelson, C.R., 2000. The biogeochemical cycling of phosphorus in marine systems.Earth Sci. Rev. 51, 109–135.
Boesch, D.F., Boynton, W.R., Crowder, L.B., Diaz, R.J., Howarth, R.W., Mee, L.D., Nixon, S.W.,Rabalais, N.N., Rosenberg, R., Sanders, J.G., Scavia, D., Turner, R.E., 2009. Nutrientenrichment drives Gulf of Mexico hypoxia. Eos 90, 117–118.
Cai, Y., Guo, L., 2009. Abundance and variation of colloidal organic phosphorus in riverine,estuarine and coastal waters in the northern Gulf of Mexico. Limnol. Oceanogr. 54,1393–1402.
Cai, Y., Guo, L., Douglas, T.,Whitledge, T., 2008. Seasonal variations in nutrient concentrationsand speciation in the Chena River, Alaska. J. Geophys. Res. 113, G030035.http://dx.doi.org/10.1029/2008JG000733.
Cai, Y., Guo, L., Wang, X., Mojzis, A.K., Redalje, D.G., 2012. The source and distribution ofdissolved and particulate organic matter in the Bay of St. Louis, northern Gulf ofMexico. Estuar. Coast. Shelf Sci. 96, 96–104.
Canton, M., Anschutz, P., Poirier, D., Chassagne, R., Deborde, J., Savoye, N., 2012. Thebuffering capacity of a small estuary on nutrient fluxes originating from catchment(Leyre estuary, SW France). Estuar. Coast. Shelf Sci. 99, 171–181.
Cao, W., Hong, H., Yue, S., 2005. Modelling agricultural nitrogen contributions to theJiulong River estuary and coastal water. Global Plant. Change 47, 111–121.
Caraco, N., Cole, J., Likens, G.E., 1990. A comparison of phosphorus immobilization insediments of freshwater and coastal marine systems. Biogeochemistry 9, 277–290.
Chen, M., Guo, L., Ma, Q., Qiu, Y., Zhang, R., Lv, E., Huang, Y., 2006. Zonal patterns of 13C,15N and 210Po in the tropical and subtropical North Pacific. Geophys. Res. Lett. 33,L04609. http://dx.doi.org/10.1029/2005GL025186.
Chen, D., Zheng, A., Chen, M., 2010. Study of colloidal phosphorus variation in estuarywith salinity. Acta Oceanol. Sin. 29, 17–25.
Conley, D.J., Smith, W.M., Cornwell, J.C., Fisher, T.R., 1995. Transformation of particle-boundphosphorus at the land-sea interface. Estuar. Coast. Shelf Sci. 40, 161–176.
Dagg, M., Ammerman, J., Amon, R., Gardner, W., Green, R., Lohrenz, S., 2007. A review ofwater column processes influencing hypoxia in the northern Gulf of Mexico.Estuar. Coasts 30, 735–752.
De Jonge, V.N., Villerius, L.A., 1989. Possible role of carbonate dissolution in estuarinephosphorus dynamics. Limnol. Oceanogr. 34, 332–340.
Duan, S.W., et al., 2008. Seasonal changes in nitrogen and phosphorus transport in thelower Changjiang River before the construction of the Three Gorges Dam. Estuar.Coast. Shelf Sci. 79, 239–250.
Fang, T.H., 2000. Partitioning and behaviour of different forms of phosphorus in theTanshui Estuary and one of its tributaries, Northern Taiwan. Estuar. Coast. Shelf Sci.50, 689–701.
Faul, K.L., Paytan, A., Delaney, M.L., 2005. Phosphorus distribution in sinking oceanicparticulate matter. Mar. Chem. 97, 307–333.
Fox, L.E., 1993. The chemistry of aquatic phosphate: inorganic processes in rivers.Hydrobiologia 253, 1–16.
Fox, L.E., Sager, S.L., Wofsy, S.C., 1986. The chemical control of soluble phosphorus in theAmazon estuary. Geochim. Cosmochim. Acta 50, 783–794.
Froelich, P.N., 1988. Kinetic control of dissolved phosphate in natural rivers and estuaries:a primer on the phosphate buffer mechanism. Limnol. Oceanogr. 33, 649–668.
Fuentes, H.M.V., 2000. Nitrogen, phosphorus and the C/N ratio in superficial sediments ofthe lagoon of Chacopata, Sucre, Venezuela. Rev. Biol. Trop. 48, 261–268.
Guo, L., Macdonald, R.W., 2006. Source and transport of terrigenous organic matter in theupper Yukon River: evidence from isotope (δ13C, Δ14C, and δ15N) composition ofdissolved, colloidal, and particulate phases. Global Biogeochem. Cycles 20, GB2011.
Guo, L., Zhang, J.-.Z., Guéguen, C., 2004. Speciation and fluxes of nutrients (N, P, Si)from the upper Yukon River. Global Biogeochem. Cycles 18 (1), GB1038.http://dx.doi.org/10.1029/2003GB2152.
Guo, L., Cai, Y., Belzile, C., Macdonald, R.W., 2012. Sources and export fluxes of inorganicand organic carbon and nutrient species from the seasonally ice-covered YukonRiver. Biogeochemistry 107, 187–206.
Hou, L.J., Liu, M., Yang, Y., Ou, D.N., Lin, X., Chen, H., Xu, S.Y., 2009. Phosphorus speciationand availability in intertidal sediments of the Yangtze Estuary, China. Appl. Geochem.24, 120–128.
Howarth, R.W., Jensen, H.S., Marino, R., Postma, H., 1995. Transport to and processing of Pin near-shore and oceanic waters. In: Tiessen, H. (Ed.), Phosphorus in the GlobalEnvironment. Transfers, Cycles and Management. Wiley, West Sussex, pp. 323–346.
Huang, X., 2008. Hydrological characteristics in the Jiulong watershed (in Chinese).Sci. Technol. Water Res. 1, 16–20.
Huang, X.-L., Zhang, J.-Z., 2010. Spatial variation in sediment-water exchange of phosphorusin Florida Bay: AMP as amodel organic compound. Environ. Sci. Technol. 44, 7790–7795.http://dx.doi.org/10.1021/es100057r.
Jensen, H., Bendixen, T., Andersen, F., 2006. Transformation of particle-bound phosphorusat the land–sea interface in a Danish Estuary. Water Air Soil Pollut. Focus 6, 547–555.
Karl, D., Björkman, K.M., 2001. Phosphorus cycle in seawater: dissolved and particulatepool inventories and selected phosphorus fluxes. Methods Microbiol. 30, 239–270.
Kolowith, L.C., Ingall, E.D., Benner, R., 2001. Composition and cycling of marine organicphosphorus. Limnol. Oceanogr. 46 (2), 309–320.
Koroleff, F., 1983. Determination of phosphorus. In: Grasshoff, K., Kremling, K., Ehrhardt,M. (Eds.), Methods of Seawater Analysis. Verlag Chemie, pp. 167–173.
Kristensen, E., Suraswadi, P., 2002. Carbon, nitrogen and phosphorus dynamics in creekwater of a southeast Asian mangrove forest. Hydrobiologia 474, 197–211.

105P. Lin et al. / Marine Chemistry 157 (2013) 93–105
Lebo, M.E., 1991. Particle-bound phosphorus along an urbanized coastal plain estuary.Mar. Chem. 34, 225–246.
Lin, P., Chen, M., Guo, L., 2012a. Speciation and transformation of phosphorus and itsmixing behavior in the Bay of St. Louis estuary in the northern Gulf of Mexico.Geochim. Cosmochim. Acta 87, 283–298. http://dx.doi.org/10.1016/j.gca.2012.03.040.
Lin, P., Guo, L., Chen, M., Tong, J., Lin, F., 2012b. The distribution and chemical speciation ofdissolved and particulate phosphorus in the Bering Sea and the Chukchi-Beaufortseas. Deep-Sea Res. II 81/84, 79–94. http://dx.doi.org/10.1016/j.dsr2.2012.07.005.
Mayer, L.M., Keil, R.G., Macko, S.A., Joye, S.B., Ruttenberg, K.C., Aller, R.C., 1998. Importanceof suspended particulates in riverine delivery of bioavailable nitrogen to coastalzones. Global Biogeochem. Cycles 12, 573–579.
Meybeck, M., Cauwet, G., Dessery, S., Somville, M., Gouleau, D., Billen, G., 1988. Nutrients(Organic C, P, N, Si) in the eutrophic river Loire (France) and its estuary. Estuar. Coast.Shelf Sci. 27, 595–624.
Monbet, P., McKelvie, I.D., Worsfold, P.J., 2009. Dissolved organic phosphorus speciation inthe waters of the Tamar estuary (SW England). Geochim. Cosmochim. Acta 73,1027–1038.
Morris, A.W., 1986. Removal of trace metals in the very low salinity region of the TamarEstuary, England. Sci. Total. Environ. 49, 297–304.
Morris, A.W., 1990. Kinetic and equilibrium approaches to estuarine chemistry. Sci. Total.Environ. 97/98, 253–266.
Mortazavi, B., Iverson, R.L., Landing, W.M., Huang, W., 2000. Phosphorus budget ofApalachicola Bay: a river-dominated estuary in the northeastern Gulf of Mexico.Mar. Ecol. Prog. Ser. 198, 33–42.
Pan, K., Wang, W.-X., 2012. Trace metal contamination in estuarine and coastalenvironments in China. Sci. Total. Environ. 421/422, 3–16.
Parsons, T.R., Maita, Y., Lalli, C.M., 1984. A Manual of Chemical and Biological Methods forSeawater Analysis. Pergamon Press, New York.
Paytan, A., McLaughlin, K., 2007. The oceanic phosphorus cycle. Chem. Rev. 107, 563–576.http://dx.doi.org/10.1021/cr0503613.
Prastka, K., Malcolm, S., 1994. Particulate phosphorus in the Humber estuary.Neth. J. Aquat. Ecol. 28 (3–4), 397–403.
Prastka, K., Sanders, R., Jickells, T., 1998. Has the role of estuaries as sources or sinks ofdissolved inorganic phosphorus changed over time? Results of a Kd study.Mar. Pollut.Bull. 36, 718–728.
Rabalais, N.N., Turner, R.E., Dortch, Q., Justic, D., Bierman Jr., V.J., Wiseman Jr., W.J., 2002.Nutrient-enhanced productivity in the northern Gulf of Mexico: past, present andfuture. Hydrobiologia 475/476, 39–63.
Ruttenberg, K.C., 1992. Development of a sequential extraction method for differentforms of phosphorus in marine sediments. Limnol. Oceanogr. 37, 1460–1482.
Ruttenberg, K.C., 2003. The global phosphorus cycle. In: Schlesinger, W.H., Holland, H.D.,Turekian, K.K. (Eds.), Treatise on Geochemistry, 8. Elsevier, pp. 585–643.
Ruttenberg, K.C., Goñi, M.A., 1997. Phosphorus distribution, C:N:P ratios, and δ13Cocin arctic, temperate, and tropical coastal sediments: tools for characterizing bulksedimentary organic matter. Mar. Geol. 139, 123–145.
Ruttenberg, K.C., Sulak, D.J., 2011. Sorption and desorption of dissolved organic phosphorusonto iron (oxyhydr)oxides in seawater. Geochim. Cosmochim. Acta 75, 4095–4112.
Sannigrahi, P., Ingall, E.D., Benner, R., 2006. Nature and dynamics of phosphorus-containing components of marine dissolved and particulate organic matter.Geochim. Cosmochim. Acta 70, 5868–5882.
Santschi, P.H., 1995. Seasonality in nutrient concentrations in Galveston Bay.Mar. Environ. Res. 40, 337–362.
Shen, Z., Zhou, S., Pei, S., 2008. Transfer and transport of phosphorus and silica in the tur-bidity maximum zone of the Changjiang estuary. Estuar. Coast. Shelf Sci. 78, 481–492.
Shim, M.J., Swarzenski, P.W., Shiller, A.M., 2012. Dissolved and colloidal trace elements in theMississippi River delta outflow after Hurricanes Katrina and Rita. Cont. Shelf Res. 42, 1–9.
Solórzano, L., Sharp, J.H., 1980. Determination of total dissolved phosphorus and particulatephosphorus in natural waters. Limnol. Oceanogr. 25, 754–758.
Stathan, P.J., 2011. Nutrients in estuaries—an overview and the potential impacts ofclimate change. Sci. Total. Environ. 434, 213–227. http://dx.doi.org/10.1016/j.scitotenv.2011.09.088.
Sylvan, J.B., Dortch, Q., Nelson, D.M., Maier Brown, A.F., Morrison, W., Ammerman, J.W.,2006. Phosphorus limits phytoplankton growth on the Louisiana Shelf during theperiod of hypoxia formation. Environ. Sci. Technol. 40, 7548–7553.
Turner, A., Tyler, A.O., 1997. Modeling adsorption and desorption processes in estuaries.In biochemistry of intertidal sediments. In: Jickeslls, T.D., Rae, J.E. (Eds.), CambridgeUniversity Press, Cambridge, U.K, pp. 42–58.
Turner, R.E., Rabalais, N.N., Justic, D., Dortch, Q., 2003. Global patterns of dissolved N, P andSi in large rivers. Biogeochemistry 64, 297–317.
van Cappellen, P., Berner, R.A., 1988. Amathematical model for the early diagenesis of phos-phorus and fluorine inmarine sediments: apatite precipitation. Am. J. Sci. 288, 289–333.
van der Zee, C., Slomp, C.P., van Raaphorst, W., 2002. Authigenic P formation and totalreactive P burial in sediments of the Nazare canyon on the Iberianmargin (NE Atlantic).Mar. Geol. 185, 379–392.
van der Zee, C., Roevros, N., Chou, L., 2007. Phosphorus speciation, transformation andretention in the Scheldt estuary (Belgium/The Netherlands) from the freshwatertidal limits to the North Sea. Mar. Chem. 106, 76–91.
Wang, X., Cai, Y., Guo, L., 2010. Preferential removal of dissolved carbohydrates duringestuarine mixing in the Bay of Saint Louis in the northern Gulf of Mexico.Mar. Chem. 119, 130–138.
Yan, W., Zhang, S., 2003. The composition and bioavailability of phosphorus transportthrough the Changjiang (Yangtze) River during the 1998 flood. Biogeochemistry 65,179–194.
Yan, X., Zhai, W., Hong, H., Guo, W., Huang, X., 2012. Distribution, fluxes and decadalchanges of nutrients in the Jiulong River Estuary, Southwest Taiwan Strait. ChineseSci. Bull. 57 (18), 2307–2318. http://dx.doi.org/10.1007/s11434-012-5084-4.
Yang, Y., Hu, M., Chen, H., Song, R., 1998. Behavior and flux of bioavailable phosphorus inthe Jiulong River Estuary (in Chinese). J. Oceanogr. Taiwan Strait 17 (3), 269–274.
Yao, Q.-Z., Yu, Z.-G., Chen, H.-T., Liu, P.-X., Mi, T.-Z., 2009. Phosphorus transport andspeciation in the Changjiang (Yangtze River) system. Appl. Geochem. 24, 2186–2194.
Zhang, J.-Z., Huang, X.-L., 2007. Relative importance of solid-phase phosphorus and iron insorption behavior of sediments. Environ. Sci. Technol. 41 (8), 2789–2795.http://dx.doi.org/10.1021/es061836q.
Zhang, J.-Z., Huang, X.-L., 2011. Effect of temperature and salinity on phosphate sorptionon marine sediments. Environ. Sci. Technol. 45, 6831–6837. http://dx.doi.org/10.1021/es200867p.
Zhang, Y., Wang, W., Huang, Z., 1999. Salinity fronts and chemical behavior of nutrients inthe Jiulong River Estuary (in Chinese). Mar. Environ. Sci. 4, 1–7.
Zhang, J.-Z., Fischer, C.J., Ortner, P.B., 2004. Potential availability of sedimentary phosphorusto sediment resuspension in Florida Bay. Global Biogeochem. Cycles 18, GB4008.http://dx.doi.org/10.1029/2004GB002255.
Zhang, J.-Z., Guo, L., Fischer, C., 2010. Abundance and chemical speciation of phosphorusin sediments of the Mackenzie River Delta, the Chukchi Sea and the Bering Sea:Importance of detrital apatite. Aquat. Geochem. 16, 353–371.