Spatio-temporal variations in surface characteristics over the North American Monsoon region
9
Spatio-temporal variations in surface characteristics over the North American Monsoon region Carlos Liza ´ rraga-Celaya a, * , Christopher J. Watts a , Julio C. Rodrı ´guez b , Jaime Garatuza-Paya ´n d , Russell L. Scott e , Juan Sa ´ iz-Herna ´ ndez c a Departmento de Fı ´sica, Universidad de Sonora, Blvd. Encinas y Rosales, Col. Centro, Hermosillo, Sonora 83000, Mexico b Departmento de Agricultura y Ganaderı ´a, Universidad de Sonora, Blvd. Encinas y Rosales, Col. Centro, Hermosillo, Sonora 83000, Mexico c Departmento de Ingenierı ´a Civil y Minas, Universidad de Sonora, Blvd. Encinas y Rosales, Col. Centro, Hermosillo, Sonora 83000, Mexico d Ciencias del Agua y del Medio Ambiente, Instituto Tecnolo ´gico de Sonora, Cd. Obrego ´n, Sonora 85000, Mexico e Southwest Watershed Research Center, USDA/Agricultural Research Service, Tucson, Arizona, USA article info Article history: Received 1 March 2009 Received in revised form 17 September 2009 Accepted 22 September 2009 Available online 18 November 2009 Keywords: Albedo Enhanced Vegetation Index Land surface temperature MODIS NAM North American Monsoon Variability abstract In this paper we summarize the surface characteristics for six locations in western Mexico and south- western USA (from a subhumid climate in Jalisco, Mexico to the Sonoran Desert climate in Arizona, USA), that lie along a meridional transect within the North American Monsoon (NAM) core region using available MODerate Resolution Imaging Radiometer (MODIS) satellite data and supplementary surface instrumental data for two of these sites in Sonora, Mexico. The climate analysis for each site is carried out for the period 2000–2008, that includes all available MODIS data. A comparison of seasonal and annual variability in surface conditions for the enhanced vegetation index (EVI), albedo and land surface temperature (LST) at each site is presented. With the help of available surface data from field observa- tions, a more detailed analysis of Rayo ´n and Rosario de Tesopaco sites is presented. The qualitative behavior and climate response of three types of vegetation: desert shrub, subtropical shrub, and tropical deciduous forest ecosystems are analyzed under the influence of the NAM summer wet season. The onset of the NAM warm wet season in early summer, is one of the main precursors of generalized EVI growth in all the NAM region. At all the sites, it is observed that the mean daytime LST cools several degrees as the NAM fully develops. During the warm wet season, in the case of open and sparse vegetation regions such as desert shrub and subtropical shrub, albedo values fall slightly during the NAM season, while in closed and dense tropical deciduous forest regions albedo shows a slight increase. Differences in soil reflectivity at these sites are probably responsible for this rather unexpected behavior. Additionally it is found that, desert shrub and subtropical shrub regions in northern latitudes show large LST and small EVI/albedo seasonal variability, whilst tropical deciduous forests in lower latitudes show much larger EVI/albedo and smaller LST seasonal variability. Thus MODIS data proves to be a valuable tool for assessing the dynamics of seasonal and interannual surface characteristics helpful in determining climate patterns. Ó 2009 Elsevier Ltd. All rights reserved. 1. Introduction There have been a significant number of contributions in the last two decades addressing the characterization of the North American Monsoon System (NAM), Douglas et al. (1993); Gochis and Brito Castillo (2006); Higgins et al., (1997); Higgins and Gochis (2007). The main focus of these studies is the characterization of the spatio- temporal patterns of warm season precipitation across the NAM region. At the present time there is a better understanding of the diurnal cycle and regional variability of clouds and rainfall as they are related to the complex terrain and continental-maritime regimes. The characteristic NAM atmospheric pattern was described in detail by Douglas et al. (1993), and can be summarized as one where the precipitation starts shortly afternoon, and most frequently over high elevations on the western slope of the Sierra Madre Occidental (SMO) with modest intensity. Later in the after- noon and evening, at lower elevations, precipitation events occur with less frequency but often with greater intensity. With lower frequency, nocturnal and early morning precipitation occur, generated by shallow clouds over the coasts of the Gulf of Cal- ifornia. The NAM system starts early in June at lower latitudes * Corresponding author. Tel.: þ 52 662 259 2242; fax: þ52 662 259 2109. E-mail address: [email protected] (C. Liza ´ rraga-Celaya). Contents lists available at ScienceDirect Journal of Arid Environments journal homepage: www.elsevier.com/locate/jaridenv 0140-1963/$ – see front matter Ó 2009 Elsevier Ltd. All rights reserved. doi:10.1016/j.jaridenv.2009.09.027 Journal of Arid Environments 74 (2010) 540–548
-
Upload
independent -
Category
Documents
-
view
2 -
download
0
Transcript of Spatio-temporal variations in surface characteristics over the North American Monsoon region
lable at ScienceDirect
Journal of Arid Environments 74 (2010) 540–548
Contents lists avai
Journal of Arid Environments
journal homepage: www.elsevier .com/locate/ jar idenv
Spatio-temporal variations in surface characteristics over the North AmericanMonsoon region
Carlos Lizarraga-Celaya a,*, Christopher J. Watts a, Julio C. Rodrıguez b, Jaime Garatuza-Payan d,Russell L. Scott e, Juan Saiz-Hernandez c
a Departmento de Fısica, Universidad de Sonora, Blvd. Encinas y Rosales, Col. Centro, Hermosillo, Sonora 83000, Mexicob Departmento de Agricultura y Ganaderıa, Universidad de Sonora, Blvd. Encinas y Rosales, Col. Centro, Hermosillo, Sonora 83000, Mexicoc Departmento de Ingenierıa Civil y Minas, Universidad de Sonora, Blvd. Encinas y Rosales, Col. Centro, Hermosillo, Sonora 83000, Mexicod Ciencias del Agua y del Medio Ambiente, Instituto Tecnologico de Sonora, Cd. Obregon, Sonora 85000, Mexicoe Southwest Watershed Research Center, USDA/Agricultural Research Service, Tucson, Arizona, USA
a r t i c l e i n f o
Article history:Received 1 March 2009Received in revised form17 September 2009Accepted 22 September 2009Available online 18 November 2009
Keywords:AlbedoEnhanced Vegetation IndexLand surface temperatureMODISNAMNorth American MonsoonVariability
* Corresponding author. Tel.: þ 52 662 259 2242; fE-mail address: [email protected] (C. Lizarrag
0140-1963/$ – see front matter � 2009 Elsevier Ltd.doi:10.1016/j.jaridenv.2009.09.027
a b s t r a c t
In this paper we summarize the surface characteristics for six locations in western Mexico and south-western USA (from a subhumid climate in Jalisco, Mexico to the Sonoran Desert climate in Arizona, USA),that lie along a meridional transect within the North American Monsoon (NAM) core region usingavailable MODerate Resolution Imaging Radiometer (MODIS) satellite data and supplementary surfaceinstrumental data for two of these sites in Sonora, Mexico. The climate analysis for each site is carried outfor the period 2000–2008, that includes all available MODIS data. A comparison of seasonal and annualvariability in surface conditions for the enhanced vegetation index (EVI), albedo and land surfacetemperature (LST) at each site is presented. With the help of available surface data from field observa-tions, a more detailed analysis of Rayon and Rosario de Tesopaco sites is presented. The qualitativebehavior and climate response of three types of vegetation: desert shrub, subtropical shrub, and tropicaldeciduous forest ecosystems are analyzed under the influence of the NAM summer wet season. The onsetof the NAM warm wet season in early summer, is one of the main precursors of generalized EVI growth inall the NAM region. At all the sites, it is observed that the mean daytime LST cools several degrees as theNAM fully develops. During the warm wet season, in the case of open and sparse vegetation regions suchas desert shrub and subtropical shrub, albedo values fall slightly during the NAM season, while in closedand dense tropical deciduous forest regions albedo shows a slight increase. Differences in soil reflectivityat these sites are probably responsible for this rather unexpected behavior. Additionally it is found that,desert shrub and subtropical shrub regions in northern latitudes show large LST and small EVI/albedoseasonal variability, whilst tropical deciduous forests in lower latitudes show much larger EVI/albedo andsmaller LST seasonal variability. Thus MODIS data proves to be a valuable tool for assessing the dynamicsof seasonal and interannual surface characteristics helpful in determining climate patterns.
� 2009 Elsevier Ltd. All rights reserved.
1. Introduction
There have been a significant number of contributions in the lasttwo decades addressing the characterization of the North AmericanMonsoon System (NAM), Douglas et al. (1993); Gochis and BritoCastillo (2006); Higgins et al., (1997); Higgins and Gochis (2007).The main focus of these studies is the characterization of the spatio-temporal patterns of warm season precipitation across the NAMregion. At the present time there is a better understanding of the
ax: þ52 662 259 2109.a-Celaya).
All rights reserved.
diurnal cycle and regional variability of clouds and rainfall as theyare related to the complex terrain and continental-maritimeregimes.
The characteristic NAM atmospheric pattern was described indetail by Douglas et al. (1993), and can be summarized as onewhere the precipitation starts shortly afternoon, and mostfrequently over high elevations on the western slope of the SierraMadre Occidental (SMO) with modest intensity. Later in the after-noon and evening, at lower elevations, precipitation events occurwith less frequency but often with greater intensity. With lowerfrequency, nocturnal and early morning precipitation occur,generated by shallow clouds over the coasts of the Gulf of Cal-ifornia. The NAM system starts early in June at lower latitudes

C. Lizarraga-Celaya et al. / Journal of Arid Environments 74 (2010) 540–548 541
(w20�N) in southern Mexico and slowly moves northward alongthe western slopes of the SMO until it reaches northern latitudes(w35�N) in Arizona and New Mexico by early July, Salinas-Zavalaet al. (2001); Watts et al. (2007). For northwestern Mexico thegreatest rainfall occurs in July and August (CPC-NWS, 2008).
In this work, we will consider six sites with different latitudes(19.7�N–31.7�N) located in the NAM region (Fig. 1). One site islocated in southern Arizona, Lucky Hills, near Tombstone, AZ. Twosites were selected in Sonora, one close to Rayon and one in thesurroundings of Rosario de Tesopaco. One more site is in thevicinity of La Paz, in the southern part of the Baja Californiapeninsula on the coast of the Gulf of California. Micrometeorolog-ical towers are installed at all these sites and data for evapotrans-piration, net radiation, etc., are available for at least four years.Three of the sites (Lucky Hills, Rayon and Rosario de Tesopaco),were included in a detailed study of changes in vegetation condi-tion and surface fluxes during the NAM experiments in 2004 (Wattset al., 2007). The aim of the present work is to extend that analysisto include a) the entire period of MODIS data from 2000–2008 andb) include sites further south in tropical vegetation. The ChamelaBiological Reserve in Jalisco is operated by UNAM in Mexico Cityand has been the subject of numerous ecological and hydrologicalstudies in the last 30 years (e.g. Garcıa-Oliva et al. 1995; Maass et al.,1995). It has been designated as a Long Term Ecological Reserve andwe intend to initiate surface flux measurements there in 2010.Finally, the site in Tamazula de Victoria Durango was identified asa candidate for future surface flux measurements in the large areabetween Rosario de Tesopaco and Chamela.
The MODIS products land surface temperature (LST), albedo andenhanced vegetation index (EVI) will be used to study the seasonaland annual evolution of surface characteristics. LST is a physicalvariable than can give information of the energy balance occurringin land-atmosphere surface processes. The albedo is an indicator ofthe amount of radiation scattered and dispersed back into the
Fig. 1. Map of sites lying in the NAM core region. Each site is displ
atmosphere and space. And finally, EVI has been designed toimprove on Normalized Difference Vegetation Index (NDVI), asa variable for following the greenness of vegetation covers, since ithas corrections for some distortions in the reflected light caused byaerosols and ground cover below vegetation, and does not saturatewhen viewing rain forests and other areas of Earth with largeamounts of chlorophyll.
A comparison study of land surface temperature (LST), theenhanced vegetation index (EVI) and albedo will be presented fromdata for 2000–2008 for all six sites using the MODerate ResolutionImaging Radiometer (MODIS) products available on line. Addi-tionally, with available field data for Rayon and Rosario de Teso-paco, a more detailed description can be made of surfacecharacteristics and albedo comparisons between MODIS compositeproducts and field observations
2. Materials and methods
This study uses MODIS products that are available from 2000 tothe present. These data are distributed by the Land ProcessesArchive Center (LP DAAC), located at the U.S. Geological Survey(USGS) Earth Resources Observation and Science (EROS) Center andcan be downloaded from Oak Ridge National Laboratory (daac.ornl.gov). The following three MODIS Land products subsets were used:
1. Land Surface Temperature (LST), (Terra version 5, productMOD11A2)
2. Normalized Difference Vegetation Index (NDVI), EnhancedVegetation Index (EVI), (Terra version 5, product MOD13Q1)
3. Calculated Albedo (Terra/Aqua version 5 combined, productMCD43A)
The Land Surface Temperature and Emissivity 8-day dataproducts, are composed from the daily 1-km LST product
ayed using an asterisk (*) and site labels described in Table 1.
C. Lizarraga-Celaya et al. / Journal of Arid Environments 74 (2010) 540–548542
MOD11A1, and stored on a 1-km sinusoidal grid as the averagevalues of clear sky LST during an 8-day period (Wan, 1999). The LSTproducts include the daytime and nighttime temperatures indegrees Kelvin, with supplementary information about the averagelocal time and average view zenith angle of each 1km resolutionaverage temperature data. In this study, only the daytime landsurface temperature average registered around 11:00 AM solartime is considered.
The global MODIS vegetation indexes are designed to provideconsistent spatial and temporal comparison of vegetation condi-tions. The blue, red and near infrared reflectance, centered at469 nm, 645 nm and 858 nm respectively, are combined to deter-mine the MODIS daily vegetation indexes (Huete et al., 1999). TheMODIS Normalized Difference Vegetation Index (NDVI) productMOD13Q1, includes a new Enhanced Vegetation Index (EVI) as well,that minimizes canopy background variations, maintaining sensi-tivity over dense vegetation conditions. The global MOD13Q1 areprovided every 16 days at 250 m spatial resolution in a sinusoidalgrid projection, and includes not only NDVI and EVI data, but alsoblue, red and near infrared reflectance, view zenith angle, sunzenith angle, relative azimuth angle. The vegetation indexes areused for monitoring vegetation conditions (Zhang et al., 2003).
While the NDVI index poses some saturation problems overdensely vegetated areas, so that the values no longer respond tovariations in green biomass, the enhanced vegetation index (EVI)was developed to optimize the vegetation signal with improvedsensitivity in high biomass regions and improved vegetationmonitoring through a decoupling of the canopy background signaland a reduction in atmospheric influences. This enhanced, soil andatmosphere resistant vegetation index (EVI) has the followingexpression:
EVI ¼ Gðrnir � rredÞ=ðLþ rnir þ C1rred þ C2rblueÞ
where r are atmospherically corrected or partially atmospherecorrected (Rayleigh and ozone absorption) surface reflectance, L isthe canopy background adjustment that addresses nonlinear,differential near infrared (NIR) and red radiant transfer througha canopy, and C1, C2 are the coefficients of the aerosol resistanceterm, which uses the blue band to correct for aerosol influences inthe red band. The coefficients adopted in the EVI algorithm are,L¼ 1, C1¼6, C2¼ 7.5, and the gain factor G¼ 2.5 (Huete et al., 2002).
For the albedo, the MODIS Bidirectional Reflectance DistributionFunction (BRDF)/Albedo Model Parameters combined productMCD43A was used, which contains three-dimensional data sets ofweighting parameters for the models used to derive the Albedo andother BRDF products. The model supports the spatial relationshipand parameter characterization that describe the differences inradiation due to scattering of each pixel, relying on multi-date,atmospherically corrected, cloud-cleared input data measured over16-day periods at 500 m resolution in a sinusoidal grid projection.
Albedo is defined as the fraction of incident solar radiation thatis reflected by a surface. While reflectance is defined as the samefraction for a single incidence angle, albedo is the directionalintegration of reflectance over all sun-view geometries. Albedo istherefore dependent on the Bidirectional Reflectance DistributionFunction (BRDF).
Due to its three-dimensional structure, the Earth’s surfacescatters radiation anisotropically, especially at the shorter wave-lengths that characterize solar irradiance. The BidirectionalReflectance Distribution Function (BRDF) specifies the behavior ofsurface scattering as a function of illumination and view angles ata particular wavelength. The albedo of a surface describes the ratioof radiant energy scattered upward and away from the surface in alldirections to the down-welling irradiance incident upon the
surface. The completely diffuse bihemispherical (or white-sky)albedo can be derived through integration of the BRDF for theentire solar and viewing hemisphere, while the direct beamdirectional hemispherical (or black-sky) albedo can be calculatedthrough integration of the BRDF for a particular illuminationgeometry. Actual albedo under particular atmospheric and illumi-nation conditions can be estimated as a function of the diffuseskylight and a proportion between the black-sky and white-skyalbedo (Strahler et al., 1999a).
The MODIS/Terra Albedo products provide both the white-skyand the black-sky albedo (at local solar noon) for MODIS bands 1–7as well as for three broad bands (0.3–0.7 mm, 0.7–5.0 mm, and 0.3–0.5 mm). While the total energy reflected by the earth’s surface inthe shortwave domain is characterized by the shortwave band 10(0.3–5.0 mm) broadband albedo, the visible band 08 (0.3–0.5 mm)and near infrared band 09 (0.7–5.0 mm) are also of interest due tomarked difference of the reflectance of vegetation in these twospectral regions. Solar radiation is received at the Earth in theshortwave wavelength of 0.3–5.0 mm, with 98% in the range ofw0.3–2.5 mm (Iqbal, 1984).
The MODIS albedo product MCD43A data are based on the Terraand Aqua combined MODIS BRDF/Albedo Model Parameter productMCD43A1. The primary BRDF model parameters from MCD43A1are used in the equations to calculate black-sky, white-sky andactual (blue-sky) albedo. The calculated data files assumed a solarzenith angle equal to local solar noon and null optical depth. Theblue-sky albedo is calculated from a polynomial expression in solarzenith angles, with parameters being provided by the BRDF func-tion for visible, near infrared and shortwave broad bands. Thewhite-sky albedo is calculated from a combination of parametersprovided also from the BRDF model for the three previousmentioned broad bands. Finally the actual (blue-sky) albedo isa combination of the black-sky and white-sky albedos with variablefunction coefficients that depend on the optical depth, solar zenithangle, aerosol type and band (Schaaf et al., 2002).
2.1. Site descriptions
The sites that have been selected are located in the NorthAmerican Monsoon (NAM) region. They all lie on a transect alongthe western side of the Sierra Madre Occidental (SMO). There isa collection of works related with NAM influence in some of thesesites, Vivoni et al., (2008, in press), Watts et al., (2007). Most of theselected sites have available surface instrumental data and theothers are included in future plans for extending the installedmicrometeorological network. The sites are the following: one sitelocated in southern Arizona, Lucky Hills (LH); two sites in Sonora,Rayon (RY) and Rosario de Tesopaco (RT); one in Southern BajaCalifornia, La Paz (LP); Tamazula de Victoria (TV) located in thelower sierras of Durango; and one in Jalisco, Chamela (CH). The sitesare shown in Fig. 1.
According to MODIS Land Type 1, there are 17 classes of landcover in the International Geosphere-Biosphere Programme (IGBP)global classification scheme. In the NAM region studied, the exist-ing land cover classes are: 2) Evergreen Broadleaf Forest, 4)Deciduous Broadleaf Forest, 5) Mixed Forest, 7) Open Shrublands,8) Woody Savannahs, 9) Savannahs, 10) Grassland, 12) Croplands,13) Urban and built-up, and 16) Barren or Sparsely vegetated.Classes 1–5 represent forests of different vegetation and densities,while classes 6–12 are related with short and low density vegeta-tion (Strahler et al., 1999b). The site locations and land cover classesare described in detail in Table 1.
In Table 2, the average monthly precipitation (in mm) is pre-sented for climatological stations near the six selected sites. Theactive NAM months are mostly from June through August, when
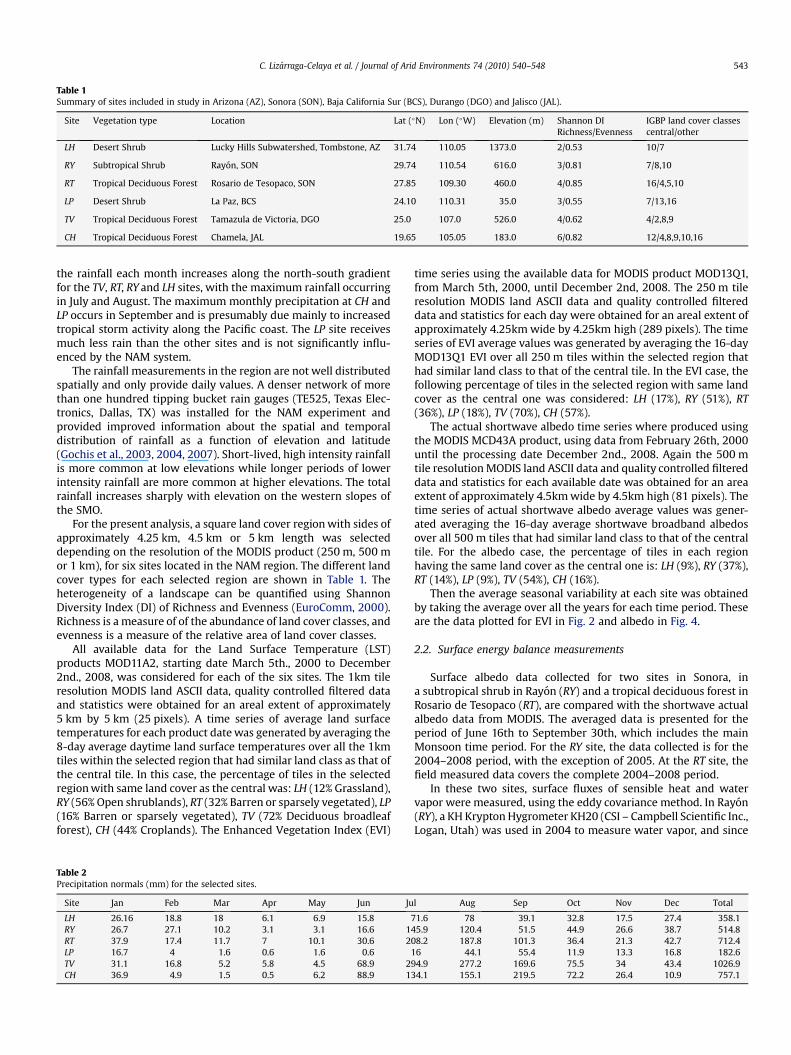
Table 1Summary of sites included in study in Arizona (AZ), Sonora (SON), Baja California Sur (BCS), Durango (DGO) and Jalisco (JAL).
Site Vegetation type Location Lat (�N) Lon (�W) Elevation (m) Shannon DIRichness/Evenness
IGBP land cover classescentral/other
LH Desert Shrub Lucky Hills Subwatershed, Tombstone, AZ 31.74 110.05 1373.0 2/0.53 10/7
RY Subtropical Shrub Rayon, SON 29.74 110.54 616.0 3/0.81 7/8,10
RT Tropical Deciduous Forest Rosario de Tesopaco, SON 27.85 109.30 460.0 4/0.85 16/4,5,10
LP Desert Shrub La Paz, BCS 24.10 110.31 35.0 3/0.55 7/13,16
TV Tropical Deciduous Forest Tamazula de Victoria, DGO 25.0 107.0 526.0 4/0.62 4/2,8,9
CH Tropical Deciduous Forest Chamela, JAL 19.65 105.05 183.0 6/0.82 12/4,8,9,10,16
C. Lizarraga-Celaya et al. / Journal of Arid Environments 74 (2010) 540–548 543
the rainfall each month increases along the north-south gradientfor the TV, RT, RY and LH sites, with the maximum rainfall occurringin July and August. The maximum monthly precipitation at CH andLP occurs in September and is presumably due mainly to increasedtropical storm activity along the Pacific coast. The LP site receivesmuch less rain than the other sites and is not significantly influ-enced by the NAM system.
The rainfall measurements in the region are not well distributedspatially and only provide daily values. A denser network of morethan one hundred tipping bucket rain gauges (TE525, Texas Elec-tronics, Dallas, TX) was installed for the NAM experiment andprovided improved information about the spatial and temporaldistribution of rainfall as a function of elevation and latitude(Gochis et al., 2003, 2004, 2007). Short-lived, high intensity rainfallis more common at low elevations while longer periods of lowerintensity rainfall are more common at higher elevations. The totalrainfall increases sharply with elevation on the western slopes ofthe SMO.
For the present analysis, a square land cover region with sides ofapproximately 4.25 km, 4.5 km or 5 km length was selecteddepending on the resolution of the MODIS product (250 m, 500 mor 1 km), for six sites located in the NAM region. The different landcover types for each selected region are shown in Table 1. Theheterogeneity of a landscape can be quantified using ShannonDiversity Index (DI) of Richness and Evenness (EuroComm, 2000).Richness is a measure of of the abundance of land cover classes, andevenness is a measure of the relative area of land cover classes.
All available data for the Land Surface Temperature (LST)products MOD11A2, starting date March 5th., 2000 to December2nd., 2008, was considered for each of the six sites. The 1km tileresolution MODIS land ASCII data, quality controlled filtered dataand statistics were obtained for an areal extent of approximately5 km by 5 km (25 pixels). A time series of average land surfacetemperatures for each product date was generated by averaging the8-day average daytime land surface temperatures over all the 1kmtiles within the selected region that had similar land class as that ofthe central tile. In this case, the percentage of tiles in the selectedregion with same land cover as the central was: LH (12% Grassland),RY (56% Open shrublands), RT (32% Barren or sparsely vegetated), LP(16% Barren or sparsely vegetated), TV (72% Deciduous broadleafforest), CH (44% Croplands). The Enhanced Vegetation Index (EVI)
Table 2Precipitation normals (mm) for the selected sites.
Site Jan Feb Mar Apr May Jun Ju
LH 26.16 18.8 18 6.1 6.9 15.8 7RY 26.7 27.1 10.2 3.1 3.1 16.6 14RT 37.9 17.4 11.7 7 10.1 30.6 20LP 16.7 4 1.6 0.6 1.6 0.6 1TV 31.1 16.8 5.2 5.8 4.5 68.9 29CH 36.9 4.9 1.5 0.5 6.2 88.9 13
time series using the available data for MODIS product MOD13Q1,from March 5th, 2000, until December 2nd, 2008. The 250 m tileresolution MODIS land ASCII data and quality controlled filtereddata and statistics for each day were obtained for an areal extent ofapproximately 4.25km wide by 4.25km high (289 pixels). The timeseries of EVI average values was generated by averaging the 16-dayMOD13Q1 EVI over all 250 m tiles within the selected region thathad similar land class to that of the central tile. In the EVI case, thefollowing percentage of tiles in the selected region with same landcover as the central one was considered: LH (17%), RY (51%), RT(36%), LP (18%), TV (70%), CH (57%).
The actual shortwave albedo time series where produced usingthe MODIS MCD43A product, using data from February 26th, 2000until the processing date December 2nd., 2008. Again the 500 mtile resolution MODIS land ASCII data and quality controlled filtereddata and statistics for each available date was obtained for an areaextent of approximately 4.5km wide by 4.5km high (81 pixels). Thetime series of actual shortwave albedo average values was gener-ated averaging the 16-day average shortwave broadband albedosover all 500 m tiles that had similar land class to that of the centraltile. For the albedo case, the percentage of tiles in each regionhaving the same land cover as the central one is: LH (9%), RY (37%),RT (14%), LP (9%), TV (54%), CH (16%).
Then the average seasonal variability at each site was obtainedby taking the average over all the years for each time period. Theseare the data plotted for EVI in Fig. 2 and albedo in Fig. 4.
2.2. Surface energy balance measurements
Surface albedo data collected for two sites in Sonora, ina subtropical shrub in Rayon (RY) and a tropical deciduous forest inRosario de Tesopaco (RT), are compared with the shortwave actualalbedo data from MODIS. The averaged data is presented for theperiod of June 16th to September 30th, which includes the mainMonsoon time period. For the RY site, the data collected is for the2004–2008 period, with the exception of 2005. At the RT site, thefield measured data covers the complete 2004–2008 period.
In these two sites, surface fluxes of sensible heat and watervapor were measured, using the eddy covariance method. In Rayon(RY), a KH Krypton Hygrometer KH20 (CSI – Campbell Scientific Inc.,Logan, Utah) was used in 2004 to measure water vapor, and since
l Aug Sep Oct Nov Dec Total
1.6 78 39.1 32.8 17.5 27.4 358.15.9 120.4 51.5 44.9 26.6 38.7 514.88.2 187.8 101.3 36.4 21.3 42.7 712.46 44.1 55.4 11.9 13.3 16.8 182.64.9 277.2 169.6 75.5 34 43.4 1026.94.1 155.1 219.5 72.2 26.4 10.9 757.1
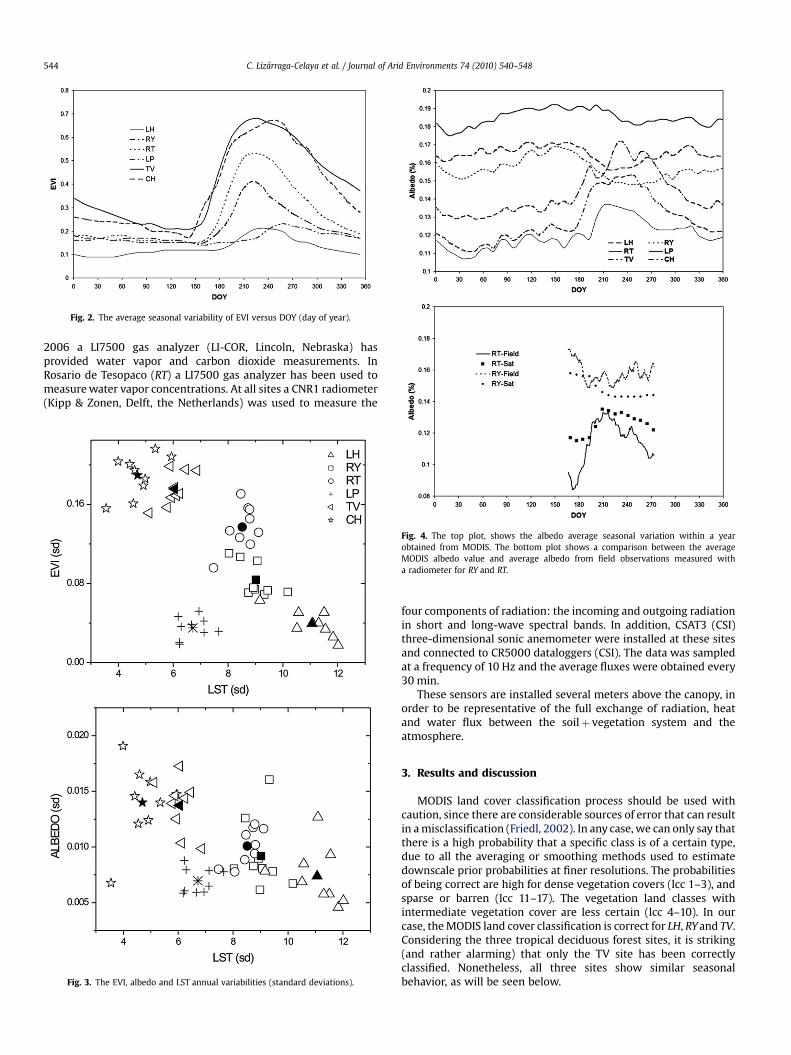
Fig. 2. The average seasonal variability of EVI versus DOY (day of year).
C. Lizarraga-Celaya et al. / Journal of Arid Environments 74 (2010) 540–548544
2006 a LI7500 gas analyzer (LI-COR, Lincoln, Nebraska) hasprovided water vapor and carbon dioxide measurements. InRosario de Tesopaco (RT) a LI7500 gas analyzer has been used tomeasure water vapor concentrations. At all sites a CNR1 radiometer(Kipp & Zonen, Delft, the Netherlands) was used to measure the
Fig. 3. The EVI, albedo and LST annual variabilities (standard deviations).
Fig. 4. The top plot, shows the albedo average seasonal variation within a yearobtained from MODIS. The bottom plot shows a comparison between the averageMODIS albedo value and average albedo from field observations measured witha radiometer for RY and RT.
four components of radiation: the incoming and outgoing radiationin short and long-wave spectral bands. In addition, CSAT3 (CSI)three-dimensional sonic anemometer were installed at these sitesand connected to CR5000 dataloggers (CSI). The data was sampledat a frequency of 10 Hz and the average fluxes were obtained every30 min.
These sensors are installed several meters above the canopy, inorder to be representative of the full exchange of radiation, heatand water flux between the soilþ vegetation system and theatmosphere.
3. Results and discussion
MODIS land cover classification process should be used withcaution, since there are considerable sources of error that can resultin a misclassification (Friedl, 2002). In any case, we can only say thatthere is a high probability that a specific class is of a certain type,due to all the averaging or smoothing methods used to estimatedownscale prior probabilities at finer resolutions. The probabilitiesof being correct are high for dense vegetation covers (lcc 1–3), andsparse or barren (lcc 11–17). The vegetation land classes withintermediate vegetation cover are less certain (lcc 4–10). In ourcase, the MODIS land cover classification is correct for LH, RY and TV.Considering the three tropical deciduous forest sites, it is striking(and rather alarming) that only the TV site has been correctlyclassified. Nonetheless, all three sites show similar seasonalbehavior, as will be seen below.
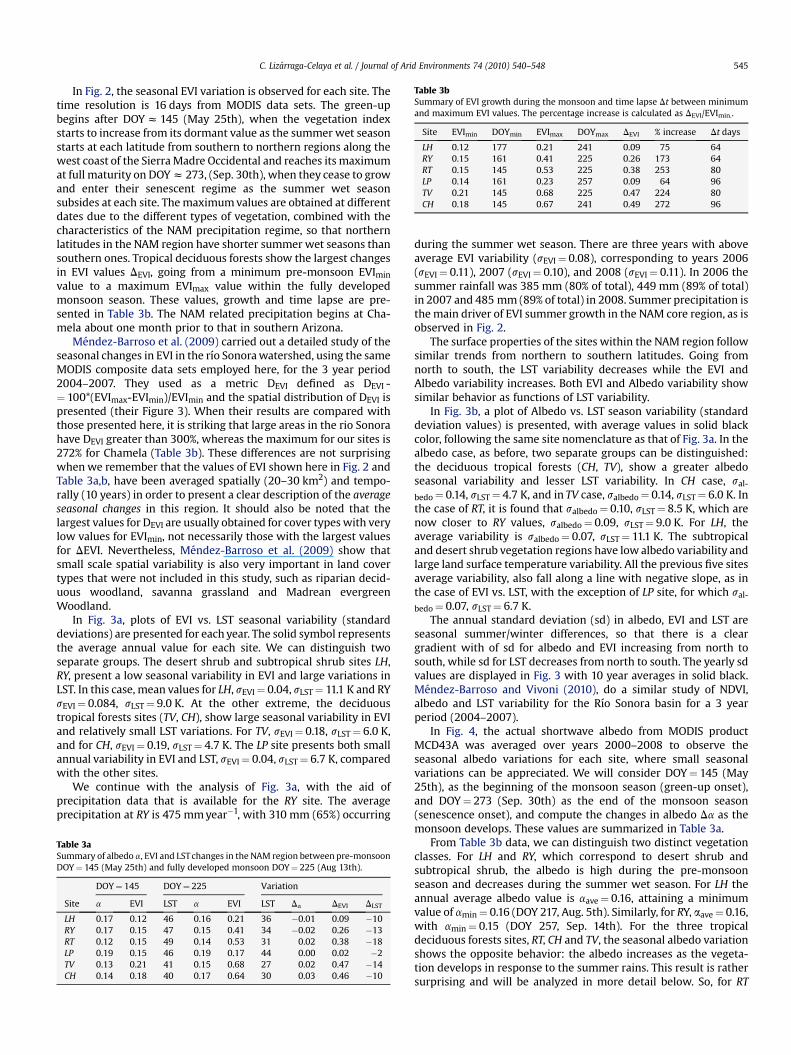
Table 3bSummary of EVI growth during the monsoon and time lapse Dt between minimumand maximum EVI values. The percentage increase is calculated as DEVI/EVImin..
Site EVImin DOYmin EVImax DOYmax DEVI % increase Dt days
LH 0.12 177 0.21 241 0.09 75 64RY 0.15 161 0.41 225 0.26 173 64RT 0.15 145 0.53 225 0.38 253 80LP 0.14 161 0.23 257 0.09 64 96TV 0.21 145 0.68 225 0.47 224 80CH 0.18 145 0.67 241 0.49 272 96
C. Lizarraga-Celaya et al. / Journal of Arid Environments 74 (2010) 540–548 545
In Fig. 2, the seasonal EVI variation is observed for each site. Thetime resolution is 16 days from MODIS data sets. The green-upbegins after DOY z 145 (May 25th), when the vegetation indexstarts to increase from its dormant value as the summer wet seasonstarts at each latitude from southern to northern regions along thewest coast of the Sierra Madre Occidental and reaches its maximumat full maturity on DOY z 273, (Sep. 30th), when they cease to growand enter their senescent regime as the summer wet seasonsubsides at each site. The maximum values are obtained at differentdates due to the different types of vegetation, combined with thecharacteristics of the NAM precipitation regime, so that northernlatitudes in the NAM region have shorter summer wet seasons thansouthern ones. Tropical deciduous forests show the largest changesin EVI values DEVI, going from a minimum pre-monsoon EVImin
value to a maximum EVImax value within the fully developedmonsoon season. These values, growth and time lapse are pre-sented in Table 3b. The NAM related precipitation begins at Cha-mela about one month prior to that in southern Arizona.
Mendez-Barroso et al. (2009) carried out a detailed study of theseasonal changes in EVI in the rıo Sonora watershed, using the sameMODIS composite data sets employed here, for the 3 year period2004–2007. They used as a metric DEVI defined as DEVI -¼ 100*(EVImax-EVImin)/EVImin and the spatial distribution of DEVI ispresented (their Figure 3). When their results are compared withthose presented here, it is striking that large areas in the rio Sonorahave DEVI greater than 300%, whereas the maximum for our sites is272% for Chamela (Table 3b). These differences are not surprisingwhen we remember that the values of EVI shown here in Fig. 2 andTable 3a,b, have been averaged spatially (20–30 km2) and tempo-rally (10 years) in order to present a clear description of the averageseasonal changes in this region. It should also be noted that thelargest values for DEVI are usually obtained for cover types with verylow values for EVImin, not necessarily those with the largest valuesfor DEVI. Nevertheless, Mendez-Barroso et al. (2009) show thatsmall scale spatial variability is also very important in land covertypes that were not included in this study, such as riparian decid-uous woodland, savanna grassland and Madrean evergreenWoodland.
In Fig. 3a, plots of EVI vs. LST seasonal variability (standarddeviations) are presented for each year. The solid symbol representsthe average annual value for each site. We can distinguish twoseparate groups. The desert shrub and subtropical shrub sites LH,RY, present a low seasonal variability in EVI and large variations inLST. In this case, mean values for LH, sEVI¼ 0.04, sLST¼ 11.1 K and RYsEVI¼ 0.084, sLST¼ 9.0 K. At the other extreme, the deciduoustropical forests sites (TV, CH), show large seasonal variability in EVIand relatively small LST variations. For TV, sEVI¼ 0.18, sLST¼ 6.0 K,and for CH, sEVI¼ 0.19, sLST¼ 4.7 K. The LP site presents both smallannual variability in EVI and LST, sEVI¼ 0.04, sLST¼ 6.7 K, comparedwith the other sites.
We continue with the analysis of Fig. 3a, with the aid ofprecipitation data that is available for the RY site. The averageprecipitation at RY is 475 mm year�1, with 310 mm (65%) occurring
Table 3aSummary of albedo a, EVI and LST changes in the NAM region between pre-monsoonDOY¼ 145 (May 25th) and fully developed monsoon DOY¼ 225 (Aug 13th).
DOY¼ 145 DOY¼ 225 Variation
Site a EVI LST a EVI LST Da DEVI DLST
LH 0.17 0.12 46 0.16 0.21 36 �0.01 0.09 �10RY 0.17 0.15 47 0.15 0.41 34 �0.02 0.26 �13RT 0.12 0.15 49 0.14 0.53 31 0.02 0.38 �18LP 0.19 0.15 46 0.19 0.17 44 0.00 0.02 �2TV 0.13 0.21 41 0.15 0.68 27 0.02 0.47 �14CH 0.14 0.18 40 0.17 0.64 30 0.03 0.46 �10
during the summer wet season. There are three years with aboveaverage EVI variability (sEVI¼ 0.08), corresponding to years 2006(sEVI¼ 0.11), 2007 (sEVI¼ 0.10), and 2008 (sEVI¼ 0.11). In 2006 thesummer rainfall was 385 mm (80% of total), 449 mm (89% of total)in 2007 and 485 mm (89% of total) in 2008. Summer precipitation isthe main driver of EVI summer growth in the NAM core region, as isobserved in Fig. 2.
The surface properties of the sites within the NAM region followsimilar trends from northern to southern latitudes. Going fromnorth to south, the LST variability decreases while the EVI andAlbedo variability increases. Both EVI and Albedo variability showsimilar behavior as functions of LST variability.
In Fig. 3b, a plot of Albedo vs. LST season variability (standarddeviation values) is presented, with average values in solid blackcolor, following the same site nomenclature as that of Fig. 3a. In thealbedo case, as before, two separate groups can be distinguished:the deciduous tropical forests (CH, TV), show a greater albedoseasonal variability and lesser LST variability. In CH case, sal-
bedo¼ 0.14, sLST¼ 4.7 K, and in TV case, salbedo¼ 0.14, sLST¼ 6.0 K. Inthe case of RT, it is found that salbedo¼ 0.10, sLST¼ 8.5 K, which arenow closer to RY values, salbedo¼ 0.09, sLST¼ 9.0 K. For LH, theaverage variability is salbedo¼ 0.07, sLST¼ 11.1 K. The subtropicaland desert shrub vegetation regions have low albedo variability andlarge land surface temperature variability. All the previous five sitesaverage variability, also fall along a line with negative slope, as inthe case of EVI vs. LST, with the exception of LP site, for which sal-
bedo¼ 0.07, sLST¼ 6.7 K.The annual standard deviation (sd) in albedo, EVI and LST are
seasonal summer/winter differences, so that there is a cleargradient with of sd for albedo and EVI increasing from north tosouth, while sd for LST decreases from north to south. The yearly sdvalues are displayed in Fig. 3 with 10 year averages in solid black.Mendez-Barroso and Vivoni (2010), do a similar study of NDVI,albedo and LST variability for the Rıo Sonora basin for a 3 yearperiod (2004–2007).
In Fig. 4, the actual shortwave albedo from MODIS productMCD43A was averaged over years 2000–2008 to observe theseasonal albedo variations for each site, where small seasonalvariations can be appreciated. We will consider DOY¼ 145 (May25th), as the beginning of the monsoon season (green-up onset),and DOY¼ 273 (Sep. 30th) as the end of the monsoon season(senescence onset), and compute the changes in albedo Da as themonsoon develops. These values are summarized in Table 3a.
From Table 3b data, we can distinguish two distinct vegetationclasses. For LH and RY, which correspond to desert shrub andsubtropical shrub, the albedo is high during the pre-monsoonseason and decreases during the summer wet season. For LH theannual average albedo value is aave¼ 0.16, attaining a minimumvalue of amin¼ 0.16 (DOY 217, Aug. 5th). Similarly, for RY, aave¼ 0.16,with amin¼ 0.15 (DOY 257, Sep. 14th). For the three tropicaldeciduous forests sites, RT, CH and TV, the seasonal albedo variationshows the opposite behavior: the albedo increases as the vegeta-tion develops in response to the summer rains. This result is rathersurprising and will be analyzed in more detail below. So, for RT
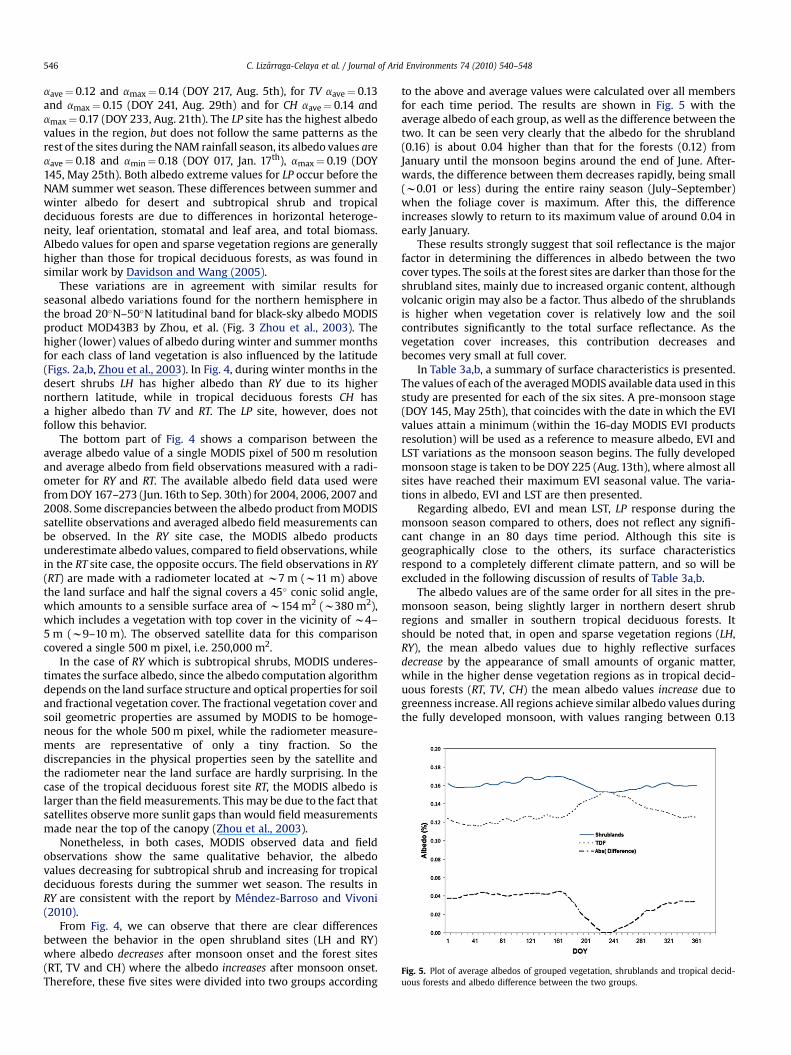
Fig. 5. Plot of average albedos of grouped vegetation, shrublands and tropical decid-uous forests and albedo difference between the two groups.
C. Lizarraga-Celaya et al. / Journal of Arid Environments 74 (2010) 540–548546
aave¼ 0.12 and amax¼ 0.14 (DOY 217, Aug. 5th), for TV aave¼ 0.13and amax¼ 0.15 (DOY 241, Aug. 29th) and for CH aave¼ 0.14 andamax¼ 0.17 (DOY 233, Aug. 21th). The LP site has the highest albedovalues in the region, but does not follow the same patterns as therest of the sites during the NAM rainfall season, its albedo values areaave¼ 0.18 and amin¼ 0.18 (DOY 017, Jan. 17th), amax¼ 0.19 (DOY145, May 25th). Both albedo extreme values for LP occur before theNAM summer wet season. These differences between summer andwinter albedo for desert and subtropical shrub and tropicaldeciduous forests are due to differences in horizontal heteroge-neity, leaf orientation, stomatal and leaf area, and total biomass.Albedo values for open and sparse vegetation regions are generallyhigher than those for tropical deciduous forests, as was found insimilar work by Davidson and Wang (2005).
These variations are in agreement with similar results forseasonal albedo variations found for the northern hemisphere inthe broad 20�N–50�N latitudinal band for black-sky albedo MODISproduct MOD43B3 by Zhou, et al. (Fig. 3 Zhou et al., 2003). Thehigher (lower) values of albedo during winter and summer monthsfor each class of land vegetation is also influenced by the latitude(Figs. 2a,b, Zhou et al., 2003). In Fig. 4, during winter months in thedesert shrubs LH has higher albedo than RY due to its highernorthern latitude, while in tropical deciduous forests CH hasa higher albedo than TV and RT. The LP site, however, does notfollow this behavior.
The bottom part of Fig. 4 shows a comparison between theaverage albedo value of a single MODIS pixel of 500 m resolutionand average albedo from field observations measured with a radi-ometer for RY and RT. The available albedo field data used werefrom DOY 167–273 (Jun. 16th to Sep. 30th) for 2004, 2006, 2007 and2008. Some discrepancies between the albedo product from MODISsatellite observations and averaged albedo field measurements canbe observed. In the RY site case, the MODIS albedo productsunderestimate albedo values, compared to field observations, whilein the RT site case, the opposite occurs. The field observations in RY(RT) are made with a radiometer located at w7 m (w11 m) abovethe land surface and half the signal covers a 45� conic solid angle,which amounts to a sensible surface area of w154 m2 (w380 m2),which includes a vegetation with top cover in the vicinity of w4–5 m (w9–10 m). The observed satellite data for this comparisoncovered a single 500 m pixel, i.e. 250,000 m2.
In the case of RY which is subtropical shrubs, MODIS underes-timates the surface albedo, since the albedo computation algorithmdepends on the land surface structure and optical properties for soiland fractional vegetation cover. The fractional vegetation cover andsoil geometric properties are assumed by MODIS to be homoge-neous for the whole 500 m pixel, while the radiometer measure-ments are representative of only a tiny fraction. So thediscrepancies in the physical properties seen by the satellite andthe radiometer near the land surface are hardly surprising. In thecase of the tropical deciduous forest site RT, the MODIS albedo islarger than the field measurements. This may be due to the fact thatsatellites observe more sunlit gaps than would field measurementsmade near the top of the canopy (Zhou et al., 2003).
Nonetheless, in both cases, MODIS observed data and fieldobservations show the same qualitative behavior, the albedovalues decreasing for subtropical shrub and increasing for tropicaldeciduous forests during the summer wet season. The results inRY are consistent with the report by Mendez-Barroso and Vivoni(2010).
From Fig. 4, we can observe that there are clear differencesbetween the behavior in the open shrubland sites (LH and RY)where albedo decreases after monsoon onset and the forest sites(RT, TV and CH) where the albedo increases after monsoon onset.Therefore, these five sites were divided into two groups according
to the above and average values were calculated over all membersfor each time period. The results are shown in Fig. 5 with theaverage albedo of each group, as well as the difference between thetwo. It can be seen very clearly that the albedo for the shrubland(0.16) is about 0.04 higher than that for the forests (0.12) fromJanuary until the monsoon begins around the end of June. After-wards, the difference between them decreases rapidly, being small(w0.01 or less) during the entire rainy season (July–September)when the foliage cover is maximum. After this, the differenceincreases slowly to return to its maximum value of around 0.04 inearly January.
These results strongly suggest that soil reflectance is the majorfactor in determining the differences in albedo between the twocover types. The soils at the forest sites are darker than those for theshrubland sites, mainly due to increased organic content, althoughvolcanic origin may also be a factor. Thus albedo of the shrublandsis higher when vegetation cover is relatively low and the soilcontributes significantly to the total surface reflectance. As thevegetation cover increases, this contribution decreases andbecomes very small at full cover.
In Table 3a,b, a summary of surface characteristics is presented.The values of each of the averaged MODIS available data used in thisstudy are presented for each of the six sites. A pre-monsoon stage(DOY 145, May 25th), that coincides with the date in which the EVIvalues attain a minimum (within the 16-day MODIS EVI productsresolution) will be used as a reference to measure albedo, EVI andLST variations as the monsoon season begins. The fully developedmonsoon stage is taken to be DOY 225 (Aug. 13th), where almost allsites have reached their maximum EVI seasonal value. The varia-tions in albedo, EVI and LST are then presented.
Regarding albedo, EVI and mean LST, LP response during themonsoon season compared to others, does not reflect any signifi-cant change in an 80 days time period. Although this site isgeographically close to the others, its surface characteristicsrespond to a completely different climate pattern, and so will beexcluded in the following discussion of results of Table 3a,b.
The albedo values are of the same order for all sites in the pre-monsoon season, being slightly larger in northern desert shrubregions and smaller in southern tropical deciduous forests. Itshould be noted that, in open and sparse vegetation regions (LH,RY), the mean albedo values due to highly reflective surfacesdecrease by the appearance of small amounts of organic matter,while in the higher dense vegetation regions as in tropical decid-uous forests (RT, TV, CH) the mean albedo values increase due togreenness increase. All regions achieve similar albedo values duringthe fully developed monsoon, with values ranging between 0.13
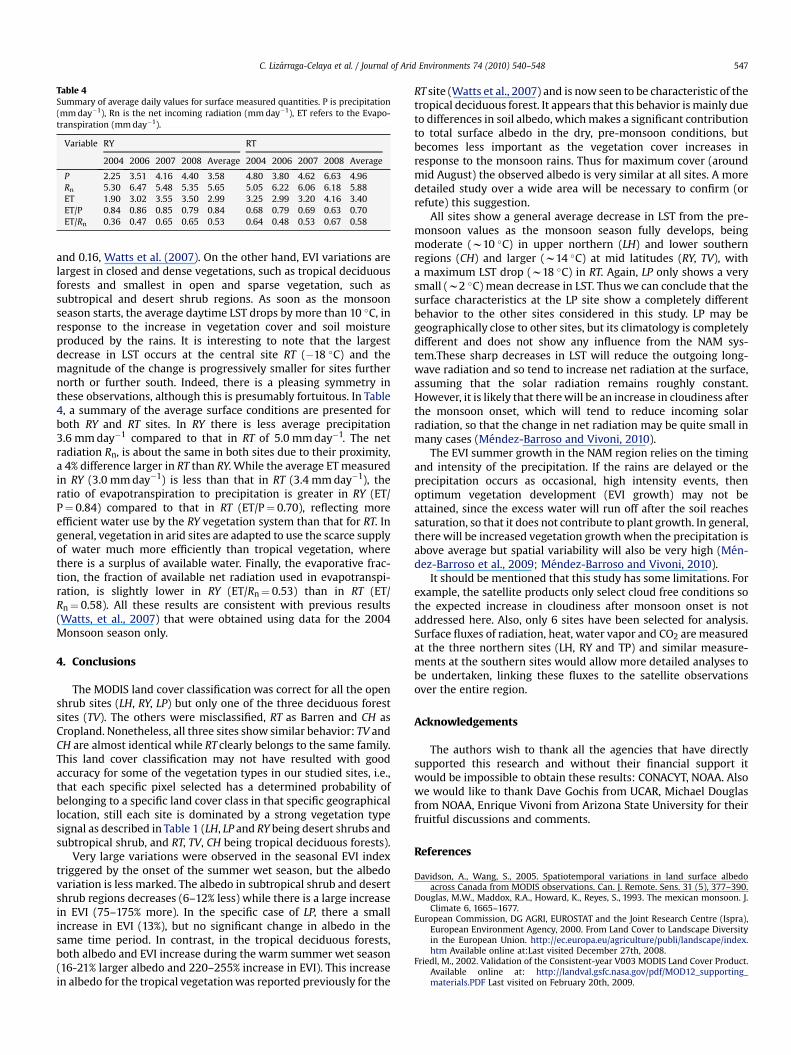
Table 4Summary of average daily values for surface measured quantities. P is precipitation(mm day�1), Rn is the net incoming radiation (mm day�1), ET refers to the Evapo-transpiration (mm day�1).
Variable RY RT
2004 2006 2007 2008 Average 2004 2006 2007 2008 Average
P 2.25 3.51 4.16 4.40 3.58 4.80 3.80 4.62 6.63 4.96Rn 5.30 6.47 5.48 5.35 5.65 5.05 6.22 6.06 6.18 5.88ET 1.90 3.02 3.55 3.50 2.99 3.25 2.99 3.20 4.16 3.40ET/P 0.84 0.86 0.85 0.79 0.84 0.68 0.79 0.69 0.63 0.70ET/Rn 0.36 0.47 0.65 0.65 0.53 0.64 0.48 0.53 0.67 0.58
C. Lizarraga-Celaya et al. / Journal of Arid Environments 74 (2010) 540–548 547
and 0.16, Watts et al. (2007). On the other hand, EVI variations arelargest in closed and dense vegetations, such as tropical deciduousforests and smallest in open and sparse vegetation, such assubtropical and desert shrub regions. As soon as the monsoonseason starts, the average daytime LST drops by more than 10 �C, inresponse to the increase in vegetation cover and soil moistureproduced by the rains. It is interesting to note that the largestdecrease in LST occurs at the central site RT (�18 �C) and themagnitude of the change is progressively smaller for sites furthernorth or further south. Indeed, there is a pleasing symmetry inthese observations, although this is presumably fortuitous. In Table4, a summary of the average surface conditions are presented forboth RY and RT sites. In RY there is less average precipitation3.6 mm day�1 compared to that in RT of 5.0 mm day�1. The netradiation Rn, is about the same in both sites due to their proximity,a 4% difference larger in RT than RY. While the average ET measuredin RY (3.0 mm day�1) is less than that in RT (3.4 mm day�1), theratio of evapotranspiration to precipitation is greater in RY (ET/P¼ 0.84) compared to that in RT (ET/P¼ 0.70), reflecting moreefficient water use by the RY vegetation system than that for RT. Ingeneral, vegetation in arid sites are adapted to use the scarce supplyof water much more efficiently than tropical vegetation, wherethere is a surplus of available water. Finally, the evaporative frac-tion, the fraction of available net radiation used in evapotranspi-ration, is slightly lower in RY (ET/Rn¼ 0.53) than in RT (ET/Rn¼ 0.58). All these results are consistent with previous results(Watts, et al., 2007) that were obtained using data for the 2004Monsoon season only.
4. Conclusions
The MODIS land cover classification was correct for all the openshrub sites (LH, RY, LP) but only one of the three deciduous forestsites (TV). The others were misclassified, RT as Barren and CH asCropland. Nonetheless, all three sites show similar behavior: TV andCH are almost identical while RT clearly belongs to the same family.This land cover classification may not have resulted with goodaccuracy for some of the vegetation types in our studied sites, i.e.,that each specific pixel selected has a determined probability ofbelonging to a specific land cover class in that specific geographicallocation, still each site is dominated by a strong vegetation typesignal as described in Table 1 (LH, LP and RY being desert shrubs andsubtropical shrub, and RT, TV, CH being tropical deciduous forests).
Very large variations were observed in the seasonal EVI indextriggered by the onset of the summer wet season, but the albedovariation is less marked. The albedo in subtropical shrub and desertshrub regions decreases (6–12% less) while there is a large increasein EVI (75–175% more). In the specific case of LP, there a smallincrease in EVI (13%), but no significant change in albedo in thesame time period. In contrast, in the tropical deciduous forests,both albedo and EVI increase during the warm summer wet season(16-21% larger albedo and 220–255% increase in EVI). This increasein albedo for the tropical vegetation was reported previously for the
RT site (Watts et al., 2007) and is now seen to be characteristic of thetropical deciduous forest. It appears that this behavior is mainly dueto differences in soil albedo, which makes a significant contributionto total surface albedo in the dry, pre-monsoon conditions, butbecomes less important as the vegetation cover increases inresponse to the monsoon rains. Thus for maximum cover (aroundmid August) the observed albedo is very similar at all sites. A moredetailed study over a wide area will be necessary to confirm (orrefute) this suggestion.
All sites show a general average decrease in LST from the pre-monsoon values as the monsoon season fully develops, beingmoderate (w10 �C) in upper northern (LH) and lower southernregions (CH) and larger (w14 �C) at mid latitudes (RY, TV), witha maximum LST drop (w18 �C) in RT. Again, LP only shows a verysmall (w2 �C) mean decrease in LST. Thus we can conclude that thesurface characteristics at the LP site show a completely differentbehavior to the other sites considered in this study. LP may begeographically close to other sites, but its climatology is completelydifferent and does not show any influence from the NAM sys-tem.These sharp decreases in LST will reduce the outgoing long-wave radiation and so tend to increase net radiation at the surface,assuming that the solar radiation remains roughly constant.However, it is likely that there will be an increase in cloudiness afterthe monsoon onset, which will tend to reduce incoming solarradiation, so that the change in net radiation may be quite small inmany cases (Mendez-Barroso and Vivoni, 2010).
The EVI summer growth in the NAM region relies on the timingand intensity of the precipitation. If the rains are delayed or theprecipitation occurs as occasional, high intensity events, thenoptimum vegetation development (EVI growth) may not beattained, since the excess water will run off after the soil reachessaturation, so that it does not contribute to plant growth. In general,there will be increased vegetation growth when the precipitation isabove average but spatial variability will also be very high (Men-dez-Barroso et al., 2009; Mendez-Barroso and Vivoni, 2010).
It should be mentioned that this study has some limitations. Forexample, the satellite products only select cloud free conditions sothe expected increase in cloudiness after monsoon onset is notaddressed here. Also, only 6 sites have been selected for analysis.Surface fluxes of radiation, heat, water vapor and CO2 are measuredat the three northern sites (LH, RY and TP) and similar measure-ments at the southern sites would allow more detailed analyses tobe undertaken, linking these fluxes to the satellite observationsover the entire region.
Acknowledgements
The authors wish to thank all the agencies that have directlysupported this research and without their financial support itwould be impossible to obtain these results: CONACYT, NOAA. Alsowe would like to thank Dave Gochis from UCAR, Michael Douglasfrom NOAA, Enrique Vivoni from Arizona State University for theirfruitful discussions and comments.
References
Davidson, A., Wang, S., 2005. Spatiotemporal variations in land surface albedoacross Canada from MODIS observations. Can. J. Remote. Sens. 31 (5), 377–390.
Douglas, M.W., Maddox, R.A., Howard, K., Reyes, S., 1993. The mexican monsoon. J.Climate 6, 1665–1677.
European Commission, DG AGRI, EUROSTAT and the Joint Research Centre (Ispra),European Environment Agency, 2000. From Land Cover to Landscape Diversityin the European Union. http://ec.europa.eu/agriculture/publi/landscape/index.htm Available online at:Last visited December 27th, 2008.
Friedl, M., 2002. Validation of the Consistent-year V003 MODIS Land Cover Product.Available online at: http://landval.gsfc.nasa.gov/pdf/MOD12_supporting_materials.PDF Last visited on February 20th, 2009.

C. Lizarraga-Celaya et al. / Journal of Arid Environments 74 (2010) 540–548548
Garcıa-Oliva, F., Maass, J.M., Galicia, L., 1995. Rainstorm analysis and rainfallerosivity of a seasonal tropical region with a strong cyclonic influence on thepacific coast of Mexico. J. Appl. Meteor. 34, 2491–2498.
Gochis, D.J., Leal, J.C., Shuttleworth, W.J., Watts, C.J., Garatuza-Payan, J., 2003. Prelimi-nary diagnostics from a new event-based precipitation monitoring system insupport of the North American Monsoon Experiment. J. Hydrometeor. 4, 974–981.
Gochis, D.J., Jimenez, A., Watts, C.J., Garatuza-Payan, J., Shuttleworth, W.J., 2004.Analysis of 2002 and 2003 warm-season precipitation from the North Americanmonsoon experiment rain gauge network. Mon. Weather Rev. 132, 2938–2953.
Gochis, D.J., Brito-Castillo, L., 2006. Hydroclimatology of the North AmericanMonsoon Region in North west Mexico. J. Hydrol. 316, 53–70.
Gochis, D.J., Watts, C.J., Garatuza-Payan, J., Rodriguez, J.C., 2007. Spatial andtemporal patterns of precipitation intensity as observed by the NAME EventRain Gauge Network from 2002 to 2004. J. Climate 20, 1734–1750.
Higgins, R.W., Yao, Y., Wang, X.L., 1997. Influence of the North American Monsoonsystem on the U.S. summer precipitation regime. J. Climate 10, 2600–2622.
Higgins, W., Gochis, D.J., 2007. A Synthesis of the results from the North AmericanMonsoon Experiment (NAME). J. Climate 20, 1601–1607.
Huete, A., Justice, C., van Leeuwen, W., 1999. MODIS Vegetation index, AlgorithmTheoretical Basis Document, Version 3. Available online at: http://modis.gsfc.nasa.gov/data/atbd/atbd_mod13.pdf Last visited December 26th, 2008.
Huete, A., Didan, K., Miura, T., Rodriguez, E.P., Gao, X., Ferreira, L.G., 2002. Overviewof the radiometric and biophysical performance of the MODIS vegetationindexes. Remote Sens. Environ. 83, 195–213.
Iqbal, M., 1984. Introduction to Solar Radiation. Academic Press Inc.Maass, J.M., Vose, J.M., Swank, W.T., Martinez-Yrizar, A., 1995. Seasonal changes of
leaf area index (LAI) in a tropical deciduous forest in west Mexico. For. Ecol.Manage. 74, 171–180.
Mendez-Barroso, L.A., Vivoni, E.R., 2010. Observed shifts in land surface conditionsduring the North American Monsoon: implications for a vegetation-rainfallfeedback mechanism. J. Arid Environ. 74, 549–555.
Mendez-Barroso, L.A., Vivoni, E.R., Watts, C.J., Rodrıguez, J.C., 2009. Seasonal andinterannual relation between precipitation, surface soil moisture and vegeta-tion dynamics in the North American monsoon regional. J. Hydrol. 377, 59–70.
CPC-NWS, 2008. US-Mexico Climatology (Annual Cycle). Available online:. ClimatePrediction Center, National Weather Service http://www.cpc.noaa.gov/products/precip/CWlink/clim.table.html Last visited on December 29th, 2008.
Salinas-Zavala, C.A., Douglas, A.V., Diaz, H.F., 2001. Interannual variability of NDVI innorthwest Mexico. Associated Climatic Mechanism and Ecological Implications.Remote Sens. Environ. 82, 417–430.
Schaaf, C.B., Gao, F., Strahler, A.H., Lucht, W., Li, X., Tsang, T., Strugnell, N.C.,Zhang, X., Jin, Y., Muller, J.-P., Lewis, P., Barnsley, M., Hobson, P., Disney, M.,Roberts, G., Dunderdale, M., Doll, C., d’Entremont, R., Hu, B., Liang, S.,Privette, J.L., 2002. First operational BRDF, Albedo and Nadir reflectance prod-ucts from MODIS. Remote Sens. Environ. 83, 135–148.
Strahler, A.H., Lucht, W., Schaaf, C.B., Tsang, T., Gao, F., Li, X., Muller, J.-P., Lewis, P.,Barnsley, M.J., 1999a. MODIS BRDF/Albedo Product, Algorithm Theoretical BasisDocument. Available online at: http://modis.gsfc.nasa.gov/data/atbd/atbd_mod09.pdf Last visited on December 26th, 2008.
Strahler, A.H., Muchoney, D., Borak, J., Friedl, M., Gopal, S., Lambin, E., Moody, A.,1999b. MODIS Land Cover Product, Algorithm Theoretical Basis Document.Available online at: http://modis.gsfc.nasa.gov/data/atbd/atbd_mod12.pdf Lastvisited on February 20th, 2009.
Vivoni, E.R., Rodriguez, J.C., Watts, C.J., in press. On the spatiotemporal variability ofsoil moisture and evapotranspiration in a mountainous basin within the NorthAmerican Monsoon Region, Water Resources Research.
Vivoni, E.R., Moreno, H.A., Mascaro, G., Rodrıguez, J.C., Watts, C.J., Garatuza-Payan, J.,Scott, R.L., 2008. Observed relation between evapotranspiration and soilmoisture in the North American monsoon region. Geophys. Res. Lett. 35,L22403. doi:10.1029/2008GL036001.
Wan, Z., 1999. MODIS Land-Surface Temperature, Algorithm Theoretical BasisDocument, Version 3.3. Available online at: http://modis.gsfc.nasa.gov/data/atbd/atbd_mod11.pdf Last visited December 26th, 2008.
Watts, C.J., Scott, R.L., Garatuza-Payan, J., Rodriguez, J.C., Prueger, J.H., Kustas, W.P.,Douglas, M.D., 2007. Changes in vegetation condition and surface fluxes duringNAME 2004. J. Climate 20, 1810–1820.
Zhang, X., Friedl, M.A., Schaaf, C.B., Strahler, A.H., Hodges, J.C.F., Gao, F., Reed, B.C.,Huete, A., 2003. Monitoring vegetation phenology using MODIS. Remote Sens.Environ. 84, 471–475.
Zhou, L., Dickinson, R.E., Tian, Y., Zeng, X., Dai, Y., Yang, Z.-L., Schaaf, C.B., Gao, F.,Jin, Y., Strahler, A., Myneni, R.B., Yu, H., Wu, W., Shaikh, M., 2003. Comparison ofseasonal and spatial variations of albedos from Moderate-Resolution ImagingSpectroradiometer (MODIS) and Common Land Model. J. Geophys. Res. 108(D15), 4488. doi:10.1029/2002JD003326.