DEPARTMENT OF PHYSICS Spatio-Temporal Organization of ...
156
DEPARTMENT OF PHYSICS TECHNISCHE UNIVERSITÄT MÜNCHEN Dissertation Spatio-Temporal Organization of Enzymatic Reactions Giovanni Giunta
-
Upload
khangminh22 -
Category
Documents
-
view
2 -
download
0
Transcript of DEPARTMENT OF PHYSICS Spatio-Temporal Organization of ...

DEPARTMENT OF PHYSICSTECHNISCHE UNIVERSITÄT MÜNCHEN
Dissertation
Spatio-Temporal Organization ofEnzymatic Reactions
Giovanni Giunta
Fakultät für PhysikTechnische Universität München
Spatio-Temporal Organization ofEnzymatic Reactions
Giovanni Giunta
Vollständiger Abdruck der von der Fakultät für Physik der Technischen UniversitätMünchen zur Erlangung des akademischen Grades eines
Doktor der Naturwissenschaften (Dr. rer. nat.)
genehmigten Dissertation.
Vorsitzender:Prof. Dr. Friedrich C. Simmel
Prüfende der Dissertation:1. Prof. Dr. Ulrich Gerland2. Prof. Dr. Martin Zacharias
Die Dissertation wurde am 16.10.2020 bei der Technischen Universität Müncheneingereicht und durch die Fakultät für Physik am 17.11.2020 angenommen.

Abstract
All living organisms rely on the catalytic activity of enzymes to carry out most oftheir biological functions. Enzymes catalyze, i.e. accelerate, the conversion of theso-called substrates into products. The efficiency of enzymatic reactions depends on theencounter rate between enzyme and substrate. This, in turn, is affected by the enzymeand substrate motion and also by their spatial arrangement.
Typically, in cells, substrate molecules diffuse while being exposed to several lossmechanisms. To intercept them and shorten their diffusive trajectories, enzymes canbe placed in proximity of substrate sources. For example, in cases in which thesubstrate is imported into the cytoplasm from the external environment, enzymesare sometimes localized at the external membrane. In contrast, when the substrateis produced inside organelles and diffuses into the cytoplasm through the organellemembrane, enzymes are found to be bound to the organelles. In this thesis, we derivean optimal allocation principle for the static spatial arrangement of enzymes so as tomaximize the reaction flux of an enzymatic reaction. The allocation principle applies tosystems where substrate enters either through the external boundary or the boundary ofinternal compartments. By drawing an analogy between the biophysical enzyme spatialallocation problem and an economical portfolio optimization, we are able to solve forthe optimal strategy. The solution allows us to characterize a transition in the optimalenzyme arrangement from a fully bound configuration into a more extended profile,where enzymes are also present in the interior of the system. Moreover, the optimalstrategy permits us to derive a deterministic construction algorithm to systematicallybuild up the optimal enzyme arrangement as the amount of enzymes in the systemgradually increases. The construction algorithm can help in the design of optimalsynthetic bio-reactors. In fact, the amount of enzymes bound and their localization canbe controlled with the use of several techniques.
While substrate molecules undergo a diffusive motion, recent experiments suggestthat the motion of enzymes can be affected by the substrate concentration profile.Different models have been proposed over the last decade to describe the enzymemotion and try to explain the experimental results, which are at times contradictory.These models study how enzymes move in response to pre-imposed substrate profiles.They neglect the feedback from enzyme transport onto the substrate caused by thereaction. In this thesis, we show that such a feedback leads to spontaneous spatial
ii

Abstract
pattern formation from initial homogeneous concentrations for one of the proposedmodels. For this model, enzymes can move in response to substrate and productgradients due to nonspecific interactions of the enzyme with the substrate and theproduct. These interactions generate cross-diffusion terms in the enzyme motion thatcan drive the accumulation of enzymes in regions of low substrate and high productconcentrations. In these regions, the reaction then amplifies local substrate and productfluctuations, steepening the substrate and product gradients, hence further driving theaccumulation of enzymes. Experimental analysis of spontaneous pattern formationcan in principle determine whether or not nonspecific interactions play a role in theenzyme motion.
iii

Zusammenfassung
Alle lebenden Organismen sind für die Erfüllung des Großteils ihrer biologischen Funk-tionen auf die katalytische Aktivität von Enzymen angewiesen. Enzyme katalysieren,d.h. sie beschleunigen die Umwandlung der so genannten Substrate in Produkte. DieEffizienz enzymatischer Reaktionen hängt von der Begegnungsrate zwischen Enzymund Substrat ab. Diese wiederum wird von der Bewegung der Enzyme und Substratesowie von deren räumlicher Anordnung beeinflusst.
Typischerweise diffundieren Substratmoleküle in Zellen, während sie verschiedenenVerlustmechanismen ausgesetzt sind. Um sie abzufangen und ihre diffusiven Wege zuverkürzen, können Enzyme in der Nähe von Substratquellen platziert werden. In Fällen,in denen das Substrat aus der äußeren Umgebung in das Zytoplasma transportiertwird, werden Enzyme beispielsweise manchmal an der äußeren Membran lokalisiert.Wenn das Substrat dagegen innerhalb von Organellen produziert wird und durch dieOrganellenmembran in das Zytoplasma diffundiert, werden Enzyme an den Organellengebunden. In dieser Arbeit leiten wir ein optimales Allokationsprinzip für die statischeräumliche Anordnung der Enzyme ab, um den Reaktionsfluss einer enzymatischenReaktion zu maximieren. Das Allokationsprinzip gilt für Systeme, bei denen dasSubstrat entweder durch eine äußere Begrenzung oder durch die Begrenzungen innererKompartimente eintritt. Indem wir eine Analogie zwischen dem biophysikalischenräumlichen Allokationsproblem der Enzyme und einer ökonomischen Portfolioopti-mierung ziehen, sind wir in der Lage, die optimale Strategie zu finden. Diese Lösungerlaubt es uns, einen Übergang in der optimalen Enzymanordnung von einer voll-ständig gebundenen Konfiguration in ein erweitertes Profil, in dem auch Enzyme imInneren des Systems vorhanden sind, zu charakterisieren. Darüber hinaus könnenwir von der optimalen Strategie einen deterministischen Konstruktionsalgorithmusableiten, um bei allmählicher Zunahme der Menge der Enzyme im System systematischdie optimale Enzymanordnung aufzubauen. Der Konstruktionsalgorithmus kann beimEntwurf optimaler synthetischer Bioreaktoren helfen. Tatsächlich kann die Mengeder gebundenen Enzyme und ihre Lokalisierung mit Hilfe verschiedener Technikenkontrolliert werden.
Während Substratmoleküle einer diffusiven Bewegung unterliegen, deuten neuereExperimente darauf hin, dass die Bewegung der Enzyme durch das Substratkonzen-trationsprofil beeinflusst werden kann. Im letzten Jahrzehnt wurden verschiedene
iv
Zusammenfassung
Modelle vorgeschlagen, um die Enzymbewegung zu beschreiben und zu versuchen, diemanchmal widersprüchlichen experimentellen Ergebnisse zu erklären. Diese Modelleuntersuchen, wie sich Enzyme als Reaktion auf vorgegebene Substratprofile bewegen,vernachlässigen dabei aber die Rückkopplung des durch die Reaktion verursachtenEnzymtransports auf das Substrat. In dieser Arbeit zeigen wir, dass eine solcheRückkopplung bei einem der vorgeschlagenen Modelle zur spontanen räumlichenMusterbildung aus anfänglich homogenen Konzentrationen führt. Bei diesem Modellkönnen sich die Enzyme als Reaktion auf Substrat- und Produktgradienten aufgrundunspezifischer Wechselwirkungen des Enzyms mit dem Substrat und dem Produktbewegen. Diese Interaktionen erzeugen Kreuzdiffusionsterme in der Enzymbewe-gung, die die Akkumulation von Enzymen in Regionen mit niedrigen Substrat- undhohen Produktkonzentrationen antreiben können. In diesen Regionen verstärkt dieReaktion dann lokale Substrat- und Produktfluktuationen, wodurch die Substrat- undProduktgradienten steiler werden und somit die Anreicherung von Enzymen weitervorangetrieben wird. Im Prinzip kann man über die experimentelle Untersuchungder spontanen Musterbildung bestimmen, ob unspezifische Wechselwirkungen bei derEnzymbewegung eine Rolle spielen oder nicht.
v
Contents
Abstract ii
Zusammenfassung iv
1. What is an enzyme and how does it work? 11.1. Discovery of enzymes . . . . . . . . . . . . . . . . . . . . . . . . . . . . . 11.2. Enzyme catalysis . . . . . . . . . . . . . . . . . . . . . . . . . . . . . . . . 2
1.2.1. Energetics of enzyme catalysis . . . . . . . . . . . . . . . . . . . . 21.2.2. Structural view of enzyme catalysis . . . . . . . . . . . . . . . . . 4
1.3. Enzyme kinetics . . . . . . . . . . . . . . . . . . . . . . . . . . . . . . . . . 71.3.1. Michaelis-Menten equation . . . . . . . . . . . . . . . . . . . . . . 71.3.2. Reversible Michaelis-Menten equation . . . . . . . . . . . . . . . 101.3.3. A model for cooperativity: the Hill’s function . . . . . . . . . . . 111.3.4. Enzyme inhibiton . . . . . . . . . . . . . . . . . . . . . . . . . . . . 13
2. Spatial organization and dynamics of enzymatic reactions 152.1. The role of diffusion on enzyme kinetics . . . . . . . . . . . . . . . . . . 152.2. Metabolic channeling . . . . . . . . . . . . . . . . . . . . . . . . . . . . . . 18
2.2.1. Advantages of metabolic channeling . . . . . . . . . . . . . . . . . 192.2.2. Metabolic channeling via structural features . . . . . . . . . . . . 202.2.3. Metabolon formation . . . . . . . . . . . . . . . . . . . . . . . . . . 23
2.3. Organelles and microcompartments . . . . . . . . . . . . . . . . . . . . . 242.4. Membrane bound enzymes . . . . . . . . . . . . . . . . . . . . . . . . . . 252.5. Synthetic strategies . . . . . . . . . . . . . . . . . . . . . . . . . . . . . . . 282.6. Enzyme motion . . . . . . . . . . . . . . . . . . . . . . . . . . . . . . . . . 33
2.6.1. Enhanced diffusion . . . . . . . . . . . . . . . . . . . . . . . . . . . 332.6.2. Directed motion in substrate gradients . . . . . . . . . . . . . . . 35
3. Design principles for the optimal spatial arrangement of enzymes 433.1. Introduction . . . . . . . . . . . . . . . . . . . . . . . . . . . . . . . . . . . 453.2. Model . . . . . . . . . . . . . . . . . . . . . . . . . . . . . . . . . . . . . . . 473.3. Results . . . . . . . . . . . . . . . . . . . . . . . . . . . . . . . . . . . . . . 50
3.3.1. Generalization of Kelly criterion . . . . . . . . . . . . . . . . . . . 51
vi

Contents
3.3.2. Optimal allocation principle . . . . . . . . . . . . . . . . . . . . . 533.3.3. General condition for transitions in the optimal enzyme arrange-
ment . . . . . . . . . . . . . . . . . . . . . . . . . . . . . . . . . . . 563.3.4. Geometrical analysis . . . . . . . . . . . . . . . . . . . . . . . . . . 583.3.5. Construction Algorithm . . . . . . . . . . . . . . . . . . . . . . . . 60
3.4. Methods for the computation of the marginal returns vector and theHessian for a discrete system . . . . . . . . . . . . . . . . . . . . . . . . . 633.4.1. Linear reactions . . . . . . . . . . . . . . . . . . . . . . . . . . . . . 633.4.2. Non-linear reactions . . . . . . . . . . . . . . . . . . . . . . . . . . 64
3.5. Discussion . . . . . . . . . . . . . . . . . . . . . . . . . . . . . . . . . . . . 65
4. Cross-diffusion induced patterns for a single-step enzymatic reaction 684.1. Introduction . . . . . . . . . . . . . . . . . . . . . . . . . . . . . . . . . . . 684.2. Model . . . . . . . . . . . . . . . . . . . . . . . . . . . . . . . . . . . . . . . 714.3. Results . . . . . . . . . . . . . . . . . . . . . . . . . . . . . . . . . . . . . . 74
4.3.1. Instability driven by substrate-induced cross-diffusion . . . . . . 744.3.2. Positive feedback causing pattern formation . . . . . . . . . . . . 784.3.3. The role of enhanced diffusion . . . . . . . . . . . . . . . . . . . . 804.3.4. Inclusion of enzyme-product interaction . . . . . . . . . . . . . . 81
4.4. Discussion . . . . . . . . . . . . . . . . . . . . . . . . . . . . . . . . . . . . 83
5. Summary and outlook 86
Appendices 89
A. Design principles for the optimal spatial arrangement of enzymes 90A.1. General Lagrangian with multiple subspaces . . . . . . . . . . . . . . . . 90A.2. Optimal enzyme arrangement in a one-dimensional system . . . . . . . 92A.3. Marginal returns landscape . . . . . . . . . . . . . . . . . . . . . . . . . . 95A.4. Derivation of the transition condition . . . . . . . . . . . . . . . . . . . . 96A.5. Reduction of numerical complexity in a one-dimensional system with drift 98A.6. One-dimensional system with two sources of substrate . . . . . . . . . . 99A.7. Optimal enzyme allocation algorithm for discretized systems . . . . . . 101
B. Cross-diffusion induced patterns for a single-step enzymatic reaction 105B.1. Linear instability analysis for enzyme interacting with substrate only . 105
B.1.1. Homogeneous steady state solution . . . . . . . . . . . . . . . . . 105B.1.2. Instability of the well-mixed system . . . . . . . . . . . . . . . . . 107B.1.3. Instability of the reaction-diffusion system . . . . . . . . . . . . . 108B.1.4. Instability type II . . . . . . . . . . . . . . . . . . . . . . . . . . . . 111
vii
Contents
B.1.5. Timescale of pattern formation . . . . . . . . . . . . . . . . . . . . 112B.2. No short-range interactions . . . . . . . . . . . . . . . . . . . . . . . . . . 112
B.2.1. Michaelis Menten form . . . . . . . . . . . . . . . . . . . . . . . . 113B.2.2. Hill function . . . . . . . . . . . . . . . . . . . . . . . . . . . . . . . 113B.2.3. Different affinity constant . . . . . . . . . . . . . . . . . . . . . . . 114
B.3. Cross-diffusion of enzyme by product gradients . . . . . . . . . . . . . . 115B.4. Simulation parameters . . . . . . . . . . . . . . . . . . . . . . . . . . . . . 116
List of Figures 118
List of Tables 120
Bibliography 121
Acknowledgments 143
viii
1. What is an enzyme and how does itwork?
Enzymes are catalysts that accelerate biochemical reactions at fast enough rates tosustain life. As catalysts, they have the role of lowering the energy barrier for chemicalreactions to proceed. They are mostly proteins and are used by all living cells tocatalyze the conversion of food to energy, the formation of building blocks and thedisposal of waste chemicals. The enzyme catalysis begins with the binding of theenzyme to a certain molecule called substrate. In this bound state the enzyme andthe substrate form a temporary complex, the structure of which favors the conversionof the substrate into a product. Once the reaction occurs, the product detaches fromthe enzyme and the enzyme is again ready for another catalytic cycle. The enzymaticactivity of an ensemble of many enzymes can depend on the amount of substrate andproduct available in the surroundings, or it can be inhibited by other chemicals. In thischapter, we provide a more detailed description of enzyme catalysis from an energeticand structural point of view. Moreover, we present different enzyme kinetic modelsdescribing how the rate of product formation is affected by changes in the amount ofsubstrate, product and how it is affected in the presence of inhibitors.
1.1. Discovery of enzymes
The word ‘enzyme’ was first coined in 1876 by the German physiologist Wilhelm Kühne,from Ancient Greek εν (en,"in") + ζνµε (zúme, "leavened" or "in yeast") [1]. It referredto the substances used by alive yeast cells to carry out the fermentation of sugars toalcohol. It was only in 1897 that Eduard Buchner discovered that fermentation couldtake place with cell-free extracts [2]. From this moment on, the word enzyme startedto be used to refer to extracts and substances able to catalyze biochemical reactions.However, the nature and the mechanism behind the enzyme catalysis were largelyunknown until mid 1900s. It was in 1926 that James B. Sumner crystallized the enzymeurease (responsible for breaking down urine into ammonia and carbon dioxide) andshowed that it is a pure protein [3]. Similarly, John H. Northrop in 1929 showed thatthe enzymes pepsin, trypsin and chymotrypsin (active in the digestive process) arepure proteins as well [4, 5]. Since these discoveries, enzymes have been long thought
1

1. What is an enzyme and how does it work?
to be exclusively proteins, i.e. composed of long chains of amino acids. However in1978 and 1982, respectively, Thomas R. Cech and Sidney Altman showed that foldedRNA molecules can also catalyze biochemical reactions [6, 7]. Such RNA moleculeshave been named ‘ribozymes’ (ribonucleic acid enzymes) [7] and to date they are thesimplest form of enzymes. The discovery of ribozymes is important in the context ofthe origin of life on Earth. A long standing question in evolutionary biology is: Whatcame first, the proteins needed for DNA replication or the DNA strands containinginformation about the proteins? In the ‘RNA world hypothesis’ we have RNA strandsthat are both capable of containing information in form of sequences of nucleic acids,just like DNA, and also show catalytic activity [8]. Hence a likely scenario for early lifeon Earth is an environment where RNA strands have the opportunity of self-replicateand store information encoded as nucleic acids sequences.
Although ribozymes might have played a crucial role in the early life, most of theknown enzymes in current living organisms are proteins or a mixture of proteinaceousstructures and RNA sequences with catalytic activity. Hence the main focus of this andthe following chapters will be on protein enzymes.
1.2. Enzyme catalysis
1.2.1. Energetics of enzyme catalysis
Enzyme catalysis initiates when a certain molecule S called substrate binds to theenzyme E, forming the enzyme-substrate complex ES. In the complexed form, theenzyme-substrate interaction favors the formation of the biochemical product P. Oncethe reaction is completed the product detaches from the enzyme, the enzyme reverts toits original form and is able to bind another substrate molecule to repeat the catalysis [9].An overview of the thermodynamics of enzyme catalysis can be seen in Fig. 1.1. Thefigure shows how the Gibbs free energy changes as the reaction proceeds in the absence(purple dashed line) and in the presence (orange line) of the enzyme. In the absenceof the enzyme the reaction can occur spontaneously if the difference in Gibbs freeenergy between the substrate and the product is negative [10]. This implies that theproduct is in a favorable, more stable energetic state than the substrate. However ahigh energy barrier, known as activation energy, needs to be overcome for the reactionto occur. The activation energy depends on the stability of the substrate molecule. Themore stable the substrate molecule, the higher the barrier and the longer it takes forthermal fluctuations to push the reaction forward. The rate of the reaction stronglydepends on the rate at which the state corresponding to the top of the energy barrieris reached. Such state is called transition state and once it is passed, the substratequickly transforms into the product. The presence of the enzyme has the overall effect
2

1. What is an enzyme and how does it work?G
ibb
s fr
ee e
nerg
y
Reaction coordinate
S+E
ES
P+E
Effect ofcatalysis
Free energydifference ΔGSP
with Enzyme
spontaneous
ES‡
Transition state
Figure 1.1.: Thermodynamics of en-zyme catalysis. The Gibbs free en-ergy is plotted as the reaction of asubstrate S into a product P proceedsfrom left to right. The purple dashedline and the orange solid line repre-sent the change in free energy in caseof a spontaneous reaction and a re-action in presence of the enzyme Erespectively. The effect of catalysis isto lower the activation energy of thetransition state, which corresponds tothe highest energetic state. First S andE form the enzyme-substrate complexES. In the complexed form the transi-tion state ES‡ is reached more easily.Once the transition state is passed, theproduct is quickly formed. Hence inthe presence of E, the rate of reactionis increased. The most right hand sideof the reaction coordinate representsthe state where P is detached from E.
of lowering the activation energy needed for the reaction to occur. According to thetypical coarse-grained picture, the substrate and the enzyme first bind, forming theES complex, and then the real step of catalysis takes place. The enzyme-substrateinteraction favors the reaction and the new transition state ES‡ has a lower activationenergy as compared to the transition state of the spontaneous reaction. The transitionstate is reached more easily and the rate of product formation is increased [11]. Oncethe catalysis happens and the product is formed, the product detaches from the enzymeleading us to the end of the catalytic cycle. In Fig. 1.1, this corresponds to the mostright hand side of the reaction coordinate, where enzyme and product are presentseparately. The enzyme is now available for the binding of a new substrate moleculeand the catalytic cycle can start over.
How much faster can reactions be in presence of enzymes? One of the most proficientenzymes is the arginine decarboxylase that catalyzes the conversion of L-arginine intoagmatine and carbon dioxide. The acceleration of such reaction is of 19 order ofmagnitudes [12]. In this case, the spontaneous reaction would occur in a time almost aslong as the age of the Earth. Instead, the presence of the enzyme speeds up the reactionrate to ≈ 103 reactions per second. Another example is the carbonic anhydrase whichis considered to be one of the fastest enzymes and it catalyzes the interconversionof carbon dioxide and water to hydrogen protons and bicarbonate ions [13]. Carbon
3

1. What is an enzyme and how does it work?
anhydrase speeds up the reaction rate by 7 order of magnitudes taking the rate from≈ 10−1s−1 to ≈ 106s−1 [12]. These examples show the key role of enzymes in livingsystems: although they do not alter the chemical equilibrium of a reaction [10], theyhelp biochemical reactions to be on relevant timescales.
1.2.2. Structural view of enzyme catalysis
Enzymes are usually much larger than their corresponding substrate. For example,the to date smallest protein enzyme, the monomer of 4-Oxalocrotonate tautomerase(4-OT), is a chain of 62 amino acids residues [14] catalyzing the isomerization of β,γ-unsaturated enones to their α,β-isomers, which are organic compounds of ≈ 156Da(hence comparable to the molecular weight of a single amino acid). Just 4 out of the 62amino acids of the monomeric 4-OT enzyme are involved in the catalysis [15]. For ageneric enzyme this is often the case: only a small part of the enzyme is involved in thecatalysis, the so called ‘catalytic site’. The catalytic site is often adjacent to the bindingsite, which is the site at which the substrate binds the enzyme. Together the bindingsite and the catalytic site form the ‘active site’, which is the site where all the stepsof catalysis as depicted in Fig. 1.1 take place. In Fig. 1.2 the structure of the enzyme
Figure 1.2.: An example of enzymatic struc-ture. In the figure we see the structure of theenzyme lysozyme (white molecule), responsi-ble for the breaking down of the cell wall ofgram positive bacteria. The substrate (black)binds the enzyme at the binding site (bluearea). Adjacent to the binding site is the cat-alytic site (red area), where the catalitic step ofthe enzymatic reaction takes place. The bind-ing site and the catalitic site constitute togetherthe active site. Figure adapted from Wikime-dia Commons: ‘Enzyme structure’ by ThomasShafee under CC BY 4.0 License. The proteinstructure original sources are PDB:9LYZ and[16].
lysozyme is shown (white molecule). The lysozyme is an enzyme composed of 129amino acids that plays an important role in the innate immune systems of animals. It isresponsible for breaking the bonds between residues of the cell wall of gram positivebacteria, ultimately causing their lysis. More specifically, it catalyzes the hydrolysis of1,4-beta-linkages between N-acetylmuramic acid and N-acetyl-D-glucosamine residuesin the peptidoglycan [16]. The peptidoglycan is the polymer consisting of sugars
4

1. What is an enzyme and how does it work?
and amino acids that forms the cell wall. In Fig. 1.2, we can see how the active site,composed of the binding site (blue) and the catalytic site (red) is only a small part ofthe enzyme. Moreover, it is immediately visible that the substrate molecule (black) ismuch smaller than the enzyme.
Now that we know how a typical enzyme looks like, we can analyze the molecularmechanisms underlying the catalysis.
Substrate binding
The binding of substrate to the active site is highly specific [17]. To characterize thisbinding, Emil Fisher proposed the so called ‘lock and key’ model in 1894. He suggestedthat enzyme and substrate have complementary geometrical structures that fit just like akey into a lock [18]. Although the model well explains the high specificity of binding, itdescribes the enzyme and the substrate as rigid objects which is not the case. Moreover,the model does not explain how the energy of the transition state can be lowered. Amore realistic view of substrate binding and catalysis in general is provided by the‘induced fit’ model proposed by Daniel Koshman in 1958 [19]. According to the model,after the substrate binds, the enzyme and especially its active site are continuouslyreshaped by the interaction with the substrate in a way that the catalytic site of theenzyme is properly aligned with the substrate. In this way the substrate gets tightlybound to the enzyme and the interaction with the catalytic site favors the substrateinto its transition state, hence lowering the activation energy as illustrated in Fig. 1.1.Moreover, the conformational changes of the induced fit model can contribute to aconformational proofreading mechanism that helps the enzyme in selecting the rightsubstrate in noisy biochemical environments with many similar molecules [20].
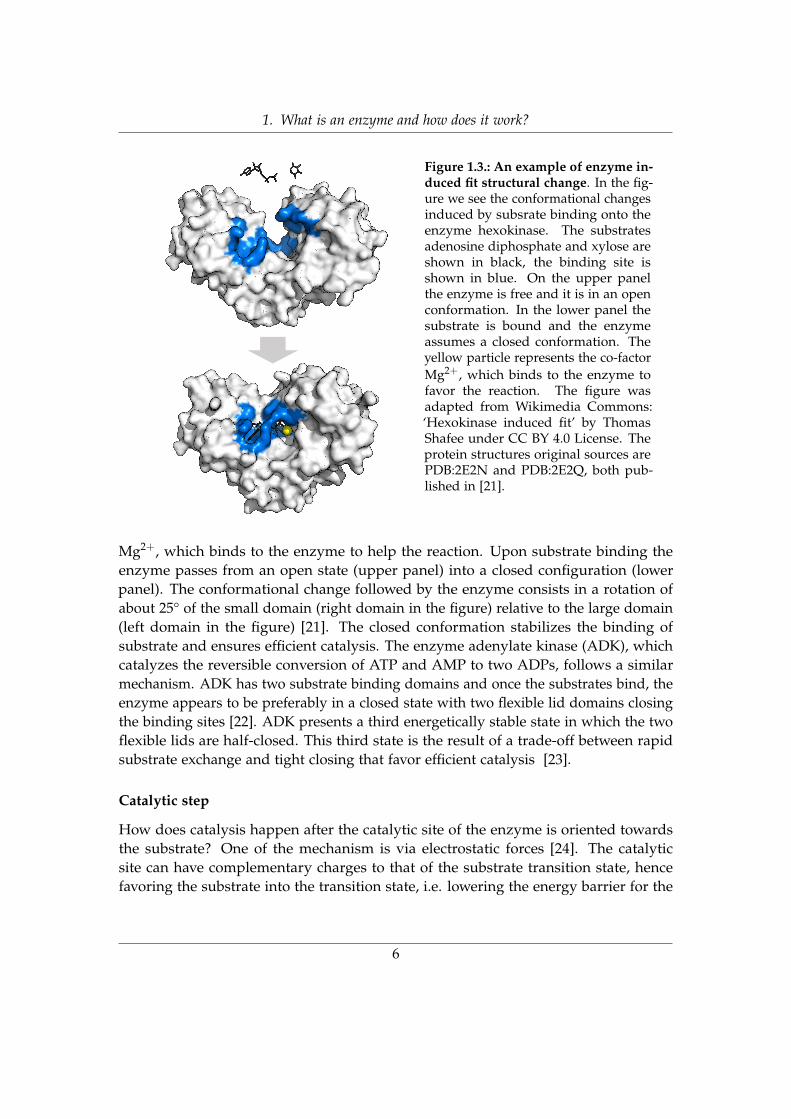
In Fig. 1.3 we see an example of induced fit for the enzyme hexokinase. Hexokinasecatalyzes the addition of a phosphate group (phosphorylation) to six-carbon sugarmolecules (hexoses). The most important substrate of hexokinase is glucose. Itsphosphorylation is the first step of glycolysis, which is a very important metabolicpathway that takes place in cells of all living organisms, and leads to the conversionof sugar molecules into energy. More specifically, glycolysis converts glucose intopyruvate acid and an hydrogen ion. The energy released during the different steps ofthe pathway is stored in high-energy molecules, such as adenosine triphosphate (ATP)and reduced nicotinamide adenine dinucleotide (NADH), which are the main sourcesof energy in cells. In Fig. 1.3, we can see how the hexokinase changes structure uponbinding of adenosine diphosphate (ADP) and the sugar xylose. Note that upon bindingof glucose the structural change of hexokinase is very similar to the one induced bythe binding of xylose, see [21] for details. The substrates are shown in black and theenzyme binding site is evidenced in blue. The yellow element represents the co-factor
5
1. What is an enzyme and how does it work?
Figure 1.3.: An example of enzyme in-duced fit structural change. In the fig-ure we see the conformational changesinduced by subsrate binding onto theenzyme hexokinase. The substratesadenosine diphosphate and xylose areshown in black, the binding site isshown in blue. On the upper panelthe enzyme is free and it is in an openconformation. In the lower panel thesubstrate is bound and the enzymeassumes a closed conformation. Theyellow particle represents the co-factorMg2+, which binds to the enzyme tofavor the reaction. The figure wasadapted from Wikimedia Commons:‘Hexokinase induced fit’ by ThomasShafee under CC BY 4.0 License. Theprotein structures original sources arePDB:2E2N and PDB:2E2Q, both pub-lished in [21].
Mg2+, which binds to the enzyme to help the reaction. Upon substrate binding theenzyme passes from an open state (upper panel) into a closed configuration (lowerpanel). The conformational change followed by the enzyme consists in a rotation ofabout 25° of the small domain (right domain in the figure) relative to the large domain(left domain in the figure) [21]. The closed conformation stabilizes the binding ofsubstrate and ensures efficient catalysis. The enzyme adenylate kinase (ADK), whichcatalyzes the reversible conversion of ATP and AMP to two ADPs, follows a similarmechanism. ADK has two substrate binding domains and once the substrates bind, theenzyme appears to be preferably in a closed state with two flexible lid domains closingthe binding sites [22]. ADK presents a third energetically stable state in which the twoflexible lids are half-closed. This third state is the result of a trade-off between rapidsubstrate exchange and tight closing that favor efficient catalysis [23].
Catalytic step
How does catalysis happen after the catalytic site of the enzyme is oriented towardsthe substrate? One of the mechanism is via electrostatic forces [24]. The catalyticsite can have complementary charges to that of the substrate transition state, hencefavoring the substrate into the transition state, i.e. lowering the energy barrier for the
6

1. What is an enzyme and how does it work?
reaction to occur. Alternatively the enzyme could participate in the reaction formingcovalent intermediates for which the energy barrier is lower. A typical example ofthis is the digestion of peptide chains by the serine proteases. In this case, at theactive site of the enzyme, the protein polypeptide binds either via hydrophobic or ionicinteractions. Then a proton transfer, mediated by favorable electrostatic interactions,causes the cleavage of the peptide bond and a part of the polypeptide is detached fromthe enzyme. However the other part is still covalently attached to the enzyme, formingan intermediate complex. A second proton transfer, favored by the presence of water,frees the binding site from the remaining polypeptide [9]. The opposite process, wherea peptide bond is formed can also be favored by the presence of an enzyme. In this casethe enzyme just serves as a template where the two substrates are brought to contactand oriented in a way to favor their reaction [9].
Generally, different enzymes follow different mechanisms, sometimes involving extracofactors [17] as for example shown in Fig. 1.3. However the underlying physical forcesin play are similar to the ones illustrated above. Non-covalent interactions, such ashydrogen bonds, electrostatic interactions, steric, ionic and hydrophobic forces can allcontribute to the catalysis. Sometimes these can also trigger the formation of temporaryintermediates that have lower activation energies. Note that in this case the Gibbs freeenergy of the reaction does not behave as in Fig. 1.1, but it presents more than twopeaks [25]. However the overall effect of the enzyme would still be the one of loweringthe activation energy barrier.
1.3. Enzyme kinetics
In the current section we are going to discuss different kinetics models used in thecharacterization of enzymatic reactions. The different models describe the rate ofreaction, i.e. the rate at which products are formed, as the concentrations of substrate,enzyme and product are varied.
1.3.1. Michaelis-Menten equation
In 1913 Leonor Michaelis and Maud Menten presented a model describing the kineticsof an enzyme following the same steps of the catalysis illustrated in Fig. 1.1 [26]. Firstthe substrate and the enzyme form a complex, then the catalytic step of the reactiontakes place and the product is formed. They assumed the complex formation to bea reversible process with forward and reverse rates k1 and k−1 respectively. Howeverthey considered the catalytic step to be an irreversible process. This assumption is validif the dissociation of the enzyme-product complex is fast and if the amount of productat the beginning of the reaction is low [25]. Hence, the reverse reaction of product and
7
1. What is an enzyme and how does it work?
enzyme to the enzymatic complex can be neglected and the reaction scheme takes theform
E + Sk1
k−1ES
kcat E + P . (1.1)
Starting from this reaction scheme, Michaelis and Menten derived a formula character-izing the velocity of reaction v as a function of substrate concentration s. The reactionvelocity corresponds to the rate of product formation, which according to the law ofmass action [27] takes the form
v =dpdt
= kcatc , (1.2)
where p and c are the concentrations of product and enzyme-substrate complex respec-tively and t is time. Here we rederive the Michaelis-Menten formula by following thederivation of Briggs and Haldane [28], i.e. by assuming that the concentration of theenzyme-substrate complex does not change on the timescale of product formation. Thisassumption, known as quasi-steady-state assumption, implies that the rate of complexformation equals the rate of dissociation
k1e0s = k−1c + kcatc . (1.3)
Here e0 is the concentration of free enzymes which is equal to e0 = e− c, where e is thetotal concentration of enzymes as given by the sum of free and complexed enzymes.Note that since the enzyme is a catalyst, its total amount does not change over thecourse of the reaction. From relation (1.3), we obtain
c =e s
k−1+kcatk1
+ s:=
e sKM + s
, (1.4)
where we defined the Michaelis-Menten constant KM = (k−1 + kcat)/k1. Finally, byinserting the above expression for c into Eq. (1.2), we get the famous Michaelis-Mentenexpression, describing the velocity of an enzymatic reaction as a function of the substrateand enzyme concentration
v = kcate s
KM + s. (1.5)
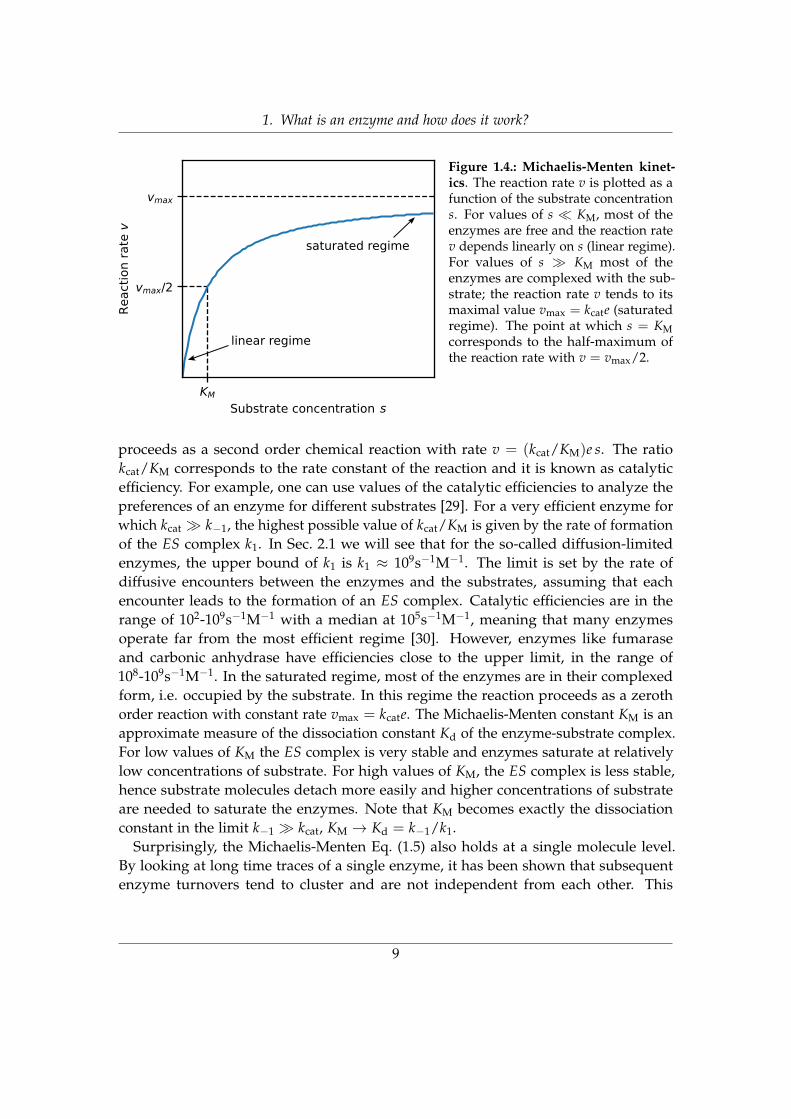
In Fig. 1.4 is shown the nonlinear behavior of the Michaelis-Menten relation as afunction of substrate concentration s, for a constant amount of enzymes e. We seethat we have a linear regime for s � KM and a saturated regime for s � KM, wherethe reaction rate tends to its maximal value vmax = kcate. The value of KM representsthe value of substrate concentration for which the reaction rate is half of the maximalvalue. In the linear regime (see Fig. 1.4) most of the enzymes are free. The reaction
8
1. What is an enzyme and how does it work?
s
saturated regime
linear regime
Figure 1.4.: Michaelis-Menten kinet-ics. The reaction rate v is plotted as afunction of the substrate concentrations. For values of s � KM, most of theenzymes are free and the reaction ratev depends linearly on s (linear regime).For values of s � KM most of theenzymes are complexed with the sub-strate; the reaction rate v tends to itsmaximal value vmax = kcate (saturatedregime). The point at which s = KMcorresponds to the half-maximum ofthe reaction rate with v = vmax/2.
proceeds as a second order chemical reaction with rate v = (kcat/KM)e s. The ratiokcat/KM corresponds to the rate constant of the reaction and it is known as catalyticefficiency. For example, one can use values of the catalytic efficiencies to analyze thepreferences of an enzyme for different substrates [29]. For a very efficient enzyme forwhich kcat � k−1, the highest possible value of kcat/KM is given by the rate of formationof the ES complex k1. In Sec. 2.1 we will see that for the so-called diffusion-limitedenzymes, the upper bound of k1 is k1 ≈ 109s−1M−1. The limit is set by the rate ofdiffusive encounters between the enzymes and the substrates, assuming that eachencounter leads to the formation of an ES complex. Catalytic efficiencies are in therange of 102-109s−1M−1 with a median at 105s−1M−1, meaning that many enzymesoperate far from the most efficient regime [30]. However, enzymes like fumaraseand carbonic anhydrase have efficiencies close to the upper limit, in the range of108-109s−1M−1. In the saturated regime, most of the enzymes are in their complexedform, i.e. occupied by the substrate. In this regime the reaction proceeds as a zerothorder reaction with constant rate vmax = kcate. The Michaelis-Menten constant KM is anapproximate measure of the dissociation constant Kd of the enzyme-substrate complex.For low values of KM the ES complex is very stable and enzymes saturate at relativelylow concentrations of substrate. For high values of KM, the ES complex is less stable,hence substrate molecules detach more easily and higher concentrations of substrateare needed to saturate the enzymes. Note that KM becomes exactly the dissociationconstant in the limit k−1 � kcat, KM → Kd = k−1/k1.
Surprisingly, the Michaelis-Menten Eq. (1.5) also holds at a single molecule level.By looking at long time traces of a single enzyme, it has been shown that subsequentenzyme turnovers tend to cluster and are not independent from each other. This
9

1. What is an enzyme and how does it work?
is due to a ‘memory effect’ caused by slow conformational fluctuations of the EScomplex [31]. Nevertheless, the inverse of the waiting time for an enzymatic reaction tooccur still depends on s, as given by Eq. (1.5). However, the microscopic interpretationsof kcat and consequently KM are different [32]. During catalysis the enzyme-substratecomplex ES undergoes many conformations and instead of having a single value forthe catalytic rate kcat, there is a distribution of values. The prefactor of Eq. (1.5) becomesthe weighted harmonic mean of the kcat values corresponding to the catalytic rates ofthe different enzyme-substrate complex conformations.
Overall, the Michaelis-Menten model provides a phenomenological law that describesthe kinetics of many different enzymes. However, there are enzymatic reactions forwhich the model assumptions do not hold. For the reaction scheme followed by theMichaelis-Menten model, Eq. (1.1), the catalytic step of the reaction is assumed to beirreversible. This assumption holds in case product molecules are quickly released bythe enzymatic complex after their formation and we are at the beginning of the reaction,when the product has not been yet accumulating in the system. Moreover enzymaticreactions are often affected by the binding of other molecules. These usually alter theenzyme activity by either inhibiting or increasing it. In the following sections, we willdiscuss kinetic models that include some of these effects.
1.3.2. Reversible Michaelis-Menten equation
As mentioned in the previous section the Michaelis-Menten model assumes an irre-versible catalytic step for the reaction. In case product molecules have accumulatedin the system, this assumption no longer holds and the reverse reaction needs to beconsidered [25]. We can therefore consider a reaction scheme that is similar to Eq. (1.1)but considers a fully reversible catalysis:
E + Sk1
k−1ES
k2
k−2E + P , (1.6)
where k2 and k−2 represent the forward and the reverse rate of the catalytic step ofthe enzymatic reaction, respectively. The reaction rate v can be derived by proceedingin a similar manner as done for the derivation of the Michaelis-Menten equation,i.e. by assuming that the complex ES is at steady state. Note that since now theprocess is totally reversible, it is possible to define a Michaelis-Menten constant forproduct formation, KS
M = (k−1 + k2)/k1, but also one for substrate formation, KPM =
(k−1 + k2)/k−2. By defining the catalytic rates for the forward and backward reaction
10

1. What is an enzyme and how does it work?
as kS = k1k2/(k−1 + k2) and kP = k−1k−2/(k−1 + k2) respectively, we obtain
v =kS s e− kP p e1 + s
KSM+ p
KPM
. (1.7)
Note that when p = 0, we get back the Michaelis-Menten equation: when no product ispresent in the system, the reverse reaction can be neglected. However when productaccumulates, the reverse reaction becomes relevant and causes the reaction rate todecrease.
For the reversible reaction scheme considered here, it is possible to relate the kineticparameters to the equilibrium constant. At the equilibrium v = 0, and
kSseqe = kP peqe , (1.8)
where with seq and peq we refer to the equilibrium concentrations of substrate andproduct respectively. From Eq. (1.8), we can express the equilibrium constant Keq as afunction of the kinetic parameters,
Keq =kS
kP=
peq
seq. (1.9)
This expression is known as the Haldane relationship. More complicated reactionschemes, e.g. multiple substrates reacting on the same enzyme, lead to a set of severalmore complex Haldane relationships; however there is at least one relationship betweenthe kinetic parameters and the equilibrium constant as given by Eq. (1.9).
1.3.3. A model for cooperativity: the Hill’s function
There are enzymes that do not follow the Michaelis-Menten kinetics Eq. (1.5), nor thereversible Michaelis-Menten one Eq. (1.7). These enzymes show a more complicatedkinetics where the reaction rate v is a sigmoidal function of the substrate concentrations, see Fig. 1.5. Typically these enzymes have sharper increases in the reaction rateas the concentration s is varied as compared to the simple Michaelis-Menten kinet-ics. One could say that such enzymes are more sensitive to perturbation in substrateconcentrations. The sharp increase in reaction rate upon small variations in s helpsin defining two different kinetic states, a saturated or active state and an inactive orlow activity state. This is used as a regulation mechanism for many enzymatic reac-tions and metabolic processes. For these reasons such enzymes are called ‘regulatoryenzymes’ [25].
But how do regulatory enzymes work on a structural level? Many enzymes are
11

1. What is an enzyme and how does it work?
KSubstrate concentration s
vmax/2
vmax
Reac
tion
rate
v
h = 1 Michaelis-Mentenh = 4 Positive coop.h = 0.5 Negative coop.
Figure 1.5.: Effects of cooperativebinding on enzyme kinetics. Weplot the reaction rate v as a func-tion of the substrate concentrations for different Hill functions. We cansee that for a Hill coefficient h = 1the Hill function coincides with aMichaelis-Menten kinetics. In case ofpositive cooperative binding, h = 4,the reacion rate rapidly shifts from alow activity state where v ≈ 0 to astate of high activity where v reachesits maximal value vmax. For a neg-ative cooperative effect, in a regimewhere s > K, higher values of s areneeded to reach similar v values ascompared to the Michaelis-Mentenkinetics. The point at which s = Kcorresponds to the half-maximum ofthe reaction rate with v = vmax/2.
present in solution as oligomers, i.e. enzymes of the same type bind to form largerstructures composed of few units, each called a monomer. An example of this is themammalian hemoglobin, protein responsible for carrying oxygen in blood vessels, thatpresents four monomers with four binding sites. The hemoglobin is therefore able tobind up to four oxygen molecules. Once an oxygen molecule binds, it induces structuralchanges in the oligomeric structure that further favor the biding of an other substratemolecule [33]. This type of interactions, where the structure of an enzyme is affectedby the binding of a molecule to a site different than the substrate binding site, is called‘allosteric interaction’ and the enzyme is called ‘allosteric enzyme’ [34]. The bindingkinetics shown by the hemoglobin also goes under the name of cooperative binding,where the binding of one molecule favors the binding of a molecule of the same type.Many allosteric enzymes are also cooperative, and vice versa. However the two termsare not interchangeable as there can be enzymes that show allosteric interactions butthese do not necessarily lead to a cooperative effect, nor to a regulatory function [25].
Archibald Vivian Hill proposed a phenomenological model to describe the degreeof cooperativity of regulatory enzymes, now known as Hill equation [35]. The Hillequation takes the form
v =vmaxsh
Kh + sh , (1.10)
where K is the Hill constant and corresponds to the value of s at which v = vmax/2
12

1. What is an enzyme and how does it work?
and h is called Hill coefficient, which is a measure for the degree of cooperativity ofthe enzyme. For h = 1 the enzyme follows a Michaelis-Menten kinetics, see Fig. 1.5. Ifh > 1 we have a positive cooperative effect. This is the case of hemoglobin that has aHill coefficient in the range of h = 1.7-3.2. In Fig. 1.5 we see how for h = 4 we havea sigmoidal kinetics that steeply increases for values of s around K. The reaction rategoes rapidly from a state of low activity where v ≈ 0 to a state of high activity wherev approaches its maximal value vmax. In general, it is also possible to have a negativecooperative effect for h < 1. In this case the allosteric interactions are such to disfavorthe binding of further molecules. Note that the Hill equation could correspond tothe reaction scheme hS + E ESh, however such a reaction scheme is usually notfollowed by enzymatic reactions. Moreover h is often a non-integer number, hence oneshould interpret the Hill equation simply as a phenomenological law, rather than adescriptive model for the reaction.
1.3.4. Enzyme inhibiton
The enzyme activity can often be reduced by the binding of specific molecules, whichare known as inhibitors. In this section we briefly describe different types of productinhibition and we analyze how the enzyme kinetics is affected in the different cases. Alltypes of inhibition follow a Michaelis-Menten kinetics with apparent catalytic activityvapp
max and apparent Michaelis-Menten constant KappM [25], as given by the following
expression
v =vapp
maxsKapp
M + s. (1.11)
With I we will refer to the inhibitor species and with i to its concentration, as similarlydone so far for the other chemical species S, E and P.
• Competitive inhibition: A competitive inhibitor binds to the active site of theenzyme, forming the inhibitor-enzyme complex EI and it therefore impedes thebinding of substrate molecules. Often in this case the inhibitor I is a molecule thatclosely resembles the substrate S. However, I is not able to undergo catalysis. Thisleads to an increase in apparent Michaelis-Menten constant Kapp
M but no change invapp
max. In fact, as compared to the case with no inhibitor, more substrate is requiredto reach the same amount of substrate-enzyme complexes ES. The new Michaelis-Menten constant takes the apparent value of Kapp
M = KM(1 + i/Kci ), where Kc
iis called competitive inhibition constant. An example of competitive inhibitioncan be seen in the reaction catalyzed by the enzyme succinate dehydrogenase,which oxidizes succinate to fumarate. A competitive inhibitor for this reactionis malonate, a very similar molecule as compared to succinate. The two differ
13

1. What is an enzyme and how does it work?
simply by the fact that malonate presents just a single methylene group insteadof two.
• Pure non-competitive: A non-competitive inhibitor binds to a different site thanthe substrate binding site. Hence the binding-unbinding of substrate is unaffectedand we have no change in KM. However, through allosteric interactions, thebinding of I reduces the catalytic activity to vapp
max = vmax/(1 + i/Kui ), where Ku
i isknown as uncompetitive inhibition constant. Typical non-competitive inhibitorsare heavy-metal ions and protons.
• Uncompetitive inhibition: An uncompetitive inhibitor can only bind to the EScomplex but not to the free enzyme. With its binding, the inhibitor inactivatesthe ES complex. This mechanism affects both the apparent catalytic activity andthe apparent Michaelis-Menten constant. We have that vapp
max = vmax/(1 + i/Kui )
and KappM = KM/(1 + i/Ku
i ). An example of uncompetitive inhibitor can be foundin the lithium used to treat manic depression, which inhibits the myo-inositolmonophosphatase, an enzyme that plays a key role in cell signaling [36].
• Mixed inhibition: A mixed inhibitor binds to a site on the enzyme that is not thesubstrate binding site. However, allosteric interactions caused by the inhibitorbinding affect both the binding-unbinding of substrate and the catalytic activityof the enzyme. This inhibition mechanism results in a mix of the competitive anduncompetitive inhibitions and we have that vapp
max = vmax/(1 + i/Kui ) and Kapp
M =
KM(1 + i/Kci )/(1 + i/Ku
i ). Note that it depends on both inhibition constants Kci
and Kui .
• Irreversible inhibition: An irreversible inhibitor permanently binds and inac-tivates the enzyme, usually by forming a covalent bond with the enzyme. Animportant example of irreversible inhibitor is the penicillin, the first discoveredbacterial antibiotic, which acts as an inhibitor for an enzyme needed to keep thebalance between cell wall production and degradation in bacteria. Hence the useof penicillin causes growing bacteria to rapidly die [37].
As we have already mentioned in Sec. 1.3.2, enzymes can also be inhibited by theirproduct [25]. By looking at the reaction rate of a reversible Michaelis-Menten kinetics,Eq. (1.7), we can see how by increasing the amount of product in the system thereaction rate decreases. This decrease is significant only if the reaction is reversible.However, product inhibition is observed even in cases for which the reaction is basicallyirreversible. In these cases, the product can bind to the enzyme without being furtherprocessed back to substrate. In this way the product sequesters the enzyme from thesubstrate, behaving like a competitive inhibitor.
14

2. Spatial organization and dynamics ofenzymatic reactions
Enzymes speed up most of the biochemical reactions that take place in the cells ofliving organisms. Often the product of an enzymatic reaction is further processedby a different enzyme and, in turn, the product of this second reaction has to befurther processed to perform its biological function. This leads to chains of enzymaticreactions, which are known as ‘metabolic pathways’. Different metabolic pathways canbe topologically linked to one another in case enzymes from the different pathwaystarget the same substrate. This leads to an intricate network of enzymatic reactions,which is known as ‘metabolism’, responsible for the conversion of food to energy andbuilding blocks, and the elimination of metabolic waste. In each cell it is thereforeimportant that a substrate, which could also be the product of an enzymatic reaction,finds the corresponding enzyme in an efficient way. The encounter rate between theenzyme and the substrate depends on their motion and on their spatial arrangement.In this chapter, we first analyze the role that a purely diffusive motion of the enzymeand the substrate has in defining the kinetic rates of a single-step enzymatic reaction.Then we discuss several examples of natural and synthetic strategies for the spatialorganization of metabolic pathways that facilitate the encounter rate. We also discussrecent experimental findings showing that the enzyme motion can be coupled to thesubstrate concentration profile, leading to effective equations describing the enzymedynamics that are more complex than a simple diffusion equation.
2.1. The role of diffusion on enzyme kinetics
The rate of an enzymatic reaction depends on the rate of encounter of the free enzymeE with substrate molecules S. The higher is the rate of encounter, the higher are thechances of forming the enzyme-substrate complex ES. The Michaelis-Menten kineticspresented in Sec. 1.3.1 does not present a direct dependence on such encounter rate.However, the binding rate k1 and the unbinding rate k−1 depend on it. In the followingwe derive the dependencies of k1 and k−1 on the encounter rate, provided that thesubstrate and the enzyme perform Brownian motion [38]. The Brownian motion is therandom motion of particles suspended in a fluid, driven by the collisions with the fluid
15

2. Spatial organization and dynamics of enzymatic reactions
molecules. Such a motion is described by the diffusion equation,
∂s(r, t)∂t
= D∇2s(r, t) , (2.1)
where s(r, t) is the concentration of the suspended molecule at position r, at time t andD is the diffusion constant of the suspended species. The kinetics of an associationprocess between diffusive molecules was first modeled by M. v. Smoluchowski [39]and then extened by Collins and Kimball [40]. These models consider the associationprocess to be irreversible. However, to see how diffusion affects the kinetic rates of theMichaelis-Menten equation, we need to consider a reversible association-dissociationprocess as considered by M. Schurr [41] or D. Shoup and A. Szabo [42]. Here we followthe derivation carried out by M. Schurr [41].
We start by considering the diffusion equation Eq. (2.1) to describe the dynamics ofsubstrate molecules around a free enzyme molecule, which we assume to be at theorigin of our reference frame. This implies that the substrate has an effective diffusioncoefficient D as given by the sum of the enzyme and substrate diffusion coefficientsD = De + Ds. The substrate and the enzyme can form a complex when they are indirect contact, i.e. at a distance R = Re + Rs. The net reaction flux J of complexformation is given by the rate of association between E and S into ES minus the rate ofdissociation from ES into E and S. Moreover, the net reaction flux J is also assumedto be equal to the diffusive flux of substrate molecules entering in contact with theenzymes, hence
J = 4πr2De0∂s(r)
∂r
∣∣∣∣r=R
= k1e0s(r)− k−1c0 , (2.2)
where e0 is the initial concentration of free enzymes, c0 the one of enzyme-substratecomplex and k1, k−1 are the so-called intrinsic rate constants of the forward and reversestep respectively of the association-dissociation reaction upon contact of substrateswith enzymes. Eq. (2.2) provides a boundary condition to the second order diffusionequation for the substrate. A second boundary condition is given by the assumption thatfar away from the enzyme the concentration of substrate relaxes to the concentration s0,i.e. s(r → ∞) = s0. By solving for the steady state of the diffusion equation Eq. (2.1)with the above boundary conditions, we find that the net reaction flux of complexformation is
J =kDk1
k1 + kD︸ ︷︷ ︸k1
e0s− kDk−1
k1 + kD︸ ︷︷ ︸k−1
c0 , (2.3)
where kD is the Smoluchowski rate constant of diffusion-limited reactions kD =
4πRD = 4π(Rs + Re)(Ds + De) and it corresponds to the rate at which substrate
16

2. Spatial organization and dynamics of enzymatic reactions
and enzyme molecules of a certain size diffuse towards each other. The rates k1 andk−1 correspond to the effective binding and unbinding rates, as given in the scheme ofa Michaelis-Menten enzymatic reaction Eq. (1.1). By substituting the above values of k1
and k−1 into the Michaelis-Menten equation (Eq. (1.5)), we obtain
v = kcate s
KM + kcat/kD + s, (2.4)
where e and s are the enzyme and substrate concentrations respectively and KM =
(k−1 + kcat)/k1 is the intrinsic Michaelis-Menten constant. The catalytic efficiency,defined as kcat/KM (see Sec. 1.3.1), fulfills the equality (kcat/KM)−1 = (kcat/KM)−1 +
(kD)−1.
In the so-called ‘reaction-limited’ regime where kD � (kcat/KM), the limiting step ofthe enzymatic reaction is the binding of the substrate to the enzyme. The diffusion is infact very fast and the transport of molecules is not a limiting factor. In this scenario,the fast diffusion smooths out any concentration gradients that might form, i.e. weare in a ‘well-mixed’ system. The assumption to be in a well-mixed system is implicitin the Michaelis-Menten description. For this reason, in the reaction-limited regimethe kinetic rates of the Michaelis-Menten model equal the intrinsic rates, k1 = k1 andk−1 = k−1.
In the regime where kD � kcat/KM, known as ‘diffusion-limited’ regime, the reactionis limited by the rate of diffusive transport of substrates to the enzyme. We are notanymore in a well-mixed system and concentration gradients emerge due to the fastreaction around the enzymes. In the diffusion-limited regime the forward rate ofthe Michaelis-Menten equation is solely determined by the rate of diffusive transportk1 = kD and the reverse rate k−1 = kDk−1/k1. The catalytic efficiency kcat/KM, inthe extreme case of kcat/KM → ∞, becomes equal to kD, which sets an upper limitfor the enzymatic efficiency. This limit corresponds to the case of very fast enzymesimmediately converting any encountered substrate molecule, provided that the enzymeand the substrate motion is described by the diffusion equation Eq. (2.1). By consideringD = 100µm2s−1 and R = Re + Rs = 1nm, we obtain the theoretical upper limit of thecatalytic efficiency to be kcat/KM ≈ 109M−1s−1. As already anticipated in Sec. 1.3.1,catalytic efficiencies are in the range of 102-109s−1M−1, with a median at 105s−1M−1 [30].This means that, although most of the enzymes operate far from the most efficientregime, there are enzymes like fumarase and carbonic anhydrase that have enzymaticefficiencies in the same order of magnitude as the theoretical upper limit of 109M−1s−1.
The model described here neglects some of the details of enzymatic reaction. Forinstance, it assumes spherical symmetry and a uniform reaction on the enzyme surface,cf. Eq. (2.2), whereas in real enzymes the reaction takes place only at the active site.
17

2. Spatial organization and dynamics of enzymatic reactions
Different extensions have been made to include the effects of rotational diffusiontogether with the presence of an active site on the surface of the enzyme [43], orto consider interaction potentials between the enzyme and the substrate [44]. Suchextensions are important to understand how the efficiency of some enzymatic reactionscan reach values that are up to one order of magnitude higher than the limit set bydiffusion. For example, electrostatic interactions cause the association rate betweenthe lac-repressor and the lac-operon to be 7 · 109M−1s−1 [45]. The lac-repressor is aDNA binding protein that is positively charged and binds to the phosphate groups(negatively charged) of the lac-operon, which is a portion of DNA responsible for theexpression of proteins needed for the digestion and transport of lactose in E.coli. Theattractive electrostatic interaction generates a drift in the motion of the lac-repressortowards its binding site, hence favoring their encounter rate. Other examples aregiven again by the enzymes fumarase and carbonic anhydrase that, in case electrostaticinteractions are not screened, can show catalytic efficiencies of up to 3 · 1010M−1s−1 and1010M−1s−1, respectively. In the case of fumarase both electrostatic interactions and thepresence of an active site justify the incredibly high rate [46]. In the case of carbonicanhydrase the substrate is assumed to first perform a 3-dimensional diffusion motionto reach the enzyme, followed by a faster 2-dimensional diffusion on the surface of theenzyme to reach the active site [47].
2.2. Metabolic channeling
Living organisms have evolved different strategies to make enzymatic reactions moreefficient. Some of them rely on an efficient transport of substrate molecules to thecorresponding enzymes. These strategies go under the name of ‘metabolic channeling’.Historically, metabolic channeling was initially referring to the intermediate productsof metabolic pathways that are directly channeled from an enzyme of the pathway tothe next via structural features [48, 49], e.g. tunnels, swinging arms or electrostaticguidance. However, other strategies that guarantee an efficient transport of substratesand at the same time prevent its diffusion into the cytoplasm are nowadays alsoreferred to as metabolic channeling [50, 51]. These strategies include the colocalizationof multiple consecutive enzymes into large clusters known as ‘metabolons’ [52], orsimply having two consecutive enzymes in close proximity without being directlylinked. In this section, we consider the advantages of metabolic channeling and wepresent some well-known examples.
18

2. Spatial organization and dynamics of enzymatic reactions
2.2.1. Advantages of metabolic channeling
Different mechanisms of metabolic channeling can lead to the same physiologicaladvantages [53]. Here we present a list of some of these advantages.
• Reduction of transient time: If a substrate is directly channeled to the active siteof the corresponding enzyme, or its diffusive motion is constrained, the overallreaction velocity is increased. This implies that the catalytic efficiency of anenzyme can be higher than the expected limit kD, as already discussed in Sec. 2.1.
• Processing of unstable or volatile substrates: Substrate molecules can leakthrough the cell membrane [54, 55], or can be destabilized by entering in contactwith the solvent [56]. Metabolic channeling can protect the structure of suchmolecules and prevent the loss of substrate.
• Protection from toxic substrates: Within a metabolic pathway, some of the in-termediate products could be toxic for the cells if they were freely diffusing inthe cytoplasm. Hence, the compartmentalization of entire pathways [57] or thedirect transport of the intermediates to the enzyme [58] can protect the cells fromintoxication.
• Avoiding competing side reactions: Some substrates can be targeted by multipleenzymes from different metabolic pathways. However, cells might want to directthe metabolism in a preferred direction. By using metabolic channeling, thesubstrate can be sequestered, i.e. isolated, from the unwanted enzymes [59].
• Making otherwise unfavorable reactions possible: Some reactions would notspontaneously proceed if the enzyme and the substrate were well-mixed in thecytoplasm. However via metabolic channeling the intermediate product canbe immediately transported to the active site of the next enzyme. This keepsthe concentration of the intermediate low at the active site of the first enzyme,hence impeding the reverse reaction from occurring. In this way the reaction canproceed, although this would be thermodynamically unfavored in a well-mixedsystem [60].
• Enhancement of product flux: Metabolic channeling enhances the formation ofproducts for fixed amounts of enzymes and substrates as compared to a well-mixed scenario. In fact, a channeled substrate is protected from the different lossmechanisms it can undergo (e.g. side reactions, diffusive loss via the membrane,spontaneous decay). Hence, a high product flux can be generated by keeping theamount of substrate low. The enhancement of product flux strongly depends on
19
2. Spatial organization and dynamics of enzymatic reactions
the channeling strategy used. For example, it is under debate whether simplyhaving two consecutive enzymes in close proximity without being directly linked(proximity channeling) can provide a measurable enhancement of product fluxor not [61, 62, 63, 64]. Proximity channeling corresponds to the case where anintermediate simply diffuses from the active site of an enzyme to the active site ofthe next enzyme. According to a purely diffusive model such channeling strategydoes not guarantee measurable enhancements in product flux unless the twoenzymes are at distances which are comparable to their sizes, i.e. < 10nm [65].However this seem to depend on whether the enzymes are reaction or diffusion-limited. For diffusion-limited enzymes, the advantages of proximity channelingare more evident [66].
In the following we present more specific examples of natural and synthetic metabolicchanneling strategies and we will see how such strategies provide some of the abovelisted advantages.
2.2.2. Metabolic channeling via structural features
Enzymes catalyzing the sequential reactions of a metabolic pathway are sometimesfound to assemble into multi-enzyme complexes [67]. Moreover, these complexesevolved structural features that favor the channeling of the intermediates. In Fig. 2.1we present an overview of such features.
In Fig. 2.1a we show the structure of the tryptophan synthase complex. This isa bi-enzyme complex catalyzing the last two steps of the synthesis of L-tryptophan,which is an amino acid and an important building block for protein synthesis. Wecan see how an intramolecular tunnel of 25Å directly connects the two active sites ofthe complex [68]. At the first active site indole-3-glycerol phosphate is converted intoindole and glyceraldehyde-3-phosphate. The intermediate indole is then transferredthrough the molecular tunnel to the second active site where it reacts with L-serine toform L-tryptophan and water. The intramolecular tunnel favors the rapid transportof indole to the second active site [70] and plays a crucial role in isolating the highlyvolatile indole molecules from the cytoplasm [54]. Another example of channelingvia an intramolecular tunnel is found in the carbamoyl phosphate synthetase (CPS)complex. The CPS complex is responsible for catalyzing the synthesis of carbamoylphosphate from bicarbonate, glutamine, and two molecules of adenosine triphosphate(ATP) [71]. Carbamoyl phosphate is an intermediate metabolite of the urea cycle, whichis responsible for nitrogen disposal. The CPS complex has a 96Å long tunnel connectingthree active sites [72]. The tunnel again provides a good sequestration mechanism forthe unstable intermediates produced.
20
2. Spatial organization and dynamics of enzymatic reactions
a b
c
Tunnel Electrostatic guidance
Swinging arms
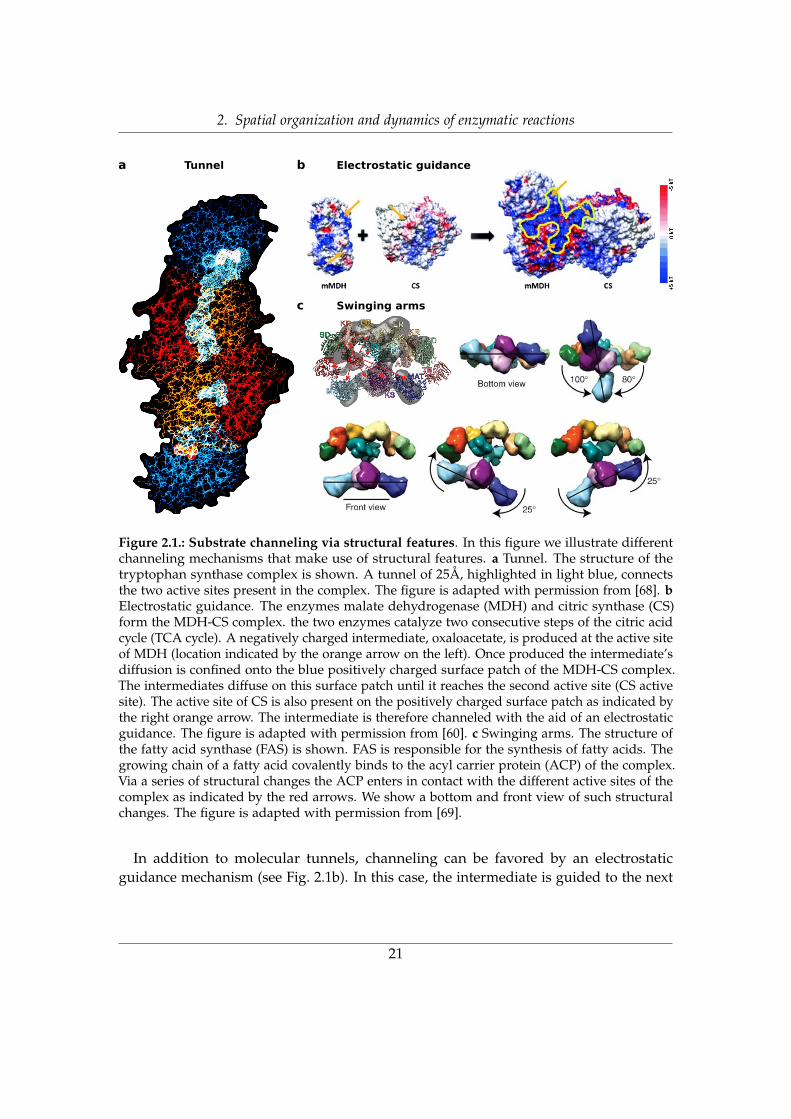
Figure 2.1.: Substrate channeling via structural features. In this figure we illustrate differentchanneling mechanisms that make use of structural features. a Tunnel. The structure of thetryptophan synthase complex is shown. A tunnel of 25Å, highlighted in light blue, connectsthe two active sites present in the complex. The figure is adapted with permission from [68]. bElectrostatic guidance. The enzymes malate dehydrogenase (MDH) and citric synthase (CS)form the MDH-CS complex. the two enzymes catalyze two consecutive steps of the citric acidcycle (TCA cycle). A negatively charged intermediate, oxaloacetate, is produced at the active siteof MDH (location indicated by the orange arrow on the left). Once produced the intermediate’sdiffusion is confined onto the blue positively charged surface patch of the MDH-CS complex.The intermediates diffuse on this surface patch until it reaches the second active site (CS activesite). The active site of CS is also present on the positively charged surface patch as indicated bythe right orange arrow. The intermediate is therefore channeled with the aid of an electrostaticguidance. The figure is adapted with permission from [60]. c Swinging arms. The structure ofthe fatty acid synthase (FAS) is shown. FAS is responsible for the synthesis of fatty acids. Thegrowing chain of a fatty acid covalently binds to the acyl carrier protein (ACP) of the complex.Via a series of structural changes the ACP enters in contact with the different active sites of thecomplex as indicated by the red arrows. We show a bottom and front view of such structuralchanges. The figure is adapted with permission from [69].
In addition to molecular tunnels, channeling can be favored by an electrostaticguidance mechanism (see Fig. 2.1b). In this case, the intermediate is guided to the next
21

2. Spatial organization and dynamics of enzymatic reactions
active site by electrostatic forces that confine its diffusion to a patch of the complexsurface presenting both active sites. The intermediate and the surface patch haveopposite electrostatic charges. An example of this can be seen in the citric acidcycle (CAC or TCA cycle), where the enzyme malate dehydrogenase (MDH) and theenzyme citric synthase (CS) form a complex [60], see Fig. 2.1b. The diffusion of thenegatively charged intermediate, oxaloacetate, is bound to a positively charged areaof the complex surface (blue) connecting the two active sites [73]. The formation ofthe MDH-CS complex is remarkable because it pushes the reaction in the oppositedirection as compared to a well-mixed system. In fact, the equilibrium constant for thereaction catalyzed by MDH is unfavourable in the forward direction of the TCA cycle(Keq = (2.86± 0.12) · 10−5 [74]). However the intermediate oxaloacetate is efficientlytransported to the CS active site and its concentration is therefore kept low at the MDHactive site. This guidance mechanism, thus, favors the direction of the reaction to be theone needed for the TCA cycle [50]. Another example of electrostatic guidance is givenby the bifunctional enzyme dihydrofolate reductase- thymidylate synthase (DHFR-TS),catalyzing two steps of the thymidylate pathway, which supplies 2-deoxythymidylatefor DNA synthesis. Similarly to the MDH-CS case, a negatively charged intermediateis bound to a positively charged patch on the surface of the complex that bridges thetwo active sites [75].
As shown in Fig. 2.1c, the use of swinging arms can also be used for channelingsubstrates [76]. An example of this is given by the fatty acid synthase (FAS), which isone of the largest known multi-enzyme complex and is responsible for the synthesis offatty acids [69]. The growing chain of fatty acids is covalently bound to an acyl carrierprotein (ACP) that moves the intermediate between the active sites of ketoreductase(KR), dehydratase (DH) and enoyl reductase (ER) in an assembly line fashion. Afterthe chain has reached the length of 16 units the fatty acid is released by the actionof thioesterase (TE). In Fig. 2.1c we can see how the carrier protein ACP enters inclose contact with the different active sites. Another well characterized example ofchanneling via swinging arms is given by the pyruvate dehydrogenase complex (PDC)that converts pyruvate to acetyl coenzyme A, linking glycolysis to the TCA cycle. ThePDC is formed by three different enzymes (called E1, E2 and E3 respectively) thatassemble in a remarkably symmetric complex [77, 78]. Here E2 enzymes form a coreto which E1 and E3 binds. After the first reaction is catalyzed by E1, the intermediateis transferred to the lipoamide swinging arm of E2 which brings the intermediatein contact with the active site of E2 where a second reaction takes place. E3 thenhas the role of reactivating the swinging arm for the binding of another intermediatemolecule [50].
22

2. Spatial organization and dynamics of enzymatic reactions
2.2.3. Metabolon formation
Metabolons are clusters of consecutive metabolic enzymes held together by protein-protein interactions (i.e. non-covalent forces such as electrostatic, hydrophobic or vander Waals interactions) and interactions with structural elements of cells, e.g. thecytoskeleton or integral membrane proteins [52]. Although the enzymes composing ametabolon are not necessarily structurally linked, the fact that they are present in largecopy numbers and held in close proximity is enough to constrain the diffusion andfavor the channeling of intermediates. Metabolons are often dynamically assembledand disassembled upon changes in the concentration of one of the metabolites thatthey process. Typically, when cells are starved of a certain nutrient, metabolons areassembled to process the low amount of nutrient in a more efficient way. Hence, theyoften play a key upregulatory function in metabolic pathways [79].
A well characterized example is the case of the purinosome, a metabolon assembledin human tumor cells (HeLa cells) to upregulate the de novo purine biosyntheticpathway [80]. Six enzymes catalyze the 10-steps reactions of the pathway, convertingthe phospho-ribosyl pyrophosphate (PRPP) into inosine monophos-phate (IMP), whichis the final product of the pathway. IMP is a precursor of adenosine and guanosinenucleotides, which are building blocks of DNA and RNA. The six enzymes assembleinto the purinosome via protein-protein interactions [81] with the aid of heat shockproteins [82]. G protein–coupled receptors (GPCRs), responsible for the transmissionof signals to the nucleus, might trigger the formation of the purinosomes [83]. Onceformed, the purinosomes can synthesize up to 3-fold higher amounts of IMP ascompared to cells not having the metabolons [84].
Recently, also enzymes catalyzing the glycolysis have been shown to assemble intometabolons in different organisms. As already mentioned in Sec. 1.2.2, glycolisis is animportant pathway for extracting energy in form of ATP and NADH from the sugarglucose. In yeast cells, glycolytic enzymes form aggregates to upregulate the conversionof glucose under hypoxic stress [85, 86] and lack of glucose [87]. In C. Elegans neurons,under energetic stress, glycolytic enzymes form metabolons in proximity of the synapsesto maintain high enough local levels of ATP. This is necessary for a normal synapticfunctioning [88]. Moreover, glycolytic enzymes are found to assemble on the membraneof human red blood cells [89, 90]. Despite glycolytic enzymes form metabolons in manydifferent organisms, it is not yet clear whether there are common principles behindthe assembly process. An interesting observation has been recently presented by Zhaoet al. [91], who showed that glycolytic enzymes drift upstream gradients of their ownsubstrate. This can favor the contact among the sequential glycolytic enzymes. Anenzyme would drift towards high concentration of its substrate that is produced by aprevious enzyme of the pathway. By following the gradient, the enzyme would then
23

2. Spatial organization and dynamics of enzymatic reactions
swim towards the previous enzyme of the pathway. In Ch. 4, we will compare themodel for the enzyme motion suggested by Zhao et al. with other models and we willsee how spatial patterns can spontaneously form if the enzyme motion is driven bynonspecific interactions with the substrate. Understanding how enzymes respond tothe presence of their own substrate can be key in better understanding the formation ofmetabolons.
We conclude this subsection by noting that there exist many other cases of metabolonformation. For example for the regulation of the TCA cycle [92], the formation ofdefense and other types of compounds in plants [93, 94]; or the purine biosyntheticpathway in yeast [87].
2.3. Organelles and microcompartments
The word organelles usually refers to compartments enclosed in lipid membranesthat are typical of eukaryotic cells. Eukaryotic cells are in fact well known for thehigh degree of spatial organization of their enzymatic reactions. Confining reactionsand entire metabolic pathways into organelles can have the same benefits as the onesobtained by metabolic channeling, cf. Sec. 2.2.1. Cells can concentrate enzymes andsubstrates in a smaller volume, hence reducing the transient times of the reactions andenhancing product fluxes, while keeping the amount of molecules relatively low ascompared to a well-mixed scenario. An example of this can be seen in the mitochondria,which are subcellular compartments highly specialized in the production of energyin form of ATP via the TCA cycle [95]. Moreover, compartmentalization allows theisolation of substrates from competing reactions, or of toxic substrates. The enzymescontained in the lysosome are a typical example of such a sequestration mechanism.The lysosome is an organelle responsible for the digestion of proteins, lipids andnucleic acids and if the enzymes contained in the lysosome were free to diffuse inthe cytoplasm, they would impair many functional activities [96]. Another exampleis the peroxisome, an organelle that encapsulates oxidative enzymes involved in theproduction and consumption of the toxic intermediate hydrogen peroxide [97]. Theperoxisome also provides a different microenvironment as compared to the cytoplasm,presenting an unphysiological alkaline pH to favor the activity of the enzymes oxidaseand catalase by speeding up their reactions [98].
Organelles encapsulated by lipid membranes are a characteristic of eukaryotic cells.However, also prokaryotes have been recently shown to present microcompartmentsenclosed by proteinaceous shells. The best studied example of such microcompartmentsis the carboxysome [99]. The carboxysome is used in cyanobacteria for the carbonconcentrating mechanism (CCM), which is crucial for efficient carbon fixation in the
24

2. Spatial organization and dynamics of enzymatic reactions
Calvin cycle of photosynthesis, i.e. the conversion of carbon dioxide (CO2) into glucose.On the proteinaceous external shell of the carboxysome there are positively chargedpores that favor the access of the anion bicarbonate (HCO –
3 ). Inside the microcompart-ment, the enzyme carbonic anhydrase converts the bicarbonate into the uncharged CO2.The CO2 is then trapped inside the compartment because of its neutral charge. Thisis very important for the carbon fixation process, because the cellular membranes arevery permeable to small uncharged molecules such as CO2 and in this way loss ofCO2 is prevented [100, 101]. In the carboxysome, CO2 is then fixed by the relativelyinefficient enzyme ribulose-1,5-biphosphate carboxylase oxygenase (RuBisCO). Giventhe low efficiency of RuBisCO, the high concentration of CO2 in the compartmenthelps the fixation process. Moreover, since RuBisCO also catalyzes the futile fixationof oxygen, the sequestration of RuBisCO inside the carboxysome directs the fixationprocess in the desired direction [99]. Overall, it has been recently shown that thecompartmentalization of the carbon fixation process in the carboxysome is optimalgiven the properties of the protein shell of the compartment [102]. Other examplesof microcompartments in prokaryotes can be found in so-called Pdu and Eut micro-compartments in enteric and gut bacteria respectively. The Pdu compartment are usedfor the effective digestion of 1,2-propanediol, which is a product of the degradationprocess of plant cell wall sugars and it is used as a carbon and energy source by theenteric bacteria. The Eut microcompartments are similarly used in gut bacteria to digestphosphatidyl ethanolamine, which serves as a carbon, energy and nitrogen source forthe bacteria. As already seen for the carboxysome, the function of the Pdu and Eutmicrocompartments is to sequester volatile and toxic intermediates that are producedby the enzymatic reactions therewithin [57, 103].
2.4. Membrane bound enzymes
Often, substrates are imported into the cytoplasm through the external membrane or themembrane of internal organelles. The enzymes that catalyze reactions involving thesesubstrates can be found to be membrane bound, either directly or via transmembraneproteins, i.e. proteins that span the entire membrane. As a consequence, the substratesare directly intercepted by the enzymes and their diffusion into the cytoplasm ishindered. This intercepting mechanism can present the same physiological advantagesof metabolic channeling presented in Sec. 2.2.1. An additional advantage can beprovided if enzymes colocalize with transmembrane transporters importing theirsubstrates. In this case, the substrate is immediately depleted from the enzyme andthis guarantees a steady gradient of substrate concentration across the membrane.This steady gradient results in a reduction of the back-flux of substrates through the
25

2. Spatial organization and dynamics of enzymatic reactions
transporters and in an increased import rate [104].
a c Mitochondrial associated PurinosomesGlycolytic Enzymes in RBC
CellulosomesbDetected
Random
band 3
aldolase
overlay
bacterial membraneanchor proteins
cohesindockerin
enzymes
cellulose bindingdomain
Figure 2.2.: Examples of spatial organization of enzymes on membranes. a In oxygenated redblood cells (RBC), the enzymes responsible for glycolysis bind to the band 3 transport proteinon the membrane. As an example, here is shown the colocalization of band 3 (top, green) withthe enzyme aldolase (middle, red), which catalyzes the 4th step of glycolysis. Having glycolyticenzymes at the membrane where glucose is imported, makes glycolysis more efficient. Figureadapted with permission from [89]. b Cellulosomes at the surface of the bacteria Clostridiumthermocellum. Anchor proteins anchor the cellulosome to the membrane. The binding of twoproteins, dockerin and cohesin, maintains the non catalytic scaffold (scaffoldin) bound to theanchor proteins and guarantee the attachment of enzymes onto the scaffoldin. Cellulose bindingdomains are present on the scaffold and favor the binding of the bacteria to the cellulose presenton plant cell wall. The enzymes break the cellulose into smaller compounds that bacteria canmore easily import. Figure adapted with permission from [105]. c Mitochondrial associatedpurinosomes. In magenta we see one of the core enzymes of the purinosome (FABS), responsiblefor catalyzing the 4th step of the de novo purine biosynthesis. A protein present on the outermembrane of the mitochondria has been tagged in green. The percentage of mitochondrialassociated purinosome is much higher than the percentage expected for a random distribution ofpurinosomes. Having purinosomes bound to the mitochondrial membrane makes the synthesisof purines more efficient as some of the intermediates needed for the pathway are directlyreleased at the mitochondrial membrane. Figure adapted with permission from [106].
26

2. Spatial organization and dynamics of enzymatic reactions
An example of this can be seen in the organization of the glycolytic enzymes of redblood cells (RBC) [89]. In red blood cells, glycolysis is the only pathway responsiblefor the storage of energy in form of ATP molecules. The role of red blood cells is infact to carry oxygen in blood vessels. The oxygen load cannot be used for the cellularrespiration that, in other type of cells, takes place in the mitochondria and uses oxygento form ATP molecules. When the red blood cell is oxygenated, glycolytic enzymes areobserved to bind at the cellular membrane, see Fig. 2.2a. Here, glucose is importedand directly converted by the glycolytic enzymes into pyruvate and ATP molecules.This causes the depletion of glucose in the vicinity of the glucose transporters, henceimpeding glucose backflux through the transporters themselves [104]. Moreover, theATP molecules are subsequently used by ion pumps, which are membrane boundproteins that make use of the energy released by the ATP to pump ions in and outof the cells [107]. Another example of enzymes active at the external cell membraneis the multienzymatic complex ‘cellulosome’, used by several anaerobic bacteria todigest the cellulose contained in the cell wall of plants [108, 109]. In this case, theenzymes are secreted outside of the cell and a noncatalytic subunit called scaffoldinsecures the anchoring of the complex to the cell wall and the incorporation of thevarious enzymatic subunits via the so-called cohesin-dockerin interaction (see Fig. 2.2b).The cohesin-dockerin interaction consists of pairs of complementary protein domainspresent on the scaffolds and on the different enzymes. Moreover, a cellulose bindingdomain (CBD) guarantees the binding to cellulose [109]. The different enzymes thenbreaks the cellulose into elemental subunits that can be more easily imported by thebacteria [105].
Enzymes can also be localized at the membranes of internal organelles. They caneither favor the channeling of substrates inside the organelles or can intercept substratesthat are being released from the organelles into the cytoplasm. An example of thefirst scenario is the binding of glycolytic enzymes to the mitochondrial membrane.The increased level of membrane bound glycolitic enzymes is associated with anincrease in respiratory demand by cells of different species [110, 111]. The productof the glycolysis is the acetyl-CoA, which is the starting point of the TCA cycletaking place in the mitochondria. Hence, having glycolytic enzymes directly boundat the mitochondrial membrane favors the formation and channeling of the TCAprecursor into the organelles. An example of the second scenario, where substrates areintercepted while being secreted into the cytoplasm, can be seen in the purinosome,see Fig 2.2c. As already mentioned in Sec. 2.2.3, the purinosome is responsible forboosting the de-novo purine synthesis in human tumor cells under purine depletedconditions. Purinosomes seem to form at nucleation sites that are located at the largestfilaments of proteins that compose the cytoskeleton, i.e. the microtubules [112]. Oncepurinosomes are assembled on the microtubules, they seem to undergo a directed
27

2. Spatial organization and dynamics of enzymatic reactions
motion towards the mitochondrial membrane [113]. This causes the purinosomes tobe largely associated to the mitochondrial membrane [106]. This is thought to bebeneficial for the cells for two reasons. First, the de-novo purine biosynthesis providesthe nucleotide precursors necessary for the formation of mitochondrial ATP. Second,the ATP produced in the mitochondria, together with other metabolites like glycine,aspartate and formate, are used by the purinosome to carry out its reactions. Thiscorresponds to a case where a substrate secreted by an organelle, the mitochondrion, isdirectly intercepted by enzymes located at the organelle’s membrane, the purinosomes.In this way the turnover efficiency of the reactions carried out by the purinosomeincreases as it has been recently shown with the use of gas cluster ion beam secondaryion mass spectrometry (GCIB-SIMS) [114]. Other examples of active enzymes boundto the membrane of organelles can be found in many pathways of the secondarymetabolism of plants, e.g. phenylpropanoid and flavonoid metabolism. The enzymescatalyzing reactions for these pathways form large complexes on the membrane of theendoplasmic reticulum (ER) [115, 116]. These complexes often form at cytochromeP450 enzymes, which are localized at the ER membrane and provide an anchor for thecomplexes [117, 118]. Their assembly is often reversible and enzymes switch from asoluble cytoplasmatic state to a membrane bound state [94, 93].
The main focus of the next chapter of the thesis, Ch. 3, will be on models of systemswhere a substrate is imported into the cytoplasm through the membrane of the cellor of internal organelles. We will consider the enzyme catalyzing the reaction to beboth membrane bound or spatially arranged in the cytoplasm and we will study theenzyme arrangement that maximizes the reaction flux. Surprisingly, we will see thathaving all enzymes directly located at membranes is not always optimal. We willcharacterize the strategy behind the optimal profile and the transition in the optimalenzyme arrangement from a fully bound configuration into a more extended profile,where enzymes are also present in the cytoplasm.
2.5. Synthetic strategies
Inspired by natural strategies for the spatial arrangement of metabolic pathways,synthetic biologists developed several techniques to finely tune the spatial allocationof enzymes in cells as well as in completely synthetic systems like protein or DNAscaffolds [119].
To regulate the amount of enzymes bound to cell or organelles membranes, enzymescould be fused to transmembrane proteins, either directly [120] or via a protein scaf-folds [121]. In such systems, transgenic genes are inserted into the cells to encode formodified version of the enzymes and/or transmembrane proteins. The genes encode
28

2. Spatial organization and dynamics of enzymatic reactions
extra information for the synthesis of peptide linkers and/or the formation of scaffoldsto which then the enzyme and the proteins can bind. Thomik et. al [121], for example,showed that by fusing an endogeneous (i.e. native) sugar transporter to the heterolo-gous (i.e. not native) enzyme xylose isomerase in yeast cells, can lead to a substratechanneling mechanism, enhancing the conversion of the imported sugar xylose toethanol, see Fig. 2.3a. The channeling mechanism drives the conversion of xyloseinto a precursor of ethanol, the xylulose. The reaction is carried out by the otherwiseinefficient enzyme xylose isomerase. Moreover, the presence of xylose isomerase inproximity of the xylose transporter maintains a steep concentration gradient of xyloseacross the membrane, causing an increase in the xylose import rate. Another techniqueto enhance the presence of enzymes onto cell membranes is to exploit the orthogonaldockerin-cohesin pairs of the cellulosomes of different species, cf. Sec. 2.4. This allowsfor a rational design of mini-cellulosomes that can be expressed in bacteria [122] andin yeast cells [123, 124, 125] to favor the anchoring of several enzymes to the cellularmembrane. In all of these cases, a reaction flux increased by 1.5 to 5-fold has beenobserved as compared to the free wild-type enzymes [122, 125]. The synthetic design ofenzymatic assemblies onto intracellular lipid droplet membranes can also be achieved.In yeast cells such assemblies have been achieved by recruiting upstream enzymes ofthe ester biosynthetic pathway to the native location of the last enzymatic reaction thattakes place onto the membrane of intracellular lipid droplets [126], see Fig. 2.3b. Therecruitment has been obtained by expressing programmed protein scaffolds composedof oleosin (a plant based lipid droplet protein) and cohesin-dockerins pairs. The as-sembled enzymes show an increased reaction flux for the pathway of about 2-fold ascompared to the case of unstructured enzymes.
Enzymes localization can also be regulated in the cytoplasm or any membrane en-closed space by folding programmed RNA assemblies into scaffolds. These predesignedRNA sequences fold into programmed structures and exhibit binding sites for func-tionalized enzymes presenting complementary RNA sequences to those of the bindingsites [127]. By assembling a hydrogen producing pathway in bacteria onto discrete,one-dimensional and two-dimensional RNA scaffolds, the production of hydrogenhas been shown to increase by 4, 11 and 48-fold respectively. Instead of using RNAscaffolds, protein scaffolds can also be used. It has been shown that an heterologousthree enzymes pathway used to convert acetyl-CoA into mevalonate, can be optimizedin bacteria to have a 77-fold increase in mevalonate production [128], see Fig. 2.4a. Thefirst of the three enzymes (AtoB) is endogenous, however the other two (HMGS andHMGR) are expressed by genes taken from yeast. The enzymes are functionalizedwith peptide linkers that allow the binding of the enzymes to protein scaffolds in asimilar manner as seen for the dockerin-cohesin interactions in the cellulosomes. Theproteins forming the scaffold (GBD, SH3 and PDZ) are expressed from heterologous
29

2. Spatial organization and dynamics of enzymatic reactions
different scaffoldstoichiometries
a b
Gal2
Scaffolds at the cellular membrane
XI Overlay
scaf
fold
edun
scaf
fold
ed
unsc
affo
lded
scaf
fold
ed
Ald6 Acs1 Atf1
Scaffolds onto intracellular Lipid Droplets
Figure 2.3.: Synthetic strategies to regulate the amount of membrane bound enzymes. aScaffolds at the cellular membrane. Top-left: In genetically engineered yeast cells, the enzymexylose isomerase (XI) is fused to the xylose importer Gal2 via a protein scaffold. In this way,the xylose is channeled directly to the xylose isomerase and it is efficiently converted into theintermediate xylulose. Xylulose is then subsequently converted to ethanol in the yeast cell.Top-right: We can see how Gal2 and XI are bound only in the presence of a scaffold. Bottom:When Gal2 and XI are bound the production of ethanol is increased. Figure adapted withpermission from [121]. b Scaffolds onto intracellular Lipid Droplets. Example of sequentialenzymes arranged onto scaffolds on the intracellular lipid droplets of synthetic yeast cells.Bottom-left: The scaffold is composed of a membrane bound protein oleisin (red) and cohesin-dockerin interactions mediate the binding of the enzymes. Top: We can see how the enzymesaldehyde dehydrogenase (Ald6), acetyl-coA synthetase (Acs1) and alcohol-O-acetyltransferase(Atf1) all localize on the membrane of lipid droplets in presence of a scaffold. These enzymescatalyze the conversion of acetaldehyde into ethyl acetate. Bottom-right: We can see how theproduction of ethyl acetate is enhanced for different scaffold structures. For details about thedifferent structures we refer the reader to [126]. Figure adapted with permission from [126].
metazoan genes. The 77-fold increase in mevalonate production has been obtained byoptimizing the stoichiometry of the assembled enzymes. Enzymes can also be directlyfused via small peptide linkers. If the linkers do not impair the enzymatic activity, itcan be shown that fluxes of metabolic pathways can be increased with such a simpletechnique. For example, in yeast cells an increase of 15-fold has been measured for
30

2. Spatial organization and dynamics of enzymatic reactions
the production of the defensive compound resveratrol [129]. Enzyme fusions can alsoresult in the formation of large enzymatic clusters used to regulate the direction ofmetabolic fluxes at metabolic branch points. If two enzymes compete for an interme-diate produced by an upstream enzyme, the latter can be fused with either one ofthe competing enzymes. In this way the intermediate is channeled only to one of thecompeting enzymes and the reaction flux is shunted [59]. Enzymes can also be linkedto DNA-binding proteins such as zinc fingers that very specifically target unique DNAsequences with nanomolar dissociation constant. Hence, by expressing DNA scaffoldsin vivo, target sites for the zinc fingers can be designed to obtain a specific spatialarrangement of the enzymes. Such strategy has been succesfully applied in E. coli cellsfor three different pathways, all showing an enhanced product flux as compared to thecase of unassembled enzymes [130].
DNA scaffolds can also be used in vitro to arrange enzymes with nanometer precision.Their application can be useful in synthetic devices such as microfluidic chips. In severalstudies, the throughput of the reaction catalyzed by the two consecutive enzymesglucose oxidase (GOx) and horseradish peroxidase (HRP) has been analyzed as the twoenzymes were tethered onto DNA scaffolds at different distances. The GOx catalyzesthe conversion of glucose and oxygen into a gluconic acid and hydrogen peroxide.The HRP then uses the hydrogen peroxide to mediate the oxidation of 2,2’-azino-bis(3-ethylbenzothiazoline-6-sulfonic acid), ABTS2–, to a colored product that can be easilydetected via spectrophotometry. The two enzymes were located onto two and fourhexagonal DNA scaffolds at a distance of 13nm and 33nm respectively. The productflux resulting from the enzymatic cascade onto the two hexagons showed an increaseof 1.2-fold as compared to the flux produced by the enzymes on the four hexagonalscaffold. This was justified by considering the different distances that the intermediatehydrogen peroxide needs to cover via diffusion to reach the next enzyme [62]. A moresystematic study of the inter-enzyme distance has been carried out by tethering GOxand HRP onto two-dimensional DNA origami tiles at varying distances in the rangeof 10-65nm [63], see Fig. 2.4b. DNA origami tiles are different as compared to thehexagonal scaffolds discussed before as they form from a long single strand of DNAinstead of the binding of different oligomers [131]. The reaction flux is enhanced by20-fold at 10nm and just by 3-folds at distances higher than 20nm. In other studiesthe enzyme pair has been enclosed into a DNA origami tunnel showing a furtherenhancement in the enzyme activity [132, 133]. Furthermore, the introduction ofswinging arms has been shown to further increase the reaction flux for the GOx, HRPpair [63] and also for two consecutive dehydrogenase enzymes [134]. Moreover, thestoichiometry of the enzymes and of the swinging arms can be optimized, leading to afurther increase in the reaction flux that, in the case of the two dehydrogenase enzymes,got up to almost 300-fold.
31

2. Spatial organization and dynamics of enzymatic reactions
Spacing distance (nm)
Fold
Enhance
men
t
Glucose
Gluconicacid
O2
H2O2
H2O ABTS2-
ABTS2-
b Enzymes on DNA scaffolds
CNPDZ
z
HMGR
SH3
y
HMGS
GBD
x
AtoB
acetyl-CoA mevalonate
x=1
a Enzymes on protein scaffolds
Fold
incr
ease
mevalo
nate
pro
duct
over
no s
caff
old
z (no. PDZ domains)
y (n
o. S
H3
dom
ains
)
Figure 2.4.: Protein and DNA scaffolds for the arrangement of enzymes in bulk. a Enzymeson protein scaffolds. An heterologous three-enzymes pathway converting acetyl-CoA intomevalonate can be inserted into bacteria. The enzymes AtoB, HMGS and HMGR bind to theGBD, SH3 and PDZ scaffold proteins respectively (left). As the stoichiometry of the scaffold isvaried, the mevalonate production rate changes. For scaffolds composed of 1 GBD domain, 2PDZ domains and 2 SH3 domains it is observed a 77-fold increase in the mevalonate productionas compared to the case with no scaffolds. Figure adapted with permission from [128]. bEnzymes on DNA scaffolds. The consecutive enzymes GOx and HRP are arranged withnanometer precision onto DNA origami tiles. On the left we can see the two-steps pathwaycatalyzed by the enzymes (top) and the four different distances considered (bottom). On theright the fold enhancement of the reaction compared to free enzyme in solution versus thespacing distance is shown. The raw activity (grey) is given by both assembled enzymes andenzymes present in solution. The assembled activity (orange) includes corrections accountingfor the percentage of enzymes correctly assembled onto the DNA origami tiles. Only at adistance of 10nm we have a significant enhancement of ≈ 20-fold. At distances larger than 20nmthe fold enhancement quickly drops to a 3-fold enhancement. Figure adapted with permissionfrom [63].
All of the above techniques can be used to spatially allocate enzymes in cells and insynthetic devices to maximize the formation of metabolites. In the next chapter, Ch. 3,we will study a wide class of systems where a substrate is imported into the bulk of thesystem via the external boundary or the boundaries of internal compartments. Once
32
2. Spatial organization and dynamics of enzymatic reactions
in the system, the substrate undergoes diffusive motion and reacts with an enzymethat is considered to be static and can be freely arranged, being also membrane bound,and that catalyze the substrate conversion into a desired product. We ask: What is theenzyme arrangement that maximizes the reaction flux? We will analyze in detail theoptimal strategy leading to the optimal enzyme profiles and characterize a transitionin the optimal configuration. Finally, we will derive a set of rules for the systematicconstruction of the optimal enzyme arrangement that, in principle, could be achievedby using the techniques presented in this section.
2.6. Enzyme motion
In Sec. 2.1, we have seen how the binding and unbinding rates of an enzymatic reactionare affected by a purely diffusive motion of the enzyme and the substrate. However,recent experiments suggest that the motion of enzymes can be influenced by theconcentration profile of the corresponding substrate [135]. Although some of theseexperimental findings are still being debated, it seems that the motion of enzymes inpresence of their substrate is not always simply diffusive. In the following, we presentthese experimental findings and the different effective equations proposed to describethe enzyme motion.
2.6.1. Enhanced diffusion
Recent experiments suggest that several enzymes exhibit a higher diffusion coefficientas the concentration of the corresponding substrate in solution increases [136, 137,138, 139, 140, 141, 142, 91]. This phenomenon goes under the name of ‘enhanceddiffusion’ of enzymes. The enhanced diffusion turns out to be directly proportionalto the Michaelis-Menten reaction rate of the enzymatic reaction. Hence, the effectivediffusion coefficient of the enzyme De(s) can be written in terms of the diffusioncoefficient in absence of substrate D0
e as
De(s) = D0e
(1 + α
sKM + s
), (2.5)
where α corresponds to the maximal relative increase (De(s)− D0e)/D0
e , obtained fors � KM. The maximal measured relative increases are in the range of α ≈ 0.15-0.80,being usually ≈ 0.30. Most of these measurements were performed by using Fluores-cence Correlation Spectroscopy (FCS). This technique is based on the measurement ofthe correlations of fluctuations of the fluorescence intensity produced by the motion offluorescently labeled enzymes in a small volume. The resulting correlation function
33

2. Spatial organization and dynamics of enzymatic reactions
is then fit to a model that assumes the diffusive motion of the labeled particles. Someof the above experimental results have been proven to be due to artifacts affectingthe FCS measurements [143, 144]. For example the 0.80 relative increase in diffusioncoefficient of the enzyme alkaline phosphatase has been shown to be due to quenchingof the fluorophore caused by the substrate [143, 145]. Nevertheless, enzymes enhanceddiffusion is still observed in experiments using different techniques [137, 146, 147, 148].
It is still unknown what the cause of enhanced diffusion could be. On the one hand,experiments suggest that catalysis plays a crucial role. In fact, the enhanced diffusionseems to correlate with the energy released by the enzymatic reaction [140]. Differentmechanisms explaining how this energy release could speed up the enzyme diffusionhave been proposed. For example, the heat dissipated by a single enzymatic reactioncould generate a local temperature increase, which in turn would cause an increaseddiffusion as given by the Einstein relation ∆D = µkb∆T, where µ is the enzymemobility, kb the Boltzmann constant and ∆T the temperature increase [38]. However,the heat dissipated by a typical enzymatic reaction can cause increases that are at most∆T < 1K [140]. Although these are too small to justify the experimental observations, ithas been suggested that the heat released by multiple synchronous reactions could leadto global temperature increases ∆T ≈ 5-10K [149]. Nevertheless, these temperatureincreases are not observed in experiments. Another model suggests that the energyreleased could cause a “chemoacoustic” effect for which the center of mass of theenzymes would be displaced by an asymmetric pressure wave propagating through theenzyme [140]. However, the energy released by the reactions is not compatible with thechemoacoustic effect [149, 150]. According to the latest measurements, it seems that theenhanced diffusion can be determined by the Gibbs free energy release rate [148]. Thisis consistent with super resolution experiments suggesting that the energy releasedfrom the catalysis could be fueling a ballistic component of the enzyme motion over atime interval of 1-10µs, for a distance of the order of tens of nm [142, 151]. For sucha model α ∼ kcatl2
B/D0e , where lB is the distance covered by the enzyme due to the
energetic boost. Note that no microscopic models have been proposed to justify theballistic motion observed.
On the other hand, experiments performed with other enzymes suggest that thecatalytic step of the reaction might play a less relevant role. In fact, enhanced diffusionof these enzymes is observed in presence of inhibitors that can bind and unbind tothe enzyme without reacting [136, 141, 152]. These experiments suggest that enhanceddiffusion could be the result of conformational changes of the enzyme upon substrate orinhibitor binding. In Sec. 1.2.2, Fig. 1.3, we have seen how the binding of substrate caninduce changes in the enzyme structure. Usually the enzyme becomes more compactand stiffer. This causes a reduction in the hydrodynamic radius and consequently anincrease in diffusion coefficient [141, 153]. For such models α = (Dc − D0
e)/D0e , where
34

2. Spatial organization and dynamics of enzymatic reactions
Dc corresponds to the diffusion coefficient of the enzyme-substrate or enzyme-inhibitorcomplex and Dc > D0
e . Having Dc > D0e has been confirmed by Brownian dynamics
simulation [154] and it has been measured for enzymes undergoing conformationalchanges [155]. However, whether these changes can cause a relative increase of en-hanced diffusion higher than 0.15 is still argued [154, 155]. Moreover, conformationalchanges have also been suggested to generate hydrodynamic collective effects thatcould be responsible for the enhanced diffusion [156, 157].
For some enzymes, the enhanced diffusion has been related to the dissociation ofenzyme oligomers into smaller subunits [158, 147]. As we have seen in Sec. 1.3.3 forthe hemoglobin, oligomers are structures composed of multiple copies of the sameenzyme. The oligomerization of enzyme complexes can depend on the concentrationof substrate or inhibitors around the complexes and it follows a Michaelis-Mentenequation of the same form of Eq. (2.5). The smaller subunits then show a higherdiffusion coefficient due to their size. Although such a dissociation process has beenshown to play a role for the enzymes F1-ATPase [158], hexokinase and aldolase [147],it only plays a limited role for the enzyme acetylcholinesterase and urease [147, 146].For instance, urease shows an enhanced diffusion that can be almost 3-fold higher thanin the absence of substrate in a viscous environment and not due to the dissociationof the enzyme oligomers [146]. This increase has been assessed by looking at themean squared displacement of single enzyme molecules with total internal reflectionfluorescence (TIRF) microscopy. To favor the tracking, the enzyme motion has beenslowed down by the addition of methylcellulose as a viscous agent. The distributionof urease oligomers, in the presence and absence of substrate, has been controlled bysingle molecule photobleaching experiments.
In summary, the enhanced diffusion of enzymes can always be effectively describedusing Eq. (2.5). However, the exact cause of the relative increase in diffusion coefficientα depends on the specific model and the enzyme considered.
2.6.2. Directed motion in substrate gradients
Enzymes not only exhibit enhanced diffusion in the presence of their substrate butalso show directed motion in substrate gradients. However, whether this motionis directed upstream or downstream depend on the experimental conditions. Insome experiments enzymes have been observed to drift upstream substrate gradients,performing ‘chemotaxis’. In others enzymes appear to drift downstream substrategradients, performing ‘antichemotaxis’. In the following we discuss and compare thetwo experimental scenarios together with the different models proposed to describethe observed enzyme motion.
35
2. Spatial organization and dynamics of enzymatic reactions
Chemotaxis
The typical experimental setup used to analyze enzyme chemotaxis is shown in Fig. 2.5a.A three-inlet one-outlet microfluidic channel is employed. A fluorescently taggedenzyme (in this case urease) flows into the channel only through the middle inlet,whereas an equal concentration of buffer solution is used in all of them. The onlyelement breaking the symmetry is the inflow of substrate (in this case urea) throughthe bottom inlet. This generates a lateral concentration gradient of the substrate. Byusing confocal microscopy is possible to analyze the enzyme profile further downthe microfluidic channel. In absence of substrate the enzymatic concentration profileappears to be symmetric, see Fig. 2.5b. However, as substrate is added into the channelwe see a shift on one flank of the profile. This suggests that the enzyme molecules movetowards higher substrate concentrations. Moreover, the shift appears to be dependenton the substrate concentration used, see Fig. 2.5c. Similar setups have been used tocharacterize the chemotactic response of several enzymes. Besides urease, catalase [139],RNA polymerase [137] and several glycolytic enzymes showed a similar response [91].Remarkably, it has been shown that the consecutive enzymes of enzymatic cascadescan co-localize due to such chemotactic response [139, 91]. In fact, the intermediateproduced by an enzyme of the cascade (upstream enzyme) triggers the chemotacticshift of the next enzyme in line (downstream enzyme). The downstream enzyme thendrifts towards high intermediate concentrations, hence co-localizing with the upstreamone.
The chemotactic response of the enzymes can be explained by considering a cross-diffusion term in the equation describing the enzyme motion. Cross-diffusion describesthe response of the enzyme to forces generated by substrate gradients. Mathematically,it corresponds to an off-diagonal element in the diffusion matrix describing the motionof both the enzyme and the substrate. Such cross-diffusion has been suggested tobe due to the local, attractive, short-ranged interactions between the substrate andthe enzyme binding site [152, 159, 91]. Such interactions are usually referred to asspecific interactions [160]. In presence of substrate gradients, enzymes that are notsubstrate bound would then be attracted to regions of high substrate concentration, seeF. Mohajerani et al. [152] for details. The equation describing the enzyme motion, whichconsiders both the effects of enhanced diffusion and cross-diffusion due to specificinteractions, takes the form:
∂te(x, t) = ∂xDe(s)∂xe + ∂x[Dsxd(s, e)∂xs] , (2.6)
36

2. Spatial organization and dynamics of enzymatic reactions
a
b c
Experimental setup
Chemotactic shift Shift as a function of substrate
Figure 2.5.: Chemotaxis of enzymes in presence of substrate gradients. a Typical experimentalsetup used to observe enzyme chemotaxis. A three-inlet one-outlet microfluidic channel isemployed. The enzyme (urease) enters the microfluidic channel through the middle inlet. Thesubstrate (urea) enters via the bottom inlet, while equal concentrations of buffer are used inall the inlets. b A chemotactic shift in the enzyme profile is observed via confocal microscopyalong the channel. The shift shows the tendency of enzymes to move towards the side of thechannel where the concentration of substrate is the highest. c The chemotactic shift in theenzyme profile increases with the substrate concentration used in the bottom inlet. The bluebars are the experimental results and the red diamonds are the results of simulations that usethe equation Eq. (2.7) for the enzyme motion. This equation includes the effects of enzymeenhanced diffusion and enzyme cross-diffusion generated by specific interactions with thesubstrate. Figures adapted with permission from [152].
where De(s) = D0e
(1 + α s
KM+s
)(same as Eq. (2.5)) and the cross-diffusion is given by
Dsxd(s, e) = −D0
eKM
KM + se
Kd + s. (2.7)
Eq. (2.7) shows that both the Michaelis-Menten constant KM and the dissociation
37
2. Spatial organization and dynamics of enzymatic reactions
constant Kd = k−1/k1 of an enzyme are determining factors for the cross-diffusionderived by F. Mohajerani et al. [152]. The first fraction in Eq. (2.7) is the fraction of freeenzymes. Only free enzymes are in fact subject to forces due to specific interactions.The second fraction has to do with the magnitude of these forces. Their magnitude ishigher if the binding has a high rate k1 � k−1, i.e. for values of Kd → 0. The Eq. (2.7)has been used in simulations of the setup shown in Fig.2.5c to measure the shift due tochemotaxis in the enzyme profile. The results are the red diamonds shown in Fig.2.5c.
The chemotaxis of enzymes in substrate gradients would make enzymatic reactionsmore efficient as free enzymes would swim towards higher substrate concentrations. Itcould also be the mechanism behind spontaneous metabolon formation (cf. Sec. 2.2.3),by driving the co-localization of consecutive enzymes. However, these findings are stillcontroversial and need to be further validated. In fact, another study has observed thatthe same enzyme used in the experiment of Fig. 2.5, urease, does not chemotax butrather antichemotax in a similar experimental setting.
Antichemotaxis
The enzyme urease that seems to chemotax in the experiment illustrated in Fig. 2.5,shows antichemotaxis in the experimental setup considered by Jee et al. [142, 151] anddescribed in Fig. 2.6. A microfluidic channel is again employed for the analysis of theenzyme motion, see Fig. 2.6a. Using sequential dilution from two parent reservoirs,enzyme and substrate enters the channel with different profiles. The enzyme is uniformacross the channel, whereas the substrate (urea) forms a linear gradient. Downstreamthe channel entry, urease concentration is measured by using FCS. In Fig. 2.6b, we cansee how the enzyme accumulates where substrate concentration is low. This suggeststhat the enzyme is able to swim downstream substrate gradients, i.e. it antichemotaxes.In contrast to chemotaxis, antichemotaxis can be justified exclusively by consideringenhanced diffusion. In Fig. 2.6c, we can see how the diffusion coefficient of the enzymeurease (extracted via FCS measurements) decreases across the channel together withthe substrate concentration. The diffusion coefficient goes from being ≈ 20% higherthan the one in the absence of substrate on the left, to be approximately equal on theright.
This type of enzyme motion can be described by the following equation of mo-tion [142]:
∂te(x, t) = ∂2x[De(s)e] , (2.8)
where the enhanced diffusion De(s) has the Michaelis-Menten form of Eq. (2.5). Thesteady state response to a linear substrate gradient given by Eq. (2.8) is given bye ∼ 1/De(s). Such a profile, fits very well the experimentally observed measurements
38

2. Spatial organization and dynamics of enzymatic reactions
e
a bExperimental setup Enzyme antichemotaxis
Spatially dependent diffusionc
Figure 2.6.: Antichemotaxis of enzymes in presence of substrate gradients. a Experimentalsetup used in the experiments that observed enzyme antichemotaxis. A microfluidic channel isemployed. The solution enters the channel via a sequential dilution from two parents reservoirs.Equal concentrations of the enzyme urease and buffer solution are employed in both reservoirs,while the substrate urea is present only in the left reservoir. This generates a linear substrategradient at the entry of the channel as shown by the cyan shading. The enzyme and the bufferinstead have initial homogeneous concentrations. b Enzyme antichemotaxis. The enzymeconcentration is measured via FCS across the channel. The results are shown by the black solidcircles. The grey open circles represent the linear substrate gradient measured in the absenceof enzymes. The enzyme accumulates on the right, where the concentration of substrate islow. c Spatially dependent diffusion coefficient. The diffusion coefficient of the enzyme ismeasured via FCS across the channel with and without substrate. In presence of substrate, thediffusion coefficient of the enzyme is higher for higher concentration of substrate. However, inthe absence of substrate, the diffusion coefficient is uniform across the channel. Figures adaptedwith permission from [142].
as can be seen by looking at the dashed black line in Fig. 2.6b. By coupling a superresolution microscopy technique (stimulated emission depletion microscopy, i.e. STED)to FCS, Jee et al. [142, 151] observed a ballistic component of the enzyme motion overdistances lB of the order of tens of nanometers, with a transient time between 5 and10µs. They suggested that such ballistic motion could be fueled by the realease of theGibbs free energy of the reaction (10-20kBT) over the observed time interval. As alreadymentioned in Sec. 2.6.1, this would generate a maximal relative increase in diffusioncoefficient of α ∼ kcatl2
B/D0e , where the prefactor would depend on whether or not the
39
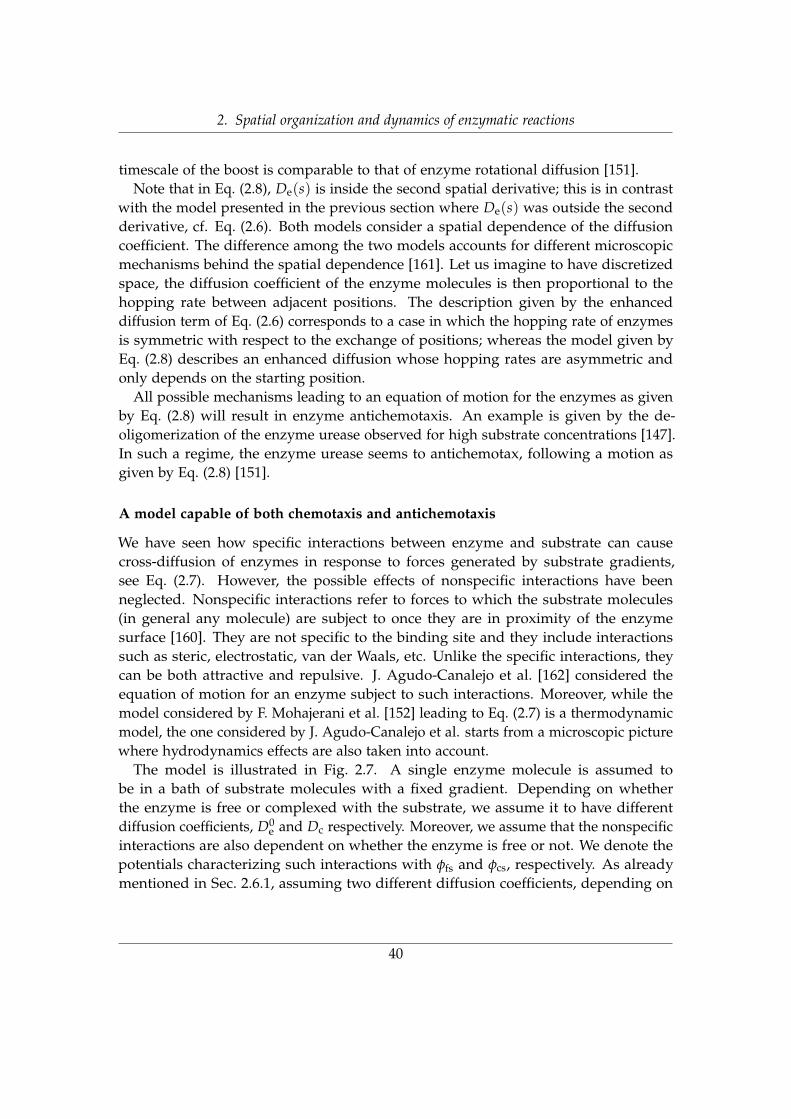
2. Spatial organization and dynamics of enzymatic reactions
timescale of the boost is comparable to that of enzyme rotational diffusion [151].Note that in Eq. (2.8), De(s) is inside the second spatial derivative; this is in contrast
with the model presented in the previous section where De(s) was outside the secondderivative, cf. Eq. (2.6). Both models consider a spatial dependence of the diffusioncoefficient. The difference among the two models accounts for different microscopicmechanisms behind the spatial dependence [161]. Let us imagine to have discretizedspace, the diffusion coefficient of the enzyme molecules is then proportional to thehopping rate between adjacent positions. The description given by the enhanceddiffusion term of Eq. (2.6) corresponds to a case in which the hopping rate of enzymesis symmetric with respect to the exchange of positions; whereas the model given byEq. (2.8) describes an enhanced diffusion whose hopping rates are asymmetric andonly depends on the starting position.
All possible mechanisms leading to an equation of motion for the enzymes as givenby Eq. (2.8) will result in enzyme antichemotaxis. An example is given by the de-oligomerization of the enzyme urease observed for high substrate concentrations [147].In such a regime, the enzyme urease seems to antichemotax, following a motion asgiven by Eq. (2.8) [151].
A model capable of both chemotaxis and antichemotaxis
We have seen how specific interactions between enzyme and substrate can causecross-diffusion of enzymes in response to forces generated by substrate gradients,see Eq. (2.7). However, the possible effects of nonspecific interactions have beenneglected. Nonspecific interactions refer to forces to which the substrate molecules(in general any molecule) are subject to once they are in proximity of the enzymesurface [160]. They are not specific to the binding site and they include interactionssuch as steric, electrostatic, van der Waals, etc. Unlike the specific interactions, theycan be both attractive and repulsive. J. Agudo-Canalejo et al. [162] considered theequation of motion for an enzyme subject to such interactions. Moreover, while themodel considered by F. Mohajerani et al. [152] leading to Eq. (2.7) is a thermodynamicmodel, the one considered by J. Agudo-Canalejo et al. starts from a microscopic picturewhere hydrodynamics effects are also taken into account.
The model is illustrated in Fig. 2.7. A single enzyme molecule is assumed tobe in a bath of substrate molecules with a fixed gradient. Depending on whetherthe enzyme is free or complexed with the substrate, we assume it to have differentdiffusion coefficients, D0
e and Dc respectively. Moreover, we assume that the nonspecificinteractions are also dependent on whether the enzyme is free or not. We denote thepotentials characterizing such interactions with φfs and φcs, respectively. As alreadymentioned in Sec. 2.6.1, assuming two different diffusion coefficients, depending on
40
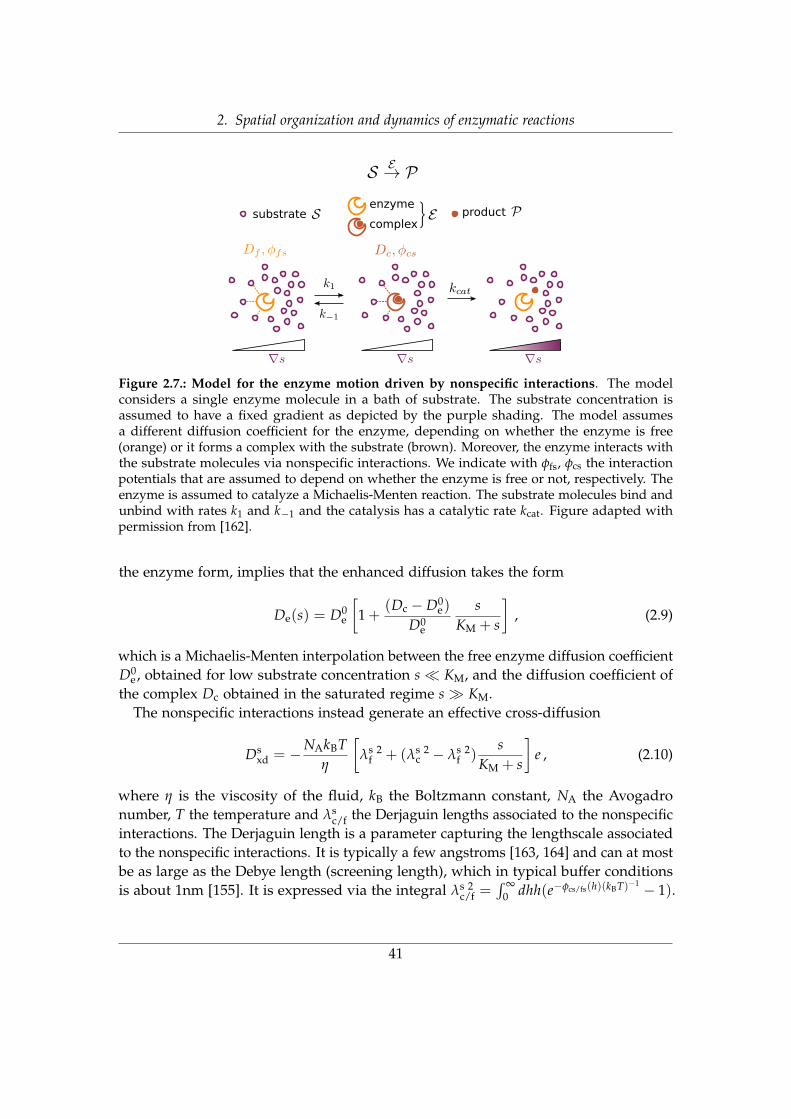
2. Spatial organization and dynamics of enzymatic reactions
substrateenzyme
complexproduct
Figure 2.7.: Model for the enzyme motion driven by nonspecific interactions. The modelconsiders a single enzyme molecule in a bath of substrate. The substrate concentration isassumed to have a fixed gradient as depicted by the purple shading. The model assumesa different diffusion coefficient for the enzyme, depending on whether the enzyme is free(orange) or it forms a complex with the substrate (brown). Moreover, the enzyme interacts withthe substrate molecules via nonspecific interactions. We indicate with φfs, φcs the interactionpotentials that are assumed to depend on whether the enzyme is free or not, respectively. Theenzyme is assumed to catalyze a Michaelis-Menten reaction. The substrate molecules bind andunbind with rates k1 and k−1 and the catalysis has a catalytic rate kcat. Figure adapted withpermission from [162].
the enzyme form, implies that the enhanced diffusion takes the form
De(s) = D0e
[1 +
(Dc − D0e)
D0e
sKM + s
], (2.9)
which is a Michaelis-Menten interpolation between the free enzyme diffusion coefficientD0
e , obtained for low substrate concentration s� KM, and the diffusion coefficient ofthe complex Dc obtained in the saturated regime s� KM.
The nonspecific interactions instead generate an effective cross-diffusion
Dsxd = −NAkBT
η
[λs 2
f + (λs 2c − λs 2
f )s
KM + s
]e , (2.10)
where η is the viscosity of the fluid, kB the Boltzmann constant, NA the Avogadronumber, T the temperature and λs
c/f the Derjaguin lengths associated to the nonspecificinteractions. The Derjaguin length is a parameter capturing the lengthscale associatedto the nonspecific interactions. It is typically a few angstroms [163, 164] and can at mostbe as large as the Debye length (screening length), which in typical buffer conditionsis about 1nm [155]. It is expressed via the integral λs 2
c/f =∫ ∞
0 dhh(e−φcs/fs(h)(kBT)−1 − 1).
41

2. Spatial organization and dynamics of enzymatic reactions
λs 2c/f is positive for attractive interactions and negative for repulsive ones [162]. Note
that the derivation of λs 2c/f is similar to that of the second virial coefficient for a real
gas [165], but it also includes hydrodynamic effects and is computed by assumingthat the size of the enzyme is much larger than the interaction length. In the simplecase that λs 2
f and λs 2c have the same sign, from Eq. (2.10), we can see that the sign of
λs 2c/f determines the sign of the cross-diffusion. In presence of a substrate gradient the
enzyme will be pushed to the side of higher substrate concentration if the nonspecificinteractions are attractive (λs 2
c/f > 0 and Dsxd < 0) and it will be pushed in the opposite
direction if the interactions are repulsive (λs 2c/f < 0 and Ds
xd > 0).The equation of motion of an enzyme subject to nonspecific interaction is therefore
given by∂te(x, t) = ∂2
x[De(s)e] + ∂x[Dsxd(s, e)∂xs] , (2.11)
where De(s) and Dsxd(s) follow Eqs. (2.9), (2.10) respectively. The equation of motion
Eq. (2.11) is a mathematical generalization of the equation presented by Jee et al. [142,151] (Eq. (2.8)). The only difference lies in the microscopic mechanisms behind theenhanced diffusion and, therefore, the two models present different relative increasesin the diffusion coefficient α. Nevertheless, the two De(s) functions have the samefunctional dependence on s. The equation of motion proposed by J. Agudo-Canalejoet al. [162] generalizes also some of the models proposed in the literature to justifyenzyme chemotaxis [159, 91]. However, the model proposed by J. Agudo-Canalejo etal. [162] and the one proposed by Mohajerani et al. [152] (given by Eq. (2.6)) presentsome differences. The enhanced diffusion of Eq. (2.11) generates a drift in the enzymemotion given by [∂sDe(s)]e = αD0
eKM/(KM + s)2 that is very similar in form to the onesuggested by Mohajerani et al. [152] and given by Eq. (2.7). Considering that oftenKM ≈ Kd, the two differs only by a prefactor α and by having opposite signs.
Overall, we have seen that different models have been proposed to describe theenzyme motion in presence of their substrate. These studies focused on the responseof the enzyme to pre-imposed substrate profiles. They did not consider the effectsthat the enzymatic reaction has in shaping the substrate profile, which in turns has aneffect on the enzyme motion. In Ch. 4, we will show that a positive feedback betweenenzyme accumulation due to nonspecific interactions and reaction can drive spatialpattern formation starting from initial homogeneous concentrations. We will thereforedemonstrate that studying the effect that the reaction has on the substrate profile canbe important in selecting the correct model of enzyme motion. In fact, patterns canonly form for the model proposed by J. Agudo-Canalejo et al. [162], but not for theother models.
42

3. Design principles for the optimal spatialarrangement of enzymes*
Due to evolutionary pressure and limited amount of resources, cells face numerousallocation problems demanding decisions on how to distribute their resources. Toregulate enzymatic reactions, cells not only decide the amounts and types of enzymesto be produced, but they also regulate their spatial arrangement (cf. Ch. 2). Forexample, enzymes can be positioned to maximize the product flux of the reaction thatthey catalyze. In this chapter, we derive an optimal allocation principle for the spatialdistribution of enzymes in a wide class of reaction-diffusion systems for which theenzyme’s substrate is imported into the system through the external boundary or theboundaries of internal compartments. So far, for systems presenting a single source ofsubstrate and spherical symmetry, these distributions have been analyzed by stochasticoptimization algorithms. However, these methods were unable to provide a systematicconstruction of the optimal profile for systems without specific symmetries. To addressthis issue, here we derive an optimal allocation principle demanding that the availableenzymes are distributed such that the marginal flux returns at each occupied positionare equal. This homogeneous marginal returns (HMR) principle generalizes the Kellycriterion [166] (widely used for betting and portfolios optimization) to a case whereeach bet globally feeds back onto all payoffs (see graphical abstract Fig. 3.1). TheHMR criterion allows us to analytically understand and characterize a localization-delocalization transition in the optimal enzyme distribution with respect to the sourceof substrate that was previously observed numerically [167, 168]. In particular, ouranalysis reveals the generality of the transition, and produces an experimentally relevanttest for the optimality of enzyme localization at the substrate source, by comparing thereaction flux to the influx of substrate. We also leverage the HMR criterion to devisea deterministic construction algorithm to build up the optimal enzyme arrangementssystematically rather than by using stochastic algorithms. Taken together, our resultsreveal a common principle in allocation problems from biology and economics, whichcan also serve as a design principle for synthetic biomolecular systems.
*The chapter is adapted from the manuscript: “A generalized Kelly criterion for the optimal spatialallocation of enzymes”, by G. Giunta, F. Tostevin, U. Gerland, which has been submitted for publication.
43

3. Design principles for the optimal spatial arrangement of enzymes
Enzyme spatial allocationproblem
Portfolio optimization problem whereinvestments and returns are coupled
Reaction-Diffusion Systemwith localized reactions
Portfolio of positions
What is the optimal localization strategy? What is the optimal bet-hedging strategy?
diffusing substrate
localized enzyme regions with
degraded
positions with
returns of
diminishing returns effect due to depletion ofpositions are coupled by Diffusion
and
investment
generate returns
Figure 3.1.: Graphical abstract: Design principles for the optimal spatial arrangement ofenzymes. We consider a class of reaction-diffusion systems where an enzyme E converts asubstrate S into a product P . The class of systems is such that S is imported into the systemeither from the external boundary or the boundary of internal compartments. Once into thesystem, S can be degraded, lost to competing reactions, or react with E , implying that S is notuniformly distributed in the system at steady state. Moreover, while S diffuses, E is assumedto be localized (static). We ask: What is the enzyme spatial arrangement that maximizesthe reaction flux? To answer the question we draw an analogy between the enzyme spatialallocation problem and a portfolio optimization problem. The system can be interpreted as aportfolio, where each position represents an asset generating a certain amount of returns interms of reaction flux. Enzymes are capital that can be invested in the system at the differentpositions. As opposite to classical economical systems where investments and returns areassumed to be independent, here the reaction-diffusion dynamics causes the returns in reactionflux and the enzyme investments to be coupled. More specifically, since the reaction betweenenzyme and substrate at a given location causes the substrate to be depleted, this generates adiminishing returns effect for which the addition of extra enzymes at that position is graduallyless efficient. Moreover diffusion causes the different positions to be coupled. By generalizing awidely used betting criterion (the Kelly criterion [166]) to include these couplings, we showthat the enzyme spatial allocation problem can be solved in terms of a bet-hedging strategy fora portfolio optimization problem where investments and returns are coupled.
44

3. Design principles for the optimal spatial arrangement of enzymes
3.1. Introduction
Living organisms have a limited amount of resources at their disposal that need tobe allocated among different molecular processes. To cope with such limitations,organisms present a variety of bet-hedging strategies that allows them to efficientlyuse their resources. Such strategies share the basic characteristics of other resourceallocation problems, where a given amount of a resource must be distributed amongcompeting alternatives to maximize the expected performance of the system [169].On the cellular level, for example, cells of a colony of microbes can differentiate intodifferent cell types, each specialized in a task that contributes to the growth of the colonyas a whole [170]. This allows a more efficient enzymes usage as cells compartmentalizemetabolic pathways, avoiding cross-talk of toxic intermediates. On the molecular level,enzymes are also efficiently allocated. For instance, a limited number of ribosomesmust produce different types of proteins in different ratios to achieve balanced cell-growth [171, 172, 173]. Moreover, cells need to dynamically adjust these ratios tosupport their growth under changes in environmental conditions [174, 175]. Besidesregulating production ratios, we have seen in Ch. 2 that cells are able to control thespatial arrangement of enzymes to optimize or regulate metabolic fluxes [79, 176].Sec. 2.2.2 showed how consecutive enzymes evolved structural features to directlychannel intermediates from one another. Sec. 2.2.3 showed how the formation of largeenzymatic clusters (metabolons) enhances the flux of the final product of a pathway andreduces the transient times of reactions by constraining the diffusion of intermediates.We have also seen that synthetic strategies can be used to regulate the spatial allocationof enzymes, both in vivo and in vitro, see Sec. 2.5. Such strategies can be used to boostthe yields of useful products such as drug molecules [128, 177, 178] and biofuels [122,123].
Here, we solve the spatial allocation problem where multiple copies of a singletype of enzyme E can be assigned to different spatial positions in a wide class ofreaction-diffusion systems, see Fig. 3.2. This class of systems applies to domains ofarbitrary shape, in which the substrate S is imported either from the external boundaryand/or the boundary of internal compartments. The enzyme catalyzes the conversionof the substrate S into a product P . As a measure for the performance of the system,we consider the total reaction flux, i.e. the overall rate at which product is generated.We are interested in finding the optimal enzyme profile e∗(r). Why would the spatialdistribution e(r) of the enzymes E affect the total reaction flux? The rate at which anenzyme catalyzes reactions depends on the local concentration of its substrate S . The Smolecules, in turn, are not necessarily uniformly distributed within cells: (i) As alreadymentioned, they are often imported into the cytoplasm from the cell exterior or froman internal organelle (see Sec. 2.4 and Fig. 3.2b-Import), or they may be produced by
45

3. Design principles for the optimal spatial arrangement of enzymes
other non-uniformly distributed enzymes. (ii) They are subject to loss mechanisms,e.g. leakage through a membrane [48], conversion by a competing enzyme [59], orspontaneous decay of unstable molecules such as PRPP [179] (see Fig. 3.2b-Loss). (iii)The enzyme E also affects the concentration profile of its substrate S by depleting itlocally. (iv) Substrate molecules are stochastically transported via diffusion and possiblyalso actively transported by cytoplasmic streaming [180] or cargo-carrying molecularmotors [181] (see Fig. 3.2b-Transport). The interplay of these mechanisms can producestable non-uniform substrate profiles, as can be seen in a variety of different contexts,including embryo-morphogenesis [182], cell mitosis [183], asymmetric division ofbacteria [184], virulence strength [185] and control of cell length in yeast [186]. Havingnon-uniform substrate profiles implies that different spatial enzyme distributions e(r)generate different total reaction fluxes. Note that potential co-localization of E withother enzymes [65, 187, 59, 66] is incorporated in our model only to the extent that theS influx at the boundaries may be caused by other, boundary-localized enzymes.
As we already discussed in Sec. 2.4 for cases where the substrate is produced insideorganelles (e.g. the mitochondria or endoplasmic reticulum), the enzymes tend to bebound to the organelle membrane, or located in their proximity also being present in thecytoplasm [115, 111, 106, 93], see Fig. 2.2c and Fig. 3.2a. In contrast, when the substrateis imported into the cytoplasm from the external environment, some of the associatedmetabolic enzymes are localized to the external membrane [89, 105], see Fig. 2.2a-b.This intuitively guarantees an efficient substrate turnover as losses of substrate shouldbe prevented, cf. Sec. 2.4. Surprisingly, a previous study of a minimal one-dimensionalmodel within the class of systems illustrated in Fig. 3.2 observed a phase transitionin the optimal enzyme distribution e∗(r) as a function of a dimensionless reaction-diffusion parameter [167]: When reactions are slow compared to diffusion, localizingall E at the source boundary is optimal, while a more extended profile with enzymesalso in the interior is optimal for faster reactions. The existence of this transition wassubsequently found to be robust with respect to the spatial dimension and specific lossmechanism and reaction kinetics considered [168]. However, the physical principlesgoverning the optimal configurations and the generality of the transition have remainedelusive, and a systematic way of constructing the optimal enzyme arrangement islacking.
The optimal allocation of limited resources is extensively studied in economics. Rulessuch as Kelly’s criterion [166] are used to determine optimal betting strategies orportfolios [188]. Kelly’s criterion specifies how to place bets to maximize the long-termgrowth rate of a gambler’s capital when betting on several mutually exclusive events.We draw an analogy between the biological problem of spatial enzyme allocation andeconomical investment problems. Within this analogy, enzyme molecules representcapital that can be invested at different positions within the system. Each position can
46

3. Design principles for the optimal spatial arrangement of enzymes
be interpreted as an asset, generating a certain expected return in terms of reaction flux.An important assumption of Kelly’s problem is that the gambler’s bets do not directlyaffect the payoffs/returns of the different events. This is certainly not the case for theenzyme allocation problem, where enzymes placed at different positions have directeffects on the substrate profile and on the reaction flux. Drawing an analogy betweenthe two problems helps in better understanding the enzyme allocation problem and italso helps in providing a generalization of the Kelly criterion for cases where payoffsand bets are directly coupled. We can therefore ask: can we use strategies of the type ofKelly’s one for the determination of the optimal enzyme arrangements? Moreover, thelocalization-to-delocalization transition observed in the optimal enzyme arrangementis reminiscent of a transition in investment strategy from investing everything on asingle asset to having a diversified portfolio where investments are partitioned amongmultiple assets. Therefore we can also ask: Can we explain the generality of thelocalization-to-delocalization transition through the analogy with a diversificationinvestment strategy? Lastly: just as Kelly’s criterion provides a set of rules for theoptimal repartition of bets, can we derive an algorithm for the construction of theoptimal arrangement of enzymes? To address these questions, we devise a variationalapproach to characterize the optimal enzyme arrangements and reveal the underlyinginvestment diversification strategy.
3.2. Model
We consider catalytic reactions where a substrate S is converted into a product P by anenzyme E (Fig. 3.2a). The substrate enters the system either from the exterior or from aninternal compartment (Fig. 3.2b-Import). Enzymes may be located both in the bulk ofthe system and at the boundaries where the substrate is imported. The former fractionis described by the concentration field e(r), with r denoting positions inside the system,while eS(s) is the density of E on the boundary surface at position s. The concentrationof S at time t is ρ(r, t). We consider the distribution of E as stationary and explore allpossible spatial arrangements of the enzymes. We assume that the rate at which S isconverted into P is described by kcateF[ρ], where kcat is the enzyme turnover rate andF[·] is a monotonically-increasing reaction function that can be chosen to represent aparticular reaction scheme, e.g. Michaelis-Menten kinetics, F[ρ] = ρ/(KM + ρ), or linearmass-action kinetics, F[ρ] = ρ, or a Hill function F[ρ] = ρh/(Kh + ρh) (cf. Sec. 1.3.3).
Within the system, substrate molecules undergo diffusive transport with diffusioncoefficient D and may also be advected by a velocity field v(r) (Fig. 3.2b-Transport).If the substrate is intrinsically unstable or subject to competing reaction pathways,it decays with rate constant σ (Fig. 3.2b-Loss). Taking into account these different
47

3. Design principles for the optimal spatial arrangement of enzymes
degradedsubstrate
leakedenzyme
a
b
Imp
ort
From the exterior From organelles
Loss
Decay/Competing pathways Leakage
Transp
ort
Diffusion+AdvectionDiffusion
Figure 3.2.: Class of reaction-diffusion systems considered for the optimal spatial allocationof enzymes. a We consider a single-step catalytic reaction where a substrate S is converted byan enzyme E into product P . The enzyme molecules can be freely placed, being either boundto the external or the internal boundaries or placed anywhere within the system. The substratehas influx j and it is processed by the enzyme with a catalytic rate kcat. b-Import: S is eitherimported from the exterior or produced within internal compartments. b-Transport: Once intothe cytoplasm the substrate can follow an advection-diffusion transport, where the advectioncan be caused by the active transport of substrate molecules or cytoplasmic streaming. b-Loss:During its transport the substrate can also be degraded with rate σ, leaked through the externalmembrane or absorbed into an other organelle.
processes, the dynamics of S follows
∂tρ(r, t) = D∇2ρ(r, t)−∇ · [ρ(r, t)v(r)]− σρ(r, t)− kcate(r)F[ρ(r, t)] , (3.1)
where the first two terms on the right hand side describe the transport of S by diffusionand advection, the third term describes decay, and the last describes the reaction
48

3. Design principles for the optimal spatial arrangement of enzymes
of substrate with enzymes. In the following, we focus on steady-state conditions,∂tρ(r, t) = 0, where ρ(r, t) = ρ(r).
We consider two types of boundaries for the system: boundaries at which substrateis imported and absorbing boundaries. For the first type, by including the reactionof substrate with the enzymes that may be located at such a boundary, we have aboundary condition of the form
j(s) =[
D∂ρ
∂n(s)− ρ(s)v(s) · n(s)
]+ kcateS(s)F[ρ(s)], (3.2)
where j(s) is the influx of S at position s, n(s) is a unit vector normal to the boundary,pointing outwards from the system, and ∂
∂n(s) represents the magnitude of the normalcomponent of the gradient. This condition enforces flux conservation at the boundary:the influx j(s) must equal the sum of the local transport and reaction flux. We allowfor j(s) to be a discontinuous function of s as there could be regions on the boundarywithout influx, j(s) = 0 (see Appendix A.1 for details on how such discontinuities aretreated). The second kind of boundaries we consider are absorbing boundaries withρ(s) = 0, from which substrate is rapidly lost (see Fig. 3.2b-Loss). For convenience, wecombine these two types of boundary condition
0 = k(s){
j(s)−[
D∂ρ
∂n(s)− ρ(s)v(s) · n(s)
]− kcateS(s)F[ρ(s)]
}− h(s)ρ(s) , (3.3)
where k(s) and h(s) are set to represent absorbing boundaries (k = 0, h = 1) orboundaries with influx of substrate (k = 1, h = 0).
The total flux JP , i.e. the rate at which the whole system produces P , has contribu-tions from enzymes at the boundaries and within the bulk,
JP =∫
SkcateS(s)F[ρ(s)]ds +
∫V
kcate(r)F[ρ(r)]dr , (3.4)
where the first integral is over all boundary surfaces S and the second is over thevolume V of the system. The question is: Given a fixed amount of available enzymes,Etot =
∫S eS(s)ds +
∫V e(r)dr, how should these enzymes be positioned such as to
maximize the rate JP of product formation?This optimization problem can be approached by defining a functional of the formL = JP −∑i λiCi, where Ci represent different constraints with associated Lagrangemultipliers λi. For our model, these constraints are that (i) the total amount of enzymesmust equal Etot, (ii) ρ(r) and e(r) must jointly satisfy the reaction-diffusion-advectionequation, Eq. (3.1), at each point r, and (iii) ρ(s) and eS(s) must jointly satisfy theboundary condition, Eq. (3.3), at each boundary point s. The resulting Lagrangian has
49
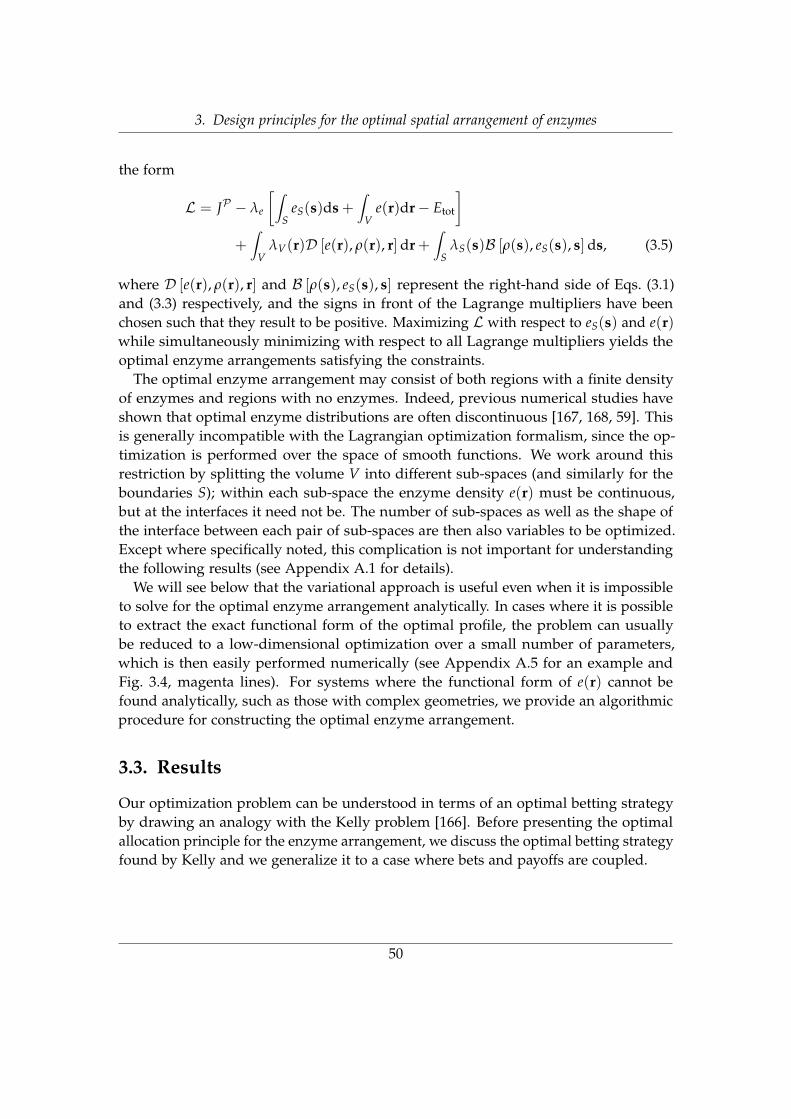
3. Design principles for the optimal spatial arrangement of enzymes
the form
L = JP − λe
[∫S
eS(s)ds +∫
Ve(r)dr− Etot
]+∫
VλV(r)D [e(r), ρ(r), r]dr +
∫S
λS(s)B [ρ(s), eS(s), s]ds, (3.5)
where D [e(r), ρ(r), r] and B [ρ(s), eS(s), s] represent the right-hand side of Eqs. (3.1)and (3.3) respectively, and the signs in front of the Lagrange multipliers have beenchosen such that they result to be positive. Maximizing L with respect to eS(s) and e(r)while simultaneously minimizing with respect to all Lagrange multipliers yields theoptimal enzyme arrangements satisfying the constraints.
The optimal enzyme arrangement may consist of both regions with a finite densityof enzymes and regions with no enzymes. Indeed, previous numerical studies haveshown that optimal enzyme distributions are often discontinuous [167, 168, 59]. Thisis generally incompatible with the Lagrangian optimization formalism, since the op-timization is performed over the space of smooth functions. We work around thisrestriction by splitting the volume V into different sub-spaces (and similarly for theboundaries S); within each sub-space the enzyme density e(r) must be continuous,but at the interfaces it need not be. The number of sub-spaces as well as the shape ofthe interface between each pair of sub-spaces are then also variables to be optimized.Except where specifically noted, this complication is not important for understandingthe following results (see Appendix A.1 for details).
We will see below that the variational approach is useful even when it is impossibleto solve for the optimal enzyme arrangement analytically. In cases where it is possibleto extract the exact functional form of the optimal profile, the problem can usuallybe reduced to a low-dimensional optimization over a small number of parameters,which is then easily performed numerically (see Appendix A.5 for an example andFig. 3.4, magenta lines). For systems where the functional form of e(r) cannot befound analytically, such as those with complex geometries, we provide an algorithmicprocedure for constructing the optimal enzyme arrangement.
3.3. Results
Our optimization problem can be understood in terms of an optimal betting strategyby drawing an analogy with the Kelly problem [166]. Before presenting the optimalallocation principle for the enzyme arrangement, we discuss the optimal betting strategyfound by Kelly and we generalize it to a case where bets and payoffs are coupled.
50

3. Design principles for the optimal spatial arrangement of enzymes
3.3.1. Generalization of Kelly criterion
Kelly found a criterion for the optimal allocation of bets that is widely used in bettingand portfolio theory [188]. He considered the case of a gambler who wants to maximizethe long-term growth rate G of his capital over a succession of repeated games. Ateach game, the bets are placed on mutually exclusive events s. We indicate with b thefraction of the gambler’s capital that is not invested in the game, with a(s) the fractioninvested on the event s and with αs the odds, i.e. the money payed back to the gamblerin case s is the winning event. Given an initial capital V0, after one game the gamblercapital becomes V1 = V0(b + a(s)αs) if s is the winning event. Note that the gamblercan go bankrupt if he bets all of his capital on the losing events, i.e. for b = 0 anda(s) = 0. After a succession of N games, the gambler’s capital is
VN = V0 ∏s(b + a(s)αs)
Ws , (3.6)
where Ws is the number of times that s is the winning event. The long term capitalgrowth rate is given by
G := limN→∞
1N
log(
VN
V0
)= lim
N→∞∑
s
Ws
Nlog [b + a(s)αs] = ∑
sp(s) log [b + a(s)αs] , (3.7)
where p(s) = limN→∞ Ws/N is the probability for s to be the winning event.Kelly’s aim was to determine the optimal way of partitioning the gambler’s capital
given that the gambler can neither borrow nor lend money, hence his aim was todetermine the optimal set of a(s) and b, under the constraint ∑s a(s) + b = 1. We cantherefore consider the functional
G = ∑s
p(s) log [b + a(s)αs]− λ
[∑
sa(s) + b− 1
], (3.8)
where λ is the Lagrange multiplier associated with the constraint on the gambler’scapital. To find the optimal set of a(s) and b we perform the following derivatives:
∂G∂a(s)
=p(s)αs
b + αsa(s)− λ = 0 for s ∈ K (3.9)
∂G∂b
= ∑s
[p(s)
b + αsa(s)
]− λ = 0 (3.10)
∂G∂a(s)
=p(s)αs
b− λ ≤ 0 for s ∈ K′ , (3.11)
51

3. Design principles for the optimal spatial arrangement of enzymes
where we indicated with K the set of events for which it is optimal to bet and a(s) > 0,and with K′ the set of events for which betting is suboptimal and a(s) = 0. Thederivatives above can be interpreted as the variation of the constrained capital growthrate G per extra bet placed (3.9), (3.11) or per extra fraction of capital kept (3.10). Thefirst terms of the derivatives are the net marginal increases of G generated by eitherplacing the bets (3.9), (3.11) or by keeping an extra fraction of capital (3.10), if noconstraint is considered. The −λ terms correspond to the marginal cost of betting theextra capital. The optimal strategy is to bet on those events s ∈ K up to the point forwhich the marginal gain generated equals the marginal cost. Moreover the optimalway of allocating the gambler’s capital, known as Kelly criterion, can be obtained bysolving for the above derivatives, together with the use of the constraint:
λ = 1 (3.12)
b =1−∑s∈K p(s)1−∑s∈K 1/αs
(3.13)
a(s) =p(s)αs − b
αsfor s ∈ K . (3.14)
To understand how to determine the set K of events for which it is optimal to bet, werefer the readers to Kelly’s original paper [166].
Here we ask: What would happen to Kelly’s optimization problem if a feedbackbetween the bets placed a(s) and the odds αs were to be considered? To answer thequestion let us imagine that the odds are now functions of the bets placed αs = fs(a),where a is the vector (a(1), a(2), ...). A new functional G can be considered:
G = ∑s
p(s) log [b + a(s)αs]− λ
[∑
sa(s) + b− 1
]−∑
sλs [αs − fs(a)] , (3.15)
where λs are the Lagrange multipliers corresponding to the constraints on the oddsαs being functions fs(·) of the bets placed a. When we take the derivatives of G withrespect to a(s) we now have extra terms:
∂G∂a(s)
=p(s)αs
b + αsa(s)+ ∑
s′
(λs′
∂ fs′(a)∂a(s)
)− λ = 0 (3.16)
The contribution of the terms in the sum ∑s′(·) comes from the coupling between thebets placed and the payoffs/returns generated. The exact form of fs(a) depends on thedetails of the model considered for the game played by the gambler. For an optimalallocation of capital the derivative ∂G
∂a(s) = 0, meaning that the addition of the first term
52

3. Design principles for the optimal spatial arrangement of enzymes
with the sum ∑s′(·) again equal the marginal cost λ. Hence, we found that even inthe presence of feedback between the bets placed and the payoffs/returns generated itresults optimal to invest up to the point for which the net marginal gain expected fromour investment (including the contribution due to the feedback) equals the marginalcost of betting extra capital λ.
3.3.2. Optimal allocation principle
In analogy to Kelly’s problem, the enzymes in our model can be considered to representcapital that can be invested in the system at different positions. Each position can beinterpreted as an asset, generating a certain expected return in terms of reaction flux.The optimization problem consists in determining the optimal fraction of enzymes tobe invested at the different locations such as to maximize the steady state reaction fluxJP .
Analogously to Kelly’s treatment we examine the variation of the Lagrangian,Eq. (3.5), with respect to the resources to be invested in the system, i.e. with respect tothe enzyme density,
δLδe(r)
= kcatF[ρ(r)]− λV(r)kcatF[ρ(r)]︸ ︷︷ ︸≡ dJP
de(r) “marginal return”
− λe . (3.17)
This variation corresponds to the change in the constrained flux L as enzymes areadded at position r. Three different terms contribute to this change. The first is theincrease in flux that would be observed upon adding enzymes at position r if everythingelse in the system were to remain unaffected, which corresponds mathematically to δJP
δe(r) .However, changing e(r) also alters the substrate density profile ρ(r), thereby affectingthe rate of reactions at all positions. The reaction between enzyme and substrate at agiven location causes the substrate to be depleted, this generates a diminishing returnseffect for which the addition of extra enzymes at that position is gradually less efficient.Moreover, the substrate motion, due to diffusion and possibly advection, couples theenzyme and substrate profiles at the different positions of the system. The diminishingreturns effect and the couplings due to substrate transport are captured by the secondterm in Eq. (3.17), where the Lagrange multiplier λV(r) ensures that ρ(r) and e(r)satisfy the constraint of the reaction-diffusion equation. Thus the sum of the first twoterms is the total rate of change of the reaction flux as extra enzymes are added atposition r. In the following, we refer to this quantity as the “marginal return” on an“investment” of enzymes, and denote it by dJP
de(r) . Finally, the third term, −λe = − ∂L∂Etot
,corresponds to a marginal cost of adding extra enzymes into the system. Note that this
53

3. Design principles for the optimal spatial arrangement of enzymes
term can also be interpreted as the reduction in flux contributions from other positionsr′ 6= r in the optimal configuration, as enzymes are moved from these positions to r inorder to satisfy the constraint of constant total enzyme number.
A key difference between Kelly’s original problem and ours is that the payoffs foreach of Kelly’s events are fixed and independent of the bets placed. Thus, Kelly’soriginal formalism lacks an equivalent of the second term in Eq. (3.17), which captureshow an investment of enzymes at one position affects the expected returns at this andall other positions, cf. (3.9). We have seen in the previous section, Sec. 3.3.1 that theKelly criterion can be generalized to include a feedback between the bets placed andthe payoffs/returns, resulting in an expression for the marginal expected growth ofcapital that has the same form as Eq. (3.17), cf. Eq. (3.16).
As similarly done in Sec. 3.3.1 for the optimal placement of bets, in the optimalenzyme profile e∗(r), we must distinguish between regions where adding enzymesis optimal (e∗(r) finite), and empty regions where adding enzymes is suboptimal(e∗(r) = 0). Wherever e∗(r) > 0, the variation δL
δe(r)
∣∣e∗ = 0. Importantly, the functional
derivative with respect to the surface density δLδeS(s)
has the same form as Eq. (3.17).Thus, the optimal profile follows a ‘homogeneous marginal returns criterion’ (HMRcriterion): it is such that at any position with enzymes, the marginal return on addedenzymes equals a constant value, namely dJP
de(r)
∣∣e∗ = λe. By contrast, in empty regions,
the marginal flux gain from adding enzymes is less than the associated marginal cost,dJP
de(r)
∣∣e∗ < λe.
As an example of this balance between gain and cost that underlies the optimalenzyme allocation strategy, we used our analytic formalism to solve exactly the caseof a linear reaction, F[ρ] = ρ/KM, with no advection or decay of S (|v| = σ = 0), ina one-dimensional domain with a source of substrate at x = 0 (j(0) = j0, k(0) = 1,h(0) = 0), and absorbing boundary at x = L (k(L) = 0, h(L) = 1). The resultingoptimal enzyme arrangement is (see Appendices A.2, A.3 for details)
e∗S(0) =
Etot√Etot
α
e∗(x) =
{0 αEtot ≤ 1Etot
L Θ( x0−x
L
)αEtot > 1
(3.18)
where Θ(x) is the Heaviside step function, α = Lkcat/(KMD), x0 = L[1− (αEtot)
−1/2].
Thus the optimal enzyme profile undergoes a transition from having all enzymes boundat the boundary at x = 0 when αEtot < 1, to an extended profile with enzymes both atthe boundary and in the interior of the system when αEtot > 1. Our analytic calculationconfirms the phenomenology of the system that had previous been found numerically[167].
54

3. Design principles for the optimal spatial arrangement of enzymes
a b
optimal extension x0(Etot)optimal profile e*(x)
marginal returns dJ/de(x)
0
50
100
150
200
250 00.5
1
0
2*10-3
4*10-3
6*10-3
8*10-3
10-2
Etot
dJ/d
e(x
)
0
3*103
6*103
0 0.5 1
e(x
)
x/L
0
3*103
6*103
0 0.5 1
e(x
)
x/L
0
3*103
6*103
0 0.5 1
e(x
)
x/L
0
5*10-4
1*10-3
0 0.5 1
dJ/d
e(x
)
x/L
0
5*10-4
1*10-3
0 0.5 1
dJ/d
e(x
)
x/L
0
5*10-4
1*10-3
0 0.5 1
dJ/d
e(x
)
x/L x/L
enzyme profiles marginal returns
bound
optimal
extended
Figure 3.3.: Homogeneous Marginal Returns (HMR) criterion. a Different enzyme arrange-ments (left) and the corresponding marginal returns (right). In all cases α = 10−2 and Etot = 400.Top: Bound configuration e(x) = Etot
L δ(x/L). The marginal returns is peaked at x > 0, indi-cating that enzymes should be moved away from the source. Middle: Optimal configuration.The marginal return is constant over the domain where enzymes are present, i.e. the HMRcriterion is satisfied. Bottom: Extended profile. The marginal return is monotonically decreasing,indicating that enzymes should be moved towards the source at x = 0. b Optimal enzymearrangement and the corresponding marginal return landscape for different values of Etot. Thedashed line represents the extension of the optimal profile, x0.
Fig. 3.3a demonstrates how the shape of the marginal returns landscape reflects thebehavior of the system. When the enzyme profile is optimal (Fig. 3.3a, middle), weobserve a plateau in dJP
de(x) across the entire extent of the enzyme profile, 0 ≤ x ≤ x0.Beyond this region, x > x0, the marginal returns decrease. If the actual enzyme profiledeviates from the optimum by having a larger proportion of enzymes located at x = 0(Fig. 3.3a, top), the marginal returns landscape becomes non-monotonic with a peakat a position x > 0. The elevated enzyme density in this region depletes the substratelocally, reducing the turnover by each enzyme and diminishing the returns fromadding additional enzymes. A higher flux could be achieved by moving some enzymesaway from the boundary, thereby allowing each enzyme to operate more efficiently.In contrast, if we consider an overextended enzyme profile (Fig. 3.3a, bottom), themarginal returns landscape has a maximum at x = 0. The flux could be increasedby moving enzymes from large-x regions, where the substrate density is low due toproximity to the absorbing boundary at x = L, towards x = 0 where the substrateconcentration is high.
55

3. Design principles for the optimal spatial arrangement of enzymes
Figure 3.3b shows how the marginal returns landscape and the optimal enzymeprofile change as Etot is increased. Below the transition, Etot ≤ α−1, the marginal returnsdecrease monotonically with distance from the source. The maximal value of dJP
de(x)
occurs only at x = 0. Above the transition, dJPde(x) takes a constant value over the region
0 ≤ x ≤ x0 where enzymes are present. The level of this plateau, λe, decreases withincreasing Etot.
How relevant is the transition for biological systems? Given that the ratio kcat/KM
varies by several orders of magnitude: 102-1010(Ms)−1 [30], the corresponding α =
Lkcat/(KMD) for a system of L = 1µm, where D = 100µm2 s−1, is in the range 10−7-101,where KM is measured in units of length µm−1 and where we consider an area of 1µm2
underlying the 1-D symmetry of the system. The transition then takes place for valuesof enzyme numbers Et
tot in the range 10−1-107, largely overlapping with the range ofprotein numbers per single cell found in S. Cerevisiae yeast cells, which is 1-106 [189],suggesting that localization is optimal for only some of the enzymes.
3.3.3. General condition for transitions in the optimal enzyme arrangement
Transitions in the optimal enzyme arrangement of the above type, from a regime inwhich enzymes are colocalized with the source of S to a regime where enzymes aredistributed within the system, have been observed in a range of reaction-diffusion mod-els [168]. We therefore asked whether there was an underlying principle determiningwhen such transitions occur, and whether it can be generalized, e.g. to systems withmore complex geometries lacking symmetry.
Fig. 3.3b suggests that the marginal returns landscape leads to a general condition forlocalization-delocalization transitions. For Etot below the transition value, the marginalreturns landscape is monotonically decreasing, with the position generating the highestreturns coinciding with the source of substrate. As the transition is reached and passed,the landscape becomes flat as positions in the vicinity of the source begin to generate thesame returns as the source position. This behavior generalizes to higher dimensionalsystems (see Appendix A.4 for details): Enzymes should be placed only at the sourceon the surface and not in the interior, as long as
∂
∂n(s)dJP
de> 0 , (3.19)
corresponding to a negative slope of the marginal returns landscape from the boundaryat s into the interior of the system, as in Fig. 3.3b for Etot < α−1. By contrast, if Eq. (3.19)evaluated at s becomes an equality, the positions adjacent to s generate the same returnsas s, so that the optimal enzyme profile features enzymes both at the boundary s and
56

3. Design principles for the optimal spatial arrangement of enzymes
in the interior of the system adjacent to s.The theoretical condition Eq. (3.19) can be turned into an experimentally meaningful
condition (see Appendix A.4) by expressing it as a comparison between the local netdiffusive flux jD(s) of S away from the surface, and the local flux jP (s) of productformation due to surface enzymes,
jD(s) ≡ D∂ρ
∂n(s)> kcateS(s)F[ρ(s)] ≡ jP (s) . (3.20)
If this inequality holds, no enzymes should be placed in the interior of the system inthe vicinity of s. For low amounts of enzymes, the optimal strategy is to place enzymesat position s to counter the diffusive flux jD(s). This is optimal up to the point at whichthe diffusive flux jD(s) equals the reaction flux jP (s), which defines the transition pointof the localization-delocalization transition.
Further combining Eq. (3.20) with the boundary condition Eq. (3.2) yields jP (s) <(j(s) − ρ(s)v(s) · n(s))/2, which simplifies in the case of no advection (v = 0) tojP < j(s)/2. Thus, in systems with purely diffusive S transport, a localization-delocalization transition occurs when the reaction flux equals exactly half the influxof S . Note that Eq. (3.20) is general, independent of v and σ and other details of thesystem in question. It is required only that the boundary with influx follows Eq. (3.2).Other aspects of the model will affect ρ(r), but not the form of Eq. (3.20), showing thatthe diffusive motion of S and the strength of the reaction are the crucial determinants ofthe transition point. To demonstrate this generality we compared the fluxes jD(s) andjP (s) as Etot was varied for a number of systems, including different spatial dimensionsas well as systems with and without decay and advection of S . As shown in Fig. 3.4,in all cases both Eq. (3.20) below the transition value of Etot and equality above thetransition were satisfied.
The inequality condition Eq. (3.20) is a strictly local condition. In systems withmultiple or spatially varying sources of substrate there will in general not be a singleglobal transition but rather a sequence of local transitions at different positions s atdifferent Etot levels. We therefore investigated a system with two unequal sources ofS . In such a system the optimal enzyme profile typically undergoes three transitions(see Appendix A.6, Fig. A.1). For small Etot, enzymes accumulate where the influx ofS is the highest. As Etot is increased, the marginal returns for placing enzymes in thevicinity of the two sources of S become more similar, until at a threshold value of Etot
they become equal. Above this value of Etot, enzymes accumulate at both sources in aconfiguration with two unequal clusters. Increasing Etot further, a second transition isreached where the optimal enzyme profile begins to extend from the stronger sourceinto the system. Finally, at yet larger Etot, the optimal enzyme profile begins to extend
57

3. Design principles for the optimal spatial arrangement of enzymes
σ vReactionGeometry/Symmetry3D spherical
1D1D two unequal
sources
Mich.-Ment.LinearLinear
N NN YY N
Diffusive flux jD/j
Reaction flux jP/j
0
0.5
1
-1 -0.8 -0.6 -0.4 -0.2 0 0.2 0.4 0.6
jP /jjD
/j
(Etot-Et )/Ettot tot
Figure 3.4.: Transition from a fully bound to an extended optimal profile in terms of localreaction and diffusion fluxes. The local reaction flux jP (s) and net diffusive flux jD(s), asa fraction of S influx j(s), are plotted for different models against the amount of enzymesin the system Etot, rescaled by the transition amount Et
tot. The various models differ in thephysical dimension and/or symmetry, reaction function, loss mechanism and transport of S .The results for each model are plotted with a different color. Lines show analytical solutions ofthe constrained optimization. Points show results of numerical optimizations computed eitherby solving numerically an analytically-derived optimization condition (see Appendix A.5), orusing the construction algorithm derived in Sec. 3.3.5. The blue and the green lines refer to thesame two-source model, the two curves are plotted using the different values of Et
tot for thecorresponding source position. See Fig. A.1 for the corresponding plot using the same rescalingof Etot. In all cases, jD > jP until they coincide at the transition point, as predicted by Eq. (3.20).When v = 0, jP = jD = j/2 at and above the transition, whereas, when v 6= 0, the pink solidand dashed lines still coincide but for values different than j/2.
also from the weaker source. For the latter two transitions, at which the optimal enzymearrangement changes from membrane-localized to extended, we confirmed that theinequality Eq. (3.20) held below the transition point and equality above (Fig. 3.4 greenand blue).
3.3.4. Geometrical analysis
Our optimization problem can be interpreted geometrically, analogously to a modelof investment portfolio optimization introduced by Markowitz [190]. Markowitzconsidered the problem of minimizing the variance of the returns of a portfolio (due to
58

3. Design principles for the optimal spatial arrangement of enzymes
the unpredictability of the market) at a constant level of returns, finding that optimalportfolios are points where lines of constant expected returns are tangent to lines ofconstant variance. To see this, Markovitz plotted the lines of constant variance andconstant expected returns in the space of portfolios, i.e. the space determined by thefraction of resources invested in different securities. Here we consider maximizing fluxat a constant level of enzymes. We can therefore plot lines of constant reaction flux andlines of constant level of enzymes in the space of enzyme configurations, i.e. the spacedetermined by the amount of enzymes invested at different positions.
0 e1
e2
lines of constantlines of constant
optimal trajectory ( )
( )
Figure 3.5.: Geometrical analysis of the op-timal enzyme configuration in a systemwith two sites. Dashed black lines showlines of constant Etot = e1 + e2 and dashedgreen lines show lines of constant reac-tion flux JP . The optimal configuratione∗ = (e∗1 , e∗2) for each value of Etot forms anoptimal trajectory e∗(Etot) (orange). Greenarrows show the marginal returns vectordJPde . The tangent vector de∗
dEtot(blue arrows)
shows how enzymes should be added ateach point.
Fig. 3.5 shows this schematically for a system where enzymes can be partitionedbetween two positions. The dashed black lines are lines of constant Etot and the dashedgreen curves are lines of constant JP . In the Markowitz model, variability in returnsis taken to be independent of the investment strategy, leading to lines of constantvariance that are ellipses in the space of investment portfolios. For our model, lines ofconstant flux do not take such a simple form, since their shape is determined by thereaction-diffusion dynamics of the substrate that couples the productivity of enzymeinvestments at all positions. The constrained optimization problem corresponds tomaximizing JP along a given Etot line, which results in the solid orange line. For thecase illustrated in Fig. 3.5, above a threshold value of Etot in the region where theoptimal configuration has both e1, e2 > 0, the principle of equal returns means that themarginal return vectors in the optimal configurations (Fig. 3.5, green arrows) pointin the (1, 1) direction, which is normal to the lines of constant Etot values. Since themarginal returns vector is itself the gradient of the reaction flux, it is by definitionnormal to lines of constant flux, implying that these lines are tangent to the lines ofconstant Etot.
59

3. Design principles for the optimal spatial arrangement of enzymes
3.3.5. Construction Algorithm
The above geometrical analysis leads us to an additive construction algorithm, whichgenerates the trajectory of optimal enzyme configurations by determining its tangent ateach point. We consider a system in which space is discretized into N sites, denotingby ei = e(ri) the density of enzymes at position ri and by ρi = ρ(ri) the correspondingdensity of S . For a given total enzyme level Etot, there will be an optimal enzymeconfiguration e∗ = (e∗1 , e∗2 , . . . , e∗N) that maximizes JP on the (N − 1)-dimensionalmanifold defined by Etot = ∑N
i=1 ei. As in Fig. 3.5, the optimal configurations atdifferent Etot values trace out a trajectory e∗(Etot) in e space. We seek a procedure toconstruct e∗(Etot). We begin with no enzymes and iteratively add enzymes until thetarget Etot value is reached. According to the optimization principle of equal marginalreturns, the largest components of dJP
de define the sites at which enzymes should beadded in the next step. Addition may initially be restricted to a single site, with further“construction sites” being introduced gradually as different Etot thresholds are crossed.
Since enzymes should be added at all positions where the marginal returns takeon their maximal value, we must determine how to partition new enzymes betweenthese positions. This partitioning corresponds to the tangent vector de∗
dEtotof the optimal
trajectory, which we determine by considering how the marginal returns change asenzymes are added (see Appendix A.7),
ddEtot
dJP
de= H
de∗
dEtot. (3.21)
Here, derivatives ddEtot
are taken tangent to the line of optimal enzyme configurations
and H is the N × N Hessian matrix of JP in the space of enzyme densities, Hij =d2 JPdeidej
.In the subspace of only those sites where enzymes should be added (sites at whichdJPdei
= λe), the left hand side of Eq. (3.21) becomes
ddEtot
dJP
de(n)=
dλe
dEtot1(n) , (3.22)
where with 1 we refer to a vector of 1s and the subscript (n) indicates that we areconsidering only the n-dimensional subspace of sites with equal returns, yielding
H(n)
de∗(n)dEtot
=dλe
dEtot1(n) . (3.23)
This n-dimensional linear system can be solved for the tangentde∗(n)dEtot
to the optimal
60
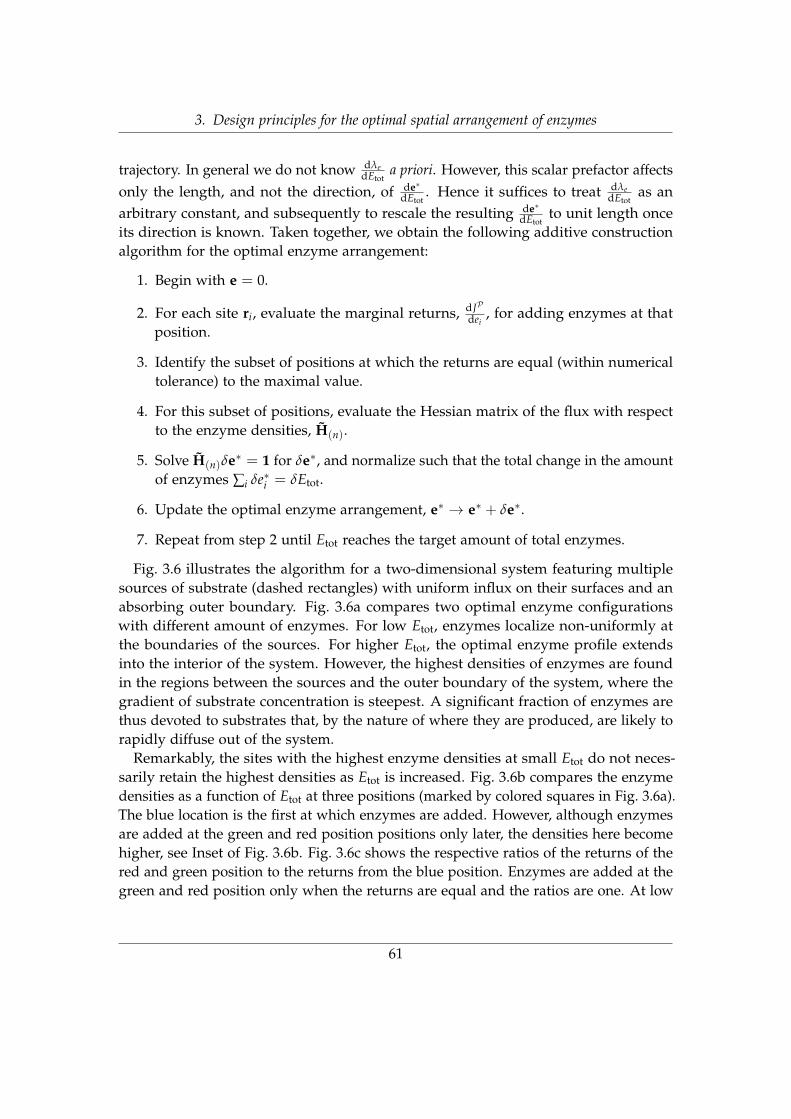
3. Design principles for the optimal spatial arrangement of enzymes
trajectory. In general we do not know dλedEtot
a priori. However, this scalar prefactor affectsonly the length, and not the direction, of de∗
dEtot. Hence it suffices to treat dλe
dEtotas an
arbitrary constant, and subsequently to rescale the resulting de∗dEtot
to unit length onceits direction is known. Taken together, we obtain the following additive constructionalgorithm for the optimal enzyme arrangement:
1. Begin with e = 0.
2. For each site ri, evaluate the marginal returns, dJPdei
, for adding enzymes at thatposition.
3. Identify the subset of positions at which the returns are equal (within numericaltolerance) to the maximal value.
4. For this subset of positions, evaluate the Hessian matrix of the flux with respectto the enzyme densities, H(n).
5. Solve H(n)δe∗ = 1 for δe∗, and normalize such that the total change in the amountof enzymes ∑i δe∗i = δEtot.
6. Update the optimal enzyme arrangement, e∗ → e∗ + δe∗.
7. Repeat from step 2 until Etot reaches the target amount of total enzymes.
Fig. 3.6 illustrates the algorithm for a two-dimensional system featuring multiplesources of substrate (dashed rectangles) with uniform influx on their surfaces and anabsorbing outer boundary. Fig. 3.6a compares two optimal enzyme configurationswith different amount of enzymes. For low Etot, enzymes localize non-uniformly atthe boundaries of the sources. For higher Etot, the optimal enzyme profile extendsinto the interior of the system. However, the highest densities of enzymes are foundin the regions between the sources and the outer boundary of the system, where thegradient of substrate concentration is steepest. A significant fraction of enzymes arethus devoted to substrates that, by the nature of where they are produced, are likely torapidly diffuse out of the system.
Remarkably, the sites with the highest enzyme densities at small Etot do not neces-sarily retain the highest densities as Etot is increased. Fig. 3.6b compares the enzymedensities as a function of Etot at three positions (marked by colored squares in Fig. 3.6a).The blue location is the first at which enzymes are added. However, although enzymesare added at the green and red position positions only later, the densities here becomehigher, see Inset of Fig. 3.6b. Fig. 3.6c shows the respective ratios of the returns of thered and green position to the returns from the blue position. Enzymes are added at thegreen and red position only when the returns are equal and the ratios are one. At low
61

3. Design principles for the optimal spatial arrangement of enzymes
0 30x
0
30
y
0 30x
0
30
y
051
52e(
x,y)
a b
c
d
mar
g. re
turn
( ,
)m
arg.
retu
rn (
)
10 -1 10 0 10 1 10 2
Etot
0
1
10 -1 10 0 10 1 10 2
Etot
1
2
3
J opt/J u
10 -1 10 0 10 1 10 2Etot
0
400
800
e i
=40Etot
=400Etot
Figure 3.6.: Construction Algorithm to determine the optimal enzyme arrangement in a 2-dimensional system with multiple sources of substrate. The substrate enters the system fromthe sources (dashed rectangles) and it is absorbed at the external boundary. The optimalenzyme arrangement is determined by using the construction algorithm for which enzymesare iteratively added, starting from a system with no enzymes. a Snapshots of the optimalenzyme distribution at two Etot levels. b Optimal enzyme densities at the positions indicatedby the blue, red and green squares in a. Inset: Although the blue position is the first one atwhich enzymes are added, for high enough Etot values the red and green positions get higheroptimal enzyme densities. c Ratio of the marginal returns at the red and green position overthe marginal return of the blue position, as indicated by colored squares in a. d The optimizedreaction flux relative to that produced by uniformly distributed enzymes, as a function of Etot.
enzyme amounts, the reaction flux of the optimal configuration is about 3-fold higherthan for the uniform configuration, whereas this advantage gradually decreases forhigher amounts of enzyme (Fig. 3.6d). This is consistent with previous studies showingthat in the limit of infinite amount of enzymes the uniform configuration becomes theoptimal one [167, 168].
62

3. Design principles for the optimal spatial arrangement of enzymes
3.4. Methods for the computation of the marginal returnsvector and the Hessian for a discrete system
In this section we explicitly derive the expressions for the marginal returns vector andthe Hessian used in the simulations of the systems shown in Fig. 3.4 and Fig. 3.6.
3.4.1. Linear reactions
For a discrete reaction-diffusion system with linear reactions, following the dynamicsEq. (3.1)
∂tρ(r, t) = D∇2ρ(r, t)−∇ · [ρ(r, t)v(r)]− σρ(r, t)− kcate(r)F[ρ(r, t)] , (3.24)
we can define a discrete diffusion operator D and a discrete advection operator V. Byindicating with ρ the substrate density and A the substrate influx vector, the steady-stateequation for a linear reaction can be written in matrix form as
(D + V)ρ− αe� ρ− σρ = A , (3.25)
with � denoting the element-wise (Hadamard) product. The reaction flux JP is givenby the scalar product JP = α e · ρ. Thus e enters JP both directly and through ρ, viathe solution to Eq. 3.25. These multiple dependencies of JP on e can be summarized bythe dependency graph shown in Fig. 3.7, where the matrix M = D + V− α diag(e)−σ diag(1) is the operator that applied to ρ gives the substrate source vector Mρ = A,diag(e) is the diagonal matrix with diagonal elements given by e and diag(1) is theidentity matrix.
The marginal returns vector dJPde can be evaluated by back-propagating the derivative
of the reaction flux with respect to the enzyme vector through the dependency graph.We find that
dJP
de=
∂JP
∂e+
(dρ
de
)t ∂JP
∂ρ(3.26)
=∂JP
∂e+
(d(M−1A)
dMdMde
)t∂JP
∂ρ, (3.27)
where dρde is a matrix with (i, j)th element given by dρi
dej, and t denotes the transpose. Each
of the derivatives appearing in Eq. 3.27 has a simple form, which we can substitute to
63

3. Design principles for the optimal spatial arrangement of enzymes
Figure 3.7.: Dependency graph for a discretereaction-diffusion system with linear reac-tion kinetics. The reaction flux is given bythe scalar product of the enzyme and the sub-strate vector JP = α e · ρ. Moreover ρ and eare coupled via the reaction-diffusion equationEq. (3.25). For a given enzyme arrangement,there is an operator M that, applied to the sub-strate profile, gives the source vector Mρ = A.The substrate profile corresponding to a cer-tain enzyme arrangement can then be foundvia ρ = M−1A.
obtain the marginal returns vector,
dJP
de= αρ�
[1 + α(M−1)
te]
, (3.28)
where 1 is a vector of ones.By taking a second derivative with respect to e, and again by back-propagating the
derivatives, we can determine the Hessian,
H = α2{ [
M−1 �({1 + α(M−1)te} ⊗ ρ
)]+[M−1 �
({1 + α(M−1)te} ⊗ ρ
)]t}
,
(3.29)
where ⊗ indicates the outer product. The Hessian Eq. (3.29) is then used in step (4)and (5) of the construction algorithm, presented in Sec. 3.3.5, to derive the optimal wayof allocating the extra enzymes added into the system.
3.4.2. Non-linear reactions
For non-linear reaction kinetics the reaction-diffusion equation becomes
(D + V)ρ− αe� F− σρ = A , (3.30)
where F is the vector with Fi = F[ρi]. Since F[ρ] is non-linear, it is no longer possible towrite the reaction-diffusion equation as a linear system that can be solved for ρ. As aresult the dependency graph includes a loop, making it inconvenient to back-propagatederivatives. Instead, taking derivatives of the reaction-diffusion equation with respect
64
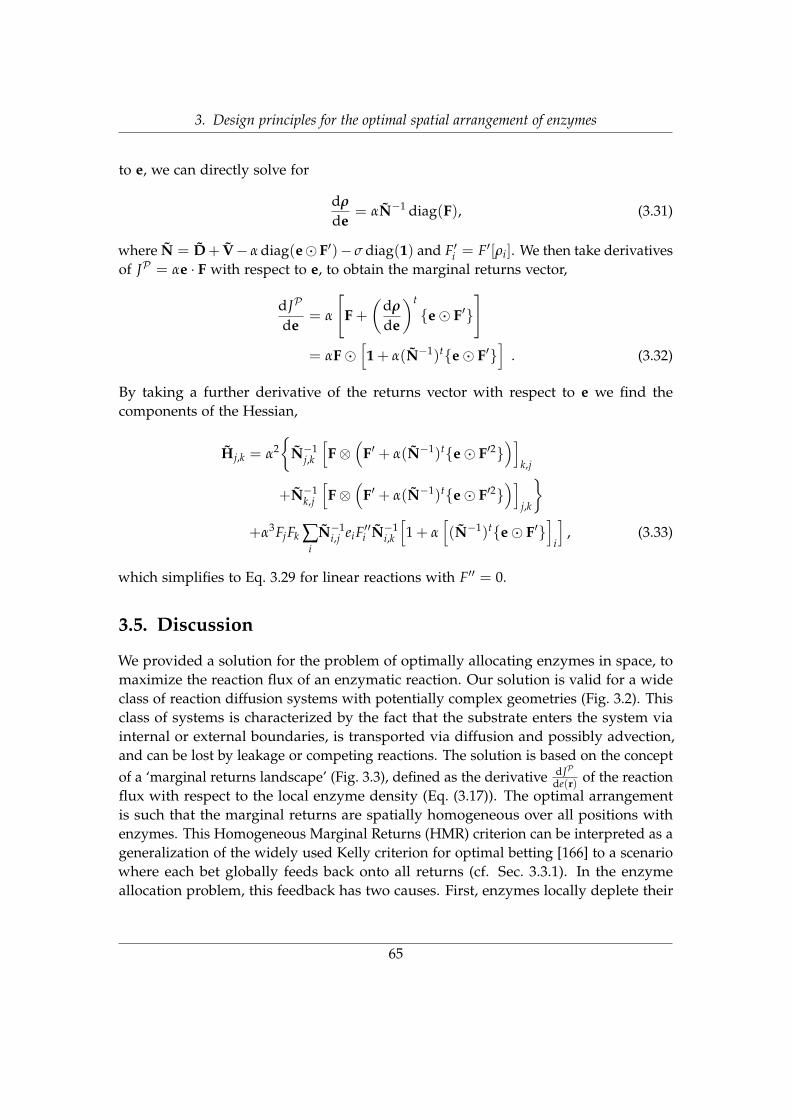
3. Design principles for the optimal spatial arrangement of enzymes
to e, we can directly solve for
dρ
de= αN−1 diag(F), (3.31)
where N = D+ V− α diag(e� F′)− σ diag(1) and F′i = F′[ρi]. We then take derivativesof JP = αe · F with respect to e, to obtain the marginal returns vector,
dJP
de= α
[F +
(dρ
de
)t
{e� F′}]
= αF�[1 + α(N−1)t{e� F′}
]. (3.32)
By taking a further derivative of the returns vector with respect to e we find thecomponents of the Hessian,
Hj,k = α2{
N−1j,k
[F⊗
(F′ + α(N−1)t{e� F′2}
)]k,j
+N−1k,j
[F⊗
(F′ + α(N−1)t{e� F′2}
)]j,k
}+α3FjFk ∑
iN−1
i,j eiF′′i N−1i,k
[1 + α
[(N−1)t{e� F′}
]i
], (3.33)
which simplifies to Eq. 3.29 for linear reactions with F′′ = 0.
3.5. Discussion
We provided a solution for the problem of optimally allocating enzymes in space, tomaximize the reaction flux of an enzymatic reaction. Our solution is valid for a wideclass of reaction diffusion systems with potentially complex geometries (Fig. 3.2). Thisclass of systems is characterized by the fact that the substrate enters the system viainternal or external boundaries, is transported via diffusion and possibly advection,and can be lost by leakage or competing reactions. The solution is based on the conceptof a ‘marginal returns landscape’ (Fig. 3.3), defined as the derivative dJP
de(r) of the reactionflux with respect to the local enzyme density (Eq. (3.17)). The optimal arrangementis such that the marginal returns are spatially homogeneous over all positions withenzymes. This Homogeneous Marginal Returns (HMR) criterion can be interpreted as ageneralization of the widely used Kelly criterion for optimal betting [166] to a scenariowhere each bet globally feeds back onto all returns (cf. Sec. 3.3.1). In the enzymeallocation problem, this feedback has two causes. First, enzymes locally deplete their
65

3. Design principles for the optimal spatial arrangement of enzymes
substrate, causing a local diminishing returns effect. Second, the moving substratecouples the reaction flux generated at different positions. The definition of marginalreturn (Eq. (3.17)) captures these effects by incorporating the flux increase caused byjust adding enzymes, as well as the reaction-diffusion feedback between enzymes andsubstrate.
The HMR criterion leads to a general local condition for the occurrence of a transitionin the optimal enzyme arrangement from a fully bound configuration into a moreextended profile where enzymes are also located in the interior of the system next tothe substrate source (Eqs. (3.19), (3.20)). Such transitions had previously been observednumerically for systems with simple geometries and one source of substrate [167, 168].The condition derived here applies locally in systems with complex geometries andwith multiple sources of substrate. It compares the local diffusive flux jD(s) to the localreaction flux jP (s) at a source position s: Binding enzymes at the source is optimalas long as jD(s) > jP (s), since the reaction counters the diffusive flux. In contrast,above the transition point, the enzymes are optimally distributed also in the interior ofthe system and the two fluxes are kept equal (Fig. 3.4). Notably, this condition is notaffected by any advective transport of the substrate. The reason ultimately is that theadvective transport is deterministic, whereas the HMR principle is fundamentally abet-hedging strategy to deal with the probabilistic nature of diffusive transport.
The same way the Kelly criterion provides rules for optimally placing bets or op-timally constructing portfolios, the HMR criterion allows to derive an algorithm forconstructing optimal enzyme arrangements (Figs. 3.5, 3.6). The algorithm is obtained byanalyzing how the marginal returns change at every position as the amount of enzymesin the system is increased (Eqs. (3.21), (3.23)). It constitutes a deterministic constructionprinciple, as opposed to the stochastic optimization algorithms that were previouslyused [167, 168].
While we have presented here the simplest general form of this algorithm, variousmodifications can be made to improve its efficiency in special cases. In particular,using the system geometry as a guide it is often possible to limit the sites at which themarginal returns need to be evaluated in each update step. For example, at low Etot
values the positions with the highest returns coincide with sources of S . Generally itsuffices to compute the marginal returns only at source positions, sites where enzymesare already present, and connected lattice sites. Additionally, larger values of δEtot maybe enabled by more sophisticated update schemes for e∗, such as a Runge-Kutta-typemethod [191, 192]. The value of δEtot could also be made adaptive to achieve a goodtrade-off between accuracy and speed.
We explicitly considered absorbing and reflective boundaries, allowing for nonuniform and discontinuous influx profiles. However, our results can be extended tosystems with permeable boundaries through which substrate molecules are allowed
66

3. Design principles for the optimal spatial arrangement of enzymes
to flow, corresponding to k(s) = 1 and h(s) = p(s) > 0 in Eq. (3.3), where p(s) is thepermeability. For such a system, the HMR principle still holds. Similarly, the conditionof Eq. (3.19) will still determine transitions in the optimal enzyme profile. However,expressing this condition in term of substrate fluxes will lead to a more complicatedexpression than Eq. (3.20). We have seen that a permeable boundary typically increasesthe transition threshold Et
tot. For example, in the one-dimensional system in Fig. 3.3b,a non-zero permeability at the origin shifts the threshold value of Etot from α−1 toα−1(1 + p(0)L/D).
Our continuous reaction-diffusion model neglects the finite size of enzyme moleculesthat limits the attainable enzyme density. Imposing a maximal density conditione(r) ≤ emax at each point [59] could be incorporated into our analytical framework asan additional constraint in the Lagrangian. This would introduce an effective position-dependent cost in Eq. (3.17), resulting in a marginal return landscape that is a functionof position. Nevertheless, the construction algorithm presented here could still beemployed if the condition that enzymes cannot be added at positions where ei = emax
is imposed. Eq. (3.23) would then only hold at positions with sub-maximal enzymedensities.
The construction algorithm presented in this chapter could be used for the design ofoptimal synthetic bioreactors. In Sec. 2.5, we have seen how synthetic strategies canbe used to spatially arrange enzymes. For instance, the amount of enzymes bound tothe external membrane or to the membranes of internal organelles can be regulated byfusing enzymes to transmembrane proteins [121, 120] or by using protein scaffolds [124,126], see Fig. 2.3. We have also discussed how the arrangement of enzymes can beregulated in the interior of membrane-bound systems and synthetic devices, see Fig. 2.4.For example, in the interior of cells, enzyme positioning can be partially controlledwith RNA and DNA assemblies [127, 130], synthetic protein scaffolds [128], or fusionproteins [59]. In synthetic devices, the arrangement of enzymes can be regulatedwith nanometer precision via single-molecule cut-and-paste surface assembly [193,194], or by arranging enzymes on programmed DNA scaffolds [61, 62, 63, 134]. Theexperimental use of our construction algorithm to design optimal synthetic bioreactorsseem to be within technological reach. For example, it could be accomplished bycombining techniques regulating the amount of enzymes bound to membranes and atthe same time their positions in the interior of the system.
67

4. Cross-diffusion induced patterns for asingle-step enzymatic reaction*
While in Ch. 2 we have studied how enzymes can be statically arranged in space tomaximize the reaction flux of an enzymatic reaction, in this chapter we focus on howthe motion of enzymes can be coupled to the substrate and the product concentrationsand how these couplings can lead to spontaneous pattern formation. In Sec. 2.6.1, wehave discussed the results of recent experiments showing that several different enzymesdisplay an apparent diffusion coefficient that increases with substrate concentration.Moreover, in Sec. 2.6.2, we have seen how their motion becomes directed in the presenceof substrate gradients. Whether this motion is directed upstream or downstreamthe substrate gradient seems to depend on the experimental conditions and severalcompeting models have been proposed to explain the observed phenomena. Theexperiments and the models study the response of enzyme motion to fixed substrategradients, they do not consider the feedback from enzyme transport onto the substrateprofile. In this chapter, we show that such feedback can generate spontaneous spatialpatterns in enzyme, substrate and product distributions, with just a single-step catalyticreaction (see graphical abstract Fig. 4.1). However, patterns form only for a subclassof transport models. For these models, nonspecific repulsive interactions between theenzyme and the substrate, or attractive interactions between the enzyme and the productcause the enzyme to accumulate in regions of low substrate concentration. Reactionsthen amplify local substrate and product fluctuations, steepening the substrate andproduct gradients, hence causing enzymes to further accumulate where substrate islow and product is high. Experimental analysis of this spontaneous pattern formationprocess could discriminate between the different transport models proposed so far.
4.1. Introduction
Recent experiments found that at least eight different enzymes present a higher dif-fusion coefficient when the concentration of the corresponding substrate in solution
*The chapter is adapted from the article: “Cross-diffusion induced patterns for a single-step enzymaticreaction”, by G. Giunta, H. Seyed-Allaei, U. Gerland, published in Communications Physics 3, 167 (2020),under CC BY 4.0 License. See Ref. [195].
68

4. Cross-diffusion induced patterns for a single-step enzymatic reaction
Figure 4.1.: Graphical abstract: Cross-diffusion induced patterns for a single-step enzymaticreaction. Repulsive nonspecific interactions between substrate and enzyme, or attractivenonspecific interactions between product and enzyme cause enzyme molecules to accumulatein regions of low substrate concentrations. Here the enzyme reacts with the substrate. Thesubstrate is further depleted and more product is formed at these locations as compared tolocations with higher amount of substrate. Hence the reaction causes the substrate and productgradients to get steeper. This in turn drives further accumulation of enzymes in regions oflow substrate. This feedback between reaction and enzyme accumulation amplifies smallfluctuations in the concentration profiles and drives spontaneous pattern formation.
is increased [136, 138, 140, 141, 142, 91, 137]. The increases were detected to be in therange of 24-80% relative to the diffusion coefficients in absence of substrate. Most ofthese measurements were performed by using Fluorescence Correlation Spectroscopy(FCS). Although FCS has been shown to introduce possible artifacts [143, 144], recentfindings using other techniques validated the phenomenon [146, 147], which is oftenreferred to as “enhanced diffusion” of enzymes. As we have seen in Sec. 2.6.1, theunderlying mechanism is still under debate [155]. A question is whether the catalyticstep of the reaction plays a role or not. On the one hand, enhanced diffusion of someenzymes has been shown to correlate with the degree of exothermicity of the enzymaticreaction [140]. Moreover, super resolution experiments suggest that the energy releasedfrom catalysis could be fueling a ballistic component of enzyme motion [142, 151]. Onthe other hand, some experiments indicate that enzymes present enhanced diffusiv-ity upon binding-unbinding of inhibitors, suggesting that catalysis might play a lessimportant role [136, 141, 152]. What contributes to enhanced diffusion could also be
69
4. Cross-diffusion induced patterns for a single-step enzymatic reaction
dependent on the enzyme considered. For example, according to the latest experimentsperformed with the enzyme urease, it seems that both the binding and the catalysisstep of the enzymatic reaction contribute to the phenomenon [151, 146].
In Sec. 2.6.2, we have discussed the results of recent experiments showing that en-zymes also perform directed motion in presence of substrate gradients. However, wehave seen that whether enzymes motion is directed upstream or downstream the gradi-ents is still unclear. Some experiments suggest that enzymes drift downstream substrategradients, performing “antichemotaxis” [142, 151]. Others suggest that enzymes moveupstream substrate gradients, performing “chemotaxis” [91, 152, 137]. Antichemotaxiscan be explained just by considering the enhanced diffusivity [142, 196]. Enzymeshave a higher diffusion coefficient in regions with high substrate concentration andaccumulate in regions with low substrate, where they have a lower diffusion coefficient.Chemotaxis instead cannot be generated by enhanced diffusion alone. A possiblecause for enzyme chemotaxis is cross-diffusion [91]. Cross-diffusion describes theresponse of the enzyme to forces generated by substrate gradients. Mathematically, itcorresponds to an off-diagonal element in the diffusion matrix describing the combinedmotion of enzyme and substrate. It has been suggested that cross-diffusion can bedue to specific interactions (ligand binding) between enzyme and substrate [152, 159,91] or due to nonspecific interactions (e.g. steric, electrostatic, van der Waals) [162].Specific interactions refer to the local, attractive, short-ranged interactions betweenthe substrate and the enzyme binding site, whereas nonspecific interactions refer toforces to which substrate molecules are subject to once they are in proximity of theenzyme surface [160]. Specific interactions only lead to chemotaxis, while nonspecificinteractions can cause enzymes to move both up- or downstream the substrate gradient,depending on whether the interactions are attractive or repulsive, respectively. Themodel including nonspecific interactions [162] can be considered as a mathematicalgeneralization of other existing models [142, 159, 91].
While the existing models and experiments study how enzymes move in pre-imposedsubstrate gradients, they do not consider the feedback between enzyme motion and theeffect that reaction has on the substrate gradient. Here, we analyze the effects of thisfeedback starting from the most general transport model [162]. We show that spatial pat-terns can emerge in initially homogeneous systems if nonspecific interactions contributeto the accumulation of the enzyme in regions where the concentration of substrate islow. Enzymes accumulating in these regions further deplete the substrate, causing thesubstrate gradient to become steeper, hence further increasing the accumulation of theenzyme. We obtain a set of conditions for the parameter range in which patterns form.We see that patterns arising from initial homogeneous concentrations can emerge onlyfor nonspecific interactions driving the enzyme away from the substrate, hence only forthe model proposed by Agudo-Canalejo et al. [162], but not for the models proposed by
70

4. Cross-diffusion induced patterns for a single-step enzymatic reaction
Zhao et al. [91], Mohajerani et al. [152] and Jee et al. [142], suggesting that the analysisof spontaneous pattern formation experiments can be used to discriminate between thedifferent proposed models. Our findings imply that patterns can arise for a single-stepenzymatic reaction even in the absence of autocatalytic activity or allosteric regulation.This is surprising given that the formation of conventional Turing patterns [197] withsuch simple reaction schemes requires at least a reaction network of three states, whereforward and backward reactions are catalyzed by two different enzymes [198].
4.2. Model
Our starting model system is depicted in Fig. 4.2. We consider a single-step enzymaticreaction in a narrow reaction chamber of length L connected via a permeable membraneto a large substrate reservoir. We assume only substrate and product molecules candiffuse through the permeable membrane, while enzymes are confined to the reactionchamber. This is justified because enzymes are typically larger than their substratesand products. We indicate with γs and γp the permeation rates of substrate andproduct respectively, i.e. the rate at which substrate and product molecules diffusethrough the membrane. These rates are obtained by dividing the substrate and productpermeabilities by the reaction chamber thickness. The reservoir has a fixed concentrationof substrate sR and no products. For the reaction occurring in the bulk of this effectively1D system we assume a Michaelis-Menten scheme (Fig. 4.2, inset). The substrate Sbinds to the enzyme E with rate kon, forming a complex, and it can unbind with rate koff.The catalytic step of the reaction has a rate constant kcat and catalysis is irreversible. Thisleads to a turnover rate per enzyme kcatF(s) := kcats(KM + s)−1, where s is the substrateconcentration and KM = (koff + kcat)k−1
on . Following Agudo-Canalejo et al. [162] (cf.Sec 2.6.2) we assume that the diffusion coefficient of the enzyme depends on whetherthe enzyme is free, Df, or it is in its complexed form, Dc. In Sec. 1.2.2, we have seenhow the binding of substrate can induce changes in the enzyme conformation (seeFig. 1.3). Typically, binding induces a reduction of the hydrodynamic radius and of theconformational fluctuations of the enzyme, meaning that the enzyme becomes morecompact and stiffer [141, 153, 154]. This implies that Dc > Df, which is consistentwith the experimentally observed trend. We also assume that short-range nonspecificinteractions can either cause the enzyme to move towards or away from the substrate,effectively generating a phoretic drift velocity that can also be interpreted as cross-diffusion [162]. We denote these interactions via pairwise potentials φfs, φcs dependingon whether the enzyme is free or in the complexed form, respectively, as depicted inFig. 4.2 (inset).
Under the assumptions that (a) the enzyme is very dilute and (b) the system is locally
71

4. Cross-diffusion induced patterns for a single-step enzymatic reaction
substrateenzyme
complex
Reservoir
Microfluidic channel
Membrane
x
product
Figure 4.2.: Model scenario considered for cross-diffusion induced patterns for a single-stepenzymatic reaction. A single-step enzymatic reaction takes place in a narrow reaction chamberthat extends in the x-direction and is coupled to a reservoir through a permeable membrane.The membrane allows for the exchange of only substrates and products with permeation ratesγs, γp respectively, but no exchange of enzymes. Inset: Reaction scheme. The substrate S isconverted into a product P by an enzyme E . The reaction follows a Michaelis-Menten schemewhere substrate can bind to the free enzyme with rate kon, forming a complex, and unbind withrate koff. The catalytic step of the reaction has a rate kcat. We assume that the enzyme has adiffusion constant Df or Dc depending on whether the enzyme is free or in its complexed form.Nonspecific pairwise interactions between enzyme and substrate φfs, φcs can depend on theenzyme form. How nonspecific interactions between enzyme and product affect the results isdiscussed in Sec.4.3.4.
in chemical equilibrium (i.e. the timescales of diffusion and cross-diffusion are slowerthan the chemical reactions), one can derive an effective transport equation for theenzymes [162],
∂te(x, t) = ∂2x[De(s)e] + ∂x[Ds
xd(s, e)∂xs] , (4.1)
within the quasi-1D reaction chamber (Fig. 4.2) oriented along the x axis. Here, e(x, t)denotes the local enzyme concentration (regardless of whether free or complexed) ands(x, t) the substrate concentration. The effective diffusion coefficient of the enzyme,
De(s) = Df + (Dc − Df)F(s), (4.2)
72
4. Cross-diffusion induced patterns for a single-step enzymatic reaction
is a function of substrate concentration, interpolating between the diffusion coefficientof the free enzyme and the complex, with F(s) as defined above. For s� KM, most ofthe enzymes are free and De(s) ∼ Df, whereas for s � KM most of the enzymes arebound to substrate and De(s) ∼ Dc. Note that the disassembly of enzyme oligomersinto monomers can also contribute to enhanced diffusion [158, 144, 147]. Eq. (4.1) wouldthen describe the enzyme motion irrespective of its oligomeric state. The cross-diffusionterm Ds
xd(s, e) of Eq. (4.1) describes how enzymes respond to substrate gradients dueto short-range nonspecific and hydrodynamic interactions,
Dsxd(s, e) = − [Cs
f + (Csc − Cs
f )F(s)] e . (4.3)
Here we define what we will refer to as “cross-diffusion strength” Csc/f = NAkBTλs 2
c/fη−1,
where η is the viscosity of the fluid, kB the Boltzmann constant, NA the Avogadro num-ber, T the temperature and λs
c/f the Derjaguin length [199, 162]. The Derjaguin lengthis a parameter capturing the effective short-range interaction between the complex/freeenzyme and the substrate. It is typically a few angstroms [163, 164] and can at mostbe as large as the Debye length (screening length), which in typical buffer conditionsis about 1nm [155]. It is expressed via the integral λs 2
c/f =∫ ∞
0 dhh(e−φcs/fs(h)(kBT)−1 − 1).λs 2
c/f is positive (negative) when the interaction is attractive (repulsive) [162]. The deriva-tion of λs 2
c/f is similar to that of the second virial coefficient for a real gas [165], butalso includes hydrodynamic effects and is computed by assuming that the size of theenzyme is much larger than the interaction length. The sign of λs 2
c/f determines the signof Cs
c/f and it has the opposite sign of Dsxd(s, e). For attractive interactions Ds
xd(s, e) < 0,i.e. the enzyme drifts towards higher concentrations of substrate (chemotaxis). The en-zyme performs antichemotaxis for repulsive interactions, for which Ds
xd(s, e) > 0. Notethat the effect of nonspecific interactions can also be written as a phoretic drift [162]by swapping ∂xs in Eq. (4.1) with e in the definition (4.3), with a drift velocity directlyproportional to the substrate gradient vph(s, ∂xs) =
[Cs
f + (Csc − Cs
f )F(s)]
∂xs.The enzyme dynamics as given by Eq. (4.1) is valid if short-range nonspecific interac-
tions between product and enzyme are neglected. We first neglect such interactions,but will discuss their effects further below. This allows us to derive simple analyticalconditions for the determination of the relevant parameter ranges for the formationof spontaneous patterns in the enzyme, substrate and product profiles. This approx-imation is valid for γp � γs. In such a regime products quickly permeate out ofthe reaction chamber, impeding the formation of large product gradients and causingproduct-induced cross-diffusion to be negligible. Note that the values of γp and γs
can vary by several orders of magnitude. For a reaction chamber that is 1-10µm thick,the permeation rates are in the range of γs,p ≈ 10−9-104s−1 [200]. In the regime wherethe enzyme is dilute and Eq. (4.1) is valid, the cross-diffusion that enzyme molecules
73
4. Cross-diffusion induced patterns for a single-step enzymatic reaction
would induce on substrate and product molecules can be neglected. Moreover thecross-diffusions related to the substrate-product interaction can also be neglected asproduct and substrate molecules are typically much smaller than the enzyme and theydo not affect each other as much as they affect the enzyme motion. Hence, the reactionchamber of Fig. 4.2 is described by the coupled reaction-transport equations
∂te(x, t) = ∂2x[De(s)e] + ∂x[Ds
xd(s, e)∂xs]
∂ts(x, t) = Ds∂2xs− kcateF(s)− γs[s− sR]
∂t p(x, t) = Dp∂2x p + kcateF(s)− γp p ,
(4.4)
where p(x, t) denotes the product concentration. The dynamics of the system of Eq. (4.4)is determined by the interplay of the different physical processes described above,each associated with a different timescale. The diffusion processes have timescalesτdiff. = L2D−1
e,s,p. The cross-diffusion process has a timescale τxd = L2eh(DsxdsR)
−1 andit represents the time it takes an enzyme to explore a length L, driven by a constantgradient sRL−1, where sR is the maximal substrate concentration allowed in the system.Equivalently, we can say that the nonspecific interactions cause the enzyme to driftwith velocity vph(s, ∂xs), with associated timescale τph. = Lv−1
ph = τxd. The reaction has
a timescale τreact. = k−1cat and the permeations have timescales τperm. = γ−1
s,p .Having the reaction chamber coupled to a reservoir avoids product accumulation
and substrate depletion, generating a nonzero homogeneous steady-state, with concen-trations eh, sh, and ph for enzyme, substrate, and product, respectively. For simplicity,we express eh and ph as functions of sh,
eh = γssR − sh
kcatF(sh), (4.5)
ph =kcatehF(sh)
γp. (4.6)
Since F(sh) is a monotonic increasing function of sh, it is possible to write sh andph in terms of eh, which can be directly tuned in experiments via the total enzymeconcentration (see Eqs. (B.4), (B.5) of Appendix B.1.1 and Fig. B.1).
4.3. Results
4.3.1. Instability driven by substrate-induced cross-diffusion
The homogeneous solution as given by Eqs. (4.5), (4.6) is stable for any positive valuesof the parameters for a well-mixed system, i.e. a system with no diffusion and no
74

4. Cross-diffusion induced patterns for a single-step enzymatic reaction
Figure 4.3.: Pattern formation for varying nonspecific interaction between substrate andenzyme. The concentration profiles for substrate s(x, t), enzyme e(x, t) and product p(x, t) areplotted as a function of time and spatial coordinate for two different parameter sets, see Table B.1for full parameter list. The homogeneous substrate concentration is fixed at sh = 104µM. Byvarying the square of the Derjaguin length λ2
s , we affect the nonspecific interaction betweensubstrate and enzyme. a λ2
s = −1Å2: the interaction is repulsive and spatial patterns arise from
initial homogeneous concentrations with white Gaussian noise. We can see how the enzymeaccumulates in regions of low substrate concentration, as well as the product; the profiles reachthe steady-state after about ∼ 103 seconds, the same order of magnitude as the timescale ofdiffusion, which is the slowest timescale for the parameters chosen, τdiff. = 103s. b λ2
s = 1Å2:
the interaction is attractive, the initial perturbation decays and the steady state profiles arehomogeneous.
cross-diffusion (see Appendix B.1.2). Fig. 4.3 shows the results of two simulations ofthe full system of Eq. (4.4), with periodic boundary conditions and parameters as givenin Table B.1. In Fig. 4.3a we see that the homogeneous solution is unstable and patternsform for a value of λs 2
f = λs 2c = −1Å
2. A steady-state is reached after about 103s,
corresponding to the timescale of enzyme diffusion that for the chosen parameters is theslowest timescale τdiff. = L2D−1
f = 103s. In Fig. 4.3b we see that for λs 2f = λs 2
c = 1Å2
the homogeneous solution is stable. Hence, depending on the parameters, the systemwill spontaneously form patterns.
To characterize the instability of the homogeneous steady state solution, vh =
(eh, sh, ph), we linearize Eqs. (4.4), v → vh + δv, and make the exponential ansatzδv = v0 eσteiqx, with q the spatial frequency of the linear perturbation and σ theperturbation growth rate. If σ > 0, the perturbation grows with a timescale as given
75

4. Cross-diffusion induced patterns for a single-step enzymatic reaction
by σ−1 and patterns form (see Appendix B.1.5 for the determination of σ−1 for thepatterns of Fig. 4.3a). Note that since the system of Eq. (4.4) is isotropic, the resultsbelow will also be valid for systems of higher physical dimensions. A positive σ can befound provided that (see Appendix B.1.3)[
D′e(sh)
De(sh)− F′(sh)
F(sh)
]+
Dsxd(sh, eh)
ehDe(sh)>
γs + Dsq2
kcatehF(sh), (4.7)
with D′e(sh) = ∂De(s)/∂s|shand F′(sh) = ∂F(s)/∂s|sh
. Using the functional form of De
in Eq. (4.7), the term given in square brackets equals −DfF′DeF which is negative. Hence
for the homogeneous solution to be unstable we must have Dsxd(sh, eh) > 0, i.e. enzyme
molecules drift downstream the substrate gradients, performing antichemotaxis. Wecan have positive cross-diffusion if the nonspecific interactions between enzyme andsubstrate molecules are repulsive, i.e. for negative cross-diffusion strengths Cs
c/f < 0.However, how repulsive do these interactions need to be? By using the definitionsof De(s), F(s) and Ds
xd(s, e), it is possible to show (see Eqs. (B.20)-(B.25) in the Ap-pendix B.1.3) that relation (4.7) is fulfilled if
0 < q <
√−β[DfKM + sh(Cs
f KM + Cscsh)]
Dssh(DfKM + Dcsh), (4.8)
Df + sh
(Cs
f +sh
KMCs
c
)< 0 , (4.9)
with β = γssR. This result holds in the strong depletion regime (sh � sR), where theeffect of the reaction on the substrate dominates over the outflow to the reservoir. In thisregime, the expressions are simpler and it is easier to pinpoint the driving mechanismbehind the instability observed in Fig. 4.3. We refer the reader to Appendix B.1.3 forthe full analysis. The argument of the square root in inequality (4.8) is positive ifrelation (4.9) is fulfilled. The instability is a type II instability [201] (see Appendix B.1.4),meaning that σ = 0 at q = 0, see Fig. B.2. This is natural as the total amount of enzymein our system is conserved and homogeneously increasing or decreasing perturbations,i.e. perturbations at q = 0, would correspond to changes in the total enzyme amount.By looking at the inequalities (4.9), (4.8), we can see that negative cross-diffusionstrengths Cs
c/f < 0 are needed to have instabilities. Given that Csc/f := NAkBTλs 2
c/fη−1,
this means that repulsive interactions (λs 2c/f < 0) are necessary. Diffusion tends to
homogenize the concentration profiles and contributes with a positive term to the lefthand side of inequality (4.9). In the case where the enzyme-substrate interaction isattractive, i.e. Cs
f > 0, also the second term on the left hand side of inequality (4.9) ispositive. Hence the interaction between enzyme and substrate would need to change
76

4. Cross-diffusion induced patterns for a single-step enzymatic reaction
sign upon substrate binding to have an instability (Csc < 0). This could happen if, upon
substrate binding, the electrostatic surface charge distribution of the enzyme changessignificantly, for instance due to a conformational transition. There can be cases inwhich the change in nonspecific interactions is less abrupt and both Cs
f < 0 and Csc < 0.
Even in the case for which Csc = Cs
f = Cs, i.e. there is no change in interaction uponsubstrate binding, it is possible to have an unstable homogeneous solution for
λ2s < − 1
6πRfNA
KM
sh(sh + KM), (4.10)
where we rewrote relation (4.9) with the use of the Stokes-Einstein relation kBT =
6πηDfRf, and the definition of Cs.
Figure 4.4.: Phase diagram of pattern formation. We plot the instability curve of the full modelgiven by the system of Eq. (4.4) (light blue line) and the approximated curve valid in the strongdepletion regime, where the reservoir concentration sR is much larger than the homogeneoussubstrate concentration sh, as given by relation (4.10) (green dashed line). The instability curvesare plotted in a diagram where on the abscissa we have sh and on the ordinate we have thesquare of the Derjaguin length λ2
s that determines the cross-diffusion strength. As a proxy tomeasure the presence of patterns, we use the ratio of the maximum and the minimum of thesteady state profile of the enzyme concentration emax/emin. Below the curve, the system of (4.4)is unstable and patterns arise, the ratio emax/emin can be as high as 109. Above the curve, thehomogeneous solution is stable and the ratio emax/emin = 1. The white cross corresponds to thesimulation shown in Fig. 4.3a.
It is interesting to note how relations (4.9), (4.10) depend on the substrate concen-tration. One could ask, given certain nonspecific interactions between enzyme andsubstrate: at which substrate concentration s∗h should we begin to observe instabilities?
77

4. Cross-diffusion induced patterns for a single-step enzymatic reaction
From relations (4.9), (4.10), we find that
s∗h =12
(−KM +
√K2
M +4DfKM
|Cs|
)=
12
(−KM +
√K2
M +2KM
3πRf|λ2s |NA
), (4.11)
with λ2s < 0. The value of s∗h given by Eq. (4.11) is similar to the value of sh above which
the phoresis generated by the nonspecific interactions vph(s, ∂xs) dominates over thedrift induced by the enhanced diffusion vbi := −∂xDe(s) [162]. They differ only by aprefactor (Dc − Df)/Df in the second term inside the square root of Eq. (4.11). Havingvph > vbi corresponds to Ds
xd(s, e) > eD′e(s). However, s∗h is not only determinedby this inequality, but also from inequality (4.7), where reaction also plays a role.By considering biologically relevant ranges, such as Rf ∼ 1-10nm [202, 203], KM ∼10−2-106µM [30], |λs| being smaller than the Debye length |λs| ≈ 10−2-10Å, we findthat s∗h . KM if |Cs|KM(4Df)
−1 � 1, or equivalently 3/2πRf|λ2s |NAKM � 1. This can
happen only for enzymes for which KM = 0.1-1M, which is only a small fraction ofenzymes [30]. For the vast majority of enzymes |Cs|KM(4Df)
−1 � 1 and s∗h � KM,meaning that we are in the saturated regime of the reaction, for which F(s) ≈ 1. Insuch a regime we find that s∗h ≈
√DfKM|Cs|−1 =
√KM(6πRfNA|λ2∗
s |)−1.In Fig. 4.4 we plot the phase diagram of the system of Eq. (4.4) where on the abscissa
we have sh and on the ordinate we have λ2s . The green dashed line corresponds to the
instability curve (4.10) in the strong depletion regime (sh � sR) and the light blue linerepresents the instability curve derived for any sh (see Eq. (B.23) in Appendix B.1.3).As a proxy for the determination of patterns we plot the ratio of the maximum overthe minimum of the enzyme profile at steady-state. Above the instability lines thehomogeneous solution is stable. Below the line the system is unstable and patternssimilar to the one shown in Fig. 4.3a arise.
4.3.2. Positive feedback causing pattern formation
What is the physical mechanism underlying the instability given by the inequalities(4.9),(4.8)? We illustrate the feedback mechanism generating the pattern in Fig. 4.5. Wehave already seen that to have instabilities the cross-diffusion Ds
xd(s, e) must be positive,see inequality (4.7). The enzymatic current induced by the cross-diffusion is given byJexd = −Ds
xd(s, e)∂xs, which for a negative slope of substrate concentration generatesa positive current for the enzyme, i.e. the enzyme moves away from a high substrateconcentration. The current generated by the enhanced diffusion Je
D = −∂x[De(s)e]also consists of a motion of the enzyme away from high substrate concentrations. InFig. 4.3a we can see how in a regime where patterns form, more product is generatedin locations where the substrate concentration is low and the enzyme concentration is
78
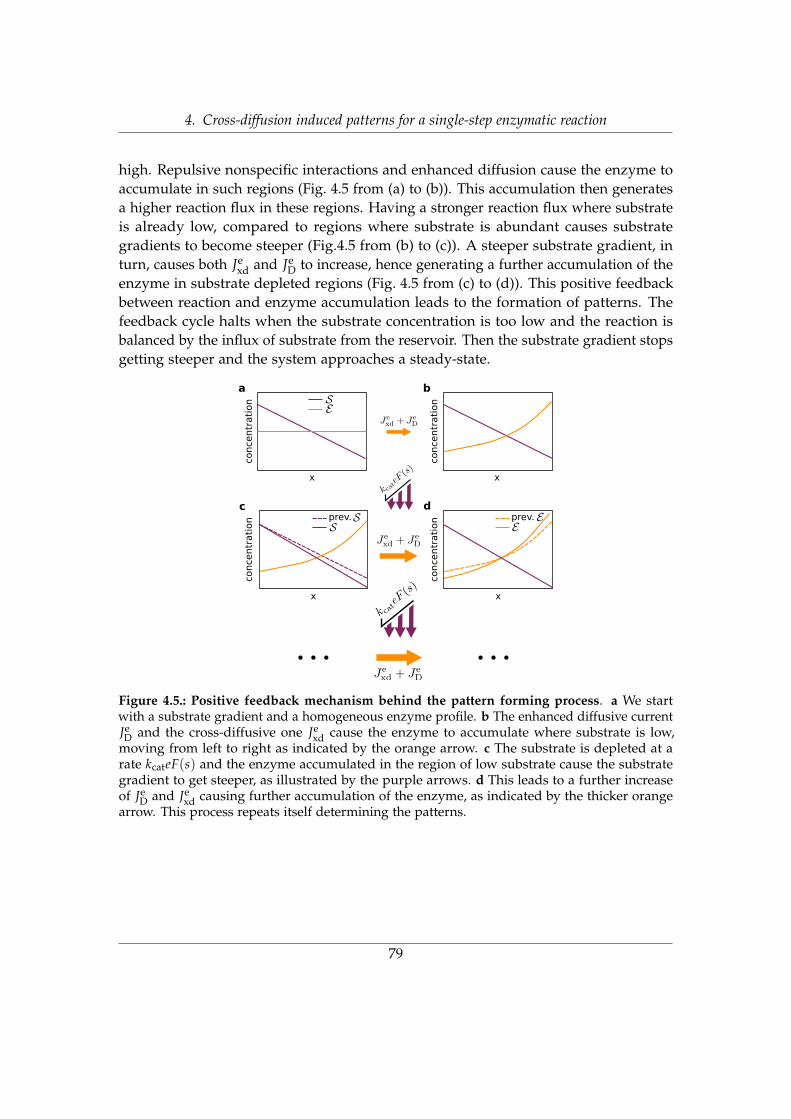
4. Cross-diffusion induced patterns for a single-step enzymatic reaction
high. Repulsive nonspecific interactions and enhanced diffusion cause the enzyme toaccumulate in such regions (Fig. 4.5 from (a) to (b)). This accumulation then generatesa higher reaction flux in these regions. Having a stronger reaction flux where substrateis already low, compared to regions where substrate is abundant causes substrategradients to become steeper (Fig.4.5 from (b) to (c)). A steeper substrate gradient, inturn, causes both Je
xd and JeD to increase, hence generating a further accumulation of the
enzyme in substrate depleted regions (Fig. 4.5 from (c) to (d)). This positive feedbackbetween reaction and enzyme accumulation leads to the formation of patterns. Thefeedback cycle halts when the substrate concentration is too low and the reaction isbalanced by the influx of substrate from the reservoir. Then the substrate gradient stopsgetting steeper and the system approaches a steady-state.
prev. prev.
concentration
concentration
x
x x
x
a b
c d
concentration
concentration
Figure 4.5.: Positive feedback mechanism behind the pattern forming process. a We startwith a substrate gradient and a homogeneous enzyme profile. b The enhanced diffusive currentJeD and the cross-diffusive one Je
xd cause the enzyme to accumulate where substrate is low,moving from left to right as indicated by the orange arrow. c The substrate is depleted at arate kcateF(s) and the enzyme accumulated in the region of low substrate cause the substrategradient to get steeper, as illustrated by the purple arrows. d This leads to a further increaseof Je
D and Jexd causing further accumulation of the enzyme, as indicated by the thicker orange
arrow. This process repeats itself determining the patterns.
79

4. Cross-diffusion induced patterns for a single-step enzymatic reaction
4.3.3. The role of enhanced diffusion
The currents JeD and Je
xd both contribute to the accumulation of enzymes in regions oflow substrate concentrations. However, the phase diagram of Fig. 4.4 suggests that forgiven concentrations only the cross-diffusive strength characterize the instability of thesystem. Hence, one could ask: What is the role played by the enhanced diffusion? Toanswer the above question, we first consider the case of a constant De(s) in Eq. (4.4), i.e.De = Dc. The inequality (4.9) characterizing the instability of the system is unaffected,while the interval (4.8) for the unstable wave vector q slightly changes.
Why cannot patterns be generated simply by enhanced diffusion? By consideringthe strong depletion regime (sh � sR) and Ds
xd(s, e) = 0, condition (4.7) becomes
D′e(sh)
De(sh)− F′(sh)
F(sh)>
q2Ds
β. (4.12)
Both De(s) and F(s) have a Michaelis-Menten dependence on s for all models of enzymemotion proposed so far. They differ only in the prefactors and a nonzero offset for De(s).Inequality (4.12) is never fulfilled for such De(s) and F(s) and consequently any initialperturbation of the concentrations is smoothed out by diffusion (see Appendix B.2.1).
However, inequality (4.12) will apply to any model with a spatially dependentdiffusion coefficient that is coupled to another diffusing and reacting species thatis being depleted. In case the diffusing species is being generated, the sign of theabove inequality is flipped. Systems of this type are used to study bacterial motion.Interestingly synthetic bacterial populations show stripe patterns as they grow onsemi-solid agar plates [204]. These bacteria produce a certain signaling moleculethrough which they sense their own concentration and regulate their mobility. Ifwe neglect bacterial growth, we have a system of equations similar to the equationsdescribing the enzyme and the substrate motion in Eq. (4.4). The enzyme wouldcorrespond to the bacteria and the substrate to the signaling molecule. For this systemF(s) = const. < 0 and De(s) is a Hill function with D′e(s) < 0. Hence patterns canform for D′e(s)De(s)−1 < q2Dsβ−1, where now β < 0. This shows that such syntheticpopulation of bacteria can form patterns even in the absence of growth. Inequality (4.12)specifies the minimal ingredients for pattern formation for such systems. It impliesthat, if F(s) > 0, patterns form whenever De(s) is more sensitive to perturbationsin the substrate concentration than F(s). Having a more sensitive De(s) than F(s)causes a more sensitive response in the enzyme motion than depletion due to reaction.Consider a local increase in substrate concentration and that both De(s) and F(s) aremonotonically increasing functions of s. Having a more sensitive De(s) than F(s)implies a higher increase in the current Je
D due to enhanced diffusivity away fromthe substrate, as compared to the depletion of substrate due to reaction. Molecules E
80

4. Cross-diffusion induced patterns for a single-step enzymatic reaction
then migrate to regions with low substrate and if they do so with a high enough ratethey can cause substrate gradients to get steeper, as in step (c) of Fig 4.5. However,for the enzyme model Eq. (4.4), De(s) and F(s) alone cannot generate instabilities(see Appendix B.2.1). The accumulation of the enzyme in low substrate regions at ahigh enough rate can be guaranteed only via the cross-diffusive term Ds
xd(s, e). This isbecause De(s) and F(s) are Michaelis-Menten functions with the same KM and thereforeare equally sensitive to substrate perturbations. In Appendix B.2.3 we show that if theMichaelis-Menten constant associated to De is much larger than the one associatedto F(s), relation (4.12) can be fulfilled, see also Fig. B.3. In this scenario, there can bea range of sh concentrations for which De(sh) is in the linear regime and sensitive tosubstrate perturbations, while F(sh) is in the saturated regime and therefore insensitiveto perturbations in s. In Appendix B.2.2 we also show that if De(s) is a Hill functionand F(s) a Michaelis-Menten reaction, we can have spontaneous pattern formation fora Hill coefficient > 1.
4.3.4. Inclusion of enzyme-product interaction
Up to now we focused on the effects that short-range nonspecific interactions betweensubstrate and enzyme have on the enzyme motion. We neglected the product-enzymeinteraction. This approximation was helpful to derive relations (4.9)-(4.11) and checkthe validity of pattern formation for biologically relevant parameter ranges.
Now we ask: How is pattern formation affected by the short-range interactionbetween product and enzyme? The enzyme dynamics becomes affected by gradients ofproduct (see Appendix B.3) and instead of Eq. (4.1) we get
∂te(x, t) = ∂2x[De(s)e] + ∂x[Ds
xd(s, e)∂xs] + ∂x[Dpxd(s, e)∂x p] , (4.13)
where Dpxd(s, e) is the cross-diffusion due to nonspecific short-range and hydrodynamic
interactions between product and enzyme. Similar to the substrate-induced cross-diffusion, Dp
xd(s, e) = −[Cpf + (Cp
c − Cpf )F(s)]e, where Cp
c/f = NAkBTλp 2c/fη
−1 is thecross-diffusive strength corresponding to the product-enzyme interactions for thecomplexed and free form respectively. The enzyme drifts upstream (downstream)the product gradients for an attractive (repulsive) interaction, for which Dp
xd(s, e) < 0(Dp
xd(s, e) > 0). Note that Dpxd(s, e) depends on the substrate concentration, because the
fraction of enzymes in the complexed form is given by F(s).It is possible to derive a condition characterizing the instability of the homogeneous
solution in the presence of product-induced cross-diffusion, similar to inequality (4.7)
81

4. Cross-diffusion induced patterns for a single-step enzymatic reaction
Figure 4.6.: Pattern formation for varying nonspecific interaction between product and en-zyme. The concentration profiles of substrate s(x, t), enzyme e(x, t), and product p(x, t) areplotted as a function of time and spatial coordinate. By varying the square of the Derjaguinlength λ2
p, we affect the nonspecific interaction between enzyme and product. a λ2p = 1Å
2: the
interaction is attractive and patterns are more pronounced as compared to the case where nointeraction is present, cf. 4.3a. b λ2
p = λ2s = −1Å
2: the interaction is repulsive and equal in
strength to the repulsive interaction between substrate and enzyme, given by λ2s ; we can see
that patterns are still present but less pronounced. c λ2p = −10Å
2: the interaction is so repulsive
that the homogeneous solution is stable.
(see Appendix B.3):[D′e(sh)
De(sh)− F′(sh)
F(sh)
]+
Dsxd(sh, eh)
ehDe(sh)−[
γs + Dsq2
γp + Dpq2
]Dp
xd(sh, eh)
ehDe(sh)>
γs + Dsq2
kcatehF(sh). (4.14)
As compared to inequality (4.7), in relation (4.14) there is an extra term that involvesthe cross-diffusion Dp
xd(s, e). The prefactor of this term goes to zero in the limit of largeγp as expected. The product-induced cross-diffusion contributes to the instability withopposite sign as compared to Ds
xd(s, e). We have seen in Fig. 4.5 that patterns form if
82

4. Cross-diffusion induced patterns for a single-step enzymatic reaction
the interaction between substrate and enzyme is repulsive (transition from (a) to (b))and Ds
xd(s, e) > 0. Then the reaction has the role of steepening pre-formed substrategradients (transition from (b) to (c)), i.e. more products are formed where substrate isalready low. This generates a product gradient that has opposite sign to the substrategradient, see Fig. 4.3a. Hence we can expect that patterns are favored by attractivenonspecific interactions between product and enzyme, for which Dp
xd(s, e) < 0. Thisfavors the accumulation of enzymes in regions of low substrate, further steepening thesubstrate gradient. In Fig. 4.6a we present the results of simulations where λ
pf = λ
pc =
λp. We vary λp and fix the other parameters to be the same as the ones considered for
Fig 4.3a, given in Table B.1. For λ2p = 1Å
2(Fig. 4.6a), i.e. for an attractive interaction
between product and enzyme (Dpxd(s, e) < 0), we see that the steady-state pattern
is more pronounced as compared to the case in which Dpxd = 0 (Fig. 4.3a). For
λ2p = λ2
s = −1Å2
(Fig. 4.6b) the pattern is still present, however less pronounced.Note that we still get a pattern because we considered different permeation ratesγs = 1s−1 and γp = 10s−1. Finally, for λ2
p = −10Å2
(Fig. 4.6c) the repulsion betweenproduct and enzyme is so strong that the pattern disappears. In this case Dp
xd(s, e) > 0and the cross-diffusive term induced by the product prevails over the cross-diffusiveterm induced by the substrate. Therefore the inequality (4.14) is not fulfilled. Notethat the inequality (4.14) can also be fulfilled if both cross-diffusions are negative,i.e. both substrate and product attract the enzyme. In this case, patterns form ifthe product attraction is stronger than the substrate one. As a result, enzyme wouldstill antichemotax from the substrate and the intuitive mechanism leading to patternsillustrated in Fig. 4.5 still holds. Note that one could think of the intuitive mechanismleading to patterns in terms of the feedback between product-induced cross-diffusionand product formation. Given an initial product gradient and a uniform enzyme profile,the enzyme would chemotax to the region of high product. Having more enzymesin this region would cause the formation of even more product. This would causethe steepening of the product gradient and a further accumulation of enzymes. Thisfeedback mechanism is the “time reversal” mechanism of the one illustrated in Fig. 4.5.
4.4. Discussion
We have seen that spontaneous patterns arising from homogeneous concentrationprofiles can form for a single-step catalytic reaction if cross-diffusive effects are present.Patterns form given sufficiently strong repulsive nonspecific interactions betweenenzyme and substrate, and/or sufficiently strong nonspecific attractive interactionsbetween enzyme and product as indicated by the inequality (4.14). These interactions
83
4. Cross-diffusion induced patterns for a single-step enzymatic reaction
cause the enzyme to move away from regions of high substrate concentrations andaccumulate in regions of low substrate, performing antichemotaxis. The accumulatedenzymes then deplete the substrate, steepening substrate and product gradients. Steepergradients further drive the accumulation of enzymes as illustrated in Fig. 4.5. Thispositive feedback cycle between enzyme accumulation and reaction is what generatesthe patterns.
The enzyme accumulation is driven by the antichemotaxis with respect to substrategradients due to nonspecific interactions. The enzyme chemotaxis considered in someof the models [152, 159, 91] has a stabilizing effect. Enzymes accumulate in regions ofhigh substrate concentrations. Reactions then flatten substrate gradients, breaking thefeedback that leads to patterns. Hence for such systems spontaneous patterns cannotform. Even in the absence of short-range nonspecific interactions, antichemotaxis existsdue to enhanced diffusivity [151, 142]. Nevertheless, we have seen that enhanceddiffusivity alone cannot generate spontaneous patterns for a simple enzymatic reaction.Hence, among all models proposed so far for enzyme motion, only the model given byEq. (4.1), first proposed by Agudo-Canalejo et al. [162], can lead to spontaneous patternformation. Analysis of the patterns generated can shed light onto the microscopicinteractions between enzyme and substrate. In fact, we have seen in Fig. 4.4 how theratio of the maximum over the minimum of the steady-state enzyme profile is affectedby the Derjaguin length |λ2
s | and it does not depend on the substrate concentration sh.The patterns observed in Fig. 4.3 are not generated via the common short-range
activation and long-range inhibition mechanism [205], as neither the enzyme nor thesubstrate have autocatalytic activity. It is also not a motility-induced phase separation(MIPS) mechanism [206], which relies on the slowing down of active particles in regionsof high particle concentrations. Here a positive feedback mechanism between particleaccumulation and reaction leads to the pattern formation. Note that for the system ofequations (4.4), patterns can form even if De ∼ Ds, because inequality (4.9) does notdepend on Ds, whereas for classical Turing patterns large differences in the diffusioncoefficients of the different species are required [197]. Moreover, it is surprising to seethat patterns can form for a single-step enzymatic reaction with no autocatalytic activitynor allosteric regulation. In fact, for a system where species have a constant diffusioncoefficient and enzymatic reactions follow a simple Michaelis-Menten scheme, patternsform for a minimal network of three states, where forward and backward reactions arecatalyzed by two different enzymes respectively [198]. In our system patterns form fora single-step catalytic reaction because of cross-diffusion.
Our findings are consistent with recent studies analyzing the effects of cross-diffusionin pattern formation [207]. Moreover it has been shown that phase separation, formationof static or self-propelled aggregates can be observed in mixtures of cross-diffusivespecies interacting via a fast diffusing chemical that can be produced or consumed [208].
84

4. Cross-diffusion induced patterns for a single-step enzymatic reaction
The scenario considered here corresponds to the case of a single cross-diffusive species,i.e. the enzyme, that is able to consume the fast diffusing chemical, i.e. the substrate.Here we considered the full nonlinear forms of enhanced diffusion and cross-diffusionfor the enzyme motion, whereas the other studies considered constant diffusion andconstant cross-diffusion [207, 208]. The nonlinear model permitted us to address thequestion why enhanced diffusion alone is not able to generate patterns for a simpleenzymatic reaction. We found that enhanced diffusion would need to be more sensitiveto perturbations in substrate concentrations than the reaction, see the inequality (4.12).Although this is not the case for enzymes, we believe that relation (4.12) can characterizethe pattern formation of species presenting different enhanced diffusion functions, suchas synthetic bacteria [204]. Moreover, the cross-diffusion terms characterizing thedynamics of E in Eq. (4.13) can correspond to chemotactic responses of organisms togradients of S and P , which can be chemoattractants or chemorepellants [209, 210].Hence the inequality (4.14) can be relevant in the characterization of spontaneouspattern formation of species performing chemotaxis. As similarly shown in Fig. 4.5,patterns can form if a chemotacting organism is repelled from a chemorepellent andsuch chemorepellent is also depleted from the organism. Moreover, patterns canalso form if the organism is attracted to a chemoattractant and the chemoattractantis produced by the organism. The latter scenario corresponds to the “time reversed”mechanism of the one shown in Fig. 4.5 and is at the base of aggregation phenomenain chemotacting Amoebae [211].
85

5. Summary and outlook
The research presented in this thesis investigates two distinct aspects of the spatial andtemporal organization of a single-step enzymatic reaction.
The first one concerns the spatial organization of localized (static) enzymes so as tomaximize the steady-state reaction rate for a wide class of reaction-diffusion systems.These systems are characterized by the fact that the substrate enters either through theexternal boundary or the boundaries of internal compartments. Once in the system,the substrate diffuses and can either react with the localized enzymes or is exposedto different loss mechanisms. Systems of this type can be encountered in naturalsystems or in synthetic bioreactors, e.g. microfluidic chambers and synthetic droplets.Hence, understanding how enzymes can be spatially arranged to maximize the reactionflux, is relevant not only for an improved understanding of natural strategies, butalso for the optimal design of synthetic bioreactors. In Ch. 3, we derive an optimalenzyme allocation principle for the class of reaction-diffusion systems that we justdescribed. We show that the optimal allocation strategy consists in distributing enzymesto have homogeneous marginal returns (HMR) in terms of reaction flux at all positionswhere enzymes are placed. This HMR principle allows us to analytically characterizetransitions in the optimal enzyme profile from configurations where enzymes are allbound to the boundaries where substrate is sourced, to configurations where enzymesare also present in the interior of the system. Moreover, by using the HMR criterionwe derive a deterministic construction algorithm for the determination of the optimalenzyme profile. Optimally arranged enzymes generate reaction fluxes that are several-fold higher than the ones given by uniform enzyme concentrations. The constructionalgorithm can be used for the design of transgenic cells and synthetic bioreactors. In fact,different synthetic strategies can regulate the spatial arrangement of enzymes both invivo and in vitro (cf. Sec. 2.5). The above results apply to systems of any dimensionalityand geometry. The substrate can have advective motion, be subject to different lossmechanisms and present nonlinear reaction functions, e.g. Michaelis-Menten or Hillfunctions. Although the class of systems considered is quite general and also includesthe possibility of having multiple sources of substrate, it applies to the maximizationof a single-step enzymatic reaction. It remains interesting to study whether the HMRcriterion also applies to the maximization of the reaction flux of a product coming froma multi-step enzymatic reaction. Moreover, the variational formalism used to derive the
86

5. Summary and outlook
HMR criterion could use other “utility functions” having different regulatory purposesthan the one of maximizing the reaction flux. For example, these functions could aimat keeping homeostatic concentration levels of metabolites or regulating the ratio ofdifferent product fluxes at metabolic branch points.
While the first research project presented in this thesis deals with the spatial orga-nization of enzymes, the second one focuses more on their motion. In fact, recentexperiments show that the enzyme motion can depend on the substrate concentrationprofile. Several enzymes exhibit an apparent diffusion coefficient that increases withsubstrate concentration. What causes this phenomenon, known as “enzyme enhanceddiffusion”, is still unclear. A first question is whether conformational changes of theenzyme upon substrate or inhibitor binding can explain the phenomenon alone, orwhether catalysis also plays a role. Moreover, the enzyme motion appears to be directedin substrate gradients. However, it is unclear whether enzymes drift upstream ordownstream the gradients and thus whether they perform “chemotaxis” or “antichemo-taxis”. To explain the experimental results, different models of enzyme motion havebeen proposed. Selecting the correct one is important for a better understanding ofenzymatic reactions and biological systems. For instance, the motion of enzymes inresponse to substrate gradients has been shown to lead to spontaneous co-localizationof consecutive metabolic enzymes, providing a possible explanation for the sponta-neous fromation of metabolons [91] (cf. Sec. 2.2.3). In Ch. 4, we show that spontaneouspattern formation experiments can be used to discern between the different modelsproposed. Patterns form for nonspecific repulsive interactions between the enzyme andthe substrate, or nonspecific attractive interactions between the enzyme and the product.These nonspecific interactions drive the accumulation of the enzyme in regions of lowsubstrate or high product concentrations. In these regions, the enzymatic reactioncauses the further depletion of substrate and increase of product, i.e. the reactioncauses the substrate and the product gradients to get steeper. This further drives theaccumulation of the enzyme in such regions, causing the emergence of spontaneousspatial patterns. Spontaneous patterns can only form for the model of enzyme motionused in Ch. 4 that accounts for the effects of nonspecific interactions. Hence, if patternsare detected experimentally, this model becomes the most likely one. However, in casepatterns do not form, different criteria are needed to further select for the correct model.A possibility is to consider sets of varying initial configurations for the substrate andthe enzyme profiles. The different dynamics may then lead to significant differences inthe concentration profiles at given times, or in the transient times required to reach thesteady-state. Experiments can then be designed based on the set of initial configurationsthat lead to the largest measurable differences in enzyme, substrate or product profileto further select for the correct model of enzyme motion.
Overall, the work presented in this thesis provides two key results. The first is a
87

5. Summary and outlook
spatial allocation strategy for the optimal arrangement of enzymes that can be usedin the design of synthetic bio-reactors. The second shows that spontaneous patternformation can be used to select for the correct model of enzyme motion among thedifferent ones proposed so far.
88
Appendices
89

A. Design principles for the optimalspatial arrangement of enzymes
A.1. General Lagrangian with multiple subspaces
As noted in Ch. 3, the functional derivatives of the Lagrangian are only well-defined ifthe function with respect to which the derivative is taken is continuous and smoothacross its entire domain. However, optimal enzyme distributions may feature disconti-nuities. For example, there may be a finite enzyme density in one region of the system,and no enzymes (zero density) in another region. This issue can be resolved by definingseparate subdomains within the system. The subdomains should be picked in theproximities of the substrate sources. For example if we have patches of sources onthe surface domains, for each source patch we would consider a surface subdomainaround the patch and a correspondent volume subdomain in proximity of the source.These are the regions where it is optimal to distribute the enzymes as diffusion doesnot allow for peak of substrate concentration away from the sources. Within eachsuch subdomain i, the substrate and enzyme densities ρ(i)(r) and e(i)(r) are smoothand their local gradients are well defined. However, at the interfaces between suchsubdomains, e(r) need not be continuous (although ρ(r) still must be). The positions ofthe interfaces, and therefore the extents of the different domains, should be optimizedover and as we have seen in Ch. 3 they depend on the Etot considered.
In this formulation, the total reaction flux can be written as a sum of contributionsfrom each surface and boundary domain, and the corresponding reaction-diffusion orboundary condition acts as a constraint that must be satisfied within each domain. Inaddition, we introduce explicit matching conditions on ρ(r) at the interfaces I. The
90

A. Design principles for the optimal spatial arrangement of enzymes
resulting Lagrangian has the following form:
L =∑i
∫Si
kcate(i)S (s)F[ρ(i)(s)]ds + ∑
j
∫Vj
kcate(j)(r)F[ρ(j)(r)]dr
− λe
[∑
i
∫Si
e(i)S (s)ds + ∑j
∫Vj
e(j)(r)dr− Etot
]
+ ∑j
∫Vj
λ(j)V (r)
{D∇2ρ(j)(r)−∇ ·
[ρ(j)(r)v(r)
]− σρ(j)(r)− kcate(j)(r)F[ρ(j)(r)]
}dr
+ ∑i
∫Si
λ(i)S (s)
{k(s)
[j(s)− D
∂ρ(l)
∂n(s)+ ρ(l)(s)v(s) · n(s)− kcate
(i)S (s)F[ρ(l)(s)]
]− h(s)ρ(l)(s)
}ds
+ ∑k
∫Ik
{λ(k)I (r)
[ρ(k1)(r)− ρ(k2)(r)
]+ λ′(k)
I (r) ·[∇ρ(k1)(r)−∇ρ(k2)(r)
]}dr.
(A.1)
where l represents the index of the volume domain adjacent to the boundary at s, andk1, k2 represent the two domains on either side of the interface Ik. Here λI(r) is aLagrange multiplier that enforces smoothness of the density profile at each point r on aninterface between two domains, and λ′I(r) is a vector of Lagrangian multipliers whereeach component enforces smoothness of ρ(r) along one of the system dimensions.
It is convenient to consider first some manipulations of the general Lagrangian,Eq. (A.1). Using the vector identity ∇ · ( f a) = ∇ f · a + f∇ · a we can rearrange thediffusive and advective transport terms to read
λV(r)∇2ρ(r) = ∇ · [λV(r)∇ρ(r)− ρ(r)∇λV(r)] + ρ(r)∇2λV(r), (A.2)
λV(r)∇ · [ρ(r)v(r)] = ∇ · [ρ(r)λV(r)v(r)]− ρ(r)v(r) · ∇λV(r) (A.3)
91

A. Design principles for the optimal spatial arrangement of enzymes
Applying Gauss theorem (∫
V ∇ · a dr =∮
a · n(s)ds), Eq. (A.1) becomes
L =∑i
∫Si
kcate(i)S (s)F[ρ(i)(s)]ds + ∑
j
∫Vj
kcate(j)(r)F[ρ(j)(r)]dr
− λe
[∑
i
∫Si
e(i)S (s)ds + ∑j
∫Vj
e(j)(r)dr− Etot
]
+ ∑j
∫Vj
{ρ(j)(r)
[D∇2λ
(j)V (r) + v(r) · ∇λ
(j)V (r)− σλ
(j)V (r)
]− kcatλ
(j)V (r)e(j)(r)F[ρ(j)(r)]
}dr
+ ∑i
∫Si
λ(i)S (s)
{k(s)
[j(s)− D
∂ρ(l)
∂n(s)+ ρ(l)(s)v(s) · n(s)− kcate
(i)S (s)F[ρ(l)(s)]
]− h(s)ρ(l)(s)
}ds
+ ∑k
∫Ik
{λ(k)I (r)
[ρ(k1)(r)− ρ(k2)(r)
]+ λ′(k)
I (r) ·[∇ρ(k1)(r)−∇ρ(k2)(r)
]}dr
+ ∑i
∫Si
{Dλ
(l)V (s)
∂ρ(l)
∂n(s)− Dρ(l)(s)
∂λ(l)V
∂n(s)− λ
(l)V (s)ρ(l)(s)v(s) · n(s)
}ds
+ ∑k
∫Ik
{Dλ
(k1)V (r)
∂ρ(k1)
∂n(r)− Dρ(k1)(r)
∂λ(k1)V
∂n(r)− Dλ
(k2)V (r)
∂ρ(k2)
∂n(r)+ Dρ(k2)(r)
∂λ(k2)V
∂n(r)
−[λ(k1)V (r)ρ(k1)(r)− λ
(k2)V (r)ρ(k2)(r)
]v(r) · n(r)
}dr
(A.4)
Here the last three lines contain the contributions from the boundary integral.
A.2. Optimal enzyme arrangement in a one-dimensionalsystem
In this section we go through the full analytic optimization of the simplest exactly-solvable model. We consider a one-dimensional system with a source of substrate atone boundary at x = 0, (j(0) = j0, k(0) = 1, h(0) = 0) and an absorbing boundary atx = L (j(L) = k(L) = 0, h(L) = 1). Further we assume a linear reaction functional, nodrift and no instability of S , i.e. F[ρ] = ρ/KM and v = σ = 0.
In our formalism we divide the system into two boundary domains (S1: x = 0and S2: x = L) and two “volume” domains (V1: 0 ≤ x ≤ x0 and V2: x0 ≤ x ≤ L,
92

A. Design principles for the optimal spatial arrangement of enzymes
with 0 ≤ x0 ≤ L a parameter to be optimized). For simplicity of presentation wewill assume that enzymes can be present at x = 0 or in the domain V1, while theboundary at x = L and the domain V2 are free of enzymes. Whilst one can includean arbitrary number of additional domains within the system, we found that suchdomains turned out to be degenerate with the two specified above. Therefore, we willnot include these possibilities here. The effective enzyme profile is therefore of theform eSδ(x) + e(x)Θ(x0 − x), where δ(x) is the Dirac delta function and Θ(x) is theHeaviside function.
The Lagrangian for this specific model is
L = κeSρ(1)(0) +∫ x0
0κe(x)ρ(1)(x)dx− λe
(eS +
∫ x0
0e(x)dx− Etot
)+∫ x0
0λ(1)(x)
[D∂2
xρ(1)(x)− κe(x)ρ(1)(x)]
dx−∫ L
x0
λ(2)(x)D∂2xρ(2)(x)dx
+ λ0
[j0 + D∂xρ(1)(0)− κeSρ(1)(0)
]− λLρ(2)(L)
+ λx0
[ρ(1)(x0)− ρ(2)(x0)
]+ λ′x0
[∂xρ(1)(x0)− ∂xρ(2)(x0)
],
(A.5)
where we have introduced the catalytic efficiency κ = kcat/KM. Here λe is the Lagrangemultiplier corresponding to the constraint of having a fixed amount of enzymes Etot;λ(1)(x) and λ(2)(x) those corresponding the constrained dynamics of the substratein the two domains; λ0 and λL to the boundary conditions; and λx0 and λ′x0
to thecontinuity and smoothness that must be imposed on ρ(x) at the interface x0.
To calculate the optimal enzyme arrangement e∗S, e∗(x) we must compute the variousfunctional derivatives of L. Let us first consider the derivatives with respect to e(x)and ρ(1)(x). From the form in Eq. (A.4) we find
δLδe(x)
= 0 ⇔ ρ(1)(x) =λe
κ[1− λ(1)(x)](A.6)
δLδρ(1)(x)
= 0 ⇔ e(x) = − D∂2xλ(1)(x)
κ[1− λ(1)(x)]. (A.7)
We can compute the derivatives ∂xρ(1)(x) and ∂2xρ(1)(x) starting from the expressions
above and we can substitute the results into the reaction-diffusion equation (given alsoby δL
δλ(1)(x)= 0) to obtain an ordinary differential equation for λ(1)(x):
∂2xλ(1)(x)
∂xλ(1)(x)= − ∂xλ(1)(x)
1− λ(1)(x). (A.8)
93

A. Design principles for the optimal spatial arrangement of enzymes
The solution to Eq. (A.8) can be found by direct integration to be
λ(1)(x) = 1− A1eB1x, (A.9)
where A1 and B1 are constants of integration still to be determined. Using Eqs. (A.6)-(A.7) we obtain
ρ(1)(x) =λe
κA1e−B1x (A.10)
e(x) =DB2
1κ
, (A.11)
Equation (A.11) immediately shows that the enzyme density in the region 0 ≤ x < x0
is constant, in agreement with previous numerical studies [167, 168].Evaluating the functional derivative of L with respect to λ(2), we recover the diffusion
equation ∂2xρ(2)(x) = 0 in the domain V2, from which
ρ(2)(x) = A2 + B2x, (A.12)
where A2 and B2 are again constants of integration.The constants A1,2 and B1,2 can be evaluated using the boundary conditions at x = 0
and x = L, and the continuity and smoothness conditions at x = x0. Additionally, thedependence on eS can be eliminated using δL
δλe= 0, which is simply the constraint on
the total enzyme number. This leaves us with an expression for the Lagrangian that,since all constraints have been satisfied equals the constrained reaction flux JP , in termsof the single optimization variable x0,
L = JP = j0
[1− 1− x0
L
1− 2 x0L + αEtot(1− x0
L )2 e−
x0L−x0
](A.13)
where we define α = κL/D. Finally, we maximize over x0 to find
x∗0 =
0 αEtot ≤ 1
L[1− (αEtot)
−1/2]
αEtot > 1. (A.14)
By substitution we can then obtain expressions for the enzyme and substrate densitiesas shown in Table A.1.
94

A. Design principles for the optimal spatial arrangement of enzymes
Regime e∗S e∗(x) ρ(1)(x) ρ(2)(x) JP∗
αEtot ≤ 1 Etot 0 N/A j0(L−x)D(1+αEtot)
j01+(αEtot)
−1
αEtot > 1√
Etotα
EtotL
j02
LD√
αEtote−√
αEtotxL
j02
L−xD√
αEtote−√
αEtotx0L j0
(1− 1
2 e1−√αEtot
)Table A.1.: Optimal enzyme distribution and corresponding substrate profile and flux for aone-dimensional system. Below the transition point αEtot ≤ 1, the optimal enzyme profile isa fully bound configuration, where all the enzymes are placed at the source of substrate. ForαEtot > 1, the optimal profile is given by a fraction of enzymes located at the source of substrateand by a constant profile in the domain [0, x∗0 ], see Eq.(A.14). The substrate profile is given byρ(1)(x), ρ(2)(x) in the domains [0, x∗0 ] and [x∗0 , L], respectively. The expressions for the optimalreaction flux JP∗ are given in the last column.
A.3. Marginal returns landscape
Given a particular enzyme arrangement, the marginal returns as a function of positioncan be calculated directly by considering the addition of an amount δe of enzymes atposition x′, and solving the new modified reaction-diffusion system. Here we presentan example of such a calculation. We consider the same one-dimensional systemanalyzed above, and suppose that we are in the regime αEtot > 1 and the enzymeprofile is the optimal one of Table A.1. For other enzyme profiles, such as those shownin Fig. 3.3a, the calculation proceeds in the same way.
We now have to consider two cases: 0 ≤ x′ ≤ x0 and x0 < x′ ≤ L.If 0 ≤ x′ < x0, we solve the reaction-diffusion equation in the three domains:
0 ≤ x < x′, x′ < x ≤ x0, and x0 ≤ x ≤ L. The resulting density profiles are
ρ[0,x′](x) = a1e√
EtotκDL x + b1e−
√EtotκDL x (A.15)
ρ[x′,x0](x) = a2e√
EtotκDL x + b2e−
√EtotκDL x (A.16)
ρ[x0,L](x) = a3x + b3. (A.17)
To fix the constants of integration ai, bi, we make use of the boundary conditions atx = 0 and x = L as well as matching conditions on ρ at x′ and x0. Specifically, werequire continuity of ρ at x′ and x0, and smoothness at x0,
ρ[0,x′](x′) = ρ[x′,x0](x′) (A.18)
ρ[x′,x0](x0) = ρ[x0,L](x0) (A.19)
∂xρ[x′,x0](x0) = ∂xρ[x0,L](x0). (A.20)
95
A. Design principles for the optimal spatial arrangement of enzymes
Additionally, conservation of mass at x = x′ requires that
D∂xρ[x′,x0](x′)− D∂xρ[0,x′](x′) = κδeρ[x′,x0](x′). (A.21)
The total flux JP is then given by
JP (x′, δe) = κ
[e∗Sρ(0) + δeρ(x′) +
∫ x0
0e∗(x)ρ(x)dx
], (A.22)
into which we substitute the final density profile ρ(x) as well as e∗S and e∗(x) fromTable A.1. Finally, the marginal returns at position x′ can be calculated as
dJP
de(x′)= lim
δe→0
∂JP
∂δe=
j04
√α
Etote1−√αEtot . (A.23)
Therefore, for 0 ≤ x′ ≤ x∗0 the marginal returns do not depend on x′, and all positionsat which we have enzymes give the same returns. It is straightforward to verify thatthis agrees with the value of λe derived from the optimal reaction flux that appears inTable A.1,
λe =dJP∗
dEtot=
j04
√α
Etote1−√αEtot . (A.24)
In the case x0 ≤ x′ < L, the same procedure can be applied, except with the threedomains 0 ≤ x ≤ x0, x0 ≤ x ≤ x′, and x′ ≤ x ≤ L. We find that the marginal returns isgiven by
dJP
de(x′)=
j0α
4e1−√αEtot
(1− x′
L
)(1 +√
αEtotx′ − x0
L
). (A.25)
As expected, this approaches Eq. (A.23) as x′ → x0 = L[1− (αEtot)
−1/2].
A.4. Derivation of the transition condition
In this section we derive the inequality condition, Eq. (3.20) presented in Sec. 3.3.3,that determines whether or not enzymes should be placed in the volume adjacent toa boundary position s. We begin by examining the functional derivative of L withrespect to substrate profiles at the system boundary, ρ(s). In the vicinity of a reflectingboundary (i.e. h(s) = 0, k(s) = 1) we obtain from Eq. (A.4)
δLδρ(s)
= kcateS(s)δF[ρ]
δρ{1− λS(s)} − D
∂λV
∂n(s)− [λV(s)− λS(s)] v(s) · n(s) = 0,
(A.26)
96

A. Design principles for the optimal spatial arrangement of enzymes
where equality with zero assumes that the enzyme distribution is the optimal one. Wecan also consider the functional derivative with respect to the gradient of ρ(r) at theboundaries of the system,
δLδ
∂ρ∂n(s)
= D [λV(s)− λS(s)] = 0. (A.27)
Equation (A.27) requires λV(s) = λS(s), which simplifies Eq. (A.26) to
kcateS(s)F′[ρ(s)]{1− λV(s)} − D∂λV
∂n(s)= 0 , (A.28)
where F′[ρ(s)] = δF[ρ]δρ .
We next examine variations of L with respect to the enzyme densities,
δLδeS(s)
= kcatF[ρ(s)]{1− λS(s)} − λe ≤ 0 (A.29)
δLδe(r)
= kcatF[ρ(r)]{1− λV(r)} − λe ≤ 0 . (A.30)
Both λV(r) and ρ(r) must be continuous, since they must both satisfy (generally non-linear) diffusion equations. Therefore, it follows from Eq. (A.30) that δL
δe(r) is itself
continuous and that we can define the spatial gradient ∇ δLδe(r) . At all points where it is
optimal to allocate a non-zero density of enzymes (both in the interior of the systemor on the boundaries) we have that δL
δeS(s)= δL
δe(r) = 0, implying that ∇ δLδe(r) = 0. In
regions where enzymes are not present because it is suboptimal to add them, we getthat δL
δe(r) < 0, and the gradient ∇ δLδe(r) will in general be finite. Furthermore, since
ρ(r)→ ρ(s) and λV(r)→ λV(s) = λS(s) smoothly as r→ s, ∇ δLδe(r) must remain well
defined as we approach the system boundaries.If it is optimal to have enzymes at the boundaries of the system but not locally in
the interior, δLδeS(s)
= 0 and δLδe(r) < 0 for a small displacement r = s + ε. In this case,
evaluating the gradient of Eq. (A.30) and taking r→ s we find
∂
∂n(s)δL
δe(r)= kcat
[F′[ρ(s)] (1− λV(s))
∂ρ
∂n(s)− F[ρ(s)]
∂λV
∂n(s)
]> 0 . (A.31)
Substituting for ∂λV∂n(s) from Eq. (A.28), this inequality becomes
kcatF′[ρ(s)] (1− λV(s)){
∂ρ
∂n(s)− kcat
DeS(s)F[ρ(s)]
}> 0. (A.32)
97

A. Design principles for the optimal spatial arrangement of enzymes
Since we assume that F[ρ] is monotonically increasing, F′[ρ] > 0. Furthermore, settingEq. (A.29) equal to zero implies that 1− λV(s) > 0, since λe > 0. Therefore, Eq. (A.32)reduces to
D∂ρ
∂n(s)> kcateS(s)F[ρ(s)] , (A.33)
which corresponds to Eq. (3.20) of Sec. 3.3.3.
A.5. Reduction of numerical complexity in a one-dimensionalsystem with drift
In this section we demonstrate how, even in cases for which the full analytical solutionis not tractable, it is nevertheless possible to use the Lagrangian formalism to expressthe optimization problem as a single equation, which can then be solved numerically.
We consider a one-dimensional system, similar to that considered in Sec. A.2 butwith the addition of a constant drift v. If v > 0 substrate molecules tend to flow awayfrom the source at the origin, whereas for v < 0 they tend to flow towards it. Thecorresponding Lagrangian is
L = κeSρ(1)(0) +∫ x0
0κe(x)ρ(1)(x)dx− λe
(eS +
∫ x0
0e(x)dx− Etot
)+∫ x0
0λ(1)(x)
[D∂2
xρ(1)(x)− v∂xρ(1)(x)− κe(x)ρ(1)(x)]
dx
−∫ L
x0
λ(2)(x)[
D∂2xρ(2)(x)− v∂xρ(2)(x)
]dx
+ λ0
[j0 + D∂xρ(1)(0)− vρ(1)(0)− κeSρ(1)(0)
]− λLρ(2)(L)
+ λx0
[ρ(1)(x0)− ρ(2)(x0)
]+ λ′x0
[∂xρ(1)(x0)− ∂xρ(2)(x0)
].
(A.34)
The derivation proceeds in the same way as in Section A.2. We again use thefunctional derivatives to find expressions for e(x) and ρ(1)(x) in terms of the Lagrangemultiplier λ(1)(x),
δLδe(x)
= 0 ⇔ ρ(1)(x) =λe
κ[1− λ(1)(x)](A.35)
δLδρ(1)(x)
= 0 ⇔ e(x) = −D∂2xλ(1)(x) + v∂xλ(1)(x)
κ[1− λ(1)(x)]. (A.36)
Surprisingly, when we combine these expressions with the reaction-diffusion equationwith drift, we find that the resulting differential equation for λ(1)(x) is again exactly
98

A. Design principles for the optimal spatial arrangement of enzymes
Eq. (A.8), which we can solve to find
λ(1)(x) = 1− A1eB1x, (A.37)
ρ(1)(x) =λe
κA1e−B1x (A.38)
e(x) =DB2
1 + vB1
κ. (A.39)
Notably the optimal enzyme density e(x) is again constant, but now depends on thedrift velocity v.
In the region with no enzymes, ρ(2)(x) obeys a diffusion equation with drift,D∂2
xρ(2)(x)− v∂xρ(2)(x) = 0, which has the solution
ρ(2)(x) = A2 + B2ePe x/L , (A.40)
where Pe = vL/D is the Péclet number. As before, we evaluate the integration constantsA1,2, B1,2 using the boundary conditions at x = 0 and x = L, and the continuity andsmoothness conditions at x0. We again eliminate the dependence on eS by using theconstraint on the total enzyme number. We are left with an expression for JP in termsof the single optimization variable x0,
L = JP = j0
{1−
exp{−Pe x0
L
[ePe(1−x0/L) − 1
]−1}1 + αEtot
Pe
[1− e−Pe(1−x0/L)
]− Pe x0
L
[ePe(1−x0/L) − 1
]−1
}, (A.41)
where α is defined as in Sec. A.2. It can be shown that Eq. (A.41) reduces to Eq. (A.13)in the limit Pe→ 0.
It is not possible to find the x∗0 that maximizes JP analytically. However, it isstraightforward solve dJP
dx0= 0 numerically for specified values of the other parameters
appearing in Eq. (A.41). The results for the rescaled reaction flux and the rescaled netdiffusive flux at the origin are shown in Fig. 3.4 in Sec. 3.3.3.
A.6. One-dimensional system with two sources of substrate
Here we present an example of a scenario of multiple sources of substrate with differentstrengths. We considered a one-dimensional system in the domain 0 ≤ x ≤ L, withreflecting boundaries at both ends. At x = 0 we apply a source of substrate withj(0) = 1, and at x = L we apply a source with j(L) = 0.3. Instead of at the boundary,loss of substrate occurs via decay with rate σ. We again assume linear reactions,
99

A. Design principles for the optimal spatial arrangement of enzymes
F[ρ] = ρ/KM. For this system we have identified a number of different regimes of theoptimal enzyme arrangement as a function of Etot, shown in Fig. A.1a.
jD/jjP/j σ vReactionGeometrySymmetry
1D two sources1D two sources
LinearLinear
YY
NN
10-4
10-2
100
0 100
e(x* )
x
ET=0.3
I
0 100x
ET=0.6
II
0 100x
ET=0.9
III
0 100x
ET=1.25
IV
a
b
0
0.5
1
-1 -0.5 0 0.5 1
jD/j
, jP /j
I II III IV
(Etot-Et )/Ettot tot
Figure A.1.: Transitions in the optimal enzyme arrangement for a one-dimensional systemwith two sources of substrate. The system is defined by σ = 1, α = Lkcat/(KMD) = 1, v = 0and boundary conditions j(0) = 1, k(0) = −1, h(0) = 0 and j(L) = 0.3, k(L) = −1, h(L) = 0. aExamples of the optimal enzyme profiles for different values of Etot. b Diffusion and reactionfluxes at x = 0 and x = L, normalized by the local influxes of substrate, are plotted as a functionof (Etot − Et2
tot)/Et2tot. For both poles of the system, we confirm that jD > jP when the optimal
enzyme distribution consists of only a single boundary cluster at that pole, while jD = jP = j/2when the optimal enzyme arrangement extends a finite distance away from the pole. Linesshow analytical solutions. Points show results of numerical optimization. Fig. 3.4 of the maintext shows the same data with the fluxes at x = L plotted against (Etot − Et3
tot)/Et3tot.
At the lowest Etot values, the optimal arrangement consists of a single cluster at x = 0,the site of strongest substrate influx. As Etot crosses a first transition level, Et1
tot, theoptimal configuration features clusters of enzymes at both ends of the system: a largerone at x = 0 (the stronger source) and a smaller one at x = L (the weaker source). Inthis regime the optimal distribution of enzymes between the two poles can be calculatedexactly by solving the reaction-diffusion equation with arbitrary cluster densities e0
and eL, and then optimizing over e0 and eL subject to the constraint e0 + eL = Etot. The
100

A. Design principles for the optimal spatial arrangement of enzymes
transition position Et1tot is then the value at which the resulting optimal e∗L = 0. However,
since the expressions are large and complex we do not include them here.As Etot is increased further we reach a second transition at Et2
tot, with enzymes beingplaced within the system in the vicinity of x = 0. This transition occurs when thediffusive and reaction fluxes at x = 0 become equal, jD(0) = jP (0) = j(0)/2 (seeFig. A.1b). At Et2
tot, the corresponding fluxes at x = L are not equal and still satisfy theinequality condition Eq. (A.33) (Eq. (3.20) of Sec. 3.3.3). Therefore, around x = L theoptimal configuration is still purely clustered, with no enzymes at x < L. The transitionthreshold Et2
tot can be determined exactly by calculating the fluxes jD(0) and jP (0) fromthe full solution of the system with the two optimal polar clusters.
At a larger still transition value Et3tot, the diffusive and reactive fluxes at x = L also
become equal, jD(L) = jP (L) = j(L)/2 (see Fig. A.1b). For Etot > Et3tot, enzymes are
present away from the boundaries at both ends of the system. In the regime Etot > Et2tot
it is not possible to solve for the form of the optimal profile e∗(x), or therefore tocalculate jD(L) and jP (L). The value of Et3
tot must therefore be determined numerically.Finally, if Etot is increased further, the enzyme density profiles extending from the
two ends of the system will eventually coalesce, and enzymes will we present at allpositions 0 ≤ x ≤ L.
It is also possible for these transitions to occur in a different order for differentparameter combinations. For example, if j(L) � j(0), the order of the first twotransitions may be reversed. In this case, the condition jD(0) = jP (0) = j(0)/2 issatisfied before the transition value Et1
tot is reached. The first transition will then be froma single cluster at x = 0 to a regime in which there is a finite extension of enzymesfrom x = 0, but no cluster at x = L. The appearance of the second cluster at x = Lmay then occur subsequently, at larger Etot, resulting in an optimal enzyme profile thanresembles type III in Fig. A.1a.
A.7. Optimal enzyme allocation algorithm for discretizedsystems
In this section we derive Eqs. (3.21), (3.23) of Sec. 3.3.5, which define the algorithm usedfor the construction of the optimal enzyme profile as enzymes are iteratively added intothe system. We consider a system with discretized space. The densities of substrate andenzyme change from functions of position to a discrete set of variables, {ei} = {e(ri)}for i = 1..N, where N is the number of lattice sites. Instead of being a functional ofe(r), ρ(r), the corresponding discrete Lagrangian then becomes a function of {ei}, {ρi},and functional derivatives δL
δ f (r) become normal derivatives ∂L∂ fi
.The derivative of L with respect to the enzyme density has an analogous form as in
101

A. Design principles for the optimal spatial arrangement of enzymes
the continuous system,∂L∂ei
= kcatF[ρi]{1− λi} − λe, (A.42)
where λi is the Lagrange multiplier associated with the discrete reaction-diffusion equa-tion at site i. We again denote the first term above by dJP
dei, with the same interpretation
as in the continuous case. This quantity is generally easily accessible in any numericalanalysis: one simply increases the amount of enzymes at position i by a small amount,solves the resulting modified reaction-diffusion system, and calculates the resultingchange in the total reaction flux. In the same way as for the continuous system, for theoptimal enzyme arrangement {e∗i } we must have that ∂L
∂ei= 0 at all sites i where e∗i > 0,
and ∂L∂ei≤ 0 where e∗i = 0.
We now consider the optimal amount of enzymes at site i to be a function of Etot,e∗i (Etot). That is, there is a line e∗(Etot) in the space of e = (e1, e2, . . . , eN), that we canparameterize by the value of Etot, for which the reaction flux JP (e∗(Etot)) is the highestthat can be achieved for that value of Etot. We begin by considering the derivative ofdJPdei
with respect to Etot along the line defined by e∗(Etot), ddEtot
dJPdei
. We now expand thetotal derivative d
dEtotin terms of derivatives with respect to the underlying variables
{ei},d
dEtot
dJP
dei=
N
∑j=1
dej
dEtot
ddej
dJP
dei. (A.43)
Note that here dde takes into account the changes in the flux both due directly to altering
the enzyme density, and the resulting change in the substrate density profile {ρi}. Sincedej
dEtotis understood to be in the direction of the line of optimal profiles, it coincides with
de∗jdEtot
. Writing the set of N equations Eq. (A.43) in vector form we have
ddEtot
dJP
de= H
de∗
dEtot, (A.44)
where H is the Hessian of JP , Hij =d2 JPdejdei
.From Eq. (A.42) we know that if there are 1 ≤ n ≤ N positions at which the optimal
102

A. Design principles for the optimal spatial arrangement of enzymes
enzyme density is non-zero, then
dJPde1...
dJPdendJP
den+1...
dJPdeN
= λe
1...1
cn+1...
cN
, (A.45)
where all c’s lie in the range 0 < ci < 1, and we have numbered lattice sites indescending order of marginal returns. Therefore, Eq. (A.44) becomes
Hde∗
dEtot=
dλe
dEtot
1...1
cn+1 +dcn+1dEtot
λedλe
dEtot...
cN + dcNdEtot
λedλe
dEtot
. (A.46)
In general it is not possible to directly compute the right hand side of Eq. (A.46),because without knowing the direction of the optimal line it is not possible to calculatethe derivatives dλe
dEtotand dci
dEtot. However, exploiting the fact that no enzymes should be
added to the system at positions where dJPdei
< λe, the vector de∗dEtot
must have zeros atall positions i > n. Therefore, the N-dimensional system in Eq. (A.46) can be split intotwo parts. Primarily, we have the n-dimensional system
H(n)
de∗(n)dEtot
=dλe
dEtot1(n), (A.47)
where the subscript (n) denotes that only the first n positions of the lattice are con-sidered. Importantly, in order to solve Eq. (A.47) it is not necessary to know dλe
dEtotin
advance. Instead, one can solve for any constant prefactor, and then subsequentlyuse the normalization condition ∑n
i=1de∗i
dEtot= 1 to express dλe
dEtotin terms of this con-
stant. For self-consistency, the solution to Eq. (A.47) must also solve the residual
103

A. Design principles for the optimal spatial arrangement of enzymes
(N − n)-dimensional system
d2 JP
de1den+1
d2 JPde2den+1
· · · d2 JPdenden+1
......
. . ....
d2 JPde1deN
d2 JPde2deN
· · · d2 JPdendeN
de∗ndEtot
=dλe
dEtot
cn+1 +
dcn+1dEtot
λedλe
dEtot...
cN + dcNdEtot
λedλe
dEtot
, (A.48)
which can be interpreted as defining the evolution of the marginal returns at positionswithout enzymes, dci
dEtot.
104

B. Cross-diffusion induced patterns for asingle-step enzymatic reaction
B.1. Linear instability analysis for enzyme interacting withsubstrate only
In this section, we perform the linear instability analysis of the PDE system (4.4) of Ch. 4to derive the condition for which patterns form for a single-step enzymatic reaction.For this system, we assume that only substrate gradients are affecting enzyme motion.We will include cross-diffusion caused by product gradients in Appendix B.3. As areminder, the starting model for our analysis (Eq. (4.4) of Ch. 4) is:
∂te(x, t) = ∂2x[De(s)e(x, t)] + ∂x[Ds
xd(s, e)∂xs(x, t)]
∂ts(x, t) = Ds∂2xs(x, t)− kcate(x, t)F(s)− γs(s− sR)
∂t p(x, t) = Dp∂2x p(x, t) + kcate(x, t)F(s)− γp p ,
(B.1)
where Dsxd(s, e) = −[Cs
f + (Csc − Cs
f )F(s)]e(x, t), with Csc/f = NAkBTλs 2
c/f/η, η is theviscosity of the fluid, kB the Boltzmann constant, NA the Avogadro number, T thetemperature and λs
c/f is the Derjaguin length [199, 162].
B.1.1. Homogeneous steady state solution
The homogeneous steady state solution vh = (eh, sh, ph) of (B.1) is given by the follow-ing expressions:
eh = γssR − sh
kcatF(sh), (B.2)
ph =kcatehF(sh)
γp, (B.3)
where eh, sh, and ph are the homogeneous concentrations of enzyme, substrate, andproduct respectively. In this work for simplicity we consider eh and ph as functions ofsh but it is also possible to write sh and ph in terms of eh, which is a quantity directly
105

B. Cross-diffusion induced patterns for a single-step enzymatic reaction
tunable in the experiments:
sh =12
sR − KM −kcat
γseh +
√(sR − KM −
kcat
γseh
)2
+ 4sRKM
, (B.4)
ph =γs
2γp
sR + KM +kcat
γseh −
√(sR − KM −
kcat
γseh
)2
+ 4sRKM
, (B.5)
which for KM � sh < sR become
sh = sR −kcat
γseh, (B.6)
andph =
kcat
γpeh. (B.7)
In Fig. B.1, we plot eh versus sh for both the exact and the approximated relation. Onecan use Fig. B.1 to read the enzyme concentration eh from the corresponding value ofthe substrate concentration sh.
9.0 · 105
1.0 · 106
1.1 · 106
101 102 103 104 105
kcat
γse h[µM
]
shKM
Exact
sh � KM
Figure B.1.: The relation between the homogeneous enzyme concentration eh and the homo-geneous substrate concentration sh. Exact curve is for Eqs. (B.2) or (B.4) and the curve forsh � KM is for Eq. (B.7). Parameters are sR = 106µM and KM = 1µM.
106

B. Cross-diffusion induced patterns for a single-step enzymatic reaction
B.1.2. Instability of the well-mixed system
We first study the instability of the solution for the well-mixed system. In the well-mixed system, the spatial derivatives and any spatial dependence of the concentrationsare neglected. The system of Eq. (B.1) becomes:
∂te(t) = 0
∂ts(t) = −kcate(t)F(s)− γs(s− sR)
∂t p(t) = kcate(t)F(s)− γp p .
(B.8)
The fixed-point of the system of Eq. (B.8) is still given by vh. To perform a linearinstability analysis, we perturb the system around its fixed point. Any perturbationaround vh can be written as e(t) = eh + δe(t), s(t) = sh + δs(t), p(t) = ph + δp(t)or alternatively v(t) = vh + δv(t) where δv(t) = (δe(t), δs(t), δp(t)). The amount ofenzymes in the system is fixed and does not change over time because ∂te(t) = 0, henceany perturbation δe(t) just shifts the total enzyme amount. The linearized system ofequations takes the form:
∂tδe(t) = 0
∂tδs(t) = −kcatehF′(sh)δs− kcatF(sh)δe(t)− γsδs(t)
∂tδp(t) = kcatehF′(sh)δs + kcatF(sh)δe(t)− γpδp(t) ,
(B.9)
where F′(sh) is the derivative of F(s) with respect to s at s = sh
F′(sh) =∂F(s)
∂s
∣∣∣∣s=sh
. (B.10)
We rewrite the linear system of equations (B.9) in matrix form
∂δv(t)∂t
= J0 · δv(t), (B.11)
where
J0 =
0 0 0−kcatF(sh) −kcatehF′(sh)− γs 0kcatF(sh) kcatehF′(sh) −γp
. (B.12)
The eigenvalues of J0 determine the fate of the perturbations. The eigenvalues areσ1 = 0, σ2 = −kcatehF′(sh) − γs and σ3 = −γp and all of them are non-positive.This indicates that the perturbations do not grow with time. σ1 = 0 corresponds tothe perturbation in the total enzyme amount. Once the total amount of enzymes is
107

B. Cross-diffusion induced patterns for a single-step enzymatic reaction
perturbed, its level does not change over time because ∂te(t) = 0. The other eigenvaluesare negative, i.e. any perturbations δs(t), δp(t) decay over time as long as F′(sh) > 0.Hence the homogeneous solution of a well-mixed system is stable against perturbationsfor any value of the parameters.
B.1.3. Instability of the reaction-diffusion system
Similar to the well-mixed system, we again study the dynamics of small perturba-tions around the homogeneous steady state solution but the perturbations are nowtemporally and spatially dependent: e(x, t) = eh + δe(x, t), s(x, t) = sh + δs(x, t),p(x, t) = ph + δp(x, t) or alternatively v(x, t) = vh + δv(x, t) where δv(x, t) =
(δe(x, t), δs(x, t), δp(x, t)). We insert the perturbed concentrations in Eq. (B.1) andlinearize the system by assuming that perturbations are small to find:
∂tδe(x, t) = De(sh)∂2xδe(x, t) +
[ehD′e(sh) + Ds
xd(sh, eh)]
∂2xδs(x, t)
∂tδs(x, t) = Ds∂2xδs(x, t)− kcatehF′(sh)δs− kcatF(sh)δe(x, t)− γsδs(x, t)
∂tδp(x, t) = Dp∂2xδp(x, t) + kcatehF′(sh)δs + kcatF(sh)δe(x, t)− γpδp(x, t) ,
(B.13)
where D′e(sh), F′(sh) are the derivatives of De(s), F(s) with respect to s at s = sh
D′e(sh) =∂De(s)
∂s
∣∣∣∣s=sh
, (B.14)
F′(sh) =∂F(s)
∂s
∣∣∣∣s=sh
. (B.15)
We write the linear system of Eq. (B.13) in Fourier space to partially diagonalize theequations. The result is that the dynamics of each Fourier mode is independent fromother modes and is governed by the following equation:
∂v(q, t)∂t
= J(q) · δv(q, t), (B.16)
where
δv(q, t) =
δe(q, t)δs(q, t)δp(q, t)
(B.17)
108
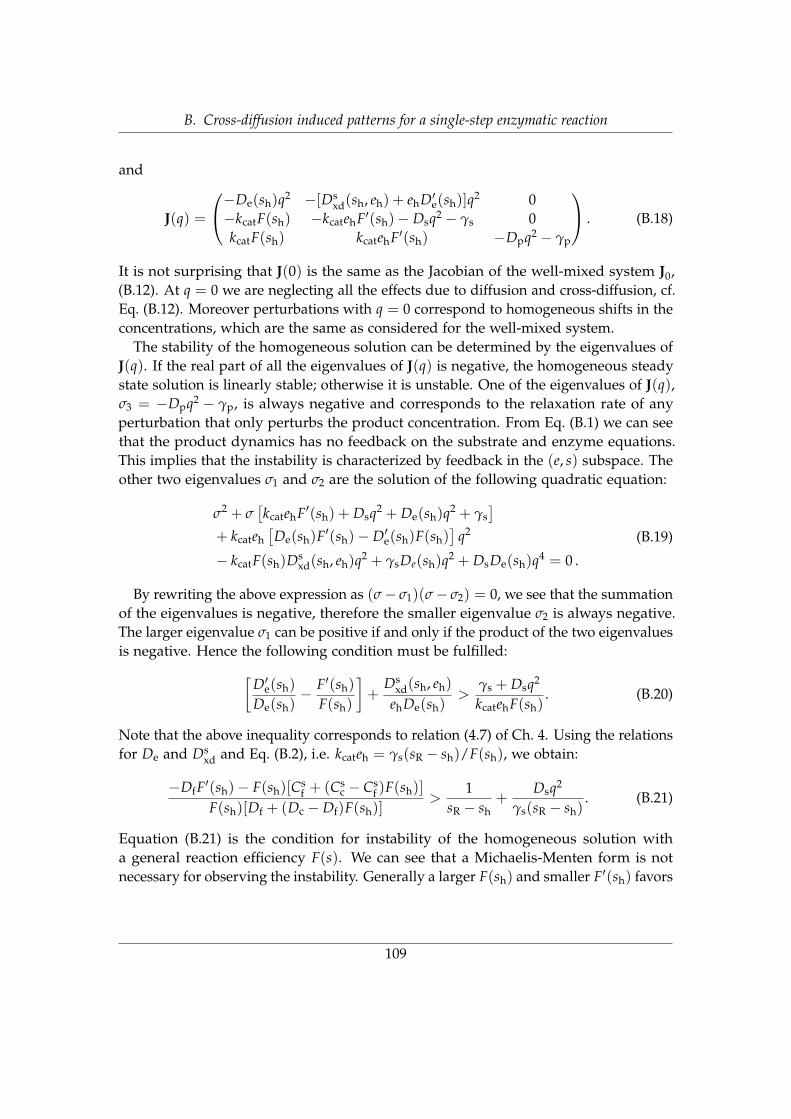
B. Cross-diffusion induced patterns for a single-step enzymatic reaction
and
J(q) =
−De(sh)q2 −[Dsxd(sh, eh) + ehD′e(sh)]q2 0
−kcatF(sh) −kcatehF′(sh)− Dsq2 − γs 0kcatF(sh) kcatehF′(sh) −Dpq2 − γp
. (B.18)
It is not surprising that J(0) is the same as the Jacobian of the well-mixed system J0,(B.12). At q = 0 we are neglecting all the effects due to diffusion and cross-diffusion, cf.Eq. (B.12). Moreover perturbations with q = 0 correspond to homogeneous shifts in theconcentrations, which are the same as considered for the well-mixed system.
The stability of the homogeneous solution can be determined by the eigenvalues ofJ(q). If the real part of all the eigenvalues of J(q) is negative, the homogeneous steadystate solution is linearly stable; otherwise it is unstable. One of the eigenvalues of J(q),σ3 = −Dpq2 − γp, is always negative and corresponds to the relaxation rate of anyperturbation that only perturbs the product concentration. From Eq. (B.1) we can seethat the product dynamics has no feedback on the substrate and enzyme equations.This implies that the instability is characterized by feedback in the (e, s) subspace. Theother two eigenvalues σ1 and σ2 are the solution of the following quadratic equation:
σ2 + σ[kcatehF′(sh) + Dsq2 + De(sh)q2 + γs
]+ kcateh
[De(sh)F′(sh)− D′e(sh)F(sh)
]q2
− kcatF(sh)Dsxd(sh, eh)q2 + γsDe(sh)q2 + DsDe(sh)q4 = 0 .
(B.19)
By rewriting the above expression as (σ− σ1)(σ− σ2) = 0, we see that the summationof the eigenvalues is negative, therefore the smaller eigenvalue σ2 is always negative.The larger eigenvalue σ1 can be positive if and only if the product of the two eigenvaluesis negative. Hence the following condition must be fulfilled:[
D′e(sh)
De(sh)− F′(sh)
F(sh)
]+
Dsxd(sh, eh)
ehDe(sh)>
γs + Dsq2
kcatehF(sh). (B.20)
Note that the above inequality corresponds to relation (4.7) of Ch. 4. Using the relationsfor De and Ds
xd and Eq. (B.2), i.e. kcateh = γs(sR − sh)/F(sh), we obtain:
−DfF′(sh)− F(sh)[Csf + (Cs
c − Csf )F(sh)]
F(sh)[Df + (Dc − Df)F(sh)]>
1sR − sh
+Dsq2
γs(sR − sh). (B.21)
Equation (B.21) is the condition for instability of the homogeneous solution witha general reaction efficiency F(s). We can see that a Michaelis-Menten form is notnecessary for observing the instability. Generally a larger F(sh) and smaller F′(sh) favors
109

B. Cross-diffusion induced patterns for a single-step enzymatic reaction
the instability, implying that weaker nonspecific interactions can generate instabilities.When F(sh) has a Michaelis-Menten form, a relatively strong repulsive interactionbetween substrate and enzyme can produce patterns even if sh . KM.
If we implement the Michaelis-Menten form of F(sh) in Eq. (B.21) we can find athreshold wave number q∗, for which any perturbation with smaller wave number(q < q∗) is unstable:
q∗2 = −γs[KMsRDf + s2
hDc + sh(sR − sh)(KMCsf + shCs
c)]
Dssh[KMDf + shDc]. (B.22)
In order to have a positive q∗2, it is required that
Df +
(sh
KM
)(sh
sR
)Dc +
sh
KM
(1− sh
sR
)(KMCs
f + shCsc) < 0. (B.23)
Equations (B.22) and (B.23) are the instability conditions for the system of equations (B.1)(Eq. (4.4) of the main text). In the regime sh � sR, with β = γssR, we get
0 < q < q∗ =
√−β
[KMDf + sh(KMCs
f + shCsc)]
Dssh[KMDf + shDc], (B.24)
Df + sh
(Cs
f +sh
KMCs
c
)< 0 , (B.25)
which are identical to relations (4.8) and (4.9) of the main text.By substituting Df = kBT/6πηRf, where Rf is the hydrodynamic radius of the
free enzyme, and Csc/f = NAkBTλs 2
c/f/η into relation (B.25), we obtain the analogousexpression:
16πNARf
KM
s2h
+KM
shλs 2
f + λs 2c < 0. (B.26)
In case λs 2c = λs 2
f , by rearranging, we obtain the inequality (4.10) of Ch. 4
λ2 < − 16πRfNA
KM
sh(sh + KM). (B.27)
To be able to see the patterns, the size of the system needs to be large enough toaccommodate Fourier modes with q < q∗. Alternatively, the minimum system size tosee patterns Lmin = 2π/q∗ can be obtained from Eq. (B.22):
Lmin = 2π
√− Dssh[KMDf + shDc]
γs[KMsRDf + s2
hDc + sh(sR − sh)(KMCsf + shCs
c)] , (B.28)
110

B. Cross-diffusion induced patterns for a single-step enzymatic reaction
where we considered the q∗ as given by Eq. (B.22). For the parameters given in Table B.1(the same used for the simulation shown in Fig. 4.3a of Ch. 4), Lmin = 59.2µm.
B.1.4. Instability type II
In this section we determine the type of instability for the system of Eq. (4.4). As canbe seen by looking at inequality (B.26), we need repulsive nonspecific interactions tohave an unstable system. Let us consider for example Cs
c < 0, then the inequality (B.26)is fulfilled when sh > s∗h where
s∗h =−KMλs 2
f −√
K2Mλs 4
f − 2KMλs 2c
3πRf NA
2λs 2c
. (B.29)
−0.05
−0.04
−0.03
−0.02
−0.01
0
0.01
0 0.02 0.04 0.06 0.08 0.1
σ1(1/s)
q(1/µm)
sh = 0.9s∗hsh = 1.0s∗hsh = 1.1s∗h
Figure B.2.: Largest eigenvalue of the Jacobian σ1 versus the wave vector q. The horizontalblack line corresponds to σ1 = 0. By increasing the initial homogeneous concentration ofsubstrate, sh, from below to above critical concentration, s∗h, the eigenvalues become positive.The shape of the eigenvalue curves indicates that the instability is of type II. The parametersfor the graph are T = 300K, Df = 10µm2 s−1, Dc = 13µm2 s−1, Ds = 100µm2 s−1, KM = 1µM,β = 106µM/s, λs 2
f = 1Å2, λs 2
c = −1Å2.
Fig. B.2 shows the largest eigenvalue of the linearized equations. When σ1 > 0, thesystem of equations is linearly unstable with respect to perturbations of the homoge-neous solution. Fig. B.2 indicates that the system becomes unstable by increasing shabove its critical value, s∗h, which is related indirectly to the initial amount of enzymesin the system. The form of curves in Fig. B.2 correspond to a type II instability [201].A type II instability is typical of systems with conserved quantities. In our case thetotal amount of enzymes is conserved, this implies that σ1 = 0 at q = 0, otherwise we
111

B. Cross-diffusion induced patterns for a single-step enzymatic reaction
would have homogeneous change in eh over time, corresponding to changes in the totalamount of enzymes.
B.1.5. Timescale of pattern formation
The timescale at which patterns form is determined by the inverse of the growth rate ofperturbations τσ = σ−1. From Eq. (B.19), we get:
σ = −12(kcatehF′(sh) + [Ds + De(sh)]q2 + γs
)+
12
√(kcatehF′(sh) + [Ds − De(sh)]q2 + γs)
2 + 4kcatF(sh)(Dsxd + ehD′e(sh))q2 .
(B.30)
For simplicity we focus on the saturated regime where sh � KM, F(sh) ≈ 1, F′(sh) ≈ 0,and D′e(sh) ≈ 0:
σ = −12([Ds + Dc]q2 + γs
)+
12
√([Ds − Dc]q2 + γs)
2 + 4kcatDsxdq2 . (B.31)
The wave number for a box with size L = 100µm is q ≈ 0.1µm−1 . According to theparameters in Table B.1, the timescale of the increase of the perturbations is found tobe τσ = σ−1 ≈ 120s. However this is the timescale associated to a linear response. Asperturbations grow, the nonlinear effects become more and more important. This is thereason why the system in Fig. 4.3a of Ch. 4 reaches the steady state after 103s.
B.2. No short-range interactions
In this section we consider Dsxd(s, e) = 0. Substituting this assumption into Eq. (B.20)
and using Eq. (B.2), i.e. kcateh = γs(sR − sh)/F(sh), we get:[D′e(sh)
De(sh)− F′(sh)
F(sh)
]>
1sR − sh
+Dsq2
γs(sR − sh). (B.32)
In the regime sh � sR, with β = γssR, we get:[D′e(sh)
De(sh)− F′(sh)
F(sh)
]>
Dsq2
β, (B.33)
which is the same as the inequality (4.12) of Ch. 4. We use the relation (B.33) in thefollowing subsections to show the possibility of pattern formation for three differentfunctional forms of De(sh).
112

B. Cross-diffusion induced patterns for a single-step enzymatic reaction
B.2.1. Michaelis Menten form
By using the definition of De(s) used by Agudo-Canalejo et al. [162], De = Df + (Dc −Df)F(s), we find that the inequality (B.32) takes the form:
− DfF′(sh)
De(sh)F(sh)(sR − sh) > 1 +
Dsq2
γs. (B.34)
Because sh < sR and F′(sh) > 0, the left hand side of the inequality above is negativeand cannot be larger than the always positive right hand side. Therefore enhanceddiffusion alone cannot drive instabilities. The cross-diffusion generated by repulsiveinteractions is key in this respect. This also holds in the simpler case of sh � sR, withβ = γssR.
Similarly it is possible to show that we cannot have instabilities for other enhanceddiffusion definitions [142, 152].
B.2.2. Hill function
A Hill function for De(s) has been considered to model enhanced diffusion in syntheticbacterial populations [204]. Here we show that condition (B.33) can be satisfied whenDe(s) is a Hill function:
De(s) = Df + (Dc − Df)sn
sn + KnM
. (B.35)
By substituting this form of De(s) in (B.33), one can show that the instability is possiblewith n > 1 under the following condition:
n(Dc − Df)
[(sh
KM
)n+(
shKM
)n+1]
Dc
(sh
KM
)2n+ (Df + Dc)
(sh
KM
)n+ Df
− 1 >Dsq2
βs(1 +
sKM
). (B.36)
For example at sh = KM we find that for the instability
0 < q < q∗ =
√β
2DsKM
√n(Dc − Df)
Dc + Df− 1, (B.37)
Dc >n + 1n− 1
Df, (B.38)
113

B. Cross-diffusion induced patterns for a single-step enzymatic reaction
which means that the closer n is to one, the larger Dc is required to be. In the limit ofthe Michaelis-Menten function (n→ 1), the condition leads to Dc → ∞.
B.2.3. Different affinity constant
Another possible form of enhanced diffusion is assuming the Michaelis-Menten functionwith a different constant, Kd, i.e. De(s) = Df +(Dc−Df)G(s), where G(s) = s/(s+Kd).To obtain the condition for instability in the strong depletion regime, we substitute thisform of De(s) in (B.33) and find
−0.01
−0.008
−0.006
−0.004
−0.002
0
0.002
10 15 20 25 30 35 40 45 50
InstabilityMeasu
re
sh/KM
KD/KM = 0.1
KD/KM = 1
KD/KM = 10
Figure B.3.: Instability measure as a function of sh/KM. Instability measure or the left handside of inequality (B.40) versus sh/KM. The parameters for the graph are Df = 10µm2 s−1,Dc = 13µm2 s−1.
0 < q < q∗ =
√β
Ds
KdDf
(Dc−Df)(sh + Kd)2 + (sh + Kd)sh
− KM
sh(sh + KM)
12
, (B.39)
Kd/KM
Df(Dc−Df)
(sh
KM+ Kd
KM
)2+ sh
KM
(sh
KM+ Kd
KM
) − 1sh
KM
(sh
KM+ 1) > 0 . (B.40)
We define the left hand side of inequality (B.40) as “instability measure”. Fig. B.3shows how the Instability Measure changes with respect to sh/KM for different ratios ofKd/KM. We see that for large enough Kd/KM it is possible to fulfill the above condition.Larger Kd/KM means slower saturation of De(sh) compared to F(sh) or alternativelyDe(sh) is more sensitive than F(sh) to perturbations in the substrate concentration.Interestingly it is also possible to observe instabilities in a regime where both De(s)
114

B. Cross-diffusion induced patterns for a single-step enzymatic reaction
and F(s) are saturated, i.e. for sh � Kd > KM. In this limit the instability measure canbe approximated with
(Dc−Df
Dc
)KdKM− 1 > 0. From this approximated relation we see
that for the instability we must have
Kd
KM>
Dc
Dc − Df. (B.41)
B.3. Cross-diffusion of enzyme by product gradients
Here we add a cross diffusion term for enzymes in response to product gradients inEq. (B.1).
∂te(x, t) = ∂2x[De(s)e(x, t)] + ∂x[Ds
xd(s, e)∂xs(x, t)] + ∂x[Dpxd(s, e)∂x p(x, t)]
∂ts(x, t) = Ds∂2xs(x, t)− kcate(x, t)F(s)− γs(s− sR)
∂t p(x, t) = Dp∂2x p(x, t) + kcate(x, t)F(s)− γp p
, (B.42)
where Dpxd(s, e) = −[Cp
f + (Cpc − Cp
f )F(s)]e(x, t), with Cpc/f = NAkBTλ
p 2c/f/η, where λ
pc/f
is the Derjaguin length of the interaction between enzyme and product.The corresponding Jacobian of the linearized equations is the following:
J(q) =
−De(sh)q2 −[Dsxd(sh, eh) + ehD′e(sh)]q2 −Dp
xd(sh, eh)q2
−kcatF(sh) −kcatehF′(sh)− Dsq2 − γs 0kcatF(sh) kcatehF′(sh) −Dpq2 − γp
, (B.43)
and the eigenvalue equation of the Jacobian is:
σ3 + σ2 [(De + Ds + Dp)q2 + γs + γp + kcatehF′(sh)]
σ[− kcatF(sh)q2(Ds
xd − Dpxd + ehD′e(sh)) + kcatehF′(sh)(Deq2 + Dpq2 + γp)
+ Deq2(Dsq2 + Dpq2 + γs + γp) + (Dpq2 + γp)(Dsq2 + γs)]
− (Dpq2 + γp)[kcatFq2(Ds
xd + ehD′e)− Deq2(kcatehF′ + Dsq2 + γs)]
+ kcatFDpxdq2(Dsq2 + γs) = 0 .
(B.44)
According to the sign of the coefficients in the above polynomial only two scenariosfor the roots are possible. (i) All roots are negative, (ii) two roots are negative and oneis positive. Therefore the product of the three roots can be negative (i) or positive (ii).If we rewrite Eq. (B.44) as (σ− σ1)(σ− σ2)(σ− σ3) then we see that the zeroth orderterm (the term without σ) in Eq. (B.44) is equal to −σ1σ2σ3. Therefore the sign of this
115

B. Cross-diffusion induced patterns for a single-step enzymatic reaction
term determines whether the homogeneous solution is positive or negative:[D′e(sh)
De(sh)− F′(sh)
F(sh)
]+
Dsxd(sh, eh)
ehDe(sh)−[
γs + Dsq2
γp + Dpq2
]Dp
xd(sh, eh)
ehDe(sh)>
γs + Dsq2
kcatehF(sh). (B.45)
The inequality (B.45) corresponds to relation 4.14 of Ch. 4 and it is similar to theinequality (B.20) but with a correction due to the product-induced cross-diffusion.Consequently if Dp
xd = 0, relation (B.45) is the same as relation (B.20). The effect ofproduct interaction on the inequality reduces when γp increases.
B.4. Simulation parameters
The numerical simulations of the system of Eq. (4.4) have been carried out using COM-SOL Multiphysics v5.3. We used the parameters listed in Table B.1 for the simulationsshown in Fig. 4.3. We used λs 2
f = λs 2c = −1 Å
2for the unstable homogeneous solution
(Fig. 4.3a) and λs 2f = λs 2
c = 1 Å2
for the stable homogeneous solution (Fig. 4.3b). Theinitial homogeneous concentrations eh, sh, ph were perturbed by adding white Gaussiannoise with variance eh · 10−2, sh · 10−2, ph · 10−2 respectively. We considered periodicboundary conditions and used the “time dependent” solver of COMSOL with a relativetolerance of 10−6 and an element size of 0.01 µm, i.e. 104 lattice points.
For the results shown in Fig. 4.4 we again used the “time dependent” solver ofCOMSOL. We considered a grid of 20× 20 values for λs 2
c = λs 2f = λ2 in the interval
[−10, 3]Å2
(evenly spaced), and sh in [101, 105]µM (evenly spaced on a log-scale). Forthe COMSOL specific parameters, we used a relative tolerance of 10−6 and a maximumelement size of 0.02 µm, except when two peaks were observed as a final result of thesimulation. In these cases, we repeated the simulations with a finer grid (element sizeof 0.01 µm) and again observed a single peak for the concentrations as the final result ofthe simulations. All other parameters were the same as in Table B.1 and the boundaryconditions were periodic.
For the simulations shown in Fig. 4.6 we modified the dynamics of the enzyme,following Eq. (4.13). We then considered the same simulation parameters as shown inTable B.1, the same COMSOL specific parameters used for the simulations depicted inFig. 4.3 and we considered the λp values shown in Fig. 4.6.
116
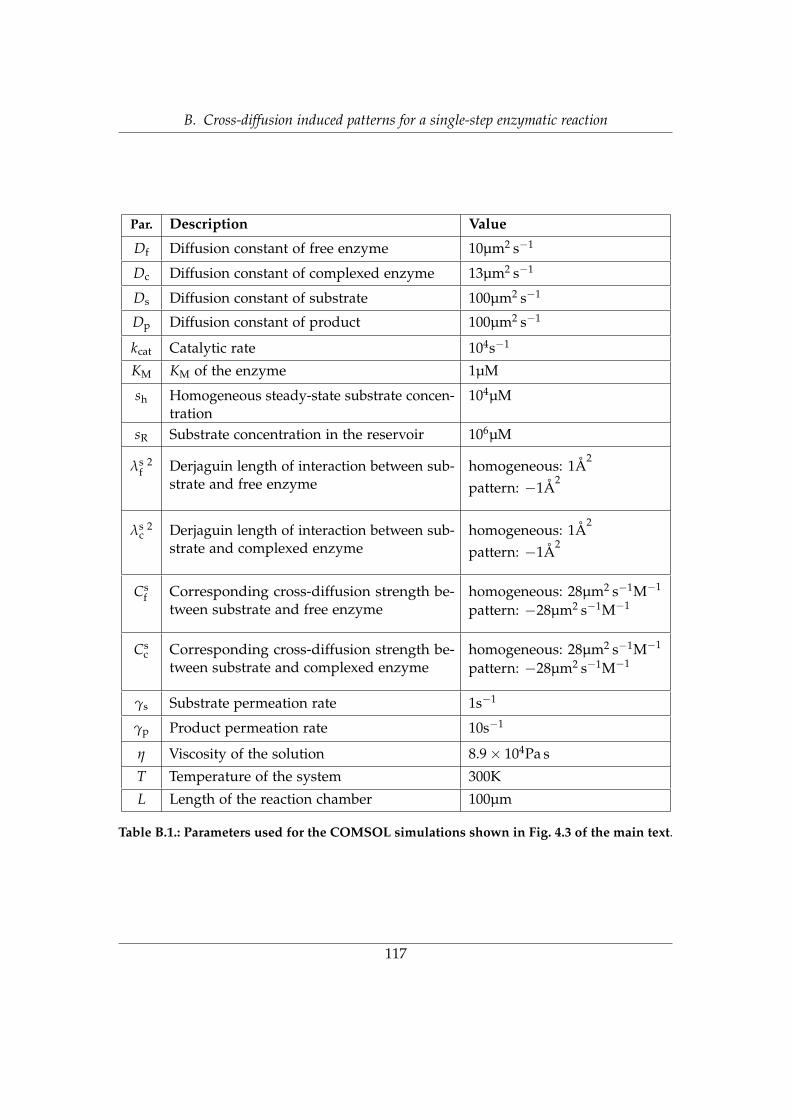
B. Cross-diffusion induced patterns for a single-step enzymatic reaction
Par. Description Value
Df Diffusion constant of free enzyme 10µm2 s−1
Dc Diffusion constant of complexed enzyme 13µm2 s−1
Ds Diffusion constant of substrate 100µm2 s−1
Dp Diffusion constant of product 100µm2 s−1
kcat Catalytic rate 104s−1
KM KM of the enzyme 1µM
sh Homogeneous steady-state substrate concen-tration
104µM
sR Substrate concentration in the reservoir 106µM
λs 2f Derjaguin length of interaction between sub-
strate and free enzymehomogeneous: 1Å
2
pattern: −1Å2
λs 2c Derjaguin length of interaction between sub-
strate and complexed enzymehomogeneous: 1Å
2
pattern: −1Å2
Csf Corresponding cross-diffusion strength be-
tween substrate and free enzymehomogeneous: 28µm2 s−1M−1
pattern: −28µm2 s−1M−1
Csc Corresponding cross-diffusion strength be-
tween substrate and complexed enzymehomogeneous: 28µm2 s−1M−1
pattern: −28µm2 s−1M−1
γs Substrate permeation rate 1s−1
γp Product permeation rate 10s−1
η Viscosity of the solution 8.9× 10⁴Pa s
T Temperature of the system 300K
L Length of the reaction chamber 100µm
Table B.1.: Parameters used for the COMSOL simulations shown in Fig. 4.3 of the main text.
117
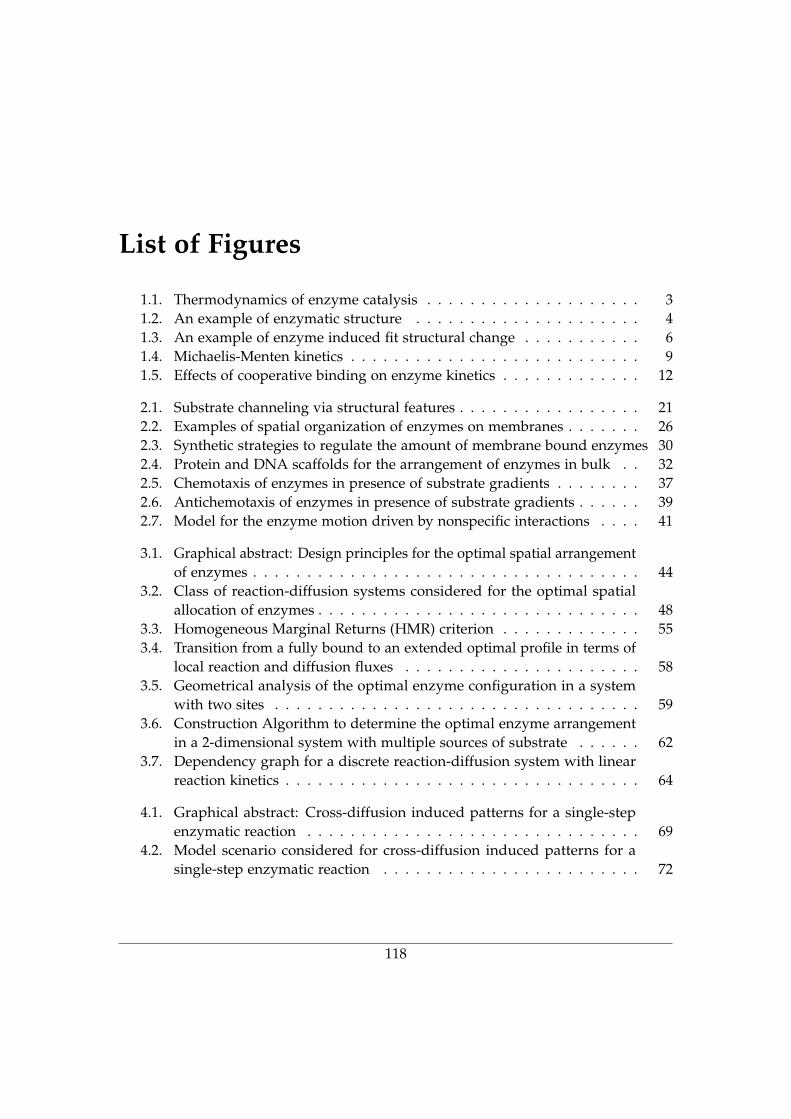
List of Figures
1.1. Thermodynamics of enzyme catalysis . . . . . . . . . . . . . . . . . . . . 31.2. An example of enzymatic structure . . . . . . . . . . . . . . . . . . . . . 41.3. An example of enzyme induced fit structural change . . . . . . . . . . . 61.4. Michaelis-Menten kinetics . . . . . . . . . . . . . . . . . . . . . . . . . . . 91.5. Effects of cooperative binding on enzyme kinetics . . . . . . . . . . . . . 12
2.1. Substrate channeling via structural features . . . . . . . . . . . . . . . . . 212.2. Examples of spatial organization of enzymes on membranes . . . . . . . 262.3. Synthetic strategies to regulate the amount of membrane bound enzymes 302.4. Protein and DNA scaffolds for the arrangement of enzymes in bulk . . 322.5. Chemotaxis of enzymes in presence of substrate gradients . . . . . . . . 372.6. Antichemotaxis of enzymes in presence of substrate gradients . . . . . . 392.7. Model for the enzyme motion driven by nonspecific interactions . . . . 41
3.1. Graphical abstract: Design principles for the optimal spatial arrangementof enzymes . . . . . . . . . . . . . . . . . . . . . . . . . . . . . . . . . . . . 44
3.2. Class of reaction-diffusion systems considered for the optimal spatialallocation of enzymes . . . . . . . . . . . . . . . . . . . . . . . . . . . . . . 48
3.3. Homogeneous Marginal Returns (HMR) criterion . . . . . . . . . . . . . 553.4. Transition from a fully bound to an extended optimal profile in terms of
local reaction and diffusion fluxes . . . . . . . . . . . . . . . . . . . . . . 583.5. Geometrical analysis of the optimal enzyme configuration in a system
with two sites . . . . . . . . . . . . . . . . . . . . . . . . . . . . . . . . . . 593.6. Construction Algorithm to determine the optimal enzyme arrangement
in a 2-dimensional system with multiple sources of substrate . . . . . . 623.7. Dependency graph for a discrete reaction-diffusion system with linear
reaction kinetics . . . . . . . . . . . . . . . . . . . . . . . . . . . . . . . . . 64
4.1. Graphical abstract: Cross-diffusion induced patterns for a single-stepenzymatic reaction . . . . . . . . . . . . . . . . . . . . . . . . . . . . . . . 69
4.2. Model scenario considered for cross-diffusion induced patterns for asingle-step enzymatic reaction . . . . . . . . . . . . . . . . . . . . . . . . 72
118

List of Figures
4.3. Pattern formation for varying nonspecific interaction between substrateand enzyme . . . . . . . . . . . . . . . . . . . . . . . . . . . . . . . . . . . 75
4.4. Phase diagram of pattern formation . . . . . . . . . . . . . . . . . . . . . 774.5. Positive feedback mechanism behind the pattern forming process . . . . 794.6. Pattern formation for varying nonspecific interaction between product
and enzyme . . . . . . . . . . . . . . . . . . . . . . . . . . . . . . . . . . . 82
A.1. Transitions in the optimal enzyme arrangement for a one-dimensionalsystem with two sources of substrate . . . . . . . . . . . . . . . . . . . . 100
B.1. The relation between the homogeneous enzyme concentration eh and thehomogeneous substrate concentration sh . . . . . . . . . . . . . . . . . . 106
B.2. Largest eigenvalue of the Jacobian σ1 versus the wave vector q . . . . . 111B.3. Instability measure as a function of sh/KM . . . . . . . . . . . . . . . . . 114
119

List of Tables
A.1. Optimal enzyme distribution and corresponding substrate profile andflux for a one-dimensional system . . . . . . . . . . . . . . . . . . . . . . 95
B.1. Parameters used for the COMSOL simulations shown in Fig. 4.3 of themain text . . . . . . . . . . . . . . . . . . . . . . . . . . . . . . . . . . . . . 117
120

Bibliography
[1] W. Kühne. “Über das Verhalten verschiedener organisirter und sog. ungeformterFermente.” In: Verhandlungen des Naturhistorisch-medicinischen Vereins zu Heidel-berg 1 (Feb. 4, 1874), (3):333–369.
[2] E. Buchner. “Alkoholische Gärung ohne Hefezellen.” In: Berichte der deutschenchemischen Gesellschaft 30.1 (Jan. 1, 1897), pp. 1110–1113. issn: 0365-9496. doi:10.1002/cber.189703001215.
[3] J. B. Sumner. “The Isolation and Crystallization of the Enzyme Urease Prelimi-nary Paper.” In: Journal of Biological Chemistry 69.2 (Aug. 1, 1926), pp. 435–441.issn: 0021-9258, 1083-351X.
[4] J. H. Northrop. “Crystalline Pepsin.” In: Science 69.1796 (May 31, 1929), pp. 580–580. issn: 0036-8075, 1095-9203. doi: 10.1126/science.69.1796.580.
[5] J. H. Northrop. “The Preparation of Pure Enzymes and Virus Proteins.” In: NobelLecture (Dec. 12, 1946).
[6] B. C. Stark, R. Kole, E. J. Bowman, and S. Altman. “Ribonuclease P: an enzymewith an essential RNA component.” In: Proceedings of the National Academy ofSciences 75.8 (Aug. 1, 1978), pp. 3717–3721. issn: 0027-8424, 1091-6490. doi:10.1073/pnas.75.8.3717.
[7] K. Kruger, P. J. Grabowski, A. J. Zaug, J. Sands, D. E. Gottschling, and T. R. Cech.“Self-splicing RNA: Autoexcision and autocyclization of the ribosomal RNAintervening sequence of tetrahymena.” In: Cell 31.1 (Nov. 1, 1982), pp. 147–157.issn: 0092-8674, 1097-4172. doi: 10.1016/0092-8674(82)90414-7.
[8] W. Gilbert. “Origin of life: The RNA world.” In: nature 319.6055 (1986), pp. 618–618.
[9] G. M. Cooper. “The Central Role of Enzymes as Biological Catalysts.” In: TheCell: A Molecular Approach. 2nd. Sinauer Associates, 2000. isbn: 978-0-87893-106-4.
[10] J. M. Berg, J. L. Tymoczko, and L. Stryer. “Free Energy Is a Useful Thermody-namic Function for Understanding Enzymes.” In: Biochemistry. 5th edition. 5th.W. H. Freeman, 2002.
121

Bibliography
[11] J. M. Berg, J. L. Tymoczko, and L. Stryer. “Enzymes Accelerate Reactions byFacilitating the Formation of the Transition State.” In: Biochemistry. 5th edition.5th. W. H. Freeman, 2002.
[12] R. Wolfenden and M. J. Snider. “The Depth of Chemical Time and the Powerof Enzymes as Catalysts.” In: Accounts of Chemical Research 34.12 (Dec. 1, 2001),pp. 938–945. issn: 0001-4842. doi: 10.1021/ar000058i.
[13] S. Lindskog. “Structure and mechanism of carbonic anhydrase.” In: Pharmacology& Therapeutics 74.1 (Jan. 1, 1997), pp. 1–20. issn: 0163-7258. doi: 10.1016/S0163-7258(96)00198-2.
[14] L. H. Chen, G. L. Kenyon, F. Curtin, S. Harayama, M. E. Bembenek, G. Hajipour,and C. P. Whitman. “4-Oxalocrotonate tautomerase, an enzyme composed of 62amino acid residues per monomer.” In: The Journal of Biological Chemistry 267.25(Sept. 5, 1992), pp. 17716–17721. issn: 0021-9258.
[15] C. P. Whitman. “The 4-oxalocrotonate tautomerase family of enzymes: hownature makes new enzymes using a β–α–β structural motif.” In: Archives ofBiochemistry and Biophysics 402.1 (June 1, 2002), pp. 1–13. issn: 0003-9861. doi:10.1016/S0003-9861(02)00052-8.
[16] J. A. Kelly, A. R. Sielecki, B. D. Sykes, M. N. James, and D. C. Phillips. “X-raycrystallography of the binding of the bacterial cell wall trisaccharide NAM-NAG-NAM to lysozyme.” In: Nature 282.5741 (Dec. 20, 1979), pp. 875–878. issn:0028-0836. doi: 10.1038/282875a0.
[17] J. M. Berg, J. L. Tymoczko, and L. Stryer. “Enzymes Are Powerful and HighlySpecific Catalysts.” In: Biochemistry. 5th edition. 5th. W. H. Freeman, 2002.
[18] E. Fischer. “Einfluss der Configuration auf die Wirkung der Enzyme.” In: Berichteder deutschen chemischen Gesellschaft 27.3 (Oct. 1, 1894), pp. 2985–2993. issn: 0365-9496. doi: 10.1002/cber.18940270364.
[19] D. E. Koshland. “Application of a Theory of Enzyme Specificity to ProteinSynthesis.” In: Proceedings of the National Academy of Sciences 44.2 (Feb. 1, 1958),pp. 98–104. issn: 0027-8424, 1091-6490. doi: 10.1073/pnas.44.2.98.
[20] Y. Savir and T. Tlusty. “Conformational Proofreading: The Impact of Conforma-tional Changes on the Specificity of Molecular Recognition.” In: PLOS ONE 2.5(May 23, 2007), e468. issn: 1932-6203. doi: 10.1371/journal.pone.0000468.
122

Bibliography
[21] H. Nishimasu, S. Fushinobu, H. Shoun, and T. Wakagi. “Crystal Structuresof an ATP-dependent Hexokinase with Broad Substrate Specificity from theHyperthermophilic Archaeon Sulfolobus tokodaii.” In: Journal of Biological Chem-istry 282.13 (Mar. 30, 2007), pp. 9923–9931. issn: 0021-9258, 1083-351X. doi:10.1074/jbc.M610678200.
[22] F. Zeller and M. Zacharias. “Substrate Binding Specifically Modulates DomainArrangements in Adenylate Kinase.” English. In: Biophysical Journal 109.9 (Nov.2015), pp. 1978–1985. issn: 0006-3495. doi: 10.1016/j.bpj.2015.08.049.
[23] B. Pelz, G. Žoldák, F. Zeller, M. Zacharias, and M. Rief. “Subnanometre enzymemechanics probed by single-molecule force spectroscopy.” en. In: Nature Commu-nications 7.1 (Feb. 2016), p. 10848. issn: 2041-1723. doi: 10.1038/ncomms10848.
[24] A. Warshel, P. K. Sharma, M. Kato, Y. Xiang, H. Liu, and M. H. M. Olsson.“Electrostatic Basis for Enzyme Catalysis.” In: Chemical Reviews 106.8 (Aug. 1,2006), pp. 3210–3235. issn: 0009-2665. doi: 10.1021/cr0503106.
[25] A. Cornish-Bowden. Fundamentals of Enzyme Kinetics. John Wiley & Sons, Feb. 22,2013. 609 pp. isbn: 978-3-527-66549-5.
[26] L. Michaelis and M. L. Menten. “Die kinetik der invertinwirkung.” In: Biochemis-che Zeitschrift 49 (Feb. 4, 1913), pp. 333–369.
[27] C. M. Guldberg and P. Waage. Etudes sur les affinités chimiques. Brøgger & Christie,1867.
[28] G. E. Briggs and J. B. S. Haldane. “A Note on the Kinetics of Enzyme Action.”In: Biochemical Journal 19.2 (1925), pp. 338–339. issn: 0264-6021.
[29] J. M. Berg, J. L. Tymoczko, and L. Stryer. “The Michaelis-Menten Model Accountsfor the Kinetic Properties of Many Enzymes.” In: Biochemistry. 5th edition. 5th. W.H. Freeman, 2002.
[30] A. Bar-Even, E. Noor, Y. Savir, W. Liebermeister, D. Davidi, D. S. Tawfik, andR. Milo. “The Moderately Efficient Enzyme: Evolutionary and PhysicochemicalTrends Shaping Enzyme Parameters.” In: Biochemistry 50.21 (May 31, 2011),pp. 4402–4410. issn: 0006-2960. doi: 10.1021/bi2002289.
[31] H. P. Lu, L. Xun, and X. S. Xie. “Single-Molecule Enzymatic Dynamics.” en.In: Science 282.5395 (Dec. 1998), pp. 1877–1882. issn: 0036-8075, 1095-9203. doi:10.1126/science.282.5395.1877.
[32] B. P. English, W. Min, A. M. van Oijen, K. T. Lee, G. Luo, H. Sun, B. J. Cherayil,S. C. Kou, and X. S. Xie. “Ever-fluctuating single enzyme molecules: Michaelis-Menten equation revisited.” en. In: Nature Chemical Biology 2.2 (Feb. 2006), pp. 87–94. issn: 1552-4469. doi: 10.1038/nchembio759.
123

Bibliography
[33] R. Benesch and R. E. Benesch. “The effect of organic phosphates from thehuman erythrocyte on the allosteric properties of hemoglobin.” In: Biochemicaland Biophysical Research Communications 26.2 (Jan. 23, 1967), pp. 162–167. issn:0006-291X. doi: 10.1016/0006-291X(67)90228-8.
[34] J. Monod, J.-P. Changeux, and F. Jacob. “Allosteric proteins and cellular controlsystems.” In: Journal of Molecular Biology 6.4 (Apr. 1, 1963), pp. 306–329. issn:0022-2836. doi: 10.1016/S0022-2836(63)80091-1.
[35] A. V. Hill. “The possible effects of the aggregation of the molecules ofhaemoglobin on its dissociation curves.” In: The Journal of Physiology 40 (1910),pp. 4–7. doi: 10.1113/jphysiol.1910.sp001386.
[36] S. J. Pollack, J. R. Atack, M. R. Knowles, G. McAllister, C. I. Ragan, R. Baker,S. R. Fletcher, L. L. Iversen, and H. B. Broughton. “Mechanism of inositolmonophosphatase, the putative target of lithium therapy.” In: Proceedings of theNational Academy of Sciences 91.13 (June 21, 1994), p. 5766. doi: 10.1073/pnas.91.13.5766.
[37] E. M. Wise and J. T. Park. “Penicillin: its basic site of action as an inhibitor of apeptide cross-linking reaction in cell wall mucopeptide synthesis.” In: Proceedingsof the National Academy of Sciences 54.1 (July 1, 1965), pp. 75–81. issn: 0027-8424,1091-6490. doi: 10.1073/pnas.54.1.75.
[38] A. Einstein. “Über die von der molekularkinetischen Theorie der Wärmegeforderte Bewegung von in ruhenden Flüssigkeiten suspendierten Teilchen.”en. In: Annalen der Physik 322.8 (1905), pp. 549–560. issn: 1521-3889. doi:10.1002/andp.19053220806.
[39] M. v. Smoluchowski. “Versuch einer mathematischen Theorie der Koagulationsk-inetik kolloider Lösungen.” In: Zeitschrift für Physikalische Chemie 92U.1 (Nov. 1,1918), pp. 129–168. issn: 2196-7156, 0942-9352. doi: 10.1515/zpch-1918-9209.
[40] F. C. Collins and G. E. Kimball. “Diffusion-controlled reaction rates.” In: Journal ofColloid Science 4.4 (Aug. 1, 1949), pp. 425–437. issn: 0095-8522. doi: 10.1016/0095-8522(49)90023-9.
[41] J. M. Schurr. “The Role of Diffusion in Bimolecular Solution Kinetics.” In:Biophysical Journal 10.8 (Aug. 1, 1970), pp. 700–716. issn: 0006-3495. doi: 10.1016/S0006-3495(70)86330-5.
[42] D. Shoup and A. Szabo. “Role of diffusion in ligand binding to macromoleculesand cell-bound receptors.” In: Biophysical Journal 40.1 (Oct. 1, 1982), pp. 33–39.issn: 0006-3495. doi: 10.1016/S0006-3495(82)84455-X.
124
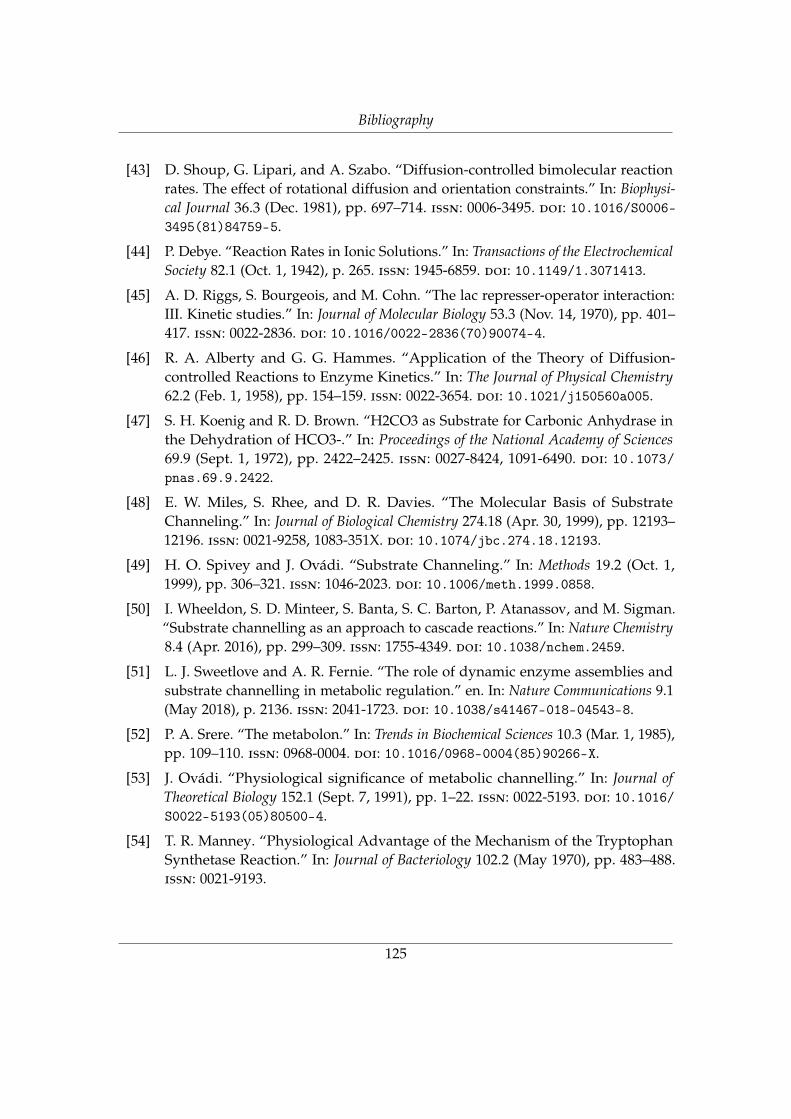
Bibliography
[43] D. Shoup, G. Lipari, and A. Szabo. “Diffusion-controlled bimolecular reactionrates. The effect of rotational diffusion and orientation constraints.” In: Biophysi-cal Journal 36.3 (Dec. 1981), pp. 697–714. issn: 0006-3495. doi: 10.1016/S0006-3495(81)84759-5.
[44] P. Debye. “Reaction Rates in Ionic Solutions.” In: Transactions of the ElectrochemicalSociety 82.1 (Oct. 1, 1942), p. 265. issn: 1945-6859. doi: 10.1149/1.3071413.
[45] A. D. Riggs, S. Bourgeois, and M. Cohn. “The lac represser-operator interaction:III. Kinetic studies.” In: Journal of Molecular Biology 53.3 (Nov. 14, 1970), pp. 401–417. issn: 0022-2836. doi: 10.1016/0022-2836(70)90074-4.
[46] R. A. Alberty and G. G. Hammes. “Application of the Theory of Diffusion-controlled Reactions to Enzyme Kinetics.” In: The Journal of Physical Chemistry62.2 (Feb. 1, 1958), pp. 154–159. issn: 0022-3654. doi: 10.1021/j150560a005.
[47] S. H. Koenig and R. D. Brown. “H2CO3 as Substrate for Carbonic Anhydrase inthe Dehydration of HCO3-.” In: Proceedings of the National Academy of Sciences69.9 (Sept. 1, 1972), pp. 2422–2425. issn: 0027-8424, 1091-6490. doi: 10.1073/pnas.69.9.2422.
[48] E. W. Miles, S. Rhee, and D. R. Davies. “The Molecular Basis of SubstrateChanneling.” In: Journal of Biological Chemistry 274.18 (Apr. 30, 1999), pp. 12193–12196. issn: 0021-9258, 1083-351X. doi: 10.1074/jbc.274.18.12193.
[49] H. O. Spivey and J. Ovádi. “Substrate Channeling.” In: Methods 19.2 (Oct. 1,1999), pp. 306–321. issn: 1046-2023. doi: 10.1006/meth.1999.0858.
[50] I. Wheeldon, S. D. Minteer, S. Banta, S. C. Barton, P. Atanassov, and M. Sigman.“Substrate channelling as an approach to cascade reactions.” In: Nature Chemistry8.4 (Apr. 2016), pp. 299–309. issn: 1755-4349. doi: 10.1038/nchem.2459.
[51] L. J. Sweetlove and A. R. Fernie. “The role of dynamic enzyme assemblies andsubstrate channelling in metabolic regulation.” en. In: Nature Communications 9.1(May 2018), p. 2136. issn: 2041-1723. doi: 10.1038/s41467-018-04543-8.
[52] P. A. Srere. “The metabolon.” In: Trends in Biochemical Sciences 10.3 (Mar. 1, 1985),pp. 109–110. issn: 0968-0004. doi: 10.1016/0968-0004(85)90266-X.
[53] J. Ovádi. “Physiological significance of metabolic channelling.” In: Journal ofTheoretical Biology 152.1 (Sept. 7, 1991), pp. 1–22. issn: 0022-5193. doi: 10.1016/S0022-5193(05)80500-4.
[54] T. R. Manney. “Physiological Advantage of the Mechanism of the TryptophanSynthetase Reaction.” In: Journal of Bacteriology 102.2 (May 1970), pp. 483–488.issn: 0021-9193.
125

Bibliography
[55] B. D. Davis. “On the importance of being ionized.” In: Archives of Biochemistry andBiophysics 78.2 (Dec. 1, 1958), pp. 497–509. issn: 0003-9861. doi: 10.1016/0003-9861(58)90374-6.
[56] J. M. Krahn, J. H. Kim, M. R. Burns, R. J. Parry, H. Zalkin, and J. L. Smith.“Coupled Formation of an Amidotransferase Interdomain Ammonia Channeland a Phosphoribosyltransferase Active Site,” in: Biochemistry 36.37 (Sept. 1,1997), pp. 11061–11068. issn: 0006-2960. doi: 10.1021/bi9714114.
[57] E. M. Sampson and T. A. Bobik. “Microcompartments for B12-dependent 1,2-propanediol degradation provide protection from DNA and cellular damage bya reactive metabolic intermediate.” In: Journal of Bacteriology 190.8 (Apr. 2008),pp. 2966–2971. issn: 1098-5530. doi: 10.1128/JB.01925-07.
[58] E. L. Maynard and P. A. Lindahl. “Catalytic Coupling of the Active Sites inAcetyl-CoA Synthase, a Bifunctional CO-Channeling Enzyme.” In: Biochemistry40.44 (Nov. 1, 2001), pp. 13262–13267. issn: 0006-2960. doi: 10.1021/bi015604+.
[59] M. Castellana, M. Z. Wilson, Y. Xu, P. Joshi, I. M. Cristea, J. D. Rabinowitz,Z. Gitai, and N. S. Wingreen. “Enzyme clustering accelerates processing ofintermediates through metabolic channeling.” In: Nature Biotechnology 32.10 (Oct.2014), pp. 1011–1018. issn: 1546-1696. doi: 10.1038/nbt.3018.
[60] F. Wu and S. Minteer. “Krebs Cycle Metabolon: Structural Evidence of SubstrateChanneling Revealed by Cross-Linking and Mass Spectrometry.” In: AngewandteChemie International Edition 54.6 (2015), pp. 1851–1854. issn: 1521-3773. doi:10.1002/anie.201409336.
[61] J. Müller and C. M. Niemeyer. “DNA-directed assembly of artificial multienzymecomplexes.” In: Biochemical and Biophysical Research Communications 377.1 (Dec. 5,2008), pp. 62–67. issn: 0006-291X. doi: 10.1016/j.bbrc.2008.09.078.
[62] O. I. Wilner, Y. Weizmann, R. Gill, O. Lioubashevski, R. Freeman, and I. Willner.“Enzyme cascades activated on topologically programmed DNA scaffolds.”In: Nature Nanotechnology 4.4 (Apr. 2009), pp. 249–254. issn: 1748-3395. doi:10.1038/nnano.2009.50.
[63] J. Fu, M. Liu, Y. Liu, N. W. Woodbury, and H. Yan. “Interenzyme SubstrateDiffusion for an Enzyme Cascade Organized on Spatially Addressable DNANanostructures.” In: Journal of the American Chemical Society 134.12 (Mar. 28,2012), pp. 5516–5519. issn: 0002-7863. doi: 10.1021/ja300897h.
126
Bibliography
[64] Y. Zhang, S. Tsitkov, and H. Hess. “Proximity does not contribute to activityenhancement in the glucose oxidase–horseradish peroxidase cascade.” In: NatureCommunications 7.1 (Dec. 22, 2016), p. 13982. issn: 2041-1723. doi: 10.1038/ncomms13982.
[65] P. Bauler, G. Huber, T. Leyh, and J. A. McCammon. “Channeling by Proximity:The Catalytic Advantages of Active Site Colocalization Using Brownian Dynam-ics.” In: The Journal of Physical Chemistry Letters 1.9 (May 6, 2010), pp. 1332–1335.doi: 10.1021/jz1002007.
[66] F. Hinzpeter, F. Tostevin, A. Buchner, and U. Gerland. “Trade-offs and designprinciples in the spatial organization of catalytic particles.” en. In: bioRxiv (June2020), p. 2020.06.14.146076. doi: 10.1101/2020.06.14.146076.
[67] P. A. Srere. “Complexes of Sequential Metabolic Enzymes.” In: Annual Reviewof Biochemistry 56.1 (1987), pp. 89–124. doi: 10.1146/annurev.bi.56.070187.000513.
[68] C. C. Hyde, S. A. Ahmed, E. A. Padlan, E. W. Miles, and D. R. Davies. “Three-dimensional structure of the tryptophan synthase alpha 2 beta 2 multienzymecomplex from Salmonella typhimurium.” In: Journal of Biological Chemistry 263.33(Nov. 25, 1988), pp. 17857–17871. issn: 0021-9258, 1083-351X.
[69] E. J. Brignole, S. Smith, and F. J. Asturias. “Conformational flexibility of metazoanfatty acid synthase enables catalysis.” en. In: Nature Structural & Molecular Biology16.2 (Feb. 2009), pp. 190–197. issn: 1545-9985. doi: 10.1038/nsmb.1532.
[70] K. S. Anderson, E. W. Miles, and K. A. Johnson. “Serine modulates substratechanneling in tryptophan synthase. A novel intersubunit triggering mechanism.”In: Journal of Biological Chemistry 266.13 (May 5, 1991), pp. 8020–8033. issn: 0021-9258, 1083-351X.
[71] P. M. Anderson and A. Meister. “Bicarbonate-Dependent Cleavage of AdenosineTriphosphate and Other Reactions Catalyzed by Escherichia coli CarbamylPhosphate Synthetase.” In: Biochemistry 5.10 (Oct. 1, 1966), pp. 3157–3163. issn:0006-2960. doi: 10.1021/bi00874a012.
[72] J. B. Thoden, H. M. Holden, G. Wesenberg, F. M. Raushel, and I. Rayment.“Structure of carbamoyl phosphate synthetase: a journey of 96 Å from substrateto product.” In: Biochemistry 36.21 (1997), pp. 6305–6316.
[73] A. H. Elcock and J. A. McCammon. “Evidence for Electrostatic Channeling in aFusion Protein of Malate Dehydrogenase and Citrate Synthase.” In: Biochemistry35.39 (Jan. 1996), pp. 12652–12658. issn: 0006-2960. doi: 10.1021/bi9614747.
127

Bibliography
[74] R. W. Guynn, H. J. Gelberg, and R. L. Veech. “Equilibrium Constants of theMalate Dehydrogenase, Citrate Synthase, Citrate Lyase, and Acetyl Coenzyme AHydrolysis Reactions under Physiological Conditions.” en. In: Journal of BiologicalChemistry 248.20 (Oct. 1973), pp. 6957–6965. issn: 0021-9258, 1083-351X.
[75] D. R. Knighton, C.-C. Kan, E. Howland, C. A. Janson, Z. Hostomska, K. M.Welsh, and D. A. Matthews. “Structure of and kinetic channelling in bifunctionaldihydrofolate reductase–thymidylate synthase.” en. In: Nature Structural Biology1.3 (Mar. 1994), pp. 186–194. issn: 1545-9985. doi: 10.1038/nsb0394-186.
[76] R. N. Perham. “Swinging Arms and Swinging Domains in MultifunctionalEnzymes: Catalytic Machines for Multistep Reactions.” In: Annual Review ofBiochemistry 69.1 (2000), pp. 961–1004. doi: 10.1146/annurev.biochem.69.1.961.
[77] Z. H. Zhou, D. B. McCarthy, C. M. O’Connor, L. J. Reed, and J. K. Stoops. “Theremarkable structural and functional organization of the eukaryotic pyruvatedehydrogenase complexes.” en. In: Proceedings of the National Academy of Sciences98.26 (Dec. 2001), pp. 14802–14807. issn: 0027-8424, 1091-6490. doi: 10.1073/pnas.011597698.
[78] M. Smolle, A. E. Prior, A. E. Brown, A. Cooper, O. Byron, and J. G. Lindsay. “ANew Level of Architectural Complexity in the Human Pyruvate DehydrogenaseComplex.” en. In: Journal of Biological Chemistry 281.28 (July 2006), pp. 19772–19780. issn: 0021-9258, 1083-351X. doi: 10.1074/jbc.M601140200.
[79] F. Hinzpeter, F. Tostevin, and U. Gerland. “Regulation of reaction fluxes viaenzyme sequestration and co-clustering.” In: Journal of The Royal Society Interface16.156 (July 2019), p. 20190444. doi: 10.1098/rsif.2019.0444.
[80] S. An, R. Kumar, E. D. Sheets, and S. J. Benkovic. “Reversible Compartmen-talization of de Novo Purine Biosynthetic Complexes in Living Cells.” en.In: Science 320.5872 (Apr. 2008), pp. 103–106. issn: 0036-8075, 1095-9203. doi:10.1126/science.1152241.
[81] Y. Deng, J. Gam, J. B. French, H. Zhao, S. An, and S. J. Benkovic. “Map-ping Protein-Protein Proximity in the Purinosome.” en. In: Journal of BiologicalChemistry 287.43 (Oct. 2012), pp. 36201–36207. issn: 0021-9258, 1083-351X. doi:10.1074/jbc.M112.407056.
[82] J. B. French, H. Zhao, S. An, S. Niessen, Y. Deng, B. F. Cravatt, and S. J. Benkovic.“Hsp70/Hsp90 chaperone machinery is involved in the assembly of the puri-nosome.” en. In: Proceedings of the National Academy of Sciences 110.7 (Feb. 2013),pp. 2528–2533. issn: 0027-8424, 1091-6490. doi: 10.1073/pnas.1300173110.
128
Bibliography
[83] F. Verrier, S. An, A. M. Ferrie, H. Sun, M. Kyoung, H. Deng, Y. Fang, and S. J.Benkovic. “GPCRs regulate the assembly of a multienzyme complex for purinebiosynthesis.” en. In: Nature Chemical Biology 7.12 (Dec. 2011), pp. 909–915. issn:1552-4469. doi: 10.1038/nchembio.690.
[84] H. Zhao, C. R. Chiaro, L. Zhang, P. B. Smith, C. Y. Chan, A. M. Pedley, R. J. Pugh,J. B. French, A. D. Patterson, and S. J. Benkovic. “Quantitative Analysis of PurineNucleotides Indicates That Purinosomes Increase de Novo Purine Biosynthesis.”en. In: Journal of Biological Chemistry 290.11 (Mar. 2015), pp. 6705–6713. issn:0021-9258, 1083-351X. doi: 10.1074/jbc.M114.628701.
[85] N. Miura, M. Shinohara, Y. Tatsukami, Y. Sato, H. Morisaka, K. Kuroda, andM. Ueda. “Spatial Reorganization of Saccharomyces cerevisiae Enolase To AlterCarbon Metabolism under Hypoxia.” en. In: Eukaryotic Cell 12.8 (Aug. 2013),pp. 1106–1119. issn: 1535-9778, 1535-9786. doi: 10.1128/EC.00093-13.
[86] M. Jin, G. G. Fuller, T. Han, Y. Yao, A. F. Alessi, M. A. Freeberg, N. P. Roach,J. J. Moresco, A. Karnovsky, M. Baba, J. R. Yates, A. D. Gitler, K. Inoki, D. J.Klionsky, and J. K. Kim. “Glycolytic Enzymes Coalesce in G Bodies underHypoxic Stress.” en. In: Cell Reports 20.4 (July 2017), pp. 895–908. issn: 2211-1247.doi: 10.1016/j.celrep.2017.06.082.
[87] R. Narayanaswamy, M. Levy, M. Tsechansky, G. M. Stovall, J. D. O’Connell,J. Mirrielees, A. D. Ellington, and E. M. Marcotte. “Widespread reorganization ofmetabolic enzymes into reversible assemblies upon nutrient starvation.” en. In:Proceedings of the National Academy of Sciences 106.25 (June 2009), pp. 10147–10152.issn: 0027-8424, 1091-6490. doi: 10.1073/pnas.0812771106.
[88] S. Jang, J. C. Nelson, E. G. Bend, L. Rodríguez-Laureano, F. G. Tueros, L.Cartagenova, K. Underwood, E. M. Jorgensen, and D. A. Colón-Ramos. “Gly-colytic Enzymes Localize to Synapses under Energy Stress to Support SynapticFunction.” en. In: Neuron 90.2 (Apr. 2016), pp. 278–291. issn: 0896-6273. doi:10.1016/j.neuron.2016.03.011.
[89] M. E. Campanella, H. Chu, and P. S. Low. “Assembly and regulation of aglycolytic enzyme complex on the human erythrocyte membrane.” en. In: Pro-ceedings of the National Academy of Sciences 102.7 (Feb. 2005), pp. 2402–2407. issn:0027-8424, 1091-6490. doi: 10.1073/pnas.0409741102.
[90] E. Puchulu-Campanella, H. Chu, D. J. Anstee, J. A. Galan, W. A. Tao, and P. S.Low. “Identification of the Components of a Glycolytic Enzyme Metabolon onthe Human Red Blood Cell Membrane.” In: The Journal of Biological Chemistry288.2 (Jan. 2013), pp. 848–858. issn: 0021-9258. doi: 10.1074/jbc.M112.428573.
129

Bibliography
[91] X. Zhao, H. Palacci, V. Yadav, M. M. Spiering, M. K. Gilson, P. J. Butler, H. Hess,S. J. Benkovic, and A. Sen. “Substrate-driven chemotactic assembly in an enzymecascade.” en. In: Nature Chemistry 10.3 (Mar. 2018), pp. 311–317. issn: 1755-4349.doi: 10.1038/nchem.2905.
[92] Y. Zhang, K. F. M. Beard, C. Swart, S. Bergmann, I. Krahnert, Z. Nikoloski,A. Graf, R. G. Ratcliffe, L. J. Sweetlove, A. R. Fernie, and T. Obata. “Protein-protein interactions and metabolite channelling in the plant tricarboxylic acidcycle.” In: Nature Communications 8 (May 2017). issn: 2041-1723. doi: 10.1038/ncomms15212.
[93] T. Laursen, J. Borch, C. Knudsen, K. Bavishi, F. Torta, H. J. Martens, D. Silvestro,N. S. Hatzakis, M. R. Wenk, T. R. Dafforn, C. E. Olsen, M. S. Motawia, B.Hamberger, B. L. Møller, and J.-E. Bassard. “Characterization of a dynamicmetabolon producing the defense compound dhurrin in sorghum.” en. In:Science 354.6314 (Nov. 2016), pp. 890–893. issn: 0036-8075, 1095-9203. doi: 10.1126/science.aag2347.
[94] K. Jørgensen, A. V. Rasmussen, M. Morant, A. H. Nielsen, N. Bjarnholt, M.Zagrobelny, S. Bak, and B. L. Møller. “Metabolon formation and metabolicchanneling in the biosynthesis of plant natural products.” en. In: Current Opinionin Plant Biology. Physiology andmetabolism 8.3 (June 2005), pp. 280–291. issn:1369-5266. doi: 10.1016/j.pbi.2005.03.014.
[95] G. M. Cooper. “Mitochondria.” en. In: The Cell: A Molecular Approach. 2nd edition(2000).
[96] B. Alberts, A. Johnson, J. Lewis, M. Raff, K. Roberts, and P. Walter. “The Com-partmentalization of Cells.” en. In: Molecular Biology of the Cell. 4th edition (2002).
[97] G. M. Cooper. “Peroxisomes.” en. In: The Cell: A Molecular Approach. 2nd edition(2000).
[98] F. A. G. Reubsaet, J. H. Veerkamp, M. L. P. Brückwilder, J. M. F. Trijbels, andL. A. H. Monnens. “Peroxisomal oxidases and catalase in liver and kidneyhomogenates of normal and di(ethylhexyl)phthalate-fed rats.” en. In: Interna-tional Journal of Biochemistry 23.9 (Jan. 1991), pp. 961–967. issn: 0020-711X. doi:10.1016/0020-711X(91)90086-3.
[99] M. R. Badger and G. D. Price. “CO2 concentrating mechanisms in cyanobac-teria: molecular components, their diversity and evolution.” en. In: Journalof Experimental Botany 54.383 (Feb. 2003), pp. 609–622. issn: 0022-0957. doi:10.1093/jxb/erg076.
130
Bibliography
[100] Z. Dou, S. Heinhorst, E. B. Williams, C. D. Murin, J. M. Shively, and G. C. Cannon.“CO2 Fixation Kinetics of Halothiobacillus neapolitanus Mutant CarboxysomesLacking Carbonic Anhydrase Suggest the Shell Acts as a Diffusional Barrier forCO2.” en. In: Journal of Biological Chemistry 283.16 (Apr. 2008), pp. 10377–10384.issn: 0021-9258, 1083-351X. doi: 10.1074/jbc.M709285200.
[101] F. Cai, B. B. Menon, G. C. Cannon, K. J. Curry, J. M. Shively, and S. Heinhorst.“The Pentameric Vertex Proteins Are Necessary for the Icosahedral CarboxysomeShell to Function as a CO2 Leakage Barrier.” en. In: PLOS ONE 4.10 (Oct. 2009),e7521. issn: 1932-6203. doi: 10.1371/journal.pone.0007521.
[102] F. Hinzpeter, U. Gerland, and F. Tostevin. “Optimal CompartmentalizationStrategies for Metabolic Microcompartments.” English. In: Biophysical Journal112.4 (Feb. 2017), pp. 767–779. issn: 0006-3495. doi: 10.1016/j.bpj.2016.11.3194.
[103] S. R. Brinsmade, T. Paldon, and J. C. Escalante-Semerena. “Minimal Functionsand Physiological Conditions Required for Growth of Salmonella enterica onEthanolamine in the Absence of the Metabolosome.” In: Journal of Bacteriology187.23 (Dec. 2005), pp. 8039–8046. issn: 0021-9193. doi: 10.1128/JB.187.23.8039-8046.2005.
[104] T. F. Moraes and R. A. F. Reithmeier. “Membrane transport metabolons.” en. In:Biochimica et Biophysica Acta (BBA) - Biomembranes 1818.11 (Nov. 2012), pp. 2687–2706. issn: 0005-2736. doi: 10.1016/j.bbamem.2012.06.007.
[105] C. M. Fontes and H. J. Gilbert. “Cellulosomes: Highly Efficient NanomachinesDesigned to Deconstruct Plant Cell Wall Complex Carbohydrates.” In: AnnualReview of Biochemistry 79.1 (June 2010), pp. 655–681. issn: 0066-4154. doi: 10.1146/annurev-biochem-091208-085603.
[106] J. B. French, S. A. Jones, H. Deng, A. M. Pedley, D. Kim, C. Y. Chan, H. Hu, R. J.Pugh, H. Zhao, Y. Zhang, T. J. Huang, Y. Fang, X. Zhuang, and S. J. Benkovic.“Spatial colocalization and functional link of purinosomes with mitochondria.”en. In: Science 351.6274 (Feb. 2016), pp. 733–737. issn: 0036-8075, 1095-9203. doi:10.1126/science.aac6054.
[107] H. Chu, E. Puchulu-Campanella, J. A. Galan, W. A. Tao, P. S. Low, and J. F.Hoffman. “Identification of cytoskeletal elements enclosing the ATP pools thatfuel human red blood cell membrane cation pumps.” en. In: Proceedings of theNational Academy of Sciences 109.31 (July 2012), pp. 12794–12799. issn: 0027-8424,1091-6490. doi: 10.1073/pnas.1209014109.
131

Bibliography
[108] R. H. Doi and A. Kosugi. “Cellulosomes: plant-cell-wall-degrading enzymecomplexes.” en. In: Nature Reviews Microbiology 2.7 (July 2004), pp. 541–551. issn:1740-1534. doi: 10.1038/nrmicro925.
[109] E. A. Bayer, J.-P. Belaich, Y. Shoham, and R. Lamed. “The Cellulosomes: Mul-tienzyme Machines for Degradation of Plant Cell Wall Polysaccharides.” In:Annual Review of Microbiology 58.1 (Sept. 2004), pp. 521–554. issn: 0066-4227. doi:10.1146/annurev.micro.57.030502.091022.
[110] S. John, J. N. Weiss, and B. Ribalet. “Subcellular Localization of Hexokinases Iand II Directs the Metabolic Fate of Glucose.” en. In: PLOS ONE 6.3 (Mar. 2011),e17674. issn: 1932-6203. doi: 10.1371/journal.pone.0017674.
[111] J. W. A. Graham, T. C. R. Williams, M. Morgan, A. R. Fernie, R. G. Ratcliffe, andL. J. Sweetlove. “Glycolytic Enzymes Associate Dynamically with Mitochondriain Response to Respiratory Demand and Support Substrate Channeling.” en. In:The Plant Cell 19.11 (Nov. 2007), pp. 3723–3738. issn: 1040-4651, 1532-298X. doi:10.1105/tpc.107.053371.
[112] S. An, Y. Deng, J. W. Tomsho, M. Kyoung, and S. J. Benkovic. “Microtubule-assisted mechanism for functional metabolic macromolecular complex forma-tion.” en. In: Proceedings of the National Academy of Sciences 107.29 (July 2010),pp. 12872–12876. issn: 0027-8424, 1091-6490. doi: 10.1073/pnas.1008451107.
[113] C. Y. Chan, A. M. Pedley, D. Kim, C. Xia, X. Zhuang, and S. J. Benkovic.“Microtubule-directed transport of purine metabolons drives their cytosolictransit to mitochondria.” en. In: Proceedings of the National Academy of Sciences115.51 (Dec. 2018), pp. 13009–13014. issn: 0027-8424, 1091-6490. doi: 10.1073/pnas.1814042115.
[114] V. Pareek, H. Tian, N. Winograd, and S. J. Benkovic. “Metabolomics and massspectrometry imaging reveal channeled de novo purine synthesis in cells.” en.In: Science 368.6488 (Apr. 2020), pp. 283–290. issn: 0036-8075, 1095-9203. doi:10.1126/science.aaz6465.
[115] H. G and W. Gj. “Metabolic pathways as enzyme complexes: evidence for thesynthesis of phenylpropanoids and flavonoids on membrane associated enzymecomplexes.” English. In: Archives of Biochemistry and Biophysics 237.1 (Feb. 1985),pp. 88–100. issn: 0003-9861, 1096-0384. doi: 10.1016/0003-9861(85)90257-7.
[116] B. Winkel-Shirley. “Evidence for enzyme complexes in the phenylpropanoidand flavonoid pathways.” en. In: Physiologia Plantarum 107.1 (1999), pp. 142–149.issn: 1399-3054. doi: 10.1034/j.1399-3054.1999.100119.x.
132

Bibliography
[117] B. S. Winkel. “Metabolic channeling in plants.” In: Annual Review of Plant Biology55.1 (Apr. 2004), pp. 85–107. issn: 1543-5008. doi: 10.1146/annurev.arplant.55.031903.141714.
[118] L. J. Sweetlove and A. R. Fernie. “The Spatial Organization of Metabolism Withinthe Plant Cell.” In: Annual Review of Plant Biology 64.1 (Apr. 2013), pp. 723–746.issn: 1543-5008. doi: 10.1146/annurev-arplant-050312-120233.
[119] C. M. Agapakis, P. M. Boyle, and P. A. Silver. “Natural strategies for the spatialoptimization of metabolism in synthetic biology.” en. In: Nature Chemical Biology8.6 (June 2012), pp. 527–535. issn: 1552-4469. doi: 10.1038/nchembio.975.
[120] H. Rabeharindranto, S. Castaño-Cerezo, T. Lautier, L. F. Garcia-Alles, C. Treitz, A.Tholey, and G. Truan. “Enzyme-fusion strategies for redirecting and improvingcarotenoid synthesis in S. cerevisiae.” en. In: Metabolic Engineering Communica-tions 8 (June 2019), e00086. issn: 2214-0301. doi: 10.1016/j.mec.2019.e00086.
[121] T. Thomik, I. Wittig, J.-y. Choe, E. Boles, and M. Oreb. “An artificial transportmetabolon facilitates improved substrate utilization in yeast.” en. In: NatureChemical Biology 13.11 (Nov. 2017), pp. 1158–1163. issn: 1552-4469. doi: 10.1038/nchembio.2457.
[122] S. Moraïs, Y. Barak, J. Caspi, Y. Hadar, R. Lamed, Y. Shoham, D. B. Wilson, andE. A. Bayer. “Contribution of a Xylan-Binding Module to the Degradation of aComplex Cellulosic Substrate by Designer Cellulosomes.” en. In: Applied andEnvironmental Microbiology 76.12 (June 2010), pp. 3787–3796. issn: 0099-2240,1098-5336. doi: 10.1128/AEM.00266-10.
[123] S.-L. Tsai, J. Oh, S. Singh, R. Chen, and W. Chen. “Functional Assembly ofMinicellulosomes on the Saccharomyces cerevisiae Cell Surface for CelluloseHydrolysis and Ethanol Production.” en. In: Applied and Environmental Mi-crobiology 75.19 (Oct. 2009), pp. 6087–6093. issn: 0099-2240, 1098-5336. doi:10.1128/AEM.01538-09.
[124] S.-L. Tsai, N. A. DaSilva, and W. Chen. “Functional Display of Complex Cellulo-somes on the Yeast Surface via Adaptive Assembly.” In: ACS Synthetic Biology2.1 (Jan. 2013), pp. 14–21. doi: 10.1021/sb300047u.
[125] F. Liu, S. Banta, and W. Chen. “Functional assembly of a multi-enzyme methanoloxidation cascade on a surface-displayed trifunctional scaffold for enhancedNADH production.” en. In: Chemical Communications 49.36 (2013), pp. 3766–3768.doi: 10.1039/C3CC40454D.
133

Bibliography
[126] J.-L. Lin, J. Zhu, and I. Wheeldon. “Synthetic Protein Scaffolds for BiosyntheticPathway Colocalization on Lipid Droplet Membranes.” In: ACS Synthetic Biology6.8 (Aug. 2017), pp. 1534–1544. doi: 10.1021/acssynbio.7b00041.
[127] C. J. Delebecque, A. B. Lindner, P. A. Silver, and F. A. Aldaye. “Organizationof Intracellular Reactions with Rationally Designed RNA Assemblies.” en. In:Science 333.6041 (July 2011), pp. 470–474. issn: 0036-8075, 1095-9203. doi: 10.1126/science.1206938.
[128] J. E. Dueber, G. C. Wu, G. R. Malmirchegini, T. S. Moon, C. J. Petzold, A. V.Ullal, K. L. J. Prather, and J. D. Keasling. “Synthetic protein scaffolds providemodular control over metabolic flux.” en. In: Nature Biotechnology 27.8 (Aug.2009), pp. 753–759. issn: 1546-1696. doi: 10.1038/nbt.1557.
[129] Y. Zhang, S.-Z. Li, J. Li, X. Pan, R. E. Cahoon, J. G. Jaworski, X. Wang, J. M. Jez,F. Chen, and O. Yu. “Using Unnatural Protein Fusions to Engineer ResveratrolBiosynthesis in Yeast and Mammalian Cells.” In: Journal of the American ChemicalSociety 128.40 (Oct. 2006), pp. 13030–13031. issn: 0002-7863. doi: 10.1021/ja0622094.
[130] R. J. Conrado, G. C. Wu, J. T. Boock, H. Xu, S. Y. Chen, T. Lebar, J. Turnšek,N. Tomšic, M. Avbelj, R. Gaber, T. Koprivnjak, J. Mori, V. Glavnik, I. Vovk,M. Bencina, V. Hodnik, G. Anderluh, J. E. Dueber, R. Jerala, and M. P. DeLisa.“DNA-guided assembly of biosynthetic pathways promotes improved catalyticefficiency.” en. In: Nucleic Acids Research 40.4 (Feb. 2012), pp. 1879–1889. issn:0305-1048. doi: 10.1093/nar/gkr888.
[131] P. W. K. Rothemund. “Folding DNA to create nanoscale shapes and patterns.”en. In: Nature 440.7082 (Mar. 2006), pp. 297–302. issn: 1476-4687. doi: 10.1038/nature04586.
[132] Y. Fu, D. Zeng, J. Chao, Y. Jin, Z. Zhang, H. Liu, D. Li, H. Ma, Q. Huang, K. V.Gothelf, and C. Fan. “Single-Step Rapid Assembly of DNA Origami Nanostruc-tures for Addressable Nanoscale Bioreactors.” In: Journal of the American ChemicalSociety 135.2 (Jan. 2013), pp. 696–702. issn: 0002-7863. doi: 10.1021/ja3076692.
[133] V. Linko, M. Eerikäinen, and M. A. Kostiainen. “A modular DNA origami-basedenzyme cascade nanoreactor.” en. In: Chemical Communications 51.25 (2015),pp. 5351–5354. doi: 10.1039/C4CC08472A.
[134] J. Fu, Y. R. Yang, A. Johnson-Buck, M. Liu, Y. Liu, N. G. Walter, N. W. Woodbury,and H. Yan. “Multi-enzyme complexes on DNA scaffolds capable of substratechannelling with an artificial swinging arm.” en. In: Nature Nanotechnology 9.7(July 2014), pp. 531–536. issn: 1748-3395. doi: 10.1038/nnano.2014.100.
134

Bibliography
[135] M. Feng and M. K. Gilson. “Enhanced Diffusion and Chemotaxis of Enzymes.”In: Annual Review of Biophysics 49.1 (2020), pp. 87–105. doi: 10.1146/annurev-biophys-121219-081535.
[136] M. Börsch, P. Turina, C. Eggeling, J. R. Fries, C. A. M. Seidel, A. Labahn, andP. Gräber. “Conformational changes of the H+-ATPase from Escherichia coliupon nucleotide binding detected by single molecule fluorescence.” en. In:FEBS Letters 437.3 (1998), pp. 251–254. issn: 1873-3468. doi: 10.1016/S0014-5793(98)01247-2.
[137] H. Yu, K. Jo, K. L. Kounovsky, J. J. d. Pablo, and D. C. Schwartz. “MolecularPropulsion: Chemical Sensing and Chemotaxis of DNA Driven by RNA Poly-merase.” In: Journal of the American Chemical Society 131.16 (Apr. 2009), pp. 5722–5723. issn: 0002-7863. doi: 10.1021/ja900372m.
[138] S. H. Muddana, S. Sengupta, E. T. Mallouk, A. Sen, and J. P. Butler. “Sub-strate Catalysis Enhances Single-Enzyme Diffusion.” In: Journal of the Amer-ican Chemical Society 132.7 (Feb. 2010), pp. 2110–2111. issn: 0002-7863. doi:10.1021/ja908773a.
[139] S. Sengupta, K. K. Dey, H. S. Muddana, T. Tabouillot, M. E. Ibele, P. J. Butler, andA. Sen. “Enzyme Molecules as Nanomotors.” In: Journal of the American ChemicalSociety 135.4 (Jan. 2013), pp. 1406–1414. issn: 0002-7863. doi: 10.1021/ja3091615.
[140] C. Riedel, R. Gabizon, M. C. A. Wilson, K. Hamadani, K. Tsekouras, S. Marqusee,S. Presse, and C. Bustamante. “The heat released during catalytic turnoverenhances the diffusion of an enzyme.” In: Nature 517 (Jan. 2015), pp. 227–230.issn: 0028-0836. doi: 10.1038/nature14043.
[141] P. Illien, X. Zhao, K. K. Dey, J. P. Butler, A. Sen, and R. Golestanian. “Exother-micity Is Not a Necessary Condition for Enhanced Diffusion of Enzymes.” In:Nano Letters 17.7 (July 2017), pp. 4415–4420. issn: 1530-6984. doi: 10.1021/acs.nanolett.7b01502.
[142] A.-Y. Jee, S. Dutta, Y.-K. Cho, T. Tlusty, and S. Granick. “Enzyme leaps fuelantichemotaxis.” In: Proceedings of the National Academy of Sciences 115.1 (Jan.2018). doi: 10.1073/pnas.1717844115.
[143] J.-P. Günther, M. Börsch, and P. Fischer. “Diffusion Measurements of SwimmingEnzymes with Fluorescence Correlation Spectroscopy.” In: Accounts of ChemicalResearch (Aug. 2018). issn: 0001-4842. doi: 10.1021/acs.accounts.8b00276.
[144] Y. Zhang, M. J. Armstrong, N. M. B. Kazeruni, and H. Hess. “Aldolase does notshow enhanced diffusion in dynamic light scattering experiments.” en. In: NanoLetters (Nov. 2018). doi: 10.1021/acs.nanolett.8b04240.
135

Bibliography
[145] Z. Chen, A. Shaw, H. Wilson, M. Woringer, X. Darzacq, S. Marqusee, Q. Wang,and C. Bustamante. “Single-molecule diffusometry reveals no catalysis-induceddiffusion enhancement of alkaline phosphatase as proposed by FCS experi-ments.” en. In: Proceedings of the National Academy of Sciences 117.35 (Sept. 2020),pp. 21328–21335. issn: 0027-8424, 1091-6490. doi: 10.1073/pnas.2006900117.
[146] M. Xu, J. L. Ross, L. Valdez, and A. Sen. “Direct Single Molecule Imaging ofEnhanced Enzyme Diffusion.” In: Physical Review Letters 123.12 (Sept. 2019),p. 128101. doi: 10.1103/PhysRevLett.123.128101.
[147] A.-Y. Jee, K. Chen, T. Tlusty, J. Zhao, and S. Granick. “Enhanced diffusion andoligomeric enzyme dissociation.” In: Journal of the American Chemical Society (Nov.2019). issn: 0002-7863. doi: 10.1021/jacs.9b06949.
[148] H. Wang, M. Park, R. Dong, J. Kim, Y.-K. Cho, T. Tlusty, and S. Granick. “Boostedmolecular mobility during common chemical reactions.” en. In: Science 369.6503(July 2020), pp. 537–541. issn: 0036-8075, 1095-9203. doi: 10.1126/science.aba8425.
[149] R. Golestanian. “Enhanced Diffusion of Enzymes that Catalyze Exothermic Re-actions.” In: Physical Review Letters 115 (Sept. 2015). doi: 10.1103/PhysRevLett.115.108102.
[150] M. Feng and M. K. Gilson. “A Thermodynamic Limit on the Role of Self-Propulsion in Enhanced Enzyme Diffusion.” en. In: Biophysical Journal 116.10(May 2019), pp. 1898–1906. issn: 0006-3495. doi: 10.1016/j.bpj.2019.04.005.
[151] A.-Y. Jee, Y.-K. Cho, S. Granick, and T. Tlusty. “Catalytic enzymes are ac-tive matter.” en. In: Proceedings of the National Academy of Sciences (Nov. 2018),p. 201814180. issn: 0027-8424, 1091-6490. doi: 10.1073/pnas.1814180115.
[152] F. Mohajerani, X. Zhao, A. Somasundar, D. Velegol, and A. Sen. “A Theory ofEnzyme Chemotaxis: From Experiments to Modeling.” In: Biochemistry 57.43(Oct. 2018), pp. 6256–6263. issn: 0006-2960. doi: 10.1021/acs.biochem.8b00801.
[153] P. Illien, T. Adeleke-Larodo, and R. Golestanian. “Diffusion of an enzyme: Therole of fluctuation-induced hydrodynamic coupling.” en. In: EPL (EurophysicsLetters) 119.4 (Aug. 2017), p. 40002. issn: 0295-5075. doi: 10.1209/0295-5075/119/40002.
[154] S. Kondrat and M. Popescu. “Brownian dynamics assessment of enhanced dif-fusion exhibited by ‘fluctuating-dumbbell enzymes’.” en. In: Physical ChemistryChemical Physics (2019). doi: 10.1039/C9CP02842K.
136
Bibliography
[155] Y. Zhang and H. Hess. “Enhanced Diffusion of Catalytically Active Enzymes.”In: ACS Central Science (May 2019). issn: 2374-7943. doi: 10.1021/acscentsci.9b00228.
[156] A. S. Mikhailov and R. Kapral. “Hydrodynamic collective effects of activeprotein machines in solution and lipid bilayers.” en. In: Proceedings of the NationalAcademy of Sciences 112.28 (July 2015), E3639–E3644. issn: 0027-8424, 1091-6490.doi: 10.1073/pnas.1506825112.
[157] M. Dennison, R. Kapral, and H. Stark. “Diffusion in systems crowded by activeforce-dipole molecules.” en. In: Soft Matter 13.20 (2017), pp. 3741–3749. doi:10.1039/C7SM00400A.
[158] N. B. Shah, M. L. Hutcheon, B. K. Haarer, and T. M. Duncan. “F1-ATPaseof Escherichia coli THE ε-INHIBITED STATE FORMS AFTER ATP HYDROL-YSIS, IS DISTINCT FROM THE ADP-INHIBITED STATE, AND RESPONDSDYNAMICALLY TO CATALYTIC SITE LIGANDS.” en. In: Journal of BiologicalChemistry 288.13 (Mar. 2013), pp. 9383–9395. issn: 0021-9258, 1083-351X. doi:10.1074/jbc.M113.451583.
[159] J. M. Schurr, B. S. Fujimoto, L. Huynh, and D. T. Chiu. “A Theory of Macro-molecular Chemotaxis.” In: The Journal of Physical Chemistry B 117.25 (June 2013),pp. 7626–7652. issn: 1520-6106. doi: 10.1021/jp302587d.
[160] A. V. Kiselev. “Non-specific and specific interactions of molecules of differentelectronic structures with solid surfaces.” en. In: Discussions of the Faraday Society40.0 (Jan. 1965), pp. 205–218. issn: 0366-9033. doi: 10.1039/DF9654000205.
[161] M. J. Schnitzer. “Theory of continuum random walks and application to chemo-taxis.” In: Physical Review E 48.4 (Oct. 1993), pp. 2553–2568. doi: 10.1103/PhysRevE.48.2553.
[162] J. Agudo-Canalejo, P. Illien, and R. Golestanian. “Phoresis and Enhanced Dif-fusion Compete in Enzyme Chemotaxis.” In: Nano Letters 18.4 (Apr. 2018),pp. 2711–2717. issn: 1530-6984. doi: 10.1021/acs.nanolett.8b00717.
[163] S. Ebbens, M.-H. Tu, J. R. Howse, and R. Golestanian. “Size dependence of thepropulsion velocity for catalytic Janus-sphere swimmers.” In: Physical Review E85.2 (Feb. 2012), p. 020401. doi: 10.1103/PhysRevE.85.020401.
[164] J. L. Anderson. “Colloid Transport by Interfacial Forces.” In: Annual Review ofFluid Mechanics 21.1 (1989), pp. 61–99. doi: 10.1146/annurev.fl.21.010189.000425.
[165] D. McQuarrie. Statistical mechanics. Harper’s chemistry series. Harper & Row,1975.
137
Bibliography
[166] J. L. Kelly. “A New Interpretation of Information Rate.” en. In: Bell SystemTechnical Journal 35.4 (1956), pp. 917–926. issn: 1538-7305. doi: 10.1002/j.1538-7305.1956.tb03809.x.
[167] A. Buchner, F. Tostevin, and U. Gerland. “Clustering and Optimal Arrangementof Enzymes in Reaction-Diffusion Systems.” In: Physical Review Letters 110.20(May 2013), p. 208104. doi: 10.1103/PhysRevLett.110.208104.
[168] A. Buchner, F. Tostevin, F. Hinzpeter, and U. Gerland. “Optimization of collectiveenzyme activity via spatial localization.” In: The Journal of Chemical Physics 139.13(Oct. 2013), p. 135101. issn: 0021-9606. doi: 10.1063/1.4823504.
[169] N. Katoh and T. Ibaraki. “Resource Allocation Problems.” en. In: Handbookof Combinatorial Optimization: Volume1–3. Ed. by D.-Z. Du and P. M. Pardalos.Boston, MA: Springer US, 1998, pp. 905–1006. isbn: 978-1-4613-0303-9. doi:10.1007/978-1-4613-0303-9_14.
[170] K. Kumar, R. A. Mella-Herrera, and J. W. Golden. “Cyanobacterial Heterocysts.”en. In: Cold Spring Harbor Perspectives in Biology 2.4 (Apr. 2010), a000315. issn: ,1943-0264. doi: 10.1101/cshperspect.a000315.
[171] M. Scott, C. W. Gunderson, E. M. Mateescu, Z. Zhang, and T. Hwa. “Interde-pendence of Cell Growth and Gene Expression: Origins and Consequences.” en.In: Science 330.6007 (Nov. 2010), pp. 1099–1102. issn: 0036-8075, 1095-9203. doi:10.1126/science.1192588.
[172] C. You, H. Okano, S. Hui, Z. Zhang, M. Kim, C. W. Gunderson, Y.-P. Wang, P.Lenz, D. Yan, and T. Hwa. “Coordination of bacterial proteome with metabolismby cyclic AMP signalling.” en. In: Nature 500.7462 (Aug. 2013), pp. 301–306. issn:1476-4687. doi: 10.1038/nature12446.
[173] A. Maitra and K. A. Dill. “Bacterial growth laws reflect the evolutionary impor-tance of energy efficiency.” en. In: Proceedings of the National Academy of Sciences112.2 (Jan. 2015), pp. 406–411. issn: 0027-8424, 1091-6490. doi: 10.1073/pnas.1421138111.
[174] M. Y. Pavlov and M. Ehrenberg. “Optimal control of gene expression for fastproteome adaptation to environmental change.” en. In: Proceedings of the NationalAcademy of Sciences 110.51 (Dec. 2013), pp. 20527–20532. issn: 0027-8424, 1091-6490. doi: 10.1073/pnas.1309356110.
[175] D. W. Erickson, S. J. Schink, V. Patsalo, J. R. Williamson, U. Gerland, and T.Hwa. “A global resource allocation strategy governs growth transition kineticsof Escherichia coli.” en. In: Nature 551.7678 (Nov. 2017), pp. 119–123. issn:1476-4687. doi: 10.1038/nature24299.
138

Bibliography
[176] D. L. Schmitt and S. An. “Spatial Organization of Metabolic Enzyme Complexesin Cells.” In: Biochemistry 56.25 (June 2017), pp. 3184–3196. issn: 0006-2960. doi:10.1021/acs.biochem.7b00249.
[177] J. Zhou and B. Xu. “Enzyme-Instructed Self-Assembly: A Multistep Process forPotential Cancer Therapy.” In: Bioconjugate Chemistry 26.6 (June 2015), pp. 987–999. issn: 1043-1802. doi: 10.1021/acs.bioconjchem.5b00196.
[178] J. Li, Y. Kuang, J. Shi, J. Zhou, J. E. Medina, R. Zhou, D. Yuan, C. Yang, H. Wang,Z. Yang, J. Liu, D. M. Dinulescu, and B. Xu. “Enzyme-Instructed IntracellularMolecular Self-Assembly to Boost Activity of Cisplatin against Drug-ResistantOvarian Cancer Cells.” en. In: Angewandte Chemie International Edition 54.45(2015), pp. 13307–13311. issn: 1521-3773. doi: 10.1002/anie.201507157.
[179] B. Hove-Jensen, K. R. Andersen, M. Kilstrup, J. Martinussen, R. L. Switzer, andM. Willemoës. “Phosphoribosyl Diphosphate (PRPP): Biosynthesis, Enzymology,Utilization, and Metabolic Significance.” en. In: Microbiology and Molecular BiologyReviews 81.1 (Mar. 2017). issn: 1092-2172, 1098-5557. doi: 10.1128/MMBR.00040-16.
[180] R. E. Goldstein and J.-W. van de Meent. “A physical perspective on cytoplasmicstreaming.” In: Interface Focus 5.4 (Aug. 2015), p. 20150030. doi: 10.1098/rsfs.2015.0030.
[181] J. F. Presley, N. B. Cole, T. A. Schroer, K. Hirschberg, K. J. M. Zaal, and J.Lippincott-Schwartz. “ER-to-Golgi transport visualized in living cells.” en. In:Nature 389.6646 (Sept. 1997), pp. 81–85. issn: 1476-4687. doi: 10.1038/38001.
[182] O. Grimm, M. Coppey, and E. Wieschaus. “Modelling the Bicoid gradient.” en.In: Development 137.14 (July 2010), pp. 2253–2264. issn: 0950-1991, 1477-9129.doi: 10.1242/dev.032409.
[183] D. Oh, C.-H. Yu, and D. J. Needleman. “Spatial organization of the Ran pathwayby microtubules in mitosis.” en. In: Proceedings of the National Academy of Sciences113.31 (Aug. 2016), pp. 8729–8734. issn: 0027-8424, 1091-6490. doi: 10.1073/pnas.1607498113.
[184] Y. E. Chen, C. Tropini, K. Jonas, C. G. Tsokos, K. C. Huang, and M. T. Laub.“Spatial gradient of protein phosphorylation underlies replicative asymmetryin a bacterium.” en. In: Proceedings of the National Academy of Sciences 108.3(Jan. 2011), pp. 1052–1057. issn: 0027-8424, 1091-6490. doi: 10.1073/pnas.1015397108.
139

Bibliography
[185] J. R. Robbins, D. Monack, S. J. McCallum, A. Vegas, E. Pham, M. B. Goldberg,and J. A. Theriot. “The making of a gradient: IcsA (VirG) polarity in Shigellaflexneri.” en. In: Molecular Microbiology 41.4 (2001), pp. 861–872. issn: 1365-2958.doi: 10.1046/j.1365-2958.2001.02552.x.
[186] T. E. Saunders, K. Z. Pan, A. Angel, Y. Guan, J. V. Shah, M. Howard, and F.Chang. “Noise Reduction in the Intracellular Pom1p Gradient by a DynamicClustering Mechanism.” en. In: Developmental Cell 22.3 (Mar. 2012), pp. 558–572.issn: 1534-5807. doi: 10.1016/j.devcel.2012.01.001.
[187] O. Idan and H. Hess. “Origins of Activity Enhancement in Enzyme Cascades onScaffolds.” In: ACS Nano 7.10 (Oct. 2013), pp. 8658–8665. issn: 1936-0851. doi:10.1021/nn402823k.
[188] E. O. Thorp. “Portfolio choice and the Kelly criterion.” In: Stochastic OptimizationModels in Finance. Elsevier, 1975, pp. 599–619.
[189] B. Ho, A. Baryshnikova, and G. W. Brown. “Unification of Protein AbundanceDatasets Yields a Quantitative Saccharomyces cerevisiae Proteome.” en. In: CellSystems 6.2 (Feb. 2018), 192–205.e3. issn: 2405-4712. doi: 10.1016/j.cels.2017.12.004.
[190] H. Markowitz. “Portfolio Selection.” en. In: The Journal of Finance 7.1 (1952),pp. 77–91. issn: 1540-6261. doi: 10.1111/j.1540-6261.1952.tb01525.x.
[191] C. Runge. “Ueber die numerische Auflösung von Differentialgleichungen.” de.In: Mathematische Annalen 46.2 (June 1895), pp. 167–178. issn: 1432-1807. doi:10.1007/BF01446807.
[192] W. Kutta. “Beitrag zur naherungsweisen Integration totaler Differentialgleichun-gen.” In: Z. Math. Phys. 46 (1901), pp. 435–453.
[193] S. K. Kufer, E. M. Puchner, H. Gumpp, T. Liedl, and H. E. Gaub. “Single-Molecule Cut-and-Paste Surface Assembly.” en. In: Science 319.5863 (Feb. 2008),pp. 594–596. issn: 0036-8075, 1095-9203. doi: 10.1126/science.1151424.
[194] K. R. Erlich, S. M. Sedlak, M. A. Jobst, L. F. Milles, and H. E. Gaub. “DNA-freedirected assembly in single-molecule cut-and-paste.” en. In: Nanoscale 11.2 (2019),pp. 407–411. doi: 10.1039/C8NR08636B.
[195] G. Giunta, H. Seyed-Allaei, and U. Gerland. “Cross-diffusion induced patternsfor a single-step enzymatic reaction.” en. In: Communications Physics 3.1 (Sept.2020), pp. 1–9. issn: 2399-3650. doi: 10.1038/s42005-020-00427-w.
[196] C. Weistuch and S. Pressé. “Spatiotemporal Organization of Catalysts Driven byEnhanced Diffusion.” In: The Journal of Physical Chemistry B (Sept. 2017). issn:1520-6106. doi: 10.1021/acs.jpcb.7b06868.
140

Bibliography
[197] A. M. Turing. “The chemical basis of morphogenesis.” en. In: Bulletin of Math-ematical Biology 52.1 (Jan. 1990), pp. 153–197. issn: 1522-9602. doi: 10.1007/BF02459572.
[198] S. S. Sugai, K. L. Ode, and H. R. Ueda. “A Design Principle for an AutonomousPost-translational Pattern Formation.” English. In: Cell Reports 19.4 (Apr. 2017),pp. 863–874. issn: 2211-1247. doi: 10.1016/j.celrep.2017.03.081.
[199] B. Derjaguin, G. Sidorenkov, E. Zubashchenkov, and E. Kiseleva. “Kinetic phe-nomena in boundary films of liquids.” In: Kolloidn. zh 9 (1947), pp. 335–347.
[200] R. Milo and R. Phillips. Cell biology by the numbers. Garland Science, 2015.
[201] M. Cross and H. Greenside. Pattern Formation and Dynamics in NonequilibriumSystems by Michael Cross. en. July 2009. doi: 10.1017/CBO9780511627200.
[202] M. Arrio-Dupont, G. Foucault, M. Vacher, P. F. Devaux, and S. Cribier. “Trans-lational Diffusion of Globular Proteins in the Cytoplasm of Cultured MuscleCells.” en. In: Biophysical Journal 78.2 (Feb. 2000), pp. 901–907. issn: 0006-3495.doi: 10.1016/S0006-3495(00)76647-1.
[203] H. P. Erickson. “Size and Shape of Protein Molecules at the Nanometer LevelDetermined by Sedimentation, Gel Filtration, and Electron Microscopy.” In:Biological Procedures Online 11 (May 2009), pp. 32–51. issn: 1480-9222. doi: 10.1007/s12575-009-9008-x.
[204] C. Liu, X. Fu, L. Liu, X. Ren, C. K. L. Chau, S. Li, L. Xiang, H. Zeng, G. Chen,L.-H. Tang, P. Lenz, X. Cui, W. Huang, T. Hwa, and J.-D. Huang. “SequentialEstablishment of Stripe Patterns in an Expanding Cell Population.” en. In:Science 334.6053 (Oct. 2011), pp. 238–241. issn: 0036-8075, 1095-9203. doi: 10.1126/science.1209042.
[205] A. J. Koch and H. Meinhardt. “Biological pattern formation: from basic mech-anisms to complex structures.” In: Reviews of Modern Physics 66.4 (Oct. 1994),pp. 1481–1507. doi: 10.1103/RevModPhys.66.1481.
[206] M. E. Cates and J. Tailleur. “Motility-Induced Phase Separation.” In: AnnualReview of Condensed Matter Physics 6.1 (Mar. 2015), pp. 219–244. issn: 1947-5454.doi: 10.1146/annurev-conmatphys-031214-014710.
[207] V. K. Vanag and I. R. Epstein. “Cross-diffusion and pattern formation in re-action–diffusion systems.” en. In: Physical Chemistry Chemical Physics 11.6 (Jan.2009), pp. 897–912. issn: 1463-9084. doi: 10.1039/B813825G.
[208] J. Agudo-Canalejo and R. Golestanian. “Active Phase Separation in Mixturesof Chemically Interacting Particles.” In: Physical Review Letters 123.1 (July 2019),p. 018101. doi: 10.1103/PhysRevLett.123.018101.
141
Bibliography
[209] D. E. Woodward, R. Tyson, M. R. Myerscough, J. D. Murray, E. O. Budrene, andH. C. Berg. “Spatio-temporal patterns generated by Salmonella typhimurium.”In: Biophysical Journal 68.5 (May 1995), pp. 2181–2189. issn: 0006-3495. doi:10.1016/S0006-3495(95)80400-5.
[210] L. Tweedy, D. A. Knecht, G. M. Mackay, and R. H. Insall. “Self-GeneratedChemoattractant Gradients: Attractant Depletion Extends the Range and Ro-bustness of Chemotaxis.” en. In: PLOS Biology 14.3 (Mar. 2016), e1002404. issn:1545-7885. doi: 10.1371/journal.pbio.1002404.
[211] E. F. Keller and L. A. Segel. “Initiation of slime mold aggregation viewed asan instability.” en. In: Journal of Theoretical Biology 26.3 (Mar. 1970), pp. 399–415.issn: 0022-5193. doi: 10.1016/0022-5193(70)90092-5.
142

Acknowledgments
The research presented in this dissertation would have not been possible without theguidance, the support and the encouragement of many people. They all contributed tomake the PhD the most formative period of my life.
First, I want to thank my supervisor Uli Gerland for encouraging me to knock at hisdoor anytime to discuss project ideas. I thank him also for guiding me while letting methe freedom to follow my own curiosities in the design of the projects. And, above all, Iam grateful to him for having been a fatherly and supportive person all the times that Iwas facing difficulties.
I am deeply grateful to Filipe Tostevin for the patience demonstrated in listeningto the countless questions I had over the years. Professionally, he taught me a lot onhow to program, how to pose, judge and analyze research questions. There is only onething I did not learn from him and this is how to be quicker in taking turns at boardgames. I am sure he wishes I had learned that. Above all, I thank Filipe for havingbecome a mentor-like figure and a close friend.
I also want to thank Hamid Seyed-Allaei for the fun had while working together onthe project on enzyme motion. I especially thank him for the patience shown whilecorrecting all the wrong estimates of parameters that I was computing. I found inHamid a great collaborator and I am sure we will keep working and discuss sciencetogether.
I am also grateful to Sorin Tanase-Nicola for contributing to the enzyme arrangementproject by providing deep mathematical insights.
I am also very thankful to the Quantitative Bioscience Munich (QBM) school fortaking me as one of their graduate students and for supporting me financially duringthe first three years of PhD. I also thank QBM for the great scientific environmentcreated and for the very inspiring retreats and lecture series organized.
I also want to thank former and current group members for creating a welcoming andwarm working atmosphere. Especially I want to thank Florian for the many stimulatingdiscussions had about enzymes, cuisines and travels. Stephan for discussing excitingfuture possible project ideas and for teaching me cross-country skating without havingmy neck broken. Linda for being the best Stammtisch buddy and for preparing me thebest setteveli ever. Elena for always helping me in the typical Italian expat bureaucracyproblems and for having become a good friend and a confidant. Zara for sharing my
143

Acknowledgments
passion for sushi and for the nice afterwork activities. Severin for always transmittinghis passion about science and for having become a great friend. Michael and Manon forthe Awesome Theory Journal Clubs, the many scientific discussions and the fun had inthe SUP sessions. Tobi and Joachim for being great office neighbors and being alwayswilling to help with any scientific and personal question. Bernhard for the feedbackprovided in writing the manuscript about the effects of the cross-diffusion of enzymesand for sharing, together with Filipe, the passion for playing Twilight Imperium (whichno, it has nothing to do with the TV series). Mareike for organizing together withTobi amazing group retreats at the Albert-Link-Hütte and Cesar for exchanging veryinteresting ideas and references. Special thanks also to Giovanni, Cecilia and Maryamfor being great office mates and good companions. I am also grateful to former groupmembers: Johannes, Thiago, Vladimir and Patrick for their guidance and their feedbackprovided at the beginning of the PhD. Thanks also to all the other group members forthe great time.
At the department I also had the chance to meet a great scientist and an even betterfriend and boulder coach, Kasia Tych. I would like to thank her for the exciting scientificconversations, the many lunches and boulder sessions had together.
I also want to thank Federica, Stefano, Karl, Leila, Linda, Stephan and Kasia for themany inputs given me for the thesis and helping me in the proofreading. I also thankBen, Felix and Linda for helping me in the translation of the German parts of the thesisand the documents associated to it.
I am also grateful to the awesome friends I met during my time in Munich. I especiallywant to thank Leila for having been always cheerful and supportive throughout thepast seven years, including the writing of this thesis. My long time uni colleaguesand awesome friends Ben and Mauro for the fun times together. My travel buddiesLuca, beautiful Mina and Mariana for the many trips necessary to recharge the energiesin between the intense periods of research. Aurora for the joint decision of movingfrom Catania to Munich after our Bachelor studies. Carmen, Karl, Rui, Giovanni, Fedeand Ste for the many family-like Sunday lunches, dinners and aperitifs. All the Italianfriends part of the MCC for the daily instructive and inspiring conversations. Specialthanks to the awesome tandem group for never giving up on my German: Susanna,Felix, Theresa, Fede and Ste; and to the people that always made Munich one of myhomes from the very first day and continue to do so: Uta, Walther, Magic, Consti,Veronica and Xavi.
I am also grateful to my former Bachelor colleagues for their occasional visits andgreat support: Mario, Pietro, Enzo, Musci, Luca, Emiliano, Ale. Together with friendsthat are also bit more far away: Fausto, Claudio, Gianluca, Sebi, Giulia, Gloria, Emiand my private English teacher Heather.
I am deeply grateful to my family for their continuous encouragement and support.
144

Acknowledgments
I especially want to thank my parents for always supporting and reassuring me and mybrothers while showing us important examples of collective social responsibility. Theircloseness and their strength transmitted me the confidence and serenity necessary tocarry out the research presented in this dissertation.
Last I would like to thank Maria for always being next to me over the last months. Ithank her for being there when celebrating for the first PhD publication. And I thankher for the infinite patience, cheerfulness, love and peace transmitted me while I waswriting this dissertation.
145

Eidesstattliche Erklärung
Ich erkläre an Eides statt, dass ich die bei der promotionsführenden Einrichtung
Fakultät für Physik
der TUM zur Promotionsprüfung vorgelegte Arbeit mit dem Titel:
Spatio-temporal Organization of Enzymatic Reactions
in
Fakultät für Physik, Lehrstuhl für Theoretische Physik - Theorie komplexerBiosysteme
unter der Anleitung und Betreuung durch: Prof. Dr. Ulrich Gerlandohne sonstige Hilfe erstellt und bei der Abfassung nur die gemäß § 6 Ab. 6 und 7 Satz2 angebotenen Hilfsmittel benutzt habe.
8� Ich habe keine Organisation eingeschaltet, die gegen Entgelt Betreuerinnen undBetreuer für die Anfertigung von Dissertationen sucht, oder die mir obliegendenPflichten hinsichtlich der Prüfungsleistungen für mich ganz oder teilweiseerledigt.
8� Ich habe die Dissertation in dieser oder ähnlicher Form in keinem anderenPrüfungsverfahren als Prüfungsleistung vorgelegt.
� Die vollständige Dissertation wurde inveröffentlicht. Die promotionsführende Einrichtunghat der Veröffentlichung zugestimmt.
8� Ich habe den angestrebten Doktorgrad noch nicht erworben und bin nicht ineinem früheren Promotionsverfahren für den angestrebten Doktorgrad endgültiggescheitert.
� Ich habe bereits am bei der Fakultät fürder Hochschuleunter Vorlage einer Dissertation mit dem Themadie Zulassung zur Promotion beantragt mit dem Ergebnis:
Die öffentlich zugängliche Promotionsordnung der TUM ist mir bekannt, insbesonderehabe ich die Bedeutung von § 28 (Nichtigkeit der Promotion) und § 29 (Entzug des
Doktorgrades) zur Kenntnis genommen. Ich bin mir der Konsequenzen einer falschenEidesstattlichen Erklärung bewusst.Mit der Aufnahme meiner personenbezogenen Daten in die Alumni-Datei bei derTUM bin ich
8� einverstanden
� nicht einverstanden
Ort, Datum, Unterschrift